Embed Size (px)
Citation preview
1
Texas
El Paso-Las Cruces TX-NM
Final Area Designations for the
2015 Ozone National Ambient Air Quality Standards
Technical Support Document for County Remanded to EPA
1.0 Summary This technical support document (TSD) describes the EPA’s final action to designate El Paso County,
Texas, as part of the El Paso-Las Cruces TX-NM nonattainment area1 for the 2015 Ozone National
Ambient Air Quality Standard (NAAQS).
On October 1, 2015, the EPA promulgated revised primary and secondary ozone NAAQS (80 FR 6592,
October 26, 2015). In that action, the EPA strengthened both standards to a level of 0.070 parts per million
(ppm), while retaining their indicators, averaging times, and forms. The EPA revised the ozone standards
based on an integrated assessment of an extensive body of new scientific evidence, which substantially
strengthens our knowledge regarding ozone-related health and welfare effects, the results of exposure and
risk analyses, the advice of the Clean Air Scientific Advisory Committee and consideration of public
comments.
Following promulgation of a new or revised NAAQS, the Clean Air Act (CAA) requires EPA to
determine if areas in the country meet the new standards. Accordingly, EPA designated all areas of the
country as to whether they met, or did not meet, the NAAQS. EPA designated areas for the 2015 Ozone
NAAQS in 3 rounds, resulting in 52 nonattainment areas. These are described below:
• Round 1- November 6, 2017: EPA designated 2,646 counties, 2 separate tribal areas and 5
territories as Attainment/Unclassifiable. We also designated 1 Unclassifiable area.
• Round 2- April 30, 2018: EPA designated 51 Nonattainment areas, 1 Unclassifiable area, and all
remaining areas as Attainment/Unclassifiable, except for 8 counties in the San Antonio, TX area.
This action included EPA’s designation for El Paso County as attainment/unclassifiable.
• Round 3- July 17, 2018: EPA designated 1 county in the San Antonio area as Nonattainment and
the other 7 counties as Attainment/Unclassifiable.
Challenges t o EPA’s Designations
Multiple petitioners (several environmental and public health advocacy groups, 3 local government
agencies, and the State of Illinois) filed six petitions for review challenging the EPA’s 2015 ozone
NAAQS designations promulgated on April 30, 2018. The District of Columbia Circuit Court
consolidated the petitions into a single case, Clean Wisconsin v. EPA, 964 F.3d 1145 (D.C. Cir. 2020).
• Collectively, the petitioners challenged EPA’s final designations of 9 attainment areas covering 17
counties.
• Petitioners primarily argued that EPA improperly designated counties (in whole or part) as
attainment/unclassifiable that should have been designated as nonattainment based on
1 This multi-county nonattainment area is named for its Combined Statistical Area (CSA).
2
contributions to nearby areas with violating monitors.
• In its brief, EPA requested voluntary remand of the final designation decisions for 10 counties
associated with 4 nonattainment areas to further review those designations.
Court Decision
On July 10, 2020, the District of Columbia Circuit Court granted EPA’s request for a voluntary remand
for certain designated areas and remanded a number of other areas to the Agency. In total, the Court
remanded 16 counties in 9 nonattainment areas back to EPA. The Court did not vacate the existing
designations but required EPA to “issue revised designations as expeditiously as practicable.”
The Court granted EPA’s motion to remand EPA’s designation of attainment/unclassifiable for El Paso
County citing EPA’s failure to give any reason for the remand and EPA’s motion as a concession that its
explanations fall short of the Clean Air Act’s requirement of reasoned decision making. In light of the
Court decision, EPA has re-evaluated the area for contribution relying on the existing technical record for
El Paso County, including data and information that was used for the April 2018 designations. El Paso
County is part of the area of analysis corresponding to the El Paso-Las Cruces TX-NM CSA comprised of
Doña Ana County, New Mexico, and El Paso and Hudspeth counties, Texas.
On May 26, 2021, EPA sent a 120-day letter to the Governor of Texas with EPA’s intended designation
for the remanded El Paso County.2 On May 27, 2021, EPA sent a letter to the Ysleta del Sur Pueblo,
providing EPA’s intended designation for the remanded El Paso County and offering consultation. On
June 14, 2021, EPA published a Notice of Availability in the Federal Register, providing EPA’s intended
designations for the remanded areas and starting a 30-day public comment period. The EPA received
comments on its intended designation for the remanded El Paso County from the following: the State of
Texas, the Texas Oil and Gas Association, the El Paso Chamber, the Chaparral Community Coalition for
Health and Environment et al., and three members of the public. All comments received are posted in the
docket for this action.3 EPA’s responses to the comments received, hereafter referred to as the “RTC”
document, are also provided in the docket for this action.
Based on EPA’s updated technical analysis of the existing record as described in this TSD, the EPA is
finalizing the 2018 air quality designation for El Paso County. Table 1 shows EPA’s 2018 designation and
the final designation for El Paso County in response to the remand.
Under CAA section 107(d), states were required to submit area designation recommendations to the EPA
for the 2015 ozone NAAQS no later than 1 year following promulgation of the standards, i.e., by October
1, 2016. Tribes were also invited to submit area designation recommendations.4 On September 30, 2016,
2 Consistent with CAA section 107(d)(1)(B)(ii), when EPA’s intended decision modifies the state’s
recommendation, EPA “shall notify the state and provide such state with an opportunity to demonstrate why any
proposed modification is inappropriate. The Administrator shall give such notification no later than 120 days before
the date the Administrator promulgates the designation, including any modification thereto.” 3 The docket for this action is posted in https://www.regulations.gov/ and the docket ID is EPA-HQ-OAR-2017-
0548. Link to the docket: https://www.regulations.gov/docket/EPA-HQ-OAR-2017-0548. 4 EPA did not receive recommendations from tribes in Louisiana, New Mexico, Oklahoma, or Texas (there are no
Federally recognized tribes in Arkansas). In 2011, the EPA issued a memorandum outlining the EPA’s approach for
designating areas of Indian country. If the EPA either does not receive an initial designation recommendation from a
tribe, or receives a recommendation that does not specify designation of a separate area, the EPA is designating the
3
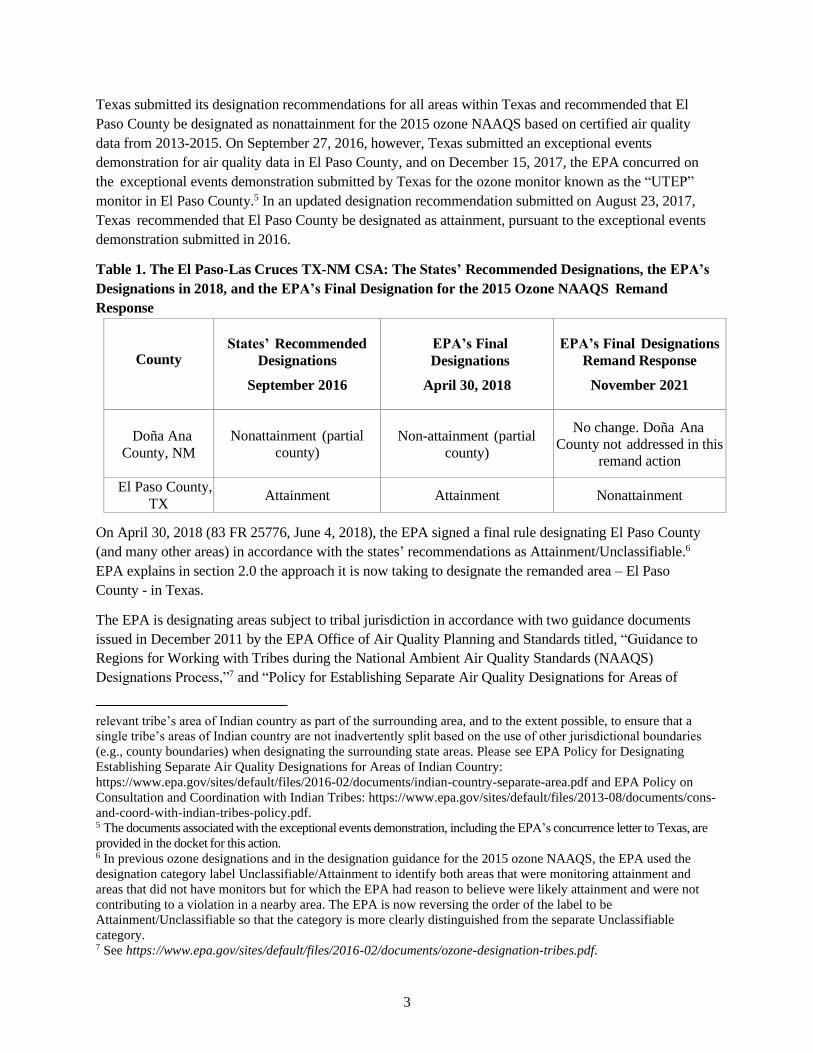
Texas submitted its designation recommendations for all areas within Texas and recommended that El
Paso County be designated as nonattainment for the 2015 ozone NAAQS based on certified air quality
data from 2013-2015. On September 27, 2016, however, Texas submitted an exceptional events
demonstration for air quality data in El Paso County, and on December 15, 2017, the EPA concurred on
the exceptional events demonstration submitted by Texas for the ozone monitor known as the “UTEP”
monitor in El Paso County.5 In an updated designation recommendation submitted on August 23, 2017,
Texas recommended that El Paso County be designated as attainment, pursuant to the exceptional events
demonstration submitted in 2016.
Table 1. The El Paso-Las Cruces TX-NM CSA: The States’ Recommended Designations, the EPA’s
Designations in 2018, and the EPA’s Final Designation for the 2015 Ozone NAAQS Remand
Response
County States’ Recommended
Designations
September 2016
EPA’s Final
Designations
April 30, 2018
EPA’s Final Designations
Remand Response
November 2021
Doña Ana
County, NM
Nonattainment (partial
county)
Non-attainment (partial
county)
No change. Doña Ana
County not addressed in this
remand action
El Paso County,
TX Attainment Attainment Nonattainment
On April 30, 2018 (83 FR 25776, June 4, 2018), the EPA signed a final rule designating El Paso County
(and many other areas) in accordance with the states’ recommendations as Attainment/Unclassifiable.6
EPA explains in section 2.0 the approach it is now taking to designate the remanded area – El Paso
County - in Texas.
The EPA is designating areas subject to tribal jurisdiction in accordance with two guidance documents
issued in December 2011 by the EPA Office of Air Quality Planning and Standards titled, “Guidance to
Regions for Working with Tribes during the National Ambient Air Quality Standards (NAAQS)
Designations Process,”7 and “Policy for Establishing Separate Air Quality Designations for Areas of
relevant tribe’s area of Indian country as part of the surrounding area, and to the extent possible, to ensure that a
single tribe’s areas of Indian country are not inadvertently split based on the use of other jurisdictional boundaries
(e.g., county boundaries) when designating the surrounding state areas. Please see EPA Policy for Designating
Establishing Separate Air Quality Designations for Areas of Indian Country:
https://www.epa.gov/sites/default/files/2016-02/documents/indian-country-separate-area.pdf and EPA Policy on
Consultation and Coordination with Indian Tribes: https://www.epa.gov/sites/default/files/2013-08/documents/cons-
and-coord-with-indian-tribes-policy.pdf. 5 The documents associated with the exceptional events demonstration, including the EPA’s concurrence letter to Texas, are
provided in the docket for this action. 6 In previous ozone designations and in the designation guidance for the 2015 ozone NAAQS, the EPA used the
designation category label Unclassifiable/Attainment to identify both areas that were monitoring attainment and
areas that did not have monitors but for which the EPA had reason to believe were likely attainment and were not
contributing to a violation in a nearby area. The EPA is now reversing the order of the label to be
Attainment/Unclassifiable so that the category is more clearly distinguished from the separate Unclassifiable
category. 7 See https://www.epa.gov/sites/default/files/2016-02/documents/ozone-designation-tribes.pdf.
4
Indian Country.”8 As discussed in these policies, tribes retain sovereign authorities over their members
and territories, and jurisdiction in Indian country generally rests with the relevant tribe and the federal
government, not with states. As such, designating areas of Indian country as part of a multijurisdictional
area has no effect on tribal sovereignty over those areas.
2.0 Nonattainment Area Analyses and Boundary Determination
The EPA evaluated and determined the boundaries for each nonattainment area on a case-by-case basis,
considering the specific facts and circumstances of the area. In accordance with the CAA section 107(d),
the EPA is designating as nonattainment the areas with the monitors that are violating the 2015 ozone
NAAQS and nearby areas with emissions sources (i.e., stationary, mobile, and/or area sources) that
contribute to the violations. Following the EPA’s designations guidance for the 2015 Ozone NAAQS
(hereafter referred to as the “ozone designations guidance”),9 after identifying each monitor indicating a
violation of the ozone NAAQS in an area, the EPA analyzed those nearby areas with emissions potentially
contributing to the violating monitor(s). The EPA believes that using the Core Based Statistical Area
(CBSA) or CSA10 as a starting point for the contribution analysis is a reasonable approach to ensure that
the nearby areas most likely to contribute to a violating monitor are evaluated.
The area-specific analyses may support nonattainment boundaries that are smaller or larger than the
CBSA or CSA.
The EPA is proceeding to complete the remanded designation for El Paso County for the ozone NAAQS
as outlined above as part of the El Paso-Las Cruces TX-NM nonattainment area.
8 See https://www.epa.gov/sites/default/files/2016-02/documents/indian-country-separate-area.pdf. 9 The EPA issued guidance on February 25, 2016 that identified important factors that the EPA evaluated in
determining appropriate area designations and nonattainment boundaries for the 2015 ozone NAAQS. Available at
https://www.epa.gov/sites/default/files/2016-02/documents/ozone-designations-guidance-2015.pdf 10 Lists of CBSAs and CSAs and their geographic components are provided at
https://www.census.gov/geographies/reference-files/time-series/demo/metro-micro/delineation-files.html. The Office
of Management and Budget (OMB) adopts standards for defining statistical areas. The statistical areas are delineated
based on U.S. Census Bureau data. The lists are periodically updated by the OMB. The EPA used the most recent
July 2015 update (OMB Bulletin No. 15-01), which is based on application of the 2010 OMB standards to the 2010
Census, 2006-2010 American Community Survey, as well as 2013 Population Estimates Program data.
5
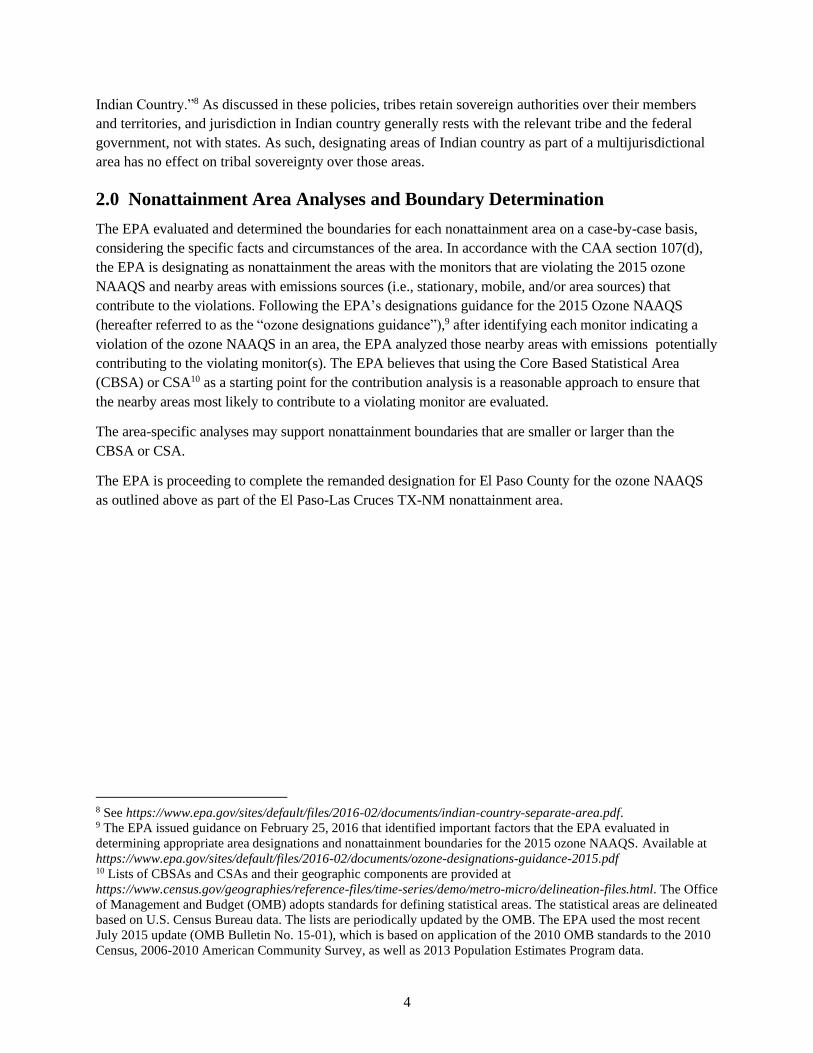
EPA’s Nonattainment Area Boundary
Figures in the remainder of this document refer to the master legend above.
6
3.0 Technical Analysis
The EPA must designate as nonattainment any area that violates the NAAQS and any nearby areas that
contribute to such violation. Doña Ana County, NM had a monitor in violation of the 2015 ozone NAAQS
and therefore was previously designated as nonattainment (83 FR 25776).
This technical analysis identifies the areas with monitors that violate the 2015 ozone NAAQS. It also
provides EPA’s re-evaluation of El Paso County to determine whether that area contributes to a violation at
the nearby violating monitor based on a weight-of-evidence approach considering the five factors
recommended in the EPA’s ozone designations guidance and any other relevant information. In
developing this technical analysis, the EPA used only the existing data from the record for which our prior
designation for El Paso County was based.11 Texas (“the State”) provided additional data in December
2020 that is outside of the existing record. Although it could not be used, the EPA reviewed the State’s
additional data provided during the comment period and responded fully in our Response to Comments
(RTC) for this action12 and we do briefly discuss in some sections below that the comments and our review
of the comments support our original analyses and conclusions
The five factors recommended in the EPA’s ozone designations guidance are:
1. Air Quality Data (including the design value calculated for each Federal Reference
Method (FRM) or Federal Equivalent Method (FEM) monitor);
2. Emissions and Emissions-Related Data (including locations of sources, population, amount
of emissions, and urban growth patterns);
3. Meteorology (weather/transport patterns);
4. Geography/Topography (including mountain ranges or other physical features that may
influence the fate and transport of emissions and ozone concentrations); and
5. Jurisdictional Boundaries (e.g., counties, air districts, existing nonattainment areas, areas
of Indian country, Metropolitan Planning Organizations (MPOs)).
Below, EPA re-analyzes the five factors for the remanded El Paso area in Texas.
Figure 1 below is a map of the EPA’s area of analysis: Doña Ana County, New Mexico and El Paso and
Hudspeth counties, Texas. Figure 1 shows the final nonattainment area boundary, which includes the
previously designated nonattainment area in the southeastern corner of Doña Ana County, New Mexico,
expanded to include El Paso County, Texas, in the nonattainment area. Figure 1 also shows the location of
ambient air quality monitors, counties, and other jurisdictional boundaries. Located within El Paso
County boundaries are several areas of Indian country belonging to the Ysleta del Sur Pueblo. The tribe
did not submit a recommendation and the EPA is including these tribal areas as part of the designated
nonattainment area.
For purposes of the 1997 and 2008 8-hour ozone NAAQS, EPA designated the entirety of Doña Ana and
El Paso counties visible in Figure 1 below as Unclassifiable/Attainment.
11 The EPA’s Ozone Designations Guidance and Data web page can be found at https://www.epa.gov/ozone-
designations/ozone-designations-guidance-and-data. 12 The additional information submitted by the State in December 2020 is provided in the docket for this action.
7
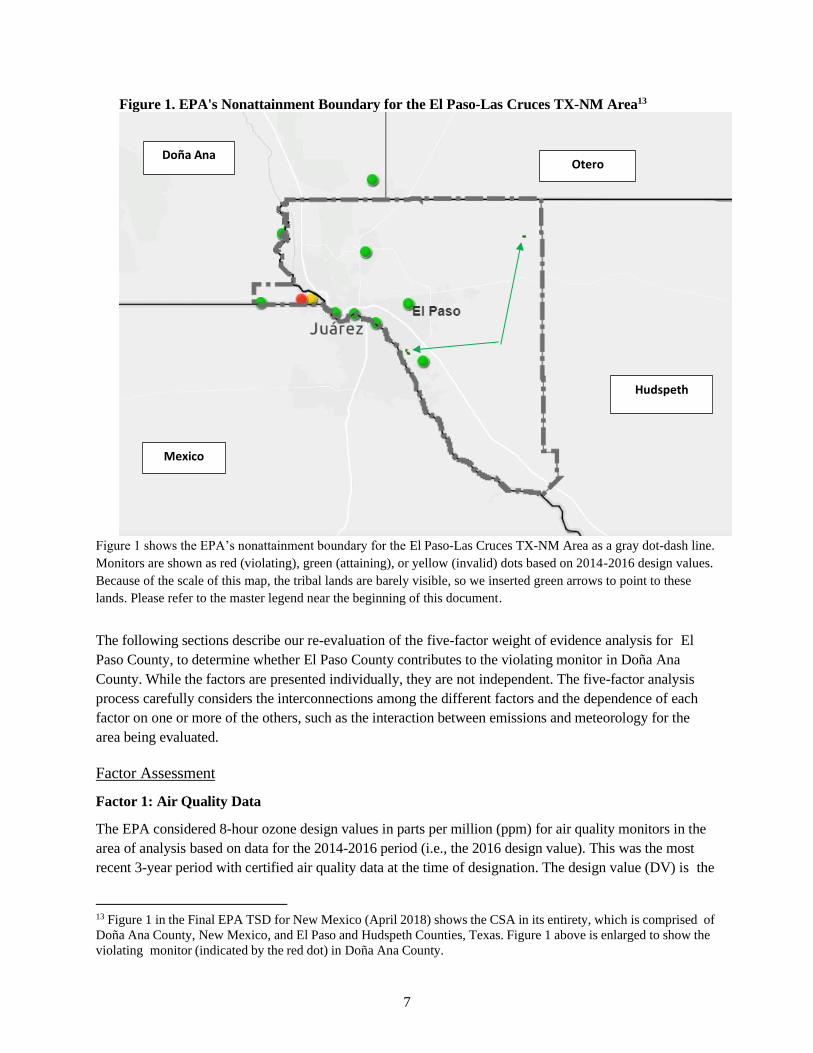
Figure 1. EPA's Nonattainment Boundary for the El Paso-Las Cruces TX-NM Area13
Figure 1 shows the EPA’s nonattainment boundary for the El Paso-Las Cruces TX-NM Area as a gray dot-dash line.
Monitors are shown as red (violating), green (attaining), or yellow (invalid) dots based on 2014-2016 design values.
Because of the scale of this map, the tribal lands are barely visible, so we inserted green arrows to point to these
lands. Please refer to the master legend near the beginning of this document.
The following sections describe our re-evaluation of the five-factor weight of evidence analysis for El
Paso County, to determine whether El Paso County contributes to the violating monitor in Doña Ana
County. While the factors are presented individually, they are not independent. The five-factor analysis
process carefully considers the interconnections among the different factors and the dependence of each
factor on one or more of the others, such as the interaction between emissions and meteorology for the
area being evaluated.
Factor Assessment
Factor 1: Air Quality Data
The EPA considered 8-hour ozone design values in parts per million (ppm) for air quality monitors in the
area of analysis based on data for the 2014-2016 period (i.e., the 2016 design value). This was the most
recent 3-year period with certified air quality data at the time of designation. The design value (DV) is the
13 Figure 1 in the Final EPA TSD for New Mexico (April 2018) shows the CSA in its entirety, which is comprised of
Doña Ana County, New Mexico, and El Paso and Hudspeth Counties, Texas. Figure 1 above is enlarged to show the
violating monitor (indicated by the red dot) in Doña Ana County.
Doña Ana
Mexico
Otero
Hudspeth
8
3-year average of the annual 4th highest daily maximum 8-hour average ozone concentration.14 The 2015
NAAQS are met when the DV is 0.070 ppm or less. Only ozone measurement data collected in
accordance with the quality assurance (QA) requirements using approved (FRM/FEM) monitors are used
for NAAQS compliance determinations.15 The EPA uses FRM/FEM measurement data residing in the
EPA’s Air Quality System (AQS) database to calculate the ozone DVs. Individual violations of the 2015
ozone NAAQS that the EPA determines have been caused by an exceptional event that meets the
administrative and technical criteria in the Exceptional Events Rule16 are not included in these
calculations. When several monitors are located in a county (or designated nonattainment area), the DV
for the county or area is determined by the monitor with the highest valid DV. The presence of one or
more violating monitors (i.e., monitors with DVs greater than 0.070 ppm) in a county or other geographic
area forms the basis for designating that county or area as nonattainment. The remaining four factors are
then used as the technical basis for determining the spatial extent of the designated nonattainment area
surrounding the violating monitor(s) based on a consideration of what nearby areas are contributing to a
violation of the NAAQS.
The EPA identified one monitor where the 2014-2016 DV violates the NAAQS and examined historical
ozone air quality measurement data (including previous DVs) to understand the nature of the ozone
ambient air quality problem in the area.17 Eligible monitors for providing DV data generally include State
and Local Air Monitoring Stations (SLAMS) that are operated in accordance with 40 CFR part 58,
appendix A, C, D, and E and operating with an FRM or FEM monitor. These requirements must be met in
order to be acceptable for comparison to the 2015 ozone NAAQS for designation purposes. All data from
Special Purpose Monitors (SPMs) using an FRM or FEM are eligible for comparison to the NAAQS,
subject to the requirements given in the March 28, 2016 Revision to Ambient Monitoring Quality
Assurance and Other Requirements Rule (81 FR 17248).
The 2014-2016 DVs for counties in the area of analysis are shown in Table 2 below.
14 The specific methodology for calculating the ozone design values, including computational formulas and data
completeness requirements, is described in 40 CFR part 50, appendix U. 15 The QA requirements for ozone monitoring data are specified in 40 CFR part 58, appendix A. The performance
test requirements for candidate FEMs are provided in 40 CFR part 53, subpart B. 16 The EPA finalized the rule on the Treatment of Data Influenced by Exceptional Events (81 FR 68216, October 3,
2016) and the guidance on the Preparation of Exceptional Events Demonstrations for Wildfire Events in September
of 2016. For more information, see https://www.epa.gov/air-quality-analysis/exceptional-events-rule-and-guidance.
The Texas submittal was prepared and submitted under the 2007 Exceptional Events Rule (72 FR 13560, March 22,
2007) and reviewed under both rules. 17 As noted above, the violating monitor is located in Doña Ana County, New Mexico. The historical air quality data
associated with the violating monitor (the “Desert View” monitor) is not included in this TSD. To review the
historical air quality data for the Desert View monitor, please see Figure 2 in EPA’s Final TSD for New Mexico,
April 2018. EPA’s Final TSD for New Mexico, April 2018, is in the docket for this action and also posted at
https://www.epa.gov/ozone-designations/ozone-designations-2015-standards-new-mexico-state-recommendations-
and-epa.
9
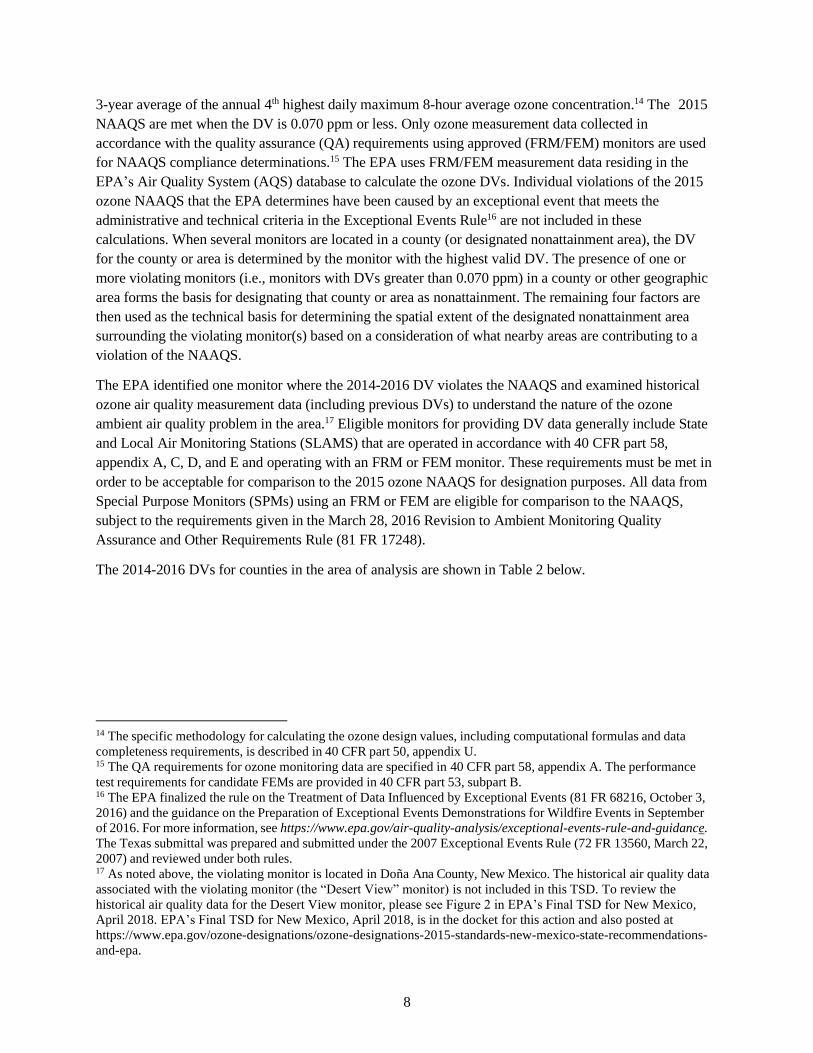
Table 2. Air Quality Data (all values in ppm)
County, State
State Recommended
Nonattainment?
AQS Site ID
2014-2016
DV
2014 4th
highest daily
max value
2015 4th
highest daily
max value
2016 4th
highest daily
max value
Doña Ana, NM Yes (partial)
350130008
“La Union” 0.066 0.065 0.070 0.063
350130017 N/A 0.067 0.057 N/A
350130020
“Chaparral” 0.066 0.067 0.065 0.068
350130021
“Desert View” 0.072 0.072 0.074 0.070
350130022
“Santa Teresa” 0.068 0.066 0.070 0.069
350130023
“Las Cruces” 0.065 0.066 0.066 0.064
El Paso, TX No
481410029
“Ivanhoe” 0.062 0.062 0.065 0.061
481410037
“UTEP” 0.070 0.070 0.070 0.071
481410044
“Chamizal” 0.067 0.066 0.070 0.065
481410055
“Ascarate Park” 0.064 0.062 0.064 0.066
481410057
“Socorro” 0.066 0.066 0.069 0.064
481410058
“Skyline” 0.068 0.070 0.069 0.066
Hudspeth, TX No No monitor N/A
The highest design value in each county is indicated in bold type.
N/A means that the monitor did not meet the completeness criteria described in 40 CFR, part 50, Appendix U, or no
data exists for the county.
The Desert View Monitor in Doña Ana County had a violation of the 2015 ozone NAAQS and therefore,
a portion of Doña Ana County was included in the final nonattainment area. A county (or partial county)
must also be designated nonattainment if it contributes to a violation in a nearby area. Each county
without a violating monitor that is located near a county with a violating monitor must be evaluated based
on the weight-of-evidence of the five factors and other relevant information to determine whether it
contributes to the nearby violation.
Figure 1, shown previously, identifies the area of analysis, the nonattainment area, and the violating
monitor. Table 2 above identifies the 2014-2016 DVs for all monitors in the area of analysis. As indicated
on the map, there is one violating monitor, the Desert View monitor, located in the area known as Sunland
Park in southeastern Doña Ana County. There are four other monitors in southern and central Doña Ana
County that were not violating based on air quality data from 2014-2016. There were six monitors in
nearby El Paso County that were not violating based on air quality data from 2014-2016.18
18 On September 27, 2016, Texas submitted an Exceptional Event demonstration for the June 21, 2015 exceedance of
10
The Desert View monitor in Doña Ana County violated the 2015 ozone NAAQS with a design value of
0.072 ppm based on air quality data for 2014-2016. The design values for all other monitors in the area of
analysis were between 0.062 ppm and 0.070 ppm.
Factor 2: Emissions and Emissions-Related Data
The EPA re-evaluated ozone precursor emissions of nitrogen oxides (NOx) and volatile organic
compounds (VOC) and other emissions-related data in the record that provide information on areas
contributing to the violating monitor.
Emissions Data
The EPA reviewed data from the 2014 National Emissions Inventory (NEI). For each county in the area of
analysis, the EPA examined the magnitude of large sources (NOx or VOC emissions greater than 100 tons
per year) and small point sources and the magnitude of county-level emissions reported in the NEI. These
county-level emissions represent the sum of emissions from the following general source categories: point
sources, non-point (i.e., area) sources, non-road mobile, on-road mobile, and fires. Emissions levels from
sources in a nearby area indicate the potential for the area to contribute to monitored violations.
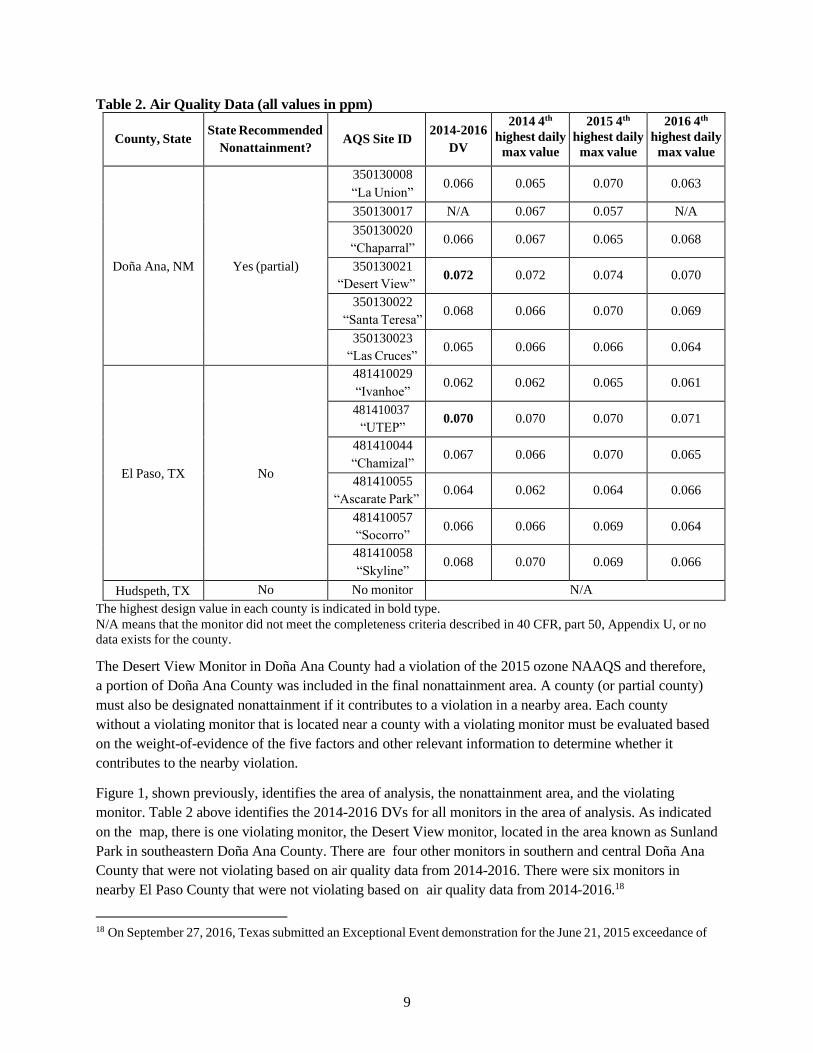
Table 3 provides a county-level emissions summary of NOx and VOC (given in tons per year (tpy)) for El
Paso County, as considered for inclusion in the nonattainment area.
Table 3. Total County-Level NOx and VOC Emissions
County, State State Recommended
Nonattainment? Total NOx (tpy) Total VOC (tpy)
El Paso, TX No 18,391 13,912
Doña Ana, NM Yes (partial)* 10,729 6,096
Hudspeth, TX No 2,776 446
Area wide: 31,896 20,454
* For partial counties, the emissions shown are for the entire county.
In addition to reviewing county-wide emissions of NOx and VOC in the area of analysis, the EPA also
reviewed emissions from and identified the locations of large stationary (“point”) sources. EPA also re-
evaluated the size and location of on-road (mobile sources), nonroad (off-road, road building vehicles,
earth moving equipment, aircraft, railroad, etc.)and area sources (smaller sources, natural gas water
heaters, fugitive VOCs, etc.) emissions within El Paso County, using Vehicle Miles Traveled (VMT)
the 2015 ozone standard at the UTEP monitor. On December 15, 2017, the EPA concurred on the exceptional events
demonstration submitted by Texas for the ozone monitor known as the “UTEP” monitor in El Paso. The EPA agreed that
an exceptional event occurred at the UTEP monitor on June 21, 2015. Individual violations of the 2015 ozone
NAAQS that the EPA determines have been caused by an exceptional event that meet the administrative and technical
criteria in the Exceptional Events Rule are not included in the air quality data calculations. Thus, the monitoring data
for June 21, 2015 are not included in the calculation of the 2014-2016 DV at the UTEP monitor. EPA did not receive
adverse comments relevant to the exceptional event. Documentation regarding the exceptional event is provided in the
docket for this action.
11
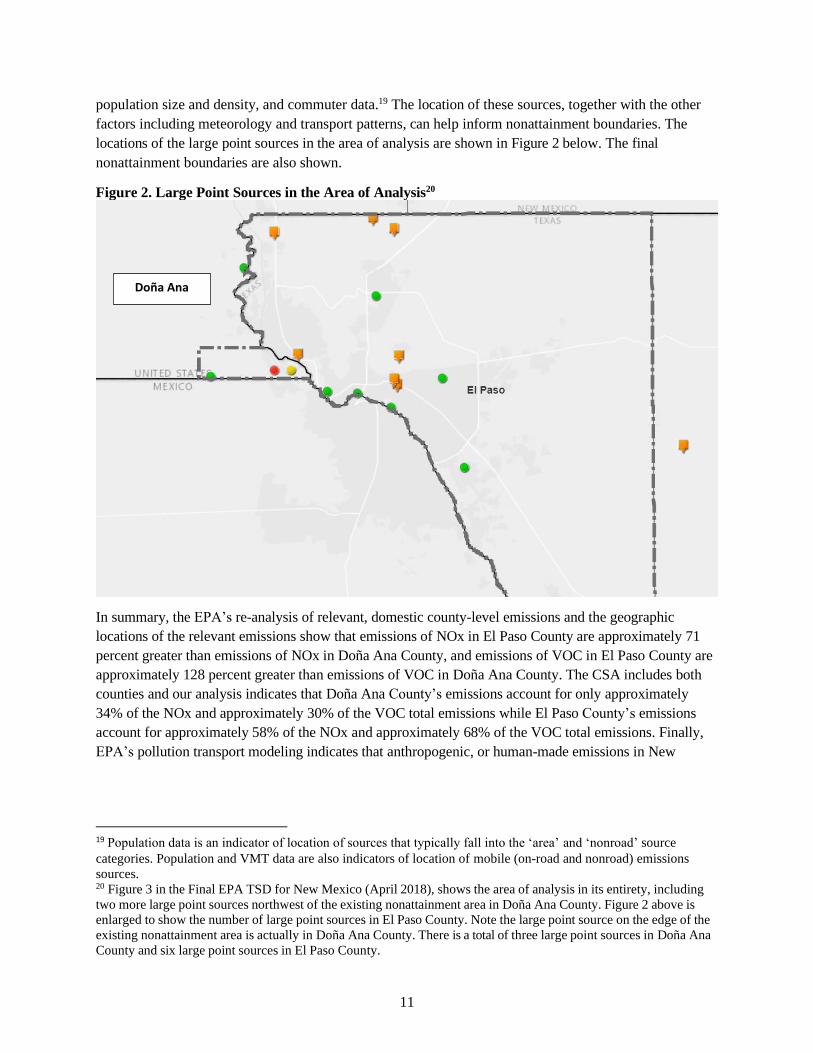
population size and density, and commuter data.19 The location of these sources, together with the other
factors including meteorology and transport patterns, can help inform nonattainment boundaries. The
locations of the large point sources in the area of analysis are shown in Figure 2 below. The final
nonattainment boundaries are also shown.
Figure 2. Large Point Sources in the Area of Analysis20
In summary, the EPA’s re-analysis of relevant, domestic county-level emissions and the geographic
locations of the relevant emissions show that emissions of NOx in El Paso County are approximately 71
percent greater than emissions of NOx in Doña Ana County, and emissions of VOC in El Paso County are
approximately 128 percent greater than emissions of VOC in Doña Ana County. The CSA includes both
counties and our analysis indicates that Doña Ana County’s emissions account for only approximately
34% of the NOx and approximately 30% of the VOC total emissions while El Paso County’s emissions
account for approximately 58% of the NOx and approximately 68% of the VOC total emissions. Finally,
EPA’s pollution transport modeling indicates that anthropogenic, or human-made emissions in New
19 Population data is an indicator of location of sources that typically fall into the ‘area’ and ‘nonroad’ source
categories. Population and VMT data are also indicators of location of mobile (on-road and nonroad) emissions
sources. 20 Figure 3 in the Final EPA TSD for New Mexico (April 2018), shows the area of analysis in its entirety, including
two more large point sources northwest of the existing nonattainment area in Doña Ana County. Figure 2 above is
enlarged to show the number of large point sources in El Paso County. Note the large point source on the edge of the
existing nonattainment area is actually in Doña Ana County. There is a total of three large point sources in Doña Ana
County and six large point sources in El Paso County.
Doña Ana
12
Mexico contribute approximately 4% to the projected 2017 design value for Doña Ana County.21
As noted in EPA’s Final TSD for New Mexico (April 2018), emissions sources in Mexico also likely
contribute to violations of the ozone NAAQS in Doña Ana County. However, foreign contributions do not
preclude EPA’s analysis of El Paso County for contribution to a violation at the nearby Desert View
Monitor.
Population density and degree of urbanization
In this part of the factor analysis, the EPA re-evaluated the population and vehicle use characteristics and
trends of the area as indicators of the probable location and magnitude of non-point source emissions.
These include emissions of NOx and VOC from on-road and non-road vehicles and engines, consumer
products, residential fuel combustion, and consumer services. Areas of dense population or commercial
development are an indicator of area source and mobile source NOx and VOC emissions that may
contribute to violations of the NAAQS. Table 4 shows the population, population density, and population
growth information for each county in the area of analysis. Figure 3 below contains a county-level density
map of the area of analysis.
Table 4. Population and Growth
County, State
State Recommended
Nonattainment?
2010
Population
2015
Population
2015
Population
Density (per
sq. mi.)
Absolute
change in
population
(2010-2015)
Population %
change (2010-
2015)
Doña Ana, NM Yes (partial)* 209,233 214,295 56 5,062 2
El Paso, TX No 800,647 835,593 825 34,946 4
Hudspeth, TX No 3,476 3,379 1 -97 -3
TX Area total: 1,013,356 1,053,267 39,911 4
* For state recommended partial counties, the emissions shown are for the entire county.
Source: U.S. Census Bureau population estimates for 2010 and 2015. www.census.gov/data.html
Within the area of analysis, El Paso County has the highest 2015 population with 835,593 and a
population density of 825 people per square mile. In comparison, the population of El Paso County is
approximately 290 percent greater than the population of Doña Ana County and the population density of
El Paso County is approximately 1373 percent greater than the population density of Doña Ana County.22
21 See Table 2c, Implementation of the 2015 Primary Ozone NAAQS: Issues Associated with Background Ozone
White Paper for Discussion, December 30, 2015. A copy of the White Paper is available at
https://www.epa.gov/sites/production/files/2016-03/documents/whitepaper-bgo3-final.pdf. The results are based on
2017 CAMx source apportionment modeling that was released publicly on January 22, 2015 as part of the memo:
Information on the Interstate Transport “Good Neighbor” Provisions for the 2008 O3 National Ambient Air Quality
Standards under Clean Air Act Section 110(a)(2)(D)(i)(I). A copy of that memo and related documents can be found
at http://www.epa.gov/airtransport/ozonetransportNAAQS.html. 22 The “percent greater than” calculations for population size and density in the TSD for EPA’s May 2021 El Paso-
Las Cruces TX-NM Intended Area Designations for the 2015 Ozone NAAQS for Counties Remanded (“May 2021
13
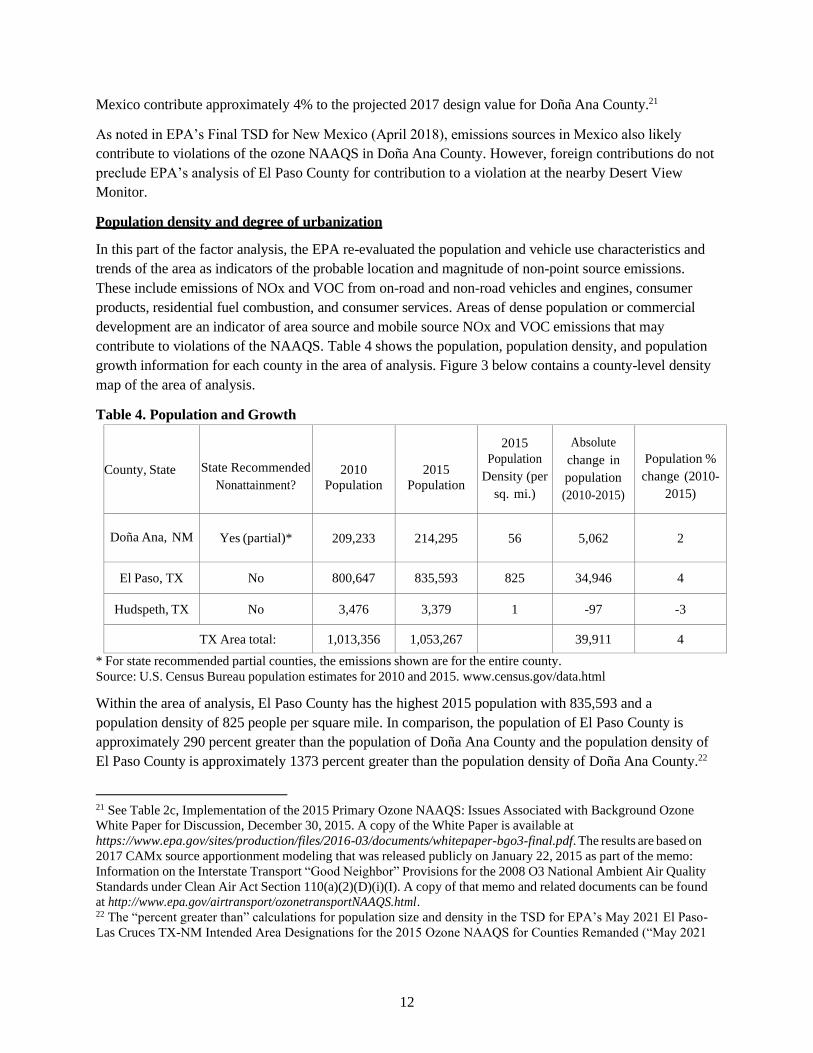
Within the area of analysis, approximately 79 percent of the total population live in El Paso County, 20
percent reside in Doña Ana County, and one percent live in Hudspeth County. There has been limited
population growth in the area of analysis. The highest growth occurred in El Paso County at 4 percent
followed by Doña Ana County at 2 percent.
Figure 3. 2010 County-Level Population
Traffic and Vehicle Miles Travelled (VMT)
The EPA evaluated the commuting patterns of residents, as well as the total vehicle miles traveled (VMT)
for each county in the area of analysis. 23 In combination with the population/population density data and
the location of main transportation arteries, this information helps identify the probable location of non-
point source emissions. A county with high VMT and/or a high number of commuters is generally an
integral part of an urban area and high VMT and/or high number of commuters indicates the presence of
motor vehicle emissions that may contribute to violations of the NAAQS. Rapid population or VMT
growth in a county on the urban perimeter may signify increasing integration with the core urban area, and
thus could indicate that the associated area source and mobile source emissions may be appropriate to
include in the nonattainment area.
El Paso-Las Cruces TX-NM TSD”) were incorrect and are corrected here.
23 The VMT data are available from the NEI (see https://www.epa.gov/air-emissions-inventories/national-emissions-
inventory-nei). See also https://www.epa.gov/ozone-designations/ozone-designations-guidance-and-data.
Doña Ana
Otero

14
In addition to VMT, the EPA evaluated worker data collected by the U.S. Census Bureau for the area of
analysis.24 Table 5 shows the traffic and commuting pattern data, including total VMT for each county,
number of residents who work in each county, number of residents that commute to or within counties with
violating monitor(s), and the percent of residents commuting to or within counties with violating
monitor(s). Unless otherwise noted, the data in Table 5 are 2014 data.
Table 5. Traffic and Commuting Patterns
County,
State
State
Recommended
Nonattainment?
2008
Total
VMT
(Million
Miles)
2014 Total
VMT
(Million
Miles)
VMT
Growth
2008 to
2014
(percent)
Number
of County
Residents
Who
Work
Number
(Percent)
Commuting
to or Within
El Paso
County
Number
(Percent)
Commuting
to or Within
Doña Ana
County
El Paso,
TX
No 5,599 5,956 6 308,236 274,910
(89%)
5,692 (2%)
Doña
Ana, NM
Yes (partial)* 2,568 2,024 -21 72,179 12,827
(18%)
47,369
(66%)
Hudspeth,
TX
No 461 441 -4 1,208 466 (39%) 4 (less than
1%)
Total: 8,628 8,421 -2 381,623 288,203 53,065
* For state recommended partial counties, the data provided are for the entire county.
Counties with a monitor violating the NAAQS are indicated in bold.
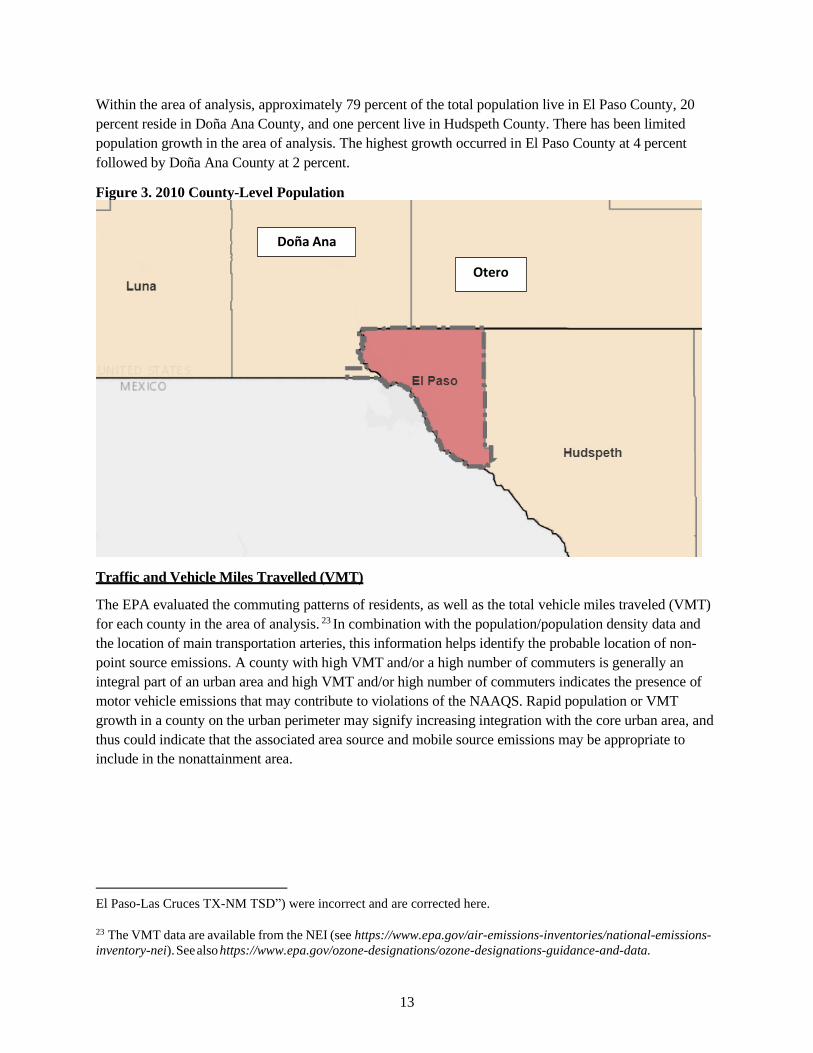
To show traffic and commuting patterns, Figure 4 below overlays 12-kilometer gridded VMT from the
2014 NEI with a map of the transportation arteries and the monitor locations.
24 The worker data can be accessed at: http://onthemap.ces.census.gov/.
15
Figure 4. Twelve Kilometer Gridded VMT (Miles) Overlaid with Transportation Arteries
Counties are listed in Table 5 in order of VMT from largest to smallest. The VMT in El Paso County is
about 194 percent higher than the VMT in Doña Ana County.25 Most of the employed population in each
of El Paso and Doña Ana counties do not travel outside of their respective counties for work. However, as
evident in Figure 4 above, the violating monitor in Doña Ana County could be impacted by the volume of
VMT emissions from El Paso County. The EPA notes that even though there is limited commuting traffic
between the two areas, the close proximity of the areas to each other makes the greater volume of VMT
and population in El Paso County an important aspect of the contribution analysis.
Factor 3: Meteorology
Evaluation of meteorological data helps to assess the fate and transport of emissions contributing to ozone
concentrations and to identify areas potentially contributing to the monitored violations. Results of
meteorological data analysis may inform the determination of nonattainment area boundaries. In order to
determine how meteorological conditions, including, but not limited to, weather, transport patterns, and
stagnation conditions, could affect the fate and transport of ozone and precursor emissions from sources in
the area, EPA evaluated 2014-2016 Hybrid Single-Particle Lagrangian Integrated Trajectory (HYSPLIT)
at 100, 500, and 1000 meters above ground level (AGL) that illustrate the three-dimensional paths traveled
25 The “percent higher than” calculation for VMT in EPA’s May 2021 El Paso-Las Cruces TX-NM TSD was
incorrect and is corrected here.
Otero Doña Ana
Mexico
Hudspeth
16
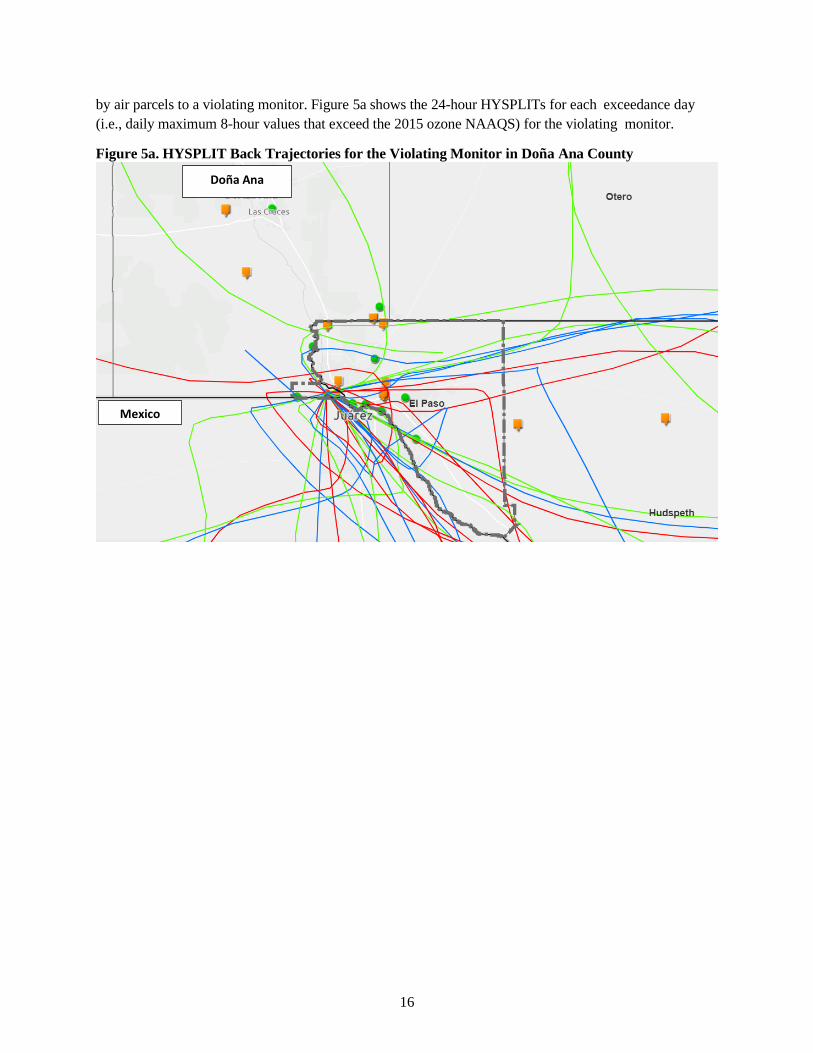
by air parcels to a violating monitor. Figure 5a shows the 24-hour HYSPLITs for each exceedance day
(i.e., daily maximum 8-hour values that exceed the 2015 ozone NAAQS) for the violating monitor.
Figure 5a. HYSPLIT Back Trajectories for the Violating Monitor in Doña Ana County
Doña Ana
Mexico
17
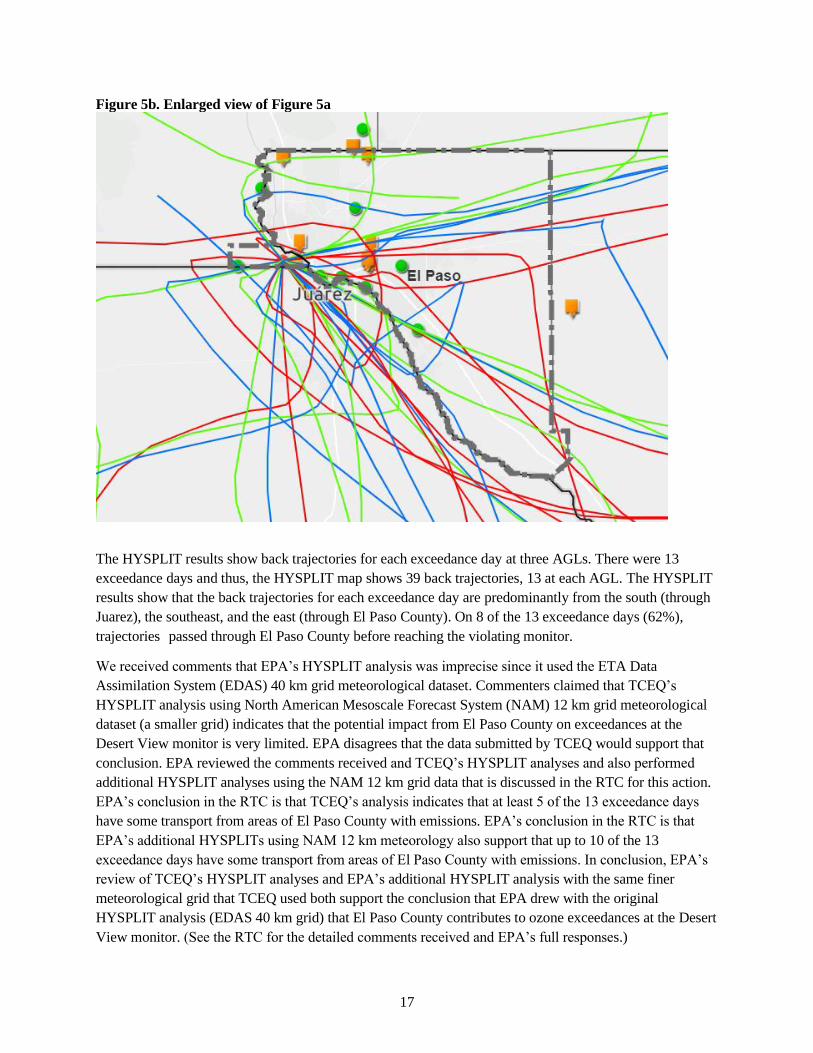
Figure 5b. Enlarged view of Figure 5a
The HYSPLIT results show back trajectories for each exceedance day at three AGLs. There were 13
exceedance days and thus, the HYSPLIT map shows 39 back trajectories, 13 at each AGL. The HYSPLIT
results show that the back trajectories for each exceedance day are predominantly from the south (through
Juarez), the southeast, and the east (through El Paso County). On 8 of the 13 exceedance days (62%),
trajectories passed through El Paso County before reaching the violating monitor.
We received comments that EPA’s HYSPLIT analysis was imprecise since it used the ETA Data
Assimilation System (EDAS) 40 km grid meteorological dataset. Commenters claimed that TCEQ’s
HYSPLIT analysis using North American Mesoscale Forecast System (NAM) 12 km grid meteorological
dataset (a smaller grid) indicates that the potential impact from El Paso County on exceedances at the
Desert View monitor is very limited. EPA disagrees that the data submitted by TCEQ would support that
conclusion. EPA reviewed the comments received and TCEQ’s HYSPLIT analyses and also performed
additional HYSPLIT analyses using the NAM 12 km grid data that is discussed in the RTC for this action.
EPA’s conclusion in the RTC is that TCEQ’s analysis indicates that at least 5 of the 13 exceedance days
have some transport from areas of El Paso County with emissions. EPA’s conclusion in the RTC is that
EPA’s additional HYSPLITs using NAM 12 km meteorology also support that up to 10 of the 13
exceedance days have some transport from areas of El Paso County with emissions. In conclusion, EPA’s
review of TCEQ’s HYSPLIT analyses and EPA’s additional HYSPLIT analysis with the same finer
meteorological grid that TCEQ used both support the conclusion that EPA drew with the original
HYSPLIT analysis (EDAS 40 km grid) that El Paso County contributes to ozone exceedances at the Desert
View monitor. (See the RTC for the detailed comments received and EPA’s full responses.)
18
In summary, the EPA’s original analysis of the HYSPLIT data using the EDAS 40 km meteorological data
set shows that the violating monitor is impacted by transport from El Paso County for more than half of
the exceedance days at the violating monitor.
Factor 4: Geography/Topography
Consideration of geography or topography can provide additional information relevant to defining
nonattainment area boundaries. Analyses should examine the physical features of the land that might
define the airshed. Mountains or other physical features may influence the fate and transport of emissions
as well as the formation and distribution of ozone concentrations. The absence of any such geographic or
topographic features may also be a relevant consideration in selecting boundaries for a given area.
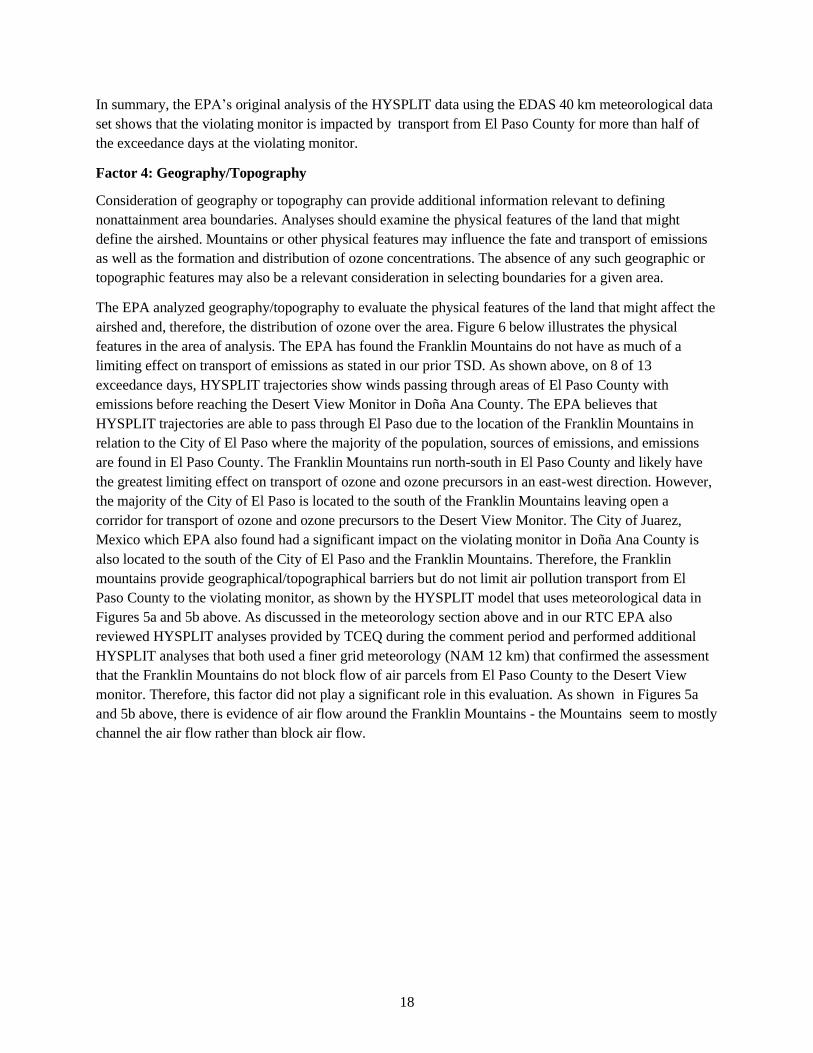
The EPA analyzed geography/topography to evaluate the physical features of the land that might affect the
airshed and, therefore, the distribution of ozone over the area. Figure 6 below illustrates the physical
features in the area of analysis. The EPA has found the Franklin Mountains do not have as much of a
limiting effect on transport of emissions as stated in our prior TSD. As shown above, on 8 of 13
exceedance days, HYSPLIT trajectories show winds passing through areas of El Paso County with
emissions before reaching the Desert View Monitor in Doña Ana County. The EPA believes that
HYSPLIT trajectories are able to pass through El Paso due to the location of the Franklin Mountains in
relation to the City of El Paso where the majority of the population, sources of emissions, and emissions
are found in El Paso County. The Franklin Mountains run north-south in El Paso County and likely have
the greatest limiting effect on transport of ozone and ozone precursors in an east-west direction. However,
the majority of the City of El Paso is located to the south of the Franklin Mountains leaving open a
corridor for transport of ozone and ozone precursors to the Desert View Monitor. The City of Juarez,
Mexico which EPA also found had a significant impact on the violating monitor in Doña Ana County is
also located to the south of the City of El Paso and the Franklin Mountains. Therefore, the Franklin
mountains provide geographical/topographical barriers but do not limit air pollution transport from El
Paso County to the violating monitor, as shown by the HYSPLIT model that uses meteorological data in
Figures 5a and 5b above. As discussed in the meteorology section above and in our RTC EPA also
reviewed HYSPLIT analyses provided by TCEQ during the comment period and performed additional
HYSPLIT analyses that both used a finer grid meteorology (NAM 12 km) that confirmed the assessment
that the Franklin Mountains do not block flow of air parcels from El Paso County to the Desert View
monitor. Therefore, this factor did not play a significant role in this evaluation. As shown in Figures 5a
and 5b above, there is evidence of air flow around the Franklin Mountains - the Mountains seem to mostly
channel the air flow rather than block air flow.
19
Figure 6. Topographic Illustration of the Physical Features
Factor 5: Jurisdictional boundaries
In addition to analyzing the geographic extent of the violating area, the EPA considered existing
jurisdictional boundaries for the purposes of providing a clearly defined legal boundary to carry out the air
quality planning and enforcement functions for nonattainment areas. In defining the boundaries of the
nonattainment area, the EPA considered existing jurisdictional boundaries, which can provide easily
identifiable and recognized boundaries for purposes of implementing the NAAQS. Examples of
jurisdictional boundaries include, but are not limited to counties, air districts, areas of Indian country,
metropolitan planning organizations, and existing nonattainment areas. If an existing jurisdictional
boundary is used to help define the nonattainment area, it must encompass all the area that has been
identified as meeting the nonattainment definition. Where existing jurisdictional boundaries are not
adequate or appropriate to describe the nonattainment area, EPA considers other clearly defined and
permanent landmarks or geographic coordinates for purposes of identifying the boundaries of the
designated areas.
El Paso County was designated as nonattainment under the 1-hour ozone NAAQS. The El Paso
Metropolitan Planning Organization includes but is not limited to El Paso County and the southeast
portion of Doña Ana County.
Mexico
Doña Ana
Otero
Hudspeth
20
In the case of a multi-state nonattainment area, of which there currently are seven for the 2015 ozone
NAAQS, each state need only address the portion of the nonattainment area within their own state
boundary, which New Mexico and Texas each has the authority to do.26
As mentioned above, the El Paso-Las Cruces TX-NM area also includes Indian country belonging to the
Ysleta del Sur Pueblo. As defined at 18 U.S.C. 1151, “Indian country” refers to: “(a) all land within the
limits of any Indian reservation under the jurisdiction of the United States Government, notwithstanding
the issuance of any patent, and, including rights-of-way running through the reservation, (b) all dependent
Indian communities within the borders of the United States whether within the original or subsequently
acquired territory thereof, and whether within or without the limits of a state, and (c) all Indian allotments,
the Indian titles to which have not been extinguished, including rights-of-way running through the same.”
The EPA recognizes the sovereignty of tribal governments and has attempted to take the input of the tribe
into account in establishing appropriate nonattainment area boundaries.
Conclusion for El Paso County
EPA has reassessed the factors described above for El Paso County and is modifying the State’s
recommendation.
The EPA designated El Paso County attainment in its April 2018 final designations action because El
Paso County had no violating monitors and EPA estimated that the majority of emissions impacting the
violating monitor could be attributed to nearby areas in Mexico. In the April 2018 Final EPA TSD for New
Mexico, the EPA stated that in considering overall emissions in the area, Juarez emits 52% of the total
NOx (compared to 28% from El Paso), 67% of the total VOC emissions (compared to 22% from El Paso),
and has 61% of the population (compared to 38% in El Paso). EPA also stated that the HYSPLIT data show
approximately 67% of back trajectories flow through nearby areas in Juarez before reaching the violating
monitor. The EPA concluded that international emissions were the primary contributor to the violating
monitor. However, in light of the Court’s decision to remand EPA’s original decision for further evaluation
and explanation and giving further consideration to the statutory requirements of CAA 107(d) and
consistency with other areas around the country, the EPA now corrects its prior decision.
Based on EPA’s reassessment of the five-factor analysis, EPA now finds that El Paso County contributes
to the violating monitor in Doña Ana County. Emissions of NOx in El Paso County are approximately 71
percent greater than emissions of NOx in Doña Ana County, and emissions of VOC in El Paso County are
approximately 128% greater than emissions of VOC in Doña Ana County. In the area of analysis,
approximately 79% of the population live in El Paso County and the VMT emissions in El Paso County
are 66% higher than the VMT in Doña Ana County. EPA believes it likely that the VMT emissions in El
Paso County also contribute to the violating monitor. Furthermore, the HYSPLIT analysis shows that on 8
of the 13 exceedance days at the violating monitor back trajectories flowed through areas of El Paso
County that also include sources of emissions of ozone pre-cursors.
We find that El Paso County contributes to the nearby violating monitor and that our previous attainment
designation did not sufficiently weigh the five factors for El Paso County for contribution and
inappropriately concluded that contributions from international emissions discounted the impact of
emissions from El Paso County. First, for contribution, we did not properly weigh the impact of emissions
26 Pursuant to CAA section 110(a)(2). See 84 FR 49057 for New Mexico and 84 FR 49663 for Texas.
21
(NOx, VOC, population size and density, and VMT) from El Paso County on the violating monitor.
Second, while EPA does believe that those international emissions influence air quality in Doña Ana and
El Paso counties, that influence is properly addressed through the appropriate CAA 179B demonstration
process, not the NAAQS designation process. As the Court noted in its opinion remanding the El Paso
County designation, the EPA must designate as nonattainment any area that contributes to a nearby
violation.27 The EPA reiterates that foreign contributions do not preclude EPA’s analysis of domestic
contributions in making designations decisions. A county may contribute to nonattainment even though
another jurisdiction’s contribution is larger, and a contributing county need not be the single cause of a
violation in order to warrant a nonattainment designation.28 Consistent with CAA section 107(d)(1)(a)(i),
even an area whose ambient air concentration complies with the relevant NAAQS must be designated as
nonattainment if it contributes to a NAAQS violation in a nearby area. See also Clean Wisconsin, 964
F.3d at 1153. EPA must designate as nonattainment any area that “exacerbates” nonattainment nearby, a
flexible standard that courts have recognized as central to the “very purpose” of Section 107(d) area
designations. See Catawba County, NC v. EPA, 571 F.3d 20 at 39 (D.C. Cir. 2009). See also Miss.
Comm’n at 163.
The EPA has determined that El Paso County contributes to a violating monitor.29 Consistent with EPA’s
prior designations and guidance, when an area contains a violating monitor, that area will be designated
nonattainment, and EPA will evaluate all nearby areas for contribution. Nearby areas include areas
without violating monitors and the absence of a violating monitor is only one of five factors the EPA
evaluates in its contribution analysis.
The EPA’s five factor analysis discussed above shows that despite the lack of violating monitors, El Paso
County contributes to the violation in Doña Ana County and, therefore, the EPA is expanding the existing
nonattainment area to include El Paso County. The EPA’s five-factor analysis from our previous
designation and this designation both demonstrate that despite a lack of violations at all monitors in El
Paso County (the 2014-2016 DVs), that El Paso County has greater emissions of NOx, greater emissions
of VOCs, greater total population, denser population, higher VMT, and more point sources than Doña
Ana County. Furthermore, the HYSPLIT analysis shows that on 8 of the 13 exceedance days at the
violating monitor back trajectories flowed through areas of El Paso County that also include sources of
emissions of ozone pre-cursors. Collectively, this provides demonstrable evidence that El Paso County
sufficiently contributes to the violating monitor and the existence of international emissions, though
relevant and greater, cannot discount that contribution. Therefore, the EPA has determined that El Paso
County contributes to the violation in Doña Ana County and is expanding the existing nonattainment area
to include El Paso County.
The EPA’s designation of nonattainment for El Paso County is consistent with the designation decisions
EPA made in April 2018 across the rest of the country. For example, inclusion of El Paso County is
consistent with EPA’s inclusion of Ellis, Kaufman, and Wise counties in the Dallas-Fort Worth (DFW)
nonattainment area and Chambers and Fort Bend counties in the Houston-Galveston-Brazoria (HGB)
nonattainment area.30 Wise, Chambers and Fort Bend counties have no ozone monitors and the ozone
27 Clean Wisconsin v. EPA, 964 F.3d 1145, 1164 (D.C. Cir. 2020) 28 Miss. Comm’n on Env’t Quality v. EPA, 790 F.3d 138 at 163. 29 Clean Wisconsin v. EPA, 964 F.3d 1145, 1164 (D.C. Cir. 2020) 30 See EPA’s Dallas-Fort Worth and Houston-Galveston-Brazoria Nonattainment Areas Final Area Designations for
22
monitors in Ellis and Kaufman counties were meeting the 2015 ozone NAAQS at the time of designation.
Also, Ellis, Kaufman, Wise, Chambers, and Fort Bend counties each have fewer emissions of NOx and
VOC than El Paso County, and the HYSPLIT maps for the DFW and HGB areas showed back
trajectories passed through these counties before reaching nearby violating monitors. All five counties
were designated nonattainment even though they had significantly fewer emissions than other counties in
the DFW and HGB areas of analysis. The Court’s remand of EPA’s April 2018 decision and our re-
evaluation here correct our April 2018 decision.
the 2015 Ozone National Ambient Air Quality Standards TSD (April 2018) in the docket for this action and posted at
https://www.epa.gov/ozone-designations/ozone-designations-2015-standards-texas-state-recommendations-and-epa-
response.