Embed Size (px)
Citation preview

WMO
Strategy for Urban Service Delivery Adapting to Changing Climate and Environment
-- Building Resilient and Climate Smart Cities
Dr. Xu Tang, Director, Weather and DRR Service Dept./WMO, [email protected]
Dr. Deon Terblanche, Director, Atmospheric Research Environment Dept./WMO, [email protected]
WMO; Weather and DRR Service Department (WDS)
WMO
Building urban resilience: fundamental base for sustainable urbanization – Risk Reduction
People centered: key issue for sustainable cities –Healthy Cities Design and development
Integrated urban service delivery: Climate and Environment smart cities, Implementation Strategies: Science in service to society, Building Resilient Society, Integration and Seamless Approaches
Government long-term promising, investment and consistent leadership
WMO; Weather and DRR Service Department (WDS)

WMO
Megacities 2015
Megacities - according to various definitions cities with more than 5, 8 or 10 million inhabitants - are particularly important in the global urbanization processes.

WMO
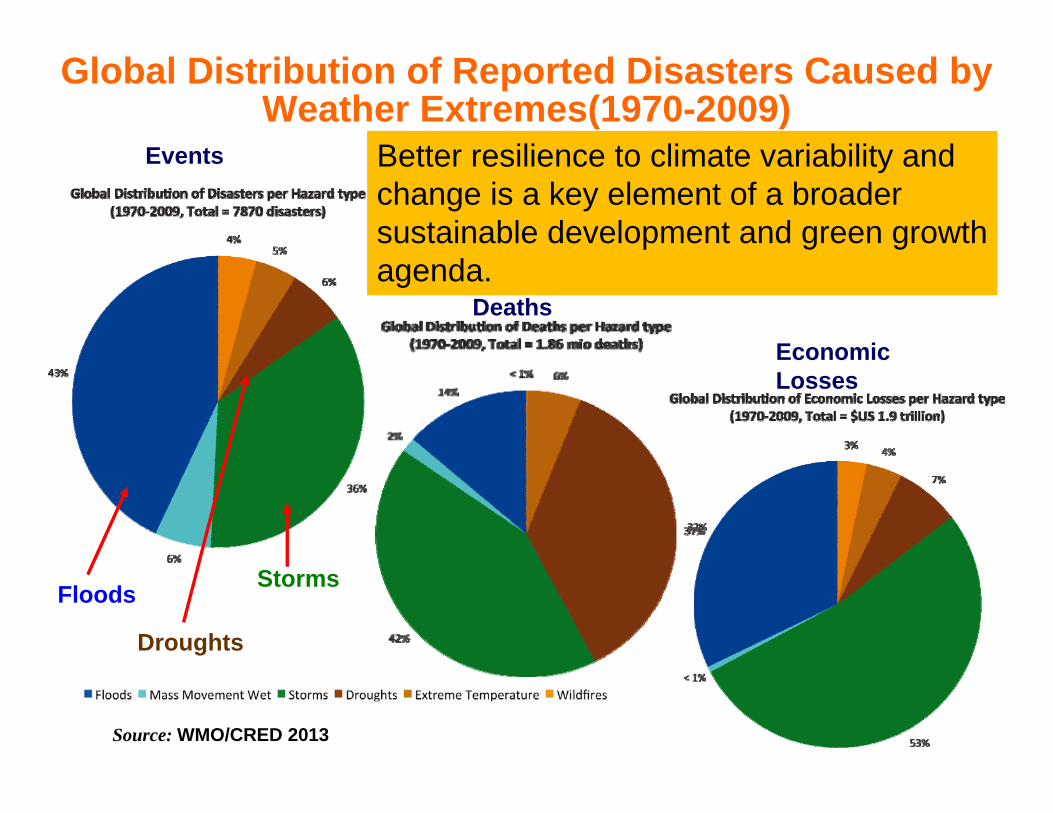
Source: WMO/CRED 2013
Global Distribution of Reported Disasters Caused by Weather Extremes(1970-2009)
Main
Deaths
Economic Losses
Events
Storms
Droughts
Floods
Better resilience to climate variability and change is a key element of a broader sustainable development and green growth agenda.
6
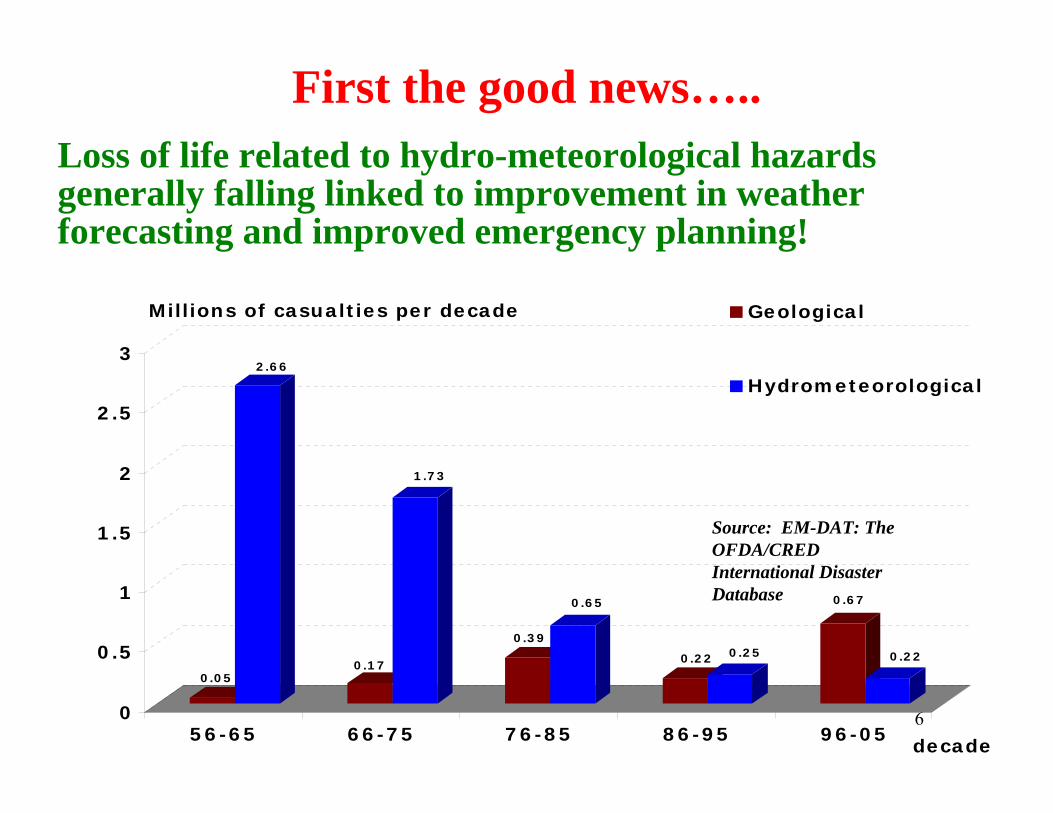
First the good news…..
Source: EM-DAT: The OFDA/CRED International Disaster Database
0.05
2.66
0.17
1.73
0.39
0.65
0.22 0.25
0.67
0.22
0
0.5
1
1.5
2
2.5
3
56-65 66-75 76-85 86-95 96-05
Geological
Hydrometeorological
Millions of casualties per decade
decade
Loss of life related to hydro-meteorological hazards generally falling linked to improvement in weather forecasting and improved emergency planning!

Source:
WMO/CRED Atlas 2013
Concerns: Economic losses related to hydro-meteorological disasters are on the rise! E.g. the
transportation infrastructure is crucial to bringing Africa out of poverty, but flooding incapacitates large parts of this network every year.
Economic losses by decade and region (in billions of US $ adjusted to 2000 values)
Asia
North/Central America and Carib
Weather extremes also increase the vulnerability of people – particularly the poorest
– when development needs trigger investment and human settlement in coastal zones,
flood plain, arid areas, and other high risk environments.
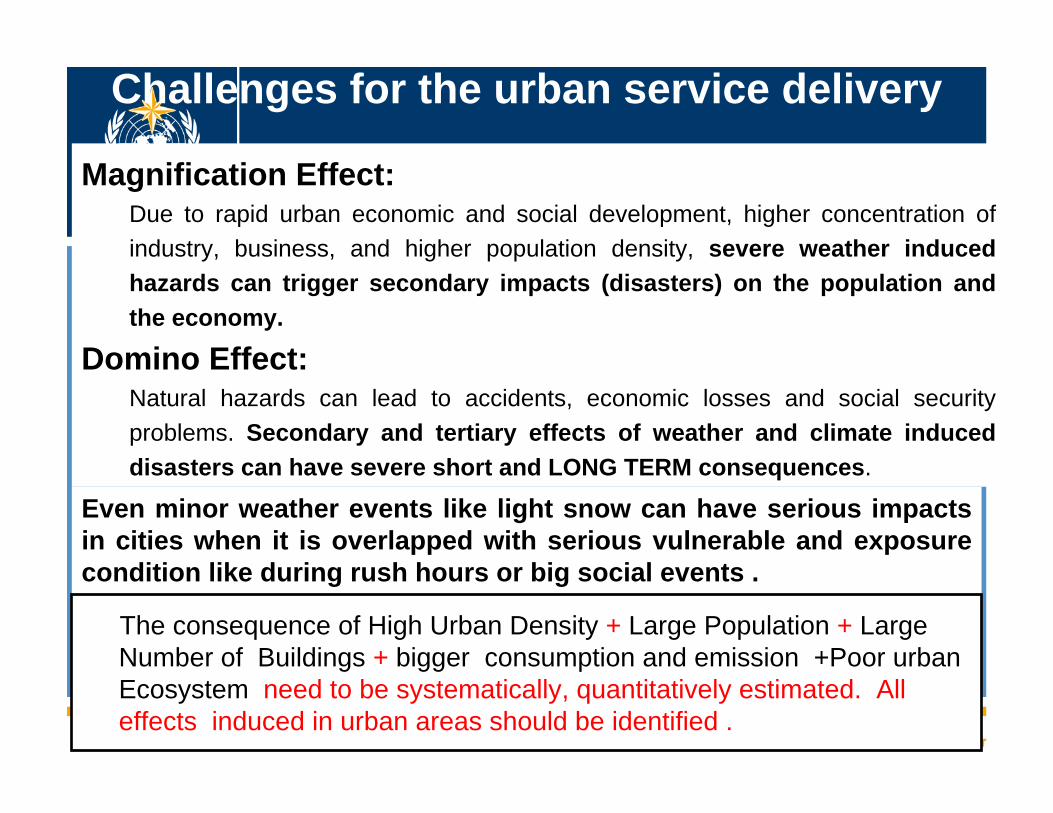
WMOMagnification Effect:
Due to rapid urban economic and social development, higher concentration of industry, business, and higher population density, severe weather induced hazards can trigger secondary impacts (disasters) on the population and the economy.
Domino Effect:Natural hazards can lead to accidents, economic losses and social security problems. Secondary and tertiary effects of weather and climate induced disasters can have severe short and LONG TERM consequences.
Challenges for the urban service delivery
Even minor weather events like light snow can have serious impacts in cities when it is overlapped with serious vulnerable and exposure condition like during rush hours or big social events .
The consequence of High Urban Density + Large Population + Large Number of Buildings + bigger consumption and emission +Poor urban Ecosystem need to be systematically, quantitatively estimated. All effects induced in urban areas should be identified .

WMO
Do we know all main chains of Hazard domino effect in urban areas?
Traffic chaos(road and railway)
Snow Storm
High impact on Agriculture Caused by
frozen rain and snow
food productsin short supply
foodprices rose
Transportation ofcoal and foodinfluenced
Traffic duringSpring Festivalblocked
Migrant workers Overcrowded
Energy Supplyin Emergency
Power towers collapsed under the weight of frozen rain
High-tension power grid
Collapsed Whichthreatened Electricity
transmission to Shanghai
CPI up over8% in Feb
Economy influenced
Hundreds of millions of people massivelyinconvenienced
Emergency policy for inflation control
set up
NaturalEvents
Social Events
Severe weather hazards may bring many other disasters, which further threaten city safety. Weather factor resembles the first piece of domino, and will impact other aspects of social activities.
WMO
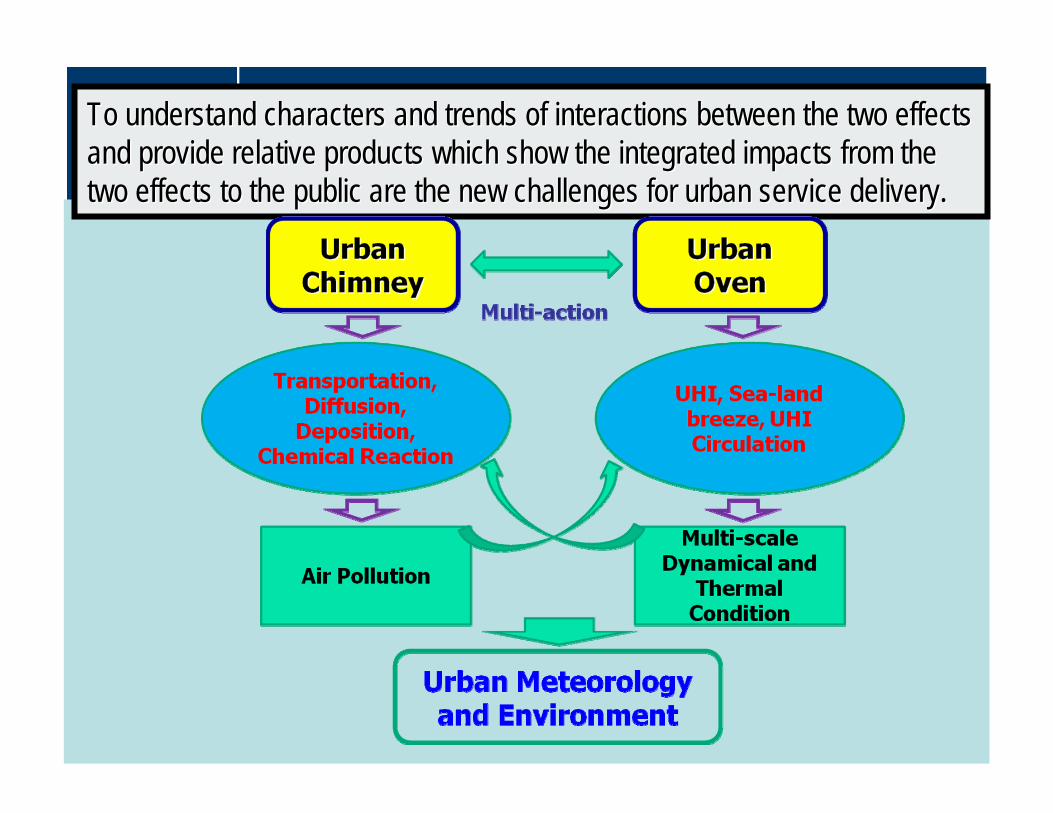
To understand characters and trends of interactions between the To understand characters and trends of interactions between the two effects two effects and provide relative products which show the integrated impacts and provide relative products which show the integrated impacts from the from the two effects to the public are the new challenges for urban servitwo effects to the public are the new challenges for urban service delivery.ce delivery.

Connections between Megacities,
Air Quality and Climate• Science - nonlinear interactions and feedbacks between emissions, chemistry, meteorology and climate
• Multiple spatial and temporal scales
• Complex mixture of pollutants from large sources
• Interacting effects of urban features and emissions
• New generation integrated modelling systems are needed
• FUMAPEX Integrated UAQIFS: in 6 EU cities
see: Nature, 455, 142-143 (2008)
WMO
test footer 12
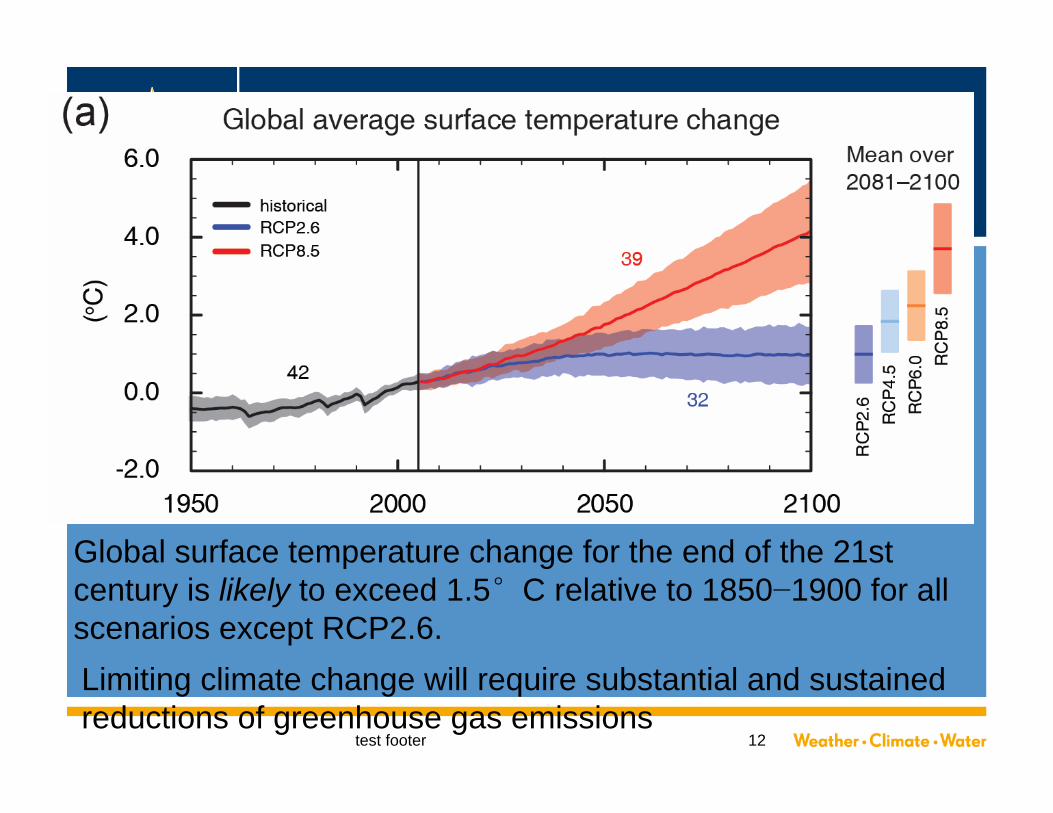
Global surface temperature change for the end of the 21st century is likely to exceed 1.5°C relative to 1850−1900 for all scenarios except RCP2.6.Limiting climate change will require substantial and sustained reductions of greenhouse gas emissions
WMO
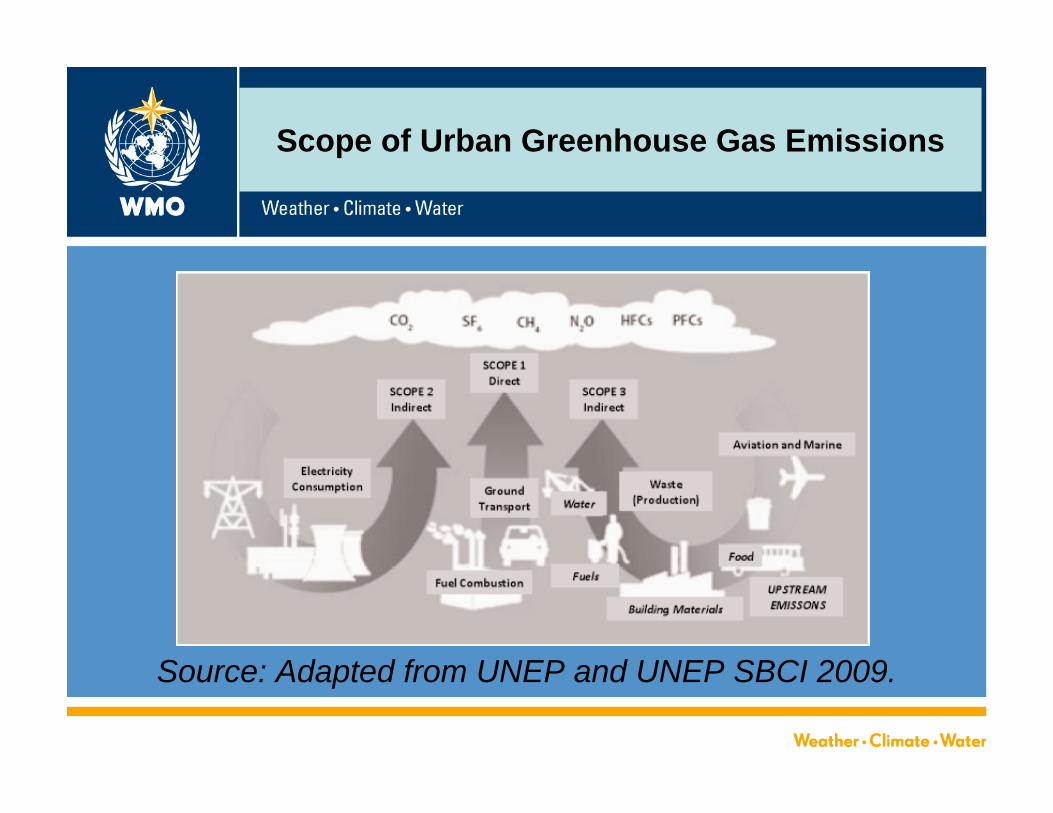
Scope of Urban Greenhouse Gas Emissions
Source: Adapted from UNEP and UNEP SBCI 2009.
WMO
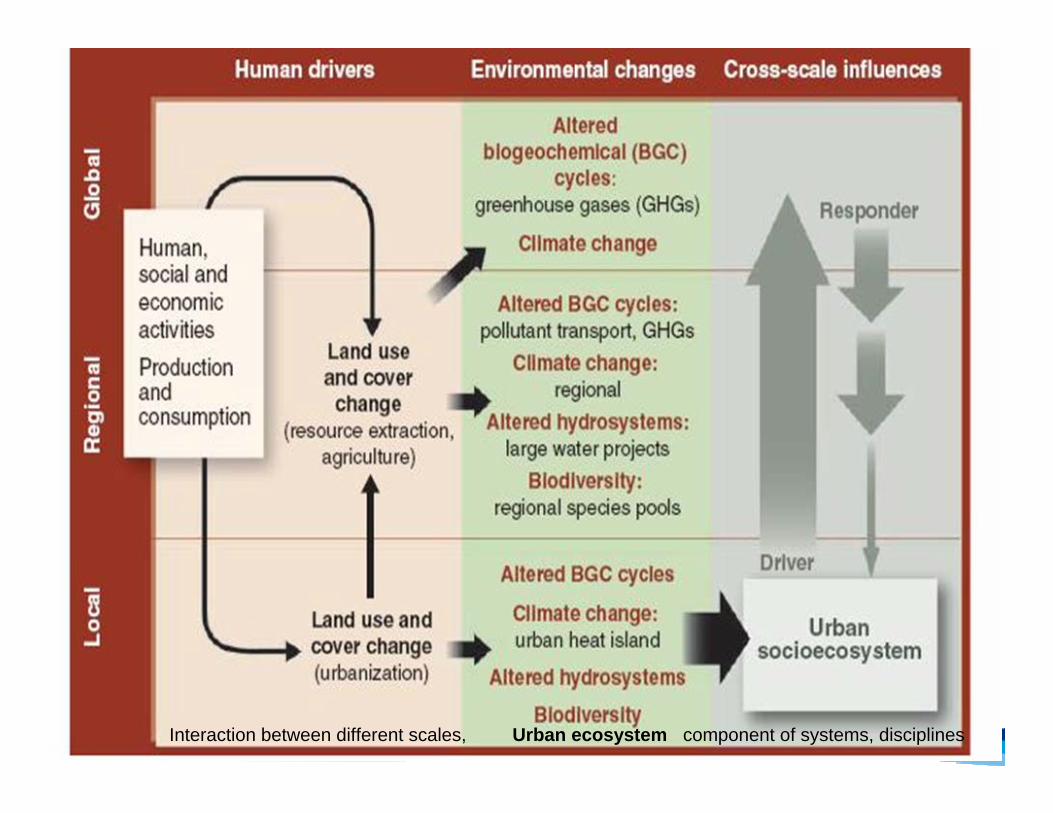
Urban socio-ecosystem
Urban ecosystemInteraction between different scales, component of systems, disciplines

WMO
test footer 15
Global surface temperature change for the end of the 21st century is likely to exceed 1.5°C relative to 1850−1900 for all scenarios except RCP2.6.
Need for a Business Shift:
based on the IPCC AR 5:
2050 will see a very different world with more extreme weather

WMO
Urbanization is not only provide opportunities for jobs, provide engines for Urbana's economic growth, but also increase vulnerability and exposures of the cities. A big worry is not only that the growth of disasters and population affected, themselves but also the number of people killed will increase if city’s government fail to intervene. However, the developing countries will continue to be exposed to frequent and extreme weather, while more people and assets are now limited structural protection, inadequate city wide drainage system and weak non structural mitigation measures.
test footer 16

WMO
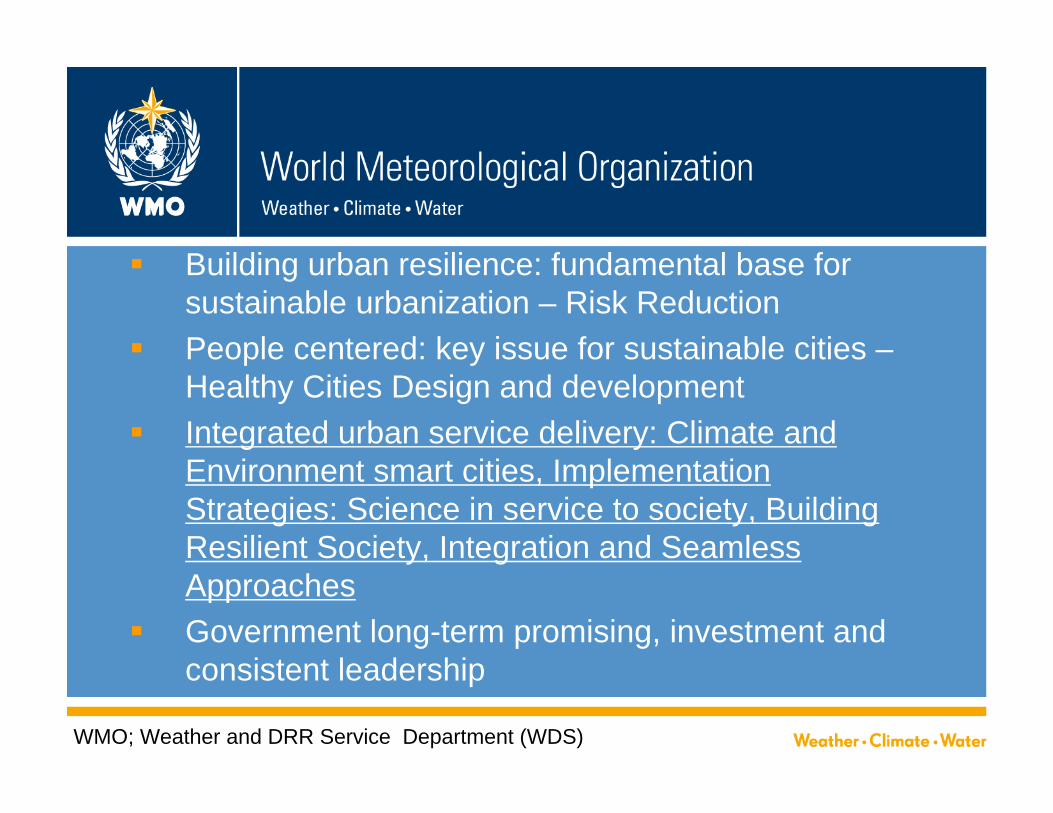
Building urban resilience: fundamental base for sustainable urbanization – Risk Reduction
People centered: key issue for sustainable cities –Healthy Cities Design and development
Integrated urban service delivery: Climate and Environment smart cities, Implementation Strategies: Science in service to society, Building Resilient Society, Integration and Seamless Approaches
Government long-term promising, investment and consistent leadership
WMO; Weather and DRR Service Department (WDS)
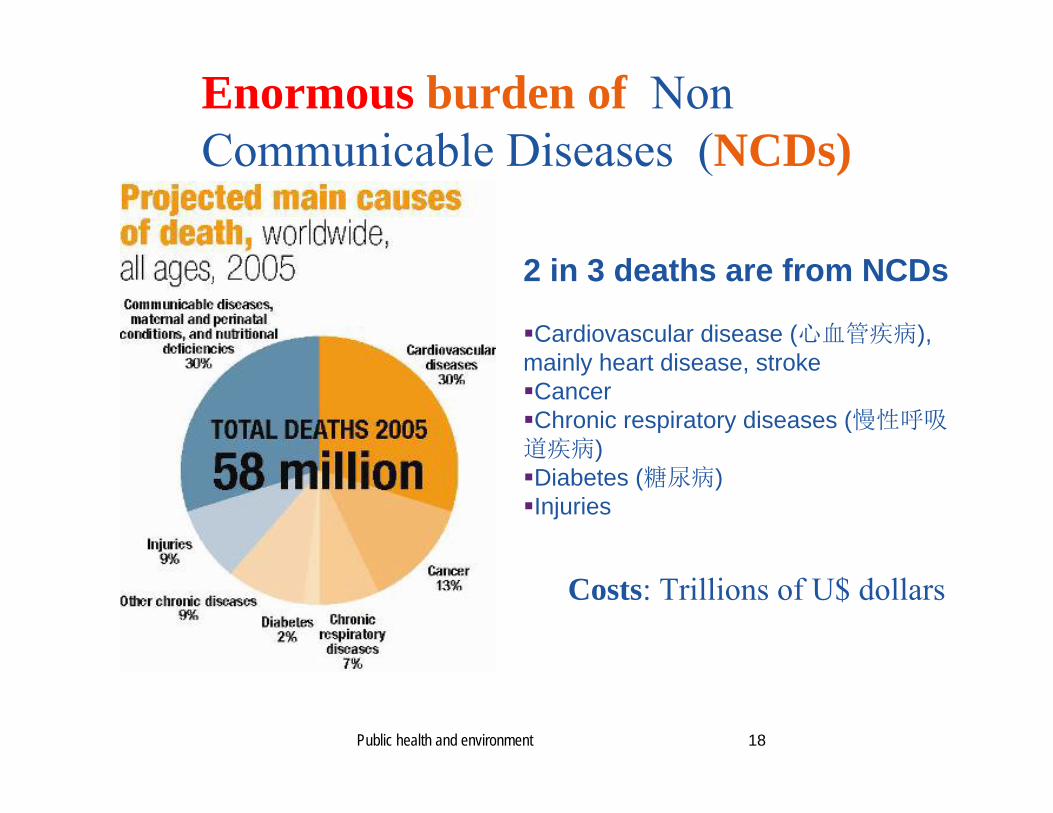
2 in 3 deaths are from NCDs
Cardiovascular disease (心血管疾病), mainly heart disease, strokeCancerChronic respiratory diseases (慢性呼吸道疾病)Diabetes (糖尿病)Injuries
18Public health and environment
Enormous burden of Non Communicable Diseases (NCDs)
Costs: Trillions of U$ dollars
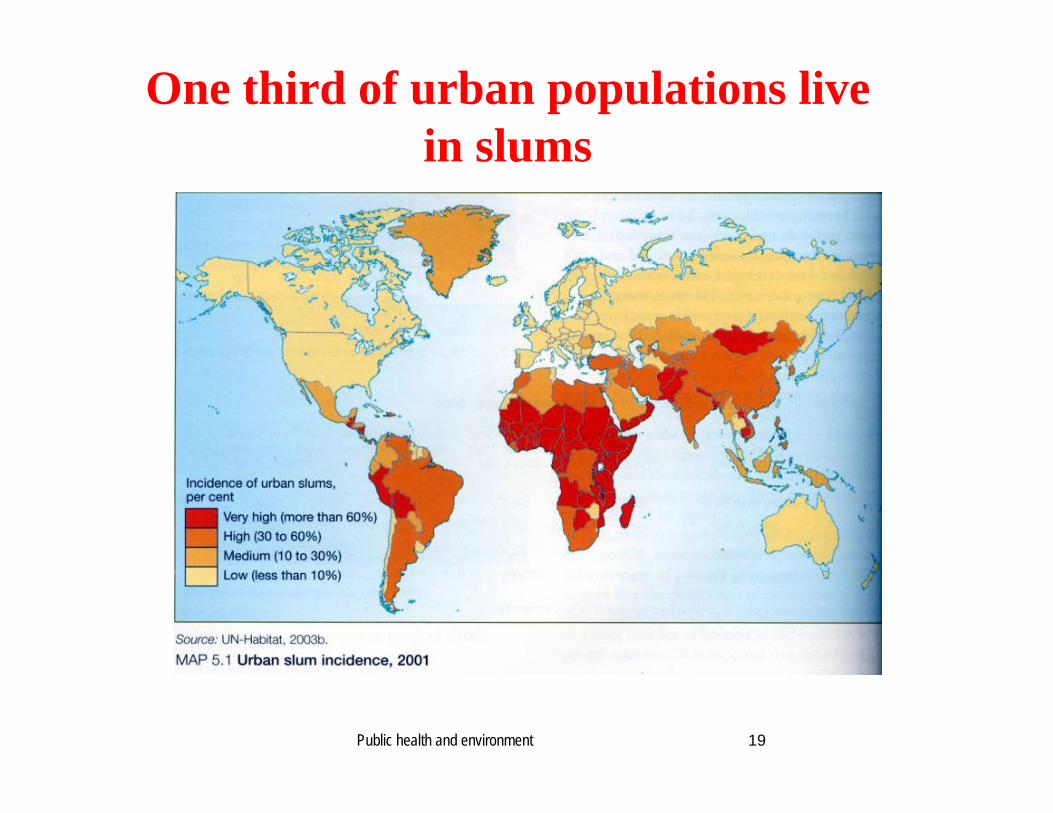
One third of urban populations live in slums
19Public health and environment
Public health and environment
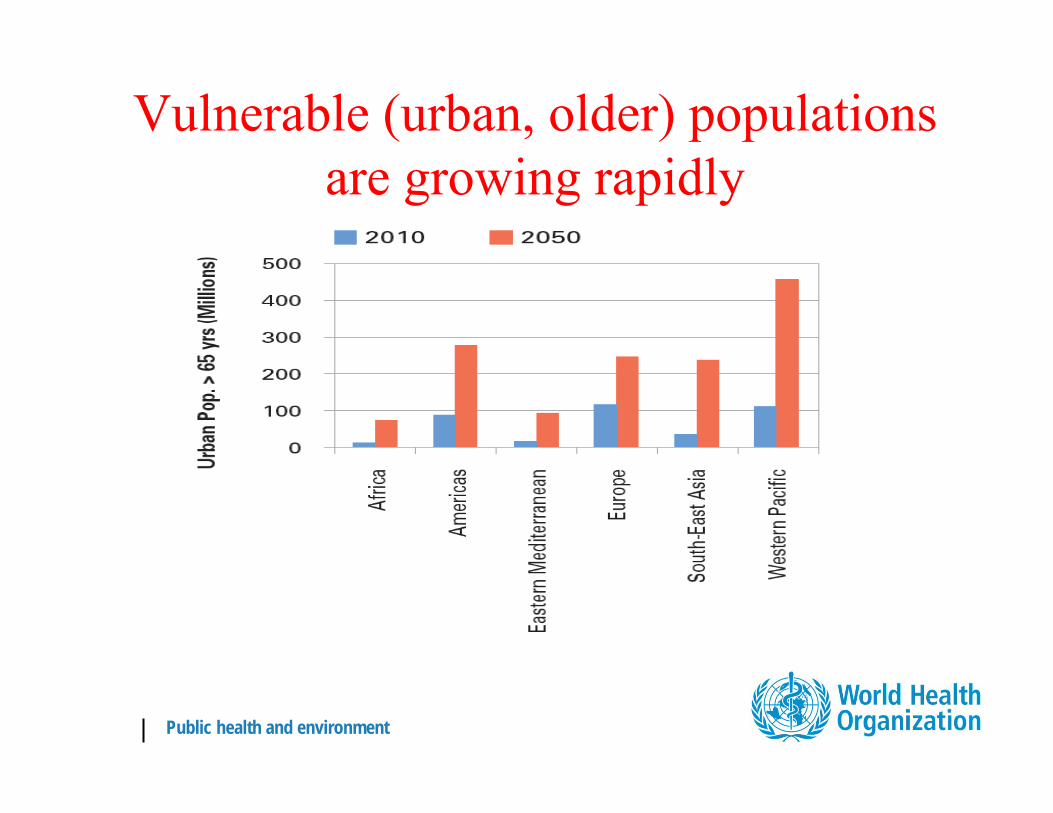
Vulnerable (urban, older) populations are growing rapidly
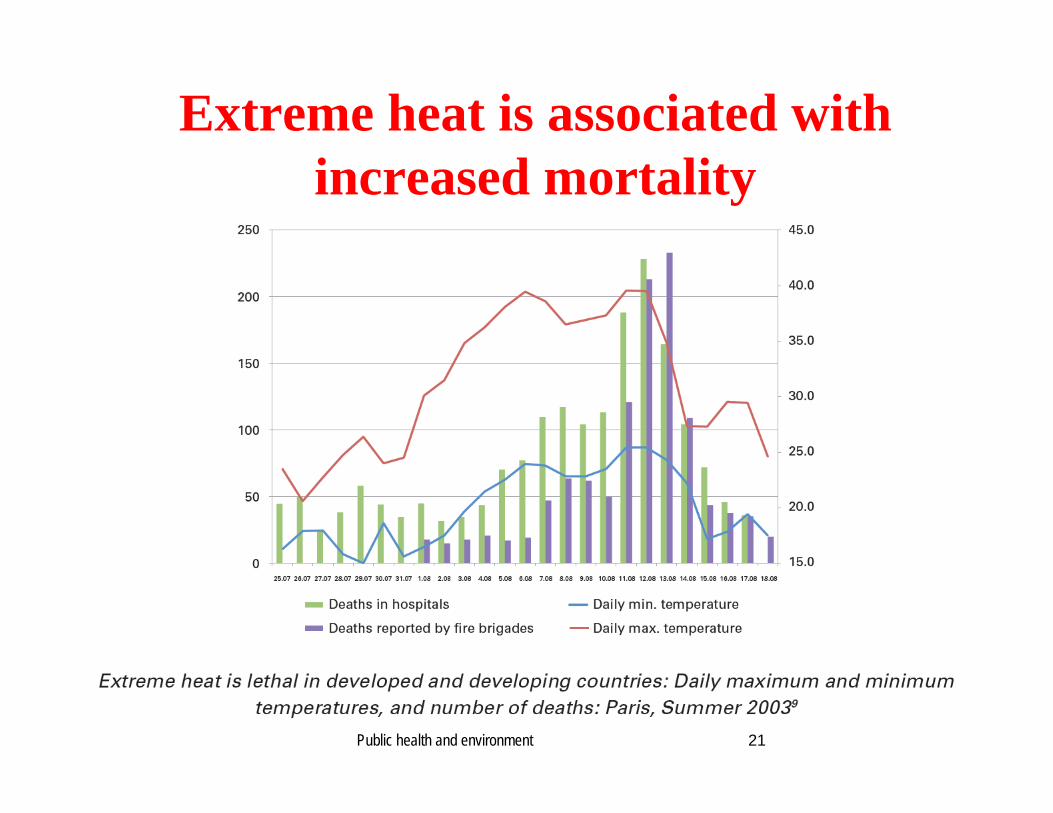
Extreme heat is associated with increased mortality
21Public health and environment
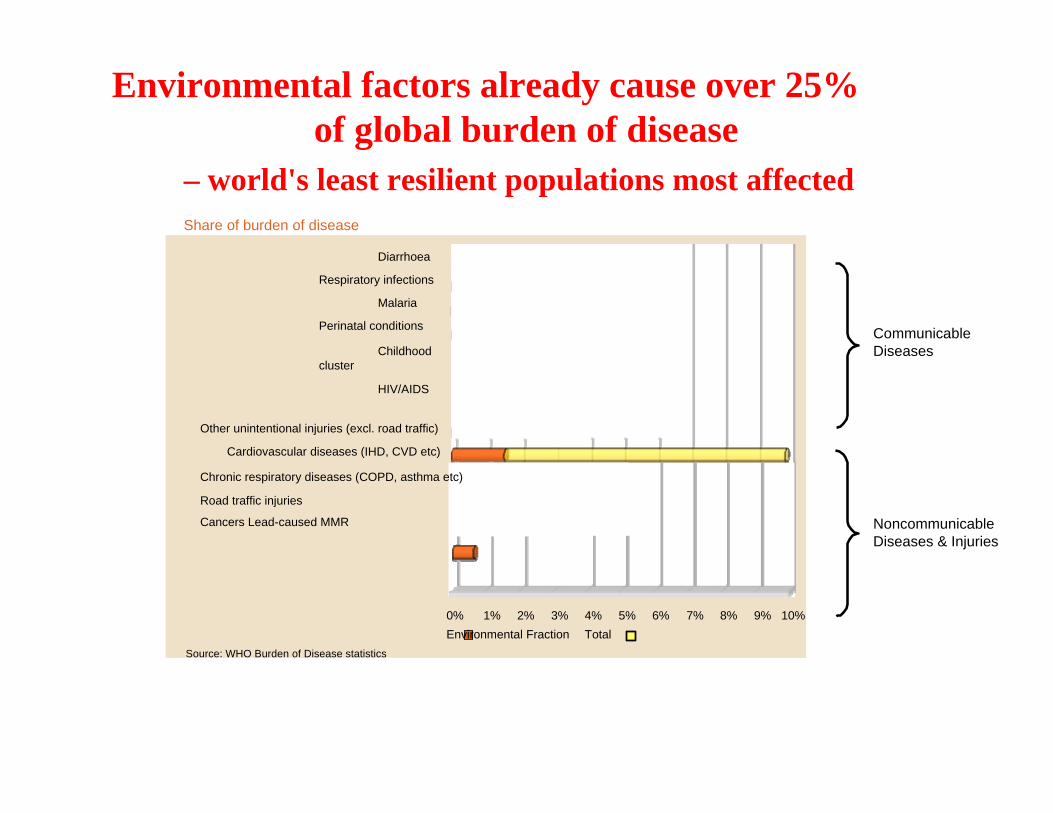
Environmental factors already cause over 25% of global burden of disease
– world's least resilient populations most affectedShare of burden of disease
Communicable Diseases
Noncommunicable Diseases & Injuries
Diarrhoea Respiratory infections
Malaria Perinatal conditions
Childhood cluster
HIV/AIDS
Other unintentional injuries (excl. road traffic) Cardiovascular diseases (IHD,
CVD etc)
Chronic respiratory diseases (COPD, asthma etc)
Road traffic injuries
Cancers Lead-caused MMR
0% 1% 2% 3% 4%5% 6% 7% 8% 9% 10
Environmental Fraction TotalSource: WHO Burden of Disease statistics
Other unintentional injuries (excl. road traffic)
Cardiovascular diseases (IHD, CVD etc)
Chronic respiratory diseases (COPD, asthma etc)
Road traffic injuries
Cancers Lead-caused MMR
Diarrhoea
Respiratory infections
Malaria
Perinatal conditions
Childhood cluster
HIV/AIDS
Source: WHO Burden of Disease statistics
0% 1% 2% 3% 4% 5% 6%Environmental Fraction Total
7% 8% 9% 10%
WMO
y = 0.098x + 89.59
0
50
100
150
200
250
300
350
400
450
500
就诊
人数
日期
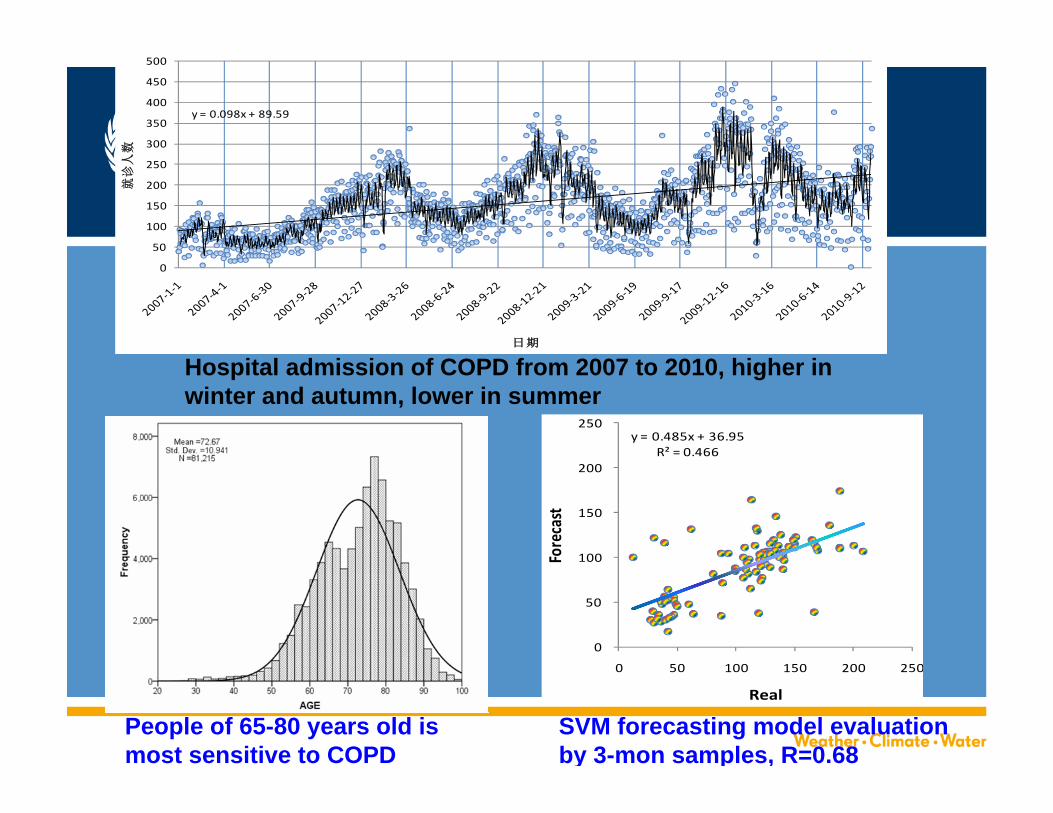
Hospital admission of COPD from 2007 to 2010, higher in winter and autumn, lower in summer
People of 65-80 years old is most sensitive to COPD
y = 0.485x + 36.95R² = 0.466
0
50
100
150
200
250
0 50 100 150 200 250
Forecast
Real
SVM forecasting model evaluation by 3-mon samples, R=0.68

WMO
0
500
1000
1500
2000
2500
3000
3500
4000
4500
1 2 3 4 5 6 7 8 9 10 11 12人
数
年 喘就 数
2006
2007
2008
2009
2010
Hospital admission of child asthma & temperature
Hospital admission of child asthma from 2006 to 2010, especially higher during the seasonal transmission period
y = 0.643x + 18.61R² = 0.511
0
50
100
150
200
250
0 50 100 150 200 250forecast (2
d)real
Evaluation of SVM forecasting model by 1 year samples, R=0.7

WMO
Four peaks of hospital admission of influenza distributed with age
0
200
400
600
800
1000
1200
1400
1600
04-1-
2404
-3-24
04-5-
2404
-7-24
04-9-
2404
-11-24
05-1-
2405
-3-24
05-5-
2405
-7-24
05-9-
2405
-11-24
06-1-
2406
-3-24
06-5-
2406
-7-24
06-9-
2406
-11-24
07-1-
2407
-3-24
07-5-
2407
-7-24
07-9-
2407
-11-24
08-1-
2408
-3-24
08-5-
24
case predicted
Influenza forecasting in Shanghai based on statistical model
54.35%
15.39%
30.25%
市区
郊区
郊县
Hospital admission of influenza in urban area is higher than that in suburb
年 样病例 构成
49.07%
21.67%
29.26%
市区
郊区
郊县
2005
2006

Poor Air Quality
Sedentary 久坐不运动
Remain Indoors
Chronic Stress 精神压力
Social Isolation
Reduced Access to Green Space
The Car Traffic
Mitochondrial Damage 导致细胞线粒体”细胞动力工厂”作用的损伤
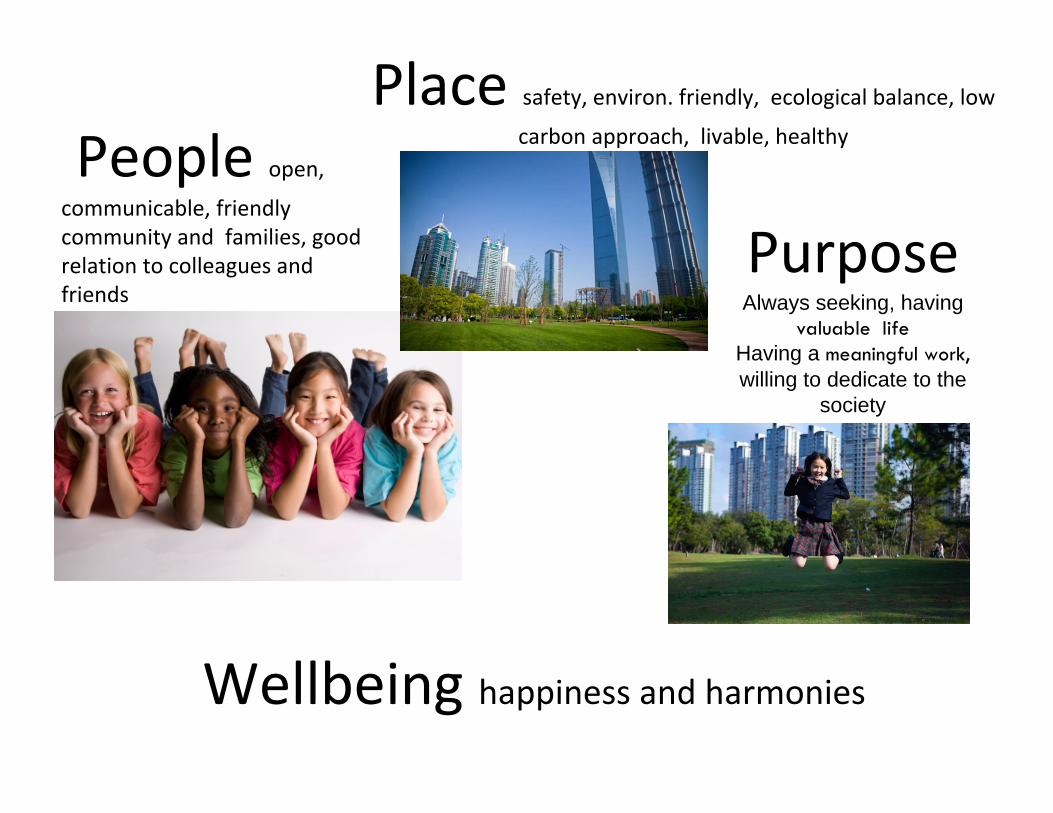
People open, communicable, friendly community and families, good relation to colleagues and friends
Place safety, environ. friendly, ecological balance, low carbon approach, livable, healthy
PurposeAlways seeking, having
valuable lifeHaving a meaningful work,willing to dedicate to the
society
Wellbeing happiness and harmonies
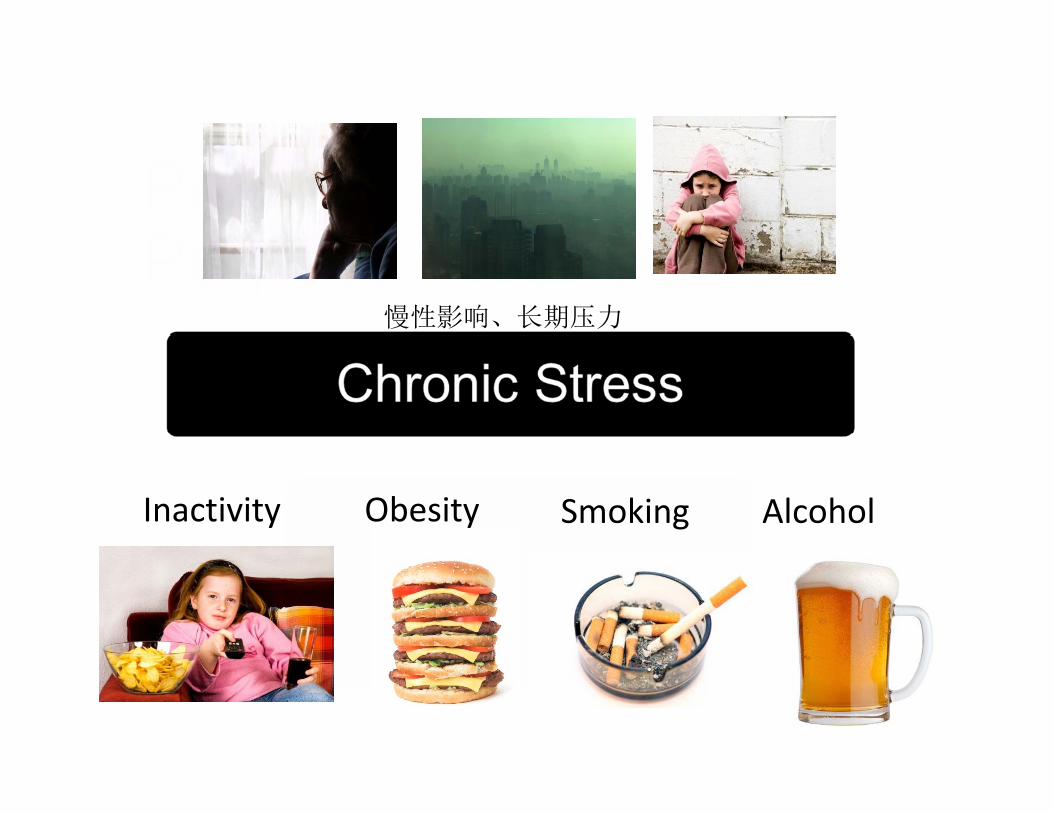
AlcoholSmokingObesityInactivity
慢性影响、长期压力
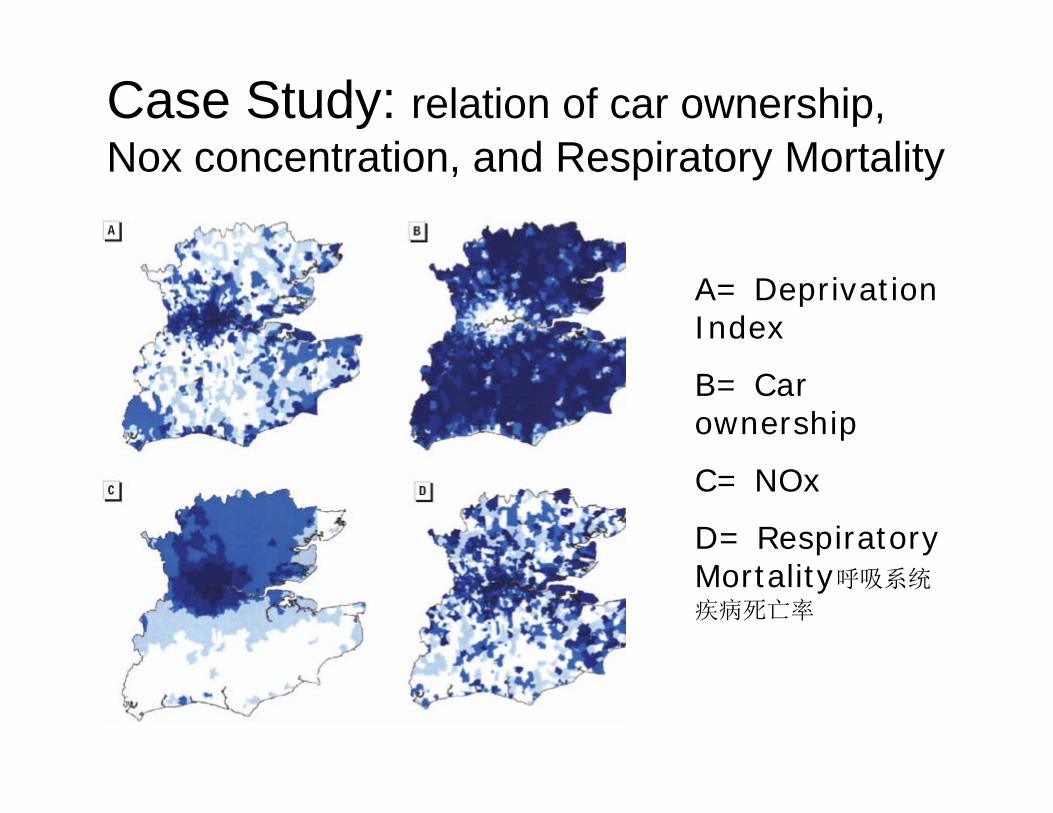
Case Study: relation of car ownership, Nox concentration, and Respiratory Mortality Air Quality
A= Deprivation Index
B= Car ownership
C= NOx
D= Respiratory Mortality呼吸系统
疾病死亡率

0
0.5
1
1.5
2
2.5
3
3.5
Low High
ObesityPhysical Activity
Greenery
Odds Ratio
A Ellaway
S Macintyre
BMJ 2005;331;611‐2
Place: Is Green Space associated with obesity? N = 6919H

Not at all
A little
Somewhat
Quite
Place: Community Cohesion (社区凝聚力) and Nearby Green Space
More nearby green spaces link to more cohesion of the community
nd environment
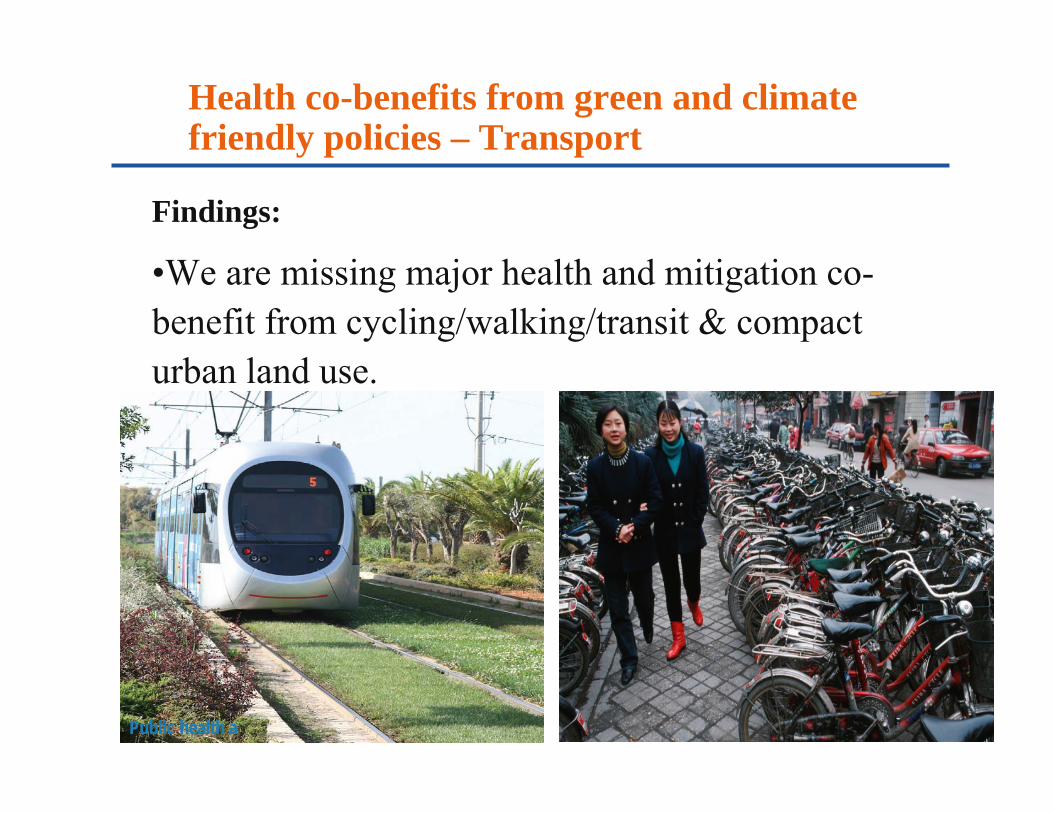
Health co-benefits from green and climate friendly policies – Transport
Findings:
•We are missing major health and mitigation co-benefit from cycling/walking/transit & compact urban land use.
Public health a

Evidence: Health outcomes directly linked to type of urban infrastructure investment
(including parking, motorways)
Reduced BMI or obesity73
Review of studies on
infrastructure investment,
physical activity and
health –
WHO/Health in Green Economy
(forthcoming)
Infrastructure for different travel modes (including presence and proximity of infrastructure) Review of studies on
infrastructure investment,
physical activity and
health –
WHO/Health in Green Economy
(forthcoming)
More infrastructure Increased walking, cycling or active Less active transport179
facilitating walking transport94,133,138,144,146,147,154,175,223–229
(including general Increased physicalassessments of activity104,154,155,160,176,184,223,228,230–239
“walkability” of Reduced BMI or neighbourhoods as obesity111,118,119,165,224,234,238–240
well as presence of Reduced air pollution-related effects234 specific features, e.g. Improved reported health status224 pavements) Reductions in specific health problems222,224
Lower mortality / higher life expectancy47
More infrastructure Increased walking, cycling or active facilitating cyclingtransport94,136–139,141,144,171,175,241–243
Increased physical activity27,104,157,159,161,184,244
More infrastructure Increased walking, cycling or active Less walking, cycling or facilitating public transport44,133,140,146 active transporttransport use 89,94,150,152,179,245
Increased physical activity103,140,157,159,182 Reduced BMI or obesity113,117
Reduced air pollution-related effects246
Less infrastructure Increased walking, cycling or active facilitating car traveltransport245,247
WMO
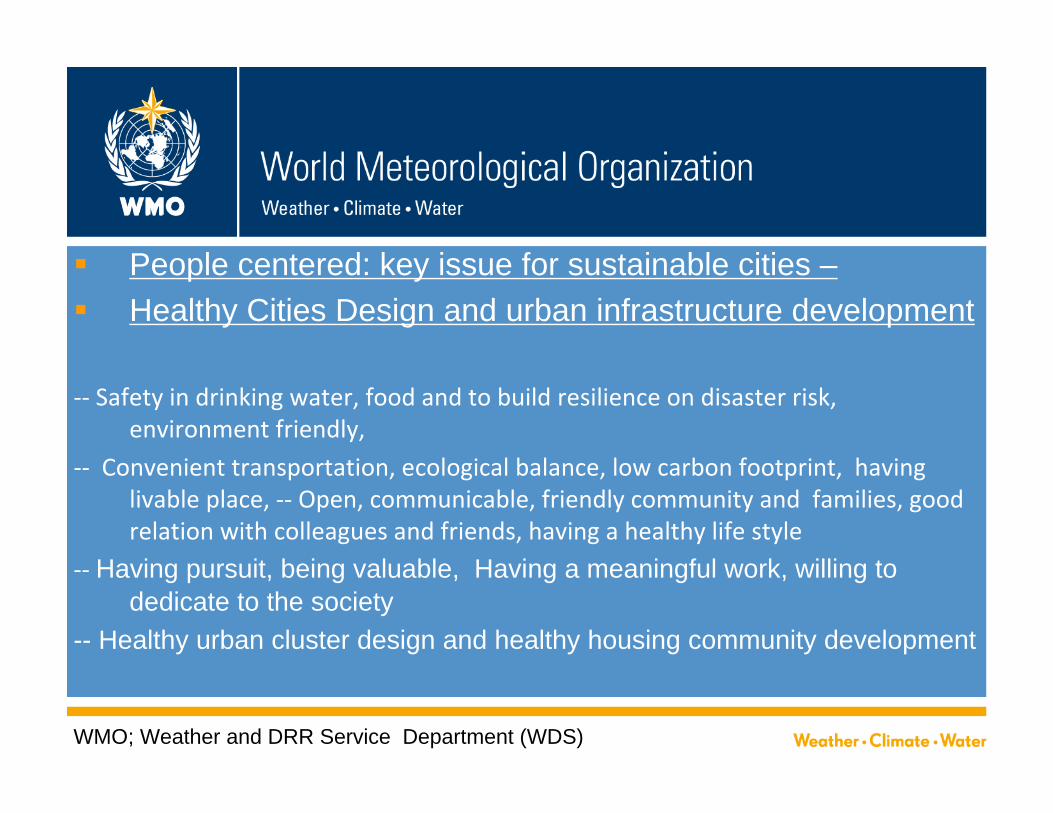
People centered: key issue for sustainable cities – Healthy Cities Design and urban infrastructure development
‐‐ Safety in drinking water, food and to build resilience on disaster risk, environment friendly,
‐‐ Convenient transportation, ecological balance, low carbon footprint, having livable place, ‐‐ Open, communicable, friendly community and families, good relation with colleagues and friends, having a healthy life style
‐‐ Having pursuit, being valuable, Having a meaningful work, willing to dedicate to the society
-- Healthy urban cluster design and healthy housing community development
WMO; Weather and DRR Service Department (WDS)
WMO
Building urban resilience: fundamental base for sustainable urbanization – Risk Reduction
People centered: key issue for sustainable cities –Healthy Cities Design and development
Integrated urban service delivery: Climate and Environment smart cities, Implementation Strategies: Science in service to society, Building Resilient Society, Integration and Seamless Approaches
Government long-term promising, investment and consistent leadership
WMO; Weather and DRR Service Department (WDS)

WMO Escalating demands for urban resources, sustainability and safetyFrom concept to action. Better city, better life, better service delivery; Healthy city, healthy life, healthy living environment; Smart city, Resilience Ready City, Low carbon and sustainable city.
To build an integrated Urban Service Delivery System of the multiple discipline systems for delivering the right information to the right people at right time.
Taking advantage of the achievements in science and technology can substantially improve the accuracy and utility of weather, climate, water and environment information in urban decision processes. Implementing “Science in service to society”; Application of the Impact-based, Risk-based methodology and technology in user orientated service, and taking advantage of IT technology achievement to build a information Smart delivery approach.
Requirement & Opportunities
WMO
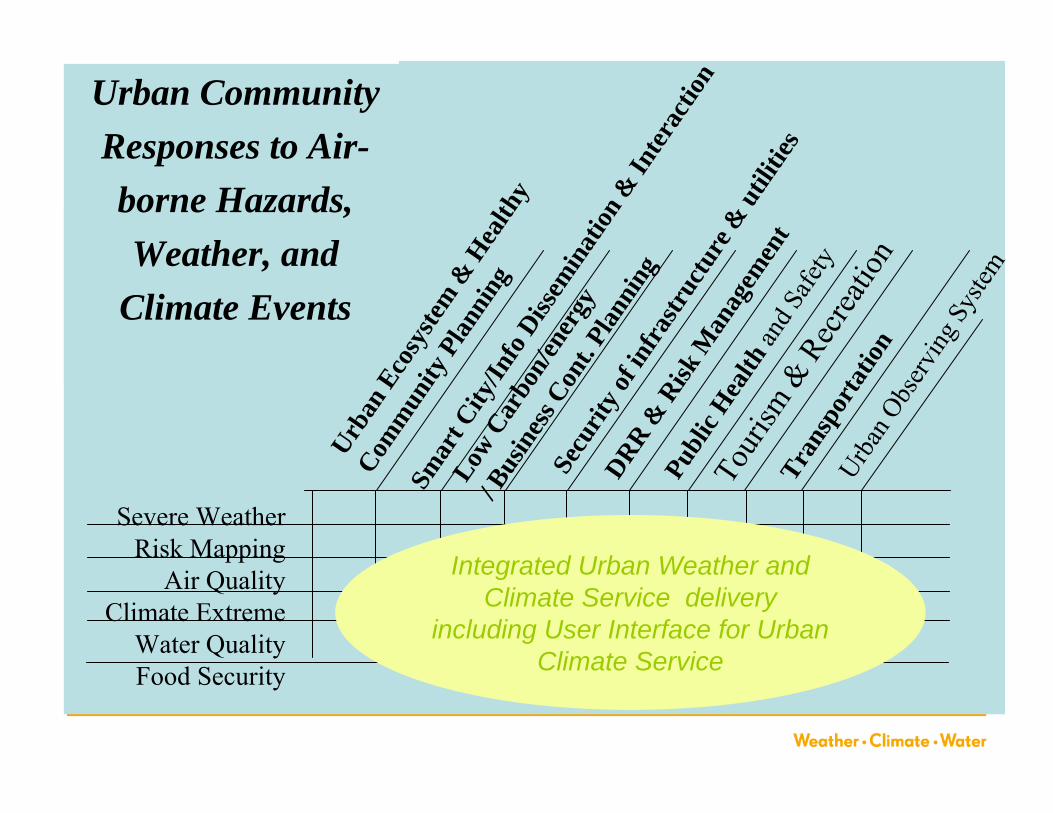
Urban Community Responses to Air-borne Hazards, Weather, and
Climate Events
Severe WeatherRisk Mapping
Air Quality Climate Extreme
Water QualityFood Security
Urban
Eco
syste
m &
Hea
lthy
Comm
unity
Plan
ning
Tour
ism &
Rec
reatio
nUrb
an O
bserv
ing S
ystem
Secu
rity o
f inf
rastr
uctu
re &
util
ities
DRR & R
isk M
anag
emen
t
Publ
ic Hea
lthan
d Safe
ty
Smar
t City
/Info
Diss
emin
ation
& In
terac
tion
Trans
porta
tion
Low C
arbo
n/en
ergy
/ Bus
ines
s Con
t. Pl
anni
ng
Integrated Urban Weather and Climate Service delivery
including User Interface for Urban Climate Service

WMO
Needs to go through integrating and crosscutting ways

Global Framework for Climate Services
3939
Global Framework for Climate Services• Goal:
– Enable better management of the risks of climate variability and change and adaptation to climate change at all levels, through development and incorporation of science-based climate information and prediction into planning, policy and practice.
WMO will work with UN and Regional partners during 2014 to 2020 to adress these issues in SIDs. The primary focus will be to facilite the development of the Regional Climate Center and National Climate Services through: (1) infrastructure development,
(2) increasing the range of products and services delivered to stakeholders, (3) enhancement of human and technical capacities at Regional Climate Centers and in NMHSs in SIDs and (4) improvement of service delivery mechanisms to national, regionaland international stakeholders.

Global Framework for Climate Services
40
GFCS: ObjectivesGFCS: Objectives
• Provide a cooperative framework in which all nations, International organizations, scientists and sectors will work together to operationally provide climate information to meet the needs of users;
• Enable users to benefit from improved user driven climate information and prediction;
• Mobilize climate science globally to advance the skills of seasonal-to-interannual and multi-decadal climate predictions to generate and provide future climate information on an operational basis;
• Cooperative global infrastructure to foster sharing new advances in science and information.
Global Framework for Climate Services
4141
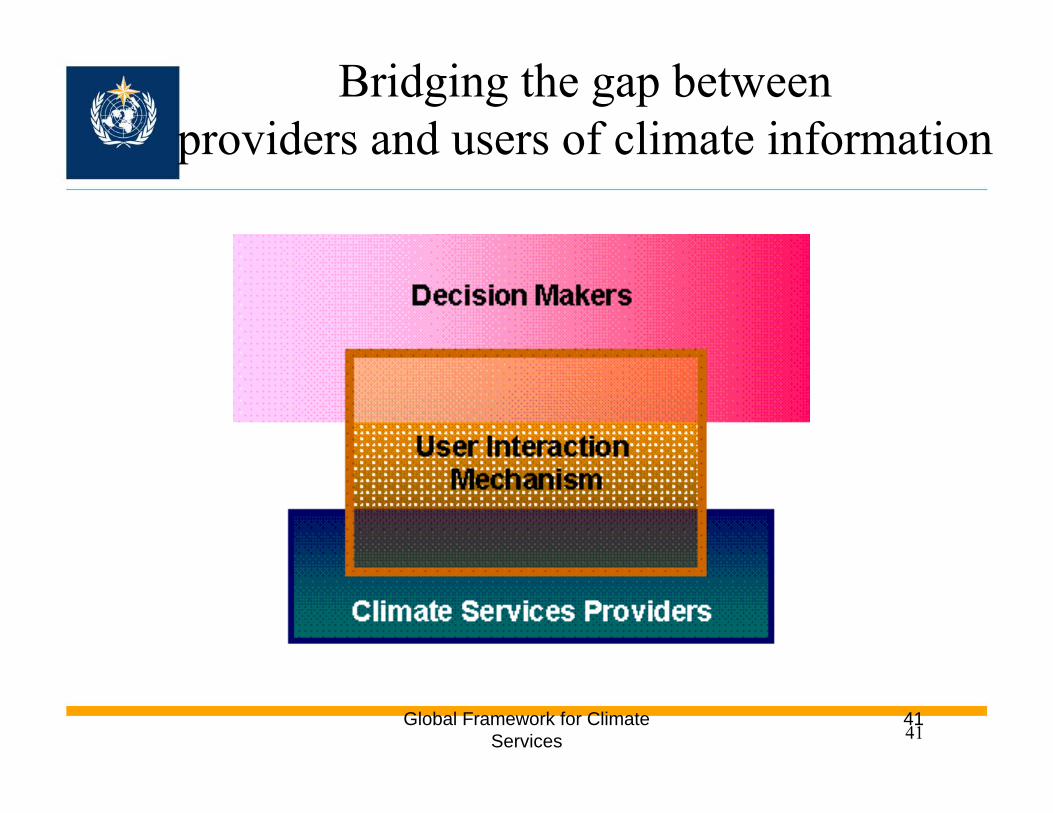
Bridging the gap between providers and users of climate information
42
42
11
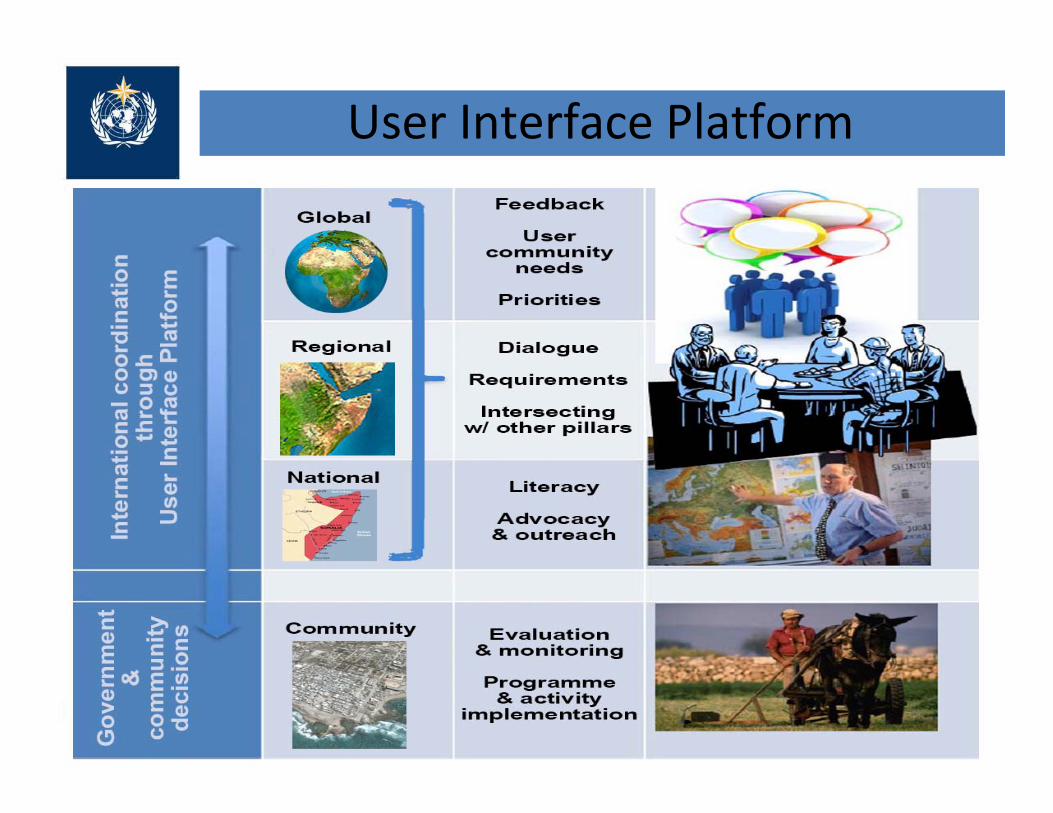
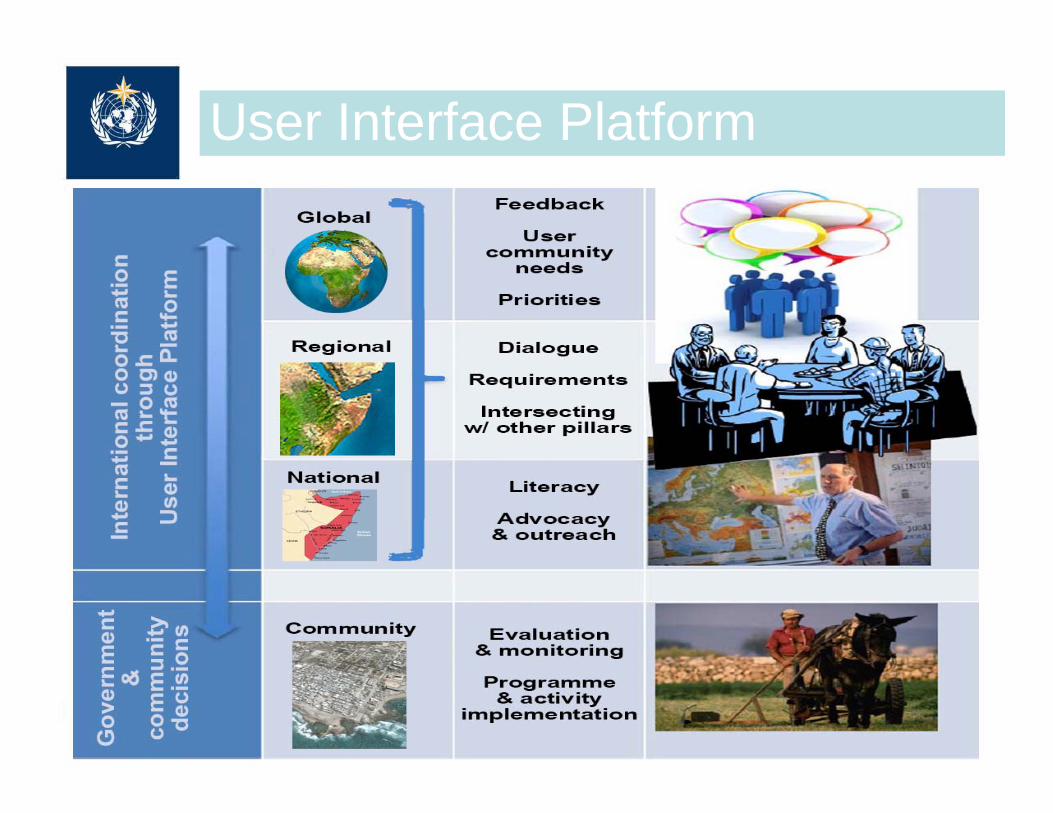
User Interface Platform
Global Framework for Climate Services
43
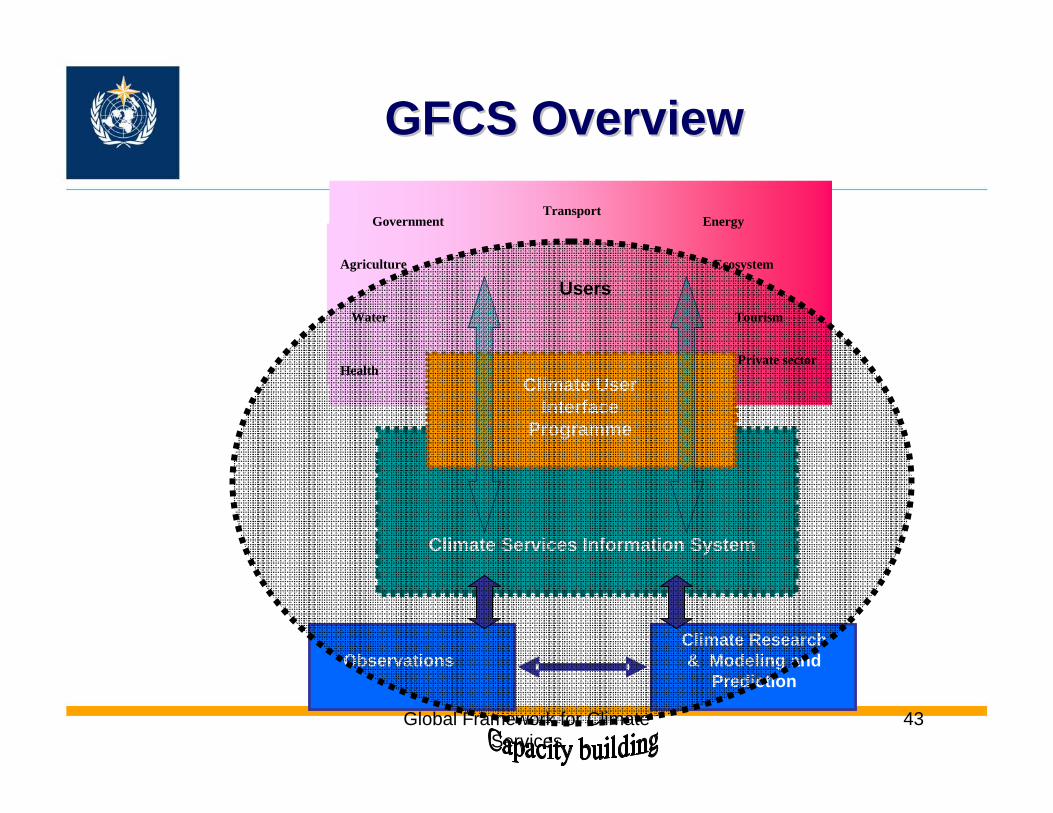
GFCS OverviewGFCS Overview
Research & Modeling
and Prediction
HealthHealth
AgricultureAgriculture
TransportTransport
TourismTourism
Water EnergyEnergy
EcosystemEcosystemSectoral Users
Climate Services Information System
User Interface
Programme
Climate Research & Modeling and
PredictionObservations
Health
Agriculture
Transport
TourismWater
Energy
Ecosystem
Users
Climate Services Information System
Climate User Interface
Programme
Government
Private sector

Global Framework for Climate Services
4444
Elements of Climate Services Information System

Global Framework for Climate Services
45
Climate Services CycleClimate Services Cycle
Capacity Building
Observations
Research, Modelling and
Prediction
Climate User Interface
Programme
Climate Services Information
Systems
Development of information and
products
Delivery of Products
Monitoring and Analysis
Application of Products

WMO
Energy & CO
2
Energy & CO
2Environmen
tEnvironmen
tObservation & Monitoring
Prediction &
Projection
InformationSystem &Research
Disaster Reduction
(MHEWS)
Disaster Reduction
(MHEWS)
Public HealthPublic Health
Agriculture ,
Eco-system
Agriculture ,
Eco-system
Wat
erW
ater
Insu
ranc
e
indus
tryIn
sura
nce
indus
try
Infrastructure
Infrastructure
Urban Framework for Climate Service (UFCS) in Shanghai
Resilience of city depends on resilience of individual systems and resilience between the systems.
Almost all of Shanghai’s natural hazards are weather-related and likely to increase as climate changes.
For Shanghai to be an int’l economic
center it must provide a safe and secure
place to do business
Resilience of city = engineering
resilience + service resilience
+ coordination resilienceIncluding transportation, utility, Recreation/ tourism
WMO
Good Observation/Analysis
Good Observation/Analysis
Poor Observation/Analysis
Poor Observation/Analysis
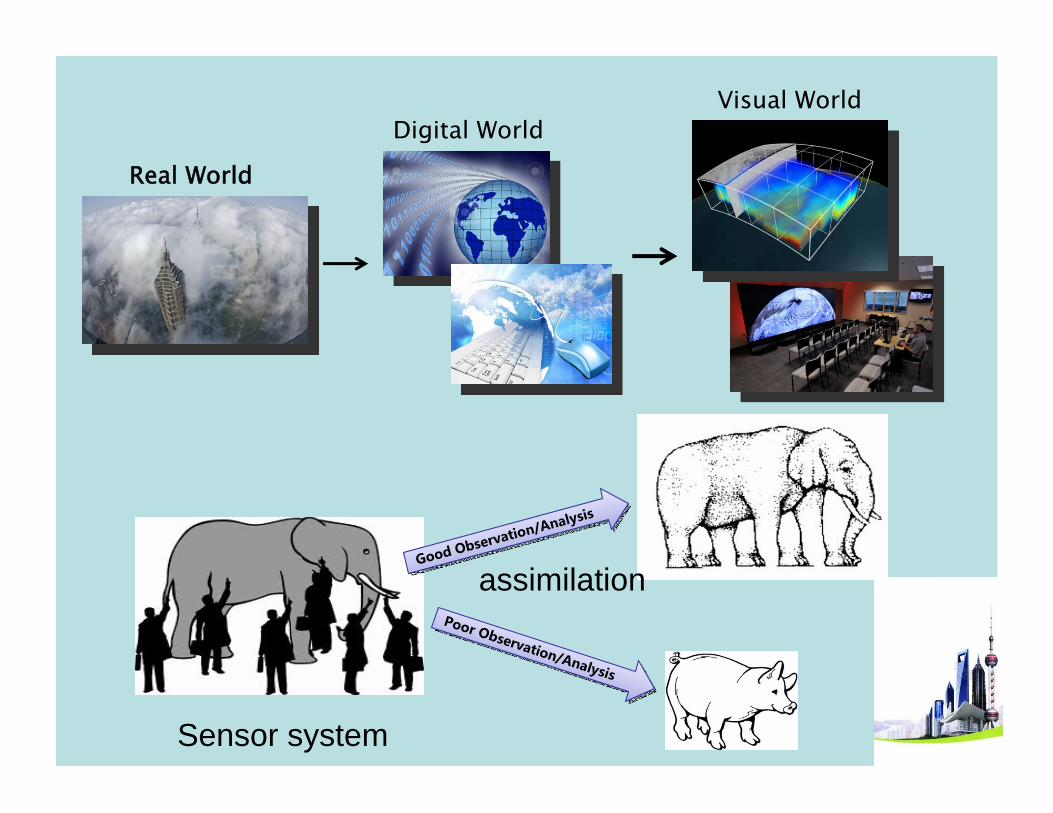
Real World
Digital WorldVisual World
Sensor system
assimilation

WMO
On the other hand, the urban atmosphere is measured in a discrete and deficient way though many variables can be collected including various dynamic, thermodynamic, and chemical variables. Using those information in which may have a deficit or inaccessibility to assess the state of the urban environment is more or less like the story of the blind men and an elephant, i.e., incomplete or even wrong.
On the other hand, the urban atmosphere is measured in a discrete and deficient way though many variables can be collected including various dynamic, thermodynamic, and chemical variables. Using those information in which may have a deficit or inaccessibility to assess the state of the urban environment is more or less like the story of the blind men and an elephant, i.e., incomplete or even wrong.
Modeling defined and service need driven design and deployment

WMO
WMO
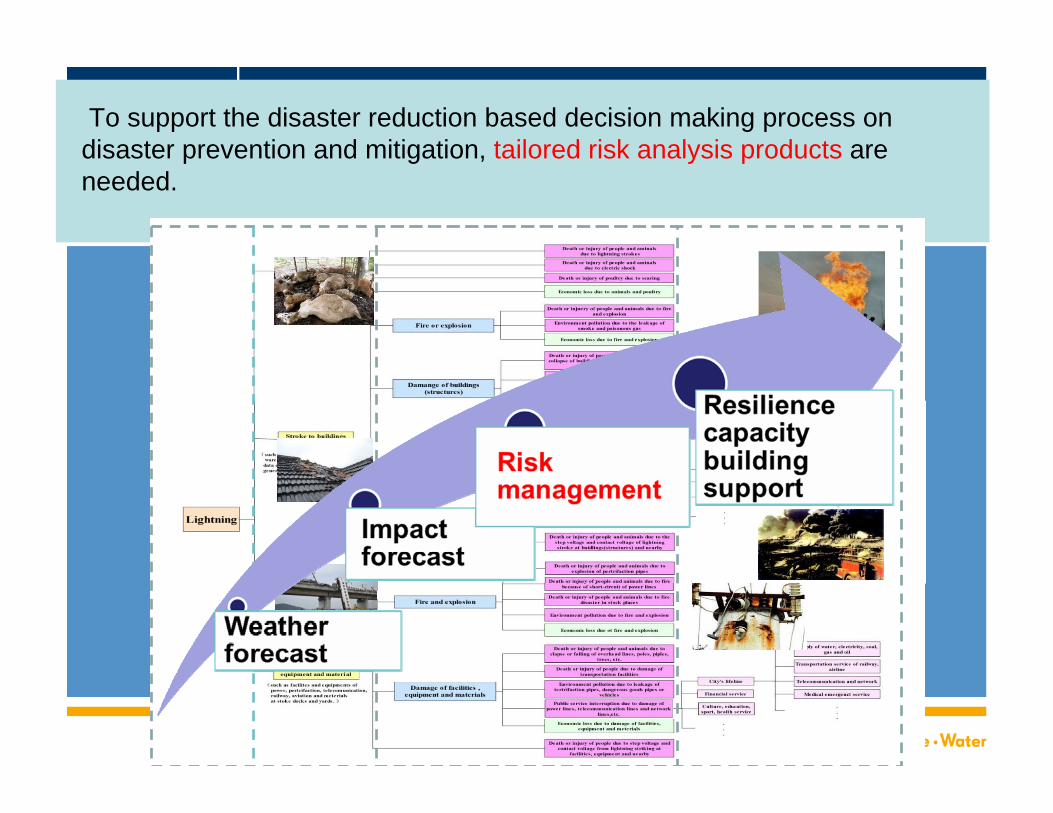
To support the disaster reduction based decision making process on disaster prevention and mitigation, tailored risk analysis products are needed.
WMO
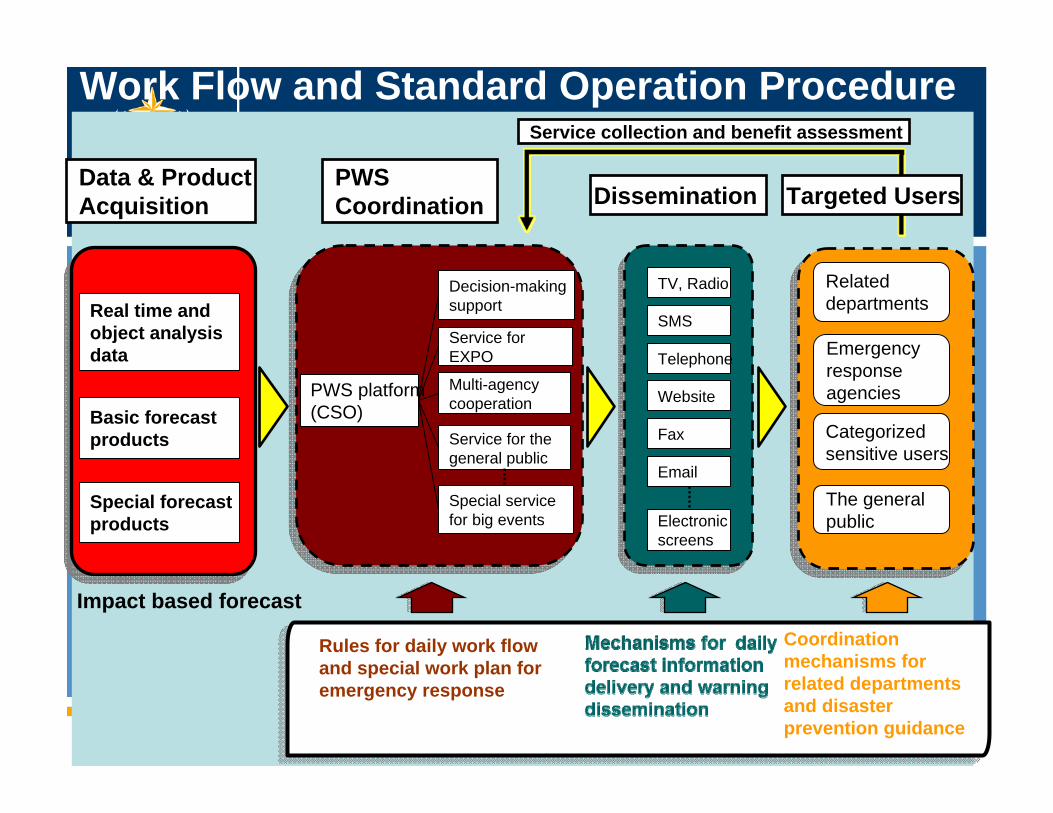
Work Flow and Standard Operation Procedure
Basic forecast products
PWS platform(CSO)
Service for EXPO
Decision-making support
Multi-agency cooperation
Special service for big events
Service for the general public
Rules for daily work flow and special work plan for emergency response
TV, Radio
SMS
Telephone
Website
Electronic screens
Fax
Related departments
Emergency response agencies
Categorized sensitive users
The general public
Coordination mechanisms for related departments and disaster prevention guidance
Special forecastproducts
Service collection and benefit assessment
Real time and object analysis data
PWS Coordination
Data & Product Acquisition Dissemination Targeted Users
Impact based forecast

WMORisk based forecast and service are being developed.The warning based on vulnerability and impact forecasts based on
ensemble forecast are needed, and those products help to reduce the impacts of disastrous weather events.
Furthermore, risk mapping results can be obtained through the integration of vulnerability, exposure and hazard events. Based on the risk mapping results, actions can be taken to increase the city’s resilience.
Early Warning operation based on high impact weather forecast and Vulnerability analyses
Impact Forecast Based on Ensemble NWP and impact analysis

Understanding the Risks Provides Evidence for Preventing Disaster Risks!
Hazard
Analysis and
Mapping
Exposure
and
Vulnerability
Potential
Loss
Estimates
This information is critical for decision-making and development of strategies to reduce the risks
Heavy Precipitation
and flood mapping
Impacts:
population density
agricultural land
urban grid
Infrastructure
Businesses
Number of lives at risk
$ at risk
Destruction of buildings and infrastructure
Reduction in crop yields
Business i t ti
Need for historical and real time data
Statistical analysis tools climate forecasts and trend analysis
Need for Socio-economic impacts data and analysis tools
Need for risk assessment tools combining hazard, asset and exposure information
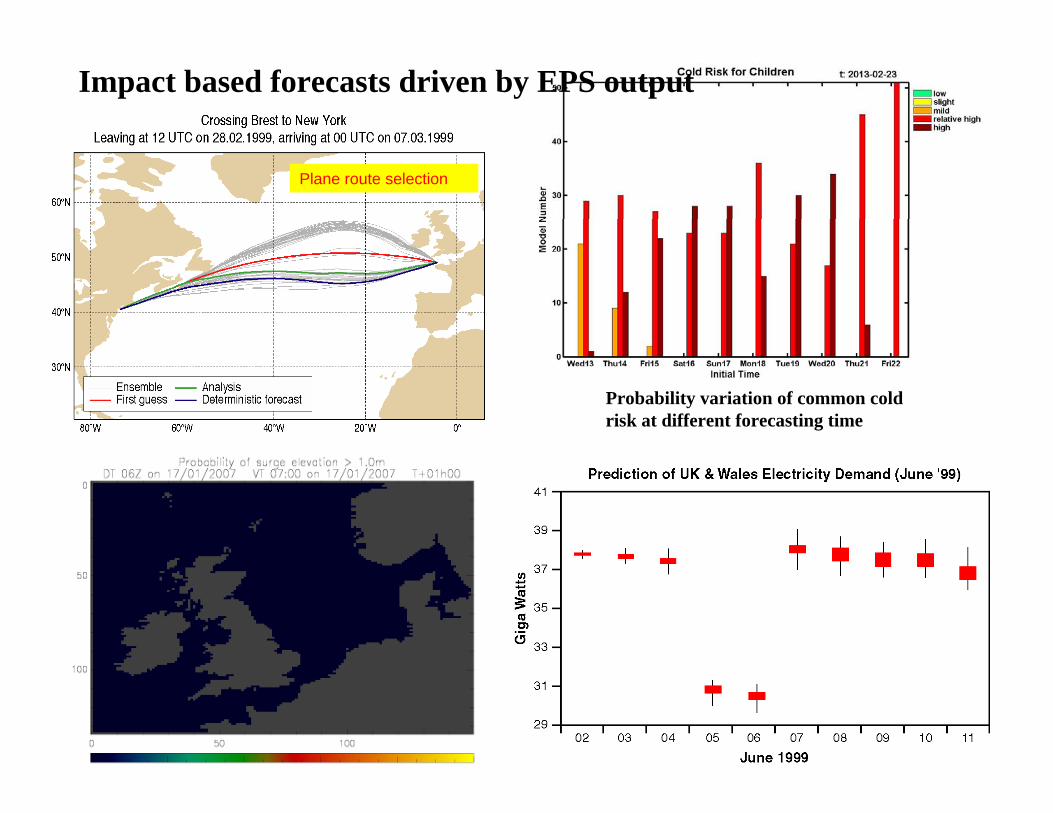
Plane route selection
Probability variation of common cold risk at different forecasting time
Impact based forecasts driven by EPS output

Climate Services in Risk Reduction
Season to yearNext hour to
10 days Decade Long term Scenarios
Short to medterm weather forecasts:
Tropical cyclone Forecasts and warnings
Probabilistic seasonal forecasts: Probabilities of
severity and intensity of tropical cyclones
Future Decadal trend analysis: of
severity and intensity of tropical
cyclones
Climate Change
scenarios –IPCC Process
Emergency planning activation and responseEvacuations, inventory, preparing houses
Strategic PlanningBuilding codesInfrastructure & Urban Developmentand RetrofittingLand Zoning and Planning
Urban & coastal Emergency PreparednessInventory: Food, Construction Materials, Shelter, Emergency funds
Emergency ServicesGovernment Authorities Insurance Public, Media
Urban plannersLocal to national GovernmentsBanksInsurance
DEC
ISION
M
AK
ERS
DEC
ISION
SSER
VICES
Local – National GovernmentInsuranceSuppliersPublic, Media
NegotiatorsParlimentarianLocal/nationalgovernmentsPrivate sector
International negotiations and agreementsNational policies and legilation

WMO DRR/ Service Delivery Strategic Foundation
WMO Strategic Plan
2008-2015(Top Level Objectives and
Five Strategic Thrusts)
Hyogo Framework for Action
2005-2015
(World Conference on Disaster Reduction)
WMO strategic priorities in Service Delivery/DRR: MHEWS at Global,
Regional, Country levels, and Urban Areas
Consultations with WMO governing bodies, Regional and National
network and partners

Weather, Climate, Water, and Environment related Service Delivery to support DRR Priority of WMO in the MHEWS Approach at 3 levels and Urban areas including LDC and SIDs
Risk Financing and Risk TransferRisk Assessment
Hazard databases and metadataForecasting and projections Statistical and forward looking approaches
Loss and damage databasesExposure and vulnerability
PREPAREDNESS:Early Warning Systems emergency planning
PREVENTION and MITIGATION:Sectoral Medium to long term planning (e.g. zoning, infrastructure, agriculture…)
Gov Investments, trust funds (ex-ante, post disaster)
CAT insurance & bonds
Weather-indexed insurance and derivatives
Other emerging products
Risk Reduction
Information and Knowledge SharingEducation and training
Governance and Institutional Framework (Multi-sector, Multi-level, Multi-Hazard)
31
5
4
2
6© World Meteorological Organization

WMO Actions with MembersWMO Regional Climate Centers are being established to provide guidance
and service in the regions. The Cascading process has been used to assist members, especially those LDC and SIDs.
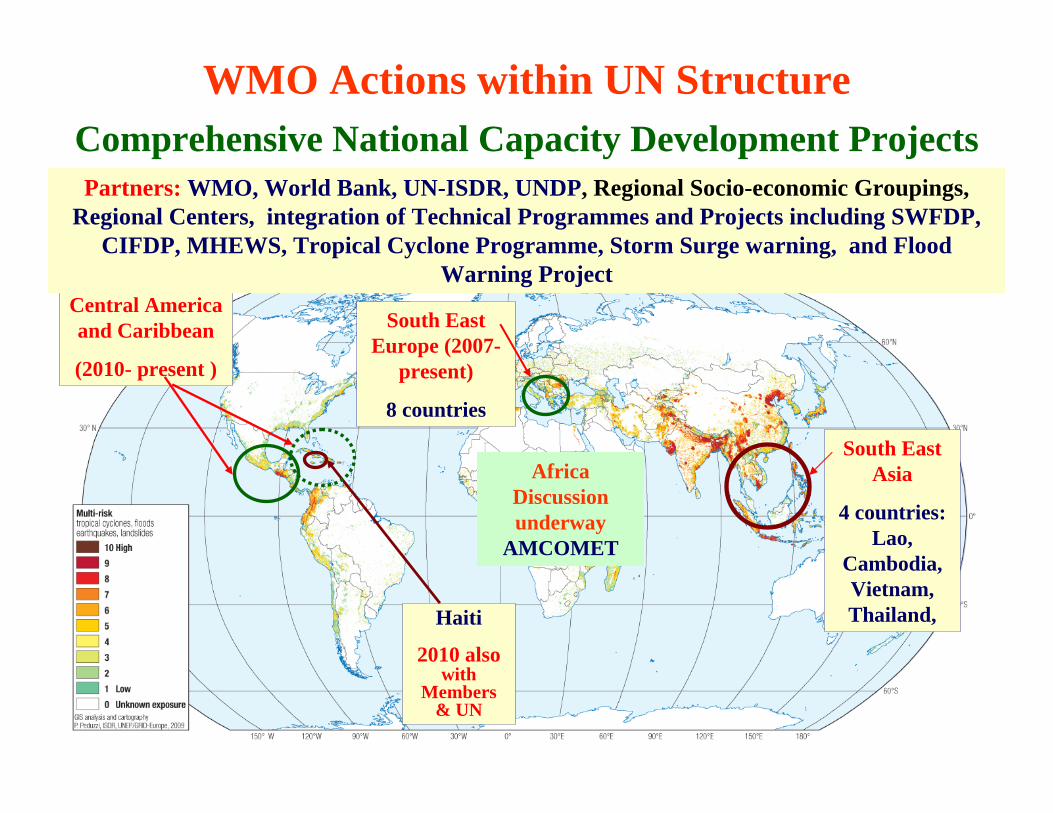
South East Europe (2007-
present)
8 countries
South East Asia
4 countries: Lao,
Cambodia, Vietnam, Thailand,
Central America and Caribbean
(2010- present )
WMO Actions within UN StructureComprehensive National Capacity Development Projects
Haiti
2010 alsowith
Members & UN
Partners: WMO, World Bank, UN-ISDR, UNDP, Regional Socio-economic Groupings, Regional Centers, integration of Technical Programmes and Projects including SWFDP,
CIFDP, MHEWS, Tropical Cyclone Programme, Storm Surge warning, and Flood Warning Project
Africa Discussion underway
AMCOMET

WMOVulnerability: geographic condition, infrastructure, industry
Exposure: Human life, property, healthy, important activities
Hazard event: lightning, heavy rain, typhoon, gale, haze
Resilience : intrinsic feature of the system, resilience to external impetus
Resilience capacity includes:Infrastructure, Non‐constructional solutions (monitoring, warning ,risk management , governce), constructional solutions
Multi‐Hazard Risk Analysis and Reduction Support

WMO
Shanghai Multi-hazard Early Warning System(WMO/WB DRR and Service Delivery Demonstration)
(1)System of sensor systems for measurements, (2)Risk mapping and assessment, (3)Impact based forecast, (4) Risk based warning and Standards for multi-agency response, (5) Smart and interactive service network and platform.
(1)System of sensor systems for measurements, (2)Risk mapping and assessment, (3)Impact based forecast, (4) Risk based warning and Standards for multi-agency response, (5) Smart and interactive service network and platform.

WMO
Government commitment, Multi-agency Coordination and Community Participation are key factors to achieve effective disaster prevention and mitigation
DPM Management
Government commitment
Inter-SectorsCoordination
Community participation
Organizing and coordinating meteorological disaster prevention and mitigation Providing fund support for infrastructure and disaster relief
Developed the mechanism and platform to ensures inter-sectors emergency response and interaction based on meteorological disaster warning signals is efficient and valid.
Emphasizing the involving of community, NGOs and volunteers Improving training for the public

WMO
Multi-agency Cooperation -- 32 agencies
1)Disaster information sharing;2)Establishment of safe community
standard
1) Early briefing on rainy season and continuous high temperature;
2) Co-issue bacterial food poisoning early warning
1) Sharing and joint establishment of country information service stations; 2)Sharing of the rural volunteers;3) Agriculture meteorological disaster early warning
1) Establish integrated database of meteorological information and public health data;2) Develop forecast model of heat wave and heatstroke, COPD and asthma.
Establishment of special warning information dissemination system for student
Green channel for meteorological related warning dissemination
Power Grid
Agriculture
Civil affairsFood SecurityCommunication
Tourism
Health
School
Shanghai Meteorological Service
1) Forecast of weather conditions impact on visitors number;2) Severe weather events early warning for various attractions.
1) Electrical load prediction model for 1-3 days;2) Wind farm output forecast3)High impact weather early warning
Civil Affair
WMO
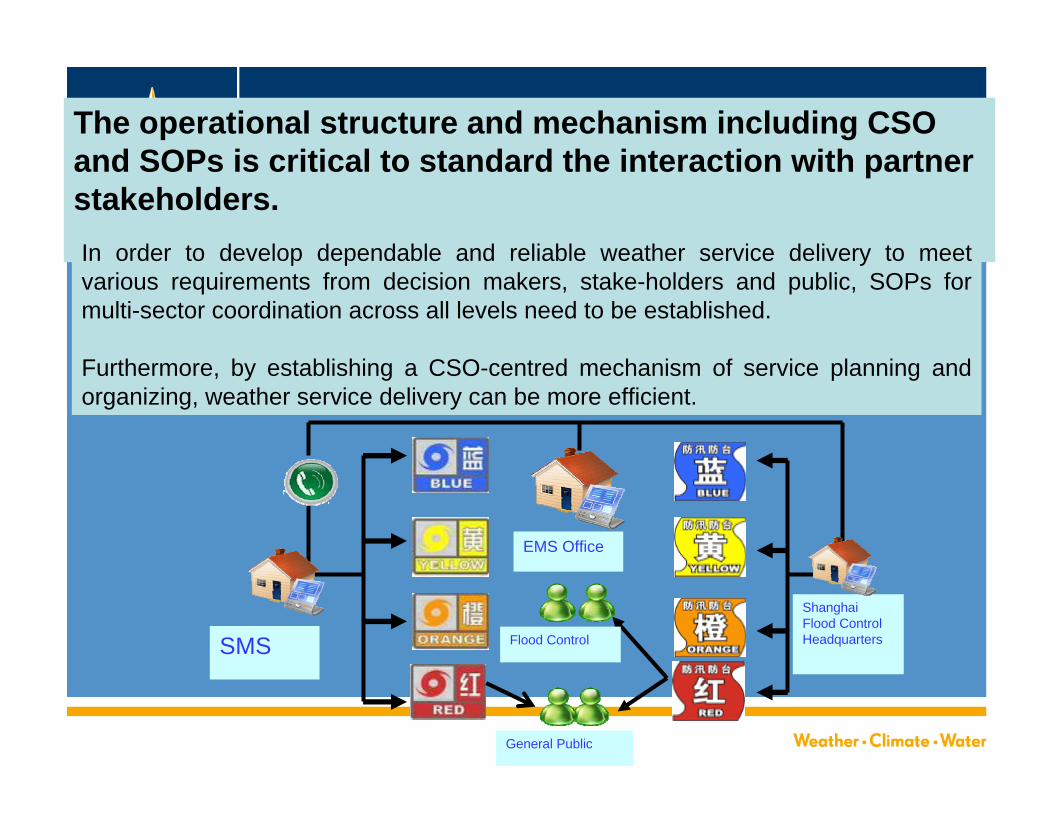
The operational structure and mechanism including CSO and SOPs is critical to standard the interaction with partner stakeholders.In order to develop dependable and reliable weather service delivery to meet various requirements from decision makers, stake-holders and public, SOPs for multi-sector coordination across all levels need to be established.
Furthermore, by establishing a CSO-centred mechanism of service planning and organizing, weather service delivery can be more efficient.
SMS
Shanghai Flood Control Headquarters
EMS Office
General Public
Flood Control

WMO
Part of the new Shanghai Meteorological Service mult-ihazard warning center
WMO
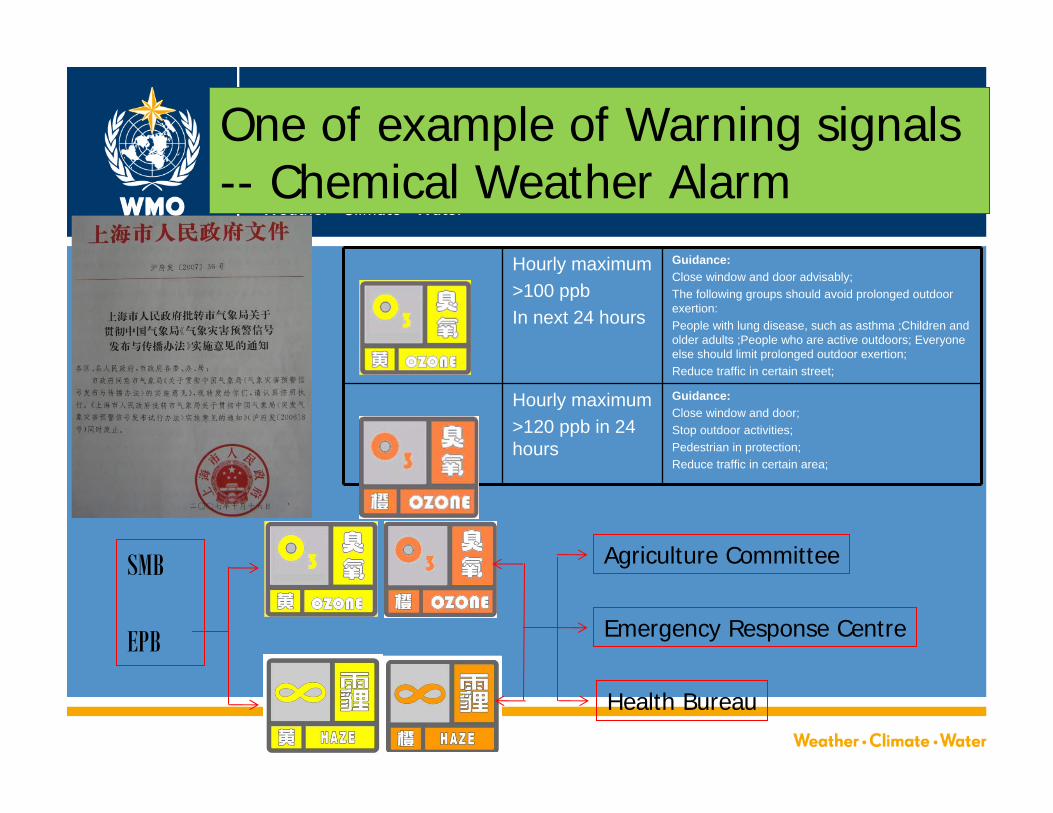
One of example of Warning signals -- Chemical Weather Alarm
SMB
EPB
Agriculture Committee
Emergency Response Centre
Health Bureau
Hourly maximum>100 ppbIn next 24 hours
Guidance:Close window and door advisably;The following groups should avoid prolonged outdoor exertion: People with lung disease, such as asthma ;Children and older adults ;People who are active outdoors; Everyone else should limit prolonged outdoor exertion;Reduce traffic in certain street;
Hourly maximum>120 ppb in 24 hours
Guidance:Close window and door;Stop outdoor activities;Pedestrian in protection;Reduce traffic in certain area;
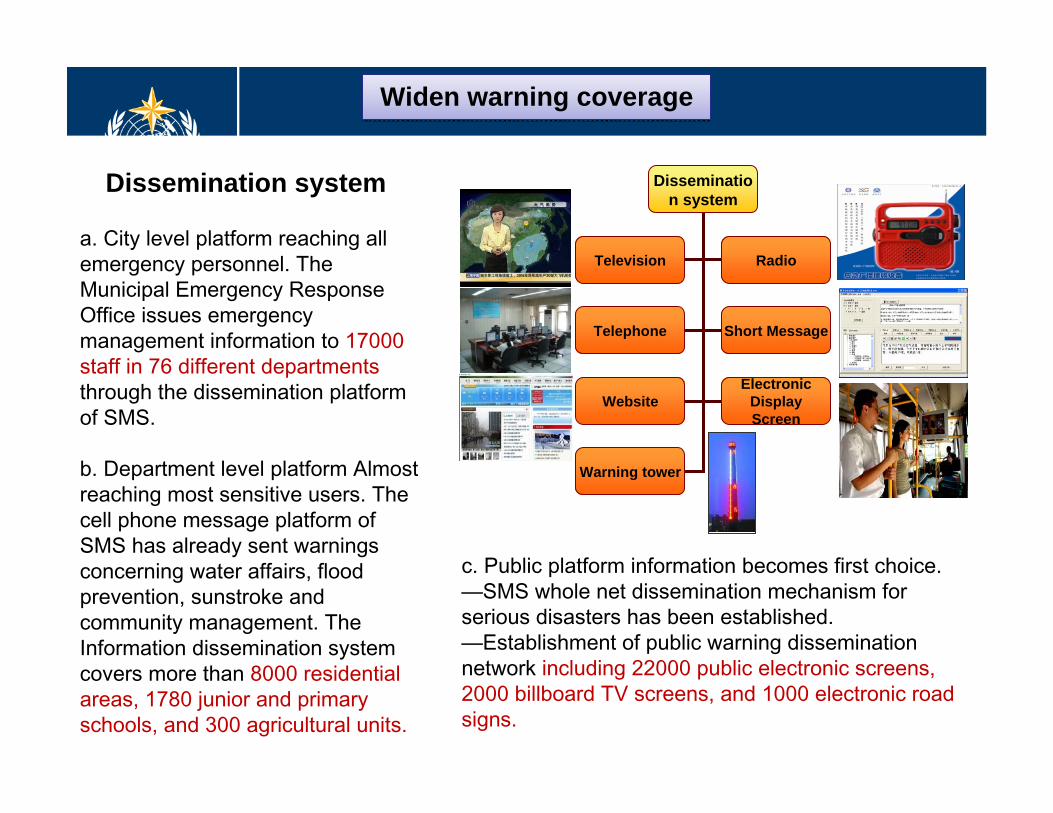
WMODissemination system
a. City level platform reaching all emergency personnel. The Municipal Emergency Response Office issues emergency management information to 17000 staff in 76 different departments through the dissemination platform of SMS.
b. Department level platform Almost reaching most sensitive users. The cell phone message platform of SMS has already sent warnings concerning water affairs, flood prevention, sunstroke and community management. The Information dissemination system covers more than 8000 residential areas, 1780 junior and primary schools, and 300 agricultural units.
Widen warning coverageWiden warning coverage
Dissemination system
Television Radio
Telephone Short Message
WebsiteElectronic
Display Screen
Warning tower
c. Public platform information becomes first choice. —SMS whole net dissemination mechanism for serious disasters has been established.—Establishment of public warning dissemination network including 22000 public electronic screens, 2000 billboard TV screens, and 1000 electronic road signs.

WMO
Building urban resilience: fundamental base for sustainable urbanization – Risk Reduction
People centered: key issue for sustainable cities –Healthy Cities Design and Development
Integrated urban service delivery: Climate and Environment smart cities, Implementation Strategies: Science in service to society, Building Resilient Society, Integration and Seamless Approaches
Government long-term promising, investment and consistent leadership
WMO; Weather and DRR Service Department (WDS)

WMOUN actions: New Urban Agenda
The General Assembly, in its resolution 66/207, decided to convene a 3th UNs conference on housing and sustainable urban development (Habitat III) in 2016
Global commitment to sustainable urbanization; focusing on the implementation of a “New Urban Agenda”
The overarching topic of 7th session of the World Urban Forum, which will held in Medellin, Colombia, 5-11 April 2014, will be: Urban Equality in Development – Cities for Life. The focus on urban equality is to ensure that public goods and basic services are available to everyone, according to needs.
WUF7 is particularly important given the concurrence of the Post 2015 Development Agenda, and will also contribute significantly to the review of the global urban agenda in 2016
WMO
Main theme of the side event: Integrating cities into national efforts to address climate change is a pressing challenge. UN agencies are helping cities to mitigate and adapt.
Main efforts: A cross-agencies TT has begun to map tools and formulate a “one UN approach to build urban resilience and foster climate smart cities” –a concerted effort of UN agencies delivering as one in pilot cities.
UN Agencies supporting Climate Smart Cities – UN Side Event on UNFCCC, COP-19, Warsaw, Poland
WMO
UN Agencies supporting Climate Smart Cities – UN Side Event on UNFCCC, COP-19, Warsaw, Poland
The joint programming of interagency climate projects and initiative in cities in the Global South are being promoted by the TT on “Urban Risk Management and Climate Smart Cities ”, which was developed by the High Level Committee on Programmes’ Working Group on Climate Change, with around 10 agencies jointed to date
The role of cities, building resilience, emerging findings, nationally appropriate mitigation actions, optimizing systems improving energy efficiency for industries , tools for building urban resilience, etc were the main components of the efforts
WMO
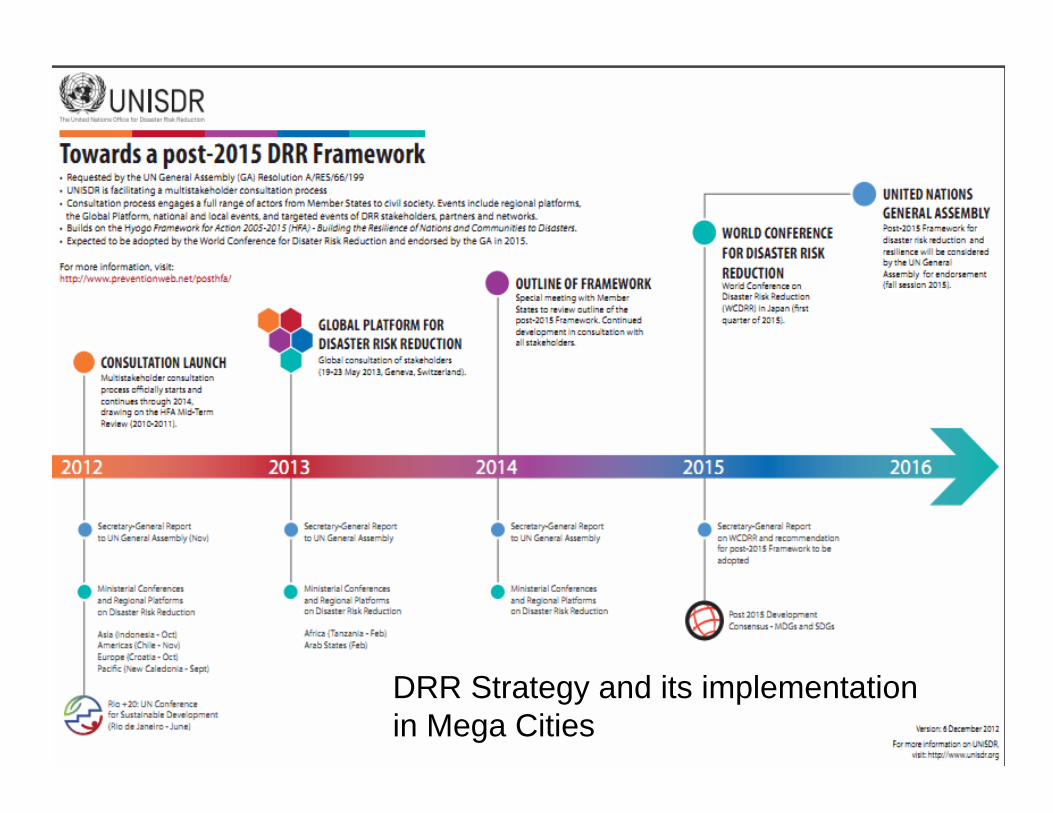
DRR Strategy and its implementation in Mega Cities
WMO
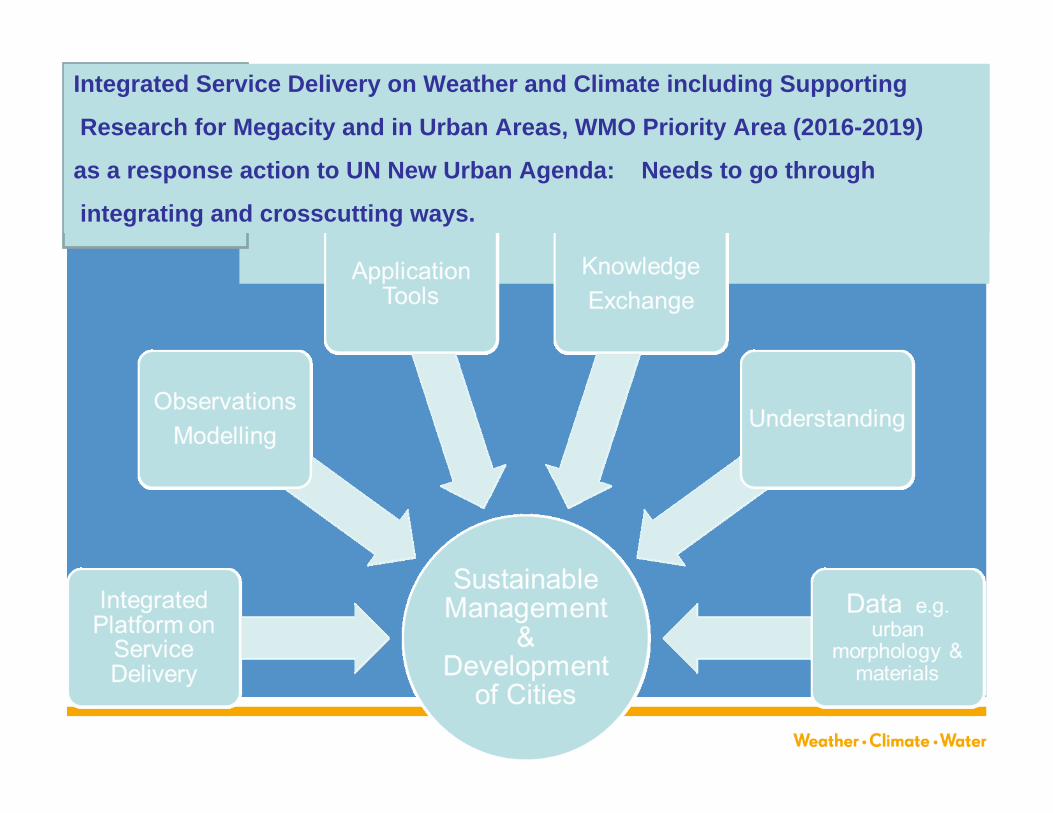
Integrated Service Delivery on Weather and Climate including Supporting
Research for Megacity and in Urban Areas, WMO Priority Area (2016-2019)
as a response action to UN New Urban Agenda: Needs to go through
integrating and crosscutting ways.

WMO
Urban Community Responses to Air-borne Hazards, Weather, and
Climate Events
Severe WeatherRisk Mapping
Air Quality Climate Extreme
Water QualityFood Security
Urban
Eco
syste
m &
Hea
lthy
Comm
unity
Plan
ning
Tour
ism &
Rec
reatio
nUrb
an O
bserv
ing S
ystem
Secu
rity o
f inf
rastr
uctu
re &
util
ities
DRR & R
isk M
anag
emen
t
Publ
ic Hea
lthan
d Safe
ty
Smar
t City
/Info
Diss
emin
ation
& In
terac
tion
Trans
porta
tion
Low C
arbo
n/en
ergy
/ Bus
ines
s Con
t. Pl
anni
ng
Integrated Urban Weather and Climate Service delivery
including User Interface for Urban Climate Service
For Climate Smart City
75
75
11
User Interface Platform
WMO
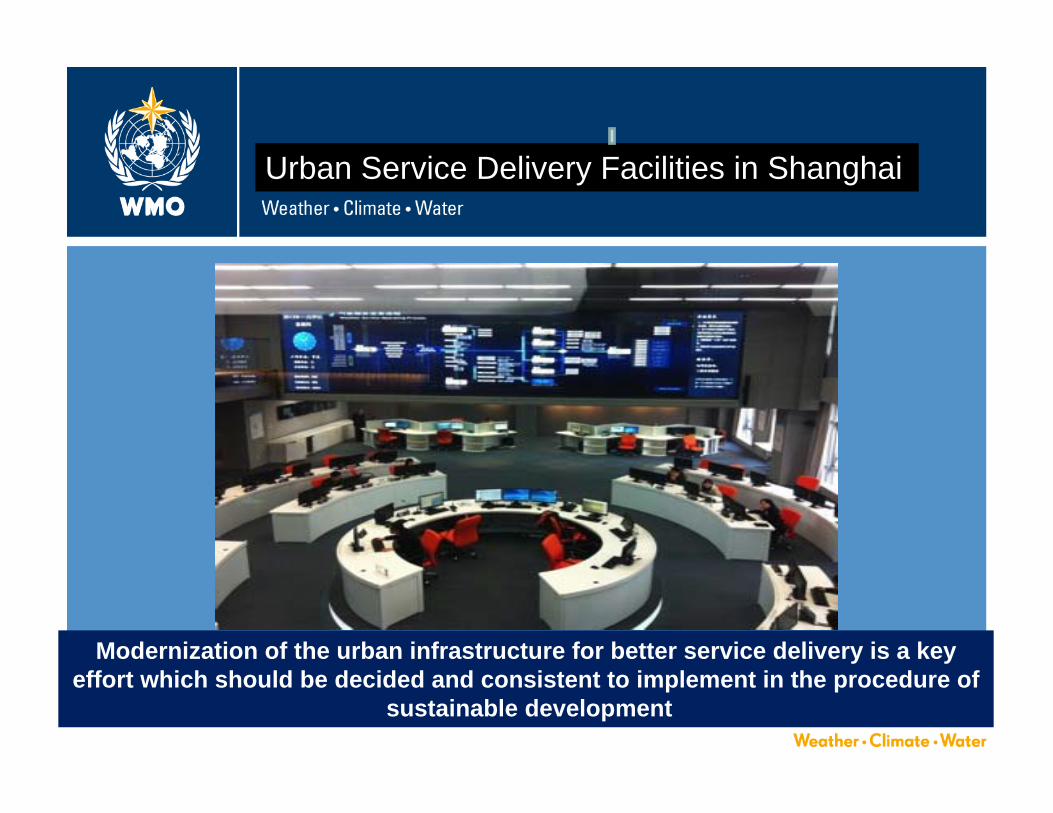
Modernization of the urban infrastructure for better service delivery is a key effort which should be decided and consistent to implement in the procedure of
sustainable development
Urban Service Delivery Facilities in Shanghai
Sustainable Cities & Sustainable Urbanization
Thank you for your attentionWhat is good for human life
is good for all life Thanks to Dr. Carlos Dora, Public Health and Environment WHO for his contribution
Building Resilient & Climate Smart Cities


![NATO phonetic alphabet - · PDF file14.06.2015 · RAH SEE-AIR-AH ERR-ah T Tango TANG go TANG GO TANGGO or TANG-GO ˈtænɡo tang go [ˈtæŋɡoʊ] /ˈtæŋɡoʊ/ TANG-goh U Uniform](https://img.pdfslide.net/doc/110x75/5a7a9f247f8b9abd768d9267/nato-phonetic-alphabet-see-air-ah-err-ah-t-tango-tang-go-tang-go-tanggo-or-tang-go.jpg)

![Prime Minister - United Nations · Prime Minister 72"d Session United Nations General Assembly General Debate [CHECK AGAINST DELIVERY] Mr. President, Permit me to add the congratulations](https://img.pdfslide.net/doc/110x75/5f09d9cd7e708231d428cbd8/prime-minister-united-nations-prime-minister-72d-session-united-nations.jpg)