Embed Size (px)
Citation preview

Finance and Productivity
Sources in Higher Education
Matt Crellin, Senior Associate
October 14, 2015
NCSL Financial Analysts Seminar

One of the most important policy gaps for public higher
education is that state finance policy is disconnected
from public agenda goals for higher education.
These data will not always tell the whole story.
However, they can produce significant insight using
publicly-available sources.
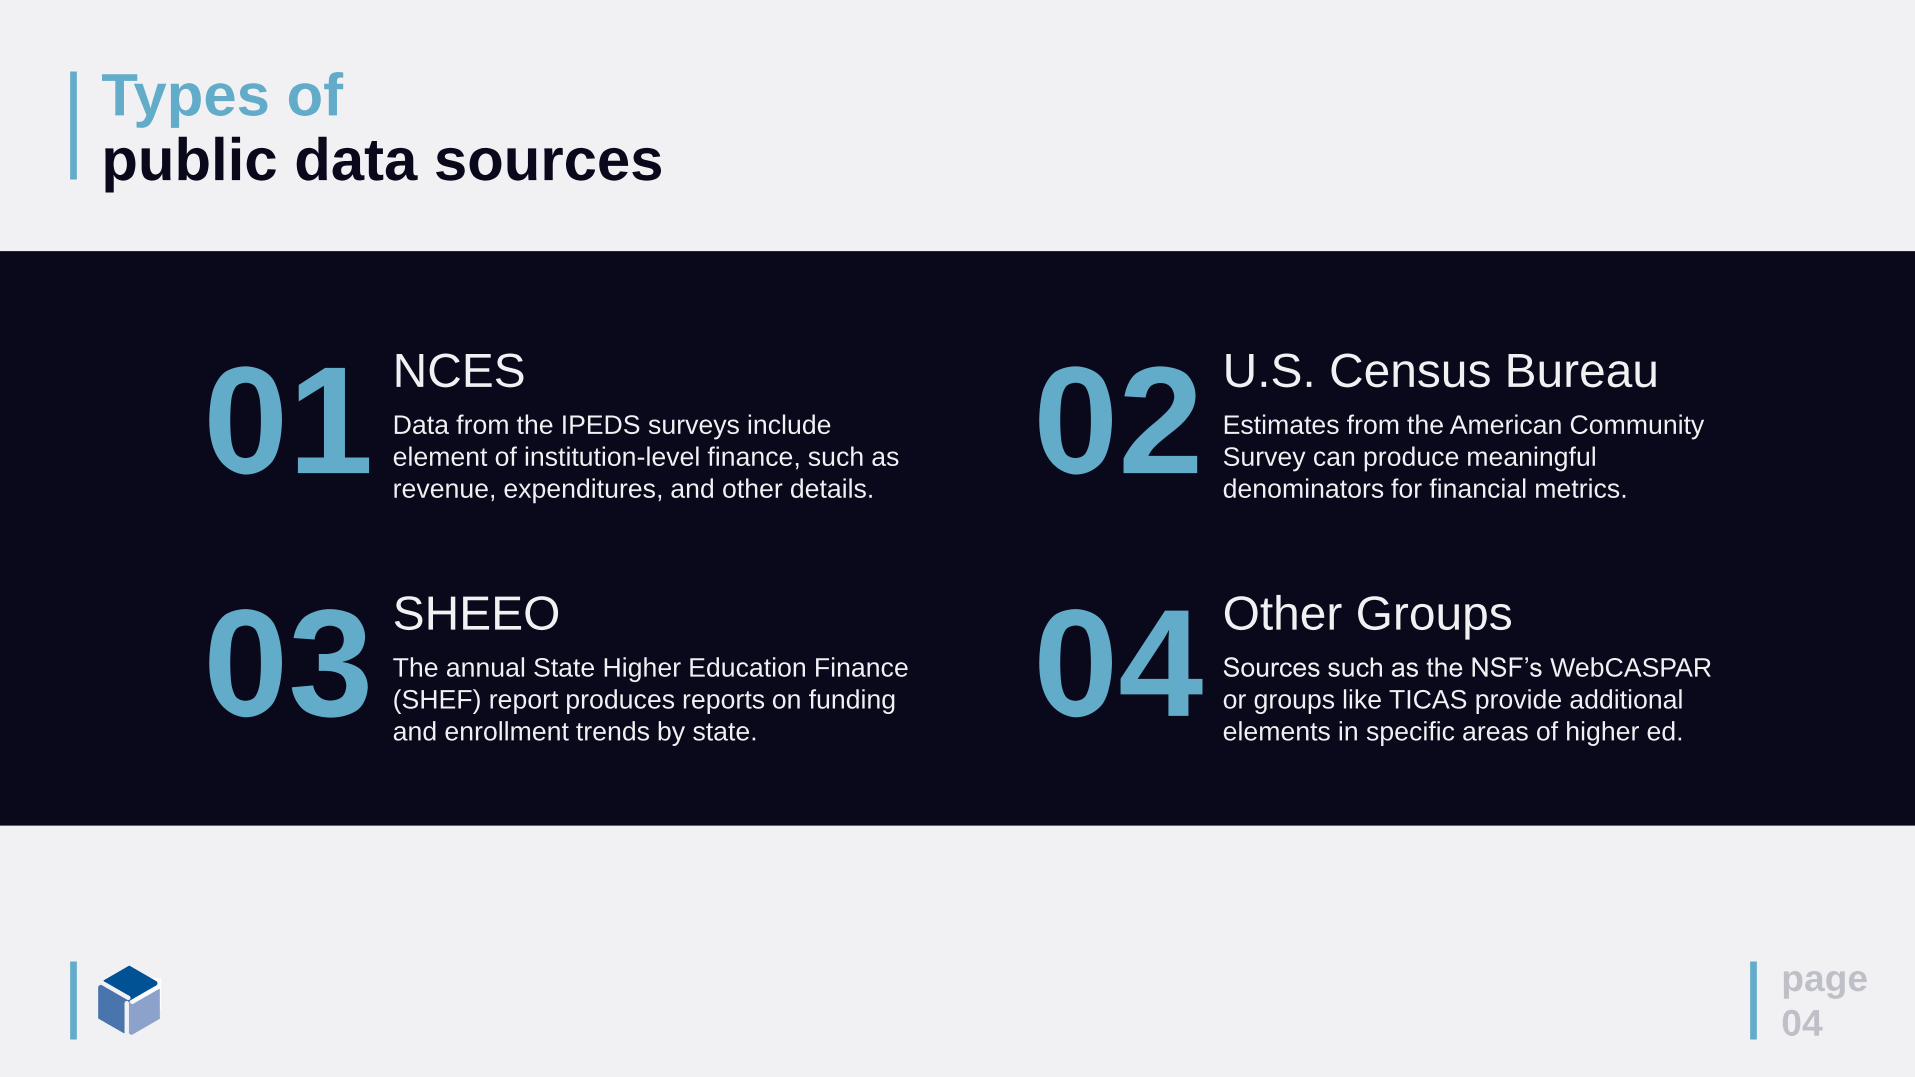
Types ofpublic data sources
page
04
01NCESData from the IPEDS surveys include
element of institution-level finance, such as
revenue, expenditures, and other details.
03SHEEOThe annual State Higher Education Finance
(SHEF) report produces reports on funding
and enrollment trends by state.
02U.S. Census BureauEstimates from the American Community
Survey can produce meaningful
denominators for financial metrics.
04Other GroupsSources such as the NSF’s WebCASPAR
or groups like TICAS provide additional
elements in specific areas of higher ed.
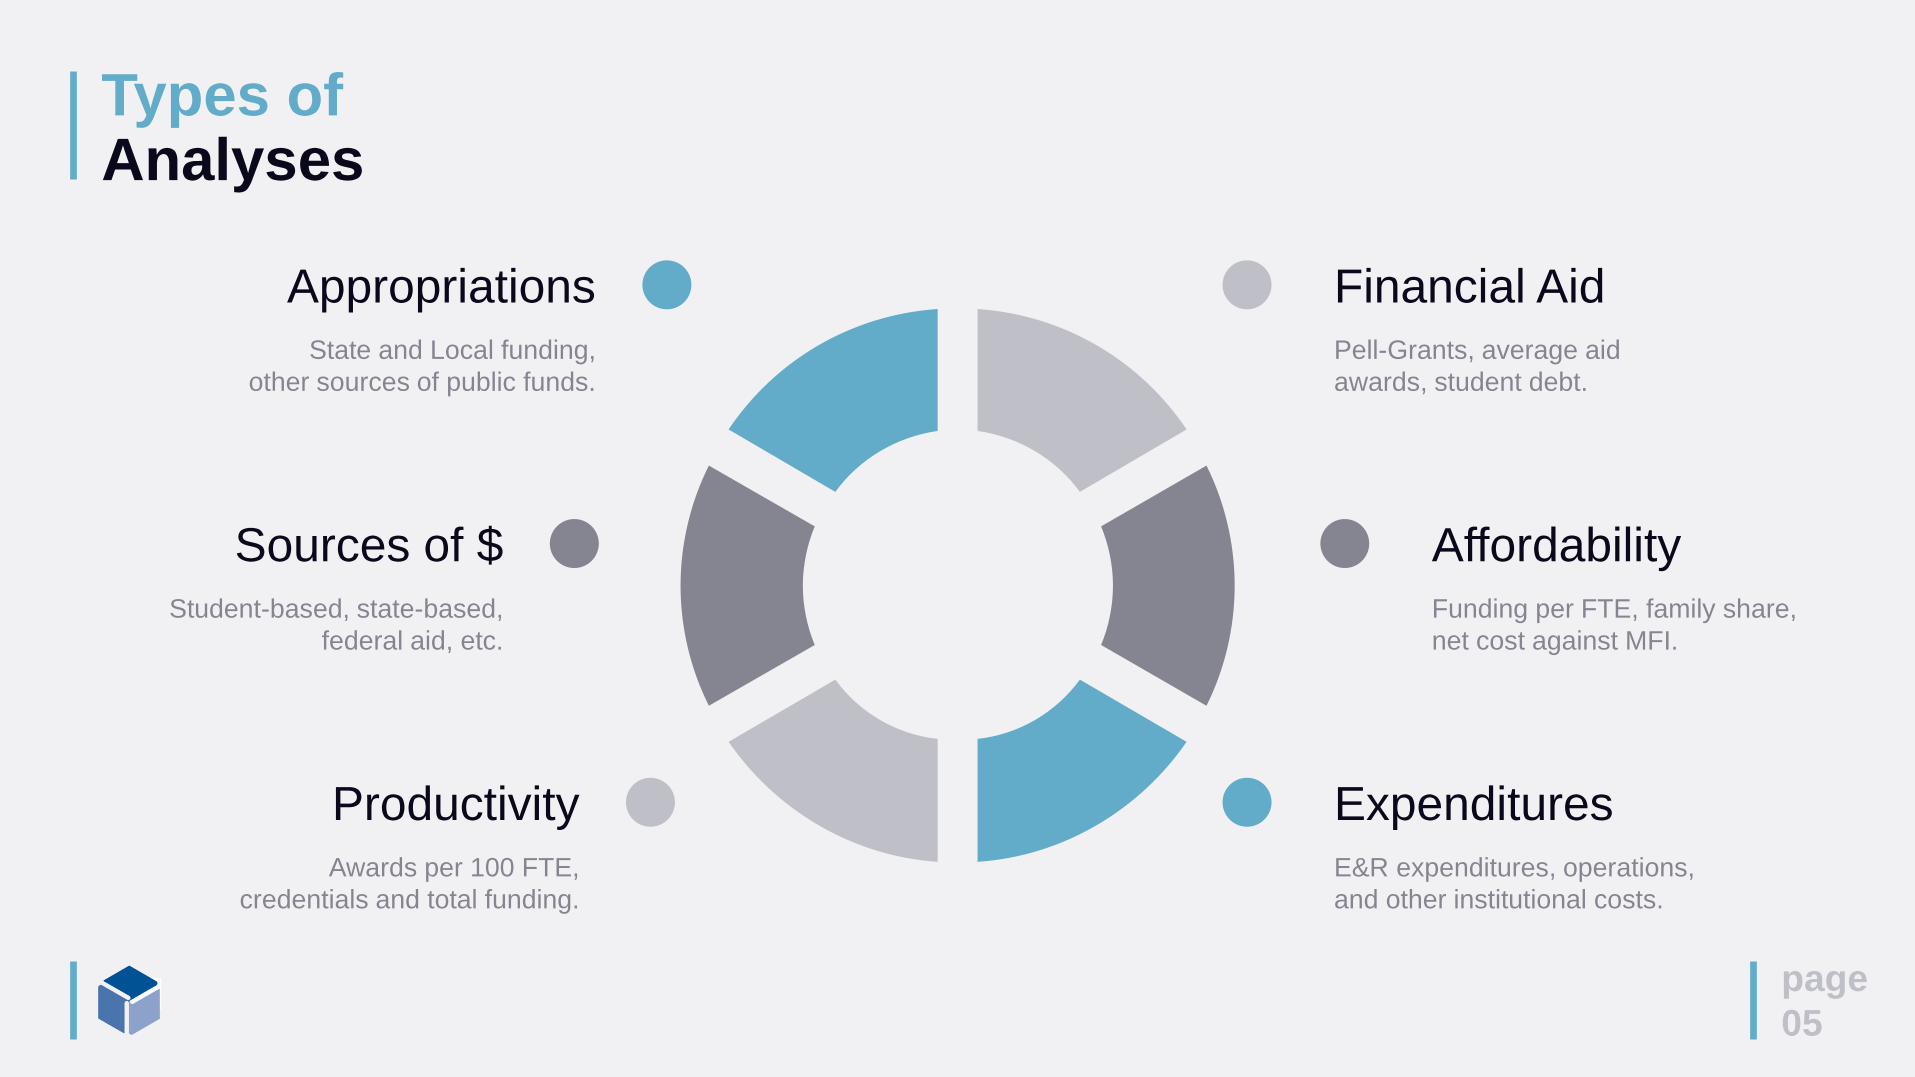
Types ofAnalyses
page
05
Appropriations
State and Local funding,
other sources of public funds.
Sources of $
Student-based, state-based,
federal aid, etc.
Productivity
Awards per 100 FTE,
credentials and total funding.
Financial Aid
Pell-Grants, average aid
awards, student debt.
Expenditures
E&R expenditures, operations,
and other institutional costs.
Affordability
Funding per FTE, family share,
net cost against MFI.
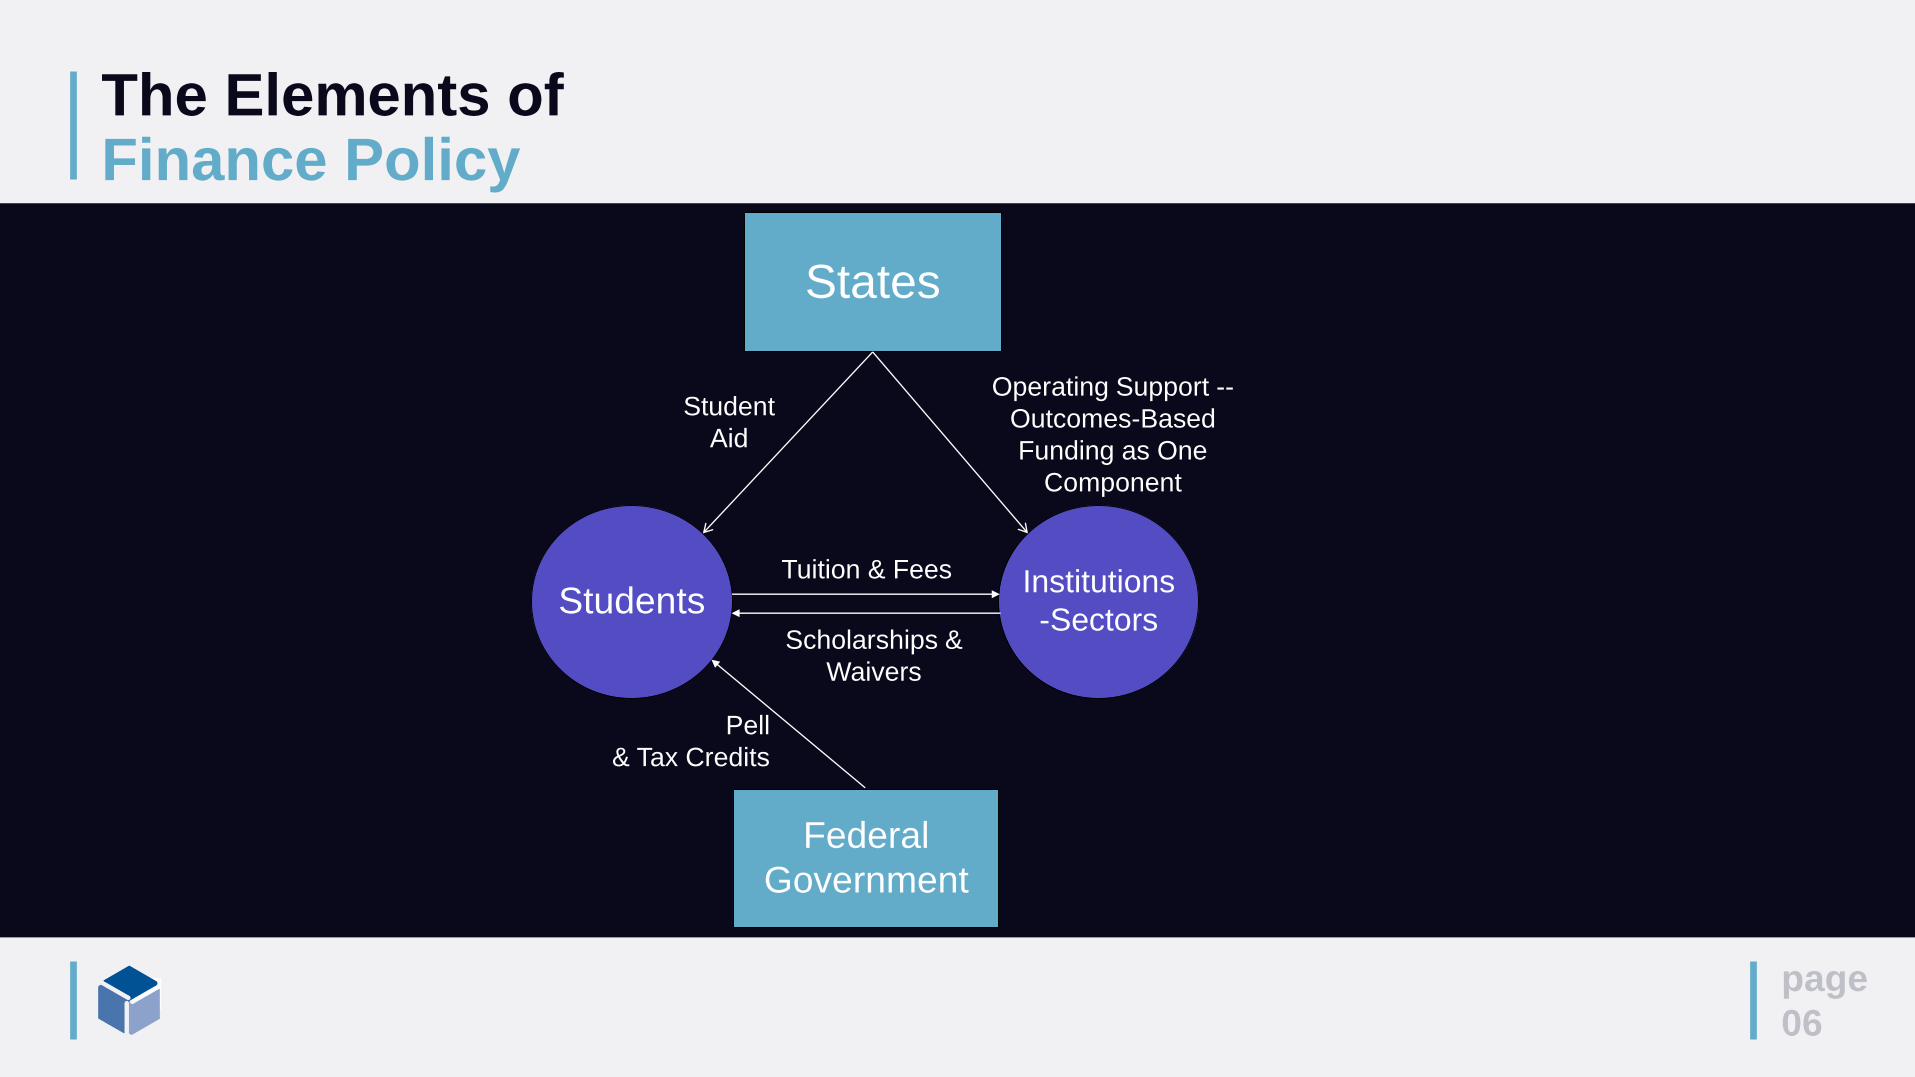
The Elements ofFinance Policy
page
06
StudentsInstitutions
-Sectors
Operating Support --
Outcomes-Based
Funding as One
Component
Student
Aid
Tuition & Fees
Scholarships &
Waivers
Pell
& Tax Credits
Federal
Government
States

Elements ofFinancing Strategy
page
07
Student
Financial AidOriginating from both states as
well as from federal government
sources.
Tuition and Fees from students
into the institution / sector
levels.
Tuition
RevenueOperating and capital, though
sources for capital are publicly
non-existent.
Appropriations
to InstitutionsInstitutional
ProductivityThe extent to which institutions
are meeting degree completion
and other goals.

State-LevelComparison
page
08
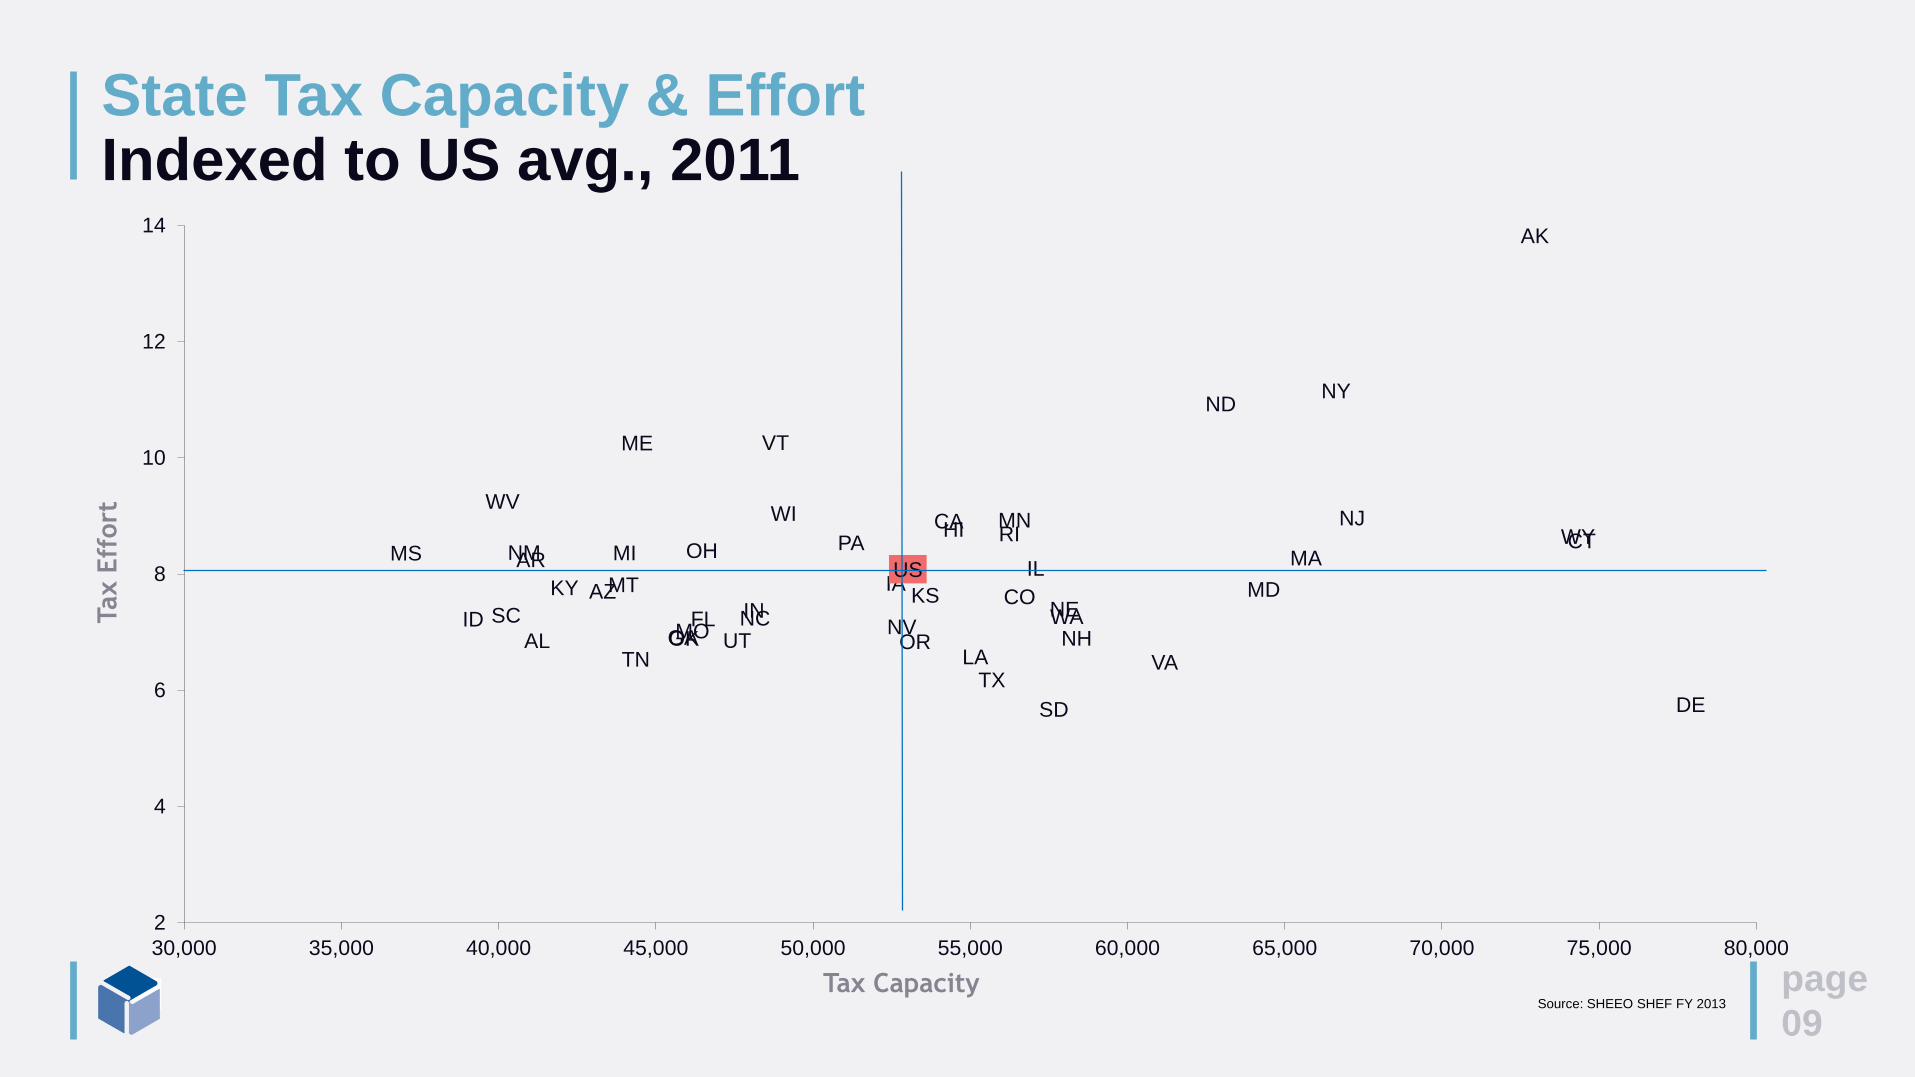
Making interstate comparisons on a variety of
higher education finance topics can occur from
various publicly-available databases.
(and they tell some interesting stories)
AL
AK
AZ
AR
CA
CO
CT
DE
FLGA
HI
ID
IL
IN
IAKSKY
LA
ME
MD
MAMI
MN
MS
MO
MTNE
NVNH
NJ
NM
NY
NC
ND
OH
OK OR
PA RI
SC
SD
TNTX
UT
VT
VA
WA
WVWI
WY
US
2
4
6
8
10
12
14
30,000 35,000 40,000 45,000 50,000 55,000 60,000 65,000 70,000 75,000 80,000
State Tax Capacity & Effort Indexed to US avg., 2011
page
09
Tax E
ffort
Tax CapacitySource: SHEEO SHEF FY 2013

page
010
$8,6
15
$8,5
20
$8,3
01
$7,8
42
$7,5
72
$7,6
70
$7,9
20
$8,0
06
$8,3
05
$8,5
77
$8,7
99
$8,7
17
$8,9
64
$8,6
38
$7,9
93
$7,4
57
$7,4
01
$7,7
64
$7,9
58
$8,0
81
$7,5
53
$7,0
13
$6,7
37
$6,1
22
$6,2
15
$6,5
52
$2,7
92
$2,8
40
$2,9
37
$3,1
75
$3,3
77
$3,4
94
$3,5
87
$3,7
09
$3,7
62
$3,7
87
$3,7
89
$3,6
06
$3,7
36
$3,7
50
$3,8
34
$4,0
34
$4,1
93
$4,4
75
$4,5
47
$4,4
82
$4,5
60
$4,7
69
$4,9
62
$5,3
48
$5,6
24
$5,7
77
$0
$2,000
$4,000
$6,000
$8,000
$10,000
$12,000
$14,000
0.0
2.0
4.0
6.0
8.0
10.0
12.0
14.0
19
89
19
90
19
91
19
92
19
93
19
94
19
95
19
96
19
97
19
98
19
99
20
00
20
01
20
02
20
03
20
04
20
05
20
06
20
07
20
08
20
09
20
10
20
11
20
12
20
13
20
14
Do
lla
rs p
er
FT
E
Pu
blic
FT
E E
nro
llm
en
t(M
illi
on
s)
Net Tuition Revenue per FTE (constant $) Educational Appropriations per FTE (constant $) Public FTE Enrollment
Note: Constant 2014 dollars adjusted by SHEEO Higher Education Cost Adjustment. Educational Appropriations include ARRA funds. (HECA)
Source: SHEEO
Public FTE Enrollment, Ed. Appropriations, and Total Ed. Revenue per FTE
United States, Fiscal 1989-2014
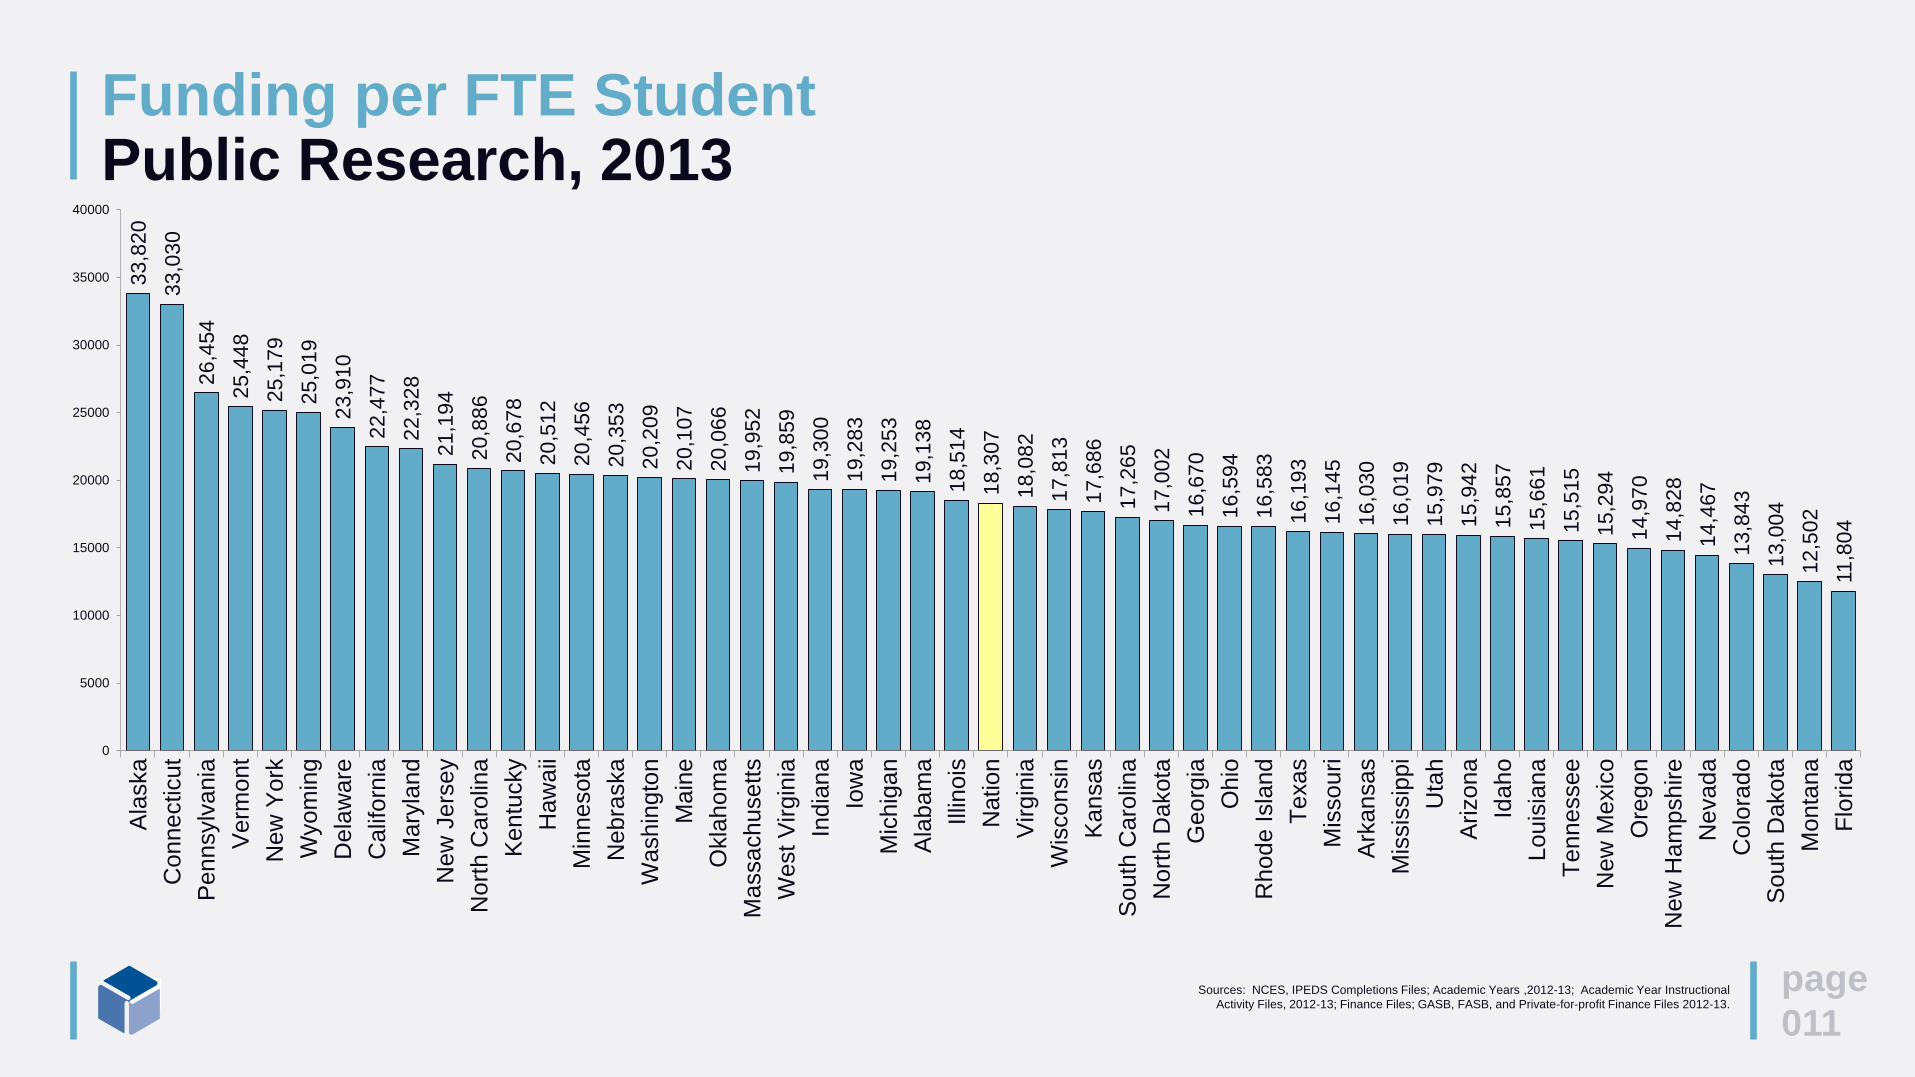
Funding per FTE StudentPublic Research, 2013
page
011
33
,82
0
33
,03
0
26
,45
4
25
,44
8
25
,17
9
25
,01
9
23
,91
0
22
,47
7
22
,32
8
21
,19
4
20
,88
6
20
,67
8
20
,51
2
20
,45
6
20
,35
3
20
,20
9
20
,10
7
20
,06
6
19
,95
2
19
,85
9
19
,30
0
19
,28
3
19
,25
3
19
,13
8
18
,51
4
18
,30
7
18
,08
2
17
,81
3
17
,68
6
17
,26
5
17
,00
2
16
,67
0
16
,59
4
16
,58
3
16
,19
3
16
,14
5
16
,03
0
16
,01
9
15
,97
9
15
,94
2
15
,85
7
15
,66
1
15
,51
5
15
,29
4
14
,97
0
14
,82
8
14
,46
7
13
,84
3
13
,00
4
12
,50
2
11,8
04
0
5000
10000
15000
20000
25000
30000
35000
40000
Ala
ska
Conn
ecticut
Pen
nsylv
ania
Verm
ont
New
York
Wyom
ing
Dela
ware
Calif
orn
ia
Mary
lan
d
New
Jers
ey
Nort
h C
aro
lina
Ken
tucky
Haw
aii
Min
ne
sota
Nebra
ska
Washin
gto
n
Main
e
Okla
hom
a
Massachusetts
West V
irgin
ia
Ind
ian
a
Iow
a
Mic
hig
an
Ala
ba
ma
Illin
ois
Nation
Virgin
ia
Wis
consin
Kan
sas
Sou
th C
aro
lina
Nort
h D
akota
Geo
rgia
Ohio
Rhod
e Isla
nd
Texas
Mis
so
uri
Ark
ansas
Mis
sis
sip
pi
Uta
h
Arizona
Ida
ho
Louis
ian
a
Tenn
essee
New
Mexic
o
Ore
go
n
Ne
w H
am
pshire
Nevad
a
Colo
rado
Sou
th D
ako
ta
Monta
na
Flo
rida
Sources: NCES, IPEDS Completions Files; Academic Years ,2012-13; Academic Year Instructional
Activity Files, 2012-13; Finance Files; GASB, FASB, and Private-for-profit Finance Files 2012-13.
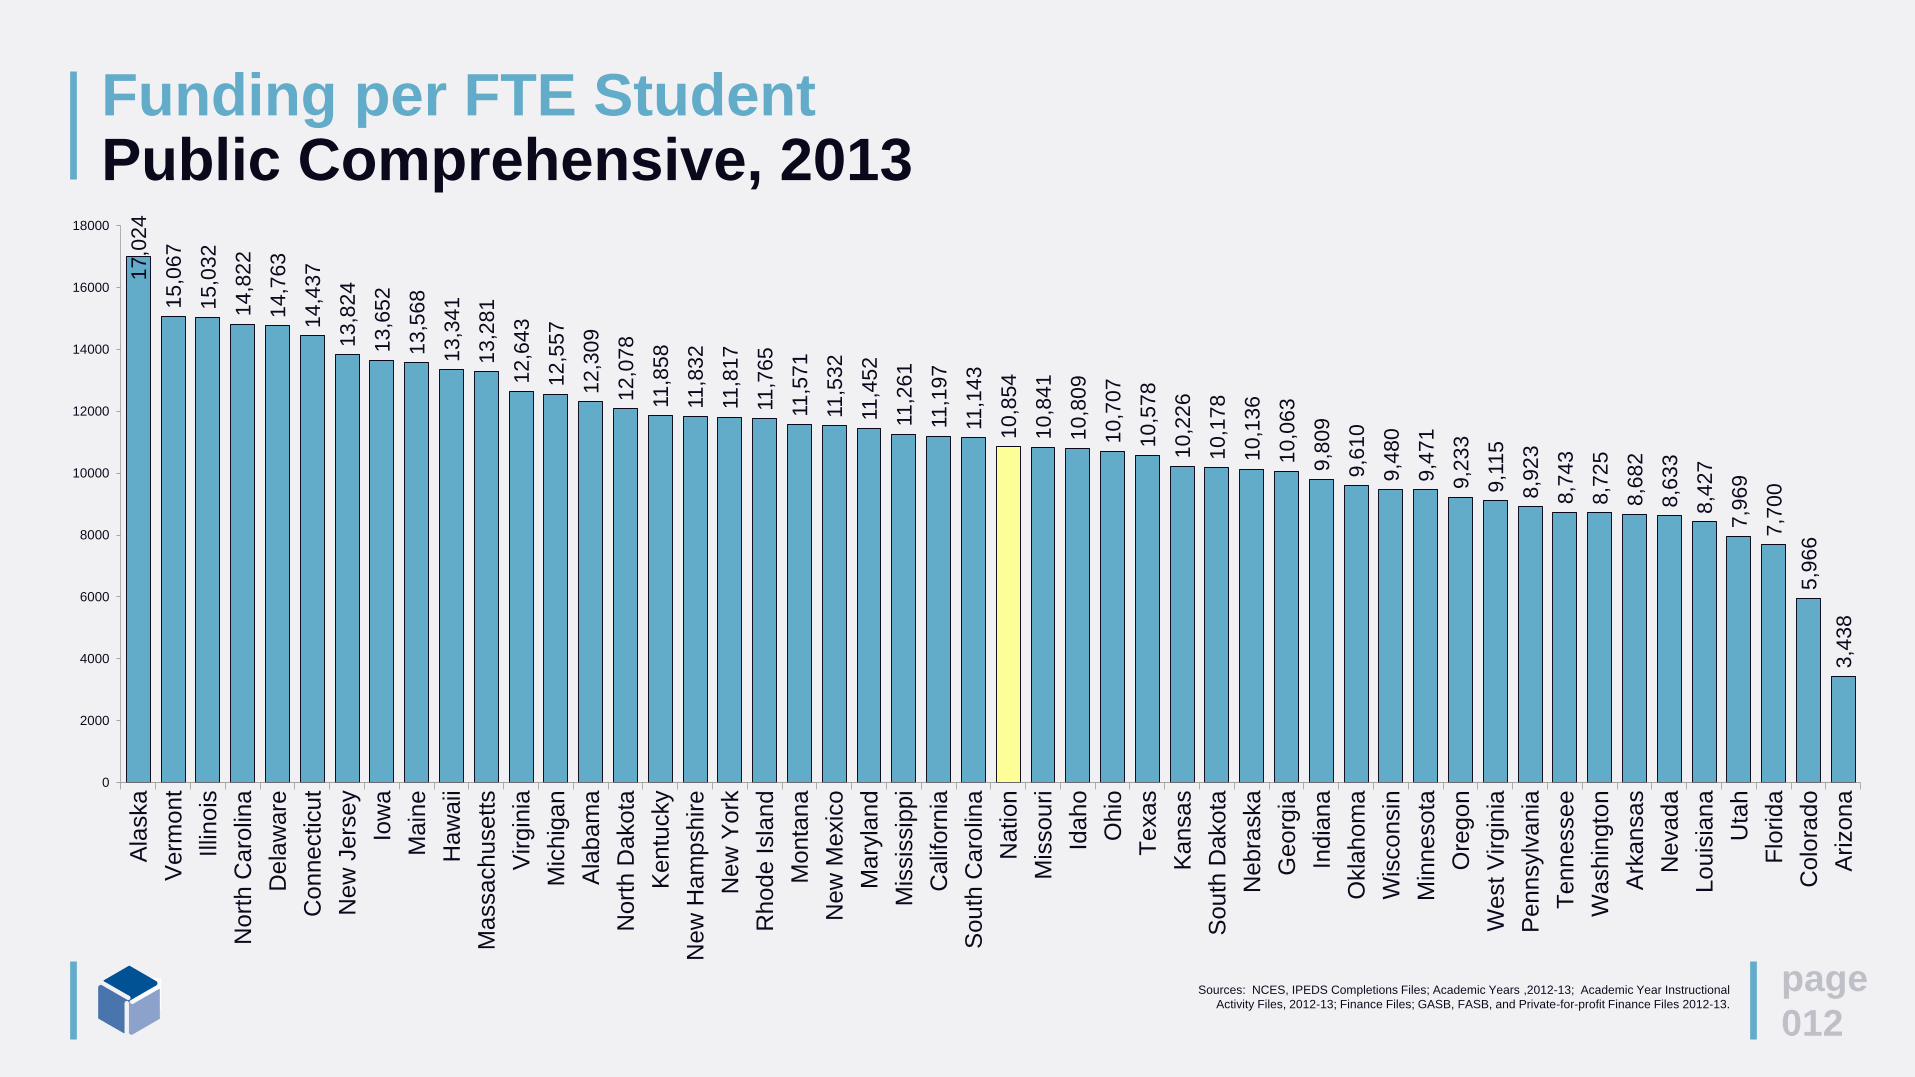
Funding per FTE StudentPublic Comprehensive, 2013
page
012Sources: NCES, IPEDS Completions Files; Academic Years ,2012-13; Academic Year Instructional
Activity Files, 2012-13; Finance Files; GASB, FASB, and Private-for-profit Finance Files 2012-13.
17
,02
4
15
,06
7
15
,03
2
14
,82
2
14
,76
3
14
,43
7
13
,82
4
13
,65
2
13
,56
8
13
,34
1
13
,28
1
12
,64
3
12
,55
7
12
,30
9
12
,07
8
11,8
58
11,8
32
11,8
17
11,7
65
11,5
71
11,5
32
11,4
52
11,2
61
11,1
97
11,1
43
10
,85
4
10
,84
1
10
,80
9
10
,70
7
10
,57
8
10
,22
6
10
,17
8
10
,13
6
10
,06
3
9,8
09
9,6
10
9,4
80
9,4
71
9,2
33
9,1
15
8,9
23
8,7
43
8,7
25
8,6
82
8,6
33
8,4
27
7,9
69
7,7
00
5,9
66
3,4
38
0
2000
4000
6000
8000
10000
12000
14000
16000
18000
Ala
ska
Verm
ont
Illin
ois
Nort
h C
aro
lina
Dela
ware
Conn
ecticut
Ne
w J
ers
ey
Iow
a
Main
e
Haw
aii
Ma
ssachusetts
Virgin
ia
Mic
hig
an
Ala
ba
ma
Nort
h D
akota
Ken
tucky
New
Ha
mp
shire
Ne
w Y
ork
Rh
od
e Isla
nd
Monta
na
New
Mexic
o
Mary
lan
d
Mis
sis
sip
pi
Calif
orn
ia
Sou
th C
aro
lina
Nation
Mis
souri
Ida
ho
Ohio
Texas
Kan
sas
Sou
th D
ako
ta
Nebra
ska
Geo
rgia
Ind
ian
a
Okla
hom
a
Wis
consin
Min
ne
sota
Ore
go
n
West V
irgin
ia
Pen
nsylv
ania
Tenn
essee
Washin
gto
n
Ark
ansas
Nevad
a
Lo
uis
ian
a
Uta
h
Flo
rida
Colo
rado
Arizona

Funding per FTE StudentPublic Two-Year, 2013
page
013Sources: NCES, IPEDS Completions Files; Academic Years ,2012-13; Academic Year Instructional
Activity Files, 2012-13; Finance Files; GASB, FASB, and Private-for-profit Finance Files 2012-13.
32
,50
3
14
,44
8
12
,08
6
11,9
38
10
,85
8
10
,00
0
9,2
76
8,7
71
8,4
88
8,0
78
7,8
95
7,8
35
7,6
03
7,5
03
7,4
41
7,3
67
7,3
36
7,2
73
7,1
76
7,1
50
7,1
27
7,0
89
7,0
85
6,9
52
6,9
40
6,7
96
6,7
82
6,7
79
6,7
70
6,6
72
6,6
13
6,5
05
6,3
69
6,2
79
6,2
33
6,1
90
6,1
09
6,0
04
5,9
99
5,9
47
5,9
45
5,4
48
5,3
94
5,3
19
5,2
45
5,2
06
5,1
95
4,7
28
4,4
92
4,4
74
3,8
71
0
5000
10000
15000
20000
25000
30000
35000
Ala
ska
Wis
consin
Wyom
ing
Ne
w H
am
pshire
Dela
ware
Mary
lan
d
Nort
h D
akota
Nebra
ska
Kan
sas
Haw
aii
New
York
Conn
ecticut
Mic
hig
an
Ore
go
n
Massachusetts
Pen
nsylv
ania
Monta
na
Rhod
e Isla
nd
Illin
ois
New
Mexic
o
Arizona
Ohio
Texas
Ida
ho
Iow
a
Nation
Verm
ont
Calif
orn
ia
Nort
h C
aro
lina
Uta
h
Nevad
a
Min
ne
sota
Sou
th D
ako
ta
Ala
ba
ma
Ark
ansas
Washin
gto
n
Tenn
essee
New
Jers
ey
Okla
hom
a
Virgin
ia
Mis
sis
sip
pi
West V
irgin
ia
Main
e
Ind
ian
a
Colo
rado
Geo
rgia
Sou
th C
aro
lina
Flo
rida
Louis
ian
a
Mis
so
uri
Ken
tucky

Funding per FTE StudentPublic Total, 2013
page
014Sources: NCES, IPEDS Completions Files; Academic Years ,2012-13; Academic Year Instructional
Activity Files, 2012-13; Finance Files; GASB, FASB, and Private-for-profit Finance Files 2012-13.
22
,52
4
19
,56
6
19
,02
8
17
,25
0
16
,37
5
14
,76
2
14
,51
3
14
,16
6
13
,93
8
13
,93
0
13
,51
5
13
,51
4
13
,34
2
13
,31
3
13
,08
7
13
,05
8
12
,86
1
12
,73
3
12
,61
5
12
,54
4
12
,52
6
12
,52
5
12
,52
5
12
,41
5
12
,25
5
11,8
88
11,8
75
11,6
31
11,5
91
11,5
30
11,5
08
11,4
88
11,4
88
11,1
15
11,0
37
11,0
31
10
,97
5
10
,92
3
10
,91
9
10
,84
5
10
,82
8
10
,81
8
10
,68
1
10
,59
2
10
,30
6
10
,28
9
10
,03
7
9,8
93
9,8
89
8,9
95
7,8
93
0
5000
10000
15000
20000
25000
Ala
ska
Verm
ont
Dela
ware
Wyom
ing
Conn
ecticut
Nort
h D
akota
Pen
nsylv
ania
Nebra
ska
Haw
aii
Mary
lan
d
Mic
hig
an
Wis
consin
Ala
ba
ma
Ind
ian
a
New
Ha
mp
shire
Ma
ssachusetts
No
rth C
aro
lina
Ohio
Rhod
e Isla
nd
Kan
sas
Main
e
West V
irgin
ia
Iow
a
Virgin
ia
New
York
Okla
hom
a
New
Jers
ey
Nation
Ida
ho
Ken
tucky
Illin
ois
Arizona
Monta
na
Tenn
essee
Nevad
a
Texas
Sou
th D
ako
ta
Mis
sis
sip
pi
Min
ne
sota
Uta
h
New
Mexic
o
Ore
go
n
Sou
th C
aro
lina
Calif
orn
ia
Geo
rgia
Washin
gto
n
Mis
souri
Louis
ian
a
Ark
ansas
Colo
rado
Flo
rida
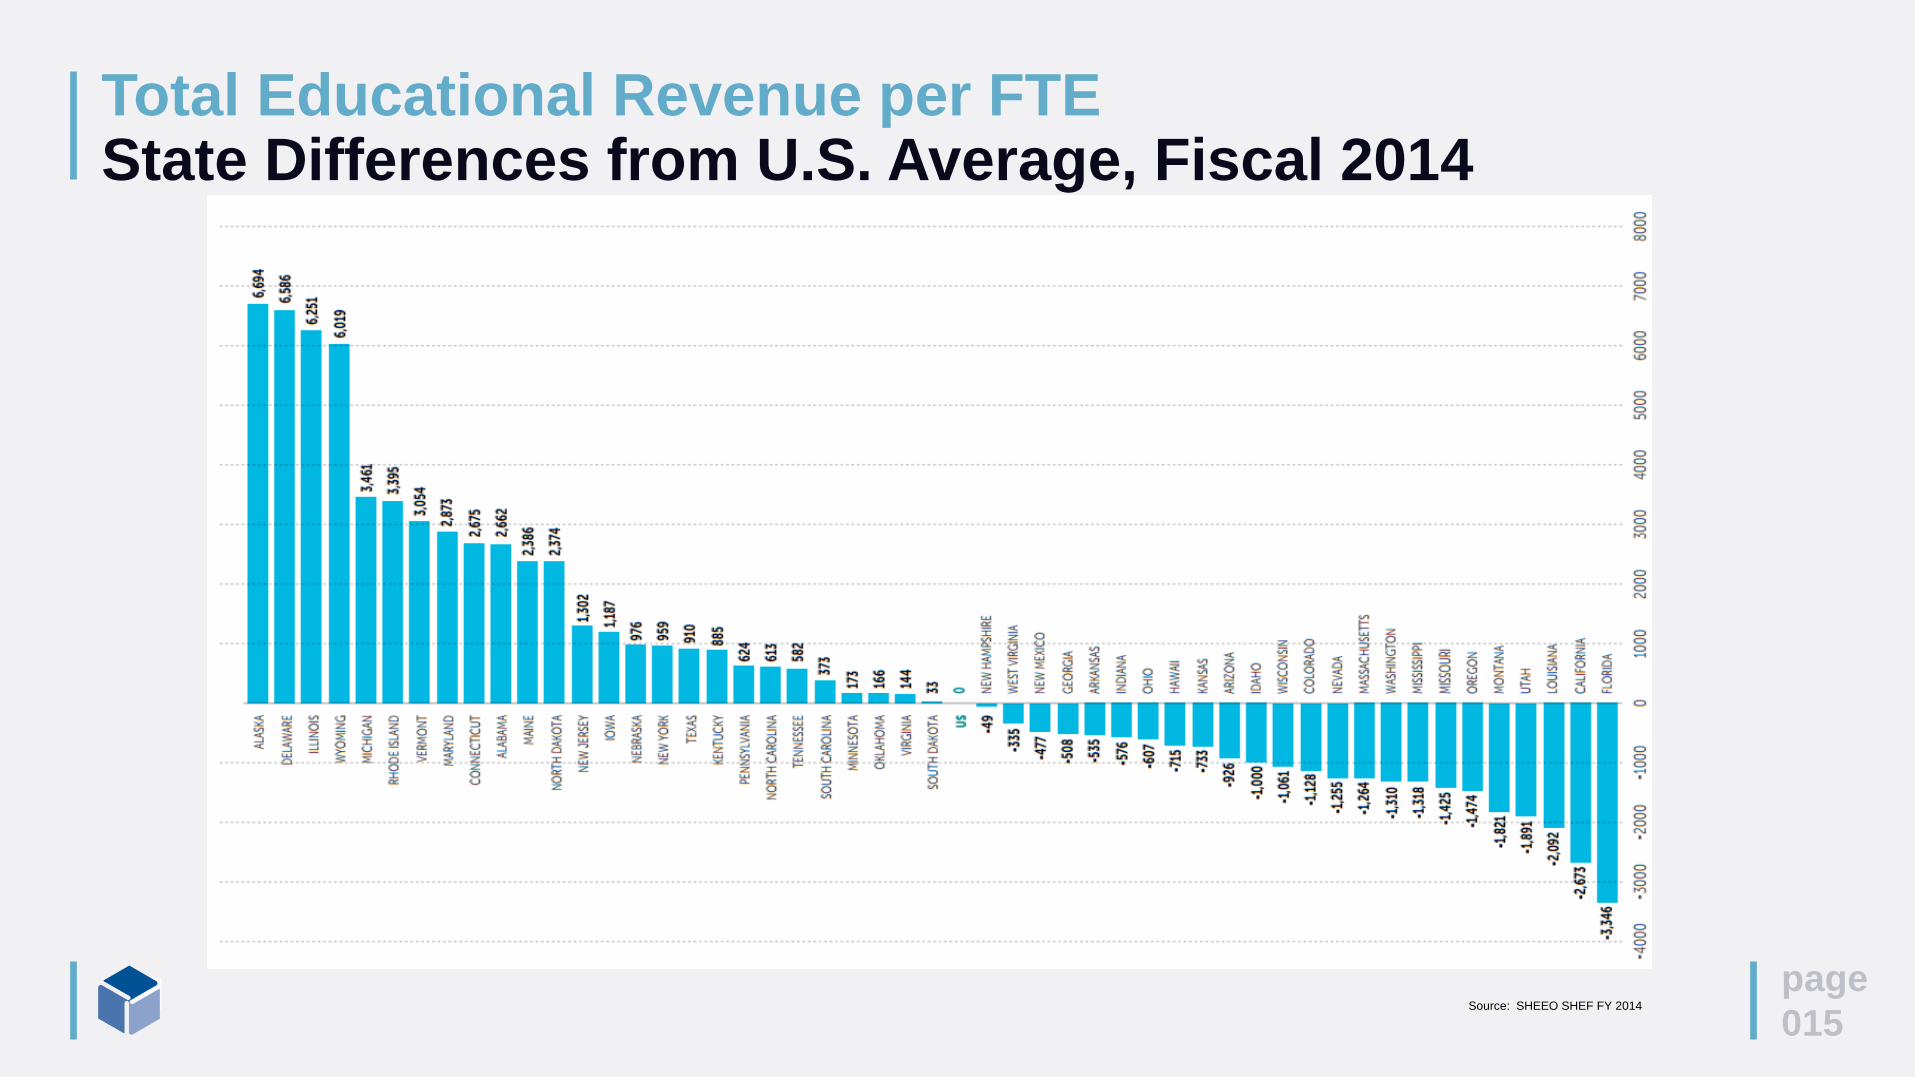
Total Educational Revenue per FTEState Differences from U.S. Average, Fiscal 2014
page
015Source: SHEEO SHEF FY 2014
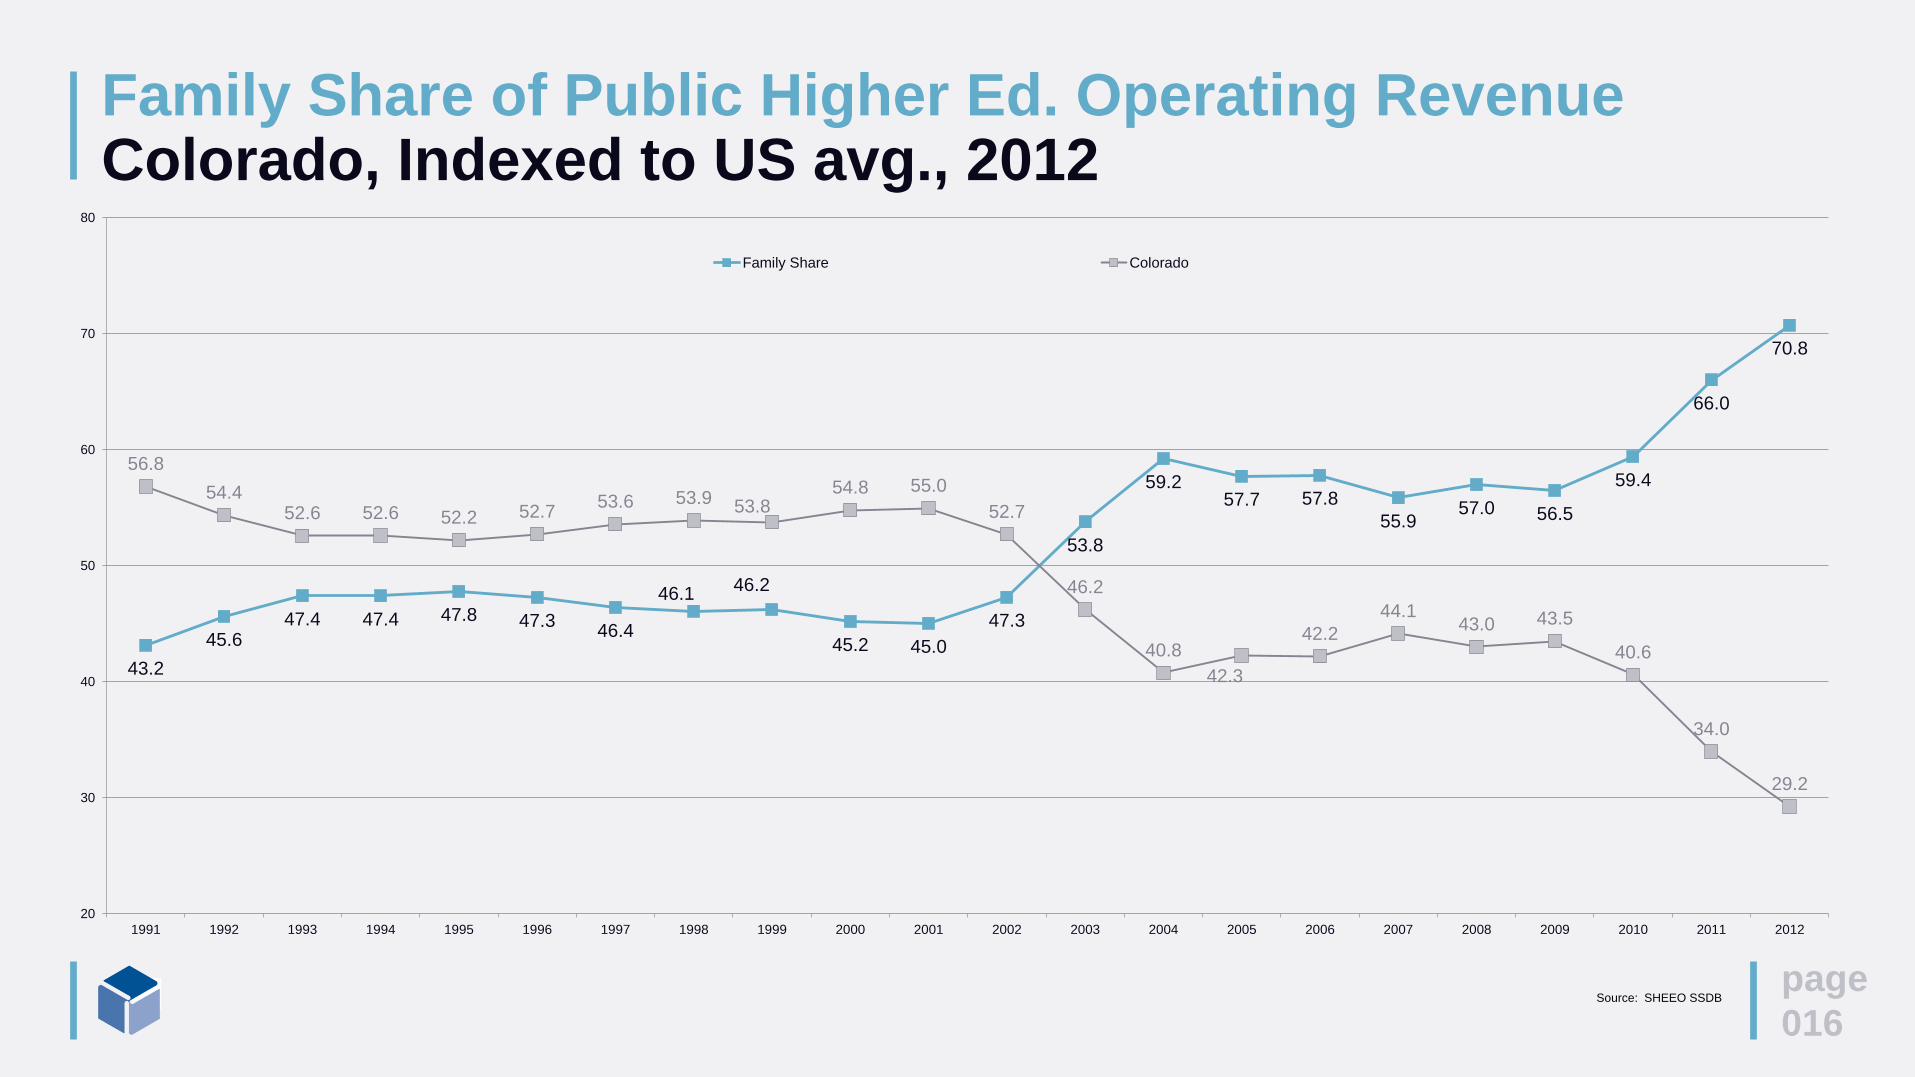
Family Share of Public Higher Ed. Operating RevenueColorado, Indexed to US avg., 2012
page
016Source: SHEEO SSDB
43.2
45.647.4 47.4 47.8 47.3
46.4
46.146.2
45.2 45.0
47.3
53.8
59.257.7 57.8
55.957.0 56.5
59.4
66.0
70.8
56.8
54.452.6 52.6 52.2 52.7
53.6 53.9 53.854.8 55.0
52.7
46.2
40.8
42.3
42.2
44.143.0 43.5
40.6
34.0
29.2
20
30
40
50
60
70
80
1991 1992 1993 1994 1995 1996 1997 1998 1999 2000 2001 2002 2003 2004 2005 2006 2007 2008 2009 2010 2011 2012
Family Share Colorado
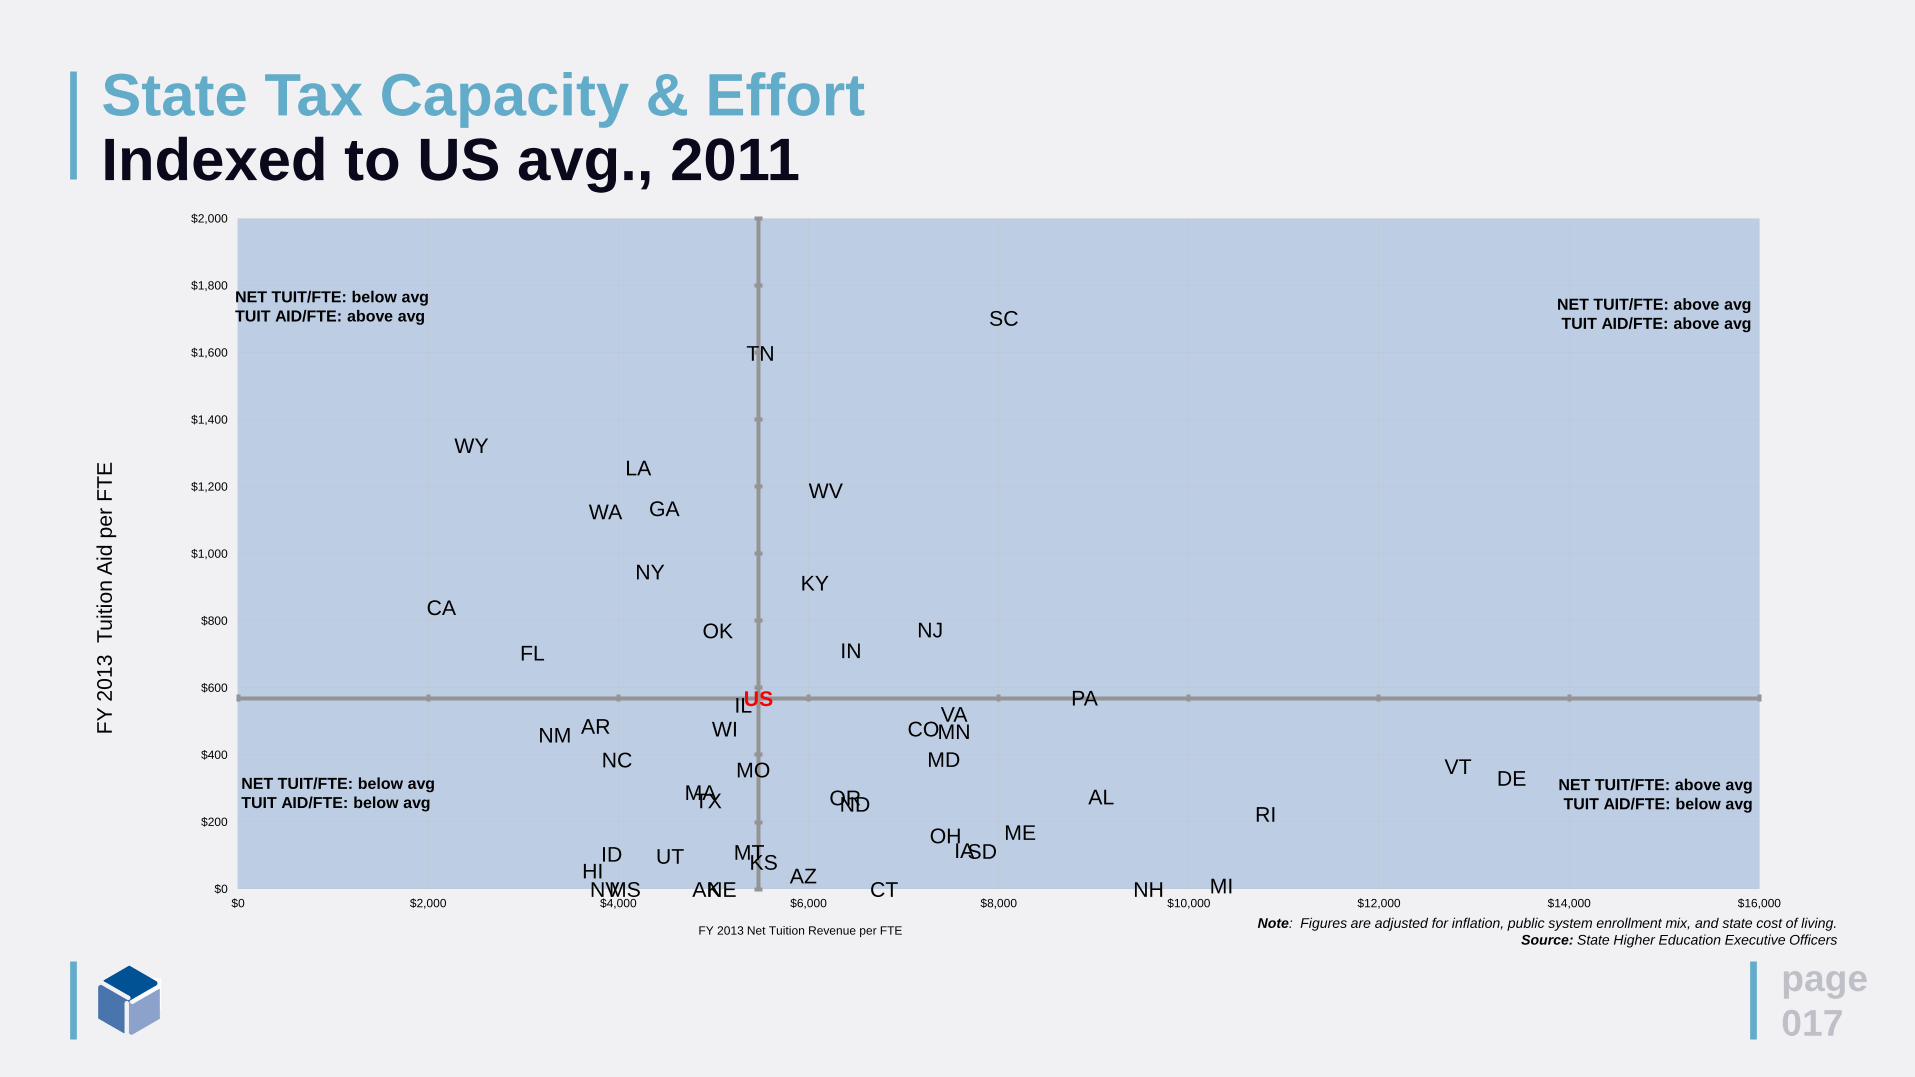
State Tax Capacity & Effort Indexed to US avg., 2011
page
017
AL
AKAZ
AR
CA
CO
CT
DE
FL
GA
HIID
IL
IN
IAKS
KY
LA
ME
MD
MA
MI
MN
MS
MO
MT
NENV NH
NJ
NM
NY
NC
ND
OH
OK
OR
PA
RI
SC
SD
TN
TX
UT
VT
VA
WAWV
WI
WY
US
$0
$200
$400
$600
$800
$1,000
$1,200
$1,400
$1,600
$1,800
$2,000
$0 $2,000 $4,000 $6,000 $8,000 $10,000 $12,000 $14,000 $16,000
FY
2013 T
uitio
n A
id p
er
FT
E
FY 2013 Net Tuition Revenue per FTENote: Figures are adjusted for inflation, public system enrollment mix, and state cost of living.
Source: State Higher Education Executive Officers
NET TUIT/FTE: below avg
TUIT AID/FTE: above avgNET TUIT/FTE: above avg
TUIT AID/FTE: above avg
NET TUIT/FTE: below avg
TUIT AID/FTE: below avgNET TUIT/FTE: above avg
TUIT AID/FTE: below avg
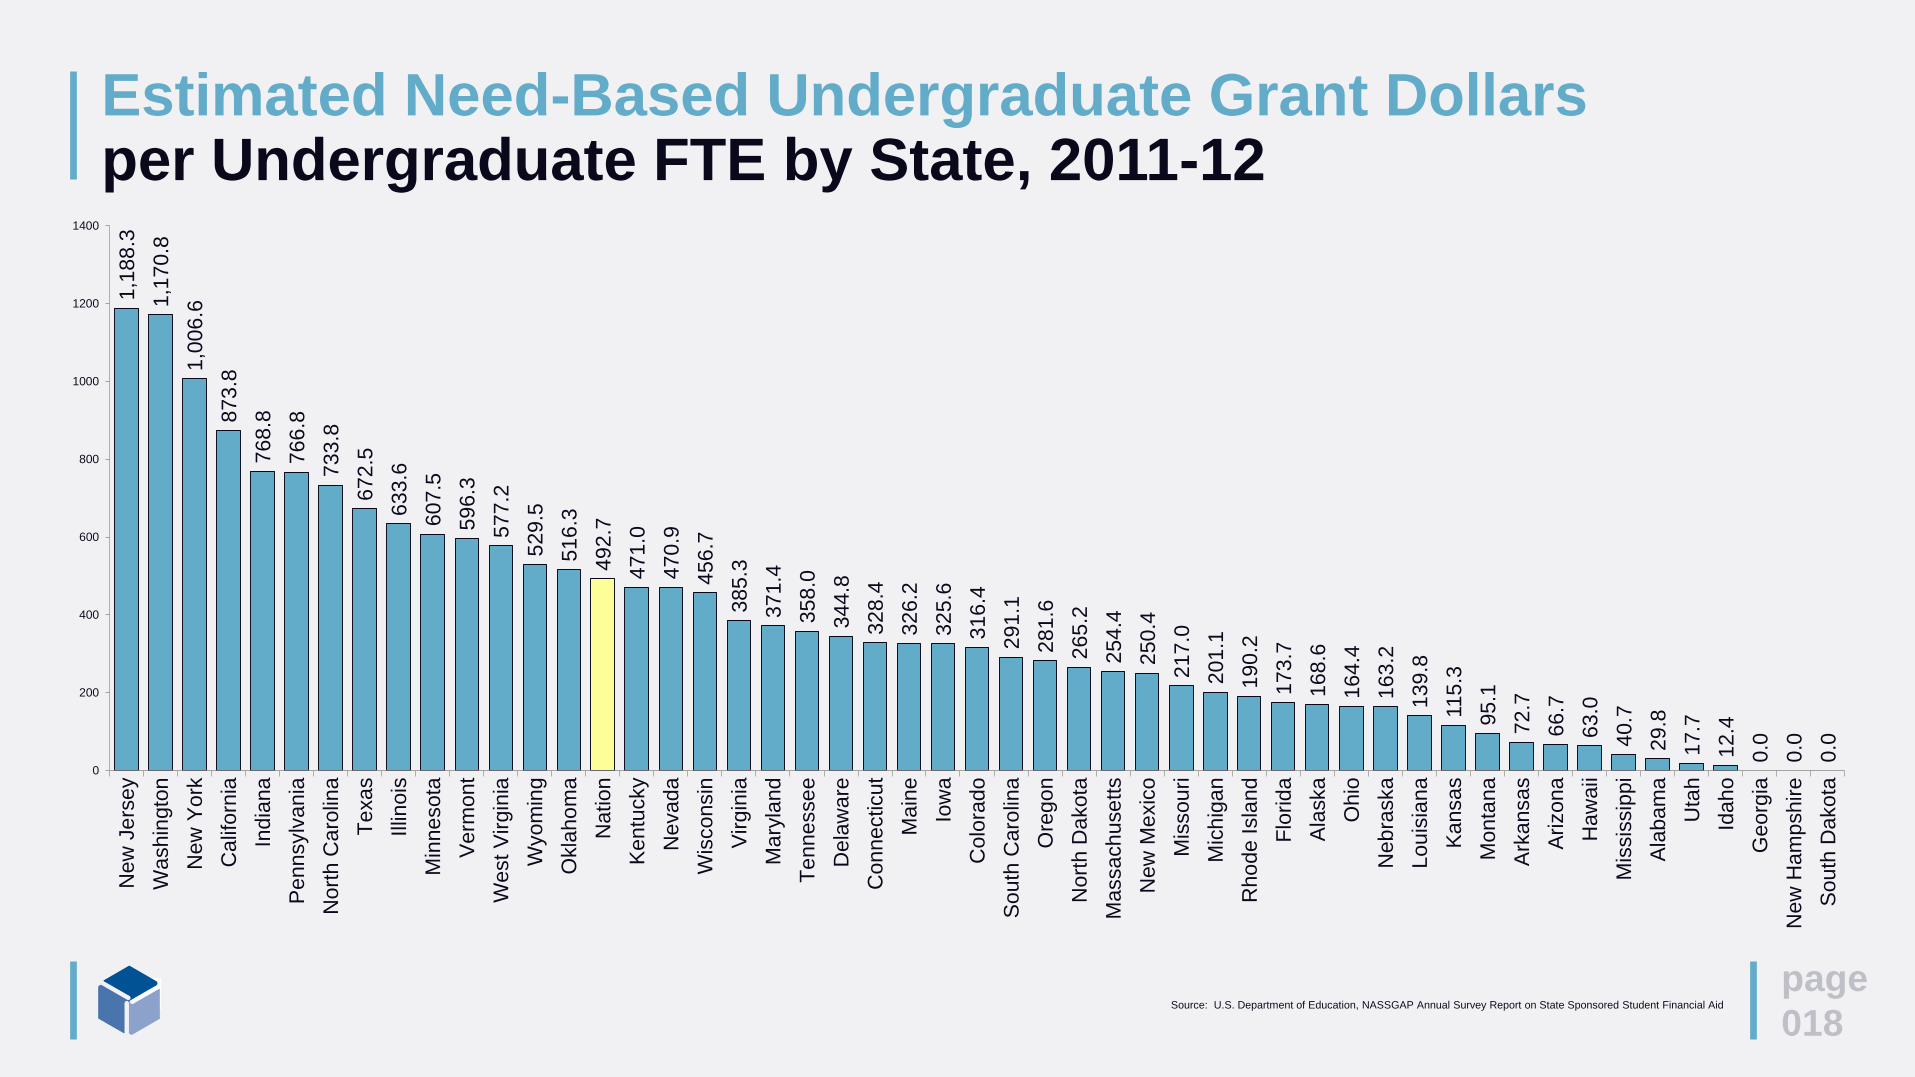
Estimated Need-Based Undergraduate Grant Dollarsper Undergraduate FTE by State, 2011-12
page
018
1,1
88
.3
1,1
70
.8
1,0
06
.6
87
3.8
76
8.8
76
6.8
73
3.8
67
2.5
63
3.6
60
7.5
59
6.3
57
7.2
52
9.5
51
6.3
49
2.7
47
1.0
47
0.9
45
6.7
38
5.3
37
1.4
35
8.0
34
4.8
32
8.4
32
6.2
32
5.6
31
6.4
29
1.1
28
1.6
26
5.2
25
4.4
25
0.4
21
7.0
20
1.1
19
0.2
17
3.7
16
8.6
16
4.4
16
3.2
13
9.8
115.3
95
.1
72
.7
66
.7
63
.0
40
.7
29
.8
17
.7
12
.4
0.0
0.0
0.0
0
200
400
600
800
1000
1200
1400
New
Je
rsey
Washin
gto
n
New
York
Calif
orn
ia
India
na
Penn
sylv
ania
Nort
h C
aro
lina
Te
xas
Illin
ois
Min
nesota
Verm
ont
West V
irgin
ia
Wyom
ing
Okla
ho
ma
Nation
Kentu
cky
Nevada
Wis
consin
Vir
gin
ia
Mary
land
Te
nnesse
e
Dela
ware
Con
necticut
Main
e
Iow
a
Colo
rado
South
Caro
lina
Ore
go
n
Nort
h D
akota
Massach
use
tts
New
Mexic
o
Mis
souri
Mic
hig
an
Rho
de Isla
nd
Flo
rida
Ala
ska
Ohio
Neb
raska
Lou
isia
na
Kansas
Monta
na
Ark
ansas
Ari
zona
Haw
aii
Mis
sis
sip
pi
Ala
bam
a
Uta
h
Idah
o
Georg
ia
New
Ham
pshir
e
South
Dakota
Source: U.S. Department of Education, NASSGAP Annual Survey Report on State Sponsored Student Financial Aid

Net Cost as a Percent of Median Family IncomePublic Four-Year Institutions, 2012-13
page
019
27
.0
24
.0
23
.4
23
.4
23
.2
23
.1
22
.4
21
.8
21
.0
21
.0
21
.0
20
.9
20
.7
20
.4
20
.3
19
.9
19
.9
19
.7
19
.5
19
.3
19
.3
19
.3
19
.2
19
.1
19
.0
19
.0
18
.8
18
.3
17
.9
17
.4
17
.3
17
.2
17
.2
17
.1
16
.9
16
.7
16
.6
16
.5
16
.3
16
.0
15
.7
15
.3
14
.8
14
.4
14
.3
14
.1
13
.5
13
.3
12
.4
11.0
10
.6
0
5
10
15
20
25
30
Penn
sylv
ania
Ohio
Mic
hig
an
New
Ham
pshir
e
Ore
go
n
Illin
ois
Dela
ware
South
Caro
lina
New
Je
rsey
Rho
de Isla
nd
Ala
bam
a
Main
e
India
na
Ari
zona
Washin
gto
n
Wis
consin
Verm
ont
Colo
rado
Calif
orn
ia
Vir
gin
ia
Min
nesota
Nevada
Massach
use
tts
Nation
New
York
Con
necticut
Georg
ia
Mis
souri
Kentu
cky
South
Dakota
West V
irgin
ia
Flo
rida
Neb
raska
Nort
h C
aro
lina
Iow
a
Te
xas
Kansas
Haw
aii
Mis
sis
sip
pi
Idah
o
Mary
land
Monta
na
Okla
ho
ma
Te
nnesse
e
Nort
h D
akota
Lou
isia
na
New
Mexic
o
Ark
ansas
Uta
h
Ala
ska
Wyom
ing
Sources: NCES, IPEDS Institutional Characteristics Files; hd2013 and ic2013_ay Provisional Release Data Files; NCES, IPEDS Fall
2012 Enrollment File; ef2012a Final Release Data File; NCES, IPEDS Academic Year 2012-13 Student Financial Aid File; sfa1213
Provisional Release Data File; U.S. Census Bureau, 2013 American Community Survey (ACS) One-Year Public Use Microdata Sample
(PUMS) File.

Net Cost as a Percent of Lowest Quintile Family IncomePublic Four-Year Institutions, 2012-13
page
020
Sources: NCES, IPEDS Institutional Characteristics Files; hd2013 and ic2013_ay Provisional Release Data Files; NCES, IPEDS Fall
2012 Enrollment File; ef2012a Final Release Data File; NCES, IPEDS Academic Year 2012-13 Student Financial Aid File; sfa1213
Provisional Release Data File; U.S. Census Bureau, 2013 American Community Survey (ACS) One-Year Public Use Microdata Sample
(PUMS) File.
92
.3
87
.7
85
.9
84
.9
83
.6
83
.3
81
.0
80
.3
80
.3
79
.7
78
.2
78
.1
76
.8
75
.8
72
.1
71
.4
71
.3
71
.3
69
.7
69
.4
69
.0
68
.0
67
.6
67
.6
65
.5
64
.6
64
.1
63
.1
62
.9
62
.2
61
.6
61
.4
61
.2
60
.9
59
.7
59
.1
57
.0
54
.9
54
.0
53
.4
53
.0
52
.3
52
.2
51
.9
51
.4
46
.7
46
.3
44
.4
39
.1
34
.1
31
.8
0
10
20
30
40
50
60
70
80
90
100
Penn
sylv
ania
Mic
hig
an
Ohio
Illin
ois
New
Je
rsey
Ala
bam
a
Rho
de Isla
nd
New
York
Ore
go
n
South
Caro
lina
Massach
use
tts
Calif
orn
ia
Ari
zona
Dela
ware
India
na
Nation
Georg
ia
Washin
gto
n
Mis
sis
sip
pi
Kentu
cky
Vir
gin
ia
Con
necticut
New
Ham
pshir
e
Colo
rado
Nevada
Wis
consin
Main
e
Mis
souri
Te
xas
Verm
ont
Min
nesota
Monta
na
Nort
h C
aro
lina
West V
irgin
ia
Lou
isia
na
Flo
rida
New
Mexic
o
Haw
aii
Mary
land
Neb
raska
Kansas
Iow
a
Te
nnesse
e
South
Dakota
Okla
ho
ma
Idah
o
Ark
ansas
Nort
h D
akota
Uta
h
Ala
ska
Wyom
ing

Percent of Graduates with Debt2012-13
page
021
43
% 47
%
48
%
48
%
49
% 52
%
53
%
53
%
54
%
54
%
55
%
55
%
55
%
55
% 57
%
57
%
58
%
59
%
59
%
59
%
59
%
59
%
60
%
60
%
61
%
61
%
61
%
62
%
62
%
62
%
63
%
63
%
64
%
64
%
64
%
65
%
66
%
66
% 68
%
68
%
69
%
69
%
70
%
70
%
70
%
70
%
70
%
71
%
72
% 76
%
0%
10%
20%
30%
40%
50%
60%
70%
80%
Nevada
Haw
aii
Lou
isia
na
Wyom
ing
Ala
ska
Uta
h
Flo
rida
Okla
ho
ma
Ala
bam
a
New
Mexic
o
Ari
zona
Ark
ansas
Calif
orn
ia
Colo
rado
Mis
sis
sip
pi
Te
nnesse
e
Washin
gto
n
Kentu
cky
Mary
land
South
Caro
lina
Te
xas
Vir
gin
ia
New
York
Ore
go
n
Nation
Georg
ia
Nort
h C
aro
lina
Dela
ware
India
na
Neb
raska
Mic
hig
an
Mis
souri
Con
necticut
Main
e
Verm
ont
Kansas
Massach
use
tts
Monta
na
Idah
o
Ohio
Iow
a
Rho
de Isla
nd
Illin
ois
Min
nesota
New
Je
rsey
West V
irgin
ia
Wis
consin
Penn
sylv
ania
South
Dakota
New
Ham
pshir
e
Nort
h D
akota
Source: The Institute for College Access & Success, College InSight, http://www.college-insight.org.
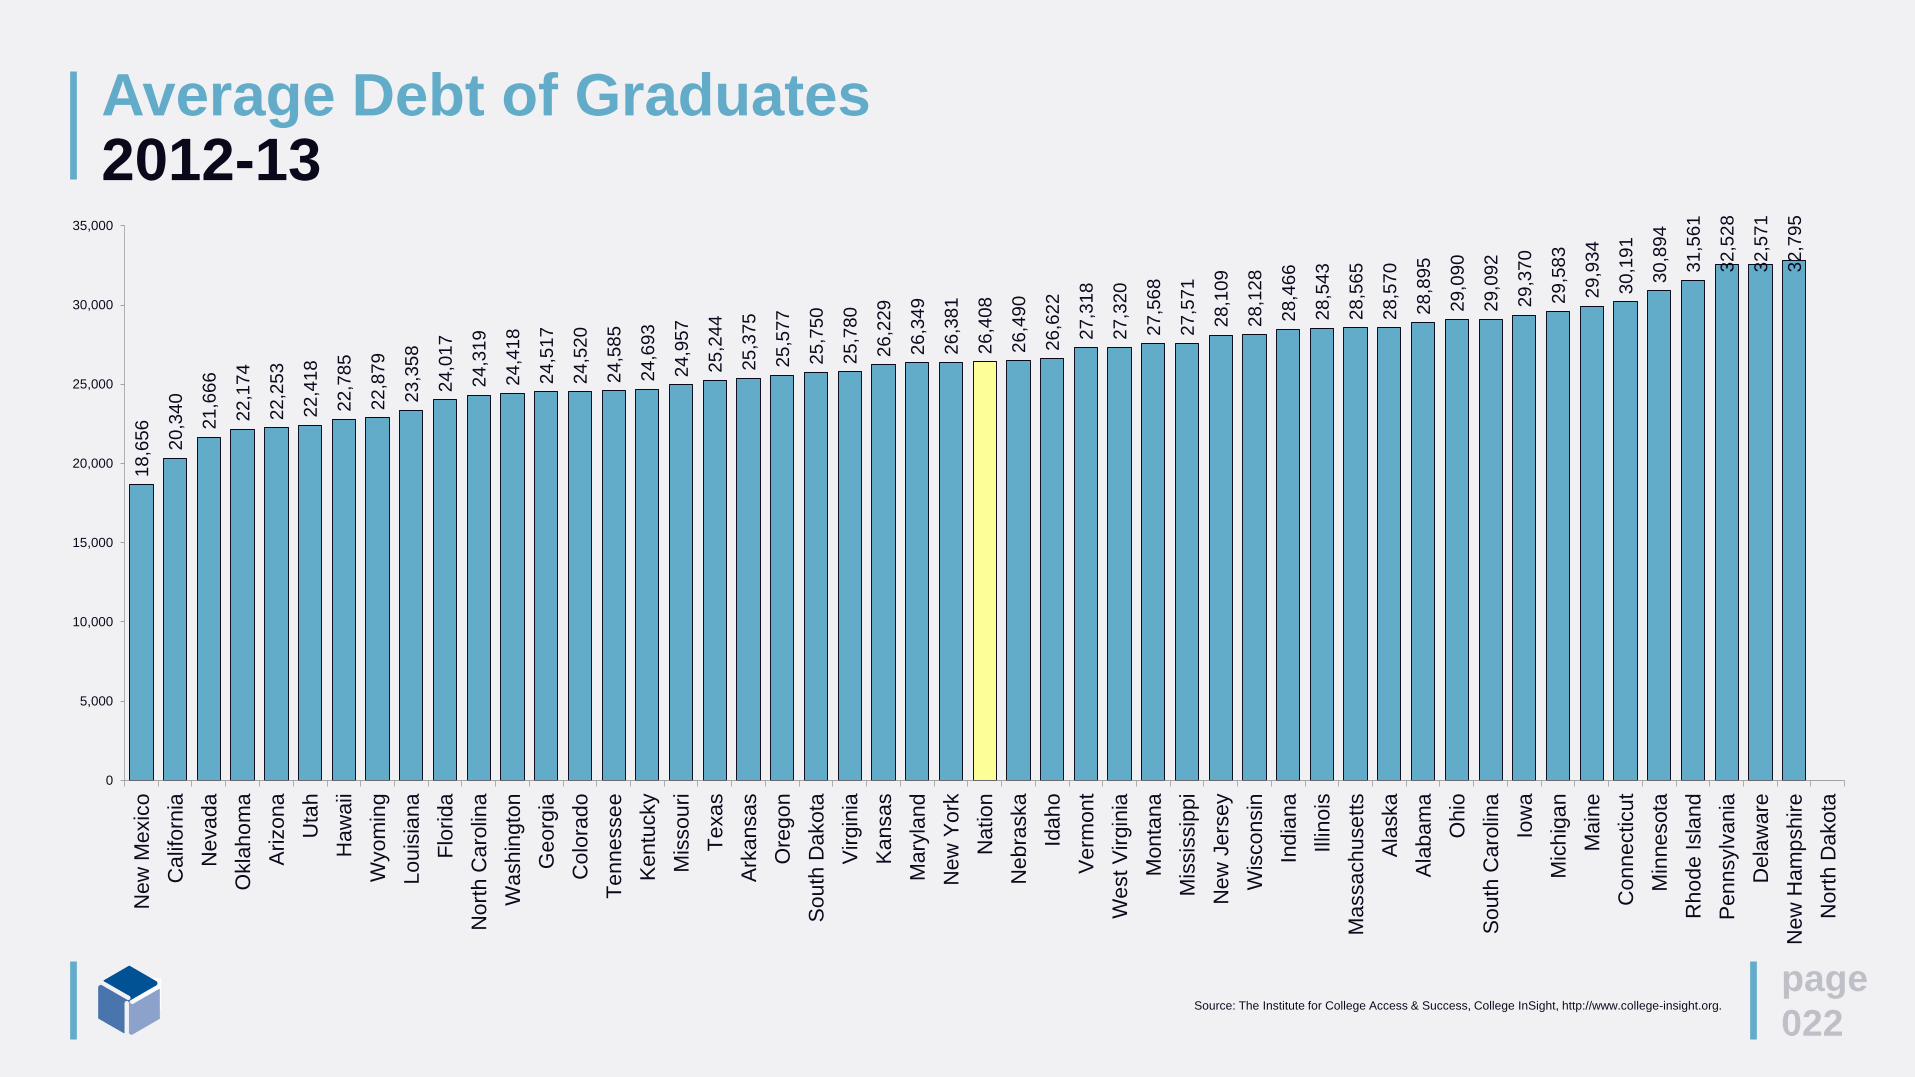
Average Debt of Graduates2012-13
page
022
18
,65
6
20
,34
0
21
,66
6
22
,17
4
22
,25
3
22
,41
8
22
,78
5
22
,87
9
23
,35
8
24
,01
7
24
,31
9
24
,41
8
24
,51
7
24
,52
0
24
,58
5
24
,69
3
24
,95
7
25
,24
4
25
,37
5
25
,57
7
25
,75
0
25
,78
0
26
,22
9
26
,34
9
26
,38
1
26
,40
8
26
,49
0
26
,62
2
27
,31
8
27
,32
0
27
,56
8
27
,57
1
28
,10
9
28
,12
8
28
,46
6
28
,54
3
28
,56
5
28
,57
0
28
,89
5
29
,09
0
29
,09
2
29
,37
0
29
,58
3
29
,93
4
30
,19
1
30
,89
4
31
,56
1
32
,52
8
32
,57
1
32
,79
5
0
5,000
10,000
15,000
20,000
25,000
30,000
35,000
New
Mexic
o
Calif
orn
ia
Nevada
Okla
ho
ma
Ari
zona
Uta
h
Haw
aii
Wyom
ing
Lou
isia
na
Flo
rida
Nort
h C
aro
lina
Washin
gto
n
Georg
ia
Colo
rado
Te
nnesse
e
Kentu
cky
Mis
souri
Te
xas
Ark
ansas
Ore
go
n
South
Dakota
Vir
gin
ia
Kansas
Mary
land
New
York
Nation
Neb
raska
Idah
o
Verm
ont
West V
irgin
ia
Monta
na
Mis
sis
sip
pi
New
Je
rsey
Wis
consin
India
na
Illin
ois
Massach
use
tts
Ala
ska
Ala
bam
a
Ohio
South
Caro
lina
Iow
a
Mic
hig
an
Main
e
Con
necticut
Min
nesota
Rho
de Isla
nd
Penn
sylv
ania
Dela
ware
New
Ham
pshir
e
Nort
h D
akota
Source: The Institute for College Access & Success, College InSight, http://www.college-insight.org.

Net Tuition as a Percent of Public Higher Ed. Total RevenueFiscal 2012
page
023
15
.1
21
.7 26
.3 31
.9
33
.5
34
.0
35
.0
36
.0
36
.1
36
.3
37
.8
38
.0
38
.9
40
.5
40
.8
42
.2
43
.1
44
.8
44
.9
46
.1
46
.9
47
.0
47
.1
48
.0
48
.1
48
.4
50
.4
51
.0
51
.1
51
.9
52
.7 57
.2
57
.2
57
.3
57
.5
59
.3
60
.3
60
.5
61
.0
62
.1
63
.0 66
.4
66
.7
66
.9 69
.7
70
.1
71
.7
72
.9
73
.4
80
.7 84
.5
0
10
20
30
40
50
60
70
80
90
Wyom
ing
Calif
orn
ia
Ala
ska
New
Mexic
o
Nort
h C
aro
lina
Haw
aii
Flo
rida
Illin
ois
New
York
Nevad
a
Ida
ho
Geo
rgia
Texas
Mis
sis
sip
pi
Nebra
ska
Ark
ansas
Okla
hom
a
Massachusetts
Louis
ian
a
Nort
h D
akota
Uta
h
Tenn
essee
U.S
.
Washin
gto
n
Ken
tucky
Wis
consin
Mary
lan
d
Kan
sas
Mis
so
uri
Conn
ecticut
Monta
na
Min
ne
sota
Ind
ian
a
Main
e
Arizona
New
Jers
ey
Iow
a
West V
irgin
ia
Ore
go
n
Virgin
ia
Ohio
Ala
ba
ma
Sou
th C
aro
lina
Sou
th D
ako
ta
Mic
hig
an
Rhod
e Isla
nd
Pen
nsylv
ania
Colo
rado
Dela
ware
Ne
w H
am
pshire
Verm
ont
Source: SHEEO SHEF FY 2014
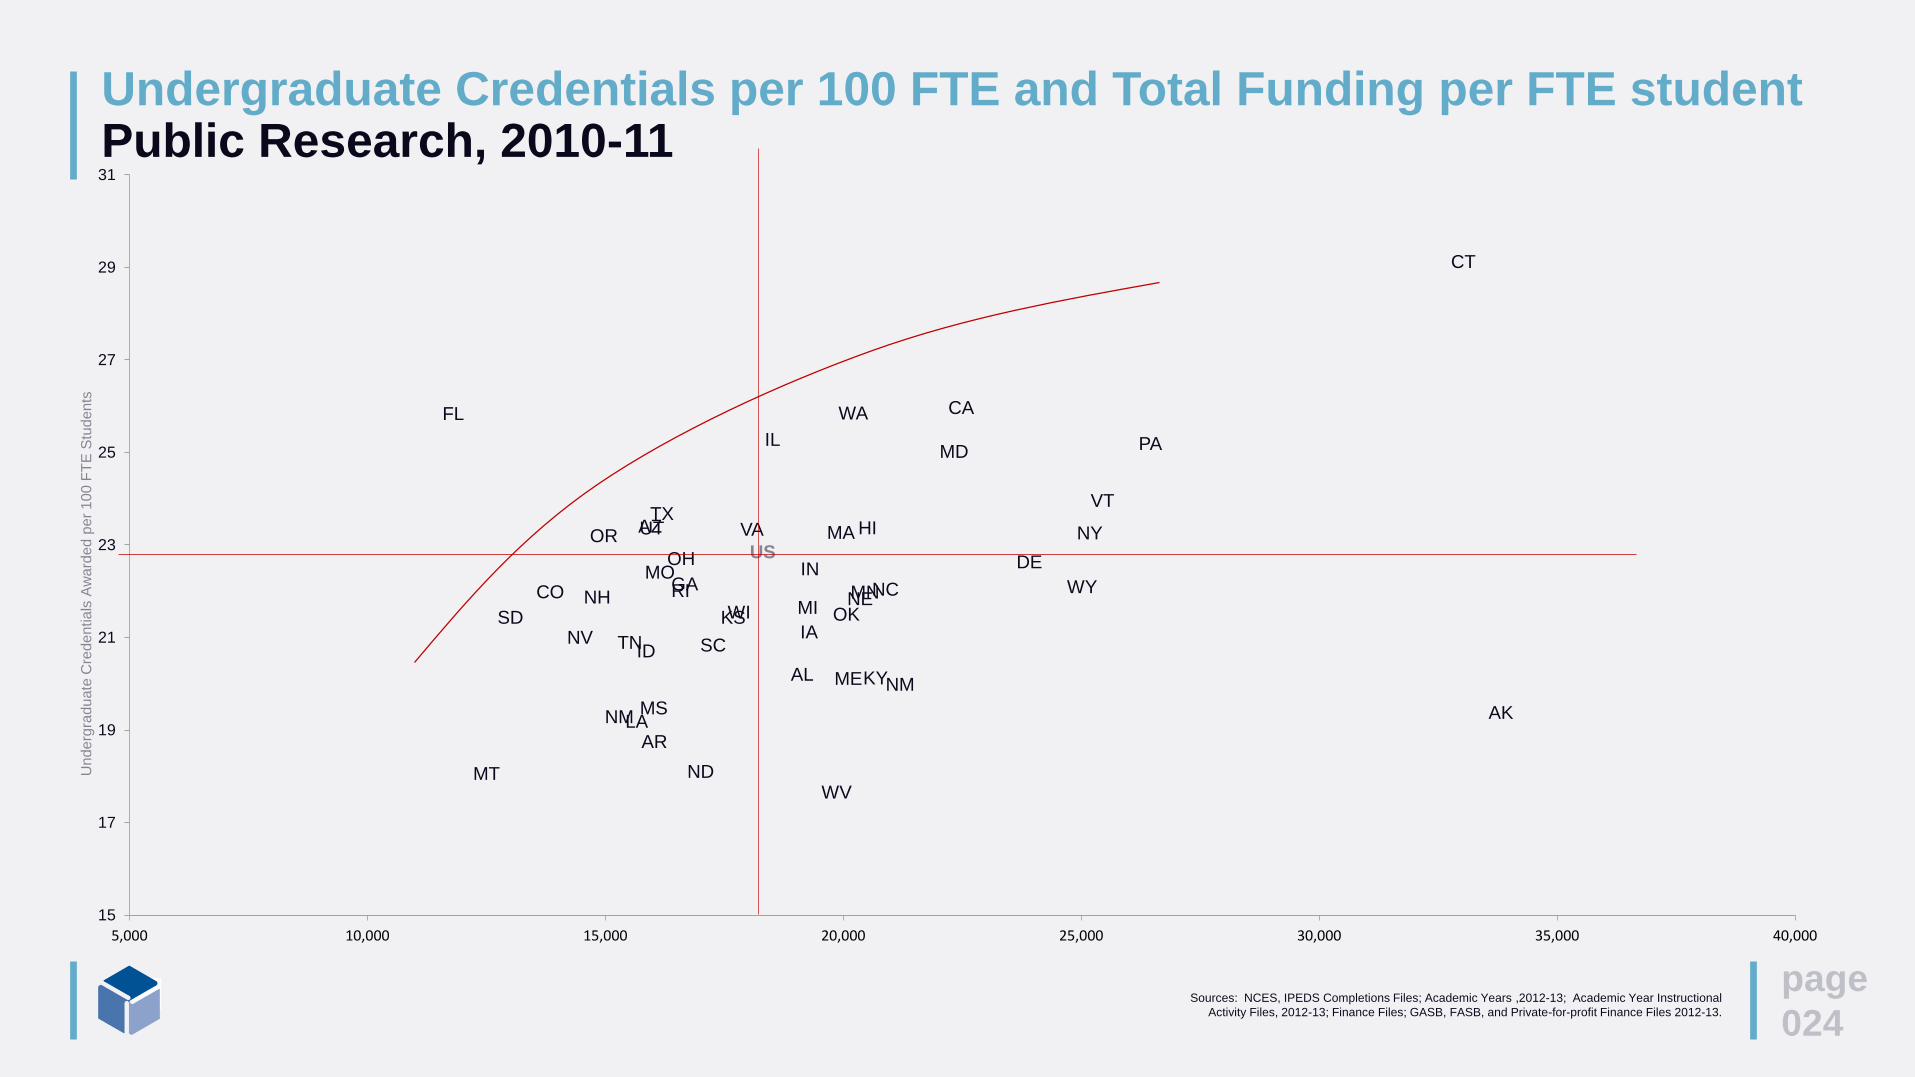
Undergraduate Credentials per 100 FTE and Total Funding per FTE studentPublic Research, 2010-11
page
024
AL
AK
AZ
AR
CA
CO
CT
DE
FL
GA
HI
ID
IL
IN
IAKS
KY
LA
ME
MD
MA
MIMN
MS
MO
MT
NE
NV
NH
NM
NM
NY
NC
ND
OH
OK
OR
PA
RI
SC
SD
TN
TXUT
VT
VA
WA
WV
WI
WY
US
15
17
19
21
23
25
27
29
31
5,000 10,000 15,000 20,000 25,000 30,000 35,000 40,000
Un
de
rgra
du
ate
Cre
de
ntia
ls A
wa
rde
d p
er
100
FT
E S
tude
nts
Sources: NCES, IPEDS Completions Files; Academic Years ,2012-13; Academic Year Instructional
Activity Files, 2012-13; Finance Files; GASB, FASB, and Private-for-profit Finance Files 2012-13.
What can these data tell you?
page
025
• What differences exist among states for
topics such as:
• Affordability
• Resources
• Students earning degrees
• Student debt levels
page
026
…and what can’t they tell you?
• Data shortcomings include
• Capital
• Endowment
• Student aid with respect to
economic background
But don’t let perfect be the enemy of good.
Thank you
page
027
.contact
Matt Crellin
Senior Associate
NCHEMS
.address
www.nchems.org
303-497-0330