Embed Size (px)
Citation preview

Finance Data
Thomson Reuters Eikon
Equities and Fixed Income
Introduction Manual
March 2017

FINANCE DATA: THOMPSON REUTERS EIKON 4.0
2
Contents
1. Introduction ................................................................................................................................... 3
1.1 When do I use Eikon? ................................................................................................................... 3
1.2 Request access for Eikon ............................................................................................................ 3
1.3 Where can I get more help with Eikon? ................................................................................... 3
2. The Excel Plug-in ........................................................................................................................... 4
2.1 Getting Started: ............................................................................................................................ 4
2.2 Formula Builder .............................................................................................................................. 4
2.2.1 A standard request ............................................................................................................. 4
2.2.2 Time Series request .............................................................................................................. 5
2.2.3 Layout options ...................................................................................................................... 6
2.3 Templates ....................................................................................................................................... 9
2.4 IPO Price – Deal Screener ........................................................................................................... 9
2.4.1 Install Deal Screener ........................................................................................................... 9
2.4.2 Using Deal Screener ............................................................................................................ 9
2.5 Operating with lists ..................................................................................................................... 11
2.5.1 Creating in Datastream ................................................................................................... 11
2.5.2 Creating lists in Eikon ......................................................................................................... 13
3. Eikon Apps .................................................................................................................................... 14
3.1 Screener ....................................................................................................................................... 14
3.1.1 S&P 500 ................................................................................................................................ 16
3.2 Search Bar .................................................................................................................................... 17
3.3 Portfolio and Lists ........................................................................................................................ 17
4. Appendix A: Specific Solutions ................................................................................................ 18
4.1 Different reporting dates ........................................................................................................... 18
4.2 Working with CDS instruments .................................................................................................. 19

FINANCE DATA: THOMPSON REUTERS EIKON 4.0
3
1. Introduction
1.1 When do I use Eikon?
Eikon is a complex financial database from Thomson Reuters which contains most of the
data relevant for any financial research. Just as its predecessor Datastream it is available
through the software itself or through an Excel plug-in. As it is the most comprehensive
platform available at the UU, it is very useful in any situation. On the other hand, it is
sometimes easier to use another platform due to the complexity of Eikon.
This manual will help you understanding the basics of this powerful tool
1.2 Request access for Eikon
Eikon is available on five computers in the computer room Adam Smith 112. The computers
are denoted as EIKON 1 – 5 with a sticker. The number of the individual computer is important
as it is only allowed to use a certain account on a certain computer.
A login-password combination can be asked by sending an email to
[email protected] (further information about this process should have been sent to
you by email).
Please note that it is NOT allowed to use this account anywhere else than in the Adam Smith
computer room.
1.3 Where can I get more help with Eikon?
Thomson Reuters does have an online help desk, but this is unfortunately not available for
students. If you need more support you can always contact the finance team of the
University by writing an email to [email protected]. It is also possible to get direct
support by visiting the responsible student assistant. He is available most Fridays from 10am to
4pm in the computer room of Adam Smith (112).

FINANCE DATA: THOMPSON REUTERS EIKON 4.0
4
2. The Excel Plug-in
2.1 Getting Started:
Eikon in Excel can be opened by simply searching for ‘Eikon.exe - Excel’ in the start menu of
Windows. This will open up a Excel sheet with 2 more selections in the top menu. The plug-in
for Eikon is denoted as ‘Thomson Reuters’. In the top right corner, you can select ‘Sign Up’ in
order to log in and use Eikon. Log in with the combination you have received per email (see
section 1.2). You are not accessing Eikon via Excel.
2.2 Formula Builder
2.2.1 A standard request
The easiest way to access data in Eikon is via the formula builder. What it basically does is
writing you a code which will retrieve data from a database. Writing this code is essentially
quite simple and similar to the time series requests of Datastream.
Opening up the formula builder by clicking on the ‘Build Formula’ symbol will open up a
window. We are now in the main menu.
Eikon’s formula builder works quite similar to other data platforms: First, you select the
companies you want data from, then you select the variable. In Eikon, the various
companies are called Instuments. The different variables (or columns) are called Data Items.
In the top bar you can enter your instruments. You can either directly search for them by
namer, ticker etc. or you can click on the small on the side. This will open a window which
will allow you to select different companies with filters. For this guide we will select the
companies of Swiss property and causality insurance companies. To do so we enter
‘Switzerland’ as a country and ‘Property and Causality Insurance’ as a sector. By clicking on
the ‘Search’ button it will search for companies that match your entry. This will give you a list
of various companies, in this case 49. You can select now the for you relevant companies. In
our case we want them all, so we click on the button. We can close this window
now and we see our selected companies are listed as instruments.
TIP: Use the ´Screener´ app to select all the equities from one Stock Exchange. For further
info, check section 3.1.
Picture 1: Several instruments are selected

FINANCE DATA: THOMPSON REUTERS EIKON 4.0
5
Now we have to choose what information we want to know from this data, the data items.
One way is to simply search for our data item in the search bar. This seems straight forward,
but can lead to confusion sometimes as its sometimes hard to know which item you want
exactly. Sometimes it makes sense to first select a category to narrow down your search.
Finding the right data item is mostly a trial and error process. It helps a lot to read the
describtion to an item first before using it.
For the example of this manual we are interested in the total revenue of these equities. As this
is quite straight forward we just enter ‘Total revenue’ in the searchbar. We click on the top
search item and on the right side we can now see a description to the item. This shows us as
well on which date the data is from. This is adjustable, but for now we leave it at the standard
one. Once we are content with the data item we can hover over the bar in the Fields list and
a blue ‘add’ button should appear. This will add this item to the formula, which we can see
on the bottom of the screen. It is possible to add other data items of course, but in our
example we are done for now. We insert the formula to Excel by hitting the
button on the right bottom.
2.2.2 Time Series request
The formula builder also has two different options for time series. The first way is to change the
data items to time series ones. To do so, click on the button in the top left corner. This will
give you a different selection of data items. This option is mostly used for prices and returns.
For instance, the close price can be found in the ‘Common’ section. In the top bar it is
possible to select the frequency of data to retrieve. Choose the interval you want in order to
get the right amount of data. To define a certain time period we click on the
button and select a start and end date.

FINANCE DATA: THOMPSON REUTERS EIKON 4.0
6
Picture 2: TS Request for 1y
However, one will quickly see that barely any of the data items are available in the time
series request. For instance, there’s no data item for the total revenue available as TS item.
This is because Eikon differs between “actual” time series data and “several static requests
from different periods”. Mostly, “actual” time series data are defined as items that seem
rather useless without including time as a variable. On the other hand, there are items that
can be interesting to look only at one time. Those are found in the menu for static data. But
by adjusting the parameters of the data item, it is possible to download static data from
different period, therefore including a time factor.
2.2.3 Layout options
One aspect that can be quite tricky in the formula builder is getting the layout right.
Sometimes it is straight forward, for instance if you have only one instrument and only one
data item. (This will return a 1x1 matrix). But once you have several instruments with several
data items and also time series data, you have to be careful to not get confused by all the
data.
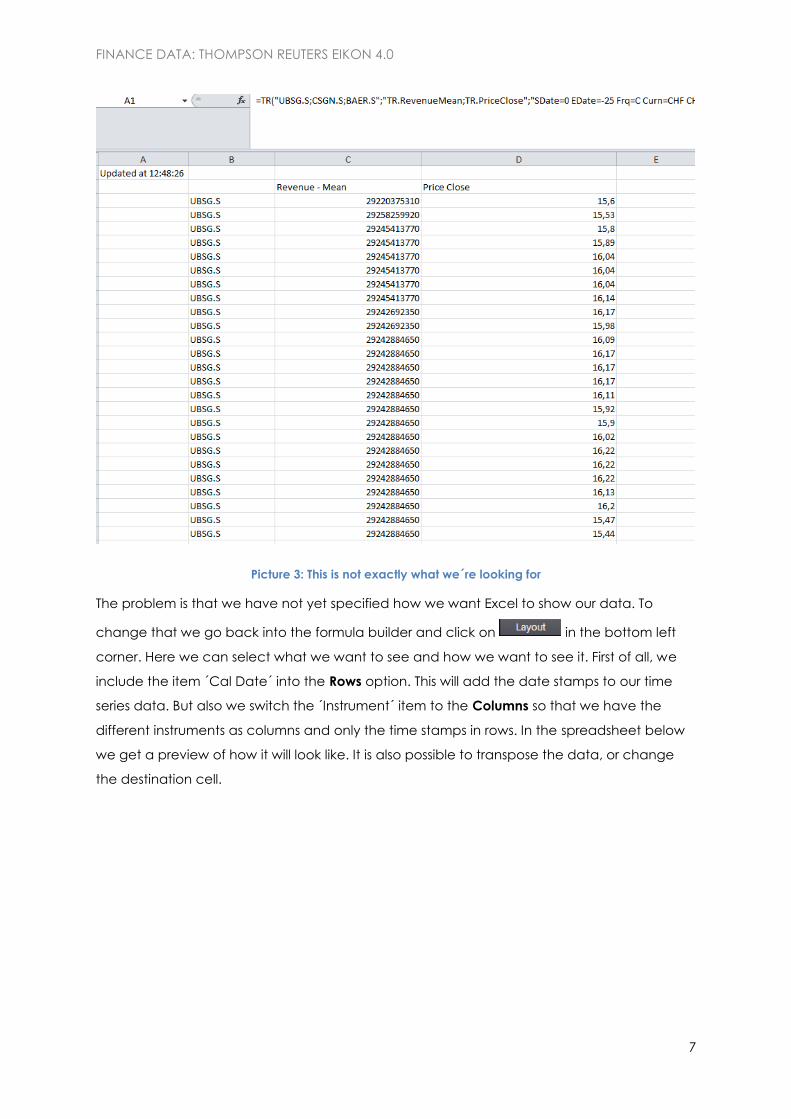
To show you a way to do it, let´s assume we have 3 instruments, and we want to look at the
closing price and the revenue mean for the last 25 dates. Entering this in the formula builder is
not too difficult, but when we just insert this we end up with something looking like this:
FINANCE DATA: THOMPSON REUTERS EIKON 4.0
7
Picture 3: This is not exactly what we´re looking for
The problem is that we have not yet specified how we want Excel to show our data. To
change that we go back into the formula builder and click on in the bottom left
corner. Here we can select what we want to see and how we want to see it. First of all, we
include the item ´Cal Date´ into the Rows option. This will add the date stamps to our time
series data. But also we switch the ´Instrument´ item to the Columns so that we have the
different instruments as columns and only the time stamps in rows. In the spreadsheet below
we get a preview of how it will look like. It is also possible to transpose the data, or change
the destination cell.

FINANCE DATA: THOMPSON REUTERS EIKON 4.0
8
Picture 4: This looks much better already
Once we insert it into Excel we get a proper spreadsheet which is easy to read:
Picture 5: Finished layout
TIP: By putting Instrument over Field in Columns we can change how the data is aligned on
the x-axis. In that case, it would first put both items from UBS and then both items from Credit
Suisse.
TIP: If you are encountering a problem that different firms reported their numbers at different
dates, check out Appendix A.

FINANCE DATA: THOMPSON REUTERS EIKON 4.0
9
2.3 Templates
Thomson Reuters Eikon includes templates that can be used to directly download data or
also to get an idea how to build your specific formula. The Template Library can be found
next to the formula builder button in Excel. There are 226 templates available and they are
categorized in the menu on the left. Read through the description to find the fitting one for
you and open it with the button. This will open a new Excel sheet with the template.
TIP: Backwards Engineering: If the template does not yet fully fit your needs, find the cell
where the formula is entered and try to alter it with the formula builder. The cell is often
denoted with ´ Updated…´
2.4 IPO Price – Deal Screener
Unfortunately, the price at the initial public offering is not always (actually almost never)
available in the formula builder. Nevertheless, there is a way to retrieve IPO data with Eikon.
2.4.1 Install Deal Screener
Before we can start downloading data we first need to install an extension to Eikon. In the
‘Thomson Reuter’ menu of Excel we select ‘Options’. This is the settings menu for Eikon. In the
menu to the left we go on ‘Apps’. This is where we see the various apps that we are using in
Excel. The app we want to download is called ‘Deal Analytics’. By clicking on ‘enable’ it will
download the app. After doing so the system asks us to restart Excel and Eikon.
2.4.2 Using Deal Screener
In the Eikon navigation in Excel there is now a new section available. It’s called ‘Deals’ and
allows us to open the ‘Deal Screener’. In order to retrieve an IPO price we have to open the
‘Deal Screener’ which will open up a window from Eikon. The first thing we have to do is
changing the universe from ‘M&A Deals’ to ‘Equity deals’. This will access the database of all
the equity deals in a long time. We can now add filters to it and narrow the list down. Please
mind that there is a maximum of 3000 equities that you can download at a time.
There is one filter that is necessary in order to get IPO prices. Under ‘Popular Filter’ we can
select ‘Issue type’. This is where we enter ‘IPO’ as a criterion so it only selects IPO deals and
not others.
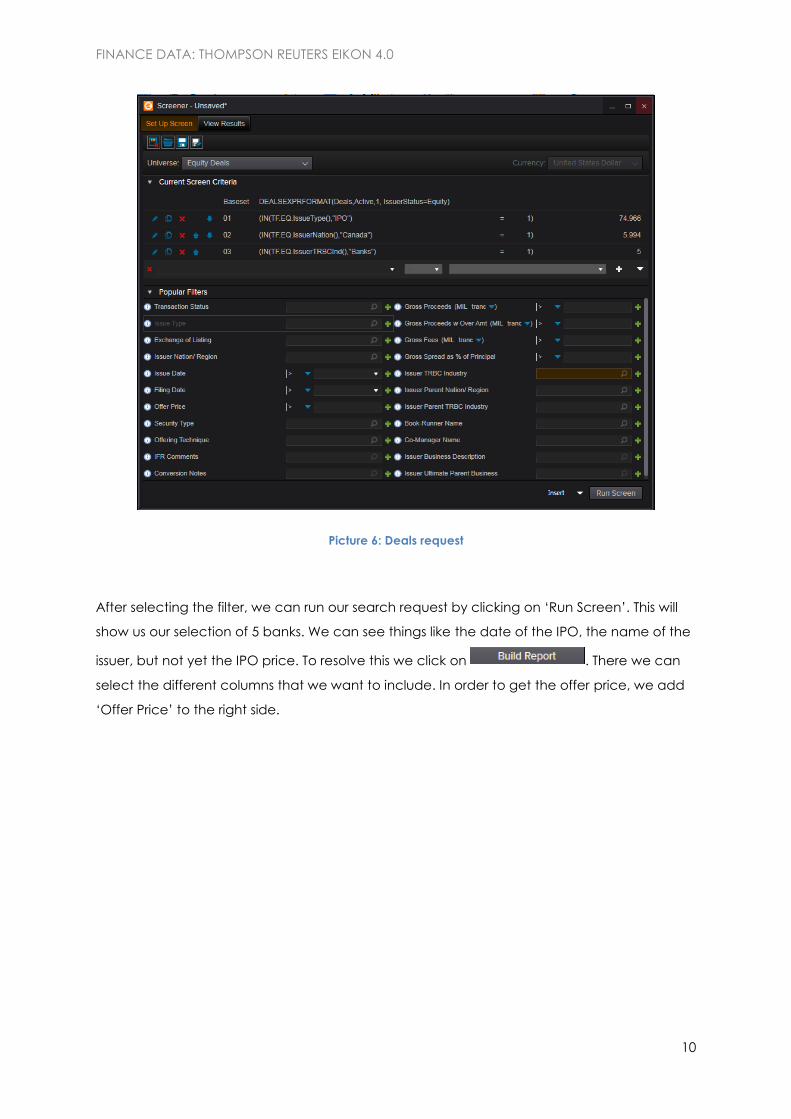
All the other filters can be adjusted manually. In this example we select ‘Canada’ as an
Issuer Nation/Region and ‘Banks’ as an Issuer TRBC Industry. In the end it should look
something like this:
FINANCE DATA: THOMPSON REUTERS EIKON 4.0
10
Picture 6: Deals request
After selecting the filter, we can run our search request by clicking on ‘Run Screen’. This will
show us our selection of 5 banks. We can see things like the date of the IPO, the name of the
issuer, but not yet the IPO price. To resolve this we click on . There we can
select the different columns that we want to include. In order to get the offer price, we add
‘Offer Price’ to the right side.

FINANCE DATA: THOMPSON REUTERS EIKON 4.0
11
Picture 7: Finished selection
TIP: Under ‘Add report items’ you can add even more useful variables like for instance ‘Price
4 Weeks after Offer’. Select whatever you think is useful.
The report is now ready to be exported to Excel. To do so we click in the ‘Insert’ button.
2.5 Operating with lists
When using the Formula Builder in Eikon it is often the case that you would like different
requests for the same selection of companies. Therefore, creating a list is crucial. There are
several possibilities to create lists and use them in Eikon. In this section we will look at a few of
them.
2.5.1 Creating in Datastream
One approach is to select the equities or bonds that you consider for your analysis in
Datastream. To see how to build a list and search for items in Datastream, please check out
the Datastream Manual.

FINANCE DATA: THOMPSON REUTERS EIKON 4.0
12
The way to use lists in Eikon is by referencing to a cell within the formula builder. To do this you
need to get a list of codes in Excel where you can link Eikon to. How to do this is explained
later. In this section, we first look at how to use the ´reference a cell´ option.
If we open the formula builder, on the top right corner there’s a small button which
allows us to select the range. So before we can select a range we need to create a range
with symbols that are readable by Eikon. Eikon is not able to read all identifiers, and there is
no list available of which Eikon can read and which it can’t. So if you have a specific
identifier you should just try it out and see if it works. The most common ones to use are ISIN
codes and RIC (Reuters Instrument Codes).
Our list from Datastream is saved in a mnemonic from Datastream itself. This means that we
can’t use them in Eikon. But what we can do is to open a static request in Datastream, insert
‘RIC’ as a data item and return it. This will give us a nice list of RIC codes which we can now
reference to in Eikon. (note that in my example I used the Datastream from the Eikon Excel. If
you use the normal Datastream Excel ‘RIC’ codes return no value. But you can use ‘ISIN’)
Picture 8: Retrieve list of RICs
FINANCE DATA: THOMPSON REUTERS EIKON 4.0
13
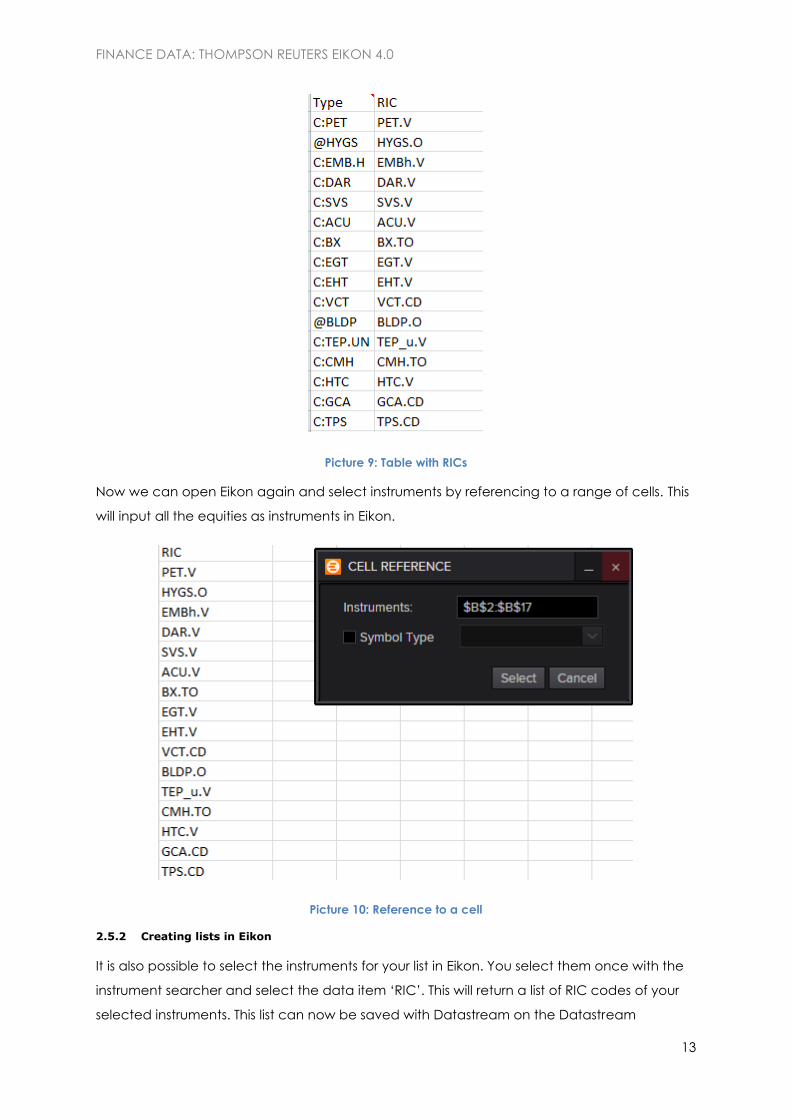
Picture 9: Table with RICs
Now we can open Eikon again and select instruments by referencing to a range of cells. This
will input all the equities as instruments in Eikon.
Picture 10: Reference to a cell
2.5.2 Creating lists in Eikon
It is also possible to select the instruments for your list in Eikon. You select them once with the
instrument searcher and select the data item ‘RIC’. This will return a list of RIC codes of your
selected instruments. This list can now be saved with Datastream on the Datastream

FINANCE DATA: THOMPSON REUTERS EIKON 4.0
14
database, and can accessed afterwards. (Also check out Section 3.1 ´Screener´ for creating
lists in Eikon’
Picture 11: Search for RIC
TIP: Also check out section 3.3 ´Portfolio and Lists´ for more information on lists.
3. Eikon Apps
3.1 Screener
Apart from the Excel plug-in, Eikon also has some great apps that can be useful. One of them
is the ‘Screener’. This app is used to select and filter equities and thereby creating a list that
can be used in the formula builder. To advantage to the searching system in the formula
builder is that the screener tool has a higher limit. Also, the screener offers better filters to filter
out relevant equities.
To open the screener, we first open the main program of Eikon, and then search for
‘Screener’ in the search bar on the top. The drop-down menu will allow us to open several
apps, and we select the top one to open the app.
In the menu on the left-hand side we can see the universe we are in and the filters to the
universe. One important aspect is to see that the current universe only contains active, public
and primary equities.

FINANCE DATA: THOMPSON REUTERS EIKON 4.0
15
Picture 12: Include in universe
Depending on your interest, you might have to change this as this might lead to biases. For
instance, the fact that it only includes equities that are still active might lead to a survivorship
bias.
The edit button allows us to change the universe and also exclude certain types of equities.
The next step is to filter out specific equity types with for instance one specific industry or one
specific country. This process is straight forward and works the same as always in Eikon.
For my selection in this example I searched for active and inactive equities with their
headquarter in Sweden which have a revenue bigger than SEK500,000,000.00 per year. As
you can see in picture 13, Eikon also gives an indication of how many equities fulfill my
requirements in a nice graph.
Picture 13: Screener Selection
FINANCE DATA: THOMPSON REUTERS EIKON 4.0
16
Before downloading this into Excel it is possible to add other columns. To do so, search for the
column you want to add in the search bar of the report menu. Once the selection is
complete we can download it into Excel by clicking on the button. All 242 equities are
now available with their RIC in Excel and can be used in the formula builder (for more on this,
check out section 2.4 ‘Operation with lists’).
The screener app has some other great features than just exporting lists. For instance, we can
get a scatter plot of two various variables of our selection. What this means is that we can
show the mapping of two variables directly in a graph.
To activate this option, we select ´Scatter plot view´ in the top right corner. We can now
select a variable for the x-axis and a variable for the y-axis. For my x-axis I chose Revenue
and for my y-axis I selected CO2 Equivalents Emission Total. This will give us a nice scatter plot
which can be used to find outliners or trends in an equity selection.
TIP: Save your screen so you can use it another time and continue working on it.
3.1.1 S&P 500
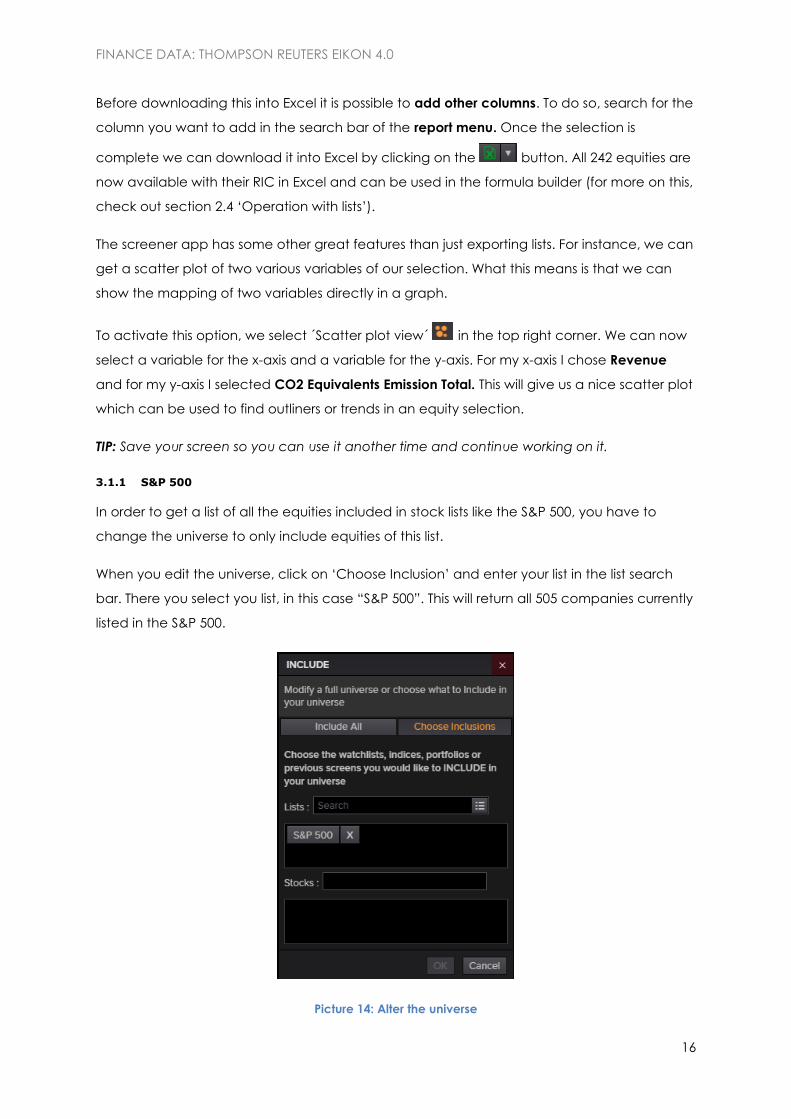
In order to get a list of all the equities included in stock lists like the S&P 500, you have to
change the universe to only include equities of this list.
When you edit the universe, click on ‘Choose Inclusion’ and enter your list in the list search
bar. There you select you list, in this case “S&P 500”. This will return all 505 companies currently
listed in the S&P 500.
Picture 14: Alter the universe

FINANCE DATA: THOMPSON REUTERS EIKON 4.0
17
3.2 Search Bar
Once Eikon is open you can search for any term in the search bar that appears in the top left
corner. This option is less used to retrieve data but more to just ´look a bit around´. Not only
equities can be found, but also fixed income, industries or countries.
Picture 15: Italy´s country overview
Even though it is not very handy to retrieve data, it is still possible sometimes to download
whole excel sheets or graphs. These can be simply opened in Excel.
3.3 Portfolio and Lists
Another handy app is the portfolio and lists app. It was already briefly mentioned in the
section 2.5 ´Operating with lists´. You can open this app by searching in the search bar. To
create a new portfolio, click on . Enter a name and a short name for your list and
select ´Create´.

FINANCE DATA: THOMPSON REUTERS EIKON 4.0
18
You can now add your equities manually by RIC, Name or any other way to find the equity.
But the easiest way to add multiple equities at a time is to filter them with the ´Screener´ app
and then send them to my lists.
If you have selected all your equities in the screener you can select the small drop down
menu on the right top corner.
There will be an option ´Add All to Existing List´ and you can select your freshly created list.
If you now want to use this list in Excel, you can find a button next to the formula
builder app. Clicking on it will open the Portfolio and List manager and will allow you to select
your list. Click on ´insert´ and your list will be downloaded in Excel with the corresponding RIC
and Name of the equity.
4. Appendix A: Specific Solutions
4.1 Different reporting dates
Sometimes it happens that we want to compare a variable over several periods of two
different equities. The problem is that not every company reports this variable at the same
time. So when we create a formula that reports us the yearly value over 4 years, and add
`Date´ to show us which value belongs to which year, we get something like this:
Picture 16: Different reporting dates

FINANCE DATA: THOMPSON REUTERS EIKON 4.0
19
Even though we just want to compare the years, the system cannot match the two dates
because they are not the same.
To solve this we go into the ´Layout´ menu in the formula builder. Instead of having ´Date´ in
our Row selection, we not choose the item ´Financial Period Absolute´. This will solve the
problem as this will only report the financial period and not a specific date.
Picture 17: Periods in financial periods
4.2 Working with CDS instruments
For some reason, the formula builder does not allow us to work with more than 25 Credit
Default Swaps at once. When you search for instruments in the formula builder it is possible to
send them. But once you have selected your data items and click on insert, nothing
happens.
To bypass this problem, we want to download the list of CDS into Excel first, and then
reference to the cells in the formula builder.
Step 1: Once you have applied all your search criteria for your CDS, click on search to see all
the results. In my case, I selected CDS of all German banks.

FINANCE DATA: THOMPSON REUTERS EIKON 4.0
20
Picture 18: CDS selection
Step 2: Click on ‘Copy All’ to save them in your memory (as in Ctrl + C). Open a new Excel file
and paste them with Ctrl + V.
Step 3: Open the formula builder and select the RICs as instruments for your new query.
Data items like ‘mid spread’ should be no problem to retrieve now.