Embed Size (px)
Citation preview

Sufian Eltayeb Mohamed
API/WPS 0803
FINANCE-GROWTH NEXUS IN SUDAN: EMPIRICAL
ASSESSMENT BASED ON AN APPLICATION OF THE
AUTOREGRESSIVE DISTRIBUTED LAG (ARDL) MODEL
Correspondence Sufian Eltayeb Mohamed , Arab Planning Institute in Kuwait, P.O. Box: 5834 Safat. 13059 Kuwait, Tel: (965) 4843130, Fax: (965) 4842935, E-mail address: [email protected]

1
Finance-Growth Nexus in Sudan: Empirical Assessment Based on an Application of
the Autoregressive Distributed Lag (ARDL) Model
Sufian Eltayeb Mohamed
Abstract This study investigates the effect of financial development on economic performance in Sudan over the period (1970- 2004). The short-run and long-run relationship between financial development and economic growth and other conditioning variables on economic growth are estimated by using the most recently developed autoregressive distributed lag (ARDL) approach to co- integration analysis proposed by Pesaran and Shin (1999).The results overwhelmingly indicate a weak relationship between financial development and economic growth in Sudan. Although the coefficient of M3/GDP is significant, it is negative, whilst the impact of credit to private sector by banks to real GDP is negative and insignificant. These findings may be attributed to the inefficient allocation of resources by banks, along with the absence of an appropriate investment climate required to foster significant private investment and promote growth in the long run, and to the poor quality of credit disbursal of the banking sector in Sudan. Moreover, the econometric analysis suggest that the speed of adjustment in the estimated models is relatively high and had the expected significant and negative sign.
دراسة تطبيقية مبنية على استخدام نموذج دراسة تطبيقية مبنية على استخدام نموذج دراسة تطبيقية مبنية على استخدام نموذج دراسة تطبيقية مبنية على استخدام نموذج : : : : علاقة التطور المالي بالنمو الاقتصادي في السودانعلاقة التطور المالي بالنمو الاقتصادي في السودانعلاقة التطور المالي بالنمو الاقتصادي في السودانعلاقة التطور المالي بالنمو الاقتصادي في السودان الانحدار الذاتي للإبطاء الموزعالانحدار الذاتي للإبطاء الموزعالانحدار الذاتي للإبطاء الموزعالانحدار الذاتي للإبطاء الموزع
ملخصملخصملخصملخص
1970 تهدف هذه الدراسة إلى اختبار تأثير التطور المالي على معدل النمو الاقتصادي في السودان للفترة
دار . 2004- نهجية الانح تخدام م وزع و باس باطؤ الم ي ذو الت ترك و ) ARDL( الذات تكامل المش ليل ال لتح
اران و شن ، تم اختبار العلاقة قصيرة و طويلة الأجل بين آل )1999(المستحدثة بواسطة آل من بيس
ودان ي الس نمو لاقتصادي ف الي و ال تطور الم رات ال ن مؤش ترك إلى . م تكامل المش بار ال د دل اخت و ق
ة ضعيفة ود علاق ودانوج ي الس نمو الاقتصادي ف الي و ال تطور الم ن ال امل . بي نوية مع ن مع بالرغم م ف
نقود الي عرض ال ناتج المحلى الإجم ال الإ آنسبة من ال ان تأثير يجم نما آ البة، بي انت س ارته آ إلا إن إش
نوح بواسطة البنوك التجارية على النمو الاقتصادي سالبا و غير معنوي تمان المم تغير الائ النتائج هذه . م
ال للموارد بواسطة البنوك، و غياب المناخ الاستثماري الملائم و ر الفع بتها إلى التخصيص غي يمكن نس
نوك في السودان نوح بواسطة الب تمان المم ة الائ بالإضافة إلى ذلك فقد أآد التحليل القياسي أن . إلى نوعي
ح بيا و أتض ة نس انت عالي درة آ نماذج المق ي ال تعديل ف رعة ال ائية س زوية الإحص لال المغ ن خ ك م ذل
. السالبة لمعامل نموذج تصحيح الخطأةشارالإو

2
1. Introduction
The financial sector usually plays a central role in the process of economic development and growth in a country. Banks as financial intermediaries play a key role in transforming deposits into financial assets. They channel funds from entities with surplus liquidity to those lacking it, thereby facilitating capital formation and trade. Banks also play a key role in filtering information by screening borrowers and monitoring their activities in financial systems characterized by incomplete and asymmetric information. Their improved efficiency is therefore quite crucial in ensuring the success of financial liberalization (Ephraim & Montfort, 2004). In this context, well-developed financial systems can be expected to accelerate the development process by channeling financial recourses to the most productive use. The most influential works that underpin this hypothesis are perhaps (Levine and King 1993a, 1993b) which suggest that better financial systems lead to more robust economic growth. However, despite the major role played by the financial sector in the process of growth and development, its role remains quite limited in many developing countries, especially sub-Saharan African countries. This due to the fact that, the financial sector in most countries remains highly fragmented and inefficient, protected from competition or is highly segmented and regulated. Moreover, financial systems in most SSA countries are dominated by a small number of banks that command heavy markets power, which undermines the efficiency allocation of resources. In the mid 1980s, many countries in sub-Saharan Africa (SSA) initiated financial Policy reforms as part of structural adjustment programs. As a result, most SSA governments shifted their economies from the state of "control" model to more market based systems as a means of promoting a stable economic environment. This was particularly relevant in the financial sector where it was hoped that streamlining the sector would stimulate domestic resource mobilization and increase the capacity of the banking system to support private sector participation in economic development. As in most developing countries, the Sudanese financial market is still young and underdeveloped following years of repression, political and economic instability up healed by long chronic civil war. To develop the financial sector the government embarked upon policies to reform it. These reforms, which took a variety of forms, started long years ago and can be traced back to the years following the independence in 1956, but these reforms had shown little improvements in the Sudan financial sector because they were not implemented under formal structural economic programs. As part of its economic and structural adjustment program, the government has adopted a comprehensive package of financial policy reforms in the early 1990s.The claimed objective is to create an improved business environment through relaxing some of the financial sector restrictions, modernize the financial sector to cope with the new achievements in the banking

3
industry and to build more efficient financial market to promote economic growth through a more efficient allocation of credit. This paper is concerned with the short and long run determinants of economic growth in the context of Sudan. It uses the bounds testing procedure to examine empirically the impact of the financial sector development on economic growth in Sudan by employing data for the period 1970-2004.Other objective of the present study is , to investigate the impact of the formal financial sector reform on economic issues in Sudan. Different economic and financial indicators are separately discussed to measure how far Sudan has benefited from the reform policy. In this study we are going to question whether financial development, in the sense of deregulated environment can be expected to act as “engine of growth” in the development process, and we argue in favor of a more cautions approach to financial sector reform. The paper proceeds as follows: section two, provides a brief review of the Sudanese economic development, besides an overview of the Sudanese banking system. The section also shows the experience of the financial sector reform in Sudan and its impact on economic issues. Section three, briefly reviews the extensive literature on the growth- finance nexus. Section four, specify the model and indicates the sources of data and setting up the econometric methodology used in the study. Section five, contains the main findings of the study, their analyses and assessments, and the final section contains policy implications and conclusions 2. Economic and Financial Development in Sudan 2.1 A Brief Review of the Sudanese Economic Development Sudan is the largest country in Africa(1), with significant human capital and vast natural resources base providing enormous development potential. Sudan is predominantly agricultural economy. The agricultural sector remains the most important sector in the economy; it contributes by 38.7 percent to GDP (2003) and employs about 80 percent of the population (1998). Despite of its major contributions to the Sudanese economy, the agricultural sector was crippled by a series of cumbersome bureaucratic procedures such as import licensing, registration of exports, reporting of stocks and restrictions of crop movement. These administrative interventions greatly discouraged production and exports. Moreover domestic policies were unstable, which was clearly manifested in the pricing and marketing of agricultural products .However, the declining of the growth rate of exports in last years is closely related to the declining share of agriculture in the domestic economies of Sudan and the expansion of the non-trade service sector. In the late 1970 and like other sub-Saharan African countries. Sudan‘s economy began to experience severe interdependent structural problems that inhabited economic growth (world bank, 1985). The average performance of the economy has worsened over the last two decades. And by the turn of the 1980’s
(1) Sudan is Africa's largest country (2, 5 million square kilometres) and the ninth largest country in the world.
4
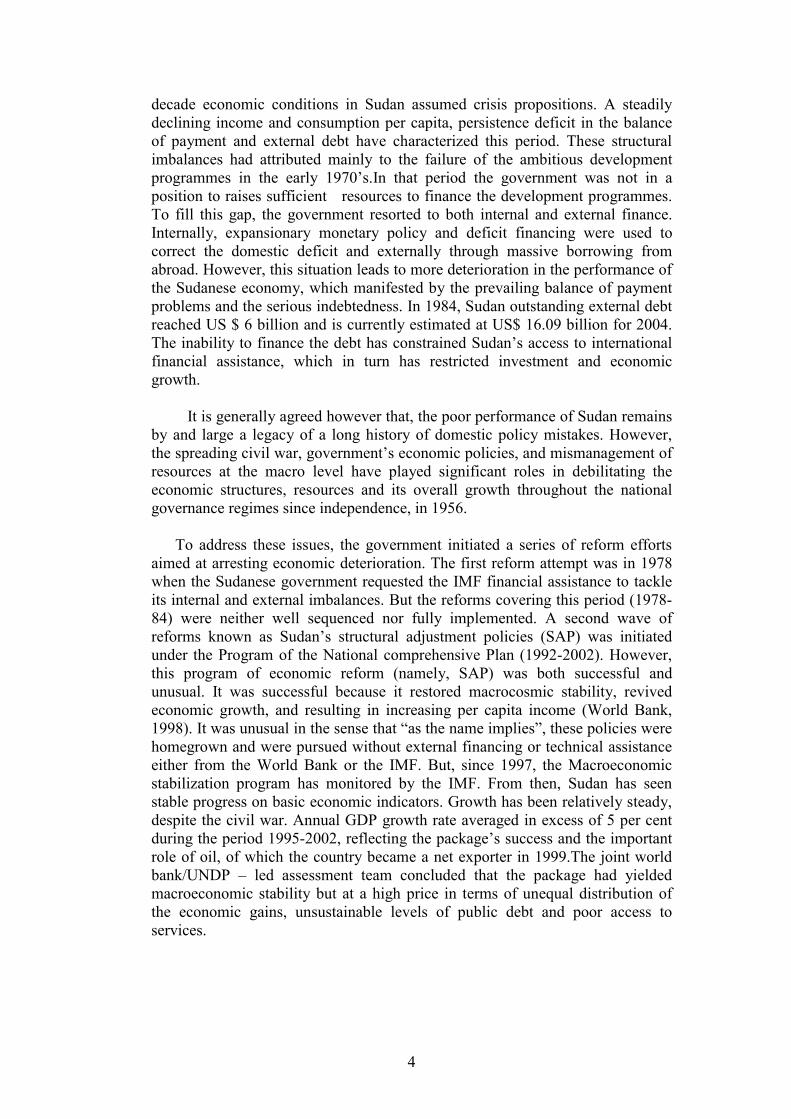
decade economic conditions in Sudan assumed crisis propositions. A steadily declining income and consumption per capita, persistence deficit in the balance of payment and external debt have characterized this period. These structural imbalances had attributed mainly to the failure of the ambitious development programmes in the early 1970’s.In that period the government was not in a position to raises sufficient resources to finance the development programmes. To fill this gap, the government resorted to both internal and external finance. Internally, expansionary monetary policy and deficit financing were used to correct the domestic deficit and externally through massive borrowing from abroad. However, this situation leads to more deterioration in the performance of the Sudanese economy, which manifested by the prevailing balance of payment problems and the serious indebtedness. In 1984, Sudan outstanding external debt reached US $ 6 billion and is currently estimated at US$ 16.09 billion for 2004. The inability to finance the debt has constrained Sudan’s access to international financial assistance, which in turn has restricted investment and economic growth. It is generally agreed however that, the poor performance of Sudan remains by and large a legacy of a long history of domestic policy mistakes. However, the spreading civil war, government’s economic policies, and mismanagement of resources at the macro level have played significant roles in debilitating the economic structures, resources and its overall growth throughout the national governance regimes since independence, in 1956. To address these issues, the government initiated a series of reform efforts aimed at arresting economic deterioration. The first reform attempt was in 1978 when the Sudanese government requested the IMF financial assistance to tackle its internal and external imbalances. But the reforms covering this period (1978-84) were neither well sequenced nor fully implemented. A second wave of reforms known as Sudan’s structural adjustment policies (SAP) was initiated under the Program of the National comprehensive Plan (1992-2002). However, this program of economic reform (namely, SAP) was both successful and unusual. It was successful because it restored macrocosmic stability, revived economic growth, and resulting in increasing per capita income (World Bank, 1998). It was unusual in the sense that “as the name implies”, these policies were homegrown and were pursued without external financing or technical assistance either from the World Bank or the IMF. But, since 1997, the Macroeconomic stabilization program has monitored by the IMF. From then, Sudan has seen stable progress on basic economic indicators. Growth has been relatively steady, despite the civil war. Annual GDP growth rate averaged in excess of 5 per cent during the period 1995-2002, reflecting the package’s success and the important role of oil, of which the country became a net exporter in 1999.The joint world bank/UNDP – led assessment team concluded that the package had yielded macroeconomic stability but at a high price in terms of unequal distribution of the economic gains, unsustainable levels of public debt and poor access to services.

5
2.2. Overview of the Sudanese Banking System 2.2.1 Structure of the Sudan’s Banking Sector Like many developing countries, the Sudanese financial sector was dominated by commercial banks’ rather than by bonds and equity markets, which require a mature system of accounting and financial information. The financial system in the Sudan has undergone significant developments since the establishment of the Bank of Sudan on February 22, 1960. Now, Sudan’s financial system consists of the central bank of Sudan (CBOS); 25 commercial banks, 16 of which are completely or mostly privately owned, and seven state-owned commercial banks. The sector also includes four specialized state-owned banks, two investment banks and a number of non-bank financial intermediaries (NBFIs), mainly insurance companies. Historically, Sudan’s financial system has been characterized by heavy government interventions and regulations, centralized lending by the central bank to public enterprises, absence of indirect monetary policy instruments, Lax bank supervision and an inadequate accounting system. According to (Kireyev, 2001), the Sudanese banks still remains very small even by the modest international standard as compared with Islamic banks in other countries. The total amount of deposits of the banking system has been hovering around $ 500 million since mid-1990 and is dominated by demand deposits with a share of over 70% whereas saving and investment deposits remain relatively small. According to him, this reflects the cash nature of the Sudanese economy where individuals prefer to have instant and easy access to their funds. It is apparently from the consolidating balance sheet of the central bank of Sudan that the commercial banking sector constitutes the major source of credit in Sudan. This can be reflected in the size and the amount of deposit liabilities deposited in the commercial banks. Due to the fact that deposit liabilities of non- banking financial institutions are relatively insignificant, a close approximation to the community’s aggregate savings in financial forms can be observed by the size of the deposit liabilities of the commercial banks. Table (1), shows the growth of the central government and private sector deposits with commercial banks for the period (1990-2001). It is relatively apparent from the table that private/pubic sector deposits dominate the total deposit liabilities of the commercial banks reaching 92.8% of the total in 1990 and 97.4% in 2001.The substantial increase in these deposits is attributed firstly to the rise in the commercial banks nominal interest rate to 8% (the period of the conventional banking system) and the rise in the profit margins of Murabaha (for the Islamic banking system) and secondly to the continuous spread of commercial banks branches.

6
Table 1: Growth of the Central Government and Private Sector’s Deposits with Commercial Banks – (SD 000’s)
Year Government
Deposits Public Institutions and
Private Deposits Total
1990 122 1582 1704 1991 172 2817 2989 1992 236 9209 9445 1993 639 16095 16734 1994 806 22630 23436 1995 315 41327 41642 1996 767 67026 67793 1997 400 96354 96754 1998 424 119689 120113 1999 3527 141992 145519 2000 6352 190872 197224 2001 7076 267112 274188
Source: Bank of Sudan Annual Reports (1990-2001). In general, commercial banks lending in Sudan is predominantly short term and is heavily concentrated in traditional sectors, such as trade, and profitable short-term activities. As table (2) below shows the whole pattern of lending has been dominated by the financing of foreign trade. This has been especially the case with respect to advances to finance exports which increased to 69% in 1990.
Table 2: Commercial bank’s lending by economic sector (SD 000’s)
Year Agriculture Industry Exports Imports Local Trade Others Total
1990 (15%) 0.08
(19%) 0.18
(69%) 1.22
(1%) 0.02
(5%) 0.08
(11%) 0.19
100% 1.77
1991 (26%) 0.27
(20%) 0.28
(19%) 0.26
(2%) 0.03
(14%) 0.19
19%) 0.27
100%) 1.4
1992 (34%) 1.12
(14%) 0.46
(17%) 0.57
(1%) 0.04
(12%) 0.38
(22%) 0.74
(100%) 3.31
1993 (53.4%) 1.865
(15.7%) 728
(21.9%) 1.154
(0.8%) 43
(6.0%) 318
(20.2%) 1.066
(100%) 5.273
1994 (29.3%) 2.946
(18.3%) 1840
(22.2%) 2.236
(1.1%) 105
(5.6%) 567
(23.5%) 2.379
(100%) 10.073
1995 (24.7%) 2.579
(18.0%) 2.618
(27.1%) 3.947
(8.5%) 1.227
(2.9%) 419
(18.8%) 2.7
100% 14514
1996 (26,5%) 8.997
(18.8%) 6.643
(19.6%) 6.643
(5%) 1.705
(3.6%) 1.216
(26.5%) 9.002
(100%) 33.948
1997 (30.5%) 12.522
(17.8% 7.284
(20.4%) 8.387
(2.1%) 857
(4.2%) 1.738
(2550 10.766
(100%) 41.556
1998 (33.3%) 16,763
(18.8%) 8.908
(17.1%) 8.114
(0.7%) 325
(4.3%) 325
925.8%) 12.235
(100%) 47.383
1999 (30.0%) 14.833
(15%) 7.784
(17%) 8.359
(3%) 1.519
(6%) 2.816
(30.0%) 14.833
(100%) 48.732
2000 (22.5%) 17.807
(10.5%) 14.035
(21.2%) 16.839
(1.4%) 16,839
(10.4%) 8.243
(33.9%) 26.867
(100%) 79.224
2001 (7.6%) 19.605
(14.8%) 16.445
(15,7%) 17.726
(3.7%) 4.106
(18.8%) 20.900
(29.2%) 32.558
(100%) 111.340
2002 14.3% 22.857
13.0% 20.850
13.7% 21970
4.4% 7.078
22.6% 36.230
32.0% 51.055
100% 160.020
2003 12.5% 26.881
11.4% 24.637
12.70% 27.512
0.50% 1.107
32.3% 69.735
30.60% 66.177
100% 216.028
2004 9.50% 27.339
11.50% 32.820
10.20% 29.129
1.20% 3.328
36% 103.832
31% 89.470
100% 285.964
*Numbers in brackets shows percentage of sector of finance to total finance Source: Bank of Sudan Annual Reports (1990-2004).

7
Despite the fact that, the agricultural sector in Sudan constitutes the backbone of the Sudanese economy, but advances to this sector is relatively small. Commercial bank’s lending to agriculture was minimal and accounted for less than 1% of their total credit prior to 1990.With the aim of pooling resources for increased lending to agriculture a commercial Banks Consortium (CBC) was formed in 1992 .As a result, Commercial banks were instructed to channel one-third of their mandatory lending to agriculture through CBC. This policy substantially raised the share of agricultural lending in total commercial bank credit in 1990s, reaching 35.3 in 1993. This trend has been gradually reversed since the start of the financial reform and liberalization program in 1997.By 2003, lending to agriculture amounted to only 12% of total bank credit (Elhiraika, 2005).The decline of credit to agriculture and according to (Kireyev 2001) is mainly attributed to the fear of banks which consider the risk of extending credit to all sectors, other than trade as being unjustifiable high. Credit to all other sectors, in particular to agriculture, is perceived by all banks as an extremely risky business because about 85% of all non performing loans originate in agriculture. In addition, some Islamic modes of financing (e.g. Salam and Musharaka) do not seem to be operationally efficient, in financing agriculture. Under Salem, banks often cannot sell in-kind repayments at a price allowing them even to recover the value of the initial credit. Some banks are reluctant to enter in a Musharaka contract with the agricultural producers because this mode of financing requires bank’s participation in the management of the financed project, which banks are not always willing to do. Figure (1) below shows the flow of finance extended by the commercial banks by different mode of finance. The percentage share of all modes have increased expect Salam which has declined from SDD 16.1 billion in 2003 to SDD 24.6 billion in 2004.
Source: Bank of Sudan Annual Reports (2003-2004).
Figure (1) : Flow of Credit By Modes of Finance (2002-2004)
0
20,000
40,000
60,000
80,000
100,000
120,000
140,000
160,000
180,000
Murabaha Musharaka Mudaraba Salam Others
SDD
Billi
ons
2002
2003
2004

8
2.2.2 iFnancial Sector Reform(2) in Sudan It is widely recognized that financial liberalization is an integral part of financial sector development .As such; policies on trade liberalization, interest rate deregulation, capital account opening may have an important implication on financial development and hence economic growth. However, a large body of literature to address the issue of the importance of financial liberalization in facilitating economic development and growth has been undertaken by many economists (see for example, Schumpeter (1911), McKinnon (1973) and Show (1973). In Sudan, historical experience shows that sporadic attempts were undertaken to reform the financial system since independence in 1956.First attempts to reform the financial sector shown by the considerable attention that was given within the framework of the first economic plan to the importance of the financial sector for allocating credit for development projects. But, dissatisfaction with the banking institutions performance led the government to support “supply-leading finance approach”( 3 ) and thus got involved in the financial system by setting up specialized (4) financial institutions to cater for the financial needs of the different sectors of the economy. The second major development was the nationalization of the banking system in may 1970 as part of the whole nationalization policy adopted by Numiri regime. The third development was the adoption of the “Open-Door Policy” in 1977 to attract foreign investment and as a result both foreign and joint-venture commercial banks have been increased. However, among these processes of reforms, the islamization of the banking system in the early 1980’s following the announcement of the islamization of the entire Sudanese economy was the major financial sector reform in Sudan. Accordingly the banking sector became one of very few countries in the world with its financial system built completely on Islamic finance principles(5). The period since the early 1990’s has been the most crucial in recent economic history of Sudan as it is marked by the explicit commitment of the Sudanese government to a policy of market economy based on private sector. The government launched the Economic Reform and Structural Adjustment
(2) The term “financial reform” is used interchangeably with the terms “financial liberalization”, “financial deregulation: and “financial deeping”. Financial reform is the process of moving or substantially reducing financial market distortions created by government intervention in setting interest rates and allocating credit. Financial reform may be a gradual process or sudden dismantling of all repressive regulations (Wilbert O.Bascom, 1994, the economics of financial reform in developing countries. The Macmillan press, Ltd, London (3) The supply –leading approach aims to create more developed financial institutions to cater for financial services that are likely to induce investment and hence economic growth. (4) Four Specialized banks were established, the Agricultural Bank of Sudan (1959), the Industrial Bank of Sudan (1961), the Estate Bank of Sudan (1967) and the Sudanese Saving Bank (1974). (5) In addition to Sudan, there are only two other countries, Iran and Pakistan, that have fully adopted the Islamic financial system. Approximately 50 other countries operate conventional interest-based banking system alongside Islamic financing.
9
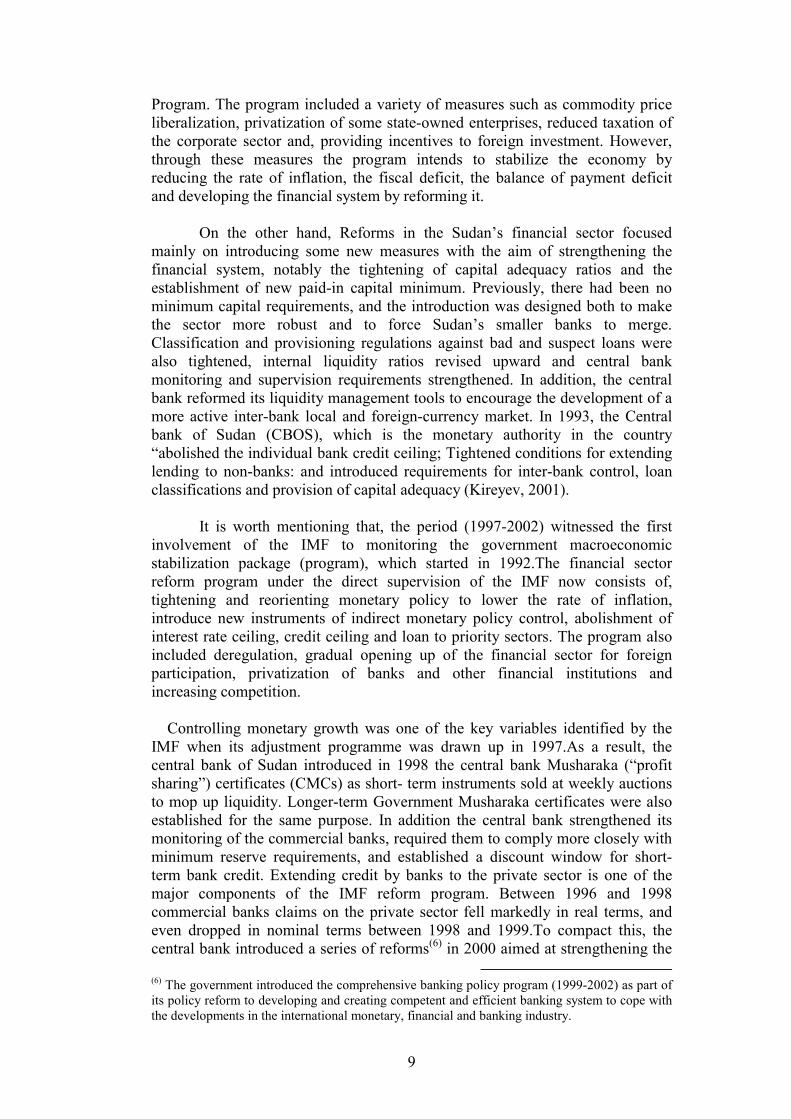
Program. The program included a variety of measures such as commodity price liberalization, privatization of some state-owned enterprises, reduced taxation of the corporate sector and, providing incentives to foreign investment. However, through these measures the program intends to stabilize the economy by reducing the rate of inflation, the fiscal deficit, the balance of payment deficit and developing the financial system by reforming it. On the other hand, Reforms in the Sudan’s financial sector focused mainly on introducing some new measures with the aim of strengthening the financial system, notably the tightening of capital adequacy ratios and the establishment of new paid-in capital minimum. Previously, there had been no minimum capital requirements, and the introduction was designed both to make the sector more robust and to force Sudan’s smaller banks to merge. Classification and provisioning regulations against bad and suspect loans were also tightened, internal liquidity ratios revised upward and central bank monitoring and supervision requirements strengthened. In addition, the central bank reformed its liquidity management tools to encourage the development of a more active inter-bank local and foreign-currency market. In 1993, the Central bank of Sudan (CBOS), which is the monetary authority in the country “abolished the individual bank credit ceiling; Tightened conditions for extending lending to non-banks: and introduced requirements for inter-bank control, loan classifications and provision of capital adequacy (Kireyev, 2001). It is worth mentioning that, the period (1997-2002) witnessed the first involvement of the IMF to monitoring the government macroeconomic stabilization package (program), which started in 1992.The financial sector reform program under the direct supervision of the IMF now consists of, tightening and reorienting monetary policy to lower the rate of inflation, introduce new instruments of indirect monetary policy control, abolishment of interest rate ceiling, credit ceiling and loan to priority sectors. The program also included deregulation, gradual opening up of the financial sector for foreign participation, privatization of banks and other financial institutions and increasing competition. Controlling monetary growth was one of the key variables identified by the IMF when its adjustment programme was drawn up in 1997.As a result, the central bank of Sudan introduced in 1998 the central bank Musharaka (“profit sharing”) certificates (CMCs) as short- term instruments sold at weekly auctions to mop up liquidity. Longer-term Government Musharaka certificates were also established for the same purpose. In addition the central bank strengthened its monitoring of the commercial banks, required them to comply more closely with minimum reserve requirements, and established a discount window for short-term bank credit. Extending credit by banks to the private sector is one of the major components of the IMF reform program. Between 1996 and 1998 commercial banks claims on the private sector fell markedly in real terms, and even dropped in nominal terms between 1998 and 1999.To compact this, the central bank introduced a series of reforms(6) in 2000 aimed at strengthening the
(6) The government introduced the comprehensive banking policy program (1999-2002) as part of its policy reform to developing and creating competent and efficient banking system to cope with the developments in the international monetary, financial and banking industry.

10
(mainly state-owned) banks and increasing their commercial independence, while tightening supervision. The reform program also included policies intended to reduce the role of the state in the management of banks. As such, there has been a move toward privatizing or part privatizing the state-owned commercial banks. The first bank to be sold is the Bank of Khartoum (Sudan’s oldest commercial bank), following a government announcement in late 2002 that it was seeking to sell a 74% stake to private investors, with the remaining 26% staying in state hands. The state-run agricultural bank (one of four specialized banks alongside the Real Estate bank, the saving and Social Development bank and the Workers bank) has also been the subject of restructuring. In addition, and to comply with the international standards on banking regulations, banks were required to meet the prudential ratios designated by the Basle committee. 2.2.3 The Impact of Reforms(7) Following the reforms, financial intermediation activity has certainly experienced relative expansion. The bank deposits have increased from around 6 per cent of GDP in 1996 to 10.6 percent in 2002.Simalrly, the ratio of M3 to GDP rose from 9 per cent in 1997 to 11, 12, 14 per cent in 2000, 2001, 2002 respectively. The other financial indicators such as non-performing loans, capital adequacy ratio and paid-up capital also, shows relative improvements (see Tabe3 and 4).
Table 3: Selected Monetary Ratios in Sudan: 1990-2002
Year M2/GDP Ratio
Velocity GDP/M2
Currency with the public / M1
Ratio M3/RDP
Ratio Total bank
Deposits / GDP Ratio
1990 17 0.42 47 20 8.9 1991 14 0.37 49 18 7.4 1992 15 0.30 67 21 11 1993 16 0.35 70 21 9.5 1994 14 0.46 60 17 9.9 1995 13 0.29 60 17 10.1 1996 9 0.76 58 11 6.1 1997 8 9.97 58 9 6.1 1998 8 9.6 63 9 6 1999 10 9.5 64 9 5.9 2000 11 8.57 61 11 6.6 2001 12 8,7 56 12 8.1 2002 14 7.8 55 14 10.6
Source: World Bank development indicators, 2005 and own calculations based on bank of Sudan annual reports (various issues)
(7) For more details on the impact of financial sector reform see (Kireyev, 2001).
11
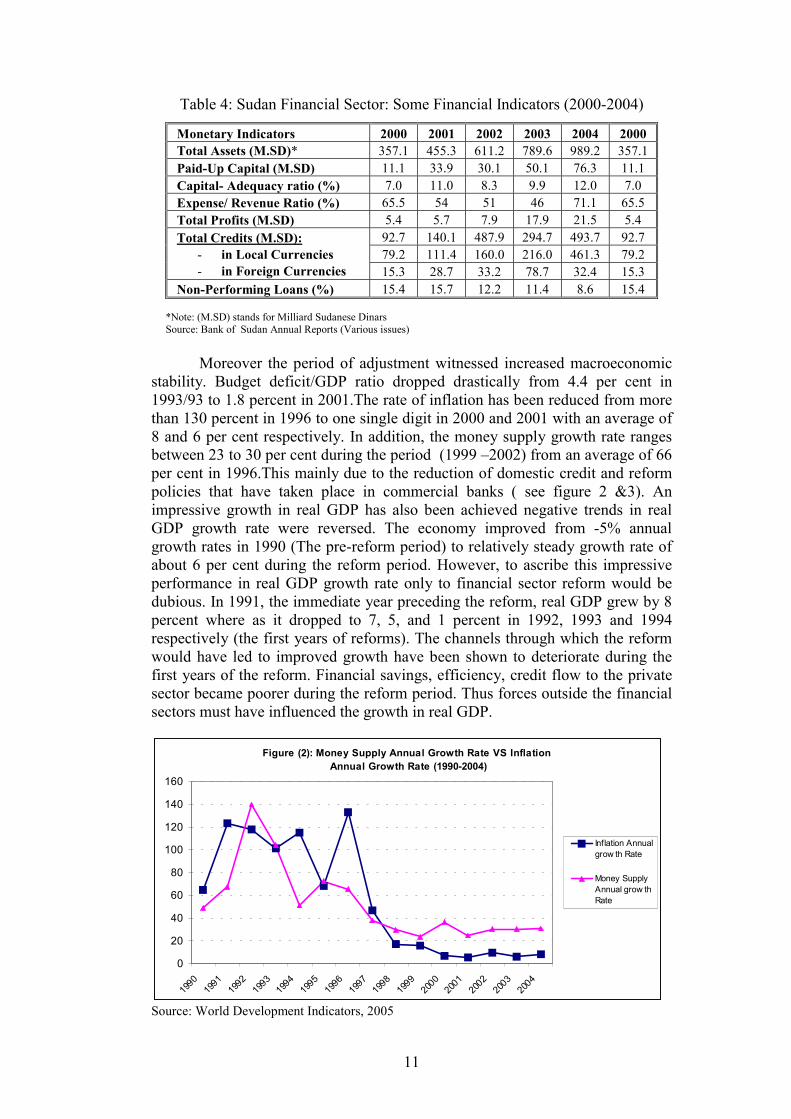
Table 4: Sudan Financial Sector: Some Financial Indicators (2000-2004)
Monetary Indicators 2000 2001 2002 2003 2004 2000 Total Assets (M.SD)* 357.1 455.3 611.2 789.6 989.2 357.1 Paid-Up Capital (M.SD) 11.1 33.9 30.1 50.1 76.3 11.1 Capital- Adequacy ratio (%) 7.0 11.0 8.3 9.9 12.0 7.0 Expense/ Revenue Ratio (%) 65.5 54 51 46 71.1 65.5 Total Profits (M.SD) 5.4 5.7 7.9 17.9 21.5 5.4
92.7 140.1 487.9 294.7 493.7 92.7 79.2 111.4 160.0 216.0 461.3 79.2
Total Credits (M.SD): - in Local Currencies - in Foreign Currencies 15.3 28.7 33.2 78.7 32.4 15.3
Non-Performing Loans (%) 15.4 15.7 12.2 11.4 8.6 15.4
*Note: (M.SD) stands for Milliard Sudanese Dinars Source: Bank of Sudan Annual Reports (Various issues)
Moreover the period of adjustment witnessed increased macroeconomic
stability. Budget deficit/GDP ratio dropped drastically from 4.4 per cent in 1993/93 to 1.8 percent in 2001.The rate of inflation has been reduced from more than 130 percent in 1996 to one single digit in 2000 and 2001 with an average of 8 and 6 per cent respectively. In addition, the money supply growth rate ranges between 23 to 30 per cent during the period (1999 –2002) from an average of 66 per cent in 1996.This mainly due to the reduction of domestic credit and reform policies that have taken place in commercial banks ( see figure 2 &3). An impressive growth in real GDP has also been achieved negative trends in real GDP growth rate were reversed. The economy improved from -5% annual growth rates in 1990 (The pre-reform period) to relatively steady growth rate of about 6 per cent during the reform period. However, to ascribe this impressive performance in real GDP growth rate only to financial sector reform would be dubious. In 1991, the immediate year preceding the reform, real GDP grew by 8 percent where as it dropped to 7, 5, and 1 percent in 1992, 1993 and 1994 respectively (the first years of reforms). The channels through which the reform would have led to improved growth have been shown to deteriorate during the first years of the reform. Financial savings, efficiency, credit flow to the private sector became poorer during the reform period. Thus forces outside the financial sectors must have influenced the growth in real GDP.
Figure (2): Money Supply Annual Growth Rate VS Inflation Annual Growth Rate (1990-2004)
0
20
40
60
80
100
120
140
160
1990
1991
1992
1993
1994
1995
1996
1997
1998
1999
2000
2001
2002
2003
2004
Inflation Annualgrow th Rate
Money SupplyAnnual grow thRate
Source: World Development Indicators, 2005

12
Figure (3): GDP Growth Rate VS Money Supply Annual Growth Rate
-20.00
0.00
20.00
40.00
60.00
80.00
100.00
120.00
140.00
160.00
1990 1991 1992 1993 1994 1995 1996 1997 1998 1999 2000 2001 2002 2003 2004 2005
GDP growth rate
Money Supplyannual growth rate
Source: World Development Indicators, 2005 To sum up, the reform policy shown some progress specially in the relative success of stopping the disintermediation process. Some indicators have been improved during the reform period but still remains lower if compared with other developing countries. For instance, the ratio of broad money to GDP is about 10 percent in Sudan, compared with 30 to 40 percent in Pakistan, Kenya and Tanzania, and 50 to 90 percent in GCC countries (Jbili et. al., 1998). However, in many respect, the financial sector is far to achieve the full efficiency since some recent reforms have not already produced their expected effect especially those designed to promote long-term savings mobilization and financing investment. 3. Financial Sector Development and Growth: A Brief Review of the Literature Financial systems have long been recognized to play an important role in economic development and growth. Their role in economic growth has attracted much interest among academics, policy makers and economist around the world and has resulted in a large body of literature, both at the theoretical and empirical levels, that addresses the potential links between financial development and economic growth.
The debate on the causal links between financial development and economic growth can be traced back to the pioneering contribution of Bagehot (1873), Schumpeter (1912), Gold Smith (1955). Cameron (1967), Hicks (1969), McKinnon (1973) and Show (1973). They all emphasized that; the financial sector would be a catalyst of economic growth if it were developed and healthy. However, well-functioning financial systems are able to mobilize savings, allocate resource efficiently, pooling risks, induce liquidity, and reducing transaction costs. In recent years, latter studies both theoretical and empirical have been carried out to examine the nature of the relationship between financial development and economic growth. Studies conducted by King and Levine (1993a, 1993b, 1993c), Rajan and Zingales (1998), Gibson and Tsakalatos (1994), Fry (1995), Levine and Zervos (1998), Okedokum (1998), all provide empirical evidence supporting this relationship. All point to the importance of an economy’s financial development for the growth of GDP real per capita income.

13
Throughout the survey of the literature, it was observed that, economists don’t all seem to agree on the importance of the role played by finance in promoting economic growth and consequently they hold different views regarding the theoretical link between financial development and economic growth. Economists such as Schumpeter (1991), Gold smith (1969), King and Levine (1993a, 1993b), Fry (1978, 1988), McKinnon (1973) and Show (1973), have argued that more developed financial system promote or “lead” economic growth. Goldsmith (1969)’ for example, was the first to reveal the positive correlation between financial development and economic growth. This early work served as the impetus for those other researcher to delve further into this aspect of growth theory. Moreover, Schumpeter (1911) has highlighted the role played by the banking sector in allocating the necessary funds for promoting long- run growth. He proposes that the services provided by the financial sector are essential drivers for innovation and growth. The above argument on the possible positive effect of the financial sector development on growth was also highlighted by McKinnon (1973) and show (1973). The McKinnon – Show School proposes that government quantitative restrictions on the banking system (such as interest ceiling, high reserve requirement and direct credit programs) restrain the volume and productivity of investment and impede the process of economic growth. The endogenous growth literature has revealed the same argument that financial development has a positive effect on economic growth (se for example, Bencivenga and Smith (1911), Greenwood and Jovanovic, 1990).
Contrary to the above hypothesis which states that, financial development lead economic growth, Robinson (1952) provides an alternatives view. She points out that finance does not exert a causal impact on growth. Instead financial development follows economic growth as a result of higher demand for financial services. In this case a financial institution is a mere reflection of the growth of the economic activity. Market participants simply acquire a demand for financial services that is a reflection of the entrepreneurial activities they are undertaking. Empirical support for this second view can also be found in some recent studies (Demetrides&Hussien (1996), Ireland (1994). So far, empirical studies for the effects of financial development on economic growth have produced mixed evidence. Patrick (1966) reached in his study the conclusion that causation runs from financial to economic development (i.e. a supply leading relationship) in the early stage of development while the direction of causation is reversed (i.e. a demand following relationship prevails) in the later stage. By employing the causality-testing framework proposed by Granger (1969), the same conclusion was arrived at by Fritz (1984) on the basis of data for Philippines.
In some cross- section study, Jao (1976) found no role for financial development in explaining per capita real GDP.But in another, Wai (1980) evaluated the effects of real value of domestic credit on real GDP by employing time series data for each of 13 developing countries and significant positive impacts were detected in virtually all the countries.

14
Many other empirical analysis of these issues have been undertaken since then, most of which provide further evidence of the positive relationship between financial sector development and growth (see for example, Lanyi and Saaloglu (1983), Gupta (1986), Glb (1989), Gertler & Rose (1994), Roubini &Sala-Martin (1992), Easter (1993) etc. King and Levine (1993a, 1993b, and 1993c) provided also the same evidence for 80 countries over the period 1960-1989.Using different measures of economic growth and financial development; they have shown that financial market development affects economic growth positively. The measures of economic growth they used are (a) the average growth rate of per captia real GDP (b) the average growth rate of capital, (c) the investment ratio (as a percentage of GDP), (d) a proxy of productivity investment. They used different financial development variables (a) liquid liabilities/GDP (b) commercial bank domestic credit/ (commercial bank domestic credit + central bank domestic credit), (c) claims on the non - financial private sector/domestic credit and (d) gross claims on private sector/GDP. They found evidence of strong, positive relationship between the various financial development indicators of growth. At the outset, it can be noted that, although numerous studies have been undertaken in this area on the importance of the impact of the banking sector development on economic growth, this paper contributes to this debate and improves on previous studies by using a new econometric technique called the ARDL framework proposed by Pesaran et al. (2001).The new framework reduces the shortcomings of small sample biases. 4. Model, Data Sources and Methodology 4.1 Model and Data Sources Following the literature (see, king and Levine 1993a, 1993b; Allen and Ndikumana 1998) and taking into account constraints relating to data availability in Sudan, we estimate the following model:
GRGDP = f (TRD, INF, INV, GEX, CPS, or M3Y) Economic growth is proxies with the variable GRGDP which is defined as the growth rate of real GDP. This is consistent with earlier studies (Gelb, 1989; Roubini and Sala-I-Martin, 1992; King and Levine, 1993a, 1993b; Demetriades and Hussein, 1996; Allen and Ndikumana, 1998; Rousseau and Wachtel, 1998 and Beck, Levine and Loayza, 2000) on financial intermediation and economic growth. This measure provides a high indicative power of the quality and quantity of economic growth. The selection of key variables to measure the level of financial services produced in the economy and to measure the extent and efficiency of financial intermediation is the major problem in an empirical study of this nature. Construction of financial development indicators is an extremely difficult task due to the diversity of financial services catered for in the financial system. What represent an appropriate measure of financial development (FD) seems to be controversial in the literature Several measures (proxies) representing the liquid

15
liabilities of the financial system, such as M1/GDP, M2/GDP, or M3/GDP have been widely used in econometric models (see, for example, Goldsmith 1969, Gelb, 1989, World Bank, 1989, King and Levine 1993a, 1993b).These measures are not good proxies of financial development since they are likely to measure the extent to which transactions are monetized rather than the ability of the financial system to channel funds from depositors to investment opportunities As an alternative measure, bank credit to the private sector is often argued to be a more superior measure of functioning financial development because it is a measure of the quality and quantity of investment (see De Gregario and Guidotti, 1995, Demetriades and Hussein, 1996 Levine et al, 2000 for similar argument). In the light of the preceding arguments, and to ensure robustness, we use two alternative measures of financial market development. The first proxy for financial development (FD) is the ratio of M3/GDP denoted by M3Y. M3 as a percentage of GDP has become a standard measure of financial depth and an indicator of the overall size of financial intermediary activity in cross-country studies. The choice of M3Y may be seen in accordance with the inside money model of McKinnon (1973) where the accumulation of real money balances is a required condition for investment. An increase in M3Y may be interpreted as an improvement in financial deeping in the economy.
The second proxy of financial development is the value of credit offers by the commercial banks to the private sector divided by GDP denoted by CBS is used to measure the private sector financing role of commercial banks and is in line with De Gregario and Guidotti (1995). This proxy does not include credit to the private sector by non-deposit money banks, the central bank; credit issued to governments or public enterprises and hence is an exclusive measure of the intermediary role of commercial banks. This proxy represents the financial intermediary in one of its main function namely that of credit intermediation by channelling savings to investors. .This indicator represents an accurate indicator (proxy) of functioning of financial development because it is a measure of the ability of the banking system to provide finance-led growth (Levine and Zervos, 1998).
Clearly, factors other than financial development impact on economic growth. We therefore introduce control variables that have been shown empirically to be robust determinants of growth in the literature. These control variables include, a measure of openness to trade (TRD), inflation (INF), gross investment as percent of GDP (INV) and, size of government (GEX). The effects of internal trade on growth are captured by openness variable, which is measured as the sum of imports and exports as a percentage of nominal GDP (Levine et al, 2000). Theoretically the effects of trade can be positive or negative, as such, the net effects can be determined only empirically. The inflation rate and extent of government expenditure are commonly used as indicators of macroeconomic stability (Eastrly and Rebelo, 1993; Fischer, 1993; Allen and Ndikumana 1993, and Levine et al, 2000). High inflation distorts economic activity and reduces investment in productive enterprises, thus reducing economic growth. This study uses change in inflation rate. Government expenditure could reduce economic growth because of the crowding out effect on

16
private investment and the inflationary pressure it can lead to (Allen and Ndikumana (1998). This study employs the ratio of government expenditure to GDP as a measure of the size of the government. The share of investment in GDP is considered as one of the few economic variables that have robust effect on economic growth (Levine and Renelt, 1992). In addition to the five variables described above we introduced a dummy variable which takes the value of zero from 1970 to 1990 and the value of one afterwards, to account for the islamization program of the banking system launched in Sudan during 1990’s. Accordingly, we estimate two versions of the model to investigate the impact of financial development on real output in Sudan, using annual time series data for the period 1970 to 2004.The two models are: Model 1: GRGDPt = α 0 + α l INVt+ α 2 ∆lnGEXt+ α 3 ∆lnTRDt+ α 4 ∆lnM3Yt+ α 5 TRENDt + α 6 D90t+ε1t Model 2: GRGDPt = β 0 + β l INVt +β 2∆ lnINFt +β 3 ∆ lnGEXt+β 4∆ lnCBSt+β 5 TRENDt +β 6 D90t+ε2t Here, INV is ln (I/ Yt-1) which refers to the log ratio of investment over real GDP from the previous year. ∆lnGEX is the log difference of government spending. ∆lnTRD is the log difference of trade openness. ∆lnINF is the log difference of inflation. D90 is a dummy variable and TREND refers to the time trend and ε is a white noise error term. Data are obtained from the World Bank’s Development indicators 2005 CD-ROM and various issues of the Central Bank of Sudan Annual Reports. All variables in our data set are expressed in natural logarithms and the time span of the study ranges annually from 1970 to 2004.The choice of annual data is due to the fact that most of the available data are reported annually. Furthermore, researchers like (Shiller and Perron, 1985; Campbell and Perron, 1991 and Hakkio and Rush, 1991) found that the power of the time series analysis with particular emphasis on co-integration lies in the span of data rather than the number of observations. It is for these reasons that in this study annual data is used. 4.2 Econometric Methodology This study utilises the newly proposed autoregressive distributed (ARDL) bounds test proposed by Pesaran, et al. (2001) to examine the co- integration relationship between financial development and economic growth..This procedure has several advantages over several methods available for conducting the co-integration test such as two-step residual based Engle-Granger (1987) test, and the maximum likelihood based Johansen (1991; 1995) and Johansen-Juselius

17
(1990) tests. The main advantage of ARDL modeling lies in its flexibility that it can be applied when the variables are of different order of integration (Pesaran and Pesaran1997). Another advantage of this approach is that the ARDL is more appropriate measure in the case of small samples, while the Johansen co-integration techniques still require large data samples for the purpose of validity. Given that our sample size is limited with a total of 35 observations only, conducting bounds test will be appropriate. Moreover, the ARDL modelling approach to co integration, involves OLS estimation of an unrestricted Error Correction Model ( ECM) of the following type as a first stage:
∆Yt = α0 + α1 T + ø1 Y t-1 + ø2 X 1, t-1 + ---- + øk X k, t-1 +∑−
=
1
1
p
iiβ ∆Yt-i + ∑
−
=
1
1
q
iø1
∆X1, t-i + --- ∑−
=
Φ1
1
qk
iki ∆X1, t-i + ε1t
Where ∆ is the difference operator, α0 is a constant, T is a time trend, Y is the dependent variable, Xi (i = 1, 2, . . . , k) are explanatory variables, ε is the error term, p and q are maximum lag orders, and the rest are coefficients. The implementation of ARDL approach involves two stages. At the first stage, the existence of the long-run relation between variables under investigation is tested by computing the F-statistics for testing the significance of the lagged levels of the variables in the error-correction form of the underling the ARDL model. Pesaran et al (1996) tabulated two sets of appropriate critical values for different number of regressors (k), and whether the model contains an intercept or trend or both. One set assumes that all the variables in the ARDL model are of 1(0), and another assumes all the variables are 1(1).If the F-statistic lies above the upper bound critical value for a given significance level; the conclusion is that there is a non-spurious long-run level relationship with the dependent variable. If the F-statistic lies below the lower bound critical value, the conclusion is that there is no long-run level relationship with the dependent variable. If it lies between the lower and the upper limits, the result is inconclusive. The general form of the null and alternative hypotheses for the F-statistic test is as follows: H0: (φ1 = φ2 = … = φk = 0) H1: (φ1 ≠ 0, = φ2 ≠ 0,. . ., φk ≠ 0) At the second stage of analysis one can estimate the long-run coefficient and make inference about their values. The estimate of the long-run coefficients may differ depending upon the model selection criteria used. In our case the Schwarz Bayesian Criterion (SBC) is used. In this step, the resulting underlying ARDL equation is also verified with all its statistical diagnostic properties in order to get unbiased and consistent/efficient estimates. The test for serial correlation, functional form, normality and heteroscedasticity are carried out to ensure that the models are well specified and congruent with data. The error correction version of ARDL equation can then, be estimated in this stage. The

18
adjustment parameter, as reflected in the coefficient of error correction term indicates the extent of adjustment of the dependent variable to the deviations from its long-run equilibrium value. 5. Empirical Results 5.1 Unit Root Test Results
Before analyzing the estimated results using ARDL approach to co integration, we first begin by investigating the non-stationarity (the presence of unit roots) in all variables by applying the Augmented Dickey–Fuller (ADF) test. These tests examine the null hypothesis that the considered variable has a unit root versus the alternative hypothesis that the variable is stationary. However, a necessary but not sufficient condition for co integration is that each of the variables should be integrated of the same order, and the order must be greater than or equal to one. The ADF tests results presented in table (5) clearly reveals that all the financial variables along with the selected growth variables are integrated at order 1, 1(1), i.e., they become stationary after first differencing.
Table 5: Unit Root Test Results
ADF test Variables levels Ist differenced GRGDP -I.21345 - 4.3433*** lnINV -0.54321 -6.04444** lnGEX - 2.10121 -3.2317** lnINF -1.56112 -5.1455*** LnTRD -2.21211 -6.0216* LnCBS -2.23451 -3.55555** LnM3Y -1.3212 -8.07288***
Note: (1) Critical values follow McKinnon (1991) (2) One, two and three asterisks indicate statistical significance at the 1%, 5% and 10% levels respectively.
In the first step of the ARDL analysis we tested for the presence of long-run relationships in model (1) and model (2).Given the fact that we have annual time series data and limited number of observations (35), the lag length will be restricted to two, that is, n = 2.Table (6) reports results of the bound test for the existence of a long run relationship. As shown in the table the calculated F-statistics in the two models, FRLGDP (.) is higher than the upper bound critical value. For model 1 FRLGDP (.) is higher than the upper critical value at the 1% level and in model 2, FRLGDP (.) is higher than the upper bound critical value at 5% level. This implying that the null hypothesis of no co-integration cannot be accepted and that there is indeed a co- integration relationship among the variables in each of the models.
Table 6: F-Statistics Test for Long Run Co-integration
Critical value bounds of the F-statistics 1% Level 5% Level Calculated F.statistics Model 1(0) 1(1) 1(0) 1(1) 1 3.668 4.978 2.945 4.088 6.876 2 3.668 4.978 2.945 4.088 7.432
*Critical values were obtained from Pesaran & Pesaran (1997)

19
Having found a long run relationship, we applied the ARDL method to estimate the long run and the short run coefficients. The results for each of the models are reported in tables 7 and 8 for the long-run and 9 and 10 for short -run respectively. For model I, table (7) shows the results of the long- run relationship between the dependent variable GRGDP and the other regressors. As expected, the investment variable has the expected positive sign. But despite the fact that, the level of investment exerts a positive and statistically significant impact on real GDP in the long run, the relationship between them in term of elasticises remains very weak i.e. a one percent increase in investment leads to a respective real GDP increase of 0.20 only. This indicates that investment in Sudan does not have an important effect on real GDP. This weak relationship between investment and real GDP is attributed usually to the prevailing situations of political instability, prolonged civil wars, and other factors such as uncertainty over agricultural leases which resulted in declining investment, particularly in major agricultural projects. The government spending variable also appears with the correct sign and is statistically significant at 10 percent level. The results suggest that a one percent increase in government spending leads to -0.396 decrease in real GDP. The negative relationship between government spending and real GDP is logical because governments usually tend to increase spending during poor economic conditions to boost the economy. Openness, measured as the sum of exports and imports as a share of GDP, does not seem to have a significant effect on real GDP.The estimated coefficient is positive (0.001) and statistically insignificant. The financial sector variable affects negatively real GDP in Sudan but the estimated coefficient is highly significant in the case of M3Y and insignificant with the credit variable. This result indicates – as we have mentioned before - that, forces outside the financial sectors may have influenced the growth in real GDP. The time trend which is significant shows that there has been an upward trend in real GDP, much of which could be explained in terms of the impact of the package’s success of the structural adjustment program and the export of oil. The dummy variable is negative and significant indicating that the implementation and adoption of Islamic modes of finance might cause adverse effects on real GDP.
Table 7: Long-Run Estimates of Model 1: Autoregressive Distributed Lag Estimates
Repressor Coefficient t-value P-value ∆ LnINV 0.200 4.1184 [0.000] ∆ LnINV(-1) 0.170 4.551 [0.002] ∆ LnGEX -0.396 -5.0467 [0.000] LnTRD 0.0011 0.038 [0.970] ∆ LnM3Y -0.3339 -5.679 [0.000] ∆ LnM3Y(-1) -0.26 -3.961 [0.001] CONST 19.484 13.6857 [0.000] TREND 0.01724 5.2638 [0.000] D90 -0.10594 -2.3003 [0.032]
Note: Dependent variable is GRGDP and ARDL (1,1,2,0,1) is selected based on Schwarz
Bayesian Criterion

20
For model 2, credit provided by the banking sector over GDP is used instead of M3Y as a financial variable, whereas inflation variable now included in model 2 to assess the strength of an independent link between financial sector development and economic growth. However, these replacements produce no significant change in the results obtained above in model 1(see 8).The investment variable again is significant and with low positive coefficient value. Government spending still has the expected negative sign but with marginal significant value. As expected the sign of inflation coefficient is negative. This is logical, because high rates of inflation can be expected to reduce economic growth through a variety of mechanisms which can influence both the rate of capital accumulation and the rate of growth of total factor productivity.
As has been assumed, private credit provided by commercial banks has a direct positive impact on real GDP in the long run and negative impact in the short run. This is justified by the fact that, private sector financing alone cannot augment economic growth as it has to be combined effectively with the other factors in the economy. In the short run if the mix of factors is such that there is too much private sector financing relative to the other economic factors, it may yield negative marginal returns and hence seem to have a negative impact on real GDP. However, in the long-run, all other factors are able to vary in tandem with the increased private sector financing by commercial banks and this is reflected in the observed positive impact on real GDP. The results of tables 7&8 shows that, the coefficient of credit to the private sector by banks is negative and insignificant in both the long and short run in Sudan, thus implying that increases credit to the private sector by banks will not boost private investment as the theory suggests. Our explanation for the negative impact of credit by bank on Real GDP could be that the institutional environment surrounding of its private sector is characterised by a lack of strong business and professional organisations. Furthermore, banks through which credits to the private sector are channelled, also, lack of personnel with experience and expertise in credit analysis. To sum up, the weak and insignificant relationship between financial development indicators and real GDP is rather surprising since economic theory suggests otherwise. These results are however not unique. Same results were obtained earlier by (e.g. Gertler & Rose, 1991; Gregorio & Guidotti, 1995).Similarly, Block and Tang (2003) in their testing for the causal relationship between financial development and economic growth of 75 countries they found that only 26 showed positive relationship with just one country having a significant coefficient .Al-Yousif (2002),attributed this negative correlation between the two variables to the act of business cycle and the weak regulatory environment where the financial institutions are operating in.

21
Table 8: Long-Run Results of Model 2: Autoregressive Distributed Lag Estimates
Repressor Coefficient t-value P- value ∆ LnINV 0.117 3.77 [0.001] ∆ LnINV(-1) 0.175 5.633 [0.000] ∆ LnGEX -0.234 -1.876 [0.074] ∆ LnINF -0.014 -1.914 [0.690] ∆ LnCBS -0.047 -1.711 [0.101] ∆ LnCBS (-1) 0.0160 0.564 [0.570] ∆ LnCBS(-2) -0.118 -3.944 [0.001] CONST 3.507 2.939 [0.000] TREND 0.0017 0.450 [ 0.032] D90 -0.489 -0.01 [0.986]
Note: Dependent variable is GRGDP and ARDL (1,0,1,0,2) is selected based on Schwarz Bayesian Criterion
5.2 Short Run Dynamics
The fact that the variables in our model are co- integrated provides support for the use of an error correction model mechanism (ECM) representation in order to investigate the short run dynamics. The estimates of the error – correction model are given in tables (9) and (10) for both model 1 and model 2. The adjusted R-squared of the error correction model is 0.75 and 0.79 in model 1 and model 2 respectively, implying that the fit of the models in each case is good. Also, the short-run models pass all the diagnostic tests for autocorrelation, functional form, normality of the residuals and heteroscedasticity, and supports the overall validity of the short run model.
It is known that the error correction term ECt-1 measures the speed of
adjustment to restore equilibrium in the dynamic model. The ECt-1 coefficient shows how quickly/slowly variables return to equilibrium and it should have a statistically significant coefficient with a negative sign. Bannerjee et al. (1998) states that a highly significant error correction term is further proof of the existence of a stable long-term relationship. Tables (9) and (10), shows that the error term ECt-1 is statistically significant in each model with the expected negative sign. This confirms once again, the existence of the co- integration relationship among the variables of these two models. The coefficients of ECt-1 are equal to (-0.37) and (-0.20) for models (1) and (2) respectively and imply that deviations from the long-term growth rate in GDP are corrected by 37 percent in model (1) and 20 percent in model (2) between two successive time periods. This means that the adjustment takes place relatively quickly in model 1 and 2.
Table 9: Error –Correction Estimates of Model 1 Repressor Coefficient t-value P-value ∆LnINV 0.098 2.76 [0.011] ∆LnGEX -0.460 -1.876 [0.004] ∆LnGEX1 0.323 -1.914 [0.023] ∆LnTRD -0.001 -1.711 [0.970] ∆LnM3Y 0.042 0.564 [0.515] ∆CONST 5.810 2.939 [0.000] ∆TREND 0,011 -0.450 [ 0.004] ∆D90 -0.106 -0.0176 [0.030] ECM(-1) -0.373 -4.142 [0.000] R2 0.75 S.E. of regression 0.035 R-Bar-Squared 0.62 F.Stat. F (10, 22) 7.949(0.000)
Note: ECM - ARDL (1, 0, 1, 0, 2) Selected based on Schwarz Bayesian Criterion

22
Table 10: Error –correction estimates of model 2 Repressor Coefficient t-value P-value ∆LnINV 0.1174 3.77 [0.001] ∆LnGEX -02338 -1.8775 [0.73] ∆LnINF -0.0138 -1.914 [0.068] ∆LnCBS -0.0472 -1.710 [0.100] ∆LnCBS1 0.1184 3.944 [0.001] ∆CONST 3.507 2.939 [0.007] ∆TREND -0.0017 0.450 [ 0656] ∆D90 -0.4899 -0.0176 [0.986] ECM(-1) -0.203 -2.562 [0.017] R2 0.79 S.E. of regression 0.033 R-Bar-Squared 0.68 F.Stat. F (10, 22) 9.815(.000) Note: ECM - ARDL (1, 0, 1, 0, 2) selected based on Schwarz Bayesian Criterion 5.3- Testing for the stability of the model
To complement this study it is important to investigate whether the above long run and short run relationships we found are stable for the entire period of study. The stability of the model is evaluated using the cumulative sum (CUSUM) and the cumulative sum of squares (CUSUMSQ) of the recursive residual test for structural stability proposed by Brown et al. (1975).A graphical representation of CUSUM AND CUSUMQ statistics are shown in fig.4 and fig.5. If the plot of the CUSUM and CUSUMSQ remains within the 5 per cent critical bound the null hypothesis that all coefficients are stable cannot be rejected. As it is clear from fig.4 and fig.5 ,the plots of both the CUSUM and the CUSUMQ are within the boundaries and hence these statistics confirm the stability of the long run coefficients of the RGDP function in model 1 and 2.
Fig. 4: Plots of CUSUM and CUSUMQ statistics for stability test (model1)
Plot of Cumulative Sum of Recursive Residuals
The straight lines represent critical bounds at 5% significance level
-5 -10 -15
0 5 10 15
1972 1977 1982 1987 1992 1997 2002 2004

23
Fig. 5: Plots of CUSUM and CUSUMQ statistics for stability test (model 2)
Plot of Cumulative Sum of Squares of Recursive Residuals
-0.5
0.0
0.5
1.0
1.5
1972 1977 1982 1987 1992 1997 2002 2004
Plot of Cumulative Sum of Recursive Residuals
The straight lines represent critical bounds at 5% significance level
-5 -10 -15
0 5 10 15
1972 1977 1982 1987 1992 1997 2002 2004
Plot of Cumulative Sum of Squares of
Recursive Residuals
The straight lines represent critical bounds at 5% significance level
-0.5
0.0
0.5
1.0
1.5
1972 1977 1982 1987 1992 1997 2002 2004

24
6. Conclusion and Policy Implications
The study attempts to evaluate the impact of financial development on real GDP in Sudan using a more robust econometric technique, the ARDL framework. Our findings suggest that that the financial development indicators does not have a direct impact on real output.These weak findings may be attributed to the inefficient allocation of resources by banks, along with the absence of an appropriate investment climate required to foster significant private investment and promote growth in the long run, and to the poor quality of credit disbursal of the banking sector in Sudan. Moreover, the econometric analysis of the model shows that the other macroeconomic variables provide little proof in explaining real GDP growth in Sudan. Although, the level of investment exerts a positive and statistically significant impact on real GDP in the long run, the relationship between them in term of elasticises remains very weak i.e. a one percent increase in investment leads to a respective real GDP increase of 0.20 only. Government spending and inflation variables appear with the correct sign but with mixed results in the short and long run. For example, government spending variable is statistically significant for model 1 in both the short and long run analysis, but it is insignificant in model 2 when we replacing trade openness by inflation variable. The results also showed that the error correction coefficients, which determine the speed of adjustment, had an expected and highly significant negative sign. Also, both models have passed all the diagnostic tests for autocorrelation, functional form, normality of the residuals and heteroscedasticity, and support the overall validity of the short run model.
As mentioned earlier, the financial sector reform conducted in Sudan in
the early 1990s was mainly to accumulate financial savings to finance productive investment endeavours and hence promote long term economic growth. But, the Sudanese experience of financial reform show that enhanced investment has not taken place yet, and that growth performance is far from being satisfactory in a country where 40 percent of the population lives below the national poverty line.
One of the most obvious implications of our results is that if Sudan is to realize its target growth rate it needs to create a stable political and economic climate conducive to investment. It follows from this that political stability and policies designated to raise investment are a precondition for Sudan’s economic success. Appendix 1 Main Islamic financial instruments used in Sudan Musharaka (Partnership): Under Musharaka the investment is necessarily be implemented between two or more parties, each of them contribute a share of the total capital. It works according to the following conditions; 1. The capital of Musharaka is generally paid in liquid money; however, payment in kind is also acceptable. In this case, the value of that property (not the property of per se) is considered for determining the percentage age of his
25
contribution to the capital and his obligations toward any liability. 2. A partner ought to enjoy full legal capacity to act on his own and on behalf of others (partners) with respect to the different dealings of Musharaka. 3. The means by which profits and losses are distributed among partners must be stated. 4. It is acceptable for a partner who contribute more effort than others and/or who enjoys more experience to take a %age in profit in lieu of his extra labor and expertise but losses are always incurred in direct proportion to the respective shares in capital. Mudaraba: Mudaraba is a special type of Musharaka. In a Mudaraba contract, one partner contributes the capital and the other partner provides labour and expertise. Common conditions for this mode of Islamic finance include: 1. Capital of Al-Mudaraba must be identified, known to the parties, and delivered to the investor (entrepreneur), and it should, under no circumstances, be a debt resting with the investor (entrepreneur). 2. The duty of the investor (entrepreneur) is to exert his best effort for investing the capital and at the same time to take all precautionary measures to protect the assets of the project under the Mudaraba financing. 3. The investor (entrepreneur) is a trustee. He is, therefore, under no obligation to guarantee any damage or loss incurred in the due process of investment. In this case, the damage and loss are borne by the investor (entrepreneur). However, the investor (entrepreneur) is pounded to pay any damages and bear losses if he transgresses the limits as a trustee, through will-full acts, negligence and breach of contract. 4. The distribution of the profit must be explicitly agreed to and in such a way as to ensure its distribution between the parties i.e. in percentage. However, losses are borne by the owner of capital. Muzara'a: Al Muzara'a is a type of sharecropping agricultural partnership. Traditionally the landowner would provide the land and inputs while the farmer provides labour. The yield is distributable among the partners in accordance with their predetermined contract. The increasing cost of inputs and production often lead to changing the formula. Some new forms may be illustrated as follows: the contract of Muzara'a may be undertaken by: 1. The landowner, the expert farmer and the owner of irrigation scheme. 2. The landowner who also undertakes to administer the farm and the bank that provides the inputs. Murabaha: The steps to be followed for the formation of this sale contract may be summarized as follows: 1. The intending buyer asks the would-be seller creditor (Islamic bank) to buy a commodity, the intending buyer promises to buy that commodity for mark-up price (margins) that is determined by the monetary authorities.

26
2. If the creditor (Islamic bank) agrees to enter into that transaction, it has to buy the demanded commodity from the original owner according to the guidelines of the commodity under financing. 3. Having that commodity, creditor (Islamic bank) has to make a fresh offer -depending of course on the previous negotiations and promise to the buyer. 4. According to the preponderant Shariah point of view and despite his previous promise, the buyer has the right to accept or reject that offer, and in case of acceptance, a valid contract of sale is concluded between the two parties. 5. In case of rejecting the offer, the ownership of the community rests with creditor (Islamic bank). Istisna'a Istisna'a is a sale contract whereby the buyer asks the seller to manufacture and sell a commodity well defined. Or that the seller commodity might be specified without necessarily manufacturing it, e.g. forming a contract with a factory for agricultural capital goods, and other inputs to be delivered by specification within a definite period of time. The dominate point of view among jurists is to the effect that the contract of Istisna'a is not obligatory on the two parties i.e. any one of them has the right to withdraw without a prior notice. However, among leading Hanafi's jurists there is an opinion that Istisna'a is as binding on its parties as any other pecuniary contract. This view is the more acceptable one for dealings in Sudan. Ijarah: Ijarah refers to a leasing contract in which some specified assets (e.g. tractor) are leased for use by a farmer/client according to an agreed price and for a specific period of time. Salam: Salam is a special type of sale contract, which is valid for both agricultural and industrial products. It is exactly the reverse of the deferred sale. In this contract, the price has to be paid immediately, whereas, the delivery of the commodity agreed on with specifications has to take place at a specific future period. The following terms must be satisfied for the validity of the contract of Salam. 1. The price (known as capital of Al-Salam) must be identified and known 2. The price should be paid immediately after the constitution of the contract. Nevertheless, a delay for short period is condensable according to the Maliki School. 3. The sold commodity must be known by specifications, in order to provide the seller with wide room to get the commodity from wherever it is available. 4. Its delivery should be postponed to a specific time in the future; therefore, the availability of the commodity in the market is usually the main determining factor for fixing a time in the contract. 5. To avoid uncertainty, the place of delivery has to be stated in the contract. 6. The seller ought not to have stipulated that he would honor his obligation from specific source such as his farm or farms in specific area. Therefore, if the seller is unable to secure the commodity due to its unavailability in the markets, the
27
buyer has two options; either to wait for its availability or to resign the contract and recover the paid up price. Source: Alherika (2004) Appendix 2: Recent Islamic Monetary Policy Tools in Sudan (1) Central Bank Musharaka Certificates (CMCs)
The Bank of Sudan introduces these certificates in June 1998.They were issued by the Sudan Financial Services Company (SFSC) on behalf of the Bank of Sudan and the government of Sudan. Essentially they represent a limited umber of shares in a special fund composed of the pool of government investments in nine commercial banks. The CMCs allow its owner to share with the bank of Sudan and the ministry of finance the benefit of investing in banks wholly or partially owned by them. The High Shari’a Supervisory Board (HSSB) approved these certificates for the banking system and other financial institutions as the first Islamic interest free instrument used to manage liquidity and conduct open market operations. The utilization of CMCs to conduct open market operations are considered to be more effective in influencing liquidity when compared with the statutory reserve ratio. If the bank of Sudan wishes to reduce liquidity of the commercial banks, then it would sell certificates with the amount of money it wants to withdraw from the banks, and the reverse is true, if it wishes to pump liquidity into the national economy.
(2) Government Musharaka Certificates (GMCs)
The Government Musharaka Certificates (GMCs) are also equity-based financial securities that were introduced in 1999, as an Islamic-oriented means for financing the budget deficit. It offers the Bank of Sudan an additional effective tool for liquidity management. These certificates allow their owner to share the profit or a loss resulting from the operations of all government companies and corporations whose equity capital constitutes the fund from which these certificates were issued. The issuing of these certificates achieves the following objectives: a- Managing liquidity on the macroeconomic level through open market
operations (OMO) b- Covering part of the budget deficit instead of printing more paper
money by the bank of Sudan. Accumulating national savings and encouraging investment through increasing awareness among the general public with the benefits associated with this investment.
28
References
Akaike, H., (1969). " Fitting Autoregressive Models for Prediction", Annals of the Institute of Statistical Mathematics, V.21, pp.243-247. Al hiraika (2006), Financial sector Policy and Poverty Reduction in Sudan. Economic Research Forum (ERF) ,Working paper (200411). Cairo, Egypt. Aging, F. and J. Ford (1998), “Financial Development, Liberalization and Economic Development in Indonesia, 1966-1996: Co integration and Causality.” University of Birmingham, Department of Economics, Discussion Paper No. 98-12. Bank of Sudan (1970 2004). Annual Reports. Different issues, Khartoum, Sudan Arestis, P. and P. Demetriades (1997), “Financial Development and Economic Growth: Assessing the Evidence.” Economic Journal, Vol. 107, No. 442, pp.783-799. Banerjee, A., Dolado, J., & Mestre, R. (1998) Error-Correction mechanism tests for cointegrationin a single equation framework, Journal of Time series Analysis, 19,pp.267-283. Barro, R.J. (1991), “Economic Growth in a Cross Section of Countries.” Quarterly Journal of Economics, Vol. 106, No 2, pp. 407-443. Beck, T., R. Levine, and N. Loayza (1999), “Finance and the Sources of Growth,” World Bank Policy Review Working Paper no. 2057. Bencivenga, V.and B.Smith, (1991), “Financial Intermediation and Endogenous Growth". Review of Economic Studies, Vol. 58, pp. 195-209. Bloch, H. and S. H. K. Tang (2003), “The role of Financial Development in Economic Growth". Progress in Development Studies, Vol. 3, No. 3, pp. 243-251. Boyd, J. and B. Smith (1992), “Intermediation and the Equilibrium Allocation of Capital: Implications for Economic Development.” Journal of Monetary Economics, Vol. 30, pp. 409-432. Demetriades, P. and K. Hussein (1996), Does Financial Development Cause Economic Growth? Time Series Evidence from 16 Countries. Journal of Development Economics, Vol. 51, pp. 387-411. Easterly, W. and S. Rebelo (1993), “Fiscal Policy and Economic Growth: an empirical Investigation". Journal of Monetary Economics, Vol. 32, pp 417-458. Elliott, G.; T. J. Rothenberg and J.H. Stock (1996), “Efficient Tests for an Autoregressive Unit Root", Econometrica, 64, pp. 813-836. El Shibly, Mekki (1984). Monetization, Financial Intermediation and Self Financed Growth in the Sudan: 1960/61 – 1975/80 – DSRC, Monograph No. 18- University of Khartoum, Sudan Fischer, S. (1993), “The Role of Macroeconomic Factors in Growth”. Journal of Monetary Economics, Vol. 32. pp 485-512.
29
Garcia, V.F. and L. Liu (1999), “Macroeconomic Determinants of Stock Market Development". Journal of Applied Economics, Vol. 2, No.1, May, pp. 29-59. Greenwood, J. and B. Jovanovic (1990), “Financial Development, Growth and the Distribution of Income". Journal of Political Economy, Vol. 98, pp. 1076-1107. Gregario, J.D., & Guidotti, P.E. (1995). Financial development and economic growth. World development, 23(3), 433-448. Gupta, K. (1984), Finance and Economic Growth in Developing Countries. Croom Helm, London. Johansen, S. (1988), “Statistical Analysis of Cointegrating Vectors". Journal of Economic Dynamics and Control, Vol. 12, pp. 231-54. Johansen, S. and K. Juselius (1992), “Maximum Likelihood Estimation and Inference on Co-integration with Applications to Demand for Money". Oxford Bulletin of Economics and Statistics, Vol.52, May, pp. 169 – 210. Jung, W. S. (1986), “Financial Development and Economic Growth: International Evidence. Economic Development and Cultural Change, pp. 30-45. King, R. and R. Levine, (1992), “Financial Indicator and Economic Growth in a Cross Section of Countries". PRE Working Paper No. 819, Washington: World Bank. King, R.G, and Levine, R. (1993c), “Financial and Growth: Schumpeter Might be Right". Quarterly Journal of Economics, Vol. CVIII, pp. 717-737. Kireyev, Alxei (2000). Financial Reform in Sudan. Streamlining Bank Intermediation. IMF Working Paper No.W/OI/53 Levine, R. (1997), “Financial Development and Economic Growth: Views and Agenda". Journal of Economic Literature, Vol. XXXV, pp. 688-726. Levine, R. (1998), The Legal Environment, Banks, and Long-Run Economic Growth”, Journal of Money, Credit, and Banking, Vol.30, No. 3, pp.596-613 Levine, R. (2004), Finance and Growth: Theory and Evidence.” NBER Working Paper Series 10766, National Bureau of Economic Research. Available on-line: http://www.nber.org/papers/w10766. Levine, R.; N. Loayza and T. Beck (2000), “Financial Intermediation and Economic Growth: Causality and Causes”. Journal of Monetary Economics, Vol. 46, pp. 31-77. Levine, R. and S. Zervos (1998), “Stock Markets, Banks, and Economic Growth”. America Economic Review, June, Vol.88, No. 3, pp. 537-58. Luintel, K. B. and M. Khan (1999), “A Quantitative Reassessment of the Finance-Growth Nexus: Evidence from a Multivariate VAR”. Journal of Development Economics, Vol. 60, pp. 381-405. Maddala, S.G. and I. Kim (1998) Unit Roots, Co integration and Structural Change, Cambridge University Press, Cambridge Murinde, V. and Eng, F.S.H, (1994), “Financial Restructuring and Economic Growth in Singapore". Savings and Development, Vol.18 No2, pp. 225-246.

30
Odedokun, M. O, (1998), “Financial Intermediation and Economic Growth in Developing Countries". Journal of Economic Studies, Vol. 25 No.3. pp. 203-224. Odedokun, M. O. (1989), “Causalities between Financial Aggregates and Economic Activities: The Results from Granger’s Test". Savings and Development, Vol.23, No. 1, pp. 101-111. Pesaran, M.H. and Y. Shin, 1996. Co-integration and speed of convergence to equilibrium. Journal of Econometrics, 71: 117-43. Pesaran, H.M. and B. Pesaran, 1997. Working with Microfit 4.0: Interactive Econometric Analysis. Oxford University Press. Pesaran, M.H., Y. Shin and R. Smith, 2001.Bounds testing approaches to the analysis of level relationships. Journal of Applied Economics, 16: 289-326. Pesaran, M.H. and R. Smith, 1998. Structural analysis of co-integration VARs. Journal of Economic Survey, 12:471-505. Ram, R. (1999), “Financial Development and Economic Growth: Additional Evidence". Journal of Development Studies. Vol. 35 No. 4, pp. 164-174. Roubini, N. and X. Sala-i-Martin (1992), “Financial Repression and Economic Growth". Journal of Development Economics, No. 39. Saint-Paul, G. (1992), “Technological Choice, Financial Markets and Economic Development". European Economic Review, Vol. 36, pp. 763-781. Seddighi H. R., K. A Lawler and V. A. Katos (2000), Econometrics: A Practical Approach, Routledge, London. Shan, J. Z., A.G. Morris and F. Sun (2001), “Financial Development and Economic Growth: an egg-and-chicken problem". Review of International Economics Vol. 9 No. 3, pp. 443-454. White, H. (1980), “A Heteroskedasticity-Consistent Covariance Matrix and a Direct Test for Heteroskedasticity". Econometrica, Vol. 48, pp. 817 – 838. Wood, A. (1993), “Financial Development and Economic Growth in Barbados: Causal Evidence”. Savings and Development, Vol.17, No.4.

31
Previous Publications
No Author Title
API/WPS 9701 الفرص والتحدياتالفرص والتحدياتالفرص والتحدياتالفرص والتحديات: : : : النفط والتنمية المستديمة في الأقطار العربية النفط والتنمية المستديمة في الأقطار العربية النفط والتنمية المستديمة في الأقطار العربية النفط والتنمية المستديمة في الأقطار العربية جميل طاهرجميل طاهرجميل طاهرجميل طاهر
API/WPS 9702 Riad Dahel Project Financing and Risk Analysis
API/WPS 9801 Imed Limam A SOCIO-ECONOMIC TAXONOMY OF ARAB COUNTRIES
API/WPS 9802 محمد عد�ان وديعمحمد عد�ان وديعمحمد عد�ان وديعمحمد عد�ان وديعالمعلومات لأسواق العمل لخليجيةالمعلومات لأسواق العمل لخليجيةالمعلومات لأسواق العمل لخليجيةالمعلومات لأسواق العمل لخليجيةمنظومات منظومات منظومات منظومات بلقاسم العباسبلقاسم العباسبلقاسم العباسبلقاسم العباس
API/WPS 9803 Adil Abdalla The Impact of Euro-Mediterranean Partnerships on Trade Interests of the OIC Countries
API/WPS 9804 رياض دهالرياض دهالرياض دهالرياض دهال حسن الحاجحسن الحاجحسن الحاجحسن الحاج
حول طرق الخصخصةحول طرق الخصخصةحول طرق الخصخصةحول طرق الخصخصة
API/WPS 9805 Ujjayant Chakravorty
Fereidun Fesharaki Shuoying Zhou DOMESTIC DEMAMD FOR PETROLEUM PRODUCTS IN OPEC
API/WPS 9806 Imed Limam Adil Abdalla Inter-Arab Trade and the Potential Success of AFTA
API/WPS 9901 Karima Aly Korayem Priorities of Social Policy Measures and the Interset of Low-Income People; the Egyptian Case
API/WPS 9902 Sami Bibi A Welfare Analysis of the Price System Reforms’ Effects on Poverty in Tunisia
API/WPS 9903 Samy Ben Naceur Mohamed Goaied The Value Creation Process in The Tunisia Stock Exchange
API/WPS 9904 بين النظرية وقابلية التطبيق في الدول العربيةبين النظرية وقابلية التطبيق في الدول العربيةبين النظرية وقابلية التطبيق في الدول العربيةبين النظرية وقابلية التطبيق في الدول العربية: : : : تكاليف التدهور البيئي وشحة الموارد الطبيعيةتكاليف التدهور البيئي وشحة الموارد الطبيعيةتكاليف التدهور البيئي وشحة الموارد الطبيعيةتكاليف التدهور البيئي وشحة الموارد الطبيعية نجاة النيشنجاة النيشنجاة النيشنجاة النيش
API/WPS 9905 Riad Dahel Volatility in Arab Stock Markets
API/WPS 9906 Yousef Al-Ebraheem Bassim Shebeb
IMPORTED INTERMEDIATE INPUTS: IMPACT ON ECONOMIC GROWTH
API/WPS 9907 Magda Kandil Determinants and Implications of Asymmetric Fluctuations: Empirical Evidence and Policy Implications Across MENA Countries
API/WPS 9908
M. Nagy Eltony Oil Price Fluctuations and their Impact on the Macroeconomic
Variables of Kuwait: A Case Study Using a VAR Model
API/WPS 9909 لى الوطن العربي بين الأما�ي والواقعلى الوطن العربي بين الأما�ي والواقعلى الوطن العربي بين الأما�ي والواقعلى الوطن العربي بين الأما�ي والواقعإإإإإعادة رؤوس الأموال العربية إعادة رؤوس الأموال العربية إعادة رؤوس الأموال العربية إعادة رؤوس الأموال العربية علي عبد القادرعلي عبد القادرعلي عبد القادرعلي عبد القادر
API/WPS 0001 التنمية البشرية ، تنمية الموارد البشرية والإحلال في الدول الخليجيةالتنمية البشرية ، تنمية الموارد البشرية والإحلال في الدول الخليجيةالتنمية البشرية ، تنمية الموارد البشرية والإحلال في الدول الخليجيةالتنمية البشرية ، تنمية الموارد البشرية والإحلال في الدول الخليجية محمد عد�ان وديعمحمد عد�ان وديعمحمد عد�ان وديعمحمد عد�ان وديع

32
No Author Title
API/WPS 0002 ربيةربيةربيةربيةبعض التجارب العبعض التجارب العبعض التجارب العبعض التجارب الع: : : : برامج الأفست برامج الأفست برامج الأفست برامج الأفست محمد �اجي التو�يمحمد �اجي التو�يمحمد �اجي التو�يمحمد �اجي التو�ي
API/WPS 0003 Riad Dahel On the Predictability of Currency Crises: The Use of Indicators in the Case of Arab Countries
API/WPS 0004 �سرين بركات�سرين بركات�سرين بركات�سرين بركات عـــادل العلـــــيعـــادل العلـــــيعـــادل العلـــــيعـــادل العلـــــي
مفهوم التنافسية والتجارب الناجحة في النفاذ الى الأسواق الدوليةمفهوم التنافسية والتجارب الناجحة في النفاذ الى الأسواق الدوليةمفهوم التنافسية والتجارب الناجحة في النفاذ الى الأسواق الدوليةمفهوم التنافسية والتجارب الناجحة في النفاذ الى الأسواق الدولية
API/WPS 0101 Imed Limam MEASURING TECHNICAL EFFICIENCY OF KUWAITI BANKS
API/WPS 0102 Ali Abdel Gadir Ali INTERNAL SUSTAINABILITY AND ECONOMIC GROWTH IN THE ARAB STATES
API/WPS 0103 Belkacem Laabas POVERTY DYNAMICS IN ALGERIA
API/WPS 0104 حالة الكويتحالة الكويتحالة الكويتحالة الكويت– ضرورات الاصلاح ضرورات الاصلاح ضرورات الاصلاح ضرورات الاصلاح ::::التعليم وسوق العمل التعليم وسوق العمل التعليم وسوق العمل التعليم وسوق العمل محمد عد�ان وديعمحمد عد�ان وديعمحمد عد�ان وديعمحمد عد�ان وديع
API/WPS 0105 دور وآفاق القطاع السياحي في اقتصادات الأقطار العربيةدور وآفاق القطاع السياحي في اقتصادات الأقطار العربيةدور وآفاق القطاع السياحي في اقتصادات الأقطار العربيةدور وآفاق القطاع السياحي في اقتصادات الأقطار العربية محمد �اجي التو�يمحمد �اجي التو�يمحمد �اجي التو�يمحمد �اجي التو�ي API/WPS 0106 آفاق ومستجداتآفاق ومستجداتآفاق ومستجداتآفاق ومستجدات: : : : الطاقة والبيئة والتنمية المستديمة الطاقة والبيئة والتنمية المستديمة الطاقة والبيئة والتنمية المستديمة الطاقة والبيئة والتنمية المستديمة نجاة النيشنجاة النيشنجاة النيشنجاة النيش
API/WPS 0107 Riad Dahel Telecommunications Privatization in Arab Countries: An Overview
API/WPS 0108 أسس العلاقة بين التعليم وسوق العمل وقياس عوائد الاستثمار البشريأسس العلاقة بين التعليم وسوق العمل وقياس عوائد الاستثمار البشريأسس العلاقة بين التعليم وسوق العمل وقياس عوائد الاستثمار البشريأسس العلاقة بين التعليم وسوق العمل وقياس عوائد الاستثمار البشري علي عبد القادرعلي عبد القادرعلي عبد القادرعلي عبد القادر API/WPS 0201
مناهج تقدير المداخيل المختلطة في الأقطار العربيةمناهج تقدير المداخيل المختلطة في الأقطار العربيةمناهج تقدير المداخيل المختلطة في الأقطار العربيةمناهج تقدير المداخيل المختلطة في الأقطار العربية أحمد الكوازأحمد الكوازأحمد الكوازأحمد الكواز API/WPS 0202 ل الاجتماعي في الاقتصاد العربي ل الاجتماعي في الاقتصاد العربي ل الاجتماعي في الاقتصاد العربي ل الاجتماعي في الاقتصاد العربي الكفاءة التوزيعية لشبكات التكافالكفاءة التوزيعية لشبكات التكافالكفاءة التوزيعية لشبكات التكافالكفاءة التوزيعية لشبكات التكاف سليمان شعبان القدسيسليمان شعبان القدسيسليمان شعبان القدسيسليمان شعبان القدسي
API/WPS 0203 Belkacem Laabas and Imed Limam Are GCC Countries Ready for Currency Union?
API/WPS 0204 تحليل للتجربة الكويتيةتحليل للتجربة الكويتيةتحليل للتجربة الكويتيةتحليل للتجربة الكويتية: : : : سياسات العمل والتنمية البشرية في الأقطار العربية سياسات العمل والتنمية البشرية في الأقطار العربية سياسات العمل والتنمية البشرية في الأقطار العربية سياسات العمل والتنمية البشرية في الأقطار العربية محمد �اجي التو�يمحمد �اجي التو�يمحمد �اجي التو�يمحمد �اجي التو�ي
API/WPS 0205 Mustafa Babiker Taxation and Labor Supply Decisions: The Implications of Human Capital Accumulation
API/WPS 0206
Ibrahim A. Elbadawi Reviving Growth in the Arab World
API/WPS 0207 M. Nagy Eltony The Determinants of Tax Effort in Arab Countries
API/WPS 0208
كوازكوازكوازكوازأحمد الأحمد الأحمد الأحمد ال السياسات الاقتصادية ورأس المال البشريالسياسات الاقتصادية ورأس المال البشريالسياسات الاقتصادية ورأس المال البشريالسياسات الاقتصادية ورأس المال البشري

33
No Author Title
API/WPS 0209
Mustafa Babiker The Impact of Environmental Regulations on Exports: A Case Study of Kuwait Chemical and Petrochemical Industry
API/WPS 0301 Samir Makdisi,
Zeki Fattah and Imed Limam
DETERMINANTS OF GROWTH IN THE MENA COUNTRIES
API/WPS 0302 حالة مصرحالة مصرحالة مصرحالة مصر""""دور الحكومة الداعم للتنافسية دور الحكومة الداعم للتنافسية دور الحكومة الداعم للتنافسية دور الحكومة الداعم للتنافسية طارق �ويرطارق �ويرطارق �ويرطارق �وير""""
API/WPS 0303 M. Nagy Eltony Quantitative Measures of Financial Sector Reform in the Arab Countries
API/WPS 0304
Ali Abdel Gadir Ali
Can the Sudan Reduce Poverty by Half by the Year 2015?
API/WPS 0305 Ali Abdel Gadir Ali
Conflict Resolution and Wealth Sharing in Sudan: Towards an Allocation Formula
API/WPS 0306 Mustafa Babiker Environment and Development in Arab Countries: Economic Impacts of Climate Change Policies in the GCC Region
API/WPS 0307 Ali Abdel Gadir Ali Globalization and Inequality in the Arab Region
API/WPS 0308 تقييم سياسات وإستراتيجيات الإقلال من الفقر في عينة من الدول العربيةتقييم سياسات وإستراتيجيات الإقلال من الفقر في عينة من الدول العربيةتقييم سياسات وإستراتيجيات الإقلال من الفقر في عينة من الدول العربيةتقييم سياسات وإستراتيجيات الإقلال من الفقر في عينة من الدول العربية علي عبد القادرعلي عبد القادرعلي عبد القادرعلي عبد القادر API/WPS 0401
Belkacem Laabas and
Imed Limam Impact of Public Policies on Poverty, Income Distribution and Growth
API/WPS 0402 Ali Abdel Gadir Ali Poverty in the Arab Region: A Selective Review
API/WPS 0403 Mustafa Babiker Impacts of Public Policy on Poverty in Arab Countries: Review of the CGE Literature
API/WPS 0404 Ali Abdel Gadir Ali On Financing Post-Conflict Development in Sudan
API/WPS 0501 Ali Abdel Gadir Ali On the Challenges of Economic Development in Post-Conflict Sudan
API/WPS 0601 Ali Abdel Gadir Ali Growth, Poverty and Institutions: Is there a Missing Link?
API/WPS 0602 Ali Abdel Gadir Ali On Human Capital in Post-Conflict Sudan: Some Exploratory Results
API/WPS 0603 Ahmad Telfah Optimal Asset Allocation in Stochastic Environment: Evidence on the Horizon and Hedging Effects
API/WPS 0604 Ahmad Telfah Do Financial Planners Take Financial Crashes In Their Advice: Dynamic Asset Allocation under Thick Tails and Fast volatility Updating
API/WPS 0701 Ali Abdel Gadir Ali Child Poverty: Concept and Measurement
API/WPS 0702 التضخم في دول مجلس التعاون الخليجي ودور صناديق النفط في الاستقرار الاقتصاديالتضخم في دول مجلس التعاون الخليجي ودور صناديق النفط في الاستقرار الاقتصاديالتضخم في دول مجلس التعاون الخليجي ودور صناديق النفط في الاستقرار الاقتصاديالتضخم في دول مجلس التعاون الخليجي ودور صناديق النفط في الاستقرار الاقتصادي حاتم مهرانحاتم مهرانحاتم مهرانحاتم مهران API/WPS 0801 Weshah Razzak In the Middle of the Heat The GCC Countries Between Rising Oil
Prices and the Sliding Greenback
API/WPS 0802 Rabie Nasser
Could New Growth Cross-Country Empirics Explain the Single Country Growth of Syria During 1965-2004?