Embed Size (px)
Citation preview
[Year]
Financial Advisory
Gaming & Hospitality
Public Policy Research
Real Estate Advisory
Regional & Urban Economics
3900 Paradise Road, Suite 209
Las Vegas, NV 89169
Main: 702-967-3188
Fax : 702-967-3196
www.rcg1.com
NEVADA ADULT-USE MARIJUANA ECONOMIC & FISCAL BENEFITS ANALYSIS
JULY 2016
PREPARED BY:
&

Fe July 12, 2016
Mr. Sean Sinclair The Coalition to Regulate Marijuana Like Alcohol 2300 W. Sahara Ave. #800 Las Vegas, NV 89012
Re: Initiative to Tax and Regulate Marijuana (“the Initiative”) Benefits Analysis (“the Study”) Dear Mr. Sinclair: The Consultant Team of the RCG Economics LLC (“RCG”) and the Marijuana Policy Group (“MPG”) is pleased to submit this economic & fiscal benefits Study (“the Study”) to The Coalition to Regulate Marijuana Like Alcohol (“the Coalition”). The purpose of the Study is to analyze the potential economic and fiscal benefits of the Initiative on the Nevada economy. The Study represents an analysis of the estimated and hypothetical economic, and a portion of the public fiscal benefits associated with the Initiative, which concerns adult-use only, not the medical use of marijuana. These benefits include, but are not limited to, increases in output (gross sales/spending), employment and wages/labor income, as well as sales and use taxes resulting from the implementation of the Initiative. Our analysis of the Initiative’s direct benefits on the state’s economy is also based upon information provided by the MPG, based on its previous work, as well as data provided by various state and local government agencies pertaining to the potential benefits noted above. Estimates of indirect and induced benefits were prepared by the Consultant Team employing the widely used and widely accepted IMPLAN (Impact Analysis for PLANing) economic benefits model. Our general fiscal analysis is based on Nevada Revised Statutes, data from the U.S. Bureau of Economic Analysis and municipal tax information and formulas. The Study is intended for the sole use of the Coalition and it may be distributed to the press, to various interest groups and to governmental representatives. Publication of the Study or any information contained therein, in any manner, must explicitly indicate that it was prepared by the Consultant Team. Standard Assumptions This work scope was performed according to the “Standard Assumptions & Limiting Conditions” detailed in an attachment to this letter.
Financial Advisory
Gaming & Hospitality
Public Policy Research
Real Estate Advisory
Regional & Urban Economics
3900 Paradise Rd, Ste. 209 Las Vegas, NV 89169 www.rcg1.com 702-967-3188
Mr. Sean Sinclair July 12, 2016 Page 2 Consultant Team Expertise The Consultant Team is uniquely qualified in providing regional economic consulting and financial services. The team has many years of experience in conducting economic research and analyses, which have been successfully and widely used by a host of private and public sector clients. Our knowledge and knowhow turn complex and technical economic issues into understandable informational tools for effective public policy making. Details about RCG, its clients, services and assignments can be found at www.rcg1.com. Information about MPG, its clients, services and assignments can be found at http://www.mjpolicygroup.com/. The Consultant Team was comprised of the following economists and analysts RCG John Restrepo Principal Hubert Hensen David Rivenbark, Ph.D. Andres Fonseca Economist Economist Research Analyst MPG Adam Orens Miles Light, Ph.D. Founding Partner Founding Partner Jacob Rowberry Clinton Saloga William Crimmins Research Associate Research Associate Research Associate Use & Nature of Report & Methodologies The distribution of the Study is limited to the Coalition. If the Coalition intends to reproduce and distribute the Study, it must be reproduced in its entirety. If it intends to include the Study in a document used for the offering of securities, the Coalition agrees: (1) to provide the Consultant Team with a representation letter; (2) that legal counsel will have advised it before the offering is made; (3) that the offering document complies with all applicable local jurisdictions and regional agencies, State of Nevada and federal legal requirements; and (4) that no reference will be made to our name in any promotional or offering materials without first furnishing us a draft of the materials and then obtaining our written consent. The results of the Consultant Team’s services under this engagement are the property of the Coalition. Copies of all documents including writings and computer or machine-readable data, which describe or relate to the services performed pursuant to this consulting assignment, or the results thereof, are the property of the Coalition and will be provided upon request. However, the Coalition will not provide the Consultant Team’s Inventions and Works to any third party or use the same for the benefit of any third party, except with the prior written consent of the Consultant Team. The Study is in the form of a narrative-report, along with any appropriate tables, graphs and maps. the Consultant Team is not responsible for statements or interpretations made by the Coalition relating to the Study.

Mr. Sean Sinclair July 12, 2016 Page 3 All ideas, developments, computer models, methodologies, innovations, inventions and copyrightable work (hereinafter “Inventions and Works”), which the Consultant Team conceived and were used during the period of the Study, and which either (a) are within the scope of the Consultant Team’s businesses or investigations, or (b) are supported by the use of materials, facilities or information paid for or provided by the Consultant Team are the exclusive property of the Consultant Team. In this regard, the Coalition agrees to credit the Consultant Team for its work.
If you have any questions, please do not hesitate to contact John Restrepo at your convenience by phone at 702-967-3188 ext. 401 or by email at [email protected]. Regards,
RCG Economics LLC Attachment

Ms. Sean Sinclair July 12, 2016 Page 4
Attachment: Standard Assumptions & Limiting Conditions 1. The Consultant Team has prepared, from third-party information collected by the Coalition, as
well as our internal econometric models and databases, the Study, as it relates to the Nevada economy.
2. The Coalition is responsible for representations about its plans and expectations, and for
disclosure of significant information that might affect the ultimate realization of the analyses results.
3. The results of the Consultant Team’s analyses apply only to the effective date of the Study. The
success of the Coalition’s plans will be affected by many related and unrelated economic conditions within a local, regional, national and/or world context. We assume no liability for an unforeseen change in the economy. Accordingly, we have no responsibility to update the Study for events and circumstances occurring after the date of the Study.
4. The Study is based on historical and projected benchmark information. Thus, variations in the
future could be material and have an impact on the Study conclusions. Even if the Study’s hypothetical assumptions were to occur, there will usually be differences between the estimated and actual results, because events and circumstances frequently do not occur as expected, and those differences may be material. These could include major changes in economic and market conditions; performing arts center benchmarks; significant increases or decreases in mortgage interest rates and/or terms or availability of financing altogether; property assessment and/or major revisions in current state and/or federal tax or regulatory laws.
5. If the Study is reproduced by the Coalition, it must be reproduced in its entirety. 6. The Consultant Team makes no representation or warranty as to the accuracy or completeness
of the third party information contained in the Study, and shall have no liability for any representations (expressed or implied) contained in, or for any omissions from, our materials.
7. The working papers for this consulting assignment will be retained in the Consultant Team’s
files and will be made available for your reference. We will be available to support the analyses, as required.
8. Unless otherwise stated in the Study, no efforts were made to determine the possible effect, if
any, on the Initiative of future Federal, State or local legislation, including any environmental or ecological matters or interpretations thereof.
9. The Consultant Team did not perform an audit, review or examination, or any other attest
function (as defined by the AICPA) regarding any of the third-party historical market, industry and economic benchmarks or any other information used or included in the Study; therefore, the Consultant Team does not express any opinion or any other form of assurance with regard to the same, in the context of the Study.
i
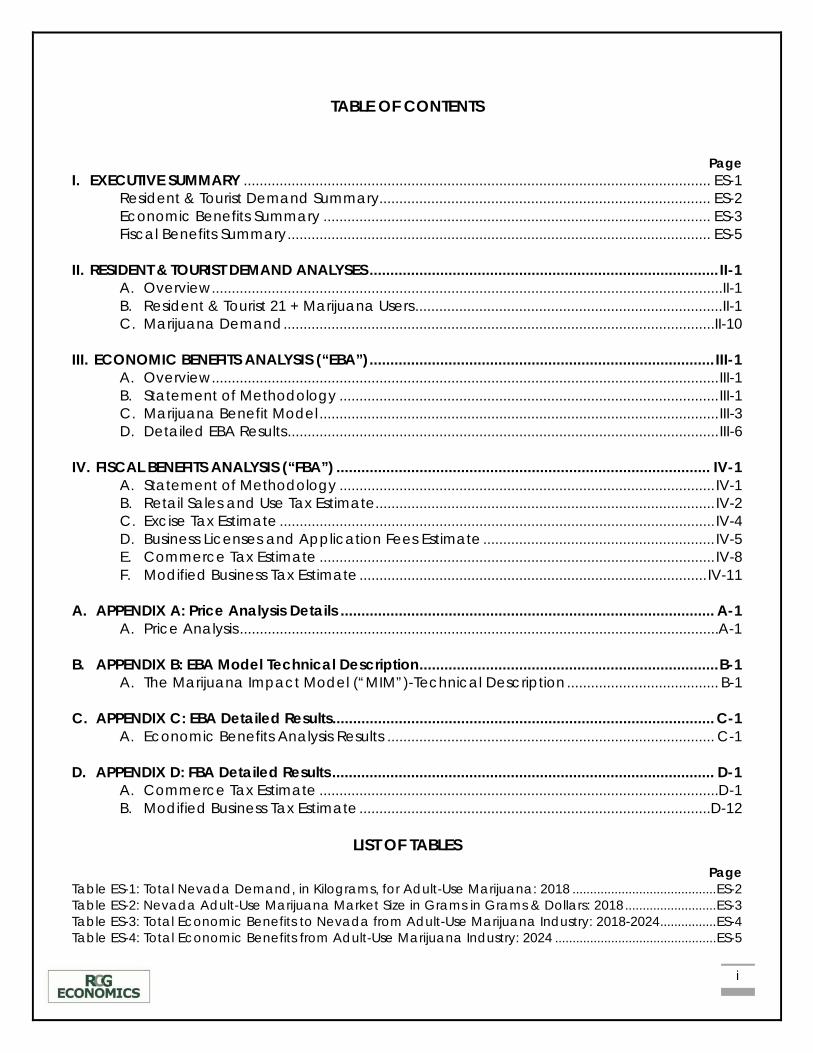
TABLE OF CONTENTS
Page I. EXECUTIVE SUMMARY ..................................................................................................................... ES-1 Resident & Tourist Demand Summary ................................................................................... ES-2 Economic Benefits Summary ................................................................................................. ES-3 Fiscal Benefits Summary .......................................................................................................... ES-5 II. RESIDENT & TOURIST DEMAND ANALYSES .................................................................................... II-1
A. Overview ................................................................................................................................ II-1 B. Resident & Tourist 21 + Marijuana Users ............................................................................. II-1 C. Marijuana Demand ............................................................................................................ II-10
III. ECONOMIC BENEFITS ANALYSIS (“EBA”) ................................................................................... III-1
A. Overview ............................................................................................................................... III-1 B. Statement of Methodology ............................................................................................... III-1 C. Marijuana Benefit Model .................................................................................................... III-3 D. Detailed EBA Results ............................................................................................................ III-6
IV. FISCAL BENEFITS ANALYSIS (“FBA”) .......................................................................................... IV-1
A. Statement of Methodology .............................................................................................. IV-1 B. Retail Sales and Use Tax Estimate..................................................................................... IV-2 C. Excise Tax Estimate ............................................................................................................. IV-4 D. Business Licenses and Application Fees Estimate .......................................................... IV-5 E. Commerce Tax Estimate ................................................................................................... IV-8 F. Modified Business Tax Estimate ....................................................................................... IV-11
A. APPENDIX A: Price Analysis Details .......................................................................................... A-1
A. Price Analysis ........................................................................................................................ A-1
B. APPENDIX B: EBA Model Technical Description ........................................................................ B-1 A. The Marijuana Impact Model (“MIM”)-Technical Description ...................................... B-1
C. APPENDIX C: EBA Detailed Results ............................................................................................ C-1
A. Economic Benefits Analysis Results .................................................................................. C-1
D. APPENDIX D: FBA Detailed Results ............................................................................................ D-1 A. Commerce Tax Estimate .................................................................................................... D-1 B. Modified Business Tax Estimate ........................................................................................D-12
LIST OF TABLES
Page Table ES-1: Total Nevada Demand, in Kilograms, for Adult-Use Marijuana: 2018 ......................................... ES-2 Table ES-2: Nevada Adult-Use Marijuana Market Size in Grams in Grams & Dollars: 2018 .......................... ES-3 Table ES-3: Total Economic Benefits to Nevada from Adult-Use Marijuana Industry: 2018-2024 ................ ES-4 Table ES-4: Total Economic Benefits from Adult-Use Marijuana Industry: 2024 .............................................. ES-5

ii
Table ES-5: Total Fiscal Benefits: 2018-2024 ............................................................................................................ ES-5 Table II-1: Percent of Total Population 21+, by Nevada County: 2015-2033 .................................................... II-2 Table II-2: Total Population, by Nevada County: 2015-2033 ................................................................................ II-4 Table II-3: Projected 21+ Population, by Nevada County: 2015-2033 ............................................................... II-6 Table II-4: Nevada Tourists: 2015 ................................................................................................................................ II-8 Table II-5: Nevada Visitors: 2015-2033....................................................................................................................... II-9 Table II-6: Days Marijuana Used in Past Month among Persons 21+ in Nevada, by Percent: 2014 ........... II-10 Table II-7: Nevada Resident Demand for Adult-Use Marijuana: 2018 ............................................................. II-11 Table II-8: 21+ Nevada Resident Demand for Medical Marijuana: Jan-14 to Dec-17 ................................. II-12 Table II-9: Marijuana Use per Day, by Frequency of Use: 2014 ......................................................................... II-13 Table II-10: Adult Nevada Resident Demand for Marijuana: 2018 ................................................................... II-14 Table II-11: Nevada Marijuana Adult-Use Tourists-Domestic: 2018 ................................................................... II-16 Table II-12: U.S. Average Daily Marijuana Consumption for Past-Month Marijuana Users: 2014 ................ II-17 Table II-13: Total Demand, in Kilograms, for Adult-Use Marijuana in Nevada: 2018 ..................................... II-18 Table II-14: Nevada Adult-Use Marijuana Market Size in Grams & 2016 Dollars: 2018 .................................. II-19 Table III-1: Total Economic Benefits from Adult-Use Marijuana Industry: 2018-2024 ....................................... III-9 Table III-2: Total Economic Benefits from Adult-Use Marijuana Industry: 2024 ............................................... III-10 Table III-3: Economic Multipliers: Nevada Adult-Use Marijuana Industry ....................................................... III-10 Table IV-1: Total Fiscal Benefits: 2018-2024 ............................................................................................................ IV-1 Table IV-2: Applicable Sales & Use Tax Rates ....................................................................................................... IV-2 Table IV-3: Total Retail Sales & Use Tax Revenues from the Initiative: 2018-2024 ........................................... IV-3 Table IV-4: Excise Tax Revenues from the Initiative: 2018-2024 ......................................................................... IV-4 Table IV-5: Total Application Fee Revenues from the Initiative: 2018-2024 .................................................... IV-5 Table IV-6: Total License Fee Revenues from the Initiative: 2018-2024 ............................................................ IV-6 Table IV-7: Applicable Commerce Tax Rates ...................................................................................................... IV-8 Table IV-8: Total Commerce Tax Revenue, by Type of Business ....................................................................... IV-9 Table IV-9: Active Marijuana Licenses ................................................................................................................... IV-9 Table IV-10: Active License by Nevada County and Nevada ....................................................................... IV-10 Table IV-11: Percentage of Active Licenses Integrated with Other License Types ..................................... IV-10 Table IV-12: Percent of Active Licenses Held by Single Businesses ................................................................ IV-11 Table IV-13: Expected Number of Active Business Licenses Held by a Single Business .............................. IV-11 Table IV-14: Total Nevada Modified Business Tax Revenue ............................................................................. IV-12 Table B-1: Direct, Indirect, and Induced Effects for the Marijuana Industry .................................................... B-2 Table B-2: Marijuana-Based Input-Output Table-Aggregated from 120 sectors for Exposition Purposes .. B-4 Table B-3: Conversion of Output Impact into Employment Changes, Full-Time Equivalent (FTE) ............... B-6 Table C-1: Total Economic Benefits from Adult-Use Marijuana Industry: 2018-2024 ..................................... C-1 Table C-2: Average Annual Economic Benefits from Adult-Use Marijuana Industry: 2018-2024 ................ C-1 Table C-3: Total Economic Benefits from Adult-Use Marijuana Industry: 2018 ............................................... C-1 Table C-4: Total Economic Benefits from Adult-Use Marijuana Industry: 2019 ............................................... C-2 Table C-5: Total Economic Benefits from Adult-Use Marijuana Industry: 2020 ............................................... C-2 Table C-6: Total Economic Benefits from Adult-Use Marijuana Industry: 2021 ............................................... C-2 Table C-7: Total Economic Benefits from Adult-Use Marijuana Industry: 2022 ............................................... C-2 Table C-8: Total Economic Benefits from Adult-Use Marijuana Industry: 2023 ............................................... C-3 Table C-9: Total Economic Benefits from Adult-Use Marijuana Industry: 2024 ............................................... C-3 Table D-1: Retail Revenue per Store by Nevada County and for the State ................................................... D-2 Table D-2: Manufacturing Facility Revenue per Year .......................................................................................... D-2 Table D-3: Cultivation Facility Revenue per Year ................................................................................................. D-3
iii
LIST OF TABLES Page Table D-4: Commerce Tax Revenue Generated by Businesses with Only One Retail License, Clark County: 2018-2024 ............................................................................................................................................ D-4 Table D-5: Commerce Tax Revenue Generated by Businesses with Only One Manufacturing License .. D-5 Table D-6: Commerce Tax Revenue Generated by Businesses with Only One Cultivation License .......... D-6 Table D-7: Commerce Tax Revenue Generated by Businesses with Multiple Retail-Only Licenses ........... D-7 Table D-8: Commerce Tax Revenue Generated by Businesses with Multiple Manufacturing Licenses .... D-8 Table D-9: Commerce Tax Revenue Generated by Businesses with Multiple Cultivation Licenses ........... D-9 Table D-10: Commerce Tax Revenue Generated by Businesses with Retail and Cultivation Licenses ....................................................................................................................................................................... D-10 Table D-11: Commerce Tax Revenue Generated by Businesses with Cultivation and Manufacturing Licenses ........................................................................................................................................... D-11 Table D-12: Modified Business Taxes Paid by Businesses with Only One Retail License............................... D-13 Table D-13: Modified Business Taxes Paid by Businesses with Only One Manufacturing License ............. D-14 Table D-14: Modified Business Taxes Paid by Businesses with Only One Cultivation License ..................... D-15 Table D-15: Modified Business Taxes Paid by Businesses with Multiple Retail-Only Licenses....................... D-16 Table D-16: Modified Business Taxes Paid by Businesses with Multiple Manufacturing-Only Licenses ..... D-17 Table D-17: Modified Business Taxes Paid by Businesses with Multiple Cultivation-Only Licenses ............. D-18 Table D-18: Modified Business Taxes Paid by Businesses with Retail and Cultivation Licenses .................. D-20 Table D-19: Modified Business Taxes Paid by Businesses with Cultivation and Manufacturing Licenses ....................................................................................................................................................................... D-22 Table D-20: Total Nevada Modified Business Tax Revenue .............................................................................. D-23
LIST OF FIGURES Page Figure III-1: Total Economic Benefits from Adult-Use Marijuana Industry: 2018-2024 .................................... III-11 Figure III-2: Total Economic Benefits from Adult-Use Marijuana Industry: 2024.............................................. III-11 Figure A-1: Total (New & Rehab) Economic Benefits from FRI: 2017-2027 ....................................................... A-1 Figure B-1: The Multiplier Effect ................................................................................................................................. B-1
NEVADA INITIATIVE TO TAX & REGULATE MARIJUANA: ECONOMIC & FISCAL BENEFITS STUDY
ES-1
I. EXECUTIVE SUMMARY he Consultant Team of the RCG Economics LLC (“RCG”) and the Marijuana Policy Group
(“MPG”) were retained by The Coalition to Regulate Marijuana Like Alcohol (“the Coalition”) to
prepare an economic & fiscal benefits study (“the Study”). The purpose of the Study is to analyze
the potential economic and fiscal benefits on the Nevada economy of the proposed November 2016
ballot initiative known as the Nevada Initiative to Tax and Regulate Marijuana (“the Initiative or
Question 2”). The focus of the Study is solely on the adult-use of marijuana, not its medical use.
The study period is 2018-2024. The Initiative language can be found at
https://nvsos.gov/Modules/ShowDocument.aspx?documentid=3294.
The Study is comprised of three separate but complementary analyses:
Demand Analysis
Economic Benefit Analysis (“EBA”)
Fiscal Benefit Analysis (“FBA”)
The report also includes four Appendices.
The EBA addresses of the estimated and hypothetical direct, indirect and induced economic
benefits associated with the Initiative. These benefits include, but are not limited to, increases in
output (gross sales/spending), employment and wages/labor income resulting from the
implementation of the Initiative.
Our analysis of the Initiative’s direct benefits on the Nevada economy is also based upon
information provided by the MPG, based on its previous work, as well as data provided by various
state and local government agencies pertaining to the potential benefits noted above. Estimates of
indirect and induced benefits were prepared by the Consultant Team employing the widely used
and widely accepted IMPLAN (Impact Analysis for PLANing) economic benefits model. Our general
fiscal analysis is based on Nevada Revised Statutes, data from the U.S. Bureau of Economic
Analysis and municipal tax information and formulas.
Our FBA uses the following sources of tax revenue related to the Initiative for seven-year period
from 2018-2024 were analyzed:
Retail sales and use tax revenue from the sale of marijuana.
T
NEVADA INITIATIVE TO TAX & REGULATE MARIJUANA: ECONOMIC & FISCAL BENEFITS STUDY
ES-2
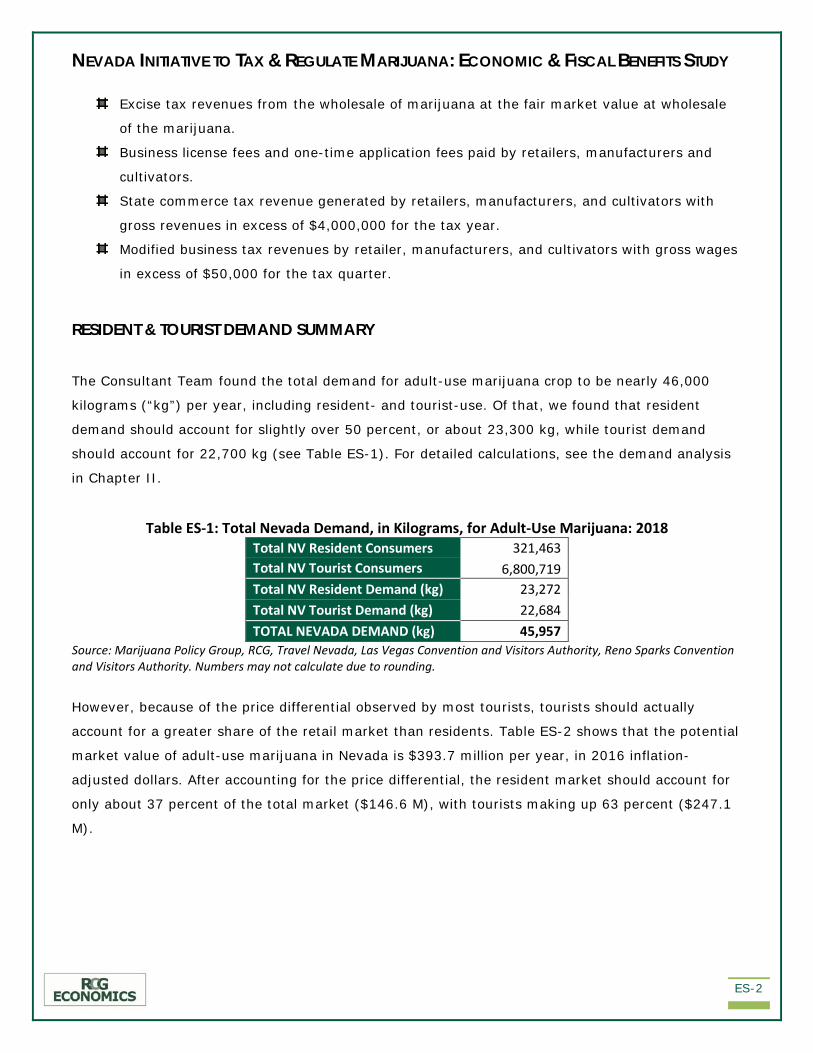
Excise tax revenues from the wholesale of marijuana at the fair market value at wholesale
of the marijuana.
Business license fees and one-time application fees paid by retailers, manufacturers and
cultivators.
State commerce tax revenue generated by retailers, manufacturers, and cultivators with
gross revenues in excess of $4,000,000 for the tax year.
Modified business tax revenues by retailer, manufacturers, and cultivators with gross wages
in excess of $50,000 for the tax quarter.
RESIDENT & TOURIST DEMAND SUMMARY
The Consultant Team found the total demand for adult-use marijuana crop to be nearly 46,000
kilograms (“kg”) per year, including resident- and tourist-use. Of that, we found that resident
demand should account for slightly over 50 percent, or about 23,300 kg, while tourist demand
should account for 22,700 kg (see Table ES-1). For detailed calculations, see the demand analysis
in Chapter II.
Table ES-1: Total Nevada Demand, in Kilograms, for Adult-Use Marijuana: 2018 Total NV Resident Consumers 321,463 Total NV Tourist Consumers 6,800,719 Total NV Resident Demand (kg) 23,272 Total NV Tourist Demand (kg) 22,684 TOTAL NEVADA DEMAND (kg) 45,957
Source: Marijuana Policy Group, RCG, Travel Nevada, Las Vegas Convention and Visitors Authority, Reno Sparks Convention and Visitors Authority. Numbers may not calculate due to rounding.
However, because of the price differential observed by most tourists, tourists should actually
account for a greater share of the retail market than residents. Table ES-2 shows that the potential
market value of adult-use marijuana in Nevada is $393.7 million per year, in 2016 inflation-
adjusted dollars. After accounting for the price differential, the resident market should account for
only about 37 percent of the total market ($146.6 M), with tourists making up 63 percent ($247.1
M).
NEVADA INITIATIVE TO TAX & REGULATE MARIJUANA: ECONOMIC & FISCAL BENEFITS STUDY
ES-3
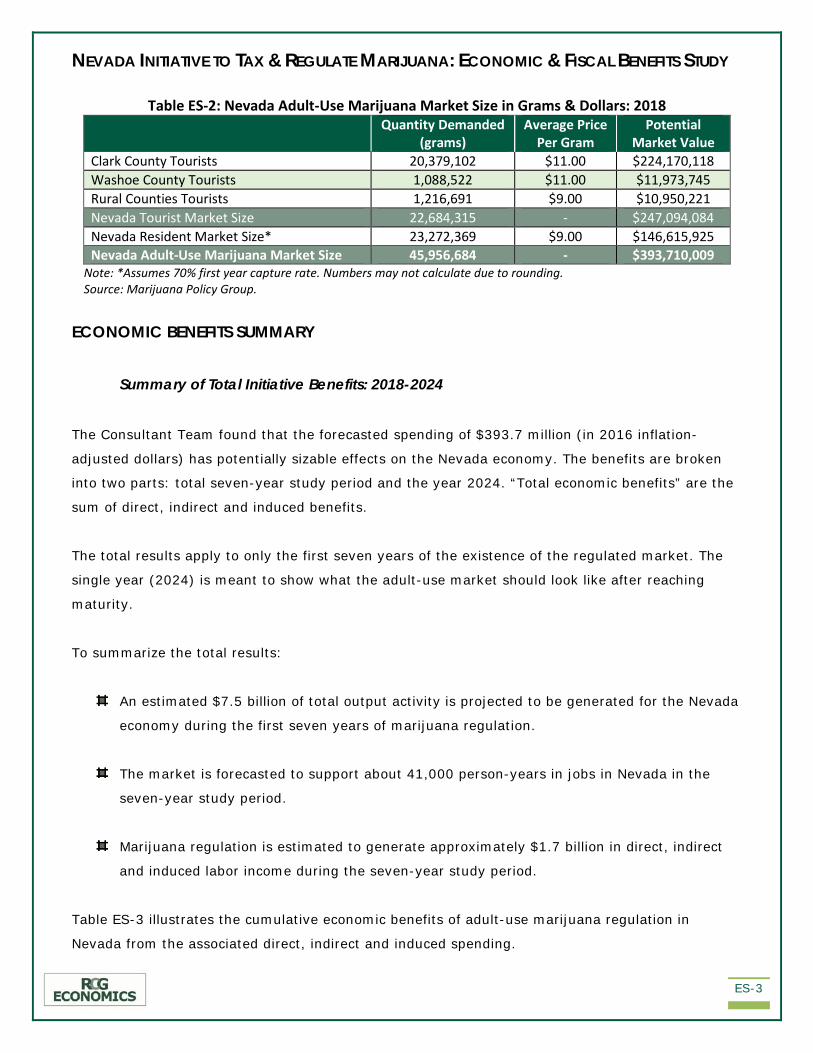
Table ES-2: Nevada Adult-Use Marijuana Market Size in Grams & Dollars: 2018
Quantity Demanded (grams)
Average Price Per Gram
Potential Market Value
Clark County Tourists 20,379,102 $11.00 $224,170,118 Washoe County Tourists 1,088,522 $11.00 $11,973,745 Rural Counties Tourists 1,216,691 $9.00 $10,950,221 Nevada Tourist Market Size 22,684,315 - $247,094,084 Nevada Resident Market Size* 23,272,369 $9.00 $146,615,925 Nevada Adult-Use Marijuana Market Size 45,956,684 - $393,710,009
Note: *Assumes 70% first year capture rate. Numbers may not calculate due to rounding. Source: Marijuana Policy Group.
ECONOMIC BENEFITS SUMMARY
Summary of Total Initiative Benefits: 2018-2024
The Consultant Team found that the forecasted spending of $393.7 million (in 2016 inflation-
adjusted dollars) has potentially sizable effects on the Nevada economy. The benefits are broken
into two parts: total seven-year study period and the year 2024. “Total economic benefits” are the
sum of direct, indirect and induced benefits.
The total results apply to only the first seven years of the existence of the regulated market. The
single year (2024) is meant to show what the adult-use market should look like after reaching
maturity.
To summarize the total results:
An estimated $7.5 billion of total output activity is projected to be generated for the Nevada
economy during the first seven years of marijuana regulation.
The market is forecasted to support about 41,000 person-years in jobs in Nevada in the
seven-year study period.
Marijuana regulation is estimated to generate approximately $1.7 billion in direct, indirect
and induced labor income during the seven-year study period.
Table ES-3 illustrates the cumulative economic benefits of adult-use marijuana regulation in
Nevada from the associated direct, indirect and induced spending.

NEVADA INITIATIVE TO TAX & REGULATE MARIJUANA: ECONOMIC & FISCAL BENEFITS STUDY
ES-4
Table ES-3: Total Economic Benefits to Nevada from Adult-Use Marijuana Industry: 2018-2024 Impact Type Spending/Output Employment Labor Income Direct Benefit $3,201,391,017 21,769 $736,319,934 Indirect Benefit $2,497,084,993 13,766 $406,578,602 Induced Benefit $1,760,765,059 5,442 $578,085,530 Total Benefits $7,459,241,070 40,978 $1,720,984,066 Multipliers 2.33 1.88 2.34
Sources: MPG, IMPLAN, RCG Economics.
The direct spending would also help create additional spending. The total benefits are described
using “multipliers”. For example, “direct spending/output” would potentially result in a multiplier of
2.33 in the state economy during the seven-year study period. This means that for every dollar
spent on retail marijuana, an additional $1.33 would ripple through the Nevada economy. These
multipliers measure the total increase in output/economic activity, total employment and labor
income in the wider regional economy per dollar in output/spending, per new jobs created and per
dollar increase in earnings.
Summary of Total Initiative Economic Benefits: 2024
The total annual economic benefits, based on 2024 benefits, are the sum of the annual averages of
direct, indirect and induced benefits (see Table ES-4).
An estimated $1.1 billion of total output activity is projected to be generated for the Nevada
economy each year due to marijuana regulation.
Marijuana regulation is forecasted to support about 6,200 FTE jobs in Nevada per year.
The market is estimated to generate approximately $260.7 million in direct, indirect and
induced labor income each year.

NEVADA INITIATIVE TO TAX & REGULATE MARIJUANA: ECONOMIC & FISCAL BENEFITS STUDY
ES-5
Table ES-4: Total Economic Benefits from Adult-Use Marijuana Industry: 2024 Impact Type Spending/Output Employment Labor Income Direct Benefit $485,016,525 3,298 $111,553,801 Indirect Benefit $378,312,890 2,086 $61,597,393 Induced Benefit $266,759,089 825 $87,581,003 Total Benefits $1,130,088,504 6,208 $260,732,197 Multipliers 2.33 1.88 2.34
Sources: MPG, IMPLAN, RCG Economics.
FISCAL BENEFITS SUMMARY
The following sources of tax revenue related to the Initiative for the seven-year period from 2018-
2024 were analyzed:
Retail sales and use tax revenue from the sale of marijuana.
Excise tax revenues from the wholesale of marijuana at the fair market value at wholesale
of the marijuana.
Business license fees and one-time application fees paid by retailers, manufacturers and
cultivators.
State commerce tax revenue generated by retailers, manufacturers and cultivators with
gross revenues in excess of $4,000,000 for the tax year.
Modified business tax revenues by retailer, manufacturers and cultivators with gross wages
in excess of $50,000 for the tax quarter.
The results of our FBA are as follows. The FBA is detailed in Chapter IV.
Table ES-5: Total Fiscal Benefits: 2018-2024 Tax Revenue Estimated Total Sales and Use Tax Revenue – 7 Years $257,434,778 Estimated Excise Tax Revenue – 7 Years $147,104,874 Application Fee Revenue – 7 Years $3,478,428 License Fee Revenue – 7 Years $47,186,595 Total Nevada Commerce Tax Revenue – 7 Years (see Note) $520,736 Total Nevada Modified Business Taxes – 7 Years $8,279,702 Total Fiscal Benefit – 7 Years $464,005,113
Sources: RCG. Note: Total commerce tax revenues collected are for all seven years of the analysis period, combined. We decided not to present calculations of annual commerce tax collections in order to simplify the results as much as possible.
NEVADA INITIATIVE TO REGULATE & TAX MARIJUANA: ECONOMIC & FISCAL BENEFITS STUDY
II-1
II. RESIDENT & TOURIST DEMAND ANALYSES
A. OVERVIEW
his chapter summarizes the methods and findings of Nevada resident and tourist demand for
marijuana associated with the passage of the Initiative to Regulate and Tax Marijuana (“the
Initiative” or “Question 2”). The analysis was performed by the Marijuana Policy Group (“MPG”) and
RCG Economics (“RCG”), collectively known as “the Consultant Team”. Included herein are sections
on Nevada adult resident users, adult tourist users and total adult users.
B. RESIDENT & TOURIST 21+ MARIJUANA USERS
This report contains RCG’s projections of Nevada’s population as well as tourists age 21 and over
(“21+”) from 2015 through 2033. We have included 2015 estimates of these cohorts as a baseline.
The purpose of the forecasts is to provide a basis for the estimated economic benefits associated
with the Initiative as detailed in the Economic Benefits Analysis (“EBA”) portion of this study.
RCG used two reports published by the Nevada State Demographer to project Nevada population for 21+
residents.
• “Nevada County Population Projections 2015 to 2034”
• “Nevada County Age, Sex, Race and Hispanic Origin Estimates and Projections 2000 to 2033:
Estimates from 2000 to 2013 and Projections from 2014 to 2033”
As the most recent official source of Nevada population forecasts, by age, the Nevada County Age,
Sex, Race and Hispanic Origin Estimates and Projections (“Nevada ASRHO”) were used to apportion
the 2015-2033 Nevada County Population Projections to persons 21+, including populations in
group quarters. Group Quarters are defined by the U.S. Census as “places where people live or
stay, in a group living arrangement, which are owned or managed by an entity or organization
providing housing and/or services for the residents.”1 Group quarters include places such as college
residence halls, military barracks, worker dormitories, correctional (institutional) facilities, etc. The
Consultant Team believes the importance of capturing the impacts of residence halls and other
1 https://ask.census.gov/faq.php?id=5000&faqId=1681
T
NEVADA INITIATIVE TO REGULATE & TAX MARIJUANA: ECONOMIC & FISCAL BENEFITS STUDY
II-2
non-institutional facility populations outweighs the small potential bias of including institutional
populations.
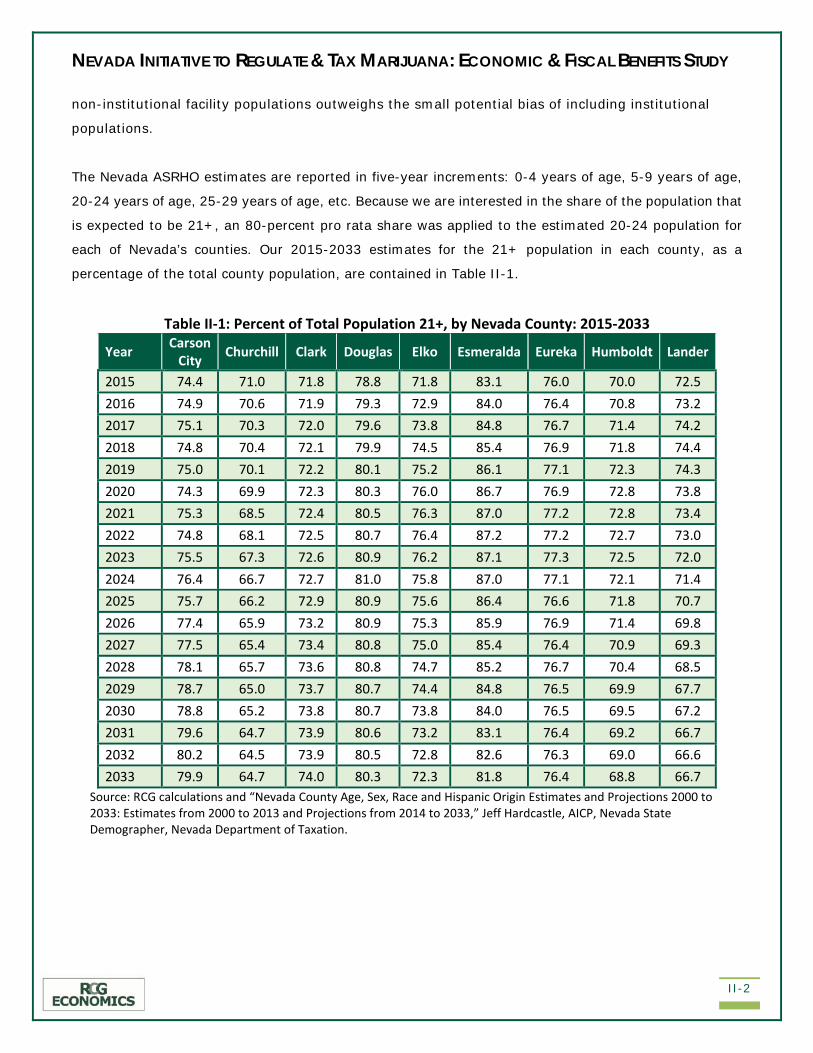
The Nevada ASRHO estimates are reported in five-year increments: 0-4 years of age, 5-9 years of age,
20-24 years of age, 25-29 years of age, etc. Because we are interested in the share of the population that
is expected to be 21+, an 80-percent pro rata share was applied to the estimated 20-24 population for
each of Nevada’s counties. Our 2015-2033 estimates for the 21+ population in each county, as a
percentage of the total county population, are contained in Table II-1.
Table II-1: Percent of Total Population 21+, by Nevada County: 2015-2033
Year Carson City Churchill Clark Douglas Elko Esmeralda Eureka Humboldt Lander
2015 74.4 71.0 71.8 78.8 71.8 83.1 76.0 70.0 72.5 2016 74.9 70.6 71.9 79.3 72.9 84.0 76.4 70.8 73.2 2017 75.1 70.3 72.0 79.6 73.8 84.8 76.7 71.4 74.2 2018 74.8 70.4 72.1 79.9 74.5 85.4 76.9 71.8 74.4 2019 75.0 70.1 72.2 80.1 75.2 86.1 77.1 72.3 74.3 2020 74.3 69.9 72.3 80.3 76.0 86.7 76.9 72.8 73.8 2021 75.3 68.5 72.4 80.5 76.3 87.0 77.2 72.8 73.4 2022 74.8 68.1 72.5 80.7 76.4 87.2 77.2 72.7 73.0 2023 75.5 67.3 72.6 80.9 76.2 87.1 77.3 72.5 72.0 2024 76.4 66.7 72.7 81.0 75.8 87.0 77.1 72.1 71.4 2025 75.7 66.2 72.9 80.9 75.6 86.4 76.6 71.8 70.7 2026 77.4 65.9 73.2 80.9 75.3 85.9 76.9 71.4 69.8 2027 77.5 65.4 73.4 80.8 75.0 85.4 76.4 70.9 69.3 2028 78.1 65.7 73.6 80.8 74.7 85.2 76.7 70.4 68.5 2029 78.7 65.0 73.7 80.7 74.4 84.8 76.5 69.9 67.7 2030 78.8 65.2 73.8 80.7 73.8 84.0 76.5 69.5 67.2 2031 79.6 64.7 73.9 80.6 73.2 83.1 76.4 69.2 66.7 2032 80.2 64.5 73.9 80.5 72.8 82.6 76.3 69.0 66.6 2033 79.9 64.7 74.0 80.3 72.3 81.8 76.4 68.8 66.7
Source: RCG calculations and “Nevada County Age, Sex, Race and Hispanic Origin Estimates and Projections 2000 to 2033: Estimates from 2000 to 2013 and Projections from 2014 to 2033,” Jeff Hardcastle, AICP, Nevada State Demographer, Nevada Department of Taxation.

NEVADA INITIATIVE TO REGULATE & TAX MARIJUANA: ECONOMIC & FISCAL BENEFITS STUDY
II-3
Table II-1: Percent of Total Population 21+, by Nevada County: 2015-2033 (Continued)
Year Lincoln Lyon Mineral Nye Pershing Storey Washoe White Pine Nevada
2015 75.5 73.5 75.8 77.9 77.0 83.4 72.4 76.3 72.2 2016 75.3 74.0 77.2 78.2 78.0 83.6 72.5 76.3 72.4 2017 75.2 74.5 77.3 78.4 79.0 84.0 72.5 76.5 72.5 2018 76.2 74.8 77.5 78.7 79.0 84.4 72.6 76.8 72.6 2019 76.5 75.2 77.2 79.0 80.0 84.7 72.7 76.8 72.7 2020 77.2 75.2 76.5 79.1 80.9 84.8 72.8 76.8 72.8 2021 77.3 75.2 75.3 79.3 81.1 84.4 72.9 76.3 72.9 2022 77.1 75.4 76.0 79.3 81.2 84.1 73.0 76.3 73.0 2023 77.1 75.4 76.0 79.3 80.4 83.9 73.1 76.3 73.1 2024 76.9 75.7 75.8 79.3 80.4 83.7 73.3 75.7 73.2 2025 77.1 75.7 75.5 79.4 80.8 83.7 73.4 75.4 73.4 2026 77.3 75.7 75.0 79.6 80.3 83.4 73.5 75.4 73.6 2027 77.3 75.6 75.6 79.7 80.2 82.8 73.7 75.6 73.8 2028 77.4 75.6 76.5 79.7 78.9 82.5 73.8 75.6 73.9 2029 77.1 75.5 75.5 79.6 79.3 82.3 73.8 75.4 74.0 2030 77.3 75.5 75.1 79.5 79.5 82.1 73.8 75.8 74.1 2031 76.8 75.5 76.0 79.5 78.9 81.9 73.8 76.0 74.1 2032 76.6 75.4 76.5 79.4 78.9 81.5 73.7 76.0 74.1 2033 76.2 75.3 77.5 79.3 78.5 81.3 73.7 75.5 74.1
Source: RCG calculations and “Nevada County Age, Sex, Race and Hispanic Origin Estimates and Projections 2000 to 2033: Estimates from 2000 to 2013 and Projections from 2014 to 2033,” Jeff Hardcastle, AICP, Nevada State Demographer, Nevada Department of Taxation.
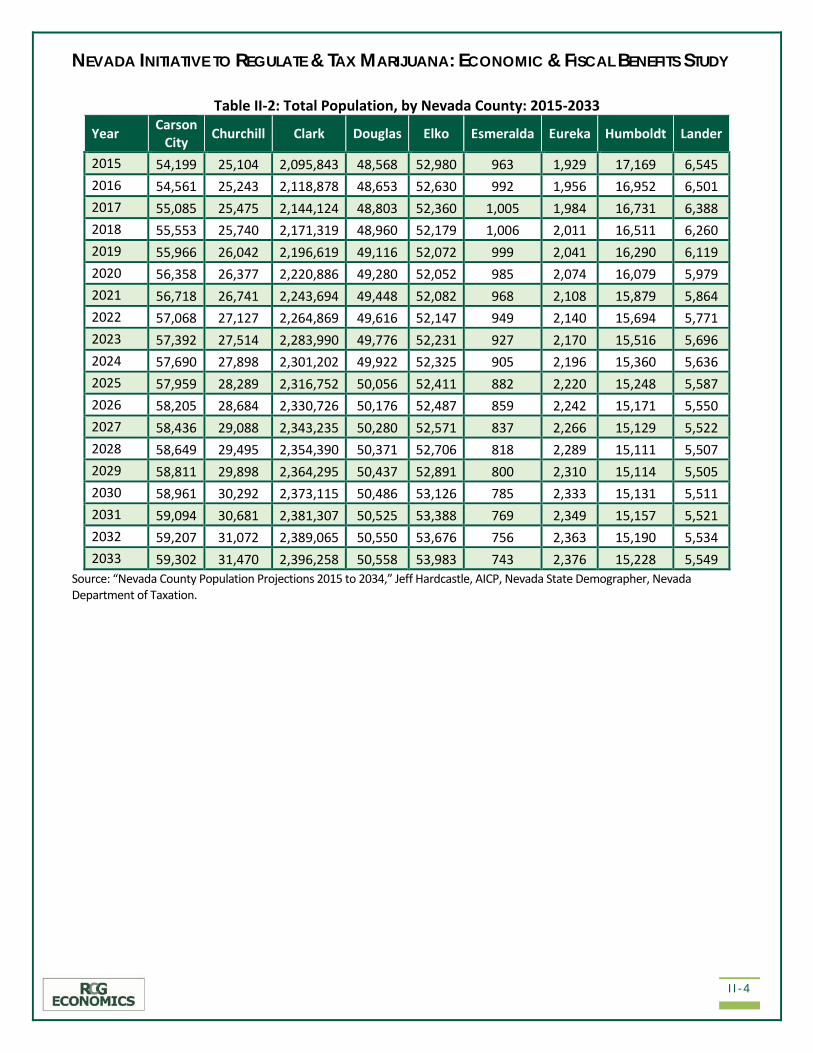
To obtain the forecasts of the 21+ population, by county, RCG applied the 21+ shares from Table II-1 to
the Demographer’s 2015-2033 Nevada County Population Projections, included in Table II-2.
The estimates for Nevada counties’ 21+ populations are shown in Table II-3.
NEVADA INITIATIVE TO REGULATE & TAX MARIJUANA: ECONOMIC & FISCAL BENEFITS STUDY
II-4
Table II-2: Total Population, by Nevada County: 2015-2033
Year Carson City Churchill Clark Douglas Elko Esmeralda Eureka Humboldt Lander
2015 54,199 25,104 2,095,843 48,568 52,980 963 1,929 17,169 6,545 2016 54,561 25,243 2,118,878 48,653 52,630 992 1,956 16,952 6,501 2017 55,085 25,475 2,144,124 48,803 52,360 1,005 1,984 16,731 6,388 2018 55,553 25,740 2,171,319 48,960 52,179 1,006 2,011 16,511 6,260 2019 55,966 26,042 2,196,619 49,116 52,072 999 2,041 16,290 6,119 2020 56,358 26,377 2,220,886 49,280 52,052 985 2,074 16,079 5,979 2021 56,718 26,741 2,243,694 49,448 52,082 968 2,108 15,879 5,864 2022 57,068 27,127 2,264,869 49,616 52,147 949 2,140 15,694 5,771 2023 57,392 27,514 2,283,990 49,776 52,231 927 2,170 15,516 5,696 2024 57,690 27,898 2,301,202 49,922 52,325 905 2,196 15,360 5,636 2025 57,959 28,289 2,316,752 50,056 52,411 882 2,220 15,248 5,587 2026 58,205 28,684 2,330,726 50,176 52,487 859 2,242 15,171 5,550 2027 58,436 29,088 2,343,235 50,280 52,571 837 2,266 15,129 5,522 2028 58,649 29,495 2,354,390 50,371 52,706 818 2,289 15,111 5,507 2029 58,811 29,898 2,364,295 50,437 52,891 800 2,310 15,114 5,505 2030 58,961 30,292 2,373,115 50,486 53,126 785 2,333 15,131 5,511 2031 59,094 30,681 2,381,307 50,525 53,388 769 2,349 15,157 5,521 2032 59,207 31,072 2,389,065 50,550 53,676 756 2,363 15,190 5,534 2033 59,302 31,470 2,396,258 50,558 53,983 743 2,376 15,228 5,549
Source: “Nevada County Population Projections 2015 to 2034,” Jeff Hardcastle, AICP, Nevada State Demographer, Nevada Department of Taxation.
NEVADA INITIATIVE TO REGULATE & TAX MARIJUANA: ECONOMIC & FISCAL BENEFITS STUDY
II-5
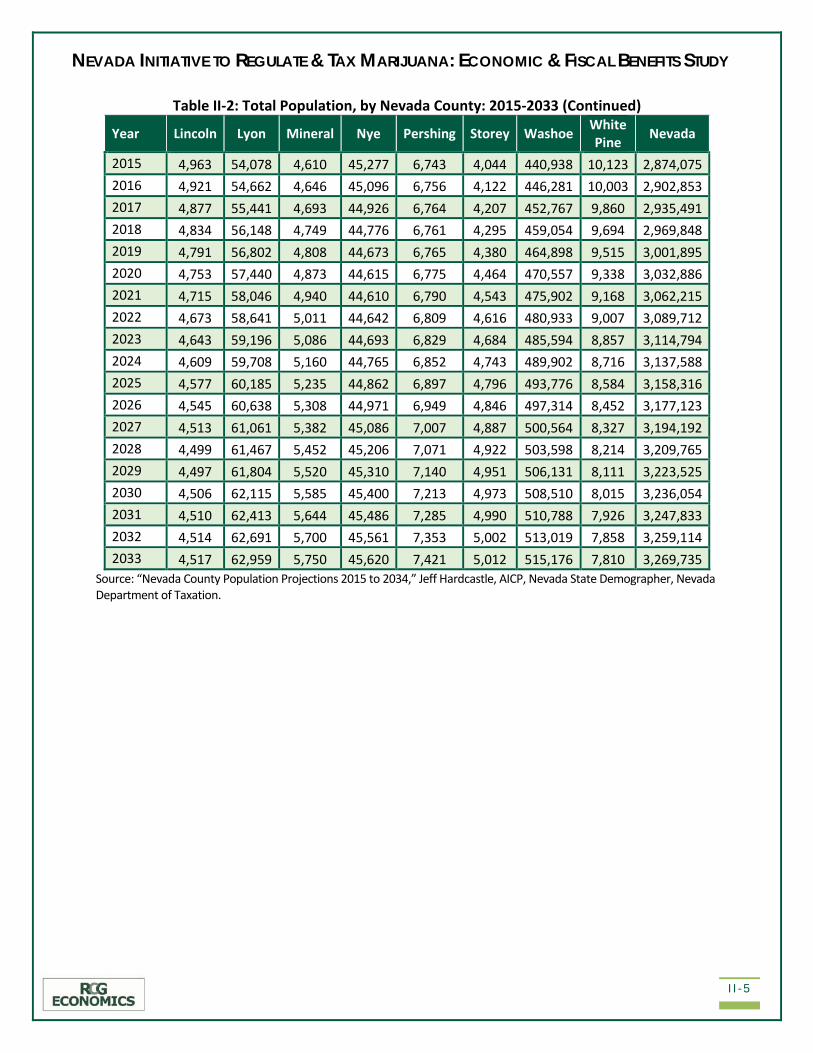
Table II-2: Total Population, by Nevada County: 2015-2033 (Continued)
Year Lincoln Lyon Mineral Nye Pershing Storey Washoe White Pine Nevada
2015 4,963 54,078 4,610 45,277 6,743 4,044 440,938 10,123 2,874,075 2016 4,921 54,662 4,646 45,096 6,756 4,122 446,281 10,003 2,902,853 2017 4,877 55,441 4,693 44,926 6,764 4,207 452,767 9,860 2,935,491 2018 4,834 56,148 4,749 44,776 6,761 4,295 459,054 9,694 2,969,848 2019 4,791 56,802 4,808 44,673 6,765 4,380 464,898 9,515 3,001,895 2020 4,753 57,440 4,873 44,615 6,775 4,464 470,557 9,338 3,032,886 2021 4,715 58,046 4,940 44,610 6,790 4,543 475,902 9,168 3,062,215 2022 4,673 58,641 5,011 44,642 6,809 4,616 480,933 9,007 3,089,712 2023 4,643 59,196 5,086 44,693 6,829 4,684 485,594 8,857 3,114,794 2024 4,609 59,708 5,160 44,765 6,852 4,743 489,902 8,716 3,137,588 2025 4,577 60,185 5,235 44,862 6,897 4,796 493,776 8,584 3,158,316 2026 4,545 60,638 5,308 44,971 6,949 4,846 497,314 8,452 3,177,123 2027 4,513 61,061 5,382 45,086 7,007 4,887 500,564 8,327 3,194,192 2028 4,499 61,467 5,452 45,206 7,071 4,922 503,598 8,214 3,209,765 2029 4,497 61,804 5,520 45,310 7,140 4,951 506,131 8,111 3,223,525 2030 4,506 62,115 5,585 45,400 7,213 4,973 508,510 8,015 3,236,054 2031 4,510 62,413 5,644 45,486 7,285 4,990 510,788 7,926 3,247,833 2032 4,514 62,691 5,700 45,561 7,353 5,002 513,019 7,858 3,259,114 2033 4,517 62,959 5,750 45,620 7,421 5,012 515,176 7,810 3,269,735
Source: “Nevada County Population Projections 2015 to 2034,” Jeff Hardcastle, AICP, Nevada State Demographer, Nevada Department of Taxation.

NEVADA INITIATIVE TO REGULATE & TAX MARIJUANA: ECONOMIC & FISCAL BENEFITS STUDY
II-6
Table II-3: Projected 21+ Population, by Nevada County: 2015-2033
Year Carson City Churchill Clark Douglas Elko Esmeralda Eureka Humboldt Lander
2015 40,344 17,834 1,504,491 38,277 38,035 801 1,466 12,014 4,746 2016 40,879 17,819 1,523,659 38,567 38,349 833 1,494 11,995 4,759 2017 41,365 17,918 1,543,797 38,840 38,624 852 1,523 11,947 4,741 2018 41,537 18,118 1,565,219 39,122 38,857 859 1,547 11,861 4,657 2019 41,970 18,252 1,585,566 39,329 39,174 860 1,573 11,772 4,548 2020 41,901 18,446 1,605,079 39,570 39,567 854 1,595 11,703 4,412 2021 42,702 18,317 1,623,809 39,785 39,729 842 1,628 11,567 4,305 2022 42,704 18,473 1,641,151 40,041 39,832 828 1,652 11,416 4,214 2023 43,304 18,508 1,657,612 40,266 39,796 807 1,678 11,256 4,101 2024 44,075 18,609 1,673,843 40,415 39,660 787 1,694 11,081 4,022 2025 43,855 18,740 1,689,369 40,489 39,642 762 1,701 10,952 3,948 2026 45,025 18,899 1,705,028 40,585 39,514 738 1,724 10,831 3,874 2027 45,291 19,032 1,720,003 40,632 39,452 715 1,732 10,721 3,824 2028 45,793 19,382 1,732,582 40,675 39,347 697 1,756 10,637 3,775 2029 46,280 19,444 1,742,903 40,707 39,351 678 1,767 10,571 3,726 2030 46,437 19,742 1,751,730 40,748 39,221 659 1,785 10,514 3,702 2031 47,061 19,852 1,759,695 40,730 39,062 639 1,796 10,483 3,684 2032 47,455 20,047 1,766,643 40,676 39,077 624 1,804 10,479 3,687 2033 47,402 20,347 1,772,286 40,599 39,012 608 1,814 10,480 3,699
Source: RCG, Nevada State Demographer.

NEVADA INITIATIVE TO REGULATE & TAX MARIJUANA: ECONOMIC & FISCAL BENEFITS STUDY
II-7
Table II-3: Projected 21+ Population by Nevada County: 2015-2033 (Continued)
Year Lincoln Lyon Mineral Nye Pershing Storey Washoe White Pine Nevada
2015 3,749 39,756 3,496 35,254 5,194 3,371 319,172 7,721 2,075,720 2016 3,707 40,458 3,585 35,285 5,268 3,445 323,340 7,630 2,101,070 2017 3,667 41,318 3,630 35,243 5,343 3,536 328,281 7,544 2,128,166 2018 3,686 41,992 3,679 35,239 5,344 3,624 333,114 7,448 2,155,902 2019 3,666 42,703 3,712 35,270 5,411 3,709 337,808 7,308 2,182,630 2020 3,670 43,187 3,727 35,305 5,478 3,785 342,348 7,173 2,207,800 2021 3,645 43,656 3,721 35,372 5,510 3,833 346,859 6,992 2,232,274 2022 3,601 44,189 3,808 35,383 5,532 3,880 351,176 6,870 2,254,751 2023 3,578 44,659 3,867 35,428 5,492 3,929 355,196 6,754 2,276,233 2024 3,545 45,190 3,910 35,499 5,507 3,970 358,981 6,597 2,297,385 2025 3,529 45,561 3,950 35,620 5,576 4,014 362,302 6,468 2,316,476 2026 3,514 45,886 3,981 35,791 5,581 4,039 365,715 6,371 2,337,098 2027 3,488 46,169 4,069 35,917 5,618 4,045 368,805 6,292 2,355,803 2028 3,482 46,445 4,171 36,009 5,579 4,058 371,435 6,211 2,372,034 2029 3,469 46,676 4,165 36,045 5,664 4,074 373,488 6,119 2,385,129 2030 3,485 46,919 4,194 36,110 5,736 4,085 375,270 6,075 2,396,412 2031 3,462 47,119 4,291 36,163 5,747 4,088 376,736 6,023 2,406,633 2032 3,458 47,263 4,358 36,189 5,804 4,078 378,222 5,972 2,415,836 2033 3,440 47,434 4,456 36,160 5,825 4,077 379,534 5,900 2,423,073
Source: RCG, Nevada State Demographer.
RCG also projected 21+ tourists for 2015-2033, by place of origin – segmented by U.S. regions and
internationally. The 21+ tourist estimates were calculated, by origin, in order to account for regional
differences in tourists’ cannabis demand.
RCG relied on five visitor reports published in Nevada by the following organizations:
• “First Quarter 2015 Volume XXIII, Discover the Facts,” “Second Quarter 2015 Volume XXIII,
Discover the Facts,” “Third Quarter 2015 Volume XXIII, Discover the Facts,” and “Fourth Quarter
2015 Volume XXIII, Discover the Facts,” quarterly reports published by the Nevada Division of
Tourism (“Travel Nevada”);
• “Rural Nevada Visitor Facts: Calendar Year 2015, 2014, 2013, 2012, 2011,” published by Travel
Nevada;
NEVADA INITIATIVE TO REGULATE & TAX MARIJUANA: ECONOMIC & FISCAL BENEFITS STUDY
II-8
• “Las Vegas Visitor Profile Study, 2015,” published by the Las Vegas Convention and Visitor
Authority (“LVCVA”);
• “2015 Visitor Profile Survey Summary Presentation,” published by the Reno-Sparks Convention
and Visitor Authority (“RSCVA”); and
• “2015 Visitor Origins Analysis,” published by the RSCVA.
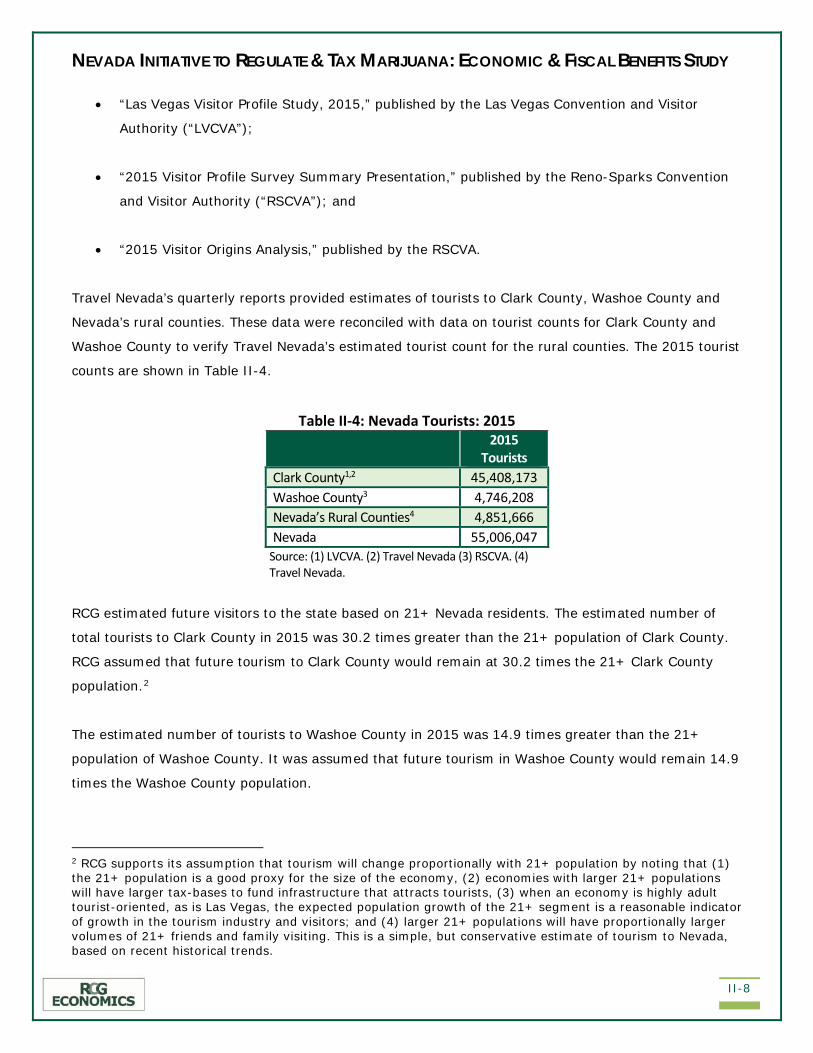
Travel Nevada’s quarterly reports provided estimates of tourists to Clark County, Washoe County and
Nevada’s rural counties. These data were reconciled with data on tourist counts for Clark County and
Washoe County to verify Travel Nevada’s estimated tourist count for the rural counties. The 2015 tourist
counts are shown in Table II-4.
Table II-4: Nevada Tourists: 2015
2015 Tourists
Clark County1,2 45,408,173 Washoe County3 4,746,208 Nevada’s Rural Counties4 4,851,666 Nevada 55,006,047
Source: (1) LVCVA. (2) Travel Nevada (3) RSCVA. (4) Travel Nevada.
RCG estimated future visitors to the state based on 21+ Nevada residents. The estimated number of
total tourists to Clark County in 2015 was 30.2 times greater than the 21+ population of Clark County.
RCG assumed that future tourism to Clark County would remain at 30.2 times the 21+ Clark County
population.2
The estimated number of tourists to Washoe County in 2015 was 14.9 times greater than the 21+
population of Washoe County. It was assumed that future tourism in Washoe County would remain 14.9
times the Washoe County population.
2 RCG supports its assumption that tourism will change proportionally with 21+ population by noting that (1) the 21+ population is a good proxy for the size of the economy, (2) economies with larger 21+ populations will have larger tax-bases to fund infrastructure that attracts tourists, (3) when an economy is highly adult tourist-oriented, as is Las Vegas, the expected population growth of the 21+ segment is a reasonable indicator of growth in the tourism industry and visitors; and (4) larger 21+ populations will have proportionally larger volumes of 21+ friends and family visiting. This is a simple, but conservative estimate of tourism to Nevada, based on recent historical trends.
NEVADA INITIATIVE TO REGULATE & TAX MARIJUANA: ECONOMIC & FISCAL BENEFITS STUDY
II-9
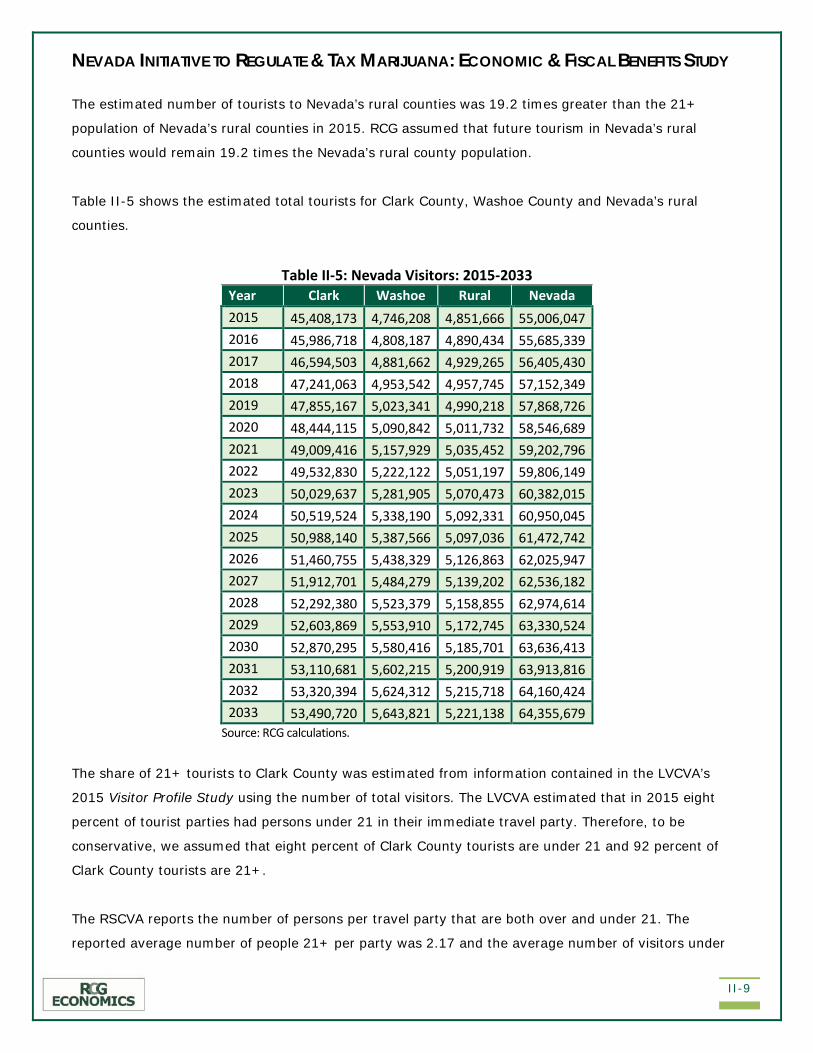
The estimated number of tourists to Nevada’s rural counties was 19.2 times greater than the 21+
population of Nevada’s rural counties in 2015. RCG assumed that future tourism in Nevada’s rural
counties would remain 19.2 times the Nevada’s rural county population.
Table II-5 shows the estimated total tourists for Clark County, Washoe County and Nevada’s rural
counties.
Table II-5: Nevada Visitors: 2015-2033 Year Clark Washoe Rural Nevada 2015 45,408,173 4,746,208 4,851,666 55,006,047 2016 45,986,718 4,808,187 4,890,434 55,685,339 2017 46,594,503 4,881,662 4,929,265 56,405,430 2018 47,241,063 4,953,542 4,957,745 57,152,349 2019 47,855,167 5,023,341 4,990,218 57,868,726 2020 48,444,115 5,090,842 5,011,732 58,546,689 2021 49,009,416 5,157,929 5,035,452 59,202,796 2022 49,532,830 5,222,122 5,051,197 59,806,149 2023 50,029,637 5,281,905 5,070,473 60,382,015 2024 50,519,524 5,338,190 5,092,331 60,950,045 2025 50,988,140 5,387,566 5,097,036 61,472,742 2026 51,460,755 5,438,329 5,126,863 62,025,947 2027 51,912,701 5,484,279 5,139,202 62,536,182 2028 52,292,380 5,523,379 5,158,855 62,974,614 2029 52,603,869 5,553,910 5,172,745 63,330,524 2030 52,870,295 5,580,416 5,185,701 63,636,413 2031 53,110,681 5,602,215 5,200,919 63,913,816 2032 53,320,394 5,624,312 5,215,718 64,160,424 2033 53,490,720 5,643,821 5,221,138 64,355,679
Source: RCG calculations.
The share of 21+ tourists to Clark County was estimated from information contained in the LVCVA’s
2015 Visitor Profile Study using the number of total visitors. The LVCVA estimated that in 2015 eight
percent of tourist parties had persons under 21 in their immediate travel party. Therefore, to be
conservative, we assumed that eight percent of Clark County tourists are under 21 and 92 percent of
Clark County tourists are 21+.
The RSCVA reports the number of persons per travel party that are both over and under 21. The
reported average number of people 21+ per party was 2.17 and the average number of visitors under

NEVADA INITIATIVE TO REGULATE & TAX MARIJUANA: ECONOMIC & FISCAL BENEFITS STUDY
II-10
21 per party was 0.81, which implied that the average number of people per tourist party to Washoe
County was 2.98. The share of 21+ tourists was, therefore, calculated to be 72.8 percent.
Travel Nevada does not report the average age of rural tourists. Accordingly, it was assumed that the
share of 21+ tourists to Nevada’s rural counties was approximately equal to the share of Washoe
County 21+ tourists, 72.8 percent. The 21+ share of tourists is shown below in Table II-11.
C. MARIJUANA DEMAND
MPG estimated resident and tourist demand for adult-use marijuana. The data came from various
sources, including the National Survey on Drug Use and Health (“NSDUH”). MPG assumed that
drug use patterns would not change significantly between 2014 and 2018.
First, using the 21+ population data calculated above by RCG (2,155,902 persons) and the percent
usage of marijuana, by frequency, by the Nevada populace, based on NSDUH data (see Table II-6),
MPG estimated the number of total resident marijuana consumers in Nevada. This provided the
number of base consumers among Nevada residents.
Table II-6: Days Marijuana Used in Past Month among Persons 21+ in Nevada, by Percent: 2014 Never Used
Not Used in Past Month
1-5 Days
6-10 Days
11-15 Days
16-20 Days
21-25 Days
26-30 Days
49.1 43.7 2.5 0.6 1.2 0.5 0.3 2.1 Source: NSDUH.
Using the base figure, MPG calculated an estimated number of total consumers. This figure is the
product of the base consumers and an underreporting adjustment, based on MPG findings3.
However, because this report is estimating the economic effects of adult-use consumers only, we
netted out the estimated medical users to obtain an estimate for adult-use (see Table II-7)4.
The Consultant Team assumed that it would take a full year after passage of Question 2 for the
State to prepare the regulations to allow the adult-use marijuana market to operate, making 2018
the first year of operation of the market.
3 Recent literature suggests that users tend to under-report their drug consumption by 11.1 percent for heavy users and 22.2 percent for all other users. 4 Total resident consumers = [Base resident consumers * (1 + underreporting adjustment)] – medical consumers.

NEVADA INITIATIVE TO REGULATE & TAX MARIJUANA: ECONOMIC & FISCAL BENEFITS STUDY
II-11
Table II-7: Nevada Resident Demand for Adult-Use Marijuana: 2018
Use Frequency Base
Consumers Underreporting
Adjustment Estimated #
of Consumers Medical
Consumers Adult-Use
Consumers Less than once per month 136,252 22.2% 166,530 0 166,530 1-5 days per month 53,898 22.2% 65,875 0 65,875 6-10 days per month 12,935 22.2% 15,810 0 15,810 11-15 days per month 25,871 22.2% 31,620 0 31,620 16-20 days per month 10,780 22.2% 13,175 0 13,175 21-25 days per month 6,468 11.1% 7,186 3,630 3,557 26-31 days per month 45,274 11.1% 50,304 25,408 24,897 Yearly User Total 291,477 - 350,500 29,037 321,463 Monthly User Total 155,225 - 183,970 29,037 154,933
Sources: NSDUH, Marijuana Policy Group, RCG, Nevada State Demographer.
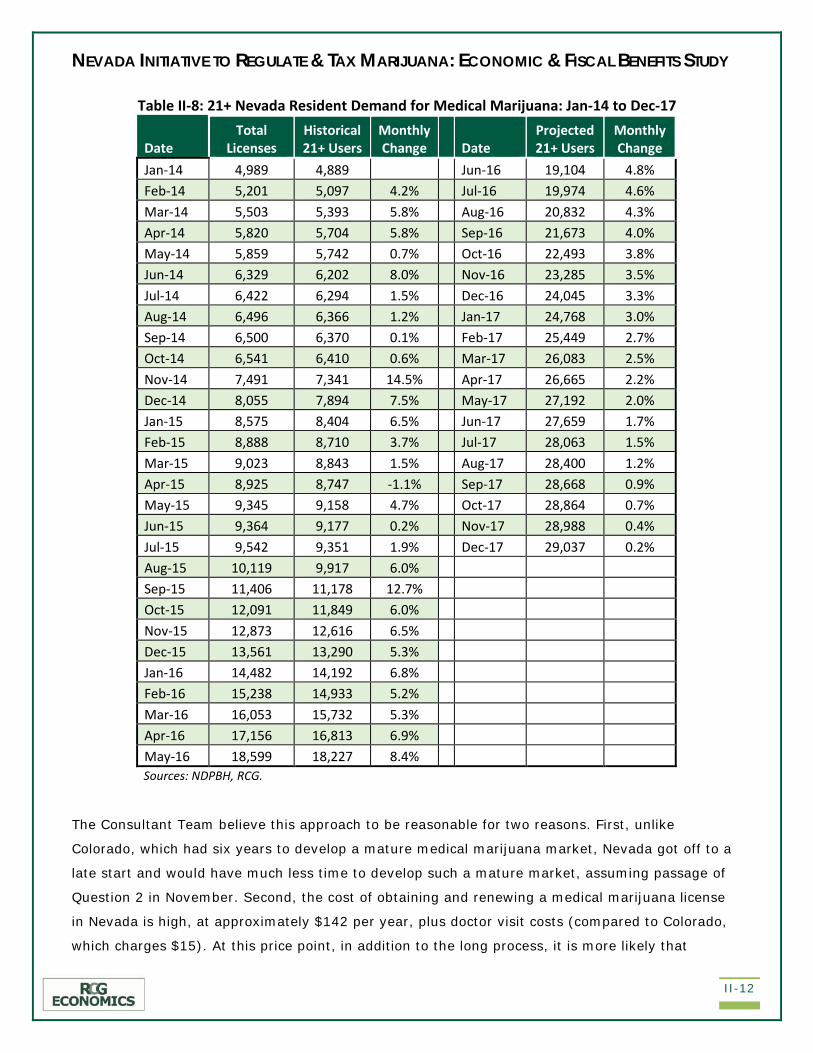
The number of medical users was based on a projection of medical marijuana cardholders in
Nevada at the start of 2018. Data was collected from the Nevada Division of Public and Behavioral
Health (“NDPBH”), which approves medical marijuana licenses to state residents. According to the
NDPBH, about two percent of all licensees are under 21, so we subtracted out these users, because
they will not be able to participate in the adult-use market. It was assumed that the average rate
of growth in 21+ medical marijuana licenses would be at the rate of growth from January 2014
through May 2016, starting in June 2016, and would slow to the Woods & Poole projected
population growth level for Clark County by December 2017 (see Table II-8).
NEVADA INITIATIVE TO REGULATE & TAX MARIJUANA: ECONOMIC & FISCAL BENEFITS STUDY
II-12
Table II-8: 21+ Nevada Resident Demand for Medical Marijuana: Jan-14 to Dec-17
Date Total
Licenses Historical 21+ Users
Monthly Change
Date
Projected 21+ Users
Monthly Change
Jan-14 4,989 4,889 Jun-16 19,104 4.8% Feb-14 5,201 5,097 4.2% Jul-16 19,974 4.6% Mar-14 5,503 5,393 5.8% Aug-16 20,832 4.3% Apr-14 5,820 5,704 5.8% Sep-16 21,673 4.0% May-14 5,859 5,742 0.7% Oct-16 22,493 3.8% Jun-14 6,329 6,202 8.0% Nov-16 23,285 3.5% Jul-14 6,422 6,294 1.5% Dec-16 24,045 3.3% Aug-14 6,496 6,366 1.2% Jan-17 24,768 3.0% Sep-14 6,500 6,370 0.1% Feb-17 25,449 2.7% Oct-14 6,541 6,410 0.6% Mar-17 26,083 2.5% Nov-14 7,491 7,341 14.5% Apr-17 26,665 2.2% Dec-14 8,055 7,894 7.5% May-17 27,192 2.0% Jan-15 8,575 8,404 6.5% Jun-17 27,659 1.7% Feb-15 8,888 8,710 3.7% Jul-17 28,063 1.5% Mar-15 9,023 8,843 1.5% Aug-17 28,400 1.2% Apr-15 8,925 8,747 -1.1% Sep-17 28,668 0.9% May-15 9,345 9,158 4.7% Oct-17 28,864 0.7% Jun-15 9,364 9,177 0.2% Nov-17 28,988 0.4% Jul-15 9,542 9,351 1.9% Dec-17 29,037 0.2% Aug-15 10,119 9,917 6.0% Sep-15 11,406 11,178 12.7% Oct-15 12,091 11,849 6.0% Nov-15 12,873 12,616 6.5% Dec-15 13,561 13,290 5.3% Jan-16 14,482 14,192 6.8% Feb-16 15,238 14,933 5.2% Mar-16 16,053 15,732 5.3% Apr-16 17,156 16,813 6.9% May-16 18,599 18,227 8.4% Sources: NDPBH, RCG.
The Consultant Team believe this approach to be reasonable for two reasons. First, unlike
Colorado, which had six years to develop a mature medical marijuana market, Nevada got off to a
late start and would have much less time to develop such a mature market, assuming passage of
Question 2 in November. Second, the cost of obtaining and renewing a medical marijuana license
in Nevada is high, at approximately $142 per year, plus doctor visit costs (compared to Colorado,
which charges $15). At this price point, in addition to the long process, it is more likely that
NEVADA INITIATIVE TO REGULATE & TAX MARIJUANA: ECONOMIC & FISCAL BENEFITS STUDY
II-13
additional residents would forego applying for cards and that existing license holders would forego
renewing theirs. Instead, both groups would opt to pay nothing up-front and would shop at adult-
use locations. However, it is possible that the State of Nevada could lower these fees to incentivize
medical users to remain in the medical market, as was done in Colorado. Therefore, to be
conservative, it was assumed that the number of medical users after the creation of the adult-use
market would remain constant at 2018 levels.
Medical users are generally daily users, by definition. Therefore, these users were distributed
among the two most frequent user groups by using the same distribution as for total marijuana
users. For example, 7,186 consumers smoke marijuana 21-25 days per month out of 57,490
consumers that smoke 21-31 days per months. Therefore, that cohort makes up 12.5 percent of
the heavy users. This percentage was applied to medical users in the same cohort (29,037 *
12.5% = 3,630).
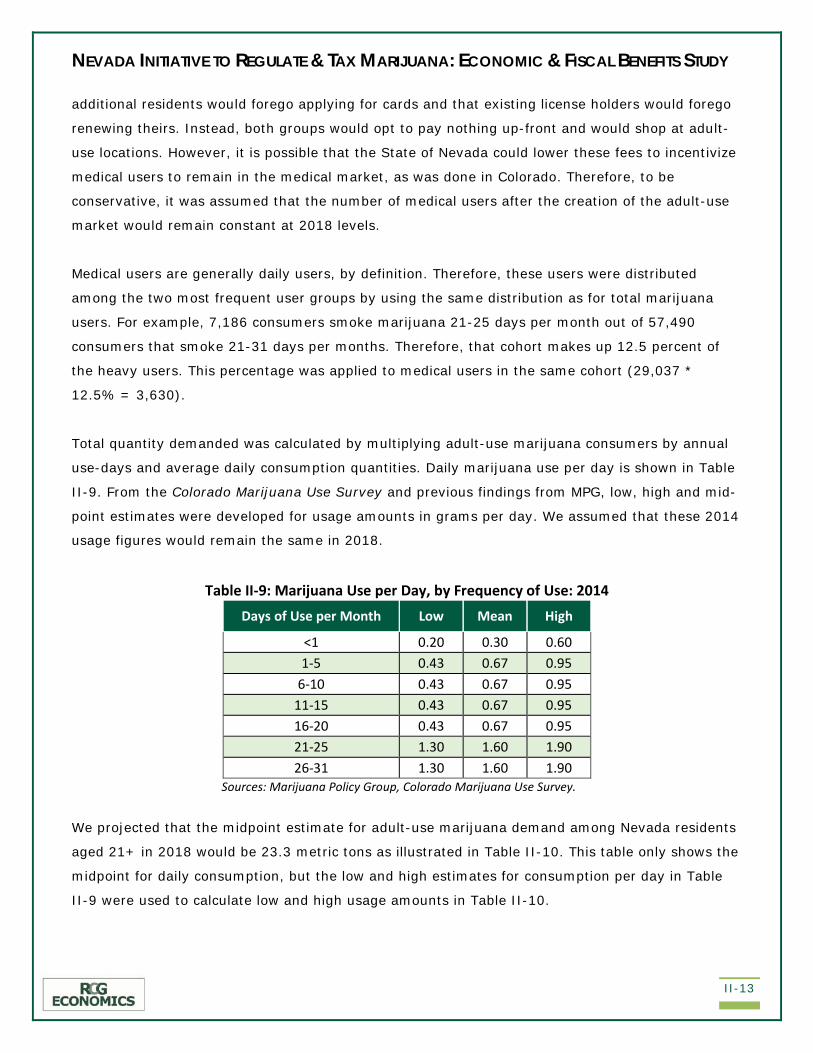
Total quantity demanded was calculated by multiplying adult-use marijuana consumers by annual
use-days and average daily consumption quantities. Daily marijuana use per day is shown in Table
II-9. From the Colorado Marijuana Use Survey and previous findings from MPG, low, high and mid-
point estimates were developed for usage amounts in grams per day. We assumed that these 2014
usage figures would remain the same in 2018.
Table II-9: Marijuana Use per Day, by Frequency of Use: 2014
Days of Use per Month Low Mean High
<1 0.20 0.30 0.60 1-5 0.43 0.67 0.95
6-10 0.43 0.67 0.95 11-15 0.43 0.67 0.95 16-20 0.43 0.67 0.95 21-25 1.30 1.60 1.90 26-31 1.30 1.60 1.90
Sources: Marijuana Policy Group, Colorado Marijuana Use Survey.
We projected that the midpoint estimate for adult-use marijuana demand among Nevada residents
aged 21+ in 2018 would be 23.3 metric tons as illustrated in Table II-10. This table only shows the
midpoint for daily consumption, but the low and high estimates for consumption per day in Table
II-9 were used to calculate low and high usage amounts in Table II-10.

NEVADA INITIATIVE TO REGULATE & TAX MARIJUANA: ECONOMIC & FISCAL BENEFITS STUDY
II-14
Table II-10: Adult Nevada Resident Demand for Marijuana: 2018 Frequency
of Use Estimated #
of Consumers Avg. Annual
Use-Days Avg. Daily
Consumption Usage Amounts:
(Kilograms) Share of Nevada
Days/Mnth Persons Days/Year Grams Low Mid High Users Demand <1 166,530 6 0.30 200 300 600 51.8% 1.3% 1-5 65,875 36 0.67 1,028 1,581 2,253 20.5% 6.8%
6-10 15,810 96 0.67 658 1,012 1,442 4.9% 4.3% 11-15 31,620 156 0.67 2,138 3,288 4,686 9.8% 14.1% 16-20 13,175 216 0.67 1,233 1,897 2,704 4.1% 8.2% 21-25 3,557 276 1.60 1,276 1,571 1,865 1.1% 6.7% 26-31 24,897 342 1.60 11,069 13,623 16,178 7.7% 58.5% Total: 321,463 - - 17,601 23,272 29,727 100% 100%
Sources: NSDUH, Marijuana Policy Group, RCG, Nevada State Demographer.
MPG also estimated the annual tourist demand for marijuana using a similar method for the three
tourist destination areas - Clark County, Washoe County and the rural counties. Visitors aged 21+
to each destination area are presented based on visitor estimates by origin in Table II-11.
MPG applied average NSDUH “past-month use prevalence (frequency)”, by region of origin, to
estimate the total number of tourists that are current marijuana users5,6. It is generally customary
in estimating tourist marijuana use to count only past-month users. However, an alternate
approach is more accurate for destinations with more lively entertainment offerings, such as Las
Vegas. Tourists visiting Las Vegas often go for the gambling, nightlife, dining, music festivals,
concerts and other events. MPG accounted for the “entertainment effect” on tourists visiting Clark
County by including past-year users in the Clark County tourist user estimates. Table II-11
provides the results of these calculations. MPG estimated that 6,983,158 tourists, or about 13.9
percent of all 21+ tourists, would potentially consume marijuana during their visit to Nevada in
2018.
Total tourists from each U.S. region is the product of total tourists to each county and the
percentage of tourists from each region for that county. The share of tourists, by location of origin,
5 For each U.S. region, the NSDUH prevalence estimates were averaged for all states included in that region. For tourists from California and Arizona, NSDUH estimates of prevalence allowed for breakdown by state. Tourists originating in Nevada were excluded because they are included in the resident demand section. For the remaining tourists from the West region (those in the ‘Other’ category), the prevalence estimates from all other West Region states were averaged, excluding California, Arizona and Nevada. For foreign tourists, the overall U.S. national average was applied to past-month and past-year marijuana use prevalence estimates. 6 Regional prevalence estimates were uniformly adjusted for under-reporting by the average 22.2 percent.

NEVADA INITIATIVE TO REGULATE & TAX MARIJUANA: ECONOMIC & FISCAL BENEFITS STUDY
II-15
used by MPG for the rural counties was the average of Clark and Washoe counties. Tourists that
are 21+ years of age, by region of origin, was calculated using the share of 21+ tourists for the
Nevada geographies.
For Clark County, the total number of 21+ marijuana-using tourists was calculated by multiplying
the number of 21+ tourists by the sum of past-month prevalence (frequency) of users, by origin,
plus the past-year prevalence of users, by origin, times one plus the underreporting adjustment.
For Washoe and the rural counties, the total number of 21+ marijuana user tourists was calculated
by multiplying the number of 21+ tourists by the past-month prevalence of users, by origin, times
one plus the underreporting adjustment7.
The final step before obtaining the total adult-use tourists was to net out the medical tourist users.
The number of medical-using tourists was already estimated by MPG in a previous study8. That
study found that Nevada would attract 182,439 eligible medical marijuana card holders per year.
Compared to total visitors to Nevada, this was such a small figure (2.6%) that the Consultant
Team assumed that there would be no change in medical marijuana-using tourists by 2018. These
users were distributed, by domestic region of origin, for each county using the same regional
shares as for all Nevada visiting marijuana users, given in the MPG medical study. Assuming that
all these visitors would make their purchases at medical dispensaries, it resulted in 6,800,719 total
adult-use marijuana consumers visiting Nevada in 2018.
7 # of 21+ marijuana-using tourists = # of total 21+ tourists * ( past month prevalence of users + past-year prevalence of users ) * ( 1 + underreporting adjustment ) 8 Nevada Medical Marijuana Demand Model. BBC Consulting. February 2014.

Table II-11: Nevada Marijuana Adult-Use Tourists-Domestic: 2018 Tourist
Destination & Region of Origin
% of Tourists
from Region
Total Tourists
from Region
% of Tourists
Aged 21+
Tourists Aged 21+
Past-Month 21+ User % Prevalence
by Origin
Past-Year 21+ User % Prevalence
by Origin
Underreporting % Adjustment
Total 21+ Marijuana User
Tourists
Total 21+ Medical Use
Tourists
Total 21+ Adult-Use Tourists
Clark County
East 7% 3,306,874 92% 3,042,324 9.88% 4.27% 22.2% 526,057 33,919 492,138 South 13% 6,141,338 92% 5,650,031 6.18% 3.36% 22.2% 658,674 2,924 655,750 Midwest 11% 5,196,517 92% 4,780,796 6.45% 3.45% 22.2% 578,371 39,145 539,226 West
CA 29% 13,699,908 92% 12,603,916 9.24% 3.44% 22.2% 1,952,972 3,630 1,949,342 AZ 9% 4,251,696 92% 3,911,560 7.96% 4.00% 22.2% 571,679 10,069 561,611 Other 14% 6,613,749 92% 6,084,649 9.90% 3.94% 22.2% 1,029,065 66,940 962,125
Foreign 16% 7,558,570 92% 6,953,884 7.73% 3.52% 22.2% 955,985 0 955,985 Subtotal - 46,768,652 - 43,027,160 - 6,272,804 156,627 6,116,177
Washoe County
East 13% 643,960 72.8% 468,924 9.88% - 22.2% 56,615 2,787 53,828 South 24% 1,188,850 72.8% 865,706 6.18% - 22.2% 65,378 240 65,138 Midwest 15% 743,031 72.8% 541,066 6.45% - 22.2% 42,646 3,216 39,430 West
CA 32% 1,585,133 72.8% 1,154,275 9.24% - 22.2% 130,332 298 130,034 AZ 3% 148,606 72.8% 108,213 7.96% - 22.2% 10,526 827 9,699 Other 10% 495,354 72.8% 360,711 9.90% - 22.2% 43,638 5,500 38,139
Foreign 1% 49,535 72.8% 36,071 7.73% - 22.2% 3,407 0 3,407
Subtotal - 4,854,471 - 3,534,967 - 352,543 12,868 339,675 Rural Counties
East 10% 495,774 72.8% 361,017 9.88% - 22.2% 43,587 2,803 40,784 South 19% 917,183 72.8% 667,881 6.18% - 22.2% 50,438 242 50,196 Midwest 13% 644,507 72.8% 469,322 6.45% - 22.2% 36,991 3,235 33,756 West
CA 31% 1,512,112 72.8% 1,101,102 9.24% - 22.2% 124,328 300 124,029 AZ 6% 297,465 72.8% 216,610 7.96% - 22.2% 21,070 832 20,238 Other 12% 594,929 72.8% 433,220 9.90% - 22.2% 52,410 5,532 46,878
Foreign 9% 421,408 72.8% 306,864 7.73% - 22.2% 28,987 0 28,987 Subtotal - 4,883,379 - 3,556,017 - 357,812 12,945 344,867
NEVADA TOTAL - 56,506,502 - 50,118,144 - 6,983,158 182,439 6,800,719 Note: Visitor totals do not match original totals due to exclusion of Nevada in-state tourists. Sources: NSDUH, Marijuana Policy Group, RCG, Travel Nevada, Las Vegas Convention and Visitors Authority, Reno Sparks Convention and Visitors Authority.

NEVADA INITIATIVE TO REGULATE AND TAX MARIJUANA: ECONOMIC & FISCAL BENEFITS STUDY
II-17
In order to estimate the daily consumption quantity for tourists, MPG used national NSDUH
prevalence and frequency estimates to calculate a weighted average consumption amount of 0.98
grams per day among past-month marijuana users as illustrated in the Table II-12. Average daily
consumption amounts were obtained from surveys conducted in Colorado and Washington.9 We
assumed that past-month and past-year marijuana users would consume this quantity during their
visit. Again, it was assumed that these 2014 estimates would remain constant in 2018.
Table II-12: U.S. Average Daily Marijuana Consumption for Past-Month Marijuana Users: 2014 Frequency of Use Among U.S. Past-Month Marijuana Users
Average Daily Consumption
Days/Month Percent Grams 1-5 39.0% 0.67
6-10 10.5% 0.67 11-15 7.5% 0.67 16-20 9.0% 0.67 21-25 6.8% 1.60 26-31 27.2% 1.60
Weighted Average Grams per Day 0.98 Sources: NSDUH, Marijuana Policy Group.
In order to estimate the total quantity of adult-use marijuana potentially demanded by tourists,
MPG multiplied the total 21+ adult-use tourist figure for each Nevada area by the average length of
stay for that area. This calculation yielded the total visitor-nights by 21+ adult marijuana tourist
users to each area. We then multiplied total visitor-nights by the average consumption quantity to
estimate a total demand for adult tourists: 22,684 kilograms (1 kg = 1,000 g). Table II-13 below
provides the MPG estimates for tourist demand, by destination area, as well as Nevada’s total
demand in 2018. MPG estimated the combined tourist and resident demand for adult-use
marijuana in Nevada to be 46,000 kg.
9 MPG. Colorado Cannabis User Survey. Colorado Department of Revenue. 2014. and BOTEC Analysis. Washington Cannabis User Survey. 2014.
NEVADA INITIATIVE TO REGULATE AND TAX MARIJUANA: ECONOMIC & FISCAL BENEFITS STUDY
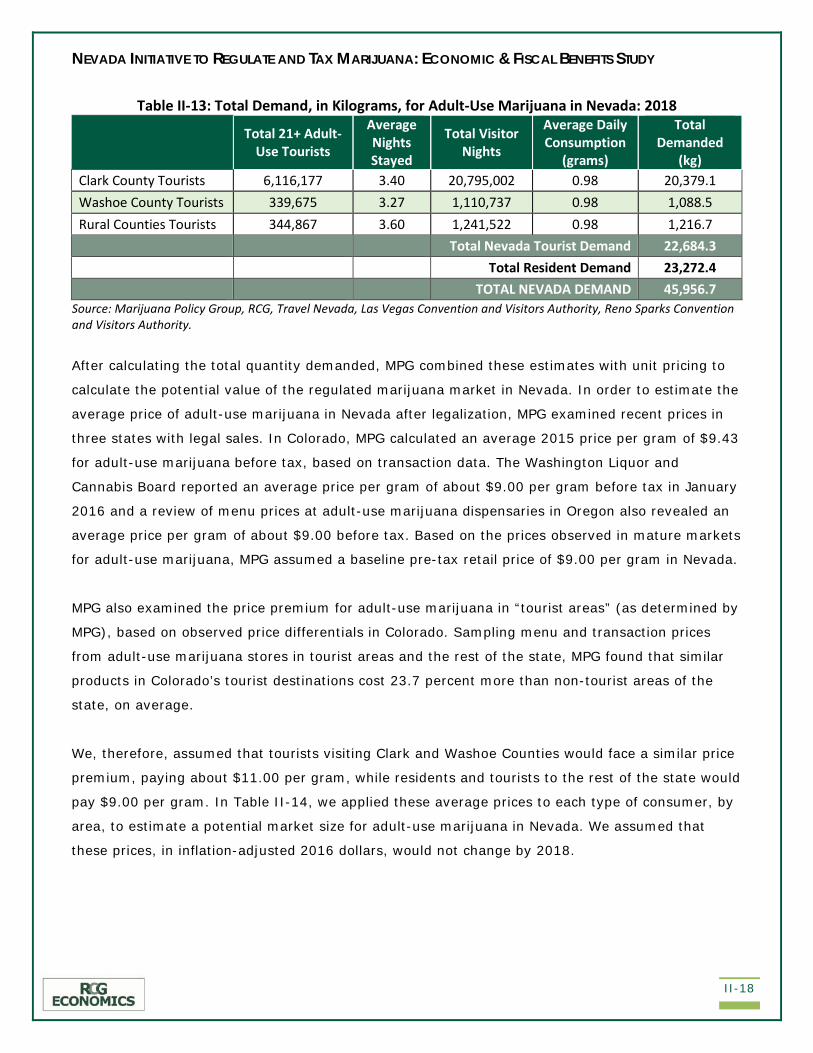
II-18
Table II-13: Total Demand, in Kilograms, for Adult-Use Marijuana in Nevada: 2018
Total 21+ Adult-Use Tourists
Average Nights Stayed
Total Visitor Nights
Average Daily Consumption
(grams)
Total Demanded
(kg) Clark County Tourists 6,116,177 3.40 20,795,002 0.98 20,379.1 Washoe County Tourists 339,675 3.27 1,110,737 0.98 1,088.5 Rural Counties Tourists 344,867 3.60 1,241,522 0.98 1,216.7 Total Nevada Tourist Demand 22,684.3
Total Resident Demand 23,272.4 TOTAL NEVADA DEMAND 45,956.7
Source: Marijuana Policy Group, RCG, Travel Nevada, Las Vegas Convention and Visitors Authority, Reno Sparks Convention and Visitors Authority.
After calculating the total quantity demanded, MPG combined these estimates with unit pricing to
calculate the potential value of the regulated marijuana market in Nevada. In order to estimate the
average price of adult-use marijuana in Nevada after legalization, MPG examined recent prices in
three states with legal sales. In Colorado, MPG calculated an average 2015 price per gram of $9.43
for adult-use marijuana before tax, based on transaction data. The Washington Liquor and
Cannabis Board reported an average price per gram of about $9.00 per gram before tax in January
2016 and a review of menu prices at adult-use marijuana dispensaries in Oregon also revealed an
average price per gram of about $9.00 before tax. Based on the prices observed in mature markets
for adult-use marijuana, MPG assumed a baseline pre-tax retail price of $9.00 per gram in Nevada.
MPG also examined the price premium for adult-use marijuana in “tourist areas” (as determined by
MPG), based on observed price differentials in Colorado. Sampling menu and transaction prices
from adult-use marijuana stores in tourist areas and the rest of the state, MPG found that similar
products in Colorado’s tourist destinations cost 23.7 percent more than non-tourist areas of the
state, on average.
We, therefore, assumed that tourists visiting Clark and Washoe Counties would face a similar price
premium, paying about $11.00 per gram, while residents and tourists to the rest of the state would
pay $9.00 per gram. In Table II-14, we applied these average prices to each type of consumer, by
area, to estimate a potential market size for adult-use marijuana in Nevada. We assumed that
these prices, in inflation-adjusted 2016 dollars, would not change by 2018.

NEVADA INITIATIVE TO REGULATE AND TAX MARIJUANA: ECONOMIC & FISCAL BENEFITS STUDY
II-19
Table II-14: Nevada Adult-Use Marijuana Market Size in Grams & 2016 Dollars: 2018
Quantity Demanded (grams)
Average Price Per Gram
Potential Market Value
Clark County Tourists 20,379,102 $11.00 $224,170,118 Washoe County Tourists 1,088,522 $11.00 $11,973,745 Rural Counties Tourists 1,216,691 $9.00 $10,950,221 Nevada Tourist Market Size 22,684,315 - $247,094,084 Nevada Resident Market Size* 23,272,369 $9.00 $146,615,925 Nevada Adult-Use Marijuana Market Size 45,956,684 - $393,710,009
Note: *Assumes 70% first year capture rate. Source: Marijuana Policy Group.
The demand methodology used herein yielded a total Nevada market size for adult-use marijuana
of $393.7 million in 2018. The estimated market size associated with tourists visiting Nevada is
$247.1 million (63 percent), while residents account for a market size of $146.6 million (37
percent).
NEVADA INITIATIVE TO REGULATE & TAX MARIJUANA: ECONOMIC & FISCAL BENEFITS STUDY
III-1
III. ECONOMIC BENEFITS ANALYSIS (“EBA”)
A. OVERVIEW
he following pages summarize the findings and conclusions regarding the potential economic
benefits to the State of Nevada associated with the passage of a ballot initiative to regulate
and tax marijuana sales. This initiative, Question 2, will be on the ballot in November 2016 and, if
passed, would likely lead to the introduction of adult-use marijuana sales in January 2018.
The Consultant Team performed this EBA to identify the potential benefits of a regulated adult-use
marijuana market on the Nevada economy. The Study attempts to quantify these benefits to
Nevada, based on the creation of jobs, as well as the generation of wages and economic activity
(output/spending).
B. STATEMENT OF METHODOLOGY
The Consultant Team used the text of the ballot initiative to analyze the effects of adult-use
marijuana legalization. We calculated the equilibrium demand in the previous section of the report.
The Consultant Team used this demand information to estimate three types of economic benefits to
the state of Nevada: direct, indirect and induced. The concept of a direct benefit is relatively
straightforward. However, concepts of indirect and induced benefits, while critically important in
assessing the totality of benefits associated with new economic activities, are often misunderstood
in economic analysis. Fundamentally, these secondary and tertiary benefits are based on an
extension of the direct expenditures/spending associated with would-be adult-use marijuana
purchases. Each type of benefit is briefly described below.
Direct benefits are due to the retail purchases of marijuana; the jobs created to support the
retail stores; and the labor income (employee compensation, proprietor income and benefits
paid) – essentially the direct benefits associated with marijuana regulation.
Indirect benefits are the local purchases of goods and services resulting from the initial
direct spending caused by marijuana retail spending. For example, the retailers’ spending
on marijuana cultivation, office supplies, rent, utilities, food manufacturing and the like will
cause suppliers to replenish inventories, etc. These sales are counted as an indirect
economic benefit.
T
NEVADA INITIATIVE TO REGULATE & TAX MARIJUANA: ECONOMIC & FISCAL BENEFITS STUDY
III-2
Induced benefits are the output, employment and labor income growth generated by the
employees of marijuana retailers and their local suppliers as they consume goods and
services in the Nevada economy. Put another way, induced benefits are benefits from labor
income spent by direct and indirect employees. For example, a new employee to the area
works as a cashier at one of the marijuana retailers. The portion of his or her personal
income will be spent locally, will cycle through the region, and will be exchanged among
local merchants; thus, inducing additional new spending (retail, food, gas, etc.) and
employment in the region.
Estimates of the direct, indirect and induced benefits to output and employment benefits, as well
as direct labor income benefits, were prepared by MPG. MPG constructed a new model that
integrates the legal marijuana industry in Colorado into the broader economy using cross-industry
data from the widely accepted IMPLAN (IMpact Analysis for PLANning) economic input-output
model to create the “Marijuana Impact Model,” or “MIM”. The Marijuana Impact Model was adapted
to Nevada’s economy, based on the most recent Nevada IMPLAN data, in order to estimate the
economic benefit of marijuana regulation, as worded in Question #2.
The IMPLAN model has been in use since 1979. The model accounts closely follow the accounting
conventions used in the “Input-Output Study of the U.S. Economy” by the U.S. Bureau of Economic
Analysis.
The MIM calculates the benefit of marijuana legalization on overall economic activity and
employment. This model does not include indirect and induced multipliers for labor income.
Therefore, the Team used a similar sector as a proxy for the marijuana industry regarding labor
income. We discuss this in greater detail below.
This EBA was prepared under various limiting assumptions acknowledged and presented herein:
Substitution Effects: This analysis does not factor in any changes to purchases of other
goods and services on which marijuana expenditures might alternatively have been spent.
Without factoring in consumers’ substitutions between goods and services, the EBA
measures economic benefits of the Initiative to the Nevada economy.
Supply/Demand Pooling: For all direct retail sales, the marijuana initiative requires that
demands be accommodated in-state. However, for indirect demand, such as for cultivators,

NEVADA INITIATIVE TO REGULATE & TAX MARIJUANA: ECONOMIC & FISCAL BENEFITS STUDY
III-3
we have assumed that demands will be accommodated in-state to the greatest extent
possible. Thus, all needs that can possibly be met by in-state producers/suppliers will be
met by these producers/suppliers. If demand is greater than supply, local
producers/suppliers will meet as much of that demand as possible and the remaining
demand will be met from outside the region. Since this minimizes imports, it would
maximize local economic activity and the resulting multipliers.
Economic Leakage: the Consultant Team’s analysis also recognizes as important,
“leakage” from the study region (Nevada) due to spending on purchases outside of the
region. Economic leakage refers to revenues that flow out of a local or regional economy to
finance the purchase of goods and services from outside sources (imports) instead of being
purchased locally. In a highly developed and urbanized local economy, a large share of the
goods and services consumed are purchased from local producers and suppliers.
In this Study, all estimates (except employment) are in inflation-adjusted 2016 dollars.
Three categories are estimated for each type of benefit. They include:
Changes to output/spending (equivalent to Gross Product)
Changes to employment (measured in terms of annual full-time equivalents, or “FTEs” for
annual jobs or person-years for the full 2018-2024 study period totals, which are equal to
FTEs multiplied by the number of years in the analysis)
Changes to labor income (employee compensation, proprietor income and benefits paid)
C. MARIJUANA BENEFIT MODEL
MPG’s “marijuana impact model” divides the industry into three types of activities: cultivation,
manufacturing and retail. Each segment is represented using a unique production function, with
different inputs, outputs and linkages to the economy.
Each segment is tightly connected to the others. For example, 100 percent of each cultivator’s
products must be sold exclusively to retailers and manufacturers within the state. Likewise,
manufacturers and retailers must purchase 100 percent of their products from cultivators who are
also inside the state.

NEVADA INITIATIVE TO REGULATE & TAX MARIJUANA: ECONOMIC & FISCAL BENEFITS STUDY
III-4
This unique structure creates a highly localized industry, where almost all of the spending on
marijuana flows to enterprises inside the state. As a result, the marijuana industry tends to create
more local output and employment per dollar than most other sectors.
Using MPG’s Marijuana Impact Model, it was found that each dollar spent on retail marijuana
generates $2.33 in state output. This compares favorably with general retail trade, which yields
$1.71 per dollar. Other more traditional, and often subsidized, sectors such as gold mining
generate $1.50 per dollar. Amusement parks generate just $1.48 per dollar of spending. Other
industries have lower output yields because their inputs are sourced outside of the state, or
because the profits are remitted to corporate owners that exist primarily outside of the state as
well. The higher output multiplier is due to the requirement that marijuana inputs be purchased
from within Nevada. The legal marijuana industry would have substantially lower leakages
compared to the other traditional Nevada industries.
Integrating the Marijuana Industry into the Economic Model
In order to integrate marijuana activities into overall Nevada economy, each segment of the
industry is inserted into the state’s economic accounts. For example, the marijuana cultivation
sector is inserted into the industrial classification sector that includes Floriculture and Tobacco
Farming. Retail stores and dispensaries are inserted as a type of specialty retail store, and infused
product manufacturers are included as part of the food manufacturing sector.
In this way, the production activities for each marijuana segment can be connected with the rest of
the Nevada economy.
Next, MPG constructed “business spending patterns” for each industry segment to trace how
marijuana spending flows through the state’s economy. Since marijuana is currently a cash-only
business and is confined within the state, most of the cash accrues directly to local cultivation and
manufacturing. Financial services are limited, and instead funds are spent on security and cash
transportation services, such as armored vehicles.
The largest spending category for retailers is the product itself1 (marijuana flower), followed by
employee payrolls, business rent, security services, compliance and consulting services.
1 Vertically-integrated operations do not explicitly account for the cost of marijuana flower. The MPG uses average market rate pricing to convert the implicit pricing for these firms into an explicit cost for the retail

NEVADA INITIATIVE TO REGULATE & TAX MARIJUANA: ECONOMIC & FISCAL BENEFITS STUDY
III-5
Cultivation in Nevada is expected to primarily occur indoors, making electricity and HVAC the
largest portion of spending, next to fertilizers, pesticides and other agricultural inputs. Payrolls
round out the largest components of spending for cultivators.
Infused-product manufacturers purchase marijuana trim and flower as the primary input to
production, followed by other food products, then machinery rents, payrolls, warehouse rental (or
imputed rent), security and cash management services, and chemicals. All three segments of the
marijuana industry have increased their spending on product safety and testing services. Marijuana
businesses in many states are now required to test for potency and product safety, including
pesticide residue and other harmful chemicals.
As the marijuana industry matures and becomes more structured, there will be more demand for
services. These include specialized law firms, consultancies and professional service providers.
These firms provide industry-specific analyses and advice to private enterprise and government
regulatory agencies.
By identifying each marijuana industry segment and classifying and quantifying its activities, they
can each be inserted into the State Economic accounts for Nevada. From there, an Input-Output
model is constructed and the benefit of marijuana spending can be computed for the region.
Note: The MIM model does not calculate labor income multipliers. Therefore, the Consultant Team
used proxy multipliers to calculate labor income. The direct labor income multiplier was based on
MIM estimates from MPG. The indirect and induced proxy income multipliers used were for the
“Other state government enterprises” IMPLAN sector, in which indirect spending tends toward
remaining in-state due to legal and other considerations, similar to spending mandates in the case
of marijuana-related activities. These multipliers appeared reasonable relative to the Colorado and
Washington data gathered by Consultant Team. The induced spending is also conservative relative
to the IMPLAN “Private households” sector, indicating that the overall multiplier could even be
higher.
operation and an explicit revenue for the cultivators, even if the cash is not directly transferred between these departments within a single, vertically-integrated firm.

NEVADA INITIATIVE TO REGULATE & TAX MARIJUANA: ECONOMIC & FISCAL BENEFITS STUDY
III-6
D. DETAILED EBA RESULTS
Two main factors for industry size and growth rates are the initial level of the black market and the
rate of transition from black market to the regulated market. This transition is what accounts for
most of the sectoral growth in the legal marijuana industry during the early years.
During the first year of operation in Colorado in 2014, MPG estimated that the legal marijuana
market supplied approximately 57 percent of total demand. This increased to and 67 percent of
total demand in 2015, with the remaining demand supplied by the gray-market (caregivers), home
growing and the black market. But the subsequent transition led to a rapidly growing “formal”
industry. Total sales were $786 million in 2014 and grew by 27 percent to $996 million in 2015.
Nevada’s market is likely to begin with a more highly formalized (regulated) market share. This will
occur because the tourist marketplace does not have the “entrenched” dealers that exist in the
resident black market. Tourists likely will not have time to try and find a local marijuana dealer. If
there’s an open store nearby, they will choose that. Residents can often find lower prices if they
continue using their existing black-market suppliers.
Since Nevada is expected to have a much larger tourist demand segment, the regulated market
share will likely be higher than it was for Colorado. Thus, for this study, the first year capture was
assumed to be 70 percent, second year at 90 percent and 95 percent thereafter.
After saturation, the market is expected to grow at the “secular” rate of growth, which equals the
rate of population growth, plus tourist growth plus any shift in preferences. For example, currently
secular growth for cigarettes is negative due to a societal shift in preferences away from cigarette
use. However, we assumed no shift in preferences for the term of this study.
Table III-1 shows the effects of the passage of Question 2 in Nevada from 2018-2024. The range
begins in 2018 because January 2018 would likely be when the new regulated market would come
online. The range extends to 2024 because MPG estimates that the market will hit maturity by the
end of that year. Due to rounding issues, the following direct results may not add exactly
(differences less than 0.005%) with the results in the demand section.
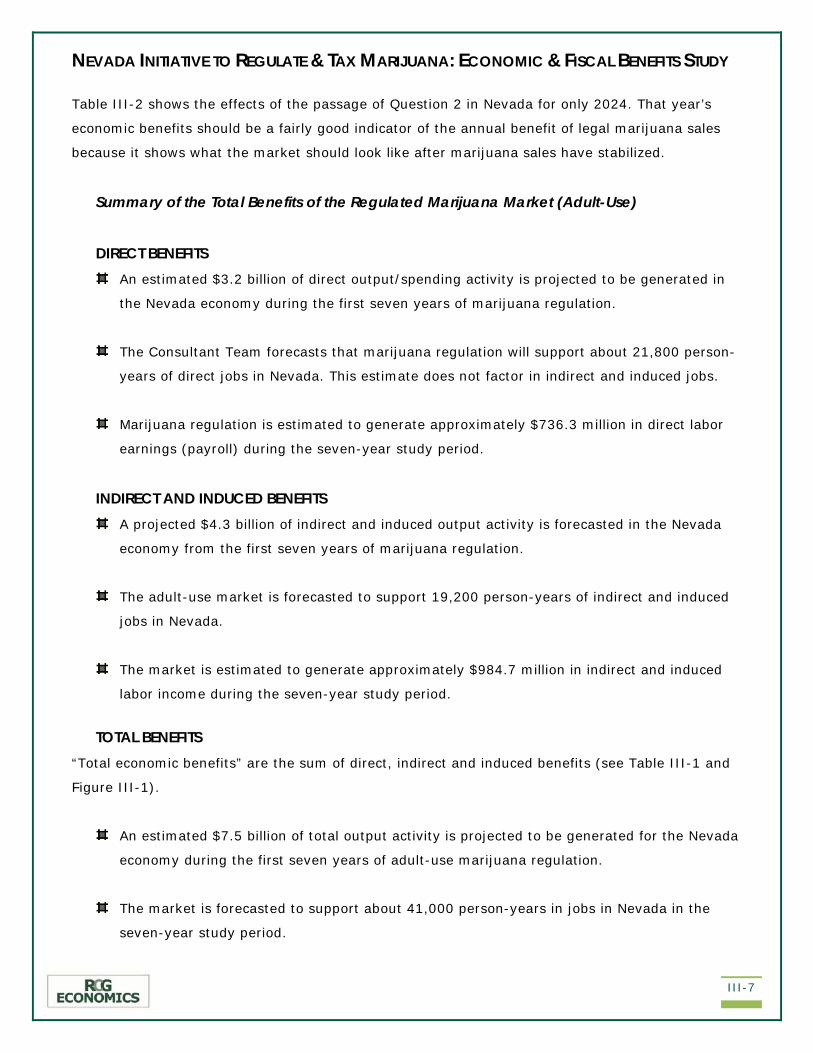
NEVADA INITIATIVE TO REGULATE & TAX MARIJUANA: ECONOMIC & FISCAL BENEFITS STUDY
III-7
Table III-2 shows the effects of the passage of Question 2 in Nevada for only 2024. That year’s
economic benefits should be a fairly good indicator of the annual benefit of legal marijuana sales
because it shows what the market should look like after marijuana sales have stabilized.
Summary of the Total Benefits of the Regulated Marijuana Market (Adult-Use)
DIRECT BENEFITS An estimated $3.2 billion of direct output/spending activity is projected to be generated in
the Nevada economy during the first seven years of marijuana regulation.
The Consultant Team forecasts that marijuana regulation will support about 21,800 person-
years of direct jobs in Nevada. This estimate does not factor in indirect and induced jobs.
Marijuana regulation is estimated to generate approximately $736.3 million in direct labor
earnings (payroll) during the seven-year study period.
INDIRECT AND INDUCED BENEFITS A projected $4.3 billion of indirect and induced output activity is forecasted in the Nevada
economy from the first seven years of marijuana regulation.
The adult-use market is forecasted to support 19,200 person-years of indirect and induced
jobs in Nevada.
The market is estimated to generate approximately $984.7 million in indirect and induced
labor income during the seven-year study period.
TOTAL BENEFITS
“Total economic benefits” are the sum of direct, indirect and induced benefits (see Table III-1 and
Figure III-1).
An estimated $7.5 billion of total output activity is projected to be generated for the Nevada
economy during the first seven years of adult-use marijuana regulation.
The market is forecasted to support about 41,000 person-years in jobs in Nevada in the
seven-year study period.
NEVADA INITIATIVE TO REGULATE & TAX MARIJUANA: ECONOMIC & FISCAL BENEFITS STUDY
III-8
Marijuana regulation is estimated to generate approximately $1.7 billion in direct, indirect
and induced labor income during the seven-year study period.
Summary of the Total Benefits of the Regulated Marijuana Market (Adult-Use): 2024
DIRECT BENEFITS By 2024, an estimated $485.0 million of direct output activity is projected to be generated
in the Nevada economy every year due to adult-use marijuana regulation.
The Team forecasted that by 2024 the industry will support about 3,300 direct FTE jobs in
Nevada per year. This estimate does not factor in indirect and induced jobs.
By 2024, the Initiative regulation is expected to generate approximately $111.6 million in
direct labor income per year.
INDIRECT AND INDUCED BENEFITS By 2024, a projected $645.1 million of indirect and induced output activity is forecasted to
be generated in the Nevada economy each year after enacting marijuana regulation.
In 2024, the market is forecasted to support 2,900 indirect and induced FTE jobs in Nevada
every year.
By 2024, an adult-use marijuana market is estimated to generate approximately $149.2
million in indirect and induced labor income per year.
TOTAL BENEFITS
“Total economic benefits” are the sum of direct, indirect and induced benefits (see Table III-2 and
Figure III-2).
By 2024, an estimated $1.1 billion of total output activity is projected to be generated for
the Nevada economy each year due to marijuana regulation.
By 2024, the Initiative is forecasted to support about 6,200 FTE jobs in Nevada per year.

NEVADA INITIATIVE TO REGULATE & TAX MARIJUANA: ECONOMIC & FISCAL BENEFITS STUDY
III-9
By 2024, the market is estimated to generate approximately $260.7 million in direct,
indirect and induced labor income each year.
There is a caveat in the employment results. There are two reasons the Consultant Team did not
report income per worker. It is inappropriate to calculate income per worker as the ratio of total
income benefits-to-total employment benefits. First, IMPLAN calculates total jobs: full- and part-
time. Because the MIM results were largely based on the IMPLAN social accounting matrix, these
results reflect the same nature of full- and part-time job mixing. Due to the method and tools that
IMPLAN provides for the FTE (or person-year) job conversion, the apparent job-to-income ratio is
not meaningful. Doing a straight calculation for average labor income yields a result of
approximately $42,000 per worker per year. However, every FTE is counted as one job per year by
definition rather than total jobs per year as originally calculated, which is approximately 1.1 jobs
per FTE job. Therefore, using the FTE (or person-year) employment figure results in an
overestimate of average income per job. The second reason is that labor income includes
proprietor income and, therefore, does not reflect only employee compensation.
For example, imagine a retailer were to create two jobs – one 30-hour per week job and one 10-
hour per week job. If the 30-hour per week worker is paid $40,000 annually, while the 10-hour per
week worker is paid $10,000, annually, that would equate to an average of $25,000 per year over
the two jobs. However, as an FTE, it would equate to one job at $50,000 per year. This would
incorrectly double the combined average annual wage for these two employees from $25,000 to
$50,000.
Tables III-1 and III-2 show the results for total benefits from marijuana regulation for 2018-2024
and for 2024 only, respectively. Appendix C contains tables that summarize the estimated
economic benefits (direct, indirect, induced and total) of the regulated marijuana market by year.
Table III-1: Total Economic Benefits from Adult-Use Marijuana Industry: 2018-2024 Impact Type Spending/Output Employment Labor Income Direct Benefit $3,201,391,017 21,769 $736,319,934 Indirect Benefit $2,497,084,993 13,766 $406,578,602 Induced Benefit $1,760,765,059 5,442 $578,085,530 Total Benefits $7,459,241,070 40,978 $1,720,984,066 Multipliers 2.33 1.88 2.34
Sources: MPG, IMPLAN, RCG Economics.
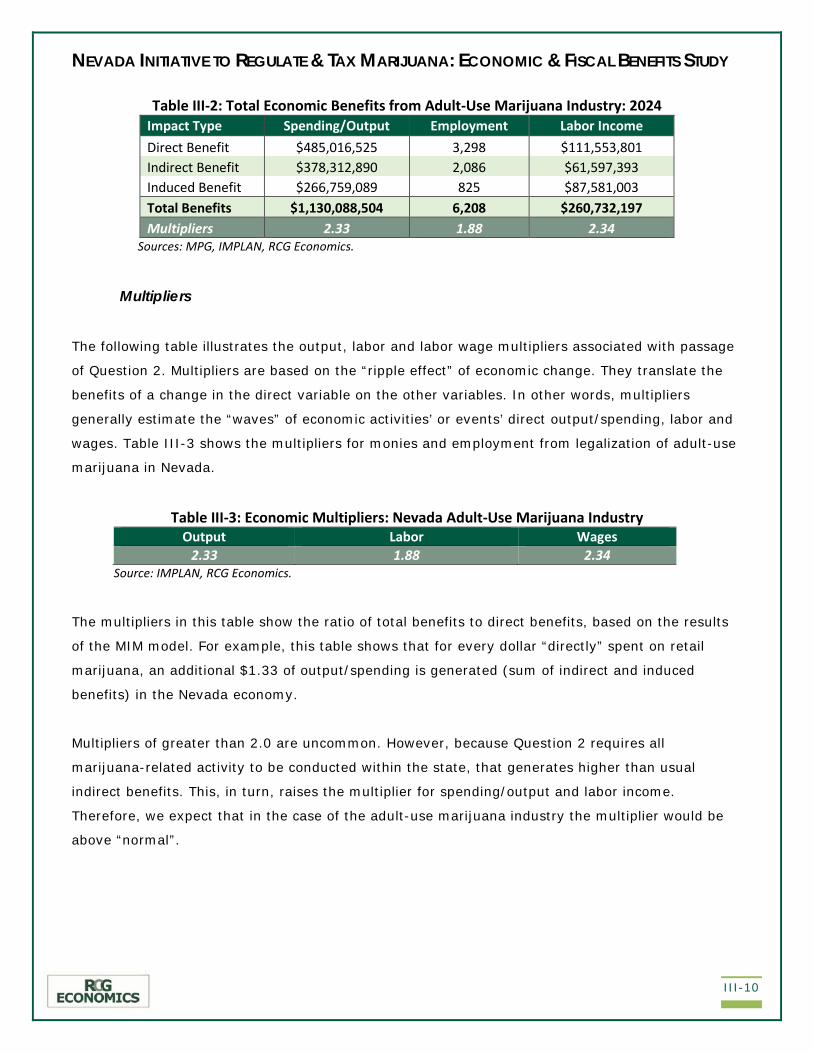
NEVADA INITIATIVE TO REGULATE & TAX MARIJUANA: ECONOMIC & FISCAL BENEFITS STUDY
III-10
Table III-2: Total Economic Benefits from Adult-Use Marijuana Industry: 2024 Impact Type Spending/Output Employment Labor Income Direct Benefit $485,016,525 3,298 $111,553,801 Indirect Benefit $378,312,890 2,086 $61,597,393 Induced Benefit $266,759,089 825 $87,581,003 Total Benefits $1,130,088,504 6,208 $260,732,197 Multipliers 2.33 1.88 2.34
Sources: MPG, IMPLAN, RCG Economics.
Multipliers
The following table illustrates the output, labor and labor wage multipliers associated with passage
of Question 2. Multipliers are based on the “ripple effect” of economic change. They translate the
benefits of a change in the direct variable on the other variables. In other words, multipliers
generally estimate the “waves” of economic activities’ or events’ direct output/spending, labor and
wages. Table III-3 shows the multipliers for monies and employment from legalization of adult-use
marijuana in Nevada.
Table III-3: Economic Multipliers: Nevada Adult-Use Marijuana Industry Output Labor Wages
2.33 1.88 2.34 Source: IMPLAN, RCG Economics.
The multipliers in this table show the ratio of total benefits to direct benefits, based on the results
of the MIM model. For example, this table shows that for every dollar “directly” spent on retail
marijuana, an additional $1.33 of output/spending is generated (sum of indirect and induced
benefits) in the Nevada economy.
Multipliers of greater than 2.0 are uncommon. However, because Question 2 requires all
marijuana-related activity to be conducted within the state, that generates higher than usual
indirect benefits. This, in turn, raises the multiplier for spending/output and labor income.
Therefore, we expect that in the case of the adult-use marijuana industry the multiplier would be
above “normal”.

NEVADA INITIATIVE TO REGULATE & TAX MARIJUANA: ECONOMIC & FISCAL BENEFITS STUDY
III-11
Figure III-1: Total Economic Benefits from Adult-Use Marijuana Industry: 2018-2024
Sources: MPG, IMPLAN, RCG Economics.
Figure III-2: Total Economic Benefits from Adult-Use Marijuana Industry: 2024
Sources: MPG, IMPLAN, RCG Economics.
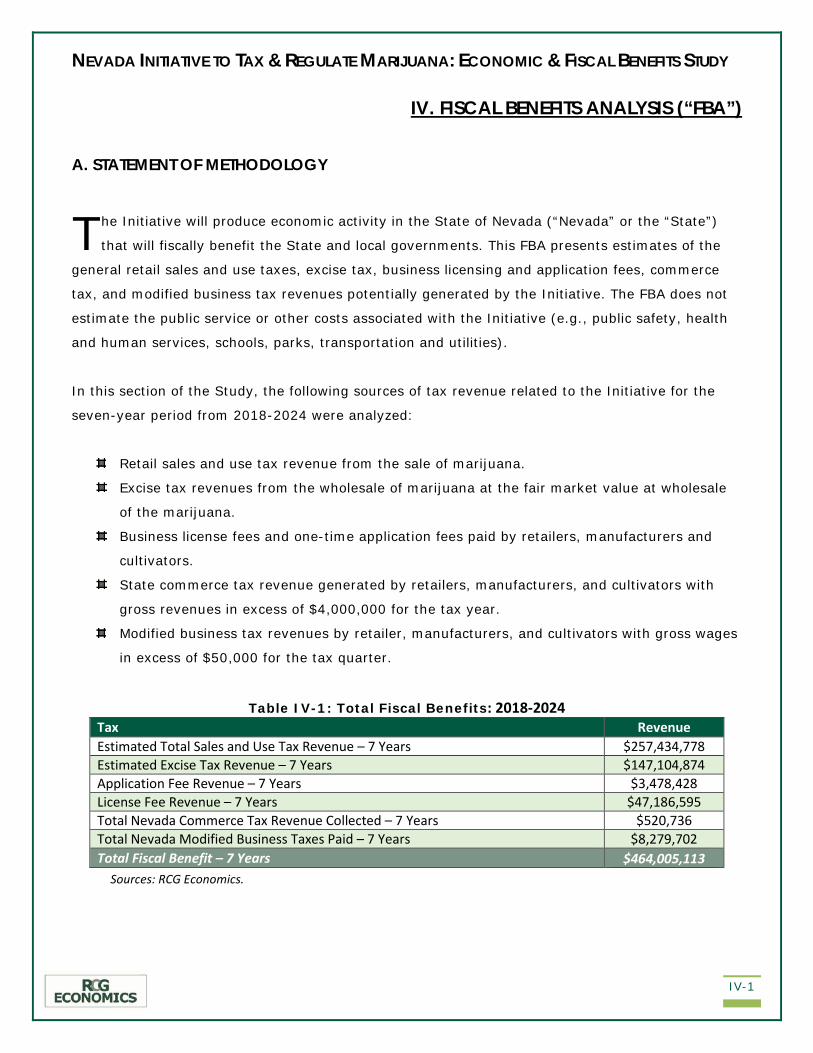
NEVADA INITIATIVE TO TAX & REGULATE MARIJUANA: ECONOMIC & FISCAL BENEFITS STUDY
IV-1
IV. FISCAL BENEFITS ANALYSIS (“FBA”)
A. STATEMENT OF METHODOLOGY
he Initiative will produce economic activity in the State of Nevada (“Nevada” or the “State”)
that will fiscally benefit the State and local governments. This FBA presents estimates of the
general retail sales and use taxes, excise tax, business licensing and application fees, commerce
tax, and modified business tax revenues potentially generated by the Initiative. The FBA does not
estimate the public service or other costs associated with the Initiative (e.g., public safety, health
and human services, schools, parks, transportation and utilities).
In this section of the Study, the following sources of tax revenue related to the Initiative for the
seven-year period from 2018-2024 were analyzed:
Retail sales and use tax revenue from the sale of marijuana.
Excise tax revenues from the wholesale of marijuana at the fair market value at wholesale
of the marijuana.
Business license fees and one-time application fees paid by retailers, manufacturers and
cultivators.
State commerce tax revenue generated by retailers, manufacturers, and cultivators with
gross revenues in excess of $4,000,000 for the tax year.
Modified business tax revenues by retailer, manufacturers, and cultivators with gross wages
in excess of $50,000 for the tax quarter.
Table IV-1: Total Fiscal Benefits: 2018-2024 Tax Revenue Estimated Total Sales and Use Tax Revenue – 7 Years $257,434,778 Estimated Excise Tax Revenue – 7 Years $147,104,874 Application Fee Revenue – 7 Years $3,478,428 License Fee Revenue – 7 Years $47,186,595 Total Nevada Commerce Tax Revenue Collected – 7 Years $520,736 Total Nevada Modified Business Taxes Paid – 7 Years $8,279,702 Total Fiscal Benefit – 7 Years $464,005,113
Sources: RCG Economics.
T
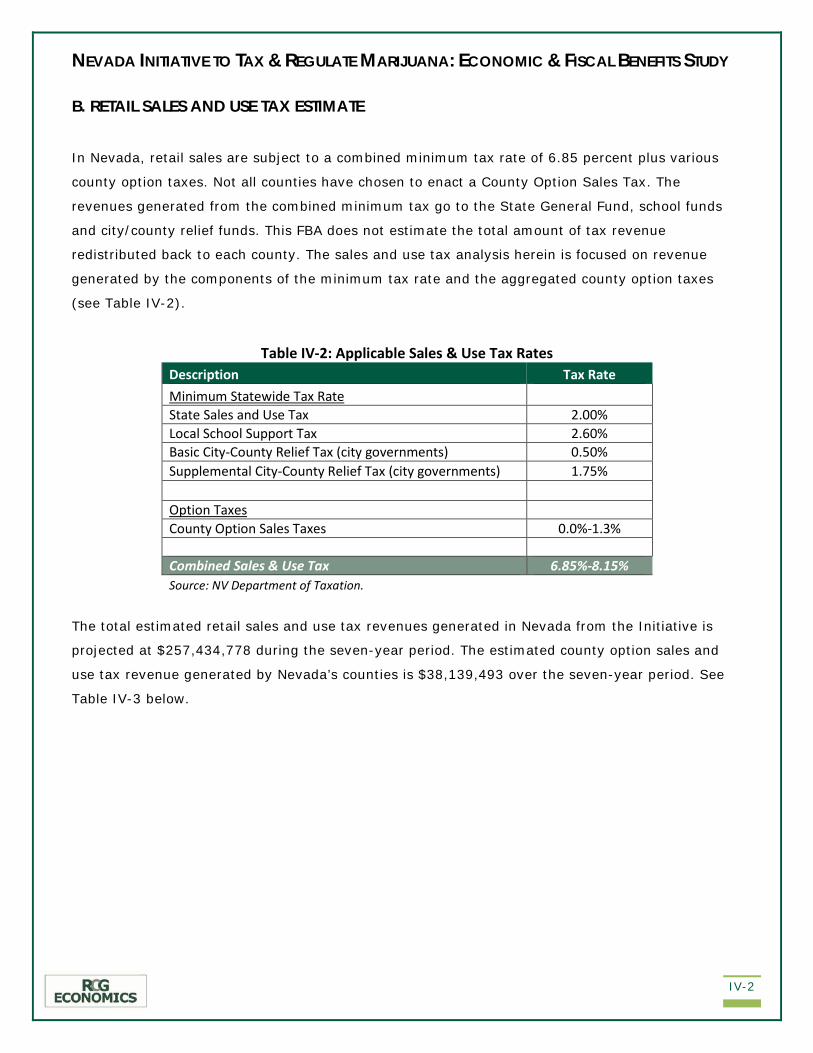
NEVADA INITIATIVE TO TAX & REGULATE MARIJUANA: ECONOMIC & FISCAL BENEFITS STUDY
IV-2
B. RETAIL SALES AND USE TAX ESTIMATE
In Nevada, retail sales are subject to a combined minimum tax rate of 6.85 percent plus various
county option taxes. Not all counties have chosen to enact a County Option Sales Tax. The
revenues generated from the combined minimum tax go to the State General Fund, school funds
and city/county relief funds. This FBA does not estimate the total amount of tax revenue
redistributed back to each county. The sales and use tax analysis herein is focused on revenue
generated by the components of the minimum tax rate and the aggregated county option taxes
(see Table IV-2).
Table IV-2: Applicable Sales & Use Tax Rates Description Tax Rate Minimum Statewide Tax Rate State Sales and Use Tax 2.00% Local School Support Tax 2.60% Basic City-County Relief Tax (city governments) 0.50% Supplemental City-County Relief Tax (city governments) 1.75% Option Taxes County Option Sales Taxes 0.0%-1.3% Combined Sales & Use Tax 6.85%-8.15% Source: NV Department of Taxation.
The total estimated retail sales and use tax revenues generated in Nevada from the Initiative is
projected at $257,434,778 during the seven-year period. The estimated county option sales and
use tax revenue generated by Nevada’s counties is $38,139,493 over the seven-year period. See
Table IV-3 below.

NEVADA INITIATIVE TO TAX & REGULATE MARIJUANA: ECONOMIC & FISCAL BENEFITS STUDY
IV-3
Table IV-3: Total Retail Sales & Use Tax Revenues from the Initiative: 2018-2024 Taxes Value Retail Sales by Residents $1,408,958,273 Retail Sales by Tourists $1,792,432,744 Total Retail Sales $3,201,391,017 State Sales and Use Tax 2.00% Local School Support Tax 2.60% Basic City-County Relief Tax 0.50% Supplemental City-County Relief Tax 1.75% County Option Sales Taxes (average) 0.0%-1.3% Estimated State Sales and Use Tax $64,027,820 Estimated Local School Support Tax $83,236,166 Estimated Basic City-County Relief Tax $16,006,955 Estimated Supplemental City-County Relief Tax $56,024,343 Estimated County Option Sales Taxes $38,139,493 Estimated Total Sales and Use Tax Revenue – 7 Years $257,434,778 Sources: RCG Economics, MPG, IMPLAN, NV Department of Taxation. Numbers may not calculate exactly due to rounding.
Retail Sales & Use Tax Assumptions
The results of the sales and use tax analysis are presented in Table IV-3.
The following assumptions and calculations were used in herein:
Total Retail Sales: Total retail sales equals the direct output of the retail segment of the
marijuana industry. Retail sales were calculated for Nevada residents and tourists visiting
Nevada.
Resident Generated Retail Sales: Retail sales generated by residents were allocated to each
county, based on the county’s share of residents 21+ years of age.
Tourist Generated Retail Sales: Retail sales generated by tourists were allocated to counties
using estimates of total 21+ tourists visiting the counties, weighted by an $11.00/gram
price in the “tourist counties” (Clark County and Washoe County) and a $9.00/gram price in
rural Nevada counties.

NEVADA INITIATIVE TO TAX & REGULATE MARIJUANA: ECONOMIC & FISCAL BENEFITS STUDY
IV-4
Estimated Minimum Statewide Tax Revenue: Estimated total sales and use tax revenue
from retail marijuana sales was calculated by multiplying total Nevada retail sales by the
minimum statewide tax rates listed in Table IV-2.
Estimated County Optional Tax Revenue: Estimated county option sales and use tax
revenue from retail marijuana sales was calculated by multiplying county-level retail sales
by the county optional sales taxes.
C. EXCISE TAX ESTIMATE
Under Section 15 of the Initiative, an excise tax is imposed and must be collected by the State. The
excise tax is applied to the wholesale sale of marijuana in the State by a marijuana cultivation
facility. The proposed excise tax is projected to generate $147,104,874 over the seven-year
period.
Table IV-4: Excise Tax Revenues from the Initiative: 2018-2024 Value Total Wholesale Sale of Marijuana (lbs) 741,600 Times: Fair Market Wholesale Value per lb $1,322.41 Total Cultivator Revenue $980,699,157 Times: Excise Tax Rate 15% Estimated Excise Tax Revenue – 7 Years $147,104,874 Sources: RCG Economics, MPG, IMPLAN, NV Department of Taxation. Numbers may not calculate exactly due to rounding.
Excise Tax Revenue Assumptions The results of the seven-year excise tax revenue analysis herein are presented in Table IV-4.
The following assumptions and calculations were used in RCG’s analysis:
Fair Market Value: Fair market value the wholesale level is assumed equal the Average
Market Rate Recommendations for Flower and Trim, published by the Colorado Department
of Revenue1, weighted by the Packaged Weight volumes. The Colorado Flower Rate
recommendation is $1,816/pound (“lb”) and 147,702.956 total package weight lbs were
harvested in 2015. The Colorado Trim Rate recommendation is $505/lb and 89,190.425
total package weight lbs were harvested in 2015. The fair market value at wholesale is
1 https://www.colorado.gov/pacific/sites/default/files/AverageMarketRate.pdf .
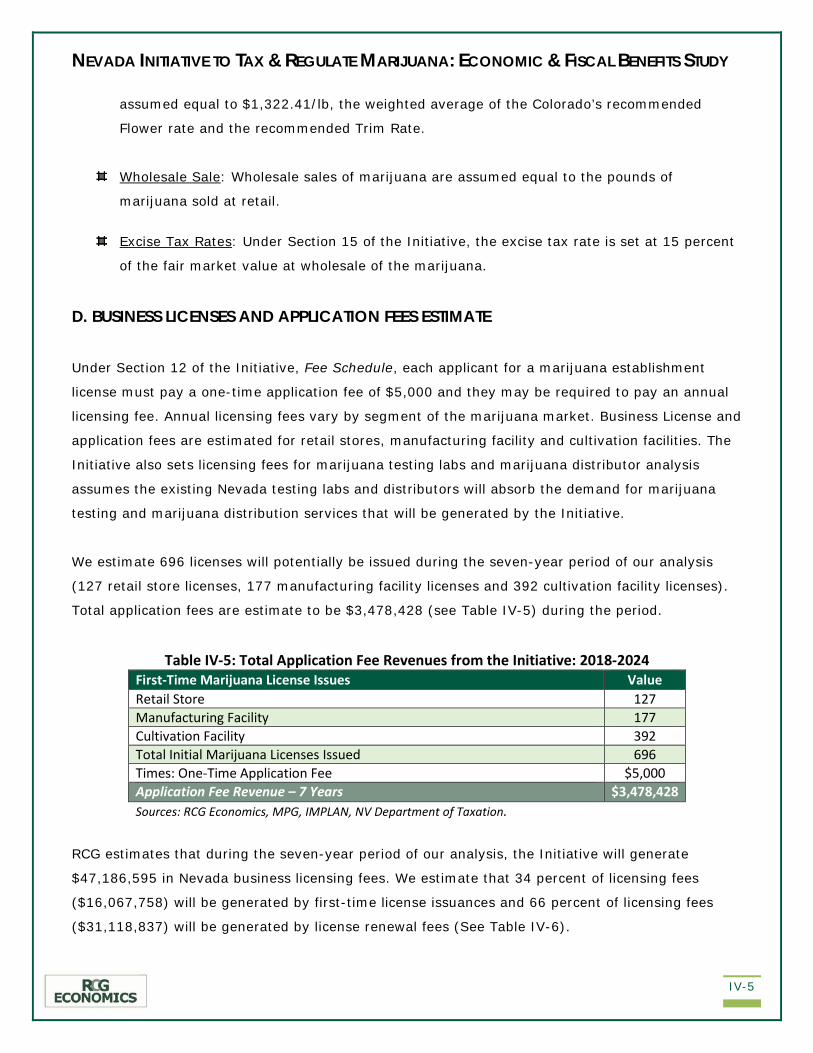
NEVADA INITIATIVE TO TAX & REGULATE MARIJUANA: ECONOMIC & FISCAL BENEFITS STUDY
IV-5
assumed equal to $1,322.41/lb, the weighted average of the Colorado’s recommended
Flower rate and the recommended Trim Rate.
Wholesale Sale: Wholesale sales of marijuana are assumed equal to the pounds of
marijuana sold at retail.
Excise Tax Rates: Under Section 15 of the Initiative, the excise tax rate is set at 15 percent
of the fair market value at wholesale of the marijuana.
D. BUSINESS LICENSES AND APPLICATION FEES ESTIMATE
Under Section 12 of the Initiative, Fee Schedule, each applicant for a marijuana establishment
license must pay a one-time application fee of $5,000 and they may be required to pay an annual
licensing fee. Annual licensing fees vary by segment of the marijuana market. Business License and
application fees are estimated for retail stores, manufacturing facility and cultivation facilities. The
Initiative also sets licensing fees for marijuana testing labs and marijuana distributor analysis
assumes the existing Nevada testing labs and distributors will absorb the demand for marijuana
testing and marijuana distribution services that will be generated by the Initiative.
We estimate 696 licenses will potentially be issued during the seven-year period of our analysis
(127 retail store licenses, 177 manufacturing facility licenses and 392 cultivation facility licenses).
Total application fees are estimate to be $3,478,428 (see Table IV-5) during the period.
Table IV-5: Total Application Fee Revenues from the Initiative: 2018-2024 First-Time Marijuana License Issues Value Retail Store 127 Manufacturing Facility 177 Cultivation Facility 392 Total Initial Marijuana Licenses Issued 696 Times: One-Time Application Fee $5,000 Application Fee Revenue – 7 Years $3,478,428 Sources: RCG Economics, MPG, IMPLAN, NV Department of Taxation.
RCG estimates that during the seven-year period of our analysis, the Initiative will generate
$47,186,595 in Nevada business licensing fees. We estimate that 34 percent of licensing fees
($16,067,758) will be generated by first-time license issuances and 66 percent of licensing fees
($31,118,837) will be generated by license renewal fees (See Table IV-6).
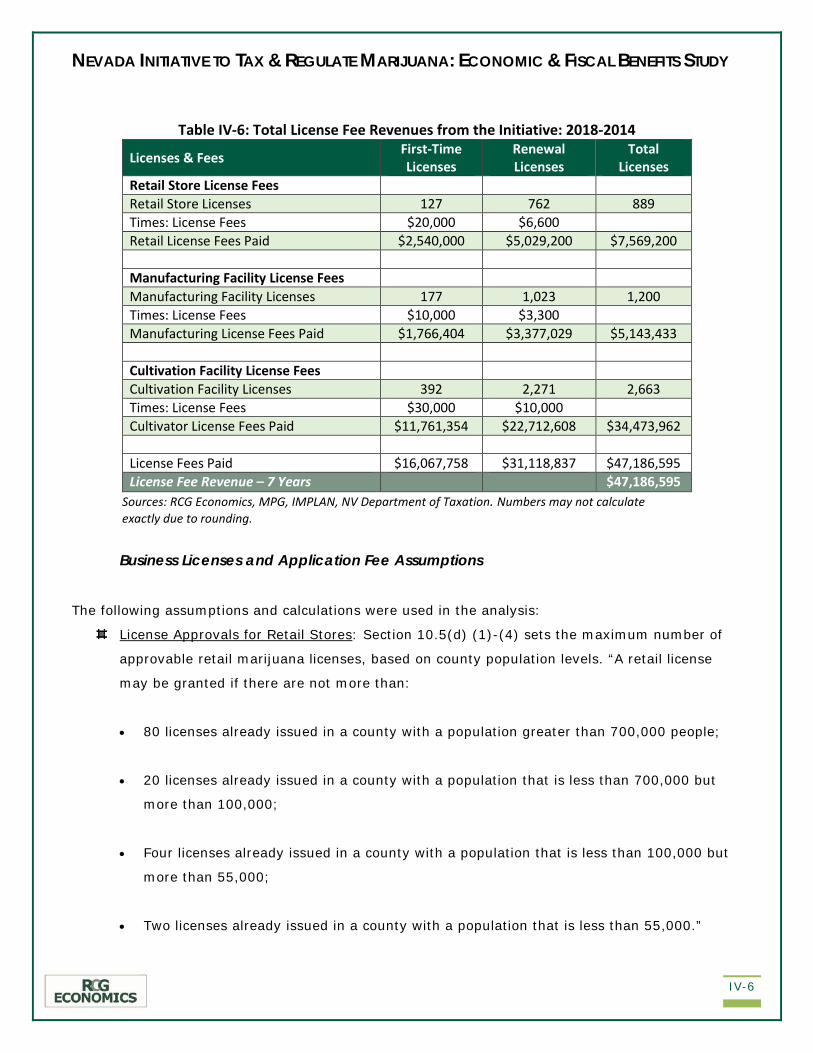
NEVADA INITIATIVE TO TAX & REGULATE MARIJUANA: ECONOMIC & FISCAL BENEFITS STUDY
IV-6
Table IV-6: Total License Fee Revenues from the Initiative: 2018-2014
Licenses & Fees First-Time Licenses
Renewal Licenses
Total Licenses
Retail Store License Fees Retail Store Licenses 127 762 889 Times: License Fees $20,000 $6,600 Retail License Fees Paid $2,540,000 $5,029,200 $7,569,200
Manufacturing Facility License Fees Manufacturing Facility Licenses 177 1,023 1,200 Times: License Fees $10,000 $3,300 Manufacturing License Fees Paid $1,766,404 $3,377,029 $5,143,433
Cultivation Facility License Fees Cultivation Facility Licenses 392 2,271 2,663 Times: License Fees $30,000 $10,000 Cultivator License Fees Paid $11,761,354 $22,712,608 $34,473,962
License Fees Paid $16,067,758 $31,118,837 $47,186,595 License Fee Revenue – 7 Years $47,186,595
Sources: RCG Economics, MPG, IMPLAN, NV Department of Taxation. Numbers may not calculate exactly due to rounding.
Business Licenses and Application Fee Assumptions
The following assumptions and calculations were used in the analysis:
License Approvals for Retail Stores: Section 10.5(d) (1)-(4) sets the maximum number of
approvable retail marijuana licenses, based on county population levels. “A retail license
may be granted if there are not more than:
• 80 licenses already issued in a county with a population greater than 700,000 people;
• 20 licenses already issued in a county with a population that is less than 700,000 but
more than 100,000;
• Four licenses already issued in a county with a population that is less than 100,000 but
more than 55,000;
• Two licenses already issued in a county with a population that is less than 55,000.”

NEVADA INITIATIVE TO TAX & REGULATE MARIJUANA: ECONOMIC & FISCAL BENEFITS STUDY
IV-7
Upon request of a county government, Nevada may issue additional retail marijuana store
licenses in that county. We have assumed that additional retail marijuana licenses are not
granted within the seven-year period of our analysis.
License Approvals for Manufacturing and Cultivation: The Initiative does not restrict the
number of licenses that may be issued for marijuana manufacturing nor marijuana
cultivation.
License Demand: The Consultant Team has analyzed the ratio of issued licenses to the
population of individual 21+ years of age in the State of Washington (“Washington”). There
are currently (as of June 28, 2016) 390 issued licenses for retail stores, 410 licenses issued
for manufacturing facilities and 910 licenses issued for cultivation facilities in the state.2 The
estimated 21+ population in Washington as of July 1, 2016 is 5,332,611. We assume:
• One license for a retail store will be issued for every 13,673 people that are 21+ years
of age;
• One license will be issued for manufacturing for every 13,006 people that are 21+ years
of age; and
• One license for cultivation will be issued for every 5,860 people that are 21+ years of
age.
Based on the expected population in each of Nevada’ counties, the Consultant Team has
estimated that demand for retail store licenses will exceed the maximum allowable licenses
under Section 10.5(d) of the Initiative. One hundred twenty seven (127) retail store licenses
will be issued/renewed each year during the seven-year period of our analysis. The number
of issued licenses for manufacturing and cultivation are not constrained.
Application Fees: Under Section 12.1 of the Initiative, each applicant for a marijuana
establishment license must pay a one-time application fee of $5,000.
Business License Fees: Under Section 12.2 of the Initiative, annual licensing fees for retail
stores are $20,000 for the first year and $6,600 for each annual renewal. Annual licensing
fees for manufacturing facilities are $10,000 for the first year and $3,300 for each annual
2 http://www.liq.wa.gov/publications/Public_Records/2016%20-%20MJ%20Applicants/MarijuanaApplicants06282016.xls.

NEVADA INITIATIVE TO TAX & REGULATE MARIJUANA: ECONOMIC & FISCAL BENEFITS STUDY
IV-8
renewal. Annual licensing fees cultivation facilities are $30,000 for the first year and
$10,000 for each annual renewal.
E. COMMERCE TAX ESTIMATE
In Nevada, a commerce tax is required to be paid by a business entity engaging in business in the
State. The commerce tax is applied to the “amount obtained by subtracting $4,000,000 from the
Nevada gross revenue of the business entity for the taxable year and multiplying that amount by
the rate set forth in NRS 363C.310 to 363C.550, inclusive, for the business category in which the
business entity is primarily engaged” (NRS 363C.300). Under NRS 363C.097 “the business entity
shall be deemed to be primarily engaged in the business category in which the highest percentage
of its Nevada gross revenue is generated.”
RCG’s commerce tax analysis is focused on the revenue generated by marijuana business, business
that are retailers, manufacturers, cultivators or a mix of the three types of marijuana businesses.
Table IV-7 below lists the current applicable commerce taxes by industry in which the business
entity may be primarily engaged.
Table IV-7: Applicable Commerce Tax Rates Description Tax Rate Marijuana Retailers (NAICS: Retail Trade) 0.111% Marijuana Manufacturers (NAICS: Manufacturing) 0.091% Marijuana Cultivators (NAICS: Agriculture) 0.063% Sources: NV Department of Taxation.
In summary, our analysis show that total potential commerce tax collections for the expected types
of marijuana businesses will total $520,736 over the seven-year analysis period (see Table IV-8
below). Detailed results of the commerce tax revenue analysis are presented in Appendix D.

NEVADA INITIATIVE TO TAX & REGULATE MARIJUANA: ECONOMIC & FISCAL BENEFITS STUDY
IV-9
Table IV-8: Total Commerce Tax Revenue, by Type of Business Business Types Value Commerce Tax Revenue Paid by Businesses with Only One License that is Retail $57,628 Commerce Tax Revenue Paid by Businesses with Only One License that is Manufacturing $0 Commerce Tax Revenue Paid by Businesses with Only One License that is Cultivation $0 Commerce Tax Revenue Paid by Businesses with Multiple Licenses that are Only Retail $460,880 Commerce Tax Revenue Paid by Businesses with Multiple Licenses that are Only Manufacturing $0 Commerce Tax Revenue Paid by Businesses with Multiple Licenses that are Only Cultivation $0 Commerce Tax Revenue Paid by Businesses with Retail and Cultivation Licenses $2,228 Commerce Tax Revenue Paid by Businesses with Cultivation and Manufacturing Licenses $0 Total Nevada Commerce Tax Revenue Collected – 7 Years $520,736 Sources: RCG Economics, MPG, IMPLAN, Washington Liquor and Marijuana Board.
Commerce Tax Assumptions
The following assumptions and calculations were used in our analysis:
Active Marijuana Licenses: Data3 on marijuana licensing indicate that a minority of licenses
issued under the Initiative will not actively generate revenue. Our analysis of license data in
Washington indicated that we can expect 83 percent of licensed manufacturing facilities,
and 80 percent of licensed cultivation facilities to actively generate revenue. For example,
about 87 percent of retail licenses in Washington become active. After applying the 87
percent license activation rate to Nevada’s individual counties, we estimate that, on
average, 89 percent of retail licenses issued in Nevada will potentially be actively generating
revenue. The estimate of issued licenses that become active under the Initiative is shown in
Table IV-9 and Table IV-10 below.
Table IV-9: Active Marijuana Licenses
Marijuana License Types Total Facilities Granted Licenses
Active License Rate
Total Active Granted Licenses
Retail Stores Licenses 127 89% 113 Manufacturing Facilities Licenses 177 83% 147 Cultivation Facilities Licenses 392 80% 314 Total Licenses 696 82% 574 Active Marijuana Business Licenses Granted 574 Sources: RCG Economics, Washington Liquor and Marijuana Board. Numbers may not calculate exactly due to rounding.
3 http://www.liq.wa.gov/publications/Public_Records/2016%20-%20MJ%20Applicants/MarijuanaApplicants06282016.xls.
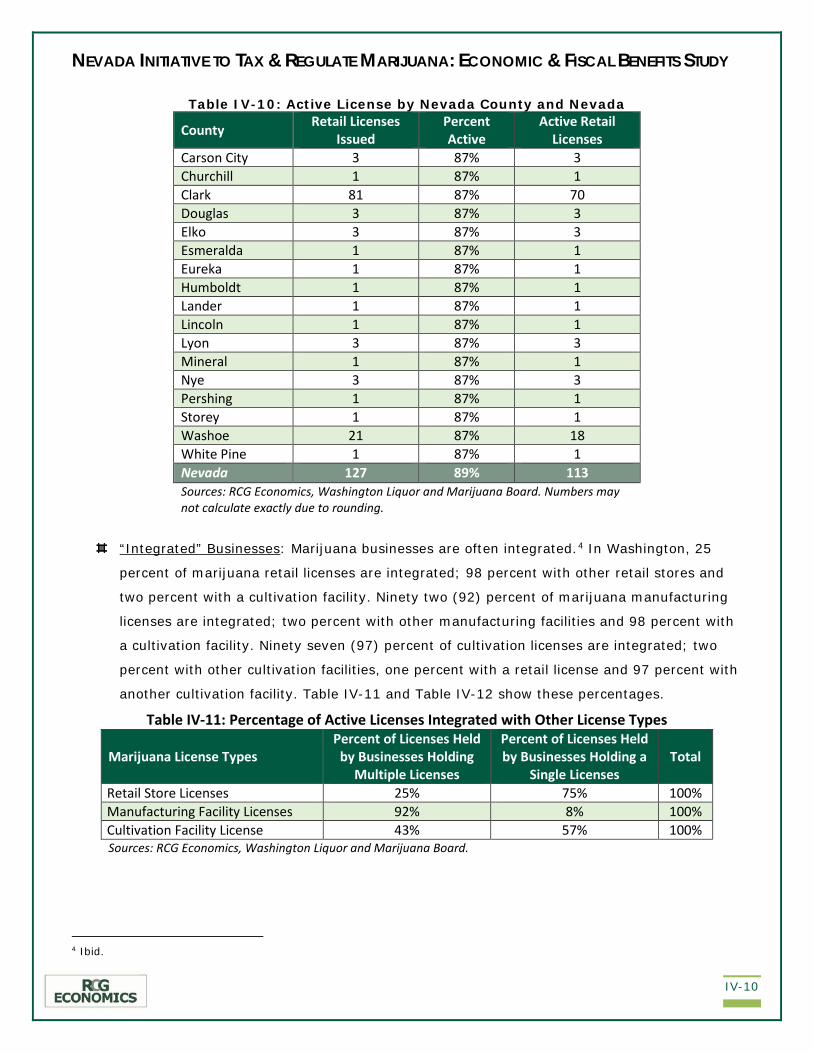
NEVADA INITIATIVE TO TAX & REGULATE MARIJUANA: ECONOMIC & FISCAL BENEFITS STUDY
IV-10
Table IV-10: Active License by Nevada County and Nevada
County Retail Licenses Issued
Percent Active
Active Retail Licenses
Carson City 3 87% 3 Churchill 1 87% 1 Clark 81 87% 70 Douglas 3 87% 3 Elko 3 87% 3 Esmeralda 1 87% 1 Eureka 1 87% 1 Humboldt 1 87% 1 Lander 1 87% 1 Lincoln 1 87% 1 Lyon 3 87% 3 Mineral 1 87% 1 Nye 3 87% 3 Pershing 1 87% 1 Storey 1 87% 1 Washoe 21 87% 18 White Pine 1 87% 1 Nevada 127 89% 113 Sources: RCG Economics, Washington Liquor and Marijuana Board. Numbers may not calculate exactly due to rounding.
“Integrated” Businesses: Marijuana businesses are often integrated.4 In Washington, 25
percent of marijuana retail licenses are integrated; 98 percent with other retail stores and
two percent with a cultivation facility. Ninety two (92) percent of marijuana manufacturing
licenses are integrated; two percent with other manufacturing facilities and 98 percent with
a cultivation facility. Ninety seven (97) percent of cultivation licenses are integrated; two
percent with other cultivation facilities, one percent with a retail license and 97 percent with
another cultivation facility. Table IV-11 and Table IV-12 show these percentages.
Table IV-11: Percentage of Active Licenses Integrated with Other License Types
Marijuana License Types Percent of Licenses Held
by Businesses Holding Multiple Licenses
Percent of Licenses Held by Businesses Holding a
Single Licenses Total
Retail Store Licenses 25% 75% 100% Manufacturing Facility Licenses 92% 8% 100% Cultivation Facility License 43% 57% 100% Sources: RCG Economics, Washington Liquor and Marijuana Board.
4 Ibid.
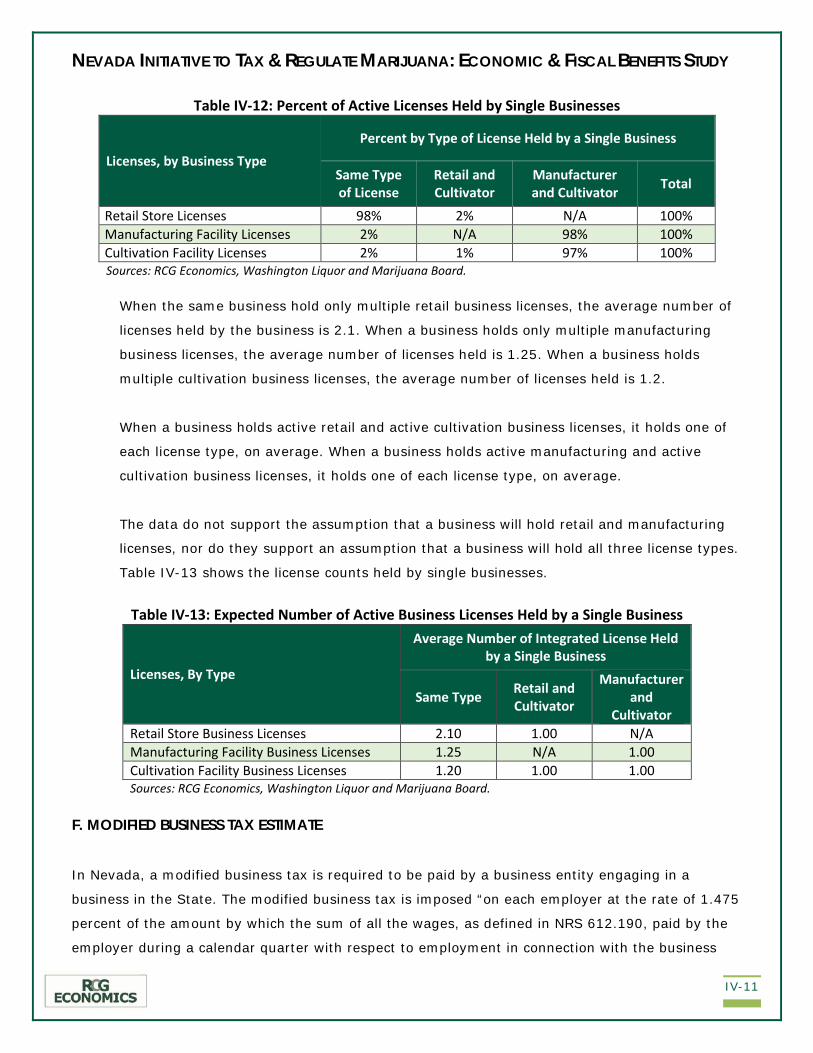
NEVADA INITIATIVE TO TAX & REGULATE MARIJUANA: ECONOMIC & FISCAL BENEFITS STUDY
IV-11
Table IV-12: Percent of Active Licenses Held by Single Businesses
Licenses, by Business Type Percent by Type of License Held by a Single Business
Same Type of License
Retail and Cultivator
Manufacturer and Cultivator Total
Retail Store Licenses 98% 2% N/A 100% Manufacturing Facility Licenses 2% N/A 98% 100% Cultivation Facility Licenses 2% 1% 97% 100% Sources: RCG Economics, Washington Liquor and Marijuana Board.
When the same business hold only multiple retail business licenses, the average number of
licenses held by the business is 2.1. When a business holds only multiple manufacturing
business licenses, the average number of licenses held is 1.25. When a business holds
multiple cultivation business licenses, the average number of licenses held is 1.2.
When a business holds active retail and active cultivation business licenses, it holds one of
each license type, on average. When a business holds active manufacturing and active
cultivation business licenses, it holds one of each license type, on average.
The data do not support the assumption that a business will hold retail and manufacturing
licenses, nor do they support an assumption that a business will hold all three license types.
Table IV-13 shows the license counts held by single businesses.
Table IV-13: Expected Number of Active Business Licenses Held by a Single Business
Licenses, By Type
Average Number of Integrated License Held by a Single Business
Same Type Retail and Cultivator
Manufacturer and
Cultivator Retail Store Business Licenses 2.10 1.00 N/A Manufacturing Facility Business Licenses 1.25 N/A 1.00 Cultivation Facility Business Licenses 1.20 1.00 1.00 Sources: RCG Economics, Washington Liquor and Marijuana Board.
F. MODIFIED BUSINESS TAX ESTIMATE
In Nevada, a modified business tax is required to be paid by a business entity engaging in a
business in the State. The modified business tax is imposed “on each employer at the rate of 1.475
percent of the amount by which the sum of all the wages, as defined in NRS 612.190, paid by the
employer during a calendar quarter with respect to employment in connection with the business
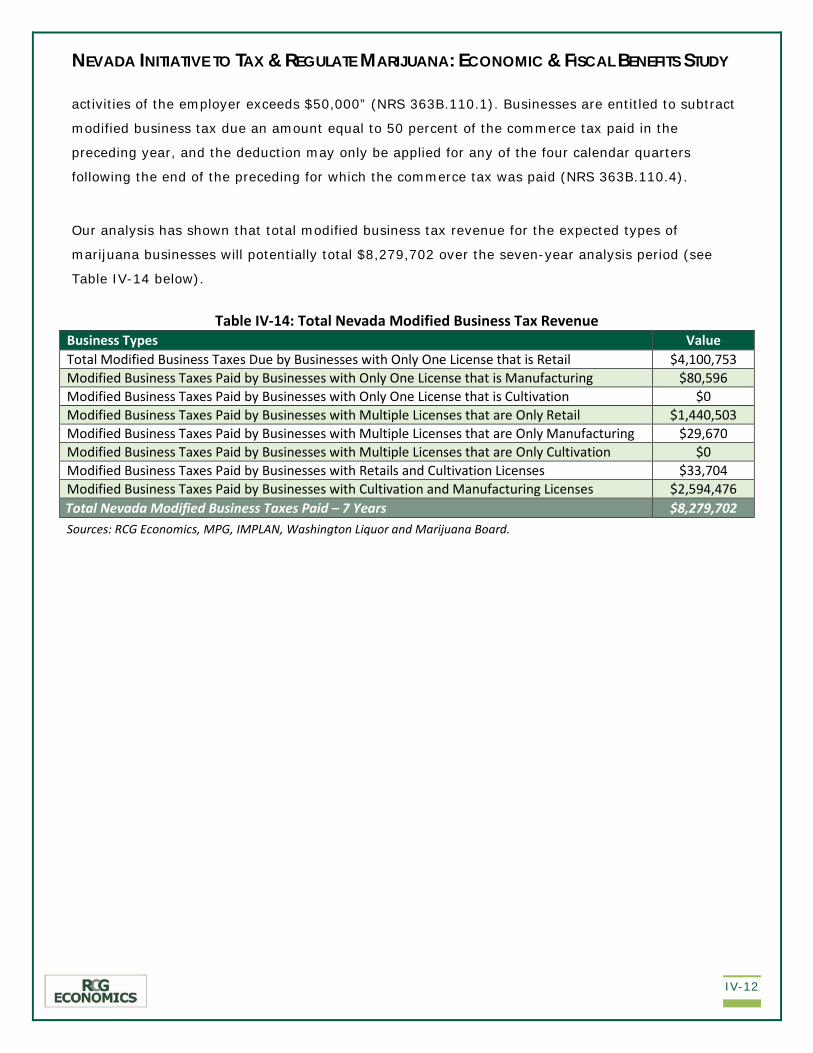
NEVADA INITIATIVE TO TAX & REGULATE MARIJUANA: ECONOMIC & FISCAL BENEFITS STUDY
IV-12
activities of the employer exceeds $50,000” (NRS 363B.110.1). Businesses are entitled to subtract
modified business tax due an amount equal to 50 percent of the commerce tax paid in the
preceding year, and the deduction may only be applied for any of the four calendar quarters
following the end of the preceding for which the commerce tax was paid (NRS 363B.110.4).
Our analysis has shown that total modified business tax revenue for the expected types of
marijuana businesses will potentially total $8,279,702 over the seven-year analysis period (see
Table IV-14 below).
Table IV-14: Total Nevada Modified Business Tax Revenue
Business Types Value Total Modified Business Taxes Due by Businesses with Only One License that is Retail $4,100,753 Modified Business Taxes Paid by Businesses with Only One License that is Manufacturing $80,596 Modified Business Taxes Paid by Businesses with Only One License that is Cultivation $0 Modified Business Taxes Paid by Businesses with Multiple Licenses that are Only Retail $1,440,503 Modified Business Taxes Paid by Businesses with Multiple Licenses that are Only Manufacturing $29,670 Modified Business Taxes Paid by Businesses with Multiple Licenses that are Only Cultivation $0 Modified Business Taxes Paid by Businesses with Retails and Cultivation Licenses $33,704 Modified Business Taxes Paid by Businesses with Cultivation and Manufacturing Licenses $2,594,476 Total Nevada Modified Business Taxes Paid – 7 Years $8,279,702 Sources: RCG Economics, MPG, IMPLAN, Washington Liquor and Marijuana Board.
NEVADA INITIATIVE TO TAX & REGULATE MARIJUANA: ECONOMIC & FISCAL BENEFITS STUDY
IV-13
Modified Business Tax Assumptions
The following assumptions and calculations were used in RCG’s analysis:
Deduction for Commerce Taxes Paid: For the purpose of our analysis, we deduct 50 percent
of the annual commerce tax paid from the modified business tax due pursuant to NRS
363B.110.1. This deduction is made at the bottom of the calculations shown in the tables in
Appendix D. Pursuant to NRS 363B.110.2, the deduction is only applied to the last six years
of the seven-year analysis period. In the first year of the analysis there are no prior
commerce tax payments made by business for which deductions may be made against the
modified business tax during the second year of the analysis.

NEVADA INITIATIVE TO REGULATE & TAX MARIJUANA: ECONOMIC & FISCAL BENEFITS STUDY
A-1
A. APPENDIX A: PRICE ANALYSIS DETAILS
A. PRICE ANALYSIS In order to determine the price premium for marijuana in Colorado tourist areas, MPG examined
the online menus of four dispensaries in tourist areas with the menus of six recreational
dispensaries in the Front Range region of the state. It compared the average price for a single
gram of bud across all strains, pre-roll joints, and marijuana-infused edibles containing 10mg of
THC. MPG also examined transaction data from the Colorado Department of Revenue, comparing
the average price per gram in tourist counties to the price in Front Range counties1.
Figure A-1: Total (New & Rehab) Economic Benefits from FRI: 2017-2027
###
1 Tourist counties include Archuleta, Eagle, Grand, Gunnison, La Plata, Pitkin, Routt, San Miguel, and Summit. Front Range counties include Adams, Arapahoe, Boulder, Denver, El Paso, Jefferson, Larimer, Pueblo, and Weld.

NEVADA INITIATIVE TO REGULATE & TAX MARIJUANA: ECONOMIC & FISCAL BENEFITS STUDY
B-1
B. APPENDIX B: EBA MODEL TECHNICAL DESCRIPTION
A. THE MARIJUANA IMPACT MODEL (“MIM”) – TECHNICAL DESCRIPTION The marijuana impact model is an economic Input-Output model that incorporates the marijuana
industry’s size, structure, and unique employment characteristics into the state economy. Input-
Output models are used to link each sector in an economy to other sectors, through purchases of
intermediate inputs and final demand spending. This interconnected spending creates a
multiplicative effect, where spending upon a specific sector creates an “output multiplier” where
total state output is increased by more than the original spending amount. The relative size and
nature of a legalized marijuana market will significantly influence its overall impact on the state
economy.
Nevada-Specific Output and Employment Multipliers
An output multiplier shows how much the state economy grows in response to a change in
spending for a particular economic activity, product or service. The notion of a multiplier comes
from Leontief Input-Output analysis, which shows how spending flows from the customer purchase
(called the direct impact), through intermediate suppliers (called the indirect impact), and finally
through the hands of employees from that sector, who spend their money on general goods and
services (called the induced effect). When combined, these three impacts represent the “economic
multiplier” for a particular industry in Nevada.
Figure B-1: The Multiplier Effect
Source: MPG.

NEVADA INITIATIVE TO REGULATE & TAX MARIJUANA: ECONOMIC & FISCAL BENEFITS STUDY
B-2
This impact is different for every industry. Products that are imported do not generate large output
multipliers, because most of the spending is remitted to the out-of-state producer.
The marijuana industry is unique because sales of marijuana are exclusive to in-state producers.
Retailers and manufacturers are required to purchase all of their marijuana inputs from in-state
suppliers. For this reason, the marijuana industry in Colorado has a relatively large multiplier1.
The marijuana industry profile is based upon the most refined market in the country – Colorado.
The current law in Colorado requires all licensees, owners and workers to be state residents2.
Therefore, all profits and wages generated by the industry are remitted entirely to state residents.
The fact that proprietors and employees are in-state residents shifts up the “induced” portion of the
multiplier for all three segments.
New Colorado legislation passed in 2016 will waive this requirement. The industry profile will be re-
structured for subsequent years, as needed. The original in-state requirement was intended to help
small marijuana businesses, but it ended up limiting funding options for them by restricting the
supply of potential investors.
Table 3 shows the estimated direct, indirect, and induced impact multipliers for Nevada. The
multiplier can be compared to other industries in the state. The aggregate output multiplier for
marijuana retailing equals 2.33, which likely ranks relatively high in Nevada. The driving factor is a
high RPC, and a large induced effect.
Table B-1: Direct, Indirect, and Induced Effects for the Marijuana Industry
Source: MPG calculations and comparative IMPLAN sector multipliers.
1 More technically, the “Regional Purchase Coefficient” for this industry is close to one, because the main ingredient for retail stores and manufacturers (marijuana flower and trim) must be purchased exclusively within the state of Colorado. 2 This requirement will be relaxed and Colorado will allow out-of-state ownership of minority stakes in businesses.
Nevada O utput Multip l iers Direc t Indirec t Induc ed TotalMari juana Retai l ing 1.00 0.78 0.55 2.33Mari juana Cultivation 1.00 0.32 0.53 1.85Mari juana Infused Produc ts 1.00 0.65 0.46 2.12

NEVADA INITIATIVE TO REGULATE & TAX MARIJUANA: ECONOMIC & FISCAL BENEFITS STUDY
B-3
The multiplier is smallest for cultivators. This is because all of their intermediate demand is for
regular goods and services. On the other hand, the largest input for retailers and infused
manufacturers is the cultivated marijuana, which is obtained 100 percent in state.
Input-Output Table Construction
In order to compute the output multipliers above, the specific linkages for Nevada must be
constructed using an Input-Output table. The Nevada Input-Output dataset has been extended by
the MPG to include the marijuana industry. An aggregated version of the so-called “direct
requirements” table is shown below, in order to highlight that both the size of the industry, and the
production structure, are needed in order to construct a true and accurate model. Note that
retailing, cultivation, and manufacturing for marijuana must be combined with all other sectors in
the economy. But at the same time, the outputs from marijuana cultivations and manufacturers
are sold exclusively to marijuana retailers.

NEVADA INITIATIVE TO REGULATE & TAX MARIJUANA: ECONOMIC & FISCAL BENEFITS STUDY
B-4
Table B-2: Marijuana-Based Input-Output Table -- Aggregated from 120 sectors for Exposition Purposes
Source: MPG.
The unique production structure for each sector in an economy is derived from data that is
collected by the federal, state, and local government. The primary data source for the non-
marijuana data is the US Bureau of Economic Affairs (“BEA”). The BEA constructs highly detailed
Input-Output tables for each sector of the economy. Economists use these Input-Output tables to
perform regional input-output modeling across a wide variety of activities.
However, since marijuana is a federally illegal “Schedule 1” narcotic, the BEA does not collect or
construct data related to its cultivation, processing, or distribution. Until 2014, the market for
marijuana was restricted to medical patients, and inventories were not consistently monitored
using a standardized seed-to-sale tracking system. Due to this lack of data, it was impossible to
estimate how the medical marijuana industry impacted the state economy. At the same time, all
Financial Services
Agriculture, Forestry, Livestock
Oil, Mining, Gas &
Construction
Food & Beverage
Marijuana Retailing
Marijuana Cultivation
Marijuana Manufacturing
Light & Heavy
Manufact
Communications &
Post
Transport & Distribution
Other Services
Government and Non-Profits
Financial Services 28.2% 4.6% 1.5% 1.5% 0.7% X.X% 3.2% 3.4% 0.7% 1.2% 3.7% 2.7% 15.7%Agriculture 0.0% 13.8% 0.1% 0.2% 5.4% X.X% X.X% x.x% 0.1% 0.0% 0.0% 0.0% 0.0%Livestock 0.0% 0.5% 0.0% 0.0% 24.9% X.X% X.X% x.x% 0.0% 0.0% 0.0% 0.0% 0.0%Forestry 0.0% 0.0% 0.0% 0.0% 0.1% X.X% X.X% x.x% 12.7% 0.0% 0.0% 0.0% 0.0%Fishing 0.0% 0.0% 0.0% 0.0% 0.2% X.X% X.X% x.x% 0.0% 0.0% 0.0% 0.0% 0.0%
Agriculture, Forestry, 0.0% 14.3% 0.1% 0.2% 30.6% X.X% X.X% x.x% 12.8% 0.0% 0.0% 0.0% 0.0%Oil-Gas Min 0.0% 0.0% 4.8% 0.0% 0.0% X.X% X.X% x.x% 0.0% 0.0% 0.4% 0.0% 0.0%
Mining 0.0% 0.4% 0.2% 0.9% 0.1% X.X% X.X% x.x% 0.0% 0.0% 0.0% 0.0% 0.0%Power Gen 0.2% 1.6% 0.5% 0.4% 1.1% X.X% X.X% x.x% 1.2% 0.2% 0.3% 0.1% 0.4%Gas Distri 0.0% 0.5% 0.5% 0.1% 1.0% X.X% X.X% x.x% 0.4% 0.2% 0.2% 0.0% 0.2%Water Svc 0.0% 0.9% 0.0% 0.1% 0.1% X.X% X.X% x.x% 0.1% 0.1% 0.1% 0.0% 0.2%
Oil, Mining, Gas & Water 0.2% 3.3% 6.0% 1.4% 2.3% X.X% X.X% x.x% 1.6% 0.6% 1.0% 0.2% 0.8%Construction 0.6% 0.5% 2.7% 0.1% 0.5% X.X% X.X% x.x% 0.6% 1.1% 1.1% 0.2% 1.2%Food Process 0.0% 0.1% 0.0% 0.0% 22.2% X.X% X.X% x.x% 0.0% 0.0% 0.0% 0.0% 0.2%
Beverages 0.0% 0.0% 0.0% 0.0% 0.8% X.X% X.X% x.x% 0.0% 0.0% 0.0% 0.0% 0.1%Food & Beverage 0.0% 0.1% 0.0% 0.0% 23.0% X.X% X.X% x.x% 0.0% 0.0% 0.0% 0.0% 0.3%Marijuana Retail X.X%Marijuana Grow X.X% X.X%Marijuana Manu X.X%
Textiles 0.0% 0.2% 0.0% 0.3% 0.1% 0.0% 0.4% 0.1% 0.8% 0.0% 0.0% 0.0% 0.4%Wood Manu 0.0% 0.2% 0.0% 2.2% 0.0% X.X% X.X% x.x% 19.3% 0.1% 0.1% 0.1% 0.1%
Paper-Print-Pub 0.4% 0.1% 0.2% 0.3% 3.1% X.X% X.X% x.x% 0.6% 0.1% 0.1% 2.5% 1.0%Chemical Refine 0.1% 16.5% 2.1% 5.5% 1.3% X.X% X.X% x.x% 1.9% 0.4% 9.5% 0.5% 0.5%Manufacturing 0.0% 1.4% 4.7% 14.4% 2.6% X.X% X.X% x.x% 5.4% 1.0% 1.8% 1.1% 0.6%
Electrical Goods 0.2% 0.1% 0.1% 3.2% 0.2% X.X% X.X% x.x% 2.0% 2.6% 0.3% 1.5% 0.2%Transport Goods 0.0% 0.3% 0.4% 0.9% 0.1% X.X% X.X% x.x% 0.5% 0.1% 2.6% 0.1% 0.5%
Furniture 0.0% 0.0% 0.0% 1.4% 0.0% X.X% X.X% x.x% 1.3% 0.0% 0.0% 0.0% 0.0%Light & Heavy 0.8% 18.8% 7.6% 28.2% 7.4% X.X% X.X% x.x% 31.7% 4.3% 14.4% 5.8% 3.3%
Communications 2.8% 0.1% 0.3% 1.1% 0.4% X.X% X.X% x.x% 0.9% 12.4% 0.9% 1.5% 1.6%Transport Svc 0.8% 2.1% 0.7% 1.6% 4.2% X.X% X.X% x.x% 4.9% 0.6% 8.2% 1.7% 1.9%Whsl/Retail 0.1% 2.3% 0.7% 5.4% 4.0% X.X% X.X% x.x% 4.7% 0.3% 1.0% 1.1% 0.5%
Transport & Distribution 0.9% 4.4% 1.4% 7.1% 8.2% X.X% X.X% x.x% 9.6% 1.0% 9.2% 2.8% 2.4%Information Process 0.2% 0.0% 0.0% 0.0% 0.0% X.X% X.X% x.x% 0.0% 4.7% 0.0% 7.5% 0.8%
Recreation Act. 0.5% 0.0% 0.1% 0.1% 0.2% X.X% X.X% x.x% 0.3% 0.3% 0.0% 0.6% 0.4%Other Svc 15.2% 11.9% 11.9% 13.8% 9.3% X.X% X.X% x.x% 9.4% 13.0% 11.1% 22.7% 15.9%
Other Services 15.9% 11.9% 12.0% 13.9% 9.5% X.X% X.X% x.x% 9.7% 18.0% 11.2% 30.8% 17.0%Non-prof Org 0.6% 0.1% 0.1% 0.3% 0.1% X.X% X.X% x.x% 0.1% 0.3% 1.1% 0.5% 0.7%State-Fed Gov 0.7% 0.0% 0.0% 0.0% 0.0% X.X% X.X% x.x% 0.0% 0.0% 0.0% 0.0% 0.0%
Government & Non- 1.3% 0.1% 0.1% 0.3% 0.1% X.X% X.X% x.x% 0.2% 0.3% 1.1% 0.5% 0.7%Bus Taxes 1.7% 1.8% 8.4% 0.6% 0.3% X.X% X.X% x.x% 0.7% 5.8% 3.9% 1.1% 0.0%Payrolls 24.5% 11.2% 15.4% 27.3% 9.3% X.X% X.X% x.x% 11.9% 16.7% 33.9% 23.8% 46.6%
Dwellings 3.9% -23.9% 17.2% -32.9% -73.2% X.X% X.X% x.x% -46.2% 14.5% -17.5% -9.7% -14.5%Rent and Cost of Capital 20.9% 28.9% 43.9% 18.2% 7.6% X.X% X.X% x.x% 19.4% 37.2% 16.7% 29.1% 10.2%
Misc. Expenses 2.2% 0.0% 0.5% 0.0% 0.2% X.X% X.X% x.x% 0.0% 1.4% 2.8% 1.3% 0.0%Total Spending: 100% 100% 100% 100% 100% 100.0% 100.0% 100.0% 100% 100% 100% 100% 100%
Traditional Economic Sectors Marijuana Industires Traditional Economic Sectors

NEVADA INITIATIVE TO REGULATE & TAX MARIJUANA: ECONOMIC & FISCAL BENEFITS STUDY
B-5
registered businesses must have a federally-assigned “EIN” (Employer Identification Number) and
must register to pay unemployment insurance and workers’ compensation insurance. This data can
be combined with private-side data in order to construct the model.
Calculation of Output and Employment Multipliers
Once the marijuana-specific tables are constructed, the industry-specific multipliers can be
computed using standard I-O techniques. This process is described next.
The Input-Output table is combined with a table of Regional Purchase Coefficients (“RPCs”)
that have been originally constructed by the BEA. These RPCs indicate the share of each
intermediate input that is purchased from within the state of Nevada, versus inputs that are
purchased from outside of Nevada. For example, the RPC for most manufactured goods is
approximately 12 percent. This indicates that approximately 88 percent of manufactured
goods that are purchased by business and residents in Nevada come from outside of the
state. Of course, all purchases of marijuana inputs have an RPC of 100 percent. However,
intermediate inputs for marijuana cultivators, and for non-marijuana products can be
purchased normally. Thus, the non-marijuana purchases utilize standard RPCs for the rest
of the economy.
The output multiplier is computed by using the standard I-O formula. This formula reflects
the share of spending for each intermediate input, or household purchase. Subsequent
spending by intermediate suppliers and by employees are included as well. The culmination
of this spending can be represented using an infinite-series. The sum of this series can be
concisely written using the equation below:
𝑋𝑋 = [𝐼𝐼 − 𝐴𝐴]−1 𝑌𝑌
Each element of the equation is a matrix or vector. X represents the total change in output,
the symbol I is the Identity matrix, A is the Direct Requirements Table and Y is a vector
representing the change in spending for different sectors. For example, if Y = $1.00 of
spending on marijuana retailing, then X would equal $2.33 dollars, using the current model.
This is the sum of changes in output for all sectors in the economy, in addition to the
original $1 dollar of spending.
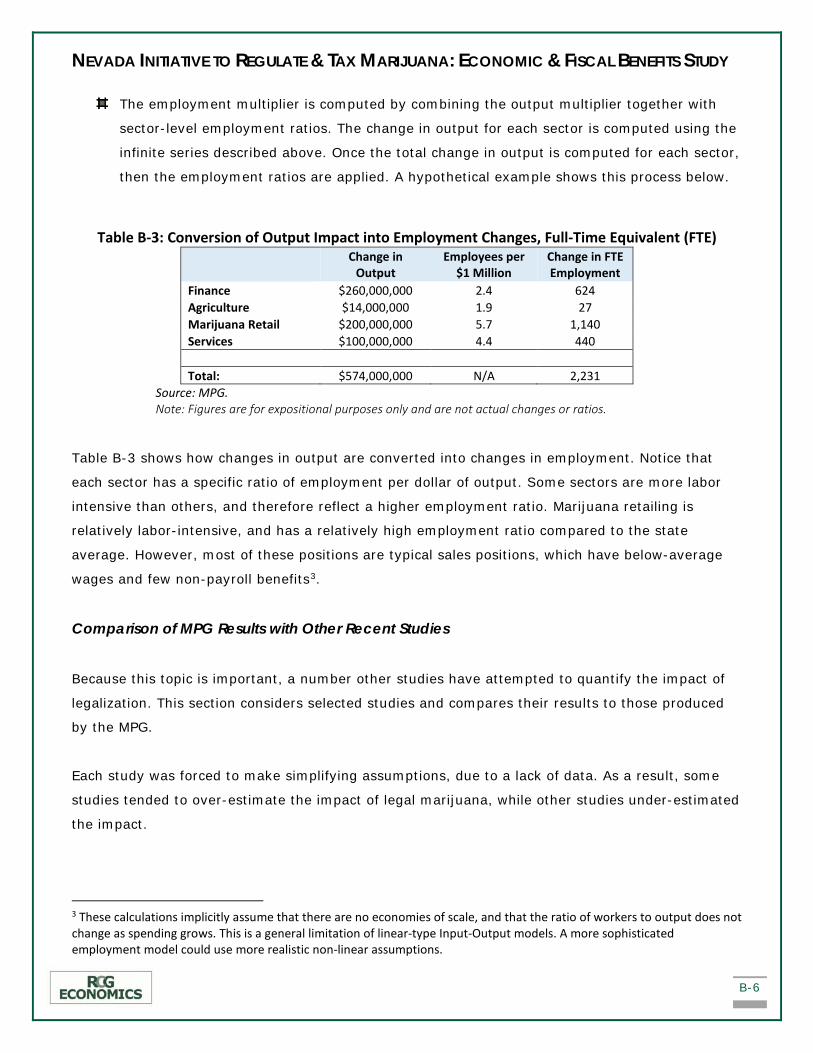
NEVADA INITIATIVE TO REGULATE & TAX MARIJUANA: ECONOMIC & FISCAL BENEFITS STUDY
B-6
The employment multiplier is computed by combining the output multiplier together with
sector-level employment ratios. The change in output for each sector is computed using the
infinite series described above. Once the total change in output is computed for each sector,
then the employment ratios are applied. A hypothetical example shows this process below.
Table B-3: Conversion of Output Impact into Employment Changes, Full-Time Equivalent (FTE)
Change in
Output Employees per
$1 Million Change in FTE Employment
Finance $260,000,000 2.4 624 Agriculture $14,000,000 1.9 27 Marijuana Retail $200,000,000 5.7 1,140 Services $100,000,000 4.4 440 Total: $574,000,000 N/A 2,231
Source: MPG. Note: Figures are for expositional purposes only and are not actual changes or ratios.
Table B-3 shows how changes in output are converted into changes in employment. Notice that
each sector has a specific ratio of employment per dollar of output. Some sectors are more labor
intensive than others, and therefore reflect a higher employment ratio. Marijuana retailing is
relatively labor-intensive, and has a relatively high employment ratio compared to the state
average. However, most of these positions are typical sales positions, which have below-average
wages and few non-payroll benefits3.
Comparison of MPG Results with Other Recent Studies
Because this topic is important, a number other studies have attempted to quantify the impact of
legalization. This section considers selected studies and compares their results to those produced
by the MPG.
Each study was forced to make simplifying assumptions, due to a lack of data. As a result, some
studies tended to over-estimate the impact of legal marijuana, while other studies under-estimated
the impact.
3 These calculations implicitly assume that there are no economies of scale, and that the ratio of workers to output does not change as spending grows. This is a general limitation of linear-type Input-Output models. A more sophisticated employment model could use more realistic non-linear assumptions.
NEVADA INITIATIVE TO REGULATE & TAX MARIJUANA: ECONOMIC & FISCAL BENEFITS STUDY
B-7
Study #1, written by a Denver-area consultancy in 2014, uses the IMPLAN model (a popular
I-O model and dataset). Because “marijuana sales” does not exist in the IMPLAN dataset,
the authors used the general retail sector as a proxy industry. The results of this study
therefore under-estimated the output and employment caused by marijuana sales, by
approximately 40 percent.
Study #2, written by New Frontier, a financial services company that serves the marijuana
industry, did not use an Input-Output model at all. Instead, the study combines anecdotal
observations together with official sales figures, and then assumes that they are
fundamental relationships. For example, the New Frontier authors state that “the market in
2020 will be $80 Billion USD” for adult-use and medical marijuana. However, this
declaration incorrectly assumes that the US market growth is inherent demand, rather than
a shift between black markets and regulated markets. As a result, their projections grossly
over-estimate potential sales over the medium term.
Study #3, by New Economy, a consulting services firm based in Portland, Oregon, estimates
the total employment caused by marijuana legalization in the state. This study is focused
upon employment, rather than output, and therefore does not rely upon an I-O model to
generate results. Instead, the study relies upon a survey of existing marijuana dispensaries
that asks questions about their employee count, and whether new employees were hired
after adult-use marijuana was legalized. The report findings represent a summary of those
results, and a linear projection of employment if sales grow further in the state. The last
chapter of this study mentions use of the IMPLAN model, but does not supply specific details
regarding the inputs or outputs of that exercise.
Study #4, by First Bank of Canada, reflects the lack of official data and the inability to
discern credible research apart from blind speculation. The study uses a combination of data
pieces from Colorado, Victoria BC and Statistics Canada to estimate potential sales and tax
revenues when adult-use cannabis is legalized in Canada. In doing so, the authors over-
estimated potential tax revenues by a gross margin -- approximately 500 percent. During
the first year of legalization, tax revenues in Colorado, Washington, and Oregon were
approximately $23, $18, and $6 per resident.4 In contrast the First Bank study suggests
4 Indicates total excise and sales tax revenues for the first “representative” 12 months after legal markets were opened, divided by the total population of the state. Oregon’s estimate is extrapolated from the first 2 months of taxation in 2016.
NEVADA INITIATIVE TO REGULATE & TAX MARIJUANA: ECONOMIC & FISCAL BENEFITS STUDY
B-8
that tax revenues will equal CA$5 Billion after legalization, or more than CA$200 per
resident.
The study findings were released and published by all major newspapers in Canada and
among the marijuana-specific publications in the United States.
This survey of alternative studies reveals two important issues related to marijuana legalization.
First, there is a clear need for economic studies that can clearly explain how marijuana legalization
impacts state budgets, employment, and output. Second, the marijuana industry and press should
be cognizant of how erroneous or misleading reports are so easily published and accepted, due to a
lack of credible and transparent quantitative research in the field of marijuana economics.
Inaccurate or misleading information can lead to poor policy choices or industry performance and
would be generally harmful to the image of the marijuana industry overall.
###

NEVADA INITIATIVE TO REGULATE & TAX MARIJUANA: ECONOMIC & FISCAL BENEFITS STUDY
C-1
C. APPENDIX C: EBA DETAILED RESULTS
A. ECONOMIC BENEFITS ANALYSIS RESULTS The results for the economic benefits analysis are presented here for each year of the seven-year
study period, as well as the total benefits and the average annual benefits for the first seven years
of the regulated market.
Table C-1: Total Economic Benefits from Adult-Use Marijuana Industry: 2018-2024 Impact Type Spending/Output Employment Labor Income Direct Benefit $3,201,391,017 21,769 $736,319,934 Indirect Benefit $2,497,084,993 13,766 $406,578,602 Induced Benefit $1,760,765,059 5,442 $578,085,530 Total Benefits $7,459,241,070 40,978 $1,720,984,066 Multipliers 2.33 1.88 2.34
Sources: MPG, IMPLAN, RCG Economics.
Table C-2: Average Annual Economic Benefits from Adult-Use Marijuana Industry: 2018-2024 Impact Type Spending/Output Employment Labor Income Direct Benefit $457,341,574 3,110 $105,188,562 Indirect Benefit $356,726,428 1,967 $58,082,657 Induced Benefit $251,537,866 777 $82,583,647 Total Benefits $1,065,605,867 5,854 $245,854,867 Multipliers 2.33 1.88 2.34
Sources: MPG, IMPLAN, RCG Economics.
Table C-3: Total Economic Benefits from Adult-Use Marijuana Industry: 2018 Impact Type Spending/Output Employment Labor Income Direct Benefit $393,711,027 2,677 $90,553,536 Indirect Benefit $307,094,601 1,693 $50,001,539 Induced Benefit $216,541,065 669 $71,093,674 Total Benefits $917,346,693 5,040 $211,648,749 Multipliers 2.33 1.88 2.34
Sources: MPG, IMPLAN, RCG Economics.
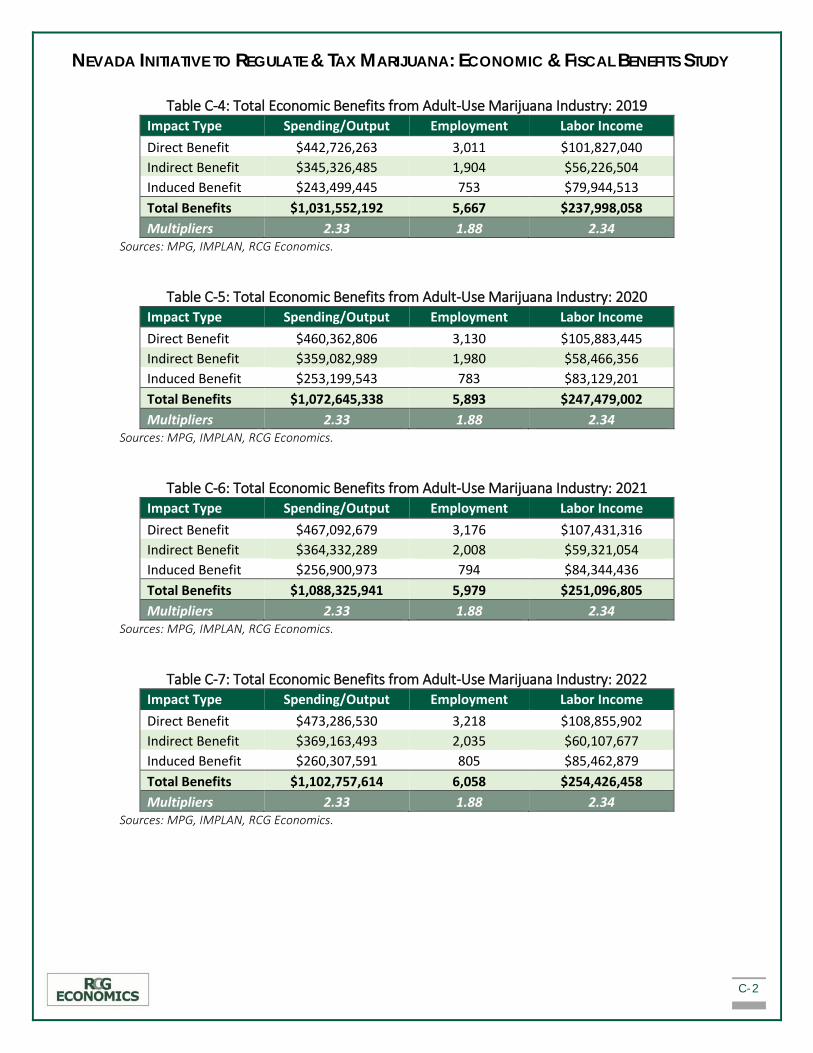
NEVADA INITIATIVE TO REGULATE & TAX MARIJUANA: ECONOMIC & FISCAL BENEFITS STUDY
C-2
Table C-4: Total Economic Benefits from Adult-Use Marijuana Industry: 2019 Impact Type Spending/Output Employment Labor Income Direct Benefit $442,726,263 3,011 $101,827,040 Indirect Benefit $345,326,485 1,904 $56,226,504 Induced Benefit $243,499,445 753 $79,944,513 Total Benefits $1,031,552,192 5,667 $237,998,058 Multipliers 2.33 1.88 2.34
Sources: MPG, IMPLAN, RCG Economics.
Table C-5: Total Economic Benefits from Adult-Use Marijuana Industry: 2020 Impact Type Spending/Output Employment Labor Income Direct Benefit $460,362,806 3,130 $105,883,445 Indirect Benefit $359,082,989 1,980 $58,466,356 Induced Benefit $253,199,543 783 $83,129,201 Total Benefits $1,072,645,338 5,893 $247,479,002 Multipliers 2.33 1.88 2.34
Sources: MPG, IMPLAN, RCG Economics.
Table C-6: Total Economic Benefits from Adult-Use Marijuana Industry: 2021 Impact Type Spending/Output Employment Labor Income Direct Benefit $467,092,679 3,176 $107,431,316 Indirect Benefit $364,332,289 2,008 $59,321,054 Induced Benefit $256,900,973 794 $84,344,436 Total Benefits $1,088,325,941 5,979 $251,096,805 Multipliers 2.33 1.88 2.34
Sources: MPG, IMPLAN, RCG Economics.
Table C-7: Total Economic Benefits from Adult-Use Marijuana Industry: 2022 Impact Type Spending/Output Employment Labor Income Direct Benefit $473,286,530 3,218 $108,855,902 Indirect Benefit $369,163,493 2,035 $60,107,677 Induced Benefit $260,307,591 805 $85,462,879 Total Benefits $1,102,757,614 6,058 $254,426,458 Multipliers 2.33 1.88 2.34
Sources: MPG, IMPLAN, RCG Economics.
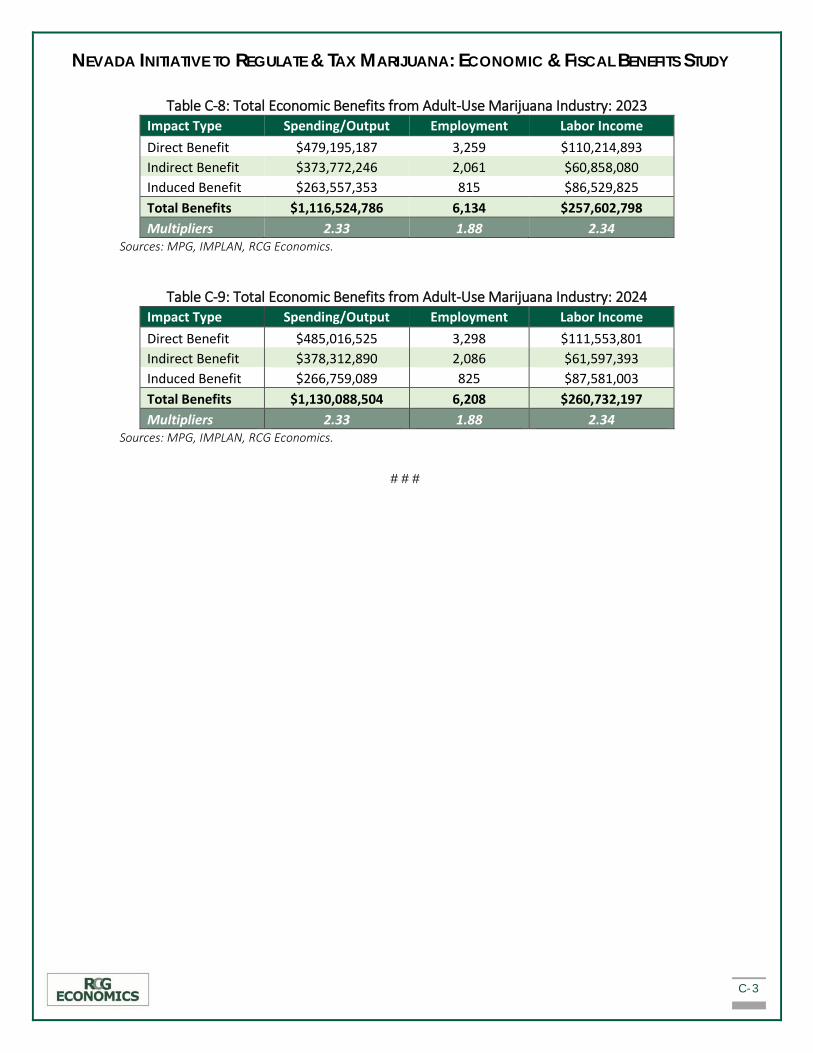
NEVADA INITIATIVE TO REGULATE & TAX MARIJUANA: ECONOMIC & FISCAL BENEFITS STUDY
C-3
Table C-8: Total Economic Benefits from Adult-Use Marijuana Industry: 2023 Impact Type Spending/Output Employment Labor Income Direct Benefit $479,195,187 3,259 $110,214,893 Indirect Benefit $373,772,246 2,061 $60,858,080 Induced Benefit $263,557,353 815 $86,529,825 Total Benefits $1,116,524,786 6,134 $257,602,798 Multipliers 2.33 1.88 2.34
Sources: MPG, IMPLAN, RCG Economics.
Table C-9: Total Economic Benefits from Adult-Use Marijuana Industry: 2024 Impact Type Spending/Output Employment Labor Income Direct Benefit $485,016,525 3,298 $111,553,801 Indirect Benefit $378,312,890 2,086 $61,597,393 Induced Benefit $266,759,089 825 $87,581,003 Total Benefits $1,130,088,504 6,208 $260,732,197 Multipliers 2.33 1.88 2.34
Sources: MPG, IMPLAN, RCG Economics.
###

NEVADA INITIATIVE TO TAX & REGULATE MARIJUANA: ECONOMIC & FISCAL BENEFITS STUDY
D-1
D. APPENDIX D: FBA DETAILED RESULTS
A. COMMERCE TAX ESTIMATE
Our fiscal benefits analysis assumes that there are eight business types that will potentially
generate revenue in Nevada:
1. Businesses with only one license that is retail;
2. Businesses with only one license that is manufacturing;
3. Businesses with only one license that is cultivation;
4. Businesses with multiple licenses that are retail only;
5. Businesses with multiple licenses that are manufacturing only;
6. Businesses with multiple licenses that are cultivation only;
7. Businesses with retail and cultivation licenses; and
8. Businesses with cultivation and manufacturing licenses.
Retail Sales per Store: For the purpose of our analysis, we assume that retail stores that
operate independently of either other retail stores, cultivation facilities or manufacturing
facilities will earn an annual revenue equal to the average annual retail sales per store for
the county in which it operates. For a marijuana retail store that operates with either
another retail store or a cultivation facility, we used the statewide annual average revenue
per store. This assumption has been made to allow for the possibility that businesses
holding multiple retail licenses have stores in different counties. Table D-1 shows the annual
retail sales per store, by Nevada county, and the State.

NEVADA INITIATIVE TO TAX & REGULATE MARIJUANA: ECONOMIC & FISCAL BENEFITS STUDY
D-2
Table D-1: Retail Revenue per Store by Nevada County and for the State
County Total Retail Sales Years Active Retail Licenses
Annual Retail Sales per Store
Carson City $39,602,697 7 3 $1,885,843 Churchill $17,088,538 7 1 $2,441,220 Clark $2,652,227,135 7 70 $5,412,708 Douglas $36,979,926 7 3 $1,760,949 Elko $36,723,775 7 3 $1,748,751 Esmeralda $773,544 7 1 $110,506 Eureka $1,510,804 7 1 $215,829 Humboldt $10,690,326 7 1 $1,527,189 Lander $4,004,026 7 1 $572,004 Lincoln $3,366,996 7 1 $480,999 Lyon $40,600,787 7 3 $1,933,371 Mineral $3,509,593 7 1 $501,370 Nye $32,843,952 7 3 $1,563,998 Pershing $5,082,281 7 1 $726,040 Storey $3,553,078 7 1 $507,583 Washoe $306,327,185 7 18 $2,431,168 White Pine $6,506,375 7 1 $929,482 Nevada $3,201,391,017 7 113 $4,047,271
Sources: RCG, MPG, IMPLAN.
Annual Marijuana Manufacturer Revenue: For the purpose of our analysis, we used
statewide annual revenue average applied to each manufacturing facility. This assumption
was made because manufacturing facilities may supply retail stores across county lines.
RCG’s research comparing retail store revenue to manufacturing facility revenue in
Washington has indicated that, on average, manufacturing facility revenue equals 48
percent of retail store revenue. We assume annual revenue per manufacturing facilities will
potentially equal $1,542,839 (see Table D-2).
Table D-2: Manufacturing Facility Revenue per Year Value
Total Retail Revenue for 7-Year Period $3,201,391,017 Divide by: Years in Analysis Period 7 Annual Retail Revenue in Nevada $457,341,574 Times: Estimated Ratio of Manufacturer-to-Retailer Revenue 48% Annual Manufacturing Revenue $219,523,955 Divide by: Average Active Manufacturing Licenses per Year 142 Annual Manufacturing Revenue per Facility $1,542,839
Sources: RCG, MPG, IMPLAN, Washington Liquor and Marijuana Board. Numbers may not calculate exactly due to rounding.
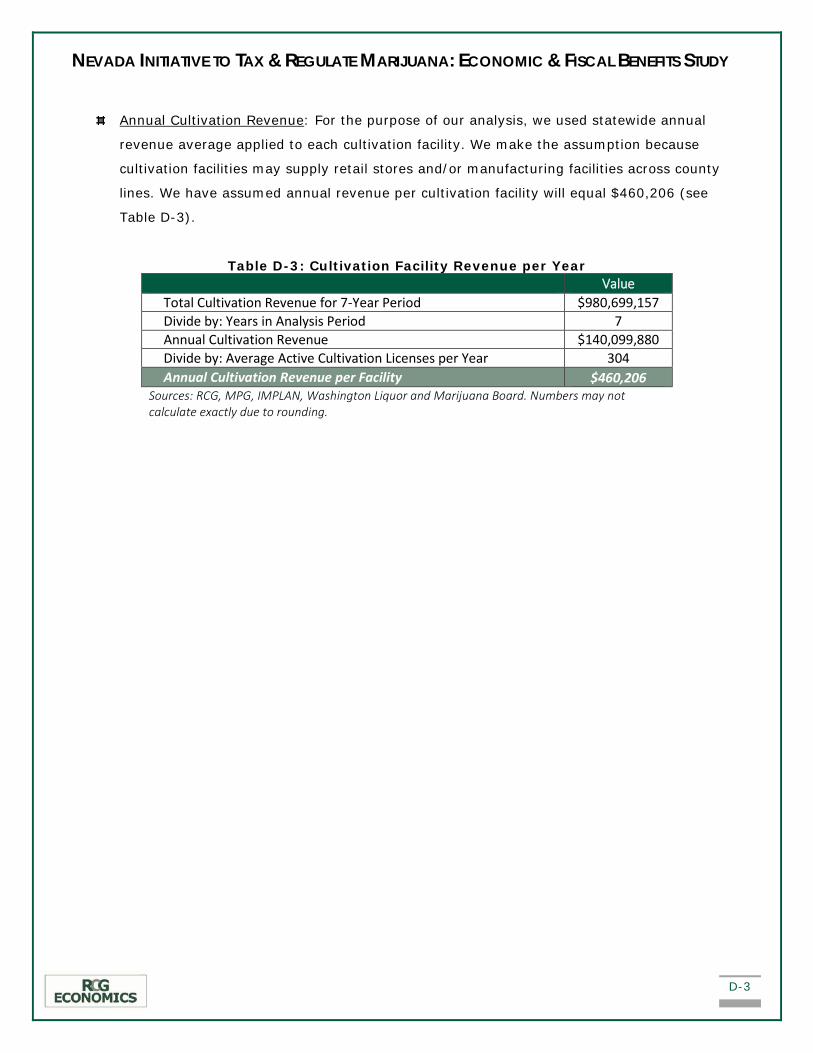
NEVADA INITIATIVE TO TAX & REGULATE MARIJUANA: ECONOMIC & FISCAL BENEFITS STUDY
D-3
Annual Cultivation Revenue: For the purpose of our analysis, we used statewide annual
revenue average applied to each cultivation facility. We make the assumption because
cultivation facilities may supply retail stores and/or manufacturing facilities across county
lines. We have assumed annual revenue per cultivation facility will equal $460,206 (see
Table D-3).
Table D-3: Cultivation Facility Revenue per Year Value
Total Cultivation Revenue for 7-Year Period $980,699,157 Divide by: Years in Analysis Period 7 Annual Cultivation Revenue $140,099,880 Divide by: Average Active Cultivation Licenses per Year 304 Annual Cultivation Revenue per Facility $460,206
Sources: RCG, MPG, IMPLAN, Washington Liquor and Marijuana Board. Numbers may not calculate exactly due to rounding.

NEVADA INITIATIVE TO TAX & REGULATE MARIJUANA: ECONOMIC & FISCAL BENEFITS STUDY
D-4
Businesses with only one license that is retail
Our analysis of retail stores, by county, shows that Clark County is the only county where a
business with only one retail license will potentially earn annual revenue in excess of the minimum
Nevada gross revenue of $4,000,000 set forth in NRS 363C.300. It has been estimated that
business with only one retail license will generate $5,412,708, annually. These stores will
potentially generate $57,628 in commerce tax revenue over the seven-year analysis period (see
Table D-4 below).
Table D-4: Commerce Tax Revenue Generated by Businesses with Only One Retail License, Clark County: 2018-2024
Value Annual Commerce Tax Collections per Retail Business in Clark County Annual Sales per Retailer Store in Clark County (Table D-1) $5,412,708 Less: Minimum Nevada Gross Revenue $4,000,000 Annual Taxable Retail Sales per Store $1,412,708 Times: Retail Commerce Tax 0.111% Annual Commerce Tax Collected per Business with Only One Retail License $1,568
Taxable Active Businesses with Only One Retail License Active Retail Licenses in Clark County 7 Times: % of Active Retail Licenses Held by a Business with Only One Retail License 75% Taxable Active Businesses with Only One Retail License 5
Total Commerce Tax Revenue for Businesses with Only One Retail License Annual Commerce Tax Collected per Business with Only One Retail License $1,568 Taxable Active Businesses with Only One Retail License 5 Times: Years in Analysis Period 7 Commerce Tax Revenue Generated by Businesses with Only One Retail License $57,628
Sources: RCG, MPG, IMPLAN, Washington Liquor and Marijuana Board. Numbers may not calculate exactly due to rounding.
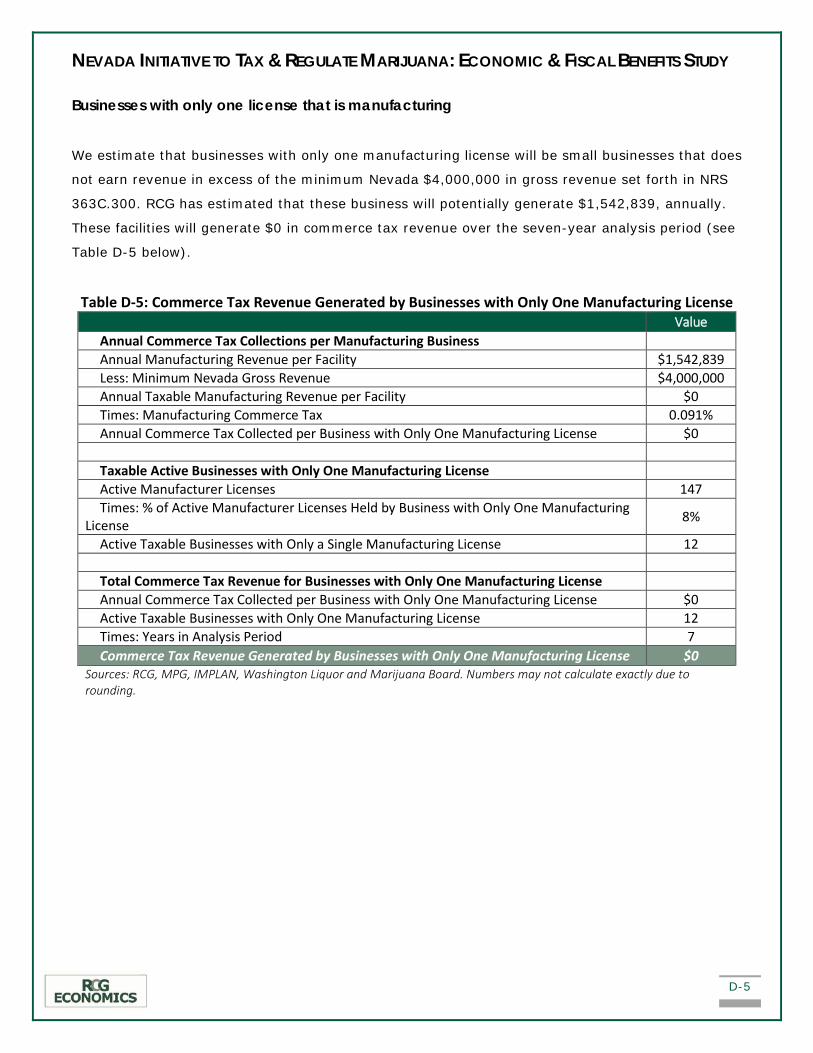
NEVADA INITIATIVE TO TAX & REGULATE MARIJUANA: ECONOMIC & FISCAL BENEFITS STUDY
D-5
Businesses with only one license that is manufacturing
We estimate that businesses with only one manufacturing license will be small businesses that does
not earn revenue in excess of the minimum Nevada $4,000,000 in gross revenue set forth in NRS
363C.300. RCG has estimated that these business will potentially generate $1,542,839, annually.
These facilities will generate $0 in commerce tax revenue over the seven-year analysis period (see
Table D-5 below).
Table D-5: Commerce Tax Revenue Generated by Businesses with Only One Manufacturing License Value
Annual Commerce Tax Collections per Manufacturing Business Annual Manufacturing Revenue per Facility $1,542,839 Less: Minimum Nevada Gross Revenue $4,000,000 Annual Taxable Manufacturing Revenue per Facility $0 Times: Manufacturing Commerce Tax 0.091% Annual Commerce Tax Collected per Business with Only One Manufacturing License $0
Taxable Active Businesses with Only One Manufacturing License Active Manufacturer Licenses 147 Times: % of Active Manufacturer Licenses Held by Business with Only One Manufacturing
License 8%
Active Taxable Businesses with Only a Single Manufacturing License 12
Total Commerce Tax Revenue for Businesses with Only One Manufacturing License Annual Commerce Tax Collected per Business with Only One Manufacturing License $0 Active Taxable Businesses with Only One Manufacturing License 12 Times: Years in Analysis Period 7 Commerce Tax Revenue Generated by Businesses with Only One Manufacturing License $0
Sources: RCG, MPG, IMPLAN, Washington Liquor and Marijuana Board. Numbers may not calculate exactly due to rounding.
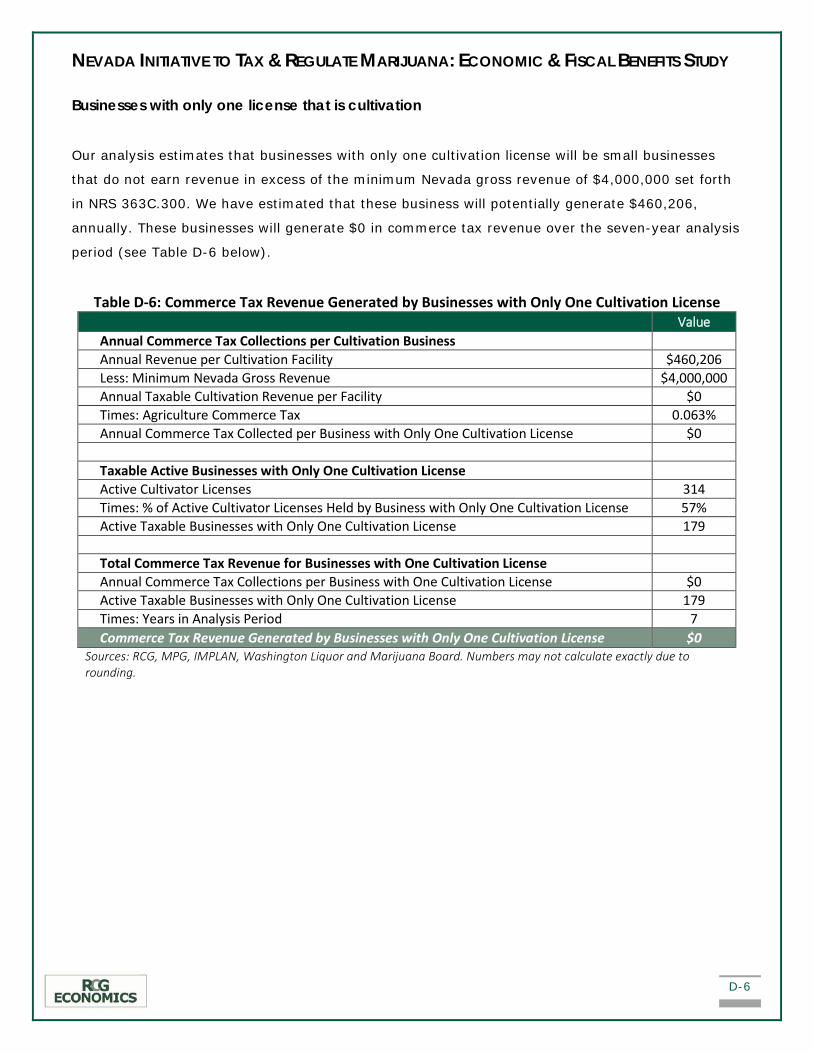
NEVADA INITIATIVE TO TAX & REGULATE MARIJUANA: ECONOMIC & FISCAL BENEFITS STUDY
D-6
Businesses with only one license that is cultivation
Our analysis estimates that businesses with only one cultivation license will be small businesses
that do not earn revenue in excess of the minimum Nevada gross revenue of $4,000,000 set forth
in NRS 363C.300. We have estimated that these business will potentially generate $460,206,
annually. These businesses will generate $0 in commerce tax revenue over the seven-year analysis
period (see Table D-6 below).
Table D-6: Commerce Tax Revenue Generated by Businesses with Only One Cultivation License Value
Annual Commerce Tax Collections per Cultivation Business Annual Revenue per Cultivation Facility $460,206 Less: Minimum Nevada Gross Revenue $4,000,000 Annual Taxable Cultivation Revenue per Facility $0 Times: Agriculture Commerce Tax 0.063% Annual Commerce Tax Collected per Business with Only One Cultivation License $0
Taxable Active Businesses with Only One Cultivation License Active Cultivator Licenses 314 Times: % of Active Cultivator Licenses Held by Business with Only One Cultivation License 57% Active Taxable Businesses with Only One Cultivation License 179
Total Commerce Tax Revenue for Businesses with One Cultivation License Annual Commerce Tax Collections per Business with One Cultivation License $0 Active Taxable Businesses with Only One Cultivation License 179 Times: Years in Analysis Period 7 Commerce Tax Revenue Generated by Businesses with Only One Cultivation License $0
Sources: RCG, MPG, IMPLAN, Washington Liquor and Marijuana Board. Numbers may not calculate exactly due to rounding.

NEVADA INITIATIVE TO TAX & REGULATE MARIJUANA: ECONOMIC & FISCAL BENEFITS STUDY
D-7
Businesses with multiple licenses that are retail only
We estimate that businesses with multiple retail licenses will earn revenue in excess of the
minimum of $4,000,000 in Nevada gross revenue set forth in NRS 363C.300. We have estimated
that these businesses will potentially generate $8,499,268, annually. They will potentially generate
$460,880 in commerce tax revenue over the seven-year analysis period (see Table D-7 below).
Table D-7: Commerce Tax Revenue Generated by Businesses with Multiple Retail-Only Licenses Value
Businesses with Multiple Retail-Only Licenses Total Active Retail Licenses 113 Times: % of Active Retail Licenses Held by a Business with Multiple Licenses 25% Times: % of Licenses Held by a Business with Multiple Retail-Only Licenses 98% Divide by: Average Number of Retail Licenses per Business with Multiple Retail-Only
Licenses 2.10
Number of Business with Multiple Retail-Only Licenses 13
Annual Commerce Tax Collections per Business with Multiple Retail-Only Licenses Annual Retail Revenue per Retail Store (Nevada) $4,047,271 Times: Average Number of Retail Licenses per Business with Multiple Retail-Only
Licenses 2.10
Annual Revenue per Business with Multiple Retail-Only Licenses $8,499,268 Less: Minimum Nevada Gross Revenue $4,000,000 Times: Retail Commerce Tax 0.111% Annual Commerce Tax Collections per Business with Multiple Retail-Only Licenses $4,994
Total Commerce Tax Revenue for Businesses with Multiple Retail-Only Licenses Annual Commerce Tax Collections per Business with Multiple Retail-Only Licenses $4,994 Times: Number of Business with Multiple Retail-Only Licenses 13 Times: Years in Analysis Period 7 Commerce Tax Revenue Generated by Businesses with Multiple Retail-Only Licenses $460,880
Sources: RCG, MPG, IMPLAN, Washington Liquor and Marijuana Board. Numbers may not calculate exactly due to rounding.

NEVADA INITIATIVE TO TAX & REGULATE MARIJUANA: ECONOMIC & FISCAL BENEFITS STUDY
D-8
Businesses with Multiple Manufacturing-Only Licenses
Our analysis estimates that businesses with multiple manufacturing licenses that will not earn
revenue in excess of the minimum $4,000,000 in Nevada gross revenue set forth in NRS 363C.300.
We have estimated that these businesses that are only will potentially generate $1,928,549,
annually. These stores will not generate commerce tax revenue over the seven-year analysis
period (see Table D-8 below).
Table D-8: Commerce Tax Revenue Generated by Businesses with Multiple Manufacturing Licenses Value
Businesses with Multiple Manufacturing Licenses Total Active Manufacturing Licenses 147 Times: % of Active Manufacturing Licenses Held by a Business with Multiple Licenses 92% Times: % of Licenses Held by a Business with Multiple Manufacturing Licenses 2% Divide by: Avg. Number of Manufacturing Licenses per Business with Multiple
Manufacturing Licenses 1.25
Number of Business with Multiple Manufacturing Licenses 2
Annual Commerce Tax Collections per Business with Multiple Manufacturing Licenses Annual Manufacturing Revenue per Manufacturing Facility $1,542,839 Times: Average Number of Manufacturing Licenses per Business with Multiple
Manufacturing Licenses 1.25
Annual Revenue per Business with Multiple Manufacturing Licenses $1,928,549 Less: Minimum Nevada Gross Revenue $4,000,000 Times: Manufacturing Commerce Tax 0.091% Annual Commerce Tax Collections per Business with Multiple Manufacturing Licenses $0
Total Commerce Tax Revenue for Businesses with Multiple Manufacturing Licenses Annual Commerce Tax Collections per Business with Multiple Manufacturing Licenses $0 Times: Number of Business with Multiple Manufacturing Licenses 2 Times: Years in Analysis Period 7 Commerce Tax Revenue Paid by Businesses with Multiple Manufacturing Licenses $0
Sources: RCG, MPG, IMPLAN, Washington Liquor and Marijuana Board. Numbers may not calculate exactly due to rounding.
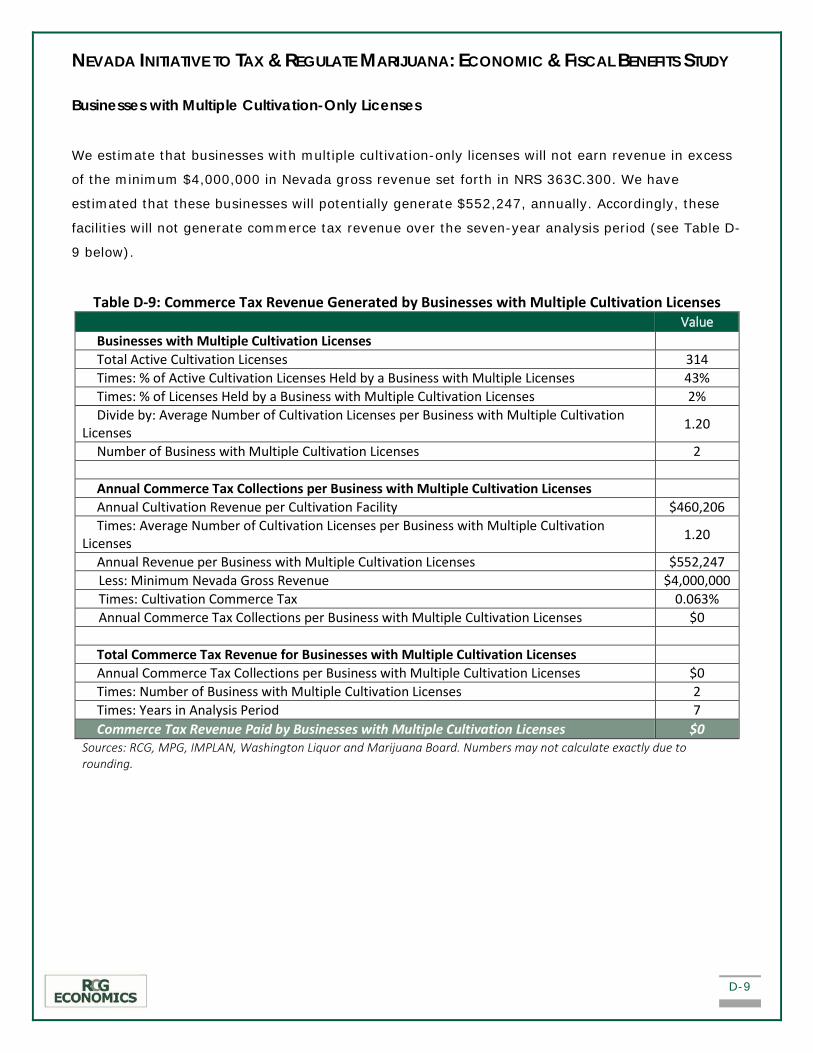
NEVADA INITIATIVE TO TAX & REGULATE MARIJUANA: ECONOMIC & FISCAL BENEFITS STUDY
D-9
Businesses with Multiple Cultivation-Only Licenses
We estimate that businesses with multiple cultivation-only licenses will not earn revenue in excess
of the minimum $4,000,000 in Nevada gross revenue set forth in NRS 363C.300. We have
estimated that these businesses will potentially generate $552,247, annually. Accordingly, these
facilities will not generate commerce tax revenue over the seven-year analysis period (see Table D-
9 below).
Table D-9: Commerce Tax Revenue Generated by Businesses with Multiple Cultivation Licenses Value
Businesses with Multiple Cultivation Licenses Total Active Cultivation Licenses 314 Times: % of Active Cultivation Licenses Held by a Business with Multiple Licenses 43% Times: % of Licenses Held by a Business with Multiple Cultivation Licenses 2% Divide by: Average Number of Cultivation Licenses per Business with Multiple Cultivation
Licenses 1.20
Number of Business with Multiple Cultivation Licenses 2
Annual Commerce Tax Collections per Business with Multiple Cultivation Licenses Annual Cultivation Revenue per Cultivation Facility $460,206 Times: Average Number of Cultivation Licenses per Business with Multiple Cultivation
Licenses 1.20
Annual Revenue per Business with Multiple Cultivation Licenses $552,247 Less: Minimum Nevada Gross Revenue $4,000,000 Times: Cultivation Commerce Tax 0.063% Annual Commerce Tax Collections per Business with Multiple Cultivation Licenses $0
Total Commerce Tax Revenue for Businesses with Multiple Cultivation Licenses Annual Commerce Tax Collections per Business with Multiple Cultivation Licenses $0 Times: Number of Business with Multiple Cultivation Licenses 2 Times: Years in Analysis Period 7 Commerce Tax Revenue Paid by Businesses with Multiple Cultivation Licenses $0
Sources: RCG, MPG, IMPLAN, Washington Liquor and Marijuana Board. Numbers may not calculate exactly due to rounding.

NEVADA INITIATIVE TO TAX & REGULATE MARIJUANA: ECONOMIC & FISCAL BENEFITS STUDY
D-10
Businesses with Retail and Cultivation Licenses
Our analysis estimates that businesses with retail and cultivation licenses will potentially earn
revenue in excess of the minimum $4,000,000 in Nevada gross revenue set forth in NRS 363C.300.
We have estimated that these businesses will potentially generate $4,507,477, annually. These
businesses will generate $2,228 in commerce tax revenue over the seven-year analysis period (see
Table D-10).
Table D-10 Commerce Tax Revenue Generated by Businesses with Retail and Cultivation Licenses Value
Retail Licenses Held by a Business Also Holding Cultivation Licenses Active Retail Licenses 113 Times: % of Active Retail Licenses Held by Business with Multiple Licenses 25% Times: % of Active Retail Licenses Held by Businesses Also Holding Active Cultivation
Licenses 2%
Number of Retail Licenses Held by Businesses Also Holding Cultivation Licenses 1 Cultivation Licenses Held by a Business Also Holding Retail Licenses Active Cultivation Licenses 314 Times: % of Active Cultivation Licenses Held by Businesses with Multiple License Types 43% Times: % of Active Cultivation Licenses Held by Businesses Also Holding Active Retail
Licenses 1%
Number of Cultivation Licenses Held by Businesses Also Holding Retail Licenses 1
Annual Commerce Tax Paid by a Business with Retail and Cultivation Licenses Annual Revenue per Retail Store (Nevada Average) $4,047,271 Plus: Annual Revenue per Cultivation Facility $460,206 Annual Revenue for Businesses with One Retail License and One Cultivation License $4,507,477 Less: Minimum Nevada Gross Revenue $4,000,000 Times: Retail Commerce Tax 0.111% Annual Commerce Tax Paid by Businesses with Retail and Cultivation Licenses $563
Total Commerce Tax Revenue Paid by Businesses with Retail and Cultivation Licenses Annual Commerce Tax Paid by Businesses with Retail and Cultivation Licenses $563 Times: Number of Businesses with Retail and Cultivation Licenses 1 Times: Years in Analysis Period 7 Commerce Tax Revenue Paid by Businesses with Retail and Cultivation Licenses $2,228 Sources: RCG, MPG, IMPLAN, Washington Liquor and Marijuana Board. Numbers may not
calculate exactly due to rounding.
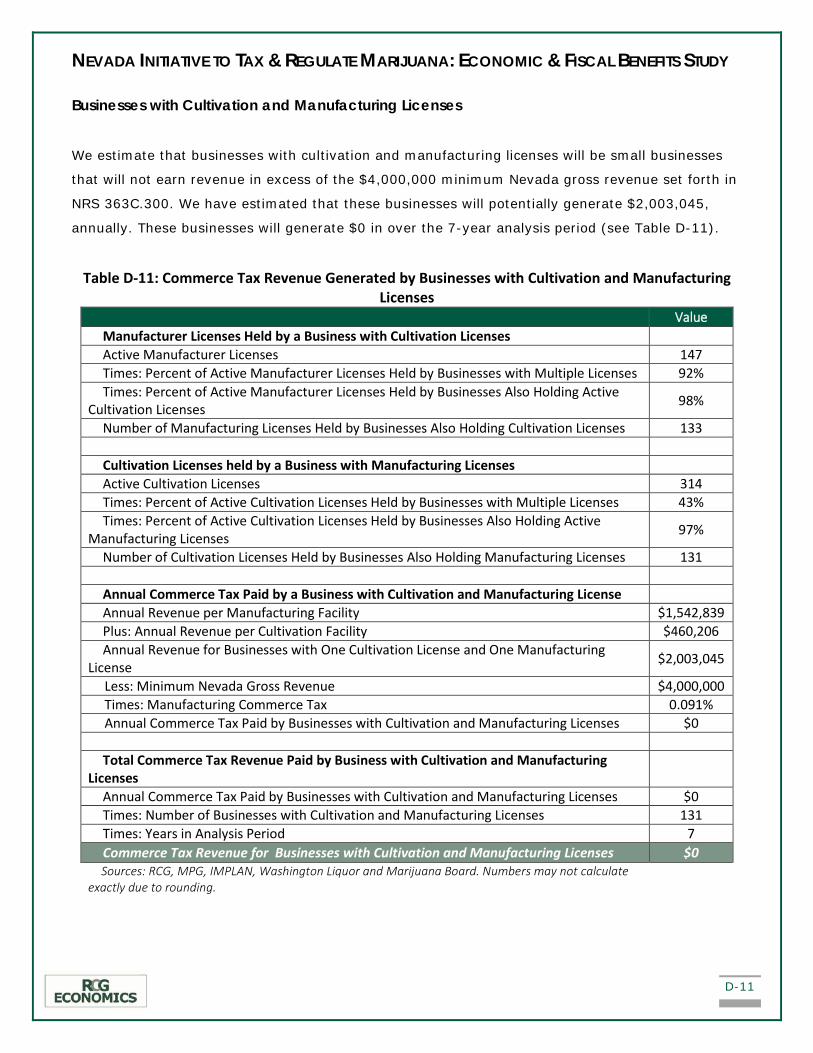
NEVADA INITIATIVE TO TAX & REGULATE MARIJUANA: ECONOMIC & FISCAL BENEFITS STUDY
D-11
Businesses with Cultivation and Manufacturing Licenses
We estimate that businesses with cultivation and manufacturing licenses will be small businesses
that will not earn revenue in excess of the $4,000,000 minimum Nevada gross revenue set forth in
NRS 363C.300. We have estimated that these businesses will potentially generate $2,003,045,
annually. These businesses will generate $0 in over the 7-year analysis period (see Table D-11).
Table D-11: Commerce Tax Revenue Generated by Businesses with Cultivation and Manufacturing Licenses
Value Manufacturer Licenses Held by a Business with Cultivation Licenses Active Manufacturer Licenses 147 Times: Percent of Active Manufacturer Licenses Held by Businesses with Multiple Licenses 92% Times: Percent of Active Manufacturer Licenses Held by Businesses Also Holding Active
Cultivation Licenses 98%
Number of Manufacturing Licenses Held by Businesses Also Holding Cultivation Licenses 133 Cultivation Licenses held by a Business with Manufacturing Licenses Active Cultivation Licenses 314 Times: Percent of Active Cultivation Licenses Held by Businesses with Multiple Licenses 43% Times: Percent of Active Cultivation Licenses Held by Businesses Also Holding Active
Manufacturing Licenses 97%
Number of Cultivation Licenses Held by Businesses Also Holding Manufacturing Licenses 131
Annual Commerce Tax Paid by a Business with Cultivation and Manufacturing License Annual Revenue per Manufacturing Facility $1,542,839 Plus: Annual Revenue per Cultivation Facility $460,206 Annual Revenue for Businesses with One Cultivation License and One Manufacturing
License $2,003,045
Less: Minimum Nevada Gross Revenue $4,000,000 Times: Manufacturing Commerce Tax 0.091% Annual Commerce Tax Paid by Businesses with Cultivation and Manufacturing Licenses $0
Total Commerce Tax Revenue Paid by Business with Cultivation and Manufacturing
Licenses
Annual Commerce Tax Paid by Businesses with Cultivation and Manufacturing Licenses $0 Times: Number of Businesses with Cultivation and Manufacturing Licenses 131 Times: Years in Analysis Period 7 Commerce Tax Revenue for Businesses with Cultivation and Manufacturing Licenses $0 Sources: RCG, MPG, IMPLAN, Washington Liquor and Marijuana Board. Numbers may not calculate
exactly due to rounding.

NEVADA INITIATIVE TO TAX & REGULATE MARIJUANA: ECONOMIC & FISCAL BENEFITS STUDY
D-12
B. MODIFIED BUSINESS TAX ESTIMATE
In Nevada, a modified business tax is required to be paid by a business entity engaging in a
business in the State. The modified business tax is imposed “on each employer at the rate of 1.475
percent of the amount by which the sum of all the wages, as defined in NRS 612.190, paid by the
employer during a calendar quarter with respect to employment in connection with the business
activities of the employer exceeds $50,000” (NRS 363B.110.1). Businesses are entitled to subtract
modified business tax due an amount equal to 50 percent of the commerce tax paid in the
preceding year, and the deduction may only be applied for any of the four calendar quarters
following the end of the preceding for which the commerce tax was paid (NRS 363B.110.4).
Modified Business Tax Assumptions
The results of the modified business tax analysis herein are presented in Table D-12 through Table
D-20 below.
The following assumptions and calculations were used in RCG’s analysis:
Deduction for Commerce Taxes Paid: For the purpose of our analysis, we deduct 50 percent
of the annual commerce tax paid from the modified business tax due pursuant to NRS
363B.110.1. This deduction is made at the bottom of the calculations shown in Tables D-12
through D-19. Pursuant to NRS 363B.110.2, the deduction is only applied to the last six
years of the seven-year analysis period. In the first year of the analysis there are no prior
commerce tax payments made by business for which deductions may be made against the
modified business tax during the second year of the analysis.
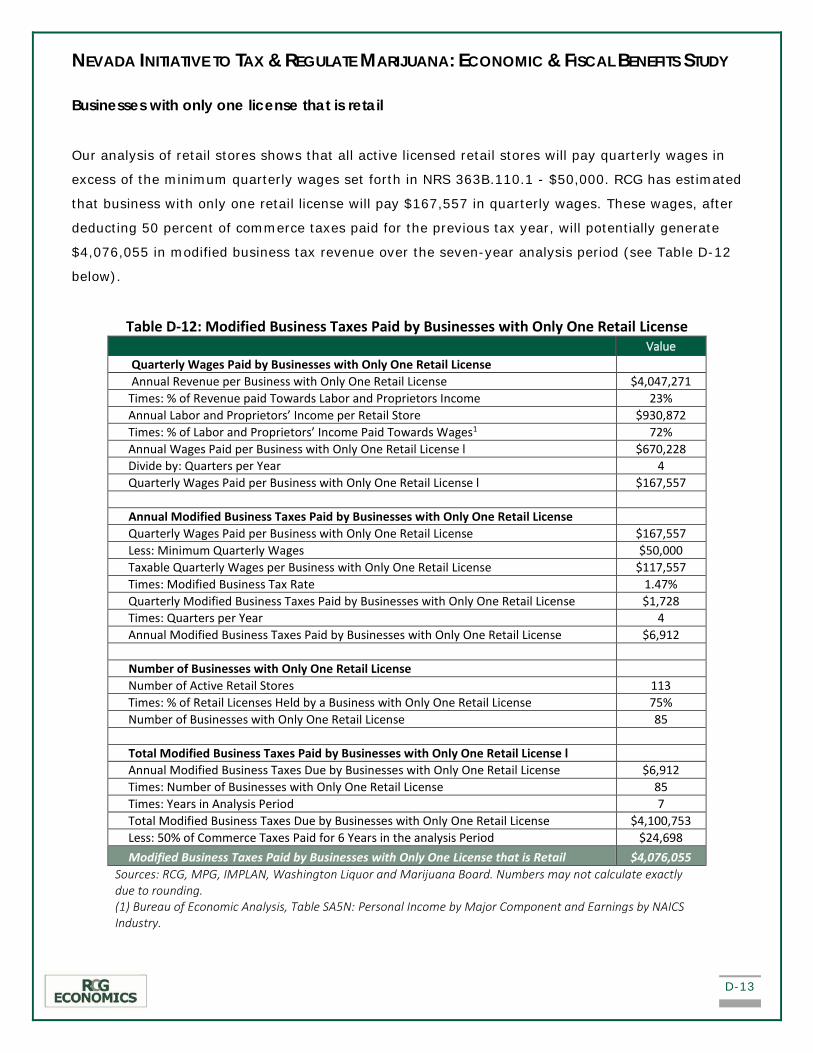
NEVADA INITIATIVE TO TAX & REGULATE MARIJUANA: ECONOMIC & FISCAL BENEFITS STUDY
D-13
Businesses with only one license that is retail
Our analysis of retail stores shows that all active licensed retail stores will pay quarterly wages in
excess of the minimum quarterly wages set forth in NRS 363B.110.1 - $50,000. RCG has estimated
that business with only one retail license will pay $167,557 in quarterly wages. These wages, after
deducting 50 percent of commerce taxes paid for the previous tax year, will potentially generate
$4,076,055 in modified business tax revenue over the seven-year analysis period (see Table D-12
below).
Table D-12: Modified Business Taxes Paid by Businesses with Only One Retail License Value
Quarterly Wages Paid by Businesses with Only One Retail License Annual Revenue per Business with Only One Retail License $4,047,271
Times: % of Revenue paid Towards Labor and Proprietors Income 23% Annual Labor and Proprietors’ Income per Retail Store $930,872 Times: % of Labor and Proprietors’ Income Paid Towards Wages1 72% Annual Wages Paid per Business with Only One Retail License l $670,228 Divide by: Quarters per Year 4 Quarterly Wages Paid per Business with Only One Retail License l $167,557 Annual Modified Business Taxes Paid by Businesses with Only One Retail License Quarterly Wages Paid per Business with Only One Retail License $167,557 Less: Minimum Quarterly Wages $50,000 Taxable Quarterly Wages per Business with Only One Retail License $117,557 Times: Modified Business Tax Rate 1.47% Quarterly Modified Business Taxes Paid by Businesses with Only One Retail License $1,728 Times: Quarters per Year 4 Annual Modified Business Taxes Paid by Businesses with Only One Retail License $6,912 Number of Businesses with Only One Retail License Number of Active Retail Stores 113 Times: % of Retail Licenses Held by a Business with Only One Retail License 75% Number of Businesses with Only One Retail License 85 Total Modified Business Taxes Paid by Businesses with Only One Retail License l Annual Modified Business Taxes Due by Businesses with Only One Retail License $6,912 Times: Number of Businesses with Only One Retail License 85 Times: Years in Analysis Period 7 Total Modified Business Taxes Due by Businesses with Only One Retail License $4,100,753 Less: 50% of Commerce Taxes Paid for 6 Years in the analysis Period $24,698 Modified Business Taxes Paid by Businesses with Only One License that is Retail $4,076,055
Sources: RCG, MPG, IMPLAN, Washington Liquor and Marijuana Board. Numbers may not calculate exactly due to rounding. (1) Bureau of Economic Analysis, Table SA5N: Personal Income by Major Component and Earnings by NAICS Industry.

NEVADA INITIATIVE TO TAX & REGULATE MARIJUANA: ECONOMIC & FISCAL BENEFITS STUDY
D-14
Businesses with only one license that is manufacturing
We estimate that businesses with only one manufacturing license will pay quarterly wages in
excess of the minimum quarterly wages set forth in NRS 363B.110.1 - $50,000. We have
estimated that these business will potentially pay $66,651 in quarterly wages. These wages, after
deducting 50 percent of commerce taxes paid for the previous tax year, will generate $80,596 in
modified business tax revenue over the seven-year analysis period (see Table D-13).
Table D-13: Modified Business Taxes Paid by Businesses with Only One Manufacturing License Value
Quarterly Modified Business Taxes Paid by Businesses with Only One Manufacturing License Annual Manufacturing Revenue per Business with Only One Manufacturing License $1,542,839 Times: % of Revenue paid Towards Labor and Proprietors Income 24% Annual Labor and Proprietors’ Income per Manufacturing Facility $370,281 Times: % of Labor and Proprietors’ Income Paid Towards Wages1 72% Annual Wages Paid per Business with Only One Manufacturing License g $266,603 Divide by: Quarters per Year 4 Quarterly Wages Paid per Business with Only One Manufacturing License $66,651 Annual Modified Business Taxes Paid by Businesses with Only One Manufacturing License Quarterly Wages Paid per Business with Only One Manufacturing License $66,651 Less: Minimum Quarterly Wages $50,000 Taxable Quarterly Wages per Business with Only One Manufacturing License $16,651 Times: Modified Business Tax Rate 1.47% Quarterly Modified Business Taxes Paid by Businesses with Only One Manufacturing License $245 Times: Quarters per Year 4 Annual Modified Business Taxes Paid by Businesses with Only One Manufacturing License $979 Number of Businesses with Only One Manufacturing License Number of Active Manufacturing Facilities 147 Times: % of Manufacturing Licenses Held by a Business with Only One Manufacturing License 8% Number of Businesses with Only One Manufacturing License 12 Total Modified Business Taxes Paid by Businesses with Only One Manufacturing License Annual Modified Business Taxes Paid by Businesses with Only One Manufacturing License $979 Times: Number of Businesses with Only One Manufacturing License 12 Times: Years in Analysis Period 7 Total Modified Business Taxes Due by Businesses with Only One Manufacturing License $80,596 Less: 50% of Commerce Taxes Paid for 6 Years in the analysis Period $0 Modified Business Taxes Paid by Businesses with Only One License that is Manufacturing $80,596
Sources: RCG, MPG, IMPLAN, Washington Liquor and Marijuana Board. Numbers may not calculate exactly due to rounding. (1) Bureau of Economic Analysis, Table SA5N: Personal Income by Major Component and Earnings by NAICS Industry.
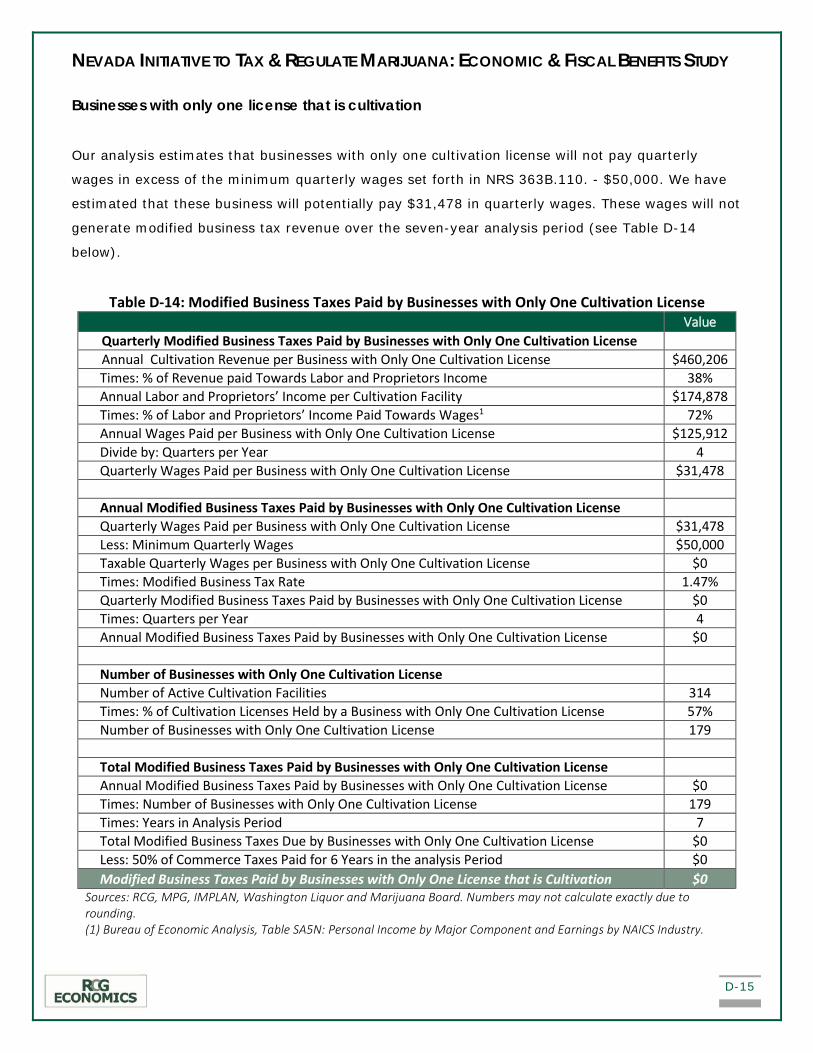
NEVADA INITIATIVE TO TAX & REGULATE MARIJUANA: ECONOMIC & FISCAL BENEFITS STUDY
D-15
Businesses with only one license that is cultivation
Our analysis estimates that businesses with only one cultivation license will not pay quarterly
wages in excess of the minimum quarterly wages set forth in NRS 363B.110. - $50,000. We have
estimated that these business will potentially pay $31,478 in quarterly wages. These wages will not
generate modified business tax revenue over the seven-year analysis period (see Table D-14
below).
Table D-14: Modified Business Taxes Paid by Businesses with Only One Cultivation License Value
Quarterly Modified Business Taxes Paid by Businesses with Only One Cultivation License Annual Cultivation Revenue per Business with Only One Cultivation License $460,206 Times: % of Revenue paid Towards Labor and Proprietors Income 38% Annual Labor and Proprietors’ Income per Cultivation Facility $174,878 Times: % of Labor and Proprietors’ Income Paid Towards Wages1 72% Annual Wages Paid per Business with Only One Cultivation License $125,912 Divide by: Quarters per Year 4 Quarterly Wages Paid per Business with Only One Cultivation License $31,478 Annual Modified Business Taxes Paid by Businesses with Only One Cultivation License Quarterly Wages Paid per Business with Only One Cultivation License $31,478 Less: Minimum Quarterly Wages $50,000 Taxable Quarterly Wages per Business with Only One Cultivation License $0 Times: Modified Business Tax Rate 1.47% Quarterly Modified Business Taxes Paid by Businesses with Only One Cultivation License $0 Times: Quarters per Year 4 Annual Modified Business Taxes Paid by Businesses with Only One Cultivation License $0 Number of Businesses with Only One Cultivation License Number of Active Cultivation Facilities 314 Times: % of Cultivation Licenses Held by a Business with Only One Cultivation License 57% Number of Businesses with Only One Cultivation License 179 Total Modified Business Taxes Paid by Businesses with Only One Cultivation License Annual Modified Business Taxes Paid by Businesses with Only One Cultivation License $0 Times: Number of Businesses with Only One Cultivation License 179 Times: Years in Analysis Period 7 Total Modified Business Taxes Due by Businesses with Only One Cultivation License $0 Less: 50% of Commerce Taxes Paid for 6 Years in the analysis Period $0 Modified Business Taxes Paid by Businesses with Only One License that is Cultivation $0
Sources: RCG, MPG, IMPLAN, Washington Liquor and Marijuana Board. Numbers may not calculate exactly due to rounding. (1) Bureau of Economic Analysis, Table SA5N: Personal Income by Major Component and Earnings by NAICS Industry.
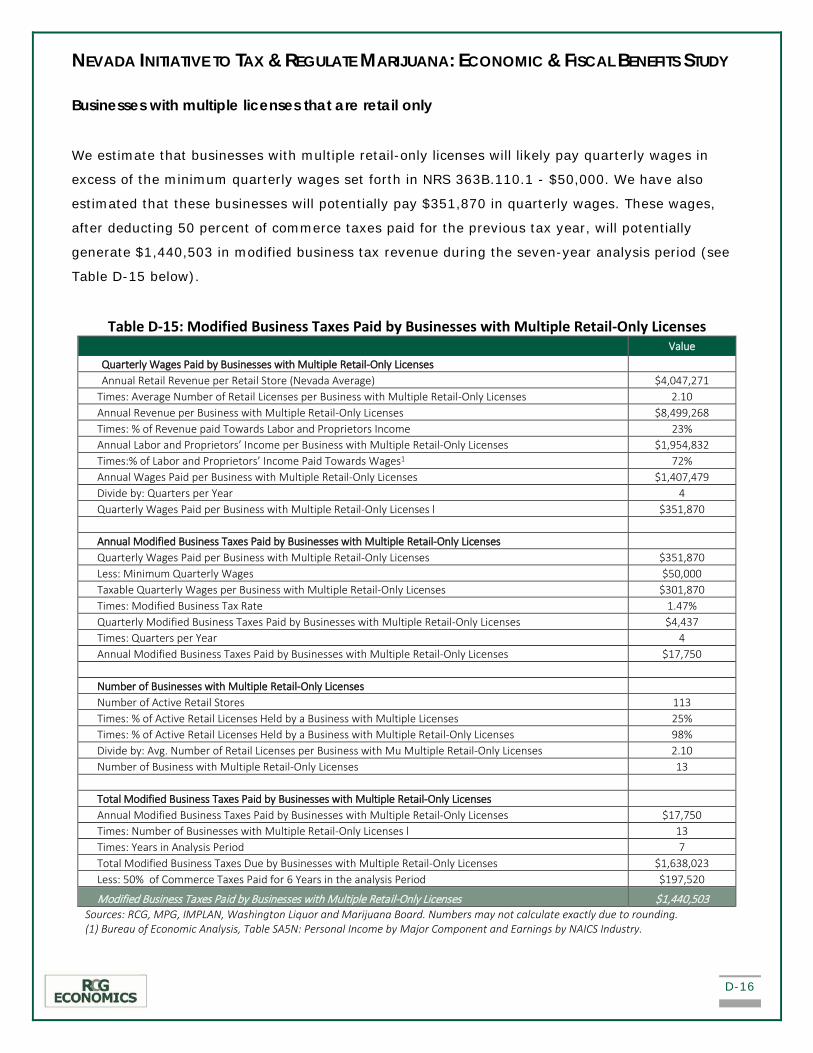
NEVADA INITIATIVE TO TAX & REGULATE MARIJUANA: ECONOMIC & FISCAL BENEFITS STUDY
D-16
Businesses with multiple licenses that are retail only
We estimate that businesses with multiple retail-only licenses will likely pay quarterly wages in
excess of the minimum quarterly wages set forth in NRS 363B.110.1 - $50,000. We have also
estimated that these businesses will potentially pay $351,870 in quarterly wages. These wages,
after deducting 50 percent of commerce taxes paid for the previous tax year, will potentially
generate $1,440,503 in modified business tax revenue during the seven-year analysis period (see
Table D-15 below).
Table D-15: Modified Business Taxes Paid by Businesses with Multiple Retail-Only Licenses Value
Quarterly Wages Paid by Businesses with Multiple Retail-Only Licenses Annual Retail Revenue per Retail Store (Nevada Average) $4,047,271
Times: Average Number of Retail Licenses per Business with Multiple Retail-Only Licenses 2.10 Annual Revenue per Business with Multiple Retail-Only Licenses $8,499,268 Times: % of Revenue paid Towards Labor and Proprietors Income 23% Annual Labor and Proprietors’ Income per Business with Multiple Retail-Only Licenses $1,954,832 Times:% of Labor and Proprietors’ Income Paid Towards Wages1 72% Annual Wages Paid per Business with Multiple Retail-Only Licenses $1,407,479 Divide by: Quarters per Year 4 Quarterly Wages Paid per Business with Multiple Retail-Only Licenses l $351,870 Annual Modified Business Taxes Paid by Businesses with Multiple Retail-Only Licenses Quarterly Wages Paid per Business with Multiple Retail-Only Licenses $351,870 Less: Minimum Quarterly Wages $50,000 Taxable Quarterly Wages per Business with Multiple Retail-Only Licenses $301,870 Times: Modified Business Tax Rate 1.47% Quarterly Modified Business Taxes Paid by Businesses with Multiple Retail-Only Licenses $4,437 Times: Quarters per Year 4 Annual Modified Business Taxes Paid by Businesses with Multiple Retail-Only Licenses $17,750 Number of Businesses with Multiple Retail-Only Licenses Number of Active Retail Stores 113 Times: % of Active Retail Licenses Held by a Business with Multiple Licenses 25% Times: % of Active Retail Licenses Held by a Business with Multiple Retail-Only Licenses 98% Divide by: Avg. Number of Retail Licenses per Business with Mu Multiple Retail-Only Licenses 2.10 Number of Business with Multiple Retail-Only Licenses 13 Total Modified Business Taxes Paid by Businesses with Multiple Retail-Only Licenses Annual Modified Business Taxes Paid by Businesses with Multiple Retail-Only Licenses $17,750 Times: Number of Businesses with Multiple Retail-Only Licenses l 13 Times: Years in Analysis Period 7 Total Modified Business Taxes Due by Businesses with Multiple Retail-Only Licenses $1,638,023 Less: 50% of Commerce Taxes Paid for 6 Years in the analysis Period $197,520
Modified Business Taxes Paid by Businesses with Multiple Retail-Only Licenses $1,440,503 Sources: RCG, MPG, IMPLAN, Washington Liquor and Marijuana Board. Numbers may not calculate exactly due to rounding. (1) Bureau of Economic Analysis, Table SA5N: Personal Income by Major Component and Earnings by NAICS Industry.
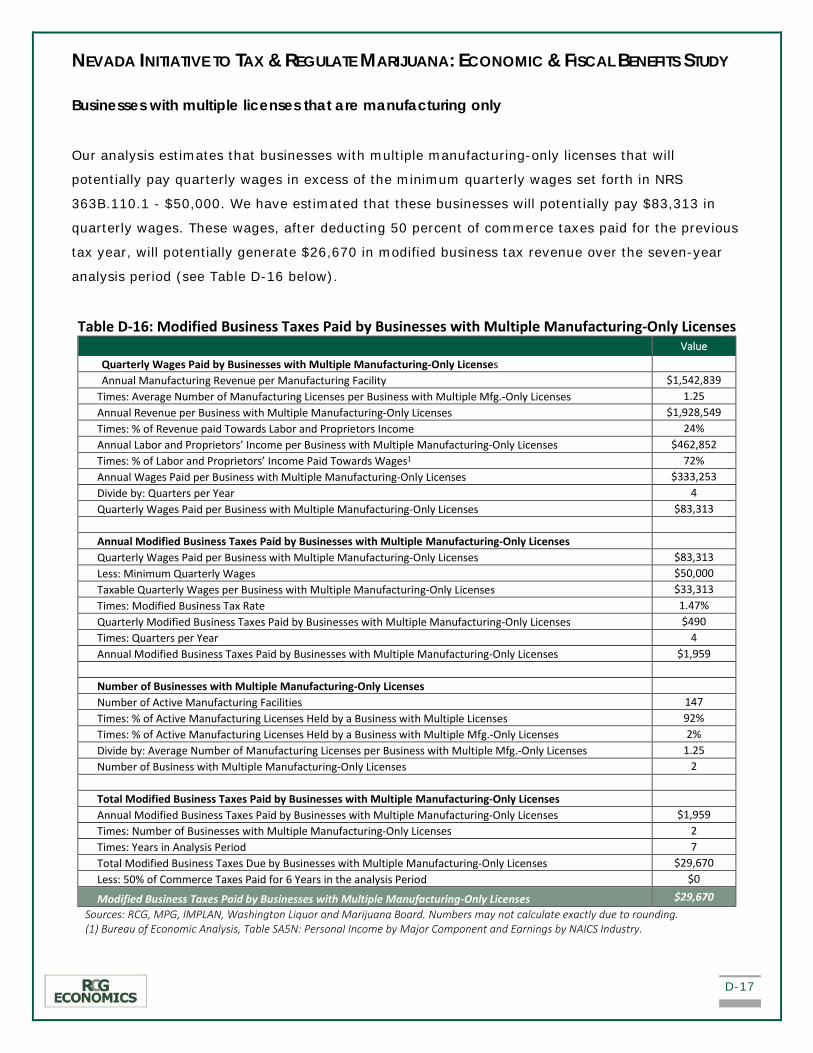
NEVADA INITIATIVE TO TAX & REGULATE MARIJUANA: ECONOMIC & FISCAL BENEFITS STUDY
D-17
Businesses with multiple licenses that are manufacturing only
Our analysis estimates that businesses with multiple manufacturing-only licenses that will
potentially pay quarterly wages in excess of the minimum quarterly wages set forth in NRS
363B.110.1 - $50,000. We have estimated that these businesses will potentially pay $83,313 in
quarterly wages. These wages, after deducting 50 percent of commerce taxes paid for the previous
tax year, will potentially generate $26,670 in modified business tax revenue over the seven-year
analysis period (see Table D-16 below).
Table D-16: Modified Business Taxes Paid by Businesses with Multiple Manufacturing-Only Licenses Value
Quarterly Wages Paid by Businesses with Multiple Manufacturing-Only Licenses Annual Manufacturing Revenue per Manufacturing Facility $1,542,839
Times: Average Number of Manufacturing Licenses per Business with Multiple Mfg.-Only Licenses 1.25 Annual Revenue per Business with Multiple Manufacturing-Only Licenses $1,928,549 Times: % of Revenue paid Towards Labor and Proprietors Income 24% Annual Labor and Proprietors’ Income per Business with Multiple Manufacturing-Only Licenses $462,852 Times: % of Labor and Proprietors’ Income Paid Towards Wages1 72% Annual Wages Paid per Business with Multiple Manufacturing-Only Licenses $333,253 Divide by: Quarters per Year 4 Quarterly Wages Paid per Business with Multiple Manufacturing-Only Licenses $83,313 Annual Modified Business Taxes Paid by Businesses with Multiple Manufacturing-Only Licenses Quarterly Wages Paid per Business with Multiple Manufacturing-Only Licenses $83,313 Less: Minimum Quarterly Wages $50,000 Taxable Quarterly Wages per Business with Multiple Manufacturing-Only Licenses $33,313 Times: Modified Business Tax Rate 1.47% Quarterly Modified Business Taxes Paid by Businesses with Multiple Manufacturing-Only Licenses $490 Times: Quarters per Year 4 Annual Modified Business Taxes Paid by Businesses with Multiple Manufacturing-Only Licenses $1,959 Number of Businesses with Multiple Manufacturing-Only Licenses Number of Active Manufacturing Facilities 147 Times: % of Active Manufacturing Licenses Held by a Business with Multiple Licenses 92% Times: % of Active Manufacturing Licenses Held by a Business with Multiple Mfg.-Only Licenses 2% Divide by: Average Number of Manufacturing Licenses per Business with Multiple Mfg.-Only Licenses 1.25 Number of Business with Multiple Manufacturing-Only Licenses 2 Total Modified Business Taxes Paid by Businesses with Multiple Manufacturing-Only Licenses Annual Modified Business Taxes Paid by Businesses with Multiple Manufacturing-Only Licenses $1,959 Times: Number of Businesses with Multiple Manufacturing-Only Licenses 2 Times: Years in Analysis Period 7 Total Modified Business Taxes Due by Businesses with Multiple Manufacturing-Only Licenses $29,670 Less: 50% of Commerce Taxes Paid for 6 Years in the analysis Period $0
Modified Business Taxes Paid by Businesses with Multiple Manufacturing-Only Licenses $29,670 Sources: RCG, MPG, IMPLAN, Washington Liquor and Marijuana Board. Numbers may not calculate exactly due to rounding. (1) Bureau of Economic Analysis, Table SA5N: Personal Income by Major Component and Earnings by NAICS Industry.
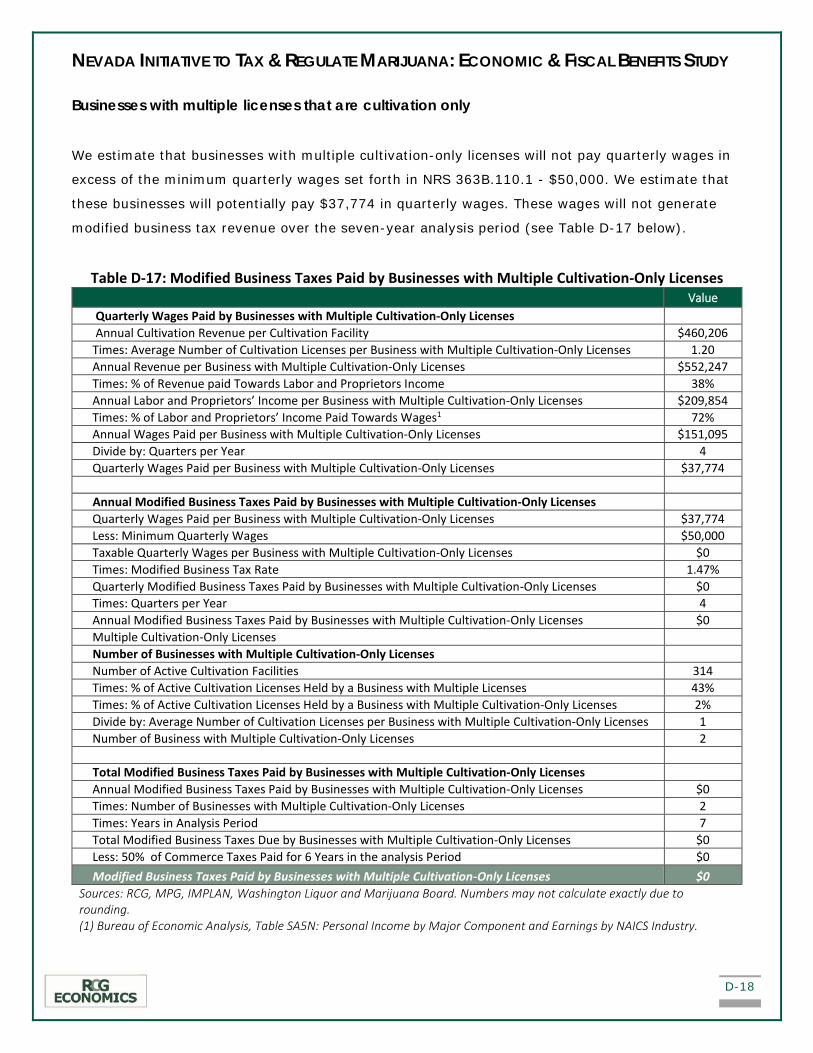
NEVADA INITIATIVE TO TAX & REGULATE MARIJUANA: ECONOMIC & FISCAL BENEFITS STUDY
D-18
Businesses with multiple licenses that are cultivation only
We estimate that businesses with multiple cultivation-only licenses will not pay quarterly wages in
excess of the minimum quarterly wages set forth in NRS 363B.110.1 - $50,000. We estimate that
these businesses will potentially pay $37,774 in quarterly wages. These wages will not generate
modified business tax revenue over the seven-year analysis period (see Table D-17 below).
Table D-17: Modified Business Taxes Paid by Businesses with Multiple Cultivation-Only Licenses Value
Quarterly Wages Paid by Businesses with Multiple Cultivation-Only Licenses Annual Cultivation Revenue per Cultivation Facility $460,206
Times: Average Number of Cultivation Licenses per Business with Multiple Cultivation-Only Licenses 1.20 Annual Revenue per Business with Multiple Cultivation-Only Licenses $552,247 Times: % of Revenue paid Towards Labor and Proprietors Income 38% Annual Labor and Proprietors’ Income per Business with Multiple Cultivation-Only Licenses $209,854 Times: % of Labor and Proprietors’ Income Paid Towards Wages1 72% Annual Wages Paid per Business with Multiple Cultivation-Only Licenses $151,095 Divide by: Quarters per Year 4 Quarterly Wages Paid per Business with Multiple Cultivation-Only Licenses $37,774 Annual Modified Business Taxes Paid by Businesses with Multiple Cultivation-Only Licenses Quarterly Wages Paid per Business with Multiple Cultivation-Only Licenses $37,774 Less: Minimum Quarterly Wages $50,000 Taxable Quarterly Wages per Business with Multiple Cultivation-Only Licenses $0 Times: Modified Business Tax Rate 1.47% Quarterly Modified Business Taxes Paid by Businesses with Multiple Cultivation-Only Licenses $0 Times: Quarters per Year 4 Annual Modified Business Taxes Paid by Businesses with Multiple Cultivation-Only Licenses $0 Multiple Cultivation-Only Licenses Number of Businesses with Multiple Cultivation-Only Licenses Number of Active Cultivation Facilities 314 Times: % of Active Cultivation Licenses Held by a Business with Multiple Licenses 43% Times: % of Active Cultivation Licenses Held by a Business with Multiple Cultivation-Only Licenses 2% Divide by: Average Number of Cultivation Licenses per Business with Multiple Cultivation-Only Licenses 1 Number of Business with Multiple Cultivation-Only Licenses 2 Total Modified Business Taxes Paid by Businesses with Multiple Cultivation-Only Licenses Annual Modified Business Taxes Paid by Businesses with Multiple Cultivation-Only Licenses $0 Times: Number of Businesses with Multiple Cultivation-Only Licenses 2 Times: Years in Analysis Period 7 Total Modified Business Taxes Due by Businesses with Multiple Cultivation-Only Licenses $0 Less: 50% of Commerce Taxes Paid for 6 Years in the analysis Period $0 Modified Business Taxes Paid by Businesses with Multiple Cultivation-Only Licenses $0
Sources: RCG, MPG, IMPLAN, Washington Liquor and Marijuana Board. Numbers may not calculate exactly due to rounding. (1) Bureau of Economic Analysis, Table SA5N: Personal Income by Major Component and Earnings by NAICS Industry.
NEVADA INITIATIVE TO TAX & REGULATE MARIJUANA: ECONOMIC & FISCAL BENEFITS STUDY
D-19
Businesses with retail and cultivation licenses
Businesses with retail and cultivation licenses will potentially pay quarterly wages in excess of the
minimum quarterly wages set forth in NRS 363B.110.1 - $50,000. We have estimated that these
businesses will potentially pay $199,035 in quarterly wages. These wages, after deducting 50
percent of commerce taxes paid for the previous tax year, will potentially generate $33,704 in
modified business tax revenue over the seven-year analysis period (see Table D-18).
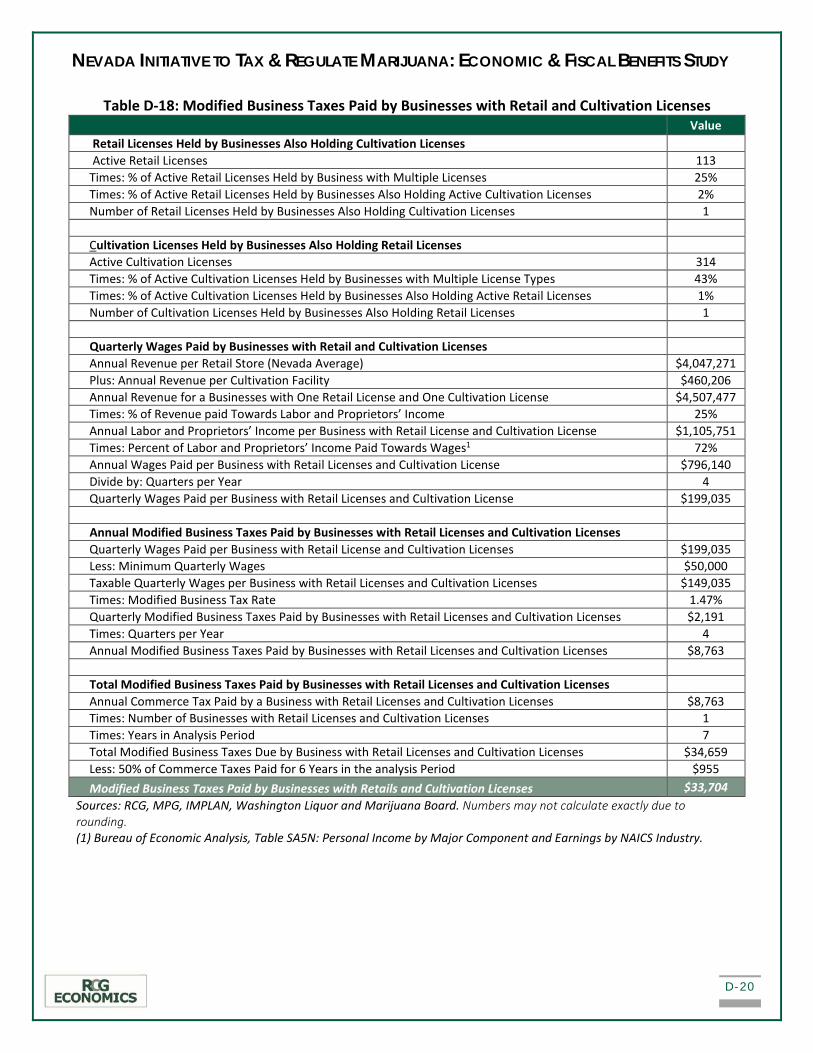
NEVADA INITIATIVE TO TAX & REGULATE MARIJUANA: ECONOMIC & FISCAL BENEFITS STUDY
D-20
Table D-18: Modified Business Taxes Paid by Businesses with Retail and Cultivation Licenses Value
Retail Licenses Held by Businesses Also Holding Cultivation Licenses Active Retail Licenses 113
Times: % of Active Retail Licenses Held by Business with Multiple Licenses 25% Times: % of Active Retail Licenses Held by Businesses Also Holding Active Cultivation Licenses 2% Number of Retail Licenses Held by Businesses Also Holding Cultivation Licenses 1 Cultivation Licenses Held by Businesses Also Holding Retail Licenses Active Cultivation Licenses 314 Times: % of Active Cultivation Licenses Held by Businesses with Multiple License Types 43% Times: % of Active Cultivation Licenses Held by Businesses Also Holding Active Retail Licenses 1% Number of Cultivation Licenses Held by Businesses Also Holding Retail Licenses 1 Quarterly Wages Paid by Businesses with Retail and Cultivation Licenses Annual Revenue per Retail Store (Nevada Average) $4,047,271 Plus: Annual Revenue per Cultivation Facility $460,206 Annual Revenue for a Businesses with One Retail License and One Cultivation License $4,507,477 Times: % of Revenue paid Towards Labor and Proprietors’ Income 25% Annual Labor and Proprietors’ Income per Business with Retail License and Cultivation License $1,105,751 Times: Percent of Labor and Proprietors’ Income Paid Towards Wages1 72% Annual Wages Paid per Business with Retail Licenses and Cultivation License $796,140 Divide by: Quarters per Year 4 Quarterly Wages Paid per Business with Retail Licenses and Cultivation License $199,035 Annual Modified Business Taxes Paid by Businesses with Retail Licenses and Cultivation Licenses Quarterly Wages Paid per Business with Retail License and Cultivation Licenses $199,035 Less: Minimum Quarterly Wages $50,000 Taxable Quarterly Wages per Business with Retail Licenses and Cultivation Licenses $149,035 Times: Modified Business Tax Rate 1.47% Quarterly Modified Business Taxes Paid by Businesses with Retail Licenses and Cultivation Licenses $2,191 Times: Quarters per Year 4 Annual Modified Business Taxes Paid by Businesses with Retail Licenses and Cultivation Licenses $8,763 Total Modified Business Taxes Paid by Businesses with Retail Licenses and Cultivation Licenses Annual Commerce Tax Paid by a Business with Retail Licenses and Cultivation Licenses $8,763 Times: Number of Businesses with Retail Licenses and Cultivation Licenses 1 Times: Years in Analysis Period 7 Total Modified Business Taxes Due by Business with Retail Licenses and Cultivation Licenses $34,659 Less: 50% of Commerce Taxes Paid for 6 Years in the analysis Period $955 Modified Business Taxes Paid by Businesses with Retails and Cultivation Licenses $33,704
Sources: RCG, MPG, IMPLAN, Washington Liquor and Marijuana Board. Numbers may not calculate exactly due to rounding. (1) Bureau of Economic Analysis, Table SA5N: Personal Income by Major Component and Earnings by NAICS Industry.
NEVADA INITIATIVE TO TAX & REGULATE MARIJUANA: ECONOMIC & FISCAL BENEFITS STUDY
D-21
Businesses with cultivation and manufacturing licenses
Businesses with cultivation and manufacturing licenses will likely pay quarterly wages in excess of
the minimum quarterly wages set forth in NRS 363B.110.1 - $50,000. These business will
potentially pay $98,129 in quarterly wages. Wages, after deducting 50 percent of commerce taxes
paid for the previous tax year, will potentially generate $2,594,476 in modified business tax
revenue during the seven-year analysis period (see Table D-19 below).
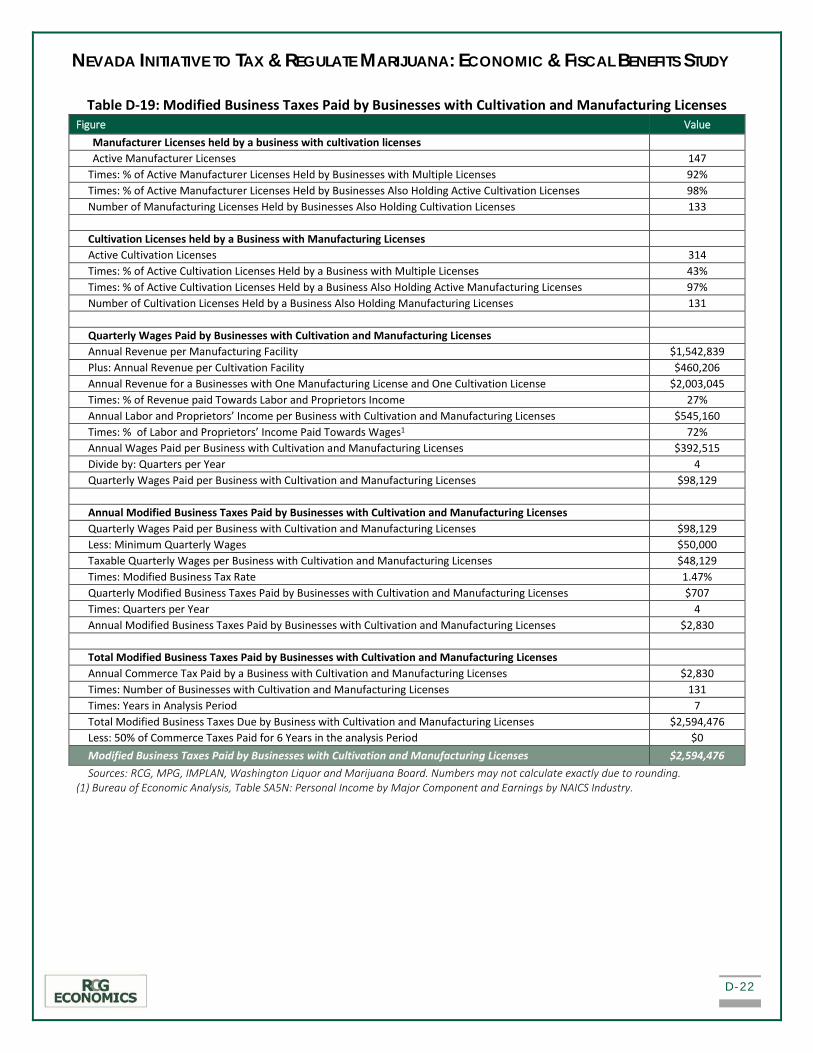
NEVADA INITIATIVE TO TAX & REGULATE MARIJUANA: ECONOMIC & FISCAL BENEFITS STUDY
D-22
Table D-19: Modified Business Taxes Paid by Businesses with Cultivation and Manufacturing Licenses Figure Value
Manufacturer Licenses held by a business with cultivation licenses Active Manufacturer Licenses 147
Times: % of Active Manufacturer Licenses Held by Businesses with Multiple Licenses 92% Times: % of Active Manufacturer Licenses Held by Businesses Also Holding Active Cultivation Licenses 98% Number of Manufacturing Licenses Held by Businesses Also Holding Cultivation Licenses 133 Cultivation Licenses held by a Business with Manufacturing Licenses Active Cultivation Licenses 314 Times: % of Active Cultivation Licenses Held by a Business with Multiple Licenses 43% Times: % of Active Cultivation Licenses Held by a Business Also Holding Active Manufacturing Licenses 97% Number of Cultivation Licenses Held by a Business Also Holding Manufacturing Licenses 131 Quarterly Wages Paid by Businesses with Cultivation and Manufacturing Licenses Annual Revenue per Manufacturing Facility $1,542,839 Plus: Annual Revenue per Cultivation Facility $460,206 Annual Revenue for a Businesses with One Manufacturing License and One Cultivation License $2,003,045 Times: % of Revenue paid Towards Labor and Proprietors Income 27% Annual Labor and Proprietors’ Income per Business with Cultivation and Manufacturing Licenses $545,160 Times: % of Labor and Proprietors’ Income Paid Towards Wages1 72% Annual Wages Paid per Business with Cultivation and Manufacturing Licenses $392,515 Divide by: Quarters per Year 4 Quarterly Wages Paid per Business with Cultivation and Manufacturing Licenses $98,129 Annual Modified Business Taxes Paid by Businesses with Cultivation and Manufacturing Licenses Quarterly Wages Paid per Business with Cultivation and Manufacturing Licenses $98,129 Less: Minimum Quarterly Wages $50,000 Taxable Quarterly Wages per Business with Cultivation and Manufacturing Licenses $48,129 Times: Modified Business Tax Rate 1.47% Quarterly Modified Business Taxes Paid by Businesses with Cultivation and Manufacturing Licenses $707 Times: Quarters per Year 4 Annual Modified Business Taxes Paid by Businesses with Cultivation and Manufacturing Licenses $2,830 Total Modified Business Taxes Paid by Businesses with Cultivation and Manufacturing Licenses Annual Commerce Tax Paid by a Business with Cultivation and Manufacturing Licenses $2,830 Times: Number of Businesses with Cultivation and Manufacturing Licenses 131 Times: Years in Analysis Period 7 Total Modified Business Taxes Due by Business with Cultivation and Manufacturing Licenses $2,594,476 Less: 50% of Commerce Taxes Paid for 6 Years in the analysis Period $0 Modified Business Taxes Paid by Businesses with Cultivation and Manufacturing Licenses $2,594,476 Sources: RCG, MPG, IMPLAN, Washington Liquor and Marijuana Board. Numbers may not calculate exactly due to rounding.
(1) Bureau of Economic Analysis, Table SA5N: Personal Income by Major Component and Earnings by NAICS Industry.

NEVADA INITIATIVE TO TAX & REGULATE MARIJUANA: ECONOMIC & FISCAL BENEFITS STUDY
D-23
Finally, our analysis has shown that total modified business tax revenue for the expected types of
marijuana businesses will potentially total $8,279,702 over the seven-year analysis period (see
Table D-20 below).
Table D-20: Total Nevada Modified Business Tax Revenue Business Types Value
Total Modified Business Taxes Due by Businesses with Only One License that is Retail $4,100,753 Modified Business Taxes Paid by Businesses with Only One License that is Manufacturing $80,596
Modified Business Taxes Paid by Businesses with Only One License that is Cultivation $0 Modified Business Taxes Paid by Businesses with Multiple Licenses that are Only Retail $1,440,503 Modified Business Taxes Paid by Businesses with Multiple Licenses that are Only Manufacturing $29,670 Modified Business Taxes Paid by Businesses with Multiple Licenses that are Only Cultivation $0 Modified Business Taxes Paid by Businesses with Retails and Cultivation Licenses $33,704 Modified Business Taxes Paid by Businesses with Cultivation and Manufacturing Licenses $2,594,476 Total Nevada Modified Business Taxes Paid – 7 Years $8,279,702 Sources: RCG, MPG, IMPLAN, Washington Liquor and Marijuana Board.
###