Embed Size (px)
Citation preview


Financial Analysis for HR Managers
Director_Book 1.indb i 11/27/12 4:01 PM

This page intentionally left blank

Financial Analysis for HR Managers
Tools for Linking HR Strategy to Business Strategy
Steven Director
Director_Book 1.indb iii 11/27/12 4:01 PM

Vice President, Publisher: Tim Moore Associate Publisher and Director of Marketing: Amy Neidlinger Executive Editor: Jeanne Glasser Levine Editorial Assistant: Pamela Boland Operations Specialist: Jodi Kemper Marketing Manager: Megan Graue Cover Designer: Alan Clements Managing Editor: Kristy Hart Project Editor: Betsy Harris Copy Editor: Apostrophe Editing Services Proofreader: Language Logistics, LLC Indexer: Lisa Stumpf Compositor: Nonie Ratcliff Manufacturing Buyer: Dan Uhrig
© 2013 by Steven Director Published by Pearson Education, Inc. Publishing as FT Press Upper Saddle River, New Jersey 07458
FT Press offers excellent discounts on this book when ordered in quantity for bulk purchases or special sales. For more information, please contact U.S. Corporate and Government Sales, 1-800-382-3419, [email protected] . For sales outside the U.S., please contact International Sales at [email protected] .
Company and product names mentioned herein are the trademarks or registered trademarks of their respective owners.
All rights reserved. No part of this book may be reproduced, in any form or by any means, without permission in writing from the publisher.
Printed in the United States of America
First Printing December 2012
ISBN-10: 0-13-299674-X ISBN-13: 978-0-13-299674-7
Pearson Education LTD. Pearson Education Australia PTY, Limited. Pearson Education Singapore, Pte. Ltd. Pearson Education Asia, Ltd. Pearson Education Canada, Ltd. Pearson Educación de Mexico, S.A. de C.V. Pearson Education—Japan Pearson Education Malaysia, Pte. Ltd.
Library of Congress Cataloging-in-Publication Data Director, Steven M. Financial analysis for HR managers : tools for linking HR strategy to business stategy / Steven Director. p. cm. ISBN 978-0-13-299674-7 (hardcover : alk. paper) 1. Personnel management. 2. Strategic planning. 3. Business enterprises--Finance. 4. Human capital. I.Title. HF5549.D5266 2013 658.15024’6583--dc23 2012041385
Director_Book 1.indb iv 11/27/12 4:01 PM

To Elissa, Syril, Rustin, Mara, Torin, Judah, and Hazel.
Director_Book 1.indb v 11/27/12 4:01 PM

This page intentionally left blank

Contents
Chapter 1 Business Strategy, Financial Strategy, and HR Strategy. . . . . . . . . . . . . . . . . . . . . . . . . . . . . . . . . . 1
Is HR Weakest in the Most Critical Areas?. . . . . . . . . . . . . . 2You Don’t Need to Be a Quant to Make Good Business Decisions . . . . . . . . . . . . . . . . . . . . . 4Which HR Decisions Are Important? . . . . . . . . . . . . . . . . . . 5What This Book Attempts to Do . . . . . . . . . . . . . . . . . . . . . . 6
Chapter 2 The Income Statement: Do We Care About More Than the Bottom Line? . . . . . . . . . . . . . . . . . . . . . . . 9
Income Statements . . . . . . . . . . . . . . . . . . . . . . . . . . . . . . . . 10Profit Can Be Measured at Various Levels . . . . . . . . . . . . . 17Seeing the Big Picture . . . . . . . . . . . . . . . . . . . . . . . . . . . . . 20The Bottom Line . . . . . . . . . . . . . . . . . . . . . . . . . . . . . . . . . 22
Chapter 3 The Balance Sheet: If Your People Are Your Most Important Asset, Where Do They Show Up onthe Balance Sheet? . . . . . . . . . . . . . . . . . . . . . . . . . . . . . . . 23
Assets on the Balance Sheet . . . . . . . . . . . . . . . . . . . . . . . . . 24Liabilities on the Balance Sheet. . . . . . . . . . . . . . . . . . . . . . 30Which Numbers on a Balance Sheet Can You Believe? . . . . . . . . . . . . . . . . . . . . . . . . . . . . . . . . . 34Use Caution When Using Published Financial Ratios . . . . 37
Chapter 4 Cash Flows: Timing Is Everything . . . . . . . . . . . . . . . . . . 43
Cash Flow Information from the Income Statement . . . . . 45Cash Flow Information from the Balance Sheet. . . . . . . . . 45
Chapter 5 Financial Statements as a Window into Business Strategy . . . . . . . . . . . . . . . . . . . . . . . . . . . . 49
Common Size Financial Statements . . . . . . . . . . . . . . . . . . 50Connecting the Dots. . . . . . . . . . . . . . . . . . . . . . . . . . . . . . . 52Return on Equity . . . . . . . . . . . . . . . . . . . . . . . . . . . . . . . . . 53Differential Impact of Financial Leverage . . . . . . . . . . . . . 54The Big Picture . . . . . . . . . . . . . . . . . . . . . . . . . . . . . . . . . . . 55The Link Between HR Strategy and Business Strategy . . . 56
Director_Book 1.indb vii 11/27/12 4:01 PM

viii FINANCIAL ANALYSIS FOR HR MANAGERS
Chapter 6 Stocks, Bonds, and the Weighted Average Cost of Capital . . . . . . . . . . . . . . . . . . . . . . . . . . . 59
Why Is the Cost of Capital Important to HR Managers? . . . . . . . . . . . . . . . . . . . . . . . . . . . . . . . . . 59Where Does the Money Come From? . . . . . . . . . . . . . . . . 60Is Your Company of Above Average or Below Average Risk? . . . . . . . . . . . . . . . . . . . . . . . . . . . . 63Capital Costs in 2012 . . . . . . . . . . . . . . . . . . . . . . . . . . . . . . 65
Chapter 7 Capital Budgeting and Discounted Cash Flow Analysis . . . . . . . . . . . . . . . . . . . . . . . . . . . . . . . . . . . 71
Calculating Present Values . . . . . . . . . . . . . . . . . . . . . . . . . . 71Do the Future Benefits Justify the Upfront Costs? . . . . . . 75Using DCF on the Job . . . . . . . . . . . . . . . . . . . . . . . . . . . . . 77HR Applications . . . . . . . . . . . . . . . . . . . . . . . . . . . . . . . . . . 77Money Has Time Value Because of Interest Rates, Not Because of Inflation. . . . . . . . . . . . . . . . . . . . . . . . . . . . 86
Chapter 8 Financial Analysis of Human Resource Initiatives . . . . . . 97
Decisions Involving Cash Flow That Occur at Different Points in Time . . . . . . . . . . . . . . . 98Allocating Budgets When There Are a Larger Number of Alternatives . . . . . . . . . . . . . . . . 104Calculating NPV of Specific HR Initiatives. . . . . . . . . . . . 107Determining Program Impacts Using Pre-Post Changes . . . . . . . . . . . . . . . . . . . . . . . . . . . . . . . . 111Determining Program Impacts Using Comparison Groups . . . . . . . . . . . . . . . . . . . . . . . . . . . . . . 111What Is Your Firm’s HR Budget? . . . . . . . . . . . . . . . . . . . 122Is Your HR Budget Allocation Optimal? . . . . . . . . . . . . . . 124Maximizing the ROI on Your Analysis Efforts . . . . . . . . . . . . . . . . . . . . . . . . . . . . . . . . . . 125
Chapter 9 Financial Analysis of a Corporation’s Strategic Initiatives . . . . . . . . . . . . . . . . . . . . . . . . . . . . . 127
Estimating the NPV of a Strategic Initiative Such as a New Product Introduction . . . . . . . . . . . . . . . . . 128Using the Spreadsheet to Structure the Deal. . . . . . . . . . . . . . . . . . . . . . . . . . . . . . . . . . . . . . . . 139Using Monte Carlo Simulations to Model Risk and Uncertainty . . . . . . . . . . . . . . . . . . . . . . . . . . . . . 141
Director_Book 1.indb viii 11/27/12 4:01 PM
CONTENTS ix
Chapter 10 Equity-Based Compensation: Stock and Stock Options . . . . . . . . . . . . . . . . . . . . . . . . . . . . . . . . . . 153
How Do Stock Options Work?. . . . . . . . . . . . . . . . . . . . . . 154What Is the Intrinsic Value of an Option? What’s the Time Value of an Option? . . . . . . . . . . . . . . . . 154Are Options High-Risk Investments? . . . . . . . . . . . . . . . . 157Do Employees Prefer Options or Stock?. . . . . . . . . . . . . . 160Understanding the Inputs to the Black-Scholes Model . . 168Firms Must Disclose the Methods and the Assumptions They Use to Cost Stock Options . . . . . . . . . 172Using Monte Carlo Simulation to Determine the Value of Employee Stock Options . . . . . . . . . . . . . . . . 180Dilution, Overhang, and Run Rates. . . . . . . . . . . . . . . . . . 181Equity Compensation Is One Tool for Aligning Executive and Shareholder Interests . . . . . . . . . 183
Chapter 11 Financial Aspects of Pension and Retirement Programs. . . . . . . . . . . . . . . . . . . . . . . . . . . . . . . . . . . . . . 185
Defined Benefit (DB) Plans. . . . . . . . . . . . . . . . . . . . . . . . 186Defined Contribution (DC) Plans . . . . . . . . . . . . . . . . . . . 186Hybrid Plans . . . . . . . . . . . . . . . . . . . . . . . . . . . . . . . . . . . . 186The Shift from DB Plans to DC Plans. . . . . . . . . . . . . . . . 187Pension Accounting . . . . . . . . . . . . . . . . . . . . . . . . . . . . . . 189Why Base Costs on the Expected Rather Than the Actual Return on Plan Assets? . . . . . . . . . . . . . . 198How Do Firms Select the Appropriate Discount Rate? . . 203DB Plans Encourage Retirement. . . . . . . . . . . . . . . . . . . . 213The Future? . . . . . . . . . . . . . . . . . . . . . . . . . . . . . . . . . . . . 213
Chapter 12 Creating Value and Rewarding Value Creation . . . . . . . 217
Aligning Pay with Performance . . . . . . . . . . . . . . . . . . . . . 217Managing EPS Expectations . . . . . . . . . . . . . . . . . . . . . . . 234Putting It All Together . . . . . . . . . . . . . . . . . . . . . . . . . . . . 240Appendix A: A Sample of Financial Measures Currently in Use . . . . . . . . . . . . . . . . . . . . . . . . . . . . . . . . . 246
Bibliography . . . . . . . . . . . . . . . . . . . . . . . . . . . . . . . . . . . 249
Endnotes . . . . . . . . . . . . . . . . . . . . . . . . . . . . . . . . . . . . . 257
Index . . . . . . . . . . . . . . . . . . . . . . . . . . . . . . . . . . . . . . . . . 263
Director_Book 1.indb ix 11/27/12 4:01 PM
Acknowledgments
I would like to express my gratitude to my colleagues and my students at Rutgers. Over the years, they have taught me far more than I ever learned in graduate school. Particularly valuable were the insights I gained from the experienced and very bright professionals who participated in the Rutgers Executive Masters in HR Leader-ship program and in the executive education programs offered by the Rutgers Center for Management Development. Among many other things, these individuals taught me the importance of communicating core concepts with a minimum of academic jargon and mathematical notation. To the extent that I failed to do that in this book, the fault is my own. My students also often asked me to recommend a book on corporate finance that would be appropriate for HR managers. The difficulty I had in identifying books that would provide what they were looking for prompted me to begin thinking about doing this volume. It was my colleague and friend Dr. Paula Caligiuri who encouraged me to move beyond just thinking about it and actually submit a book proposal to FT Press. I am therefore particularly grateful to Paula for making this book happen.
The ideas expressed in this volume are largely a synthesis of the writings and contributions others have made to the finance and human resource strategy literatures. My dependence on their work cannot be overstated. Unfortunately, the list is far too large to acknowledge them all. I have, however, tried to cite many of these individuals in the following chapters. Finally, I would like to express my greatest gratitude to my parents. Though neither had a degree in finance, or anything else, their exceptional level of business acumen (and hard work) provided our family with the resources that enabled my siblings and me to attend college and graduate school.
Director_Book 1.indb x 11/27/12 4:01 PM

About the Author
Steven Director is a professor in the Rutgers University School of Management and Labor Relations. He has held a number of lead-ership positions at Rutgers, including serving as Associate Dean, as Chair of the Human Resource Management Department, and as Director of the PhD program in Industrial Relations and Human Resources. Prior to joining Rutgers he was an Employment Policy Fellow at the Brookings Institution and on the faculty of Michigan State University. He received his Ph.D. and MBA degrees from the Northwestern University Kellogg School of Management.
Dr. Director teaches courses in Labor Economics, Statistics, and Finance. His most frequent and preferred teaching assignment is a course in Financial Analysis for Human Resource Managers. In addi-tion to his on-campus teaching, Dr. Director has taught Finance for HR to senior executives in the U.S., Europe, and Asia. Recognized for his ability to effectively communicate financial concepts to non-finan-cial audiences, Dr. Director has also developed and delivered cus-tomized finance training for scientists, engineers, and physicians. His publications have appeared in numerous journals and edited volumes.
His research interests include the financial aspects of HR, com-pensation and benefits policy, and the interaction between national and corporate employment policy. In January, 2003 he developed and partnered with the Society of Human Resource Management to produce the monthly Leading Indicator of National Employment (LINE) Report. Dr. Director continues to serve as economic advisor to this project and SHRM has now published over 100 consecutive monthly LINE reports. This data series is followed closely by finan-cial analysts and business economists.
Director_Book 1.indb xi 11/27/12 4:01 PM

This page intentionally left blank

1
1 Business Strategy, Financial Strategy,
and HR Strategy
What makes one company more successful than another? Is it because it has nicer office buildings, newer research labs, or better manufacturing equipment? If it is the differences in people that cre-ate differences in corporate value, then the HR function (though not necessarily the HR department) is critical to a corporation’s success. Clearly line managers have an important role in hiring, developing, and motivating the people that can make an organization successful. Perhaps surprisingly it is the role of human resource managers in this process that is less clear. Should human resource managers have pri-marily an administrative role focusing on the processing of transac-tions and compliance with regulations? Should human resource managers be business partners charged with developing and main-taining a workforce with the specific capabilities required to execute their firm’s business strategy? Or should human resource managers be true strategic partners participating along with top management, and their counterparts from other functional areas, in the actual development and monitoring of a firm’s business strategy? In many organizations HR departments play only one or two of these three roles. It is a premise of this book that many firms fail to achieve their maximum success because they do not utilize their HR departments optimally. It must be acknowledged, however, that line managers may be underutilizing their HR departments because they are not confi-dent that HR can perform at higher levels.
Director_Book 1.indb 1 11/27/12 4:01 PM

2 FINANCIAL ANALYSIS FOR HR MANAGERS
Is HR Weakest in the Most Critical Areas? A study conducted by the Corporate Leadership Council (CLC) 1
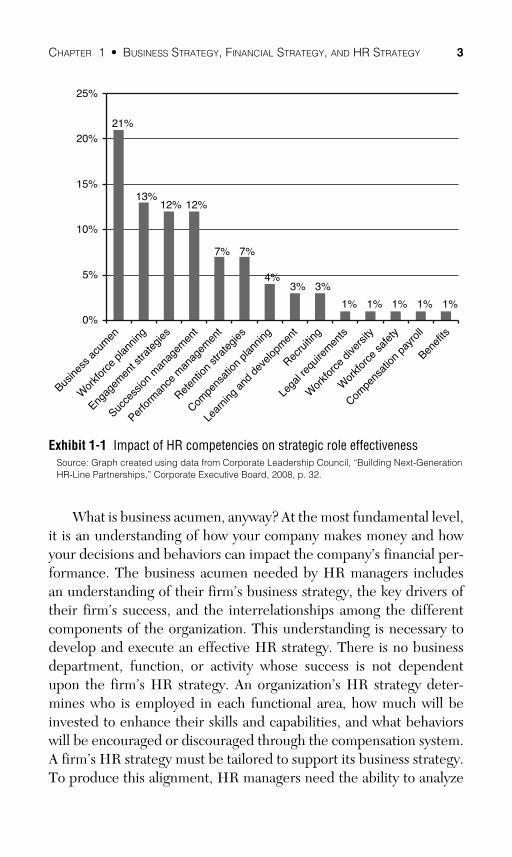
found that in the opinion of the 16,000 line managers who were sur-veyed, fewer than one in five HR business partners were highly effec-tive in their strategy roles. That’s a statement that the HR profession should find troubling. The good news is that there’s lots of room for improvement, and we know how to generate those improvements. The CLC study also estimated the relationship between HR staff compe-tencies and degree of success as a strategic partner. Their findings are summarized in Exhibit 1-1 . Each vertical bar represents an estimate of the maximum impact on strategic role effectiveness of a particular HR capability. The maximum impact was calculated by comparing the strategic role performance of individuals rated high and individu-als rated low on each capability. Of far greater importance than exper-tise in any HR specialization was overall business acumen. What are the implications of that statement for the way you select and train HR professionals? Does it mean you don’t need individuals with spe-cialized training or experience in HR? No, but it suggests that while specialized HR skills are necessary, they are not sufficient.
HR professionals need both HR knowledge and a high degree of business acumen. Most individuals in the field today have strong HR skills. There is, however, a wide range in the level of business acu-men they possess. That creates substantial competitive advantages for corporations whose HR staffs possess both sets of skills. For individu-als who have both sets of skills, it also creates great opportunities for them to advance within their HR careers. The specific mix of skills required depends, of course, on the individual’s job duties and posi-tion in the corporate hierarchy. In general, the higher the individual is (or hopes to be) in the corporate hierarchy, the greater the need for strong business acumen to complement their HR knowledge.
Director_Book 1.indb 2 11/27/12 4:01 PM
CHAPTER 1 • BUSINESS STRATEGY, FINANCIAL STRATEGY, AND HR STRATEGY 3
What is business acumen, anyway? At the most fundamental level, it is an understanding of how your company makes money and how your decisions and behaviors can impact the company’s financial per-formance. The business acumen needed by HR managers includes an understanding of their firm’s business strategy, the key drivers of their firm’s success, and the interrelationships among the different components of the organization. This understanding is necessary to develop and execute an effective HR strategy. There is no business department, function, or activity whose success is not dependent upon the firm’s HR strategy. An organization’s HR strategy deter-mines who is employed in each functional area, how much will be invested to enhance their skills and capabilities, and what behaviors will be encouraged or discouraged through the compensation system. A firm’s HR strategy must be tailored to support its business strategy. To produce this alignment, HR managers need the ability to analyze
21%
13%12% 12%
7% 7%
4%3% 3%
1% 1% 1% 1% 1%
0%
5%
10%
15%
20%
25%
Busine
ss a
cum
en
Wor
kforc
e pla
nning
Engag
emen
t stra
tegie
s
Succe
ssion
man
agem
ent
Perfo
rman
ce m
anag
emen
t
Reten
tion
strat
egies
Compe
nsat
ion p
lannin
g
Lear
ning
and
deve
lopm
ent
Recru
iting
Lega
l req
uirem
ents
Wor
kforc
e div
ersit
y
Wor
kforc
e sa
fety
Compe
nsat
ion p
ayro
ll
Benef
its
Exhibit 1-1 Impact of HR competencies on strategic role effectiveness Source: Graph created using data from Corporate Leadership Council, “Building Next-Generation HR-Line Partnerships,” Corporate Executive Board, 2008, p. 32.
Director_Book 1.indb 3 11/27/12 4:01 PM

4 FINANCIAL ANALYSIS FOR HR MANAGERS
which choices will add value to the firm and which will weaken it. Do most individuals in the HR profession have that ability? In a survey conducted by Mercer Consulting, 2 HR leaders were asked to assess the skills of their staffs. They rated their staffs weakest on the follow-ing skill sets:
• Financial skills • Business strategy skills • Organizational assessment • Cross-functional expertise • Cost analysis and management
They felt their staffs were strongest at the following:
• Interpersonal skills • Recordkeeping/data maintenance • Team skills • Functional HR expertise • Customer service
The skill sets where these HR staffs were strong are important, but they are not the skill sets that drive corporate success or the career success of individual HR managers. No company is going to become an industry leader because of the interpersonal skills or recordkeep-ing abilities of its HR staff. It is rather striking that the areas in which these HR staffs were weakest are exactly the skill sets that are most likely to contribute to a corporation’s success, and exactly the skills that individual HR managers need to progress in their careers.
You Don’t Need to Be a Quant to Make Good Business Decisions
In most cases HR managers need only a modest level of quan-titative skills. There is certainly no need to be the kind of individual the Wall Street firms refer to as a quant . Analyzing business deci-sions generally requires no more than a tolerance for basic arithmetic
Director_Book 1.indb 4 11/27/12 4:01 PM

CHAPTER 1 • BUSINESS STRATEGY, FINANCIAL STRATEGY, AND HR STRATEGY 5
and a comfort with the creation and use of spreadsheets. Actually, in many cases more important than the ability to crunch the numbers is the ability to think analytically and creatively about the business chal-lenges a firm faces. Some HR managers are limited in their ability to do this simply because they do not understand all the jargon used in their company’s financial statements or in the models their firm uses to evaluate business alternatives. Without that understanding it’s impossible to know, for example, whether a proposal made by a col-league is brilliant or nonsense.
Fortunately, gaining an understanding of basic financial jargon and concepts is not difficult to do. You don’t need a degree in finance to use financial tools to make better decisions. The goal of this book is to help HR professionals deepen their understanding of business eco-nomics and finance. Hopefully an increased understanding of these issues can enable them to make better decisions about resource allo-cations within the HR function. The bigger potential benefit, how-ever, is that an increased understanding of these issues can enable them to more effectively tailor an HR strategy to the firm’s business strategy. If this can be done they can significantly improve their firm’s competitiveness and add value to the firm’s shareholders. At the same time they can enhance their own prospects for career advancement. Too many HR professionals underestimate the role HR can and should play in strategic decisions. They should not be deterred simply because these decisions involve financial models or analyses.
Which HR Decisions Are Important? In many organizations, human resource costs (recruitment, selec-
tion, compensation, training, and workforce administration) are the largest component of the firm’s operating expenses. In some service organizations these items constitute 70% to 80% of the firm’s total costs. Properly managing those costs is therefore critical to the success of any corporation. Other things equal, a 10% reduction in a firm’s HR costs can produce a huge increase in its bottom line profit. Still, of greater importance than managing workforce costs is creating work-force value. Firms do not become industry leaders because they have
Director_Book 1.indb 5 11/27/12 4:01 PM
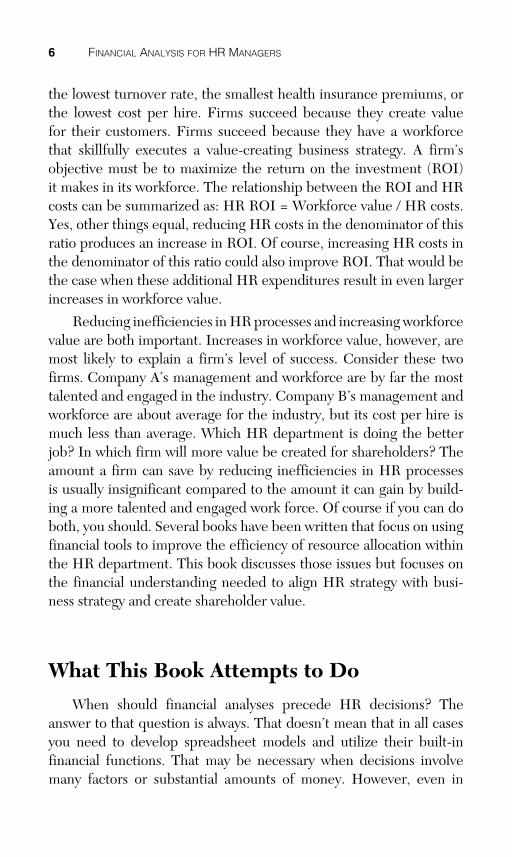
6 FINANCIAL ANALYSIS FOR HR MANAGERS
the lowest turnover rate, the smallest health insurance premiums, or the lowest cost per hire. Firms succeed because they create value for their customers. Firms succeed because they have a workforce that skillfully executes a value-creating business strategy. A firm’s objective must be to maximize the return on the investment (ROI) it makes in its workforce. The relationship between the ROI and HR costs can be summarized as: HR ROI = Workforce value / HR costs. Yes, other things equal, reducing HR costs in the denominator of this ratio produces an increase in ROI. Of course, increasing HR costs in the denominator of this ratio could also improve ROI. That would be the case when these additional HR expenditures result in even larger increases in workforce value.
Reducing inefficiencies in HR processes and increasing workforce value are both important. Increases in workforce value, however, are most likely to explain a firm’s level of success. Consider these two firms. Company A’s management and workforce are by far the most talented and engaged in the industry. Company B’s management and workforce are about average for the industry, but its cost per hire is much less than average. Which HR department is doing the better job? In which firm will more value be created for shareholders? The amount a firm can save by reducing inefficiencies in HR processes is usually insignificant compared to the amount it can gain by build-ing a more talented and engaged work force. Of course if you can do both, you should. Several books have been written that focus on using financial tools to improve the efficiency of resource allocation within the HR department. This book discusses those issues but focuses on the financial understanding needed to align HR strategy with busi-ness strategy and create shareholder value.
What This Book Attempts to Do When should financial analyses precede HR decisions? The
answer to that question is always. That doesn’t mean that in all cases you need to develop spreadsheet models and utilize their built-in financial functions. That may be necessary when decisions involve many factors or substantial amounts of money. However, even in
Director_Book 1.indb 6 11/27/12 4:01 PM

CHAPTER 1 • BUSINESS STRATEGY, FINANCIAL STRATEGY, AND HR STRATEGY 7
situations in which no formal modeling is warranted, you need to con-sider the potential financial implications of your recommendations and actions. To do that requires an understanding of and appreciation for the importance of the following:
• Basic financial concepts such as the difference between profit and cash flow
• Difference between the market value and the book value of a company
• Cost of capital • Time value of money • Return on investment • Risk reward trade-offs • Risk management tools such as diversification and real options
Most of these concepts are just as relevant for your personal deci-sion making as for your decisions at work. HR managers also need to understand the strengths and weaknesses of the various financial per-formance measures used to assess how well a company is doing and as a basis for allocating incentive pay.
This book provides you with an intuitive understanding of each of these topics. Algebraic notation and equations are avoided, and these concepts are illustrated using spreadsheet examples. Not all HR managers are comfortable with algebraic notation, and in any case spreadsheets are the format in which they are most likely to encoun-ter these concepts on the job. Where appropriate the keystrokes for utilizing Microsoft Excel’s built-in financial functions are provided and discussed. This book does not attempt to include an introduction to the HR strategy or to corporate compensation policies. There are excellent volumes devoted to these topics. 3 What it does attempt to do is provide HR managers with an understanding of the financial jargon and methods often central to strategy development and com-pensation policy.
Chapter 2 (“The Income Statement: Do We Care About More Than the Bottom Line?”), Chapter 3 (“The Balance Sheet: If Your People Are Your Most Important Asset, Where Do They Show Up on the Balance Sheet?”), and Chapter 4 (“Cash Flows: Timing Is Every-thing”) use data from the annual reports of Home Depot, Inc., to
Director_Book 1.indb 7 11/27/12 4:01 PM

8 FINANCIAL ANALYSIS FOR HR MANAGERS
review the interpretation of corporate income statements, balance sheets, and cash flow statements. If you are familiar with the inter-pretation of basic financial statements and the differences between profit and cash flow, you may want to skip over these chapters. Chap-ter 5 (“Financial Statements as a Window into Business Strategy”) provides a case study on using financial statements to gain insights into a firm’s business strategy. Chapter 6 (“Stocks, Bonds, and the Weighted Average Cost of Capital”) and Chapter 7 (“Capital Budget-ing and Discounted Cash Flow Analysis”) discuss the concepts of cost of capital and time value of money. Chapter 8 (“Financial Analysis of Human Resource Initiatives”) uses these concepts to look at resource allocation within the HR function. Chapter 9 (“Financial Analysis of Corporation’s Strategic Initiatives”) begins with the premise that if HR managers are going to be true strategic partners they must understand the financial models used to develop and evaluate cor-porate strategy. These techniques are discussed in spreadsheet illus-trations. Chapter 10 (“Equity-Based Compensation: Stock and Stock Options”) looks at equity pay and the implications of paying in stock versus paying in stock by stock options. Pensions are of enormous financial significance to the U.S. economy and to most large corpo-rations, and they are the subject of Chapter 11 (“Financial Aspects of Pension and Retirement Programs”). The chapter includes a dis-cussion of the way pension accounting choices can affect the compa-ny’s bottom line profit. Chapter 12 (“Creating Value and Rewarding Value Creation”) attempts to pull all these concepts together to look at the conditions under which shareholder value is created and at the strengths and weaknesses of alternative measures of value creation. These topics are discussed within the context of incentive pay and the choice of performance metrics that encourage the development and execution of strategies that create long-term value for the firm and its stakeholders.
Director_Book 1.indb 8 11/27/12 4:01 PM

Index
263
Numbers 401(k)s, 207 - 208
influencing plan choices, 209 - 210 pricing bonds, 90 - 91
A ABO (accumulated benefit
obligation), 192 accounting for pension plans, 189
actuarial loss, net, 197 amortization of prior service
costs, 197 DB (defined benefit) plan
obligations, 189 - 192 expected return on plan assets,
197 - 198 income statements, 195 - 196 interest costs, 196 - 197 pension footnotes, 193
post-retirement benefits, 194 - 195 service costs, 196
accounts receivable, 25 accounts receivable turnover ratio, 25 accumulated benefit obligation
(ABO), 192 acquisition value, Monte Carlo
simulations, 148 - 150 acquisitions
DCFs (discounted cash flows), 144 - 145
EPS (earnings per share), 235 Monte Carlo simulations, 150 - 151
actuarial loss, net, 197 Airbus, 157 - 158
Alcoa disclosure of methods and
assumptions they use to cost stock options, 174 - 176
pension trusts, 185 aligning pay with performance,
217 - 218 alternative calculation of ROI, 41 amortization, 14 - 15 amortization of prior service costs,
pension plans, 197 analysis, maximizing ROI (return on
investment), 125 - 126 analyzing
DCFs (discounted cash flows), mergers and acquisitions, 144 - 145
expected NPV, 135 - 137 annual cash, 10 annual reports, pension footnotes, 193 Apple, 157 ASC 17, 214 ASC 715, 193 asset turnover, common size financial
statements, 51 - 52 asset values, balance sheets, 35 AT&T, 214
B balance sheets, 10 , 23 - 25
accounts receivable, 25 accounts receivable turnover
ratio, 25 believing the numbers, 34 - 37
asset values, equity value, 35 book value versus market value of
long-term assets, 35
Director_Book 1.indb 263 11/27/12 4:01 PM

264 INDEX
cash flow, 45 - 48 financial ratios, 37
current assets to current liabilities, 38
financial leverage, 38 - 40 goodwill, 28 - 30 inventories, 26 - 27 inventory turnover ratio, 27 liabilities, 30 - 24
capital invested component of stockholders’ equity, 32 - 33
other comprehensive income, 33
retained earning component of stockholders equity, 33
stockholders’ equity, 31 - 32 treasury stock, 33 - 34
property, plant, and equipment, 27 - 28
base costs, pension plans, 198 - 199 corridor method, 199 - 201
believing the numbers, balance sheets, 34 - 37
asset values, equity value, 35 benefit/cost analysis of turnover
reduction programs, 116 beta, 64 - 65 binomial options pricing model,
176 - 175 Black, Fisher, 165 Black-Scholes model
dividend yield, 171 estimating cost of options granted,
165 - 168 exercise price, 170 forfeiture rates, 171 inputs, 168 - 172 interest rates, 170 Johnson & Johnson, pricing
employee stock options, 173 - 174 versus lattice models, 177 - 180 maturity, 170 stock price, 170 vesting periods, 171 volatility, 170 - 171
Boeing, 158 bonds
choosing with IRR, 92 pricing 401(k)s with NPV, 90 - 91
bonuses, 153
book value versus market value of long-term assets, 35
Boudreau, John, 116 - 118 branding, 57 breakeven levels
estimating NPV of new product introduction, 129 - 130
as planning tools, 114 - 115 budgets, HR budget allocations,
122 - 123 NPV and IRR, 101 - 104 optimizing, 124 - 125 when there are large alternatives,
104 - 107 Buffet, Warren, 164 business acumen, 2 - 4 business strategies, HR strategies and,
56 - 58 buy versus lease decisions, 82 - 83
C calculating
cash flow, 44 CFROI (cash flow return on
investment), 227 DB (defined benefit) plans,
obligations of, 189 - 192 present values, 71 - 72
of a series of cash flows, 75 - 76 spreadsheets, 80 - 82
call options, 154 capital, working capital, 130 capital asset pricing model
(CAPM), 62 capital budgeting, 69 capital charge, 229 capital costs, 65 - 66
reducing, WACC (weighted average cost of capital), 68
WACC (weighted average cost of capital), 69
capital expenditures, estimating NPV of new product introduction, 128 - 129
capital invested component of stockholders’ equity, 32 - 33
CAPM (capital asset pricing model), 62 - 63
Cascio, Wayne, 116 - 118
Director_Book 1.indb 264 11/27/12 4:01 PM

INDEX 265
cash balance plan (CBP), 187 cash flow, 43 - 44
balance sheets, 45 - 48 calculating, 44
present value of a series of cash flows, 75 - 76
converting profits to, 130 - 131 decisions about overtime usage,
98 - 101 determining relevant cash flows,
83 - 85 dividing into initial time horizon and
terminal value, 145 income statements, 45 using NPV and IRR to guide HR
budget allocations, 101 - 104 cash flow return on investment
(CFROI), 227 - 229 CBP (cash balance plan), 187 Center on Executive Compensation,
217 - 218 , 236 CFROI (cash flow return on
investment), 227 - 229 calculating, 227
Chrysler Corporation, bonuses, 79 commercial paper, 61 common shareholders, 60 common size financial statements, 50
asset turnover, 51 - 52 profit margins, 51 return on assets, 51
common size income statements, 20 common stock, 60 comparing leavers and their
replacements, 118 - 119 comparison groups, determining
program impacts using pre-post changes, 111 - 112
compensation aligning pay with performance,
217 - 218 EBIT (earnings before interest and
taxes) versus net income, 219 EBIT versus EBIT per
employee, 219 EBIT versus EBITDA, 220 - 221 equity compensation, 159 , 183 - 184 getting incentive levels just right,
236 - 238 profit per dollar of assets, 221 - 222
composition, of turnover, 117 - 118
converting profits to cash flows, 130 - 131
corporate profits, changes in pension assumptions, 204 - 205
corridor method, pension expense, 199 - 201
cost of capital, 59 , 65 - 66 impact of WACC on value creation,
66 - 68 Monte Carlo simulations, 147 reducing WACC, 68 WACC, 69
cost of debt, 62 cost of equity, 62 - 63 cost of goods sold, Home Depot, 12 cost of options, 164 - 165 cost-benefit analysis of training
programs, 110 costs, reducing, 6 current assets to current liabilities, 38
D DB (defined benefit) plans, 186 , 211
accounting for, 189 calculating obligations, 189 - 192 de-risking, 205 - 206 freezing, 207 interest rates, 202 - 203 perfect storms, 200 - 201 retirement, 213 shifting to DC plans, 187 - 188 transferring risk to employees, 206 transferring risk to insurance
companies, 206 - 207 Verizon, 193
DC (defined contribution) plans, 186 , 195 , 211
influencing plan choices, 208 - 210 pension plans, 207 - 208 shifting to, 187 - 188
DCFs (discounted cash flows), 72 - 73 analyzing mergers and acquisitions,
144 - 145 examples, 77 HR applications, 77 - 78
determining relevant cash flows, 83 - 85
selecting discount rates, 85 time value of money, 78 - 80
Director_Book 1.indb 265 11/27/12 4:01 PM

266 INDEX
using Excel’s NPV function to analyze a buy versus lease decision, 82 - 83
using spreadsheets to calculate present values, 80 - 82
time value of money, 78 - 80 deals, structuring with spreadsheets,
139 - 140 debt, cost of, 62 debt financing, 61 decision making, overtime, 98 - 101 deferred income tax entries, 30 deferred revenue, 30 Degussa Chemicals, 225 Delta Air Lines, 222 depreciation, 14 - 15 , 45 , 220 de-risking DB (defined benefit) plans,
205 - 206 Diluted Earnings Per Share, 17 dilution, 181 - 182 disclosure, methods and assumptions
used to price stock options, 172 - 173 Alcoa, 174 - 176 Johnson & Johnson, 173 - 174
discount rates pension plans, 203 - 204 selecting, 85
discounted cash flow analysis, 71 discounted cash flows. See DCFs
(discounted cash flows) distribution, estimating around
expected NPV, 137 - 138 dividend yield, Black-Scholes
model, 171 dividing cash flows into initial time
horizon and terminal values, 145 dollar value of program impacts,
measuring, 113 - 114
E earnings per share. See EPS (earnings
per share) EBIT (earnings before interest and
taxes), 18 versus net income, 219
EBIT (earnings before interest and taxes) versus net income, versus EBIT per employee, 219
EBIT per employee, versus EBIT (earnings before interest and taxes) versus net income, 219
EBITDA (earnings before interest, taxes, depreciation, and amortization), 18 - 19
versus EBIT (earnings before interest and taxes), 220 - 221
financing costs, 22 economic margin (EM), 229 economic value added (EVA), 222 - 224 EM (economic margin), 229 employee preferences
options versus stock, 160 - 161 risk, 162 - 163
Employee Retirement Income Security Act of 1974 (ERISA), 192
employees improving ability to make pension
plan choices, 210 transferring risk to, DB (defined
benefit) plans, 206 EPS (earnings per share), 17 , 233 - 234
impact of financial restructuring, 235 - 236
managing expectation, 234 - 235 equipment, net present value,
120 - 122 equity
cost of, 62 - 63 stockholders’ equity, on balance
sheets, 31 - 32 equity compensation, 159 , 183 - 184 equity financing, 60 equity value, balance sheets, 35 ERISA (Employee Retirement
Income Security Act of 1974), 192 estimating
cost of options granted, Black-Scholes model, 165 - 168
expected NPV based on judgments about
likelihood of each scenario, 133 - 135
distribution, 137 - 138 multiple NPVs with scenario
analysis, 133 NPV of new product introduction,
128 - 129 capital expenditures and
revenue forecasts, 128 - 129
Director_Book 1.indb 266 11/27/12 4:01 PM

INDEX 267
converting profits back to cash flows, 130 - 131
should you introduce the new product, 131
usefulness of models, 131 - 133 variable costs and breakeven
levels, 129 - 130 EVA (economic value added), 222 - 224
limitations of, 226 - 227 evaluating financial performance, risk,
238 - 239 Evonik Industries, 225 Excel
built-in IRR functions, 88 - 89 MIRR function, 93 - 94
exchange traded options, 155 - 156 versus stock options, 158 - 159
exercise price, Black-Scholes model, 170
expected NPV analyzing, 135 - 137 estimating based on judgments
about likelihood of each scenario, 133 - 135
estimating distribution, 137 - 138 expected return on plan assets,
pension plans, 197 - 198 expenses, pension plans, 192 - 193 expensing stock options, 163 - 164
F facilities, net present value, 120 - 122 fair value, 172 - 173 FASB (Financial Accounting
Standards), 163 FIFO (first-in, first-out), 26 Financial Accounting Standards
Board (FASB), 163 financial leverage
impact of, 54 - 55 increasing shareholders’ ROI, 38 - 40 reducing shareholders’ ROI, 39 - 40
financial performance, evaluating risk, 238 - 239
financial ratios, 37 alternative calculation of ROI, 41 current assets to current
liabilities, 38
financial leverage increasing shareholders’ ROI,
38 - 40 reducing shareholders’ ROI,
39 - 40 financial statements, 9 - 10 , 49
common size financial statements, 50
asset turnover, 51 - 52 profit margins, 51 return on assets, 51
financial leverage, impact of, 54 - 55 income statements. See income
statements reviewing, 55 - 56 ROE (return on equity), 53 - 54
financing costs, 22 first-in, first-out (FIFO), 26 Ford, transferring DB risk to
employees, 206 forfeiture rates, Black-Scholes
model, 171 freezing DB (defined benefit)
plans, 207
G Gayston Corp., 235 GE (General Electric)
discount rates, 203 - 204 relative TSR (total shareholder
returns), 232 General Dynamics, 235 General Motors (GM), 60
transferring DB risk to employees, 206
transferring DB risk to insurance companies, 206 - 207
Goldilocks problem, 236 - 238 goodwill, Home Depot, 29 - 30 gross profit, 17 - 18 , 218 growth perpetuity, Monte Carlo
simulations, 147 - 148
H Home Depot
accounts receivable, 25 accounts receivable turnover ratio, 25 balance sheets, 36 - 37
Director_Book 1.indb 267 11/27/12 4:01 PM

268 INDEX
cash flow, 46 - 47 common size income statements, 20 current assets to current
liabilities, 38 EBITDA (earnings before
interest, taxes, depreciation, and amortization), 19
financial leverage, reducing shareholders’ ROI, 39 - 40
financing costs, 22 income statements, 11
cost of goods sold, 12 depreciation and amortization,
14 - 15 income taxes, 16 interest expense, 15 - 16 net income, 16 - 17 sales revenue, 11 - 12 SG&A (Selling, General, and
Administrative Expense), 13 inventories, 26 - 27 inventory turnover ratio, 27 liabilities, 30 - 24
capital invested component of stockholders equity, 32 - 33
stockholders’ equity, 31 - 32 operating efficiency, 21 operating profit margin, 21 other comprehensive income, 33 profit per store, 21 - 22 property, plant, and equipment, 28 retained earning component of
stockholders equity, 33 ROIC, 222 store growth, 21 treasury stock, 33 - 34 year-over-year change, 22
Honeywell, 214 HR, role in value creation, 245 HR budget allocations
NPV and IRR, 101 - 104 optimizing, 124 - 125 trade-offs, 125 when there are large alternatives,
104 - 107 HR budgets, 122 - 123 HR costs, reducing, 6 HR initiatives, 107
cost-benefit analysis of training programs, 109
HRIS (human resource information system) software, choosing, 107 - 108
sunk costs, 109 HR strategies, business strategies and,
56 - 58 HRIS (human resource information
system) software, choosing, 107 - 108 HRIS software, 107 Hull-White approach, 179 human resource information
system, 107 hybrid plans, 186 - 187
I IASB (International Accounting
Standards Board), 214 IBM, 61
balance sheets, 37 identifying non-trainees, 113 IFRS (International Financial
Reporting Standards), 35 Immelt, Jeff, 204 , 232 impact of financial restructuring, EPS
(earnings per share), 235 - 236 implications of pension plan design on
HR, 211 - 212 incentives, getting just right, 236 - 238 income statements, 10 - 11
amortization, 14 - 15 cash flow, 45 common size income statements, 20 cost of goods sold, 12 depreciation, 14 - 15 Home Depot, 11
sales revenue, 11 - 12 income taxes, 16 interest expense, 15 - 16 net income, 16 - 17 operating efficiency, 21 operating profit margin, 21 pension expense, 195 - 196 sales revenue, 11 - 12 SG&A (Selling, General, and
Administrative Expense), 12 - 13 store growth, 21
income taxes, 16 increasing shareholders’ ROI,
financial leverage, 38 - 40 inefficiencies, reducing, 6
Director_Book 1.indb 268 11/27/12 4:01 PM

INDEX 269
inflation, 86 influencing plan choices, DC (defined
contribution) plans, 208 - 210 initial time horizon, dividing cash
flows, 145 in-licensing, 139 - 140 inputs, Black-Scholes model, 168 - 172 insurance companies, transferring
risk to, DB (defined benefit) plans, 206 - 207
interest costs, pension plans, 196 - 197 interest expense, 15 - 16 interest rates, 86
Black-Scholes model, 170 DB (defined benefit) plans, 202 - 203 IRR (internal rate of return), 87 IRR reinvestment rate assumption,
92 - 94 payback periods, 94 using NPV to evaluate investments
or projects, 86 - 87 using NPV to price the bonds in
your 401(k), 90 - 91 International Accounting Standards
Board (IASB), 214 International Financial Reporting
Standards (IFRS), 35 interpreting output from Monte Carlo
simulations, 142 - 143 intrinsic value of stock options, 154 - 155 inventories, 26 - 27 inventory turnover ratio, 27 investments
evaluating with NPV, 86 - 87 facilities and equipment, net present
value, 120 - 122 IRR (internal rate of return), 87
built-in IRR functions, 88 - 89 choosing bonds, 92 HR budget allocations, 101 - 104 HRIS software, 108 reinvestment rate assumption, 92 - 94
IRR decision rule, 89 - 90
J-K-L Jensen, Michael C., 153 Johnson & Johnson, 155
Black-Scholes model, pricing employee stock options, 173 - 174
Kaiser Aluminum Corp., 225
last-in, first-out, 26-27 lattice models
versus Black-Scholes model, 177 - 180
disclosure of methods and assumptions they use to cost stock options, Alcoa, 174 - 176
lease versus buy decisions, 82 - 83 liabilities, 23
balance sheets, 30 - 24 capital invested component of
stockholders’ equity, 32 - 33 other comprehensive
income, 33 retained earning component of
stockholders’ equity, 33 stockholders’ equity, 31 - 32 treasury stock, 33 - 34
LIFO (last-in, first-out), 26 - 27 limitations of EVA (economic value
added), 226 - 227 listed options, 155 - 156 Lockheed Martin, pension trusts, 185 long-term measures of value creation,
242 - 243 Lowe’s
common size income statements, 20 financing costs, 22 operating efficiency, 21 operating profit margin, 21 profit per store, 21 - 22 store growth, 21 year-over-year change, 22
M MacDonald, J. Randall, 214 maintenance costs, 85 market value added (MVA), 230 market value of long-term assets
versus book value, 35 maturity, Black-Scholes model, 170 maximizing ROI (return on
investment) on your analysis efforts, 125 - 126
measuring dollar value of program impacts, 113 - 114
mergers DCFs (discounted cash flows),
144 - 145 Monte Carlo simulations, 150 - 151
Director_Book 1.indb 269 11/27/12 4:01 PM

270 INDEX
Merton, Robert, 168 metrics, value creation, 243 - 245 MIRR function, 93 - 94 models, estimating NPV of new
product introduction, 131 - 133 Monte Carlo simulations, 141 - 142
acquisition value, 148 - 150 acquisitions, 150 - 151 cost of capital, 147 determining value of stock options,
180 - 181 growth perpetuity, 147 - 148 interpreting output from,
142 - 143 mergers, 150 - 151 present value of a no-growth
perpetuity, 147 MSN Money, 37 Murphy, Kevin J., 153 MVA (market value added), 230
N net income, 16 - 17 , 19
versus EBIT (earnings before interest and taxes), 219
net present value of investments involving facilities and equipment, 120 - 122
new product introduction, estimating NPV, 128 - 129
capital expenditures and revenue forecasts, 128 - 129
converting profits back to cash flows, 130 - 131
variable costs and breakeven levels, 129 - 130
no-growth perpetuity, Monte Carlo simulations, 147
non-trainees, identifying, 113 Nordstrom, 55 - 56 NPV (net present value)
allocating HR budgets, 104 - 107 estimating expected NPV, based on
judgments about likelihood of each scenario, 133 - 135
estimating multiple NPVs with scenario analysis, 133
estimating strategic initiative of new product introduction, 128 - 129
capital expenditures and revenue forecasts, 128 - 129
converting profits back to cash flows, 130 - 131
should you introduce the new product, 131
usefulness of models, 131 - 133 variable costs and breakeven
levels, 129 - 130 evaluating investments or projects,
86 - 87 expected NPV
analyzing, 135 - 137 estimating distribution, 137 - 138
HR budget allocations, 101 - 104 HRIS software, 108
NPV decision rule, 89 - 90 pricing bonds in 401(k)s, 90 - 91
O OPAC (operating profit after capital
charge), 223 operating efficiency, 21 operating profit, 221 operating profit after capital charge
(OPAC), 223 operating profit margin, 21 optimizing HR budget allocations,
124 - 125 options
cost of, 164 - 165 estimating cost of options granted,
Black-Scholes model, 165 - 168 risk, 157 versus stock, employee preferences,
160 - 161 options trading, 157 - 158 other comprehensive income, 33 overhang, 181 - 182 overtime, cash flow, 98 - 101
P pay, aligning with performance,
217 - 218 payback periods, interest rates, 94
Director_Book 1.indb 270 11/27/12 4:01 PM
INDEX 271
PBGC (Pension Benefit Guarantee Corporation), 192
PBO (projected benefit obligation), 192
P/E (Price/Earnings) ratio, 233 - 234 pension accounting, 189
calculating DB plan obligations, 189 - 192
Pension Benefit Guarantee Corporation (PBGC), 192
pension expense, corridor method, 199 - 201
pension footnotes, annual reports, 193 pension plans, 185
accounting for actuarial loss, net, 197 amortization of prior service
costs, 197 expected return on plan assets,
197 - 198 income statements, 195 - 196 interest costs, 196 - 197 pension footnotes, 193 post-retirement benefits,
194 - 195 service costs, 196
base costs, 198 - 199 corridor method, 199 - 201
changes in pension assumptions, effect on corporate profits, 204 - 205
DB (defined benefit) plans, 186 freezing pension plans, 207 interest rates, 202 - 203 perfect storms, 200 - 201 retirement, 213 transferring risk to
employees, 206 transferring risk to insurance
companies, 206 - 207 DC (defined contribution) plans,
186 , 207 - 208 influencing plan choices,
208 - 210 defining expenses, 192 - 193 de-risking DB (defined benefit)
plans, 205 - 206 discount rates, 203 - 204 future of, 213 - 215 HR implications of plan design,
211 - 212
hybrid plans, 186 - 187 improving employees’ ability to
make their own choices, 210 shifting from DB plans to DC plans,
187 - 188 underfunded pensions, 201
pension trusts, 185 perfect storms, DB (defined benefit)
plans, 200 - 201 performance
aligning pay with, 217 - 218 short-term performance
metrics, 240 performance share unit (PSU), 183 performance shares, 183 Pfizer, Inc, SG&A (Selling, General,
and Administrative Expense), 13 planning tools, breakeven levels as,
114 - 115 post-retirement benefits, 194 - 195 preferred stock, 60 premiums, 154 pre-post changes, determining
program impacts, 111 present value tables, reading, 73 present values
calculating, 71 - 72 of a series of cash flows, 75 - 76 spreadsheets, 80 - 82
DCFs (discounted cash flows), 72 - 73
time value of money, 74 - 75 pricing bonds in 401(k)s with NPV,
90 - 91 productivity, training programs that
don’t increase productivity, 115 - 116 profit, 17
EBIT (earnings before interest and taxes), 18
EBITDA (earnings before interest, taxes, depreciation, and amortization), 18 - 19
EVA (economic value added), 222 - 224
gross profit, 17 - 18 , 218 net income, 19 operating profit, 221
profit margins, common size financial statements, 51
profit maximization, 218
Director_Book 1.indb 271 11/27/12 4:01 PM

272 INDEX
profit per dollar of assets, ROA and ROIC, 221 - 222
profit per store, 21 - 22 profits, converting profits back to cash
flows, 130 - 131 program impacts
determining using comparison groups, 111 - 112
determining using pre-post changes, 111
measuring dollar value of, 113 - 114 projected benefit obligation
(PBO), 192 projects, evaluating with NPV, 86 - 87 property, plant and equipment,
27 - 28 PSU (performance share unit),
183 , 238
Q-R quants, 5 R&D (research and
development), 226 reading present value tables, 73 reducing
HR costs, 6 inefficiencies, 6 shareholders’ ROI, 39 - 40 WACC (weighted average cost of
capital), 68 relative TSR (total shareholder
returns), 232 - 233 restricted stock, 182 restricted stock unit (RSU), 182 retained earning component of
stockholders’ equity, 33 retirement, DB (defined benefit)
plans, 213 return on assets. See ROA return on equity (ROE), 53 - 54 revenue forecasts, estimating NPV of
new product introduction, 128 - 129 risk, 63 - 65
employee preferences, 162 - 163 evaluating financial performance,
238 - 239 options, 157 reducing on DB (defined benefit)
plans, 205 - 206
transferring to employees, DB (defined benefit) plans, 206
transferring to insurance companies, DB (defined benefit) plans, 206 - 207
ROA (return on assets), 52 common size financial
statements, 51 profit per dollar of assets, 221 - 222 Roche Pharmaceuticals, 223 ROE (return on equity), 53 - 54 , 224 ROI (return on investment),
maximizing on your analysis efforts, 125 - 126
ROI, alternative calculation of ROI, 41
ROIC (return on invested capital), 240
compared to WACC, 222 profit per dollar of assets, 221 - 222
RSU (restricted stock unit), 182 run rates, 181 - 182
S sales revenue, 11 - 12
Home Depot, 11 - 12 SAR (stock appreciation rights), 182 scenario analysis, estimating multiple
NPVs, 133 Scholes, Myron, 165 selecting discount rates, 85 service costs, pension plans, 196 SG&A (Selling, General, and
Administrative Expense), 12 - 13 short-term performance metrics, 240 skill sets, 4 Solver function, 105 spreadsheets
calculating present values, 80 - 82 for structuring deals, 139 - 140
stock common stock, 60 versus options, 160 - 161 preferred stock, 60 restricted stock, 182
stock appreciation rights (SAR), 182 stock options, 153 , 182 , 242
disclosure of methods and assumptions they use to cost stock options, 172 - 173
Director_Book 1.indb 272 11/27/12 4:01 PM

INDEX 273
versus exchange traded options, 158 - 159
expensing, 163 - 164 how they work, 154 intrinsic value of, 154 - 155 time value of, 154 - 155
stock price, Black-Scholes model, 170 stockholders’ equity, 31 - 32 store growth, 21 straddles, 158 structuring deals with spreadsheets,
139 - 140 sunk costs, HR initiatives, 109
T terminal values, dividing cash
flows, 145 Tiffany and Company, 57 - 58 time value of money, 74 - 75
DCFs (discounted cash flows), 78 - 80
interest rates, 86 IRR (internal rate of return), 87 IRR reinvestment rate
assumption, 92 - 94 payback periods, 94 using NPV to price the bonds in
your 401(k), 90 - 91 time value of stock options, 154 - 155 total shareholder returns (TSR),
231 - 232 trade-offs, among HR budget
components, 125 training programs, 102 - 103 , 123
cost-benefit analysis of, 110 determining program impacts using
comparison groups, 111 - 112 determining program impacts using
pre-post changes, 111 that don’t increase productivity,
115 - 116 what if everybody gets training, 113
transferring risk to employees, DB (defined benefit) plans, 206
treasury stock, 33 - 34 TSR (total shareholder return),
231 - 232
turnover comparing leavers and their
replacements, 118 - 119 composition of, 117 - 118
turnover reduction programs, benefit/cost analysis, 116
U-V underfunded pensions, 201 UPS, 214 U.S. GAAP, 214 value creation, 217 , 240 - 242
HR’s role in, 245 impact of WACC on value creation,
66 - 68 imperfect metrics, 243 - 245 long-term measures of, 242 - 243
value of stock options, determining with Monte Carlo simulation, 180 - 181
variable costs, estimating NPV of new product introduction, 129 - 130
VBO (vested benefit obligation), 192 Verizon
changes in pension assumptions, effect on corporate profits, 204 - 205
DB (defined benefit) plans, 193 pension expense, income
statements, 195 - 196 pension footnotes, annual
reports, 193 pension plans, base costs, 198 post-retirement benefits, 194 - 195
vested benefit obligation (VBO), 192 vesting periods, Black-Scholes
model, 171 volatility, 64
Black-Scholes model, 170 - 171
W WACC (weighted average cost of
capital), 61 , 85 compared to ROIC, 222 impact on value creation, 66 - 68 reducing, 68
Director_Book 1.indb 273 11/27/12 4:01 PM

274 INDEX
Wal-Mart Stores, Inc., 55 weighted average cost of capital
(WACC), 61 workforce value, 6 working capital, 130
X-Y-Z year-over-year change, 22
Director_Book 1.indb 274 11/27/12 4:01 PM

This page intentionally left blank

Director_Book 1.indb 276 11/27/12 4:01 PM
PressFINANCIAL TIMES
In an increasingly competitive world, it is qualityof thinking that gives an edge—an idea that opens newdoors, a technique that solves a problem, or an insight
that simply helps make sense of it all.
We work with leading authors in the various arenasof business and finance to bring cutting-edge thinking
and best-learning practices to a global market.
It is our goal to create world-class print publicationsand electronic products that give readers
knowledge and understanding that can then beapplied, whether studying or at work.
To find out more about our businessproducts, you can visit us at www.ftpress.com.
FT