Embed Size (px)
Citation preview
7/30/2019 Financial Analysis - Golden Agri-Resources Limited Cultivates, Harvests, Processes, Distributes, And Sells Crude Palm Oil and Palm Kernel. the Company Also Refines Crude Pal…
http://slidepdf.com/reader/full/financial-analysis-golden-agri-resources-limited-cultivates-harvests-processes 1/8
06.05.2013
Ticker: Golden Agri-Resources Ltd Benchmark:
Currency: Singapore: GGR, Currency: SGD Straits Times Index STI (FSSTI)
Sector: Consumer Staples Industry: Food Products Year:
Telephone 65-6590-0800 Revenue (M) Business Segments in SGD Sales (M) Geographic Segments in SGD Sales (M)Website www.goldenagri.com.sg No of Employees Palm Oil Plantation and Refining 5949 Rest of Asia 2801
Address 108 Pasir Panjang Road #06-00 Golden Agri Plaza Singapore Singapore Vegetable Oil and Oilseed Processing 1611 China 2149Share Price Performance in SGD India 999
Price 0.54 1M Return -4.3% Indonesia 823
52 Week High 0.76 6M Return -10.5% Europe 735
52 Week Low 0.51 52 Wk Return -24.7% Other Countries 54
52 Wk Beta 1.52 YTD Return -16.8%
Credit Ratings
Bloomberg -
S&P - Date - Outlook -
Moody's - Date - Outlook STABLE
Fitch - Date - Outlook -
Valuation Ratios
12/09 12/10 12/11 12/12 12/13E 12/14E 12/15E
P/E 6.9x 5.3x 5.3x 16.1x 11.1x 10.3x 9.2x
EV/EBIT 15.2x 15.1x 9.2x 13.6x - - -
EV/EBITDA 12.5x 13.2x 8.3x 11.4x 8.3x 7.4x 6.7x
P/S 1.8x 2.2x 1.1x 1.1x 1.0x 0.9x 0.8x
P/B 0.8x 1.1x 0.8x 0.8x 0.6x 0.6x 0.6x
Div Yield 1.0% 1.0% 2.7% 1.8% 2.3% 2.5% 3.5%
Profitability Ratios %
12/09 12/10 12/11 12/12 12/13E 12/14E 12/15E
Gross Margin 22.2 27.2 30.9 26.6 22.8 22.4 18.3
EBITDA Margin 16.9 18.3 15.3 11.8 14.3 14.3 14.5
Operating Margin 13.9 15.9 13.7 9.9 11.7 11.7 12.4
Profit Margin 26.5 40.6 21.3 6.8 8.1 8.1 8.5
Return on Assets 8.2 15.8 11.6 3.3 3.7 3.9 4.7
Return on Equity 12.1 23.2 17.1 4.9 5.4 5.8 6.0
Leverage and Coverage Ratios
12 09 12 10 12 11 12 12Current Ratio 1.5 1.4 1.6 1.9 Current Capitalization in SGD
Quick Ratio 0.6 0.4 0.5 0.8 Common Shares Outstanding (M) 12837.5
EBIT/Interest 7.2 12.5 13.9 9.5 Market Capitalization (M) 6868.1
Tot Debt/Capital 0.1 0.1 0.1 0.2 Cash and ST Investments (M) 817.6
Tot Debt/Equity 0.1 0.1 0.1 0.2 Total Debt (M) 2265.5
Eff Tax Rate % - 25.0 25.0 32.1 Preferred Equity (M) 0.0LT Investments in Affiliate Companies (M) 0.0
Investments (M) 111.9
Enterprise Value (M) 8427.9
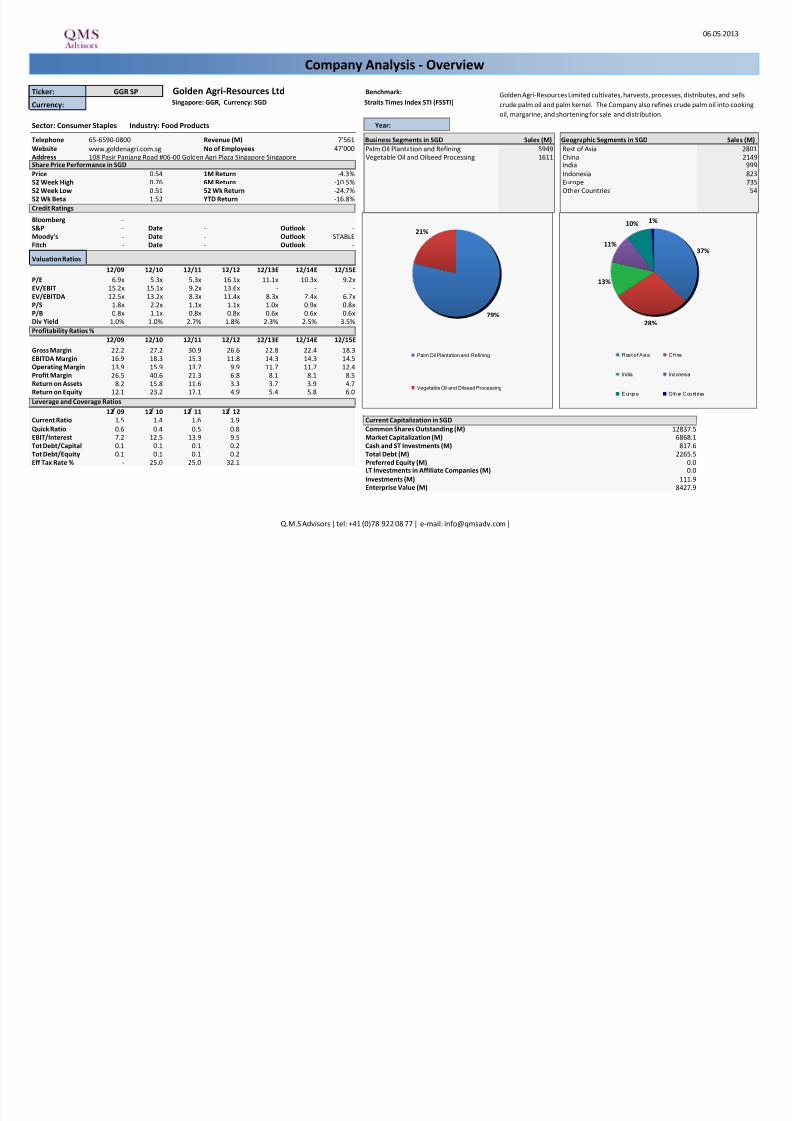
Golden Agri-Resources Limited cultivates, harvests, processes, distributes, and sells
crude palm oil and palm kernel. The Company also refines crude palm oil into cooking
oil, margarine, and shortening for sale and distribution.
GGR SP
7'56147'000
Company Analysis - Overview
79%
21%
Palm Oil Plantation and Refining
Vegetable Oil and Oilseed Processing
37%
28%
13%
11%
10% 1%
Rest o f Asia China
India Indonesia
Europ e Oth er C ou nt ri es
Q.M.S Advisors | tel: +41 (0)78 922 08 77 | e-mail: [email protected] |
7/30/2019 Financial Analysis - Golden Agri-Resources Limited Cultivates, Harvests, Processes, Distributes, And Sells Crude Palm Oil and Palm Kernel. the Company Also Refines Crude Pal…
http://slidepdf.com/reader/full/financial-analysis-golden-agri-resources-limited-cultivates-harvests-processes 2/8
Golden Agri-Resources LtdTarget price in SGD
Date Buy Hold Sell Date Price Target Price Broker Analyst Recommendation Target Date
30-Apr-13 40% 35 25 6-May-13 0.54 0.65 UOB Kay Hian STEFANUS DARMAGIRI sell 0.55 26-Apr-13
29-Mar-13 50% 25 25 3-May-13 0.53 0.65 Phillip Securities NICHOLAS HUAI GIM ONG neutral 0.55 22-Apr-13
28-Feb-13 57% 24 19 2-May-13 0.52 0.65 Goldman Sachs PATRICK TIAH neutral/neutral 0.63 12-Apr-13
31-Jan-13 62% 24 14 1-May-13 0.53 0.65 Deutsche Bank MICHELLE FOONG sell 0.50 11-Apr-13
31-Dec-12 67% 29 5 30-Apr-13 0.53 0.65 CIMB IVY NG neutral 0.58 10-Apr-13
30-Nov-12 67% 24 10 29-Apr-13 0.55 0.65 RHB Research Institute Sdn Bhd TEAM COVERAGE buy 0.71 10-Apr-13
31-Oct-12 77% 18 5 26-Apr-13 0.56 0.65 BNP Paribas Equity Research MICHAEL GREENALL buy 0.83 10-Apr-13
28-Sep-12 81% 14 5 25-Apr-13 0.56 0.65 Nomura MUZHAFAR MUKHTAR neutral 0.65 8-Apr-13
31-Aug-12 80% 15 5 24-Apr-13 0.54 0.65 OCBC Investment Research CAREY WONG hold 0.63 4-Apr-13
31-Jul-12 84% 11 5 23-Apr-13 0.52 0.65 Macquarie CONRAD WERNER underperform 0.50 26-Mar-13
29-Jun-12 75% 20 5 22-Apr-13 0.52 0.65 Morgan Stanley CHARLES C SPENCER Overwt/Attractive 0.70 12-Mar-13
31-May-12 75% 20 5 19-Apr-13 0.52 0.66 Credit Suisse TAN TING MIN outperform 0.80 28-Feb-13
18-Apr-13 0.52 0.66 JPMorgan YING-JIAN CHAN underweight 0.50 28-Feb-13
17-Apr-13 0.53 0.66 HSBC THILAN WICKRAMASINGHE overweight 0.75 6-Feb-13
16-Apr-13 0.54 0.66 Standard Chartered ADRIAN FOULGER in-line 0.67 5-Feb-13
15-Apr-13 0.55 0.67 EVA Dimensions AUSTIN BURKETT hold 15-Jan-13
12-Apr-13 0.56 0.67 Jefferies ARYA SEN buy 0.88 14-Mar-12
11-Apr-13 0.56 0.67 Affin Securities Sdn Bhd ONG KENG WEE not rated 2-Feb-12
10-Apr-13 0.56 0.67 IIFL ZUO LI add 0.77 14-Nov-11
9-Apr-13 0.55 0.67
8-Apr-13 0.55 0.67
5-Apr-13 0.56 0.69
4-Apr-13 0.56 0.69
3-Apr-13 0.57 0.69
2-Apr-13 0.57 0.69
1-Apr-13 0.58 0.69
29-Mar-13 0.57 0.69
28-Mar-13 0.57 0.69
27-Mar-13 0.58 0.69
26-Mar-13 0.58 0.69
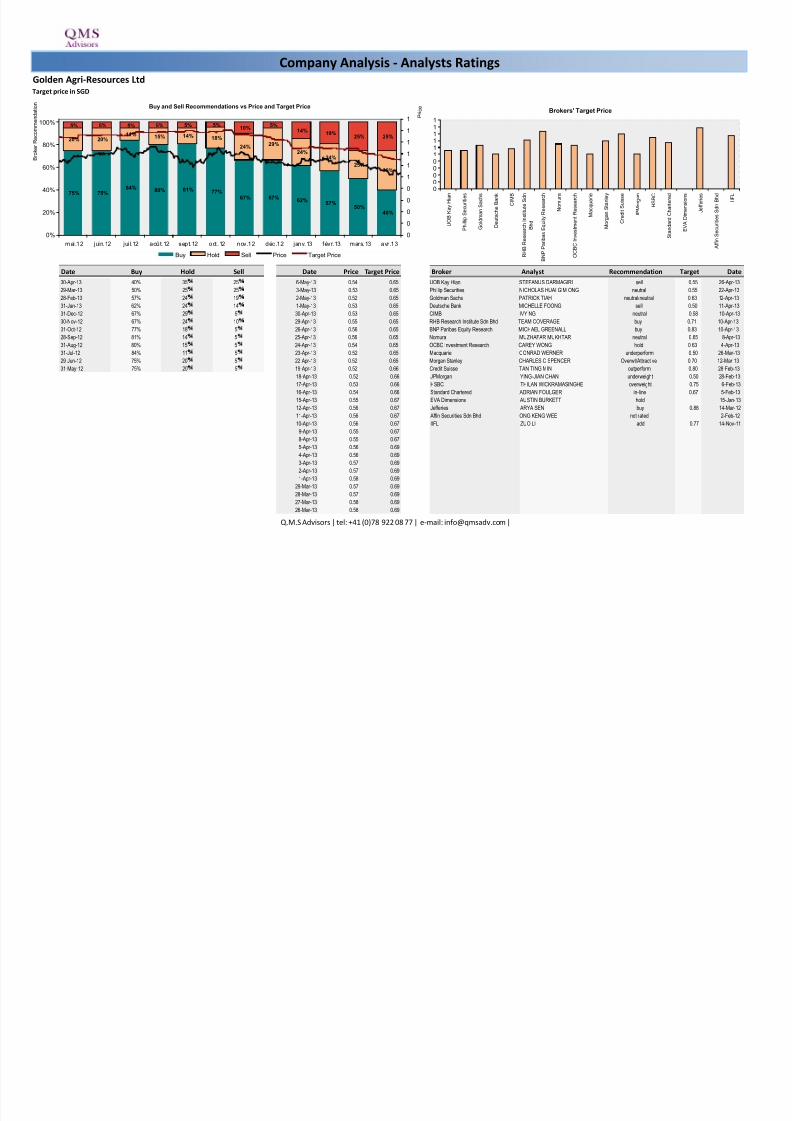
Company Analysis - Analysts Ratings
Buy and Sell Recommendations vs Price and Target Price
75% 75%84% 80% 81% 77%
67% 67%62%
57%50%
40%
20% 20%11%
15% 14% 18%
24%29%
24%24%
25%35%
5% 5% 5% 5% 5% 5%10%
5%14%
19%
25% 25%
0%
20%
40%
60%
80%
100%
mai.12 juin.12 jui l.12 août.12 sept.12 oct.12 nov.12 déc.12 janv.13 févr.13 mars.13 avr.13
B r o
k e r
R e c o m m e n
d a
t i o n
0
0
0
0
0
1
1
1
1
1
1 P r i c e
Buy Hold Sell Price Target Price
Brokers' Target Price
00000111111
U O B K a y
H i a n
P h i l l i p S e c u r i t i e s
G o
l d m a n
S a c
h s
D e u
t s c
h e
B a n
k
C I M B
R H B R e s e a r c
h I n s
t i t u t e S d n
B h d
B N P P a r i b a s
E q u
i t y R e s e a r c
h
N o m u r a
O C B C
I n v e s
t m e n
t R e s e a r c
h
M a c q u a r i e
M o r g a n
S t a n
l e y
C r e
d i t S u
i s s e
J P M o r g a n
H S B C
S t a n
d a r d
C h a r t e r e
d
E V A D i m e n s
i o n s
J e
f f e r i e s
A f f i n S e c u r i t i e s
S d n
B h d
I I F L
Q.M.S Advisors | tel: +41 (0)78 922 08 77 | e-mail: [email protected] |
7/30/2019 Financial Analysis - Golden Agri-Resources Limited Cultivates, Harvests, Processes, Distributes, And Sells Crude Palm Oil and Palm Kernel. the Company Also Refines Crude Pal…
http://slidepdf.com/reader/full/financial-analysis-golden-agri-resources-limited-cultivates-harvests-processes 3/8
06.05.2013
Golden Agri-Resources Ltd
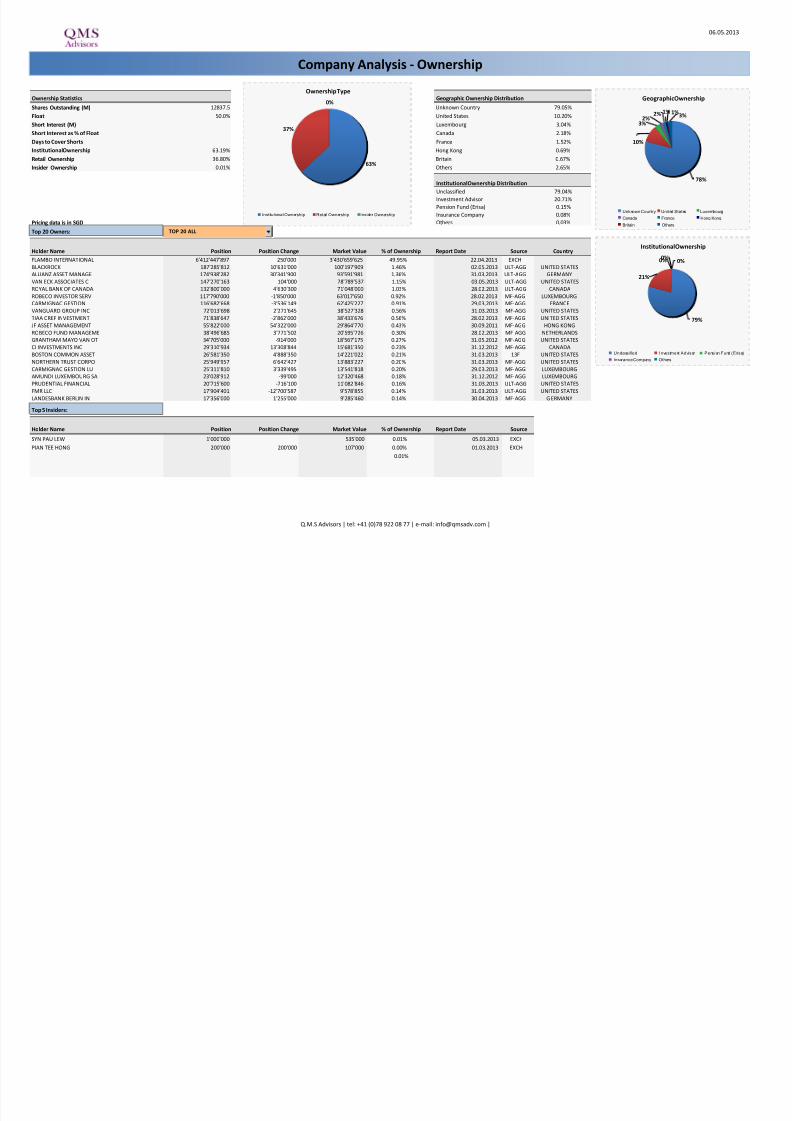
Ownership Statistics Geographic Ownership Distribution
Shares Outstanding (M) 12837.5 Unknown Country 79.05%
Float 50.0% United States 10.20%
Short Interest (M) Luxembourg 3.04%
Short Interest as % of Float Canada 2.18%
Days to Cover Shorts France 1.52%
Institutional Ownership 63.19% Hong Kong 0.69%
Retail Ownership 36.80% Britain 0.67%
Insider Ownership 0.01% Others 2.65%
Institutional Ownership Distribution
Unclassified 79.04%
Investment Advisor 20.71%
Pension Fund (Erisa) 0.15%
Insurance Company 0.08%
Pricing data is in SGD Others 0.03%
Top 20 Owners:
Holder Name Position Position Change Market Value % of Ownership Report Date Source Country
FLAMBO INTERNATIONAL 6'412'447'897 250'000 3'430'659'625 49.95% 22.04.2013 EXCH
BLACKROCK 187'285'812 10'631'000 100'197'909 1.46% 02.05.2013 ULT-AGG UNITED STATES
ALLIANZ ASSET MANAGE 174'938'282 30'341'900 93'591'981 1.36% 31.03.2013 ULT-AGG GERMANYVAN ECK ASSOCIATES C 147'270'163 104'000 78'789'537 1.15% 03.05.2013 ULT-AGG UNITED STATES
ROYAL BANK OF CANADA 132'800'000 4'630'300 71'048'000 1.03% 28.02.2013 ULT-AGG CANADA
ROBECO INVESTOR SERV 117'790'000 -1'850'000 63'017'650 0.92% 28.02.2013 MF-AGG LUXEMBOURG
CARMIGNAC GESTION 116'682'668 -3'536'149 62'425'227 0.91% 29.03.2013 MF-AGG FRANCE
VANGUARD GROUP INC 72'013'698 2'271'645 38'527'328 0.56% 31.03.2013 MF-AGG UNITED STATES
TIAA CREF INVESTMENT 71'838'647 -2'862'000 38'433'676 0.56% 28.02.2013 MF-AGG UNITED STATES
JF ASSET MANAGEMENT 55'822'000 54'322'000 29'864'770 0.43% 30.09.2011 MF-AGG HONG KONG
ROBECO FUND MANAGEME 38'496'685 3'771'502 20'595'726 0.30% 28.02.2013 MF-AGG NETHERLANDS
GRANTHAM MAYO VAN OT 34'705'000 -914'000 18'567'175 0.27% 31.05.2012 MF-AGG UNITED STATES
CI INVESTMENTS INC 29'310'934 13'308'844 15'681'350 0.23% 31.12.2012 MF-AGG CANADA
BOSTON COMMON ASSET 26'581'350 4'888'350 14'221'022 0.21% 31.03.2013 13F UNITED STATES
NORTHERN TRUST CORPO 25'949'957 6'642'427 13'883'227 0.20% 31.03.2013 MF-AGG UNITED STATES
CARMIGNAC GESTION LU 25'311'810 3'339'495 13'541'818 0.20% 29.03.2013 MF-AGG LUXEMBOURG
AMUNDI LUXEMBOURG SA 23'028'912 -99'000 12'320'468 0.18% 31.12.2012 MF-AGG LUXEMBOURG
PRUDENTIAL FINANCIAL 20'715'600 -716'100 11'082'846 0.16% 31.03.2013 ULT-AGG UNITED STATES
FMR LLC 17'904'401 -12'700'587 9'578'855 0.14% 31.03.2013 ULT-AGG UNITED STATES
LANDESBANK BERLIN IN 17'356'000 1'255'000 9'285'460 0.14% 30.04.2013 MF-AGG G ERMANY
Top 5 Insiders:
Holder Name Position Position Change Market Value % of Ownership Report Date Source
SYN PAU LEW 1'000'000 535'000 0.01% 05.03.2013 EXCH
PIAN TEE HONG 200'000 200'000 107'000 0.00% 01.03.2013 EXCH
0.01%
Company Analysis - Ownership
Ownership Type
63%
37%
0%
Institutional Ownership Retail Ownership Insider Ownership
Geographic Ownership
78%
3%
3%
2%2%
1% 1%
10%
Unknown Country United States Luxembourg
Canada France Hong Kong
Britain Others
Institutional Ownership
79%
0% 0%0%
21%
Unclassified Investment Advisor Pension Fund (Erisa)
Insurance Company Others
TOP 20 ALL
Q.M.S Advisors | tel: +41 (0)78 922 08 77 | e-mail: [email protected] |
7/30/2019 Financial Analysis - Golden Agri-Resources Limited Cultivates, Harvests, Processes, Distributes, And Sells Crude Palm Oil and Palm Kernel. the Company Also Refines Crude Pal…
http://slidepdf.com/reader/full/financial-analysis-golden-agri-resources-limited-cultivates-harvests-processes 4/8
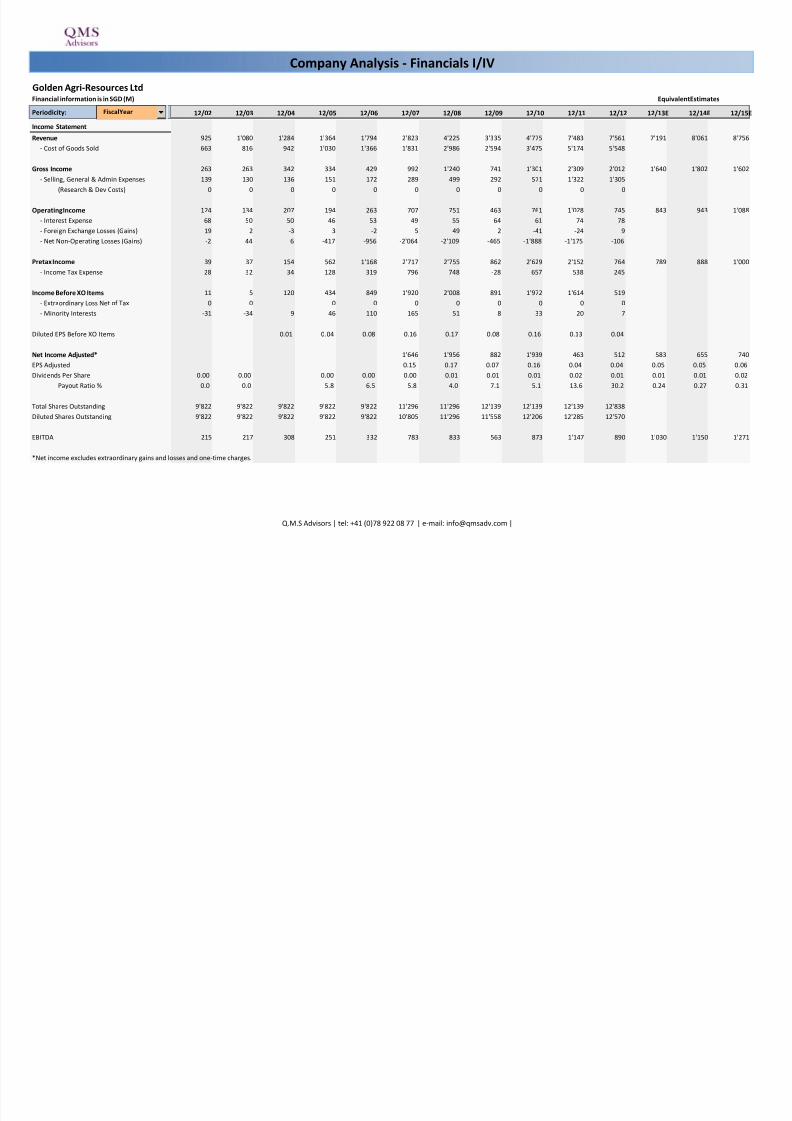
Golden Agri-Resources LtdFinancial information is in SGD (M)
Periodicity: 12/02 12/03 12/04 12/05 12/06 12/07 12/08 12/09 12/10 12/11 12/12 12/13E 12/14E 12/15E
Income Statement
Revenue 925 1'080 1'284 1'364 1'794 2'823 4'225 3'335 4'775 7'483 7'561 7'191 8'061 8'756- Cost of Goods Sold 663 816 942 1'030 1'366 1'831 2'986 2'594 3'475 5'174 5'548
Gross Income 263 263 342 334 429 992 1'240 741 1'301 2'309 2'012 1'640 1'802 1'602
- Selling, General & Admin Expenses 139 130 136 151 172 289 499 292 571 1'322 1'305
(Research & Dev Costs) 0 0 0 0 0 0 0 0 0 0 0
Operating Income 124 134 207 194 263 707 751 463 761 1'028 745 843 943 1'088
- Interest Expense 68 50 50 46 53 49 55 64 61 74 78
- Foreign Exchange Losses (Gains) 19 2 -3 3 -2 5 49 2 -41 -24 9
- Net Non-Operating Losses (Gains) -2 44 6 -417 -956 -2'064 -2'109 -465 -1'888 -1'175 -106
Pretax Income 39 37 154 562 1'168 2'717 2'755 862 2'629 2'152 764 789 888 1'000
- Income Tax Expense 28 32 34 128 319 796 748 -28 657 538 245
Income Before XO Items 11 5 120 434 849 1'920 2'008 891 1'972 1'614 519
- Extraordinary Loss Net of Tax 0 0 0 0 0 0 0 0 0 0
- Minority Interests -31 -34 9 46 110 165 51 8 33 20 7
Diluted EPS Before XO Items 0.01 0.04 0.08 0.16 0.17 0.08 0.16 0.13 0.04
Net Income Adjusted* 1'646 1'956 882 1'939 463 512 583 655 740
EPS Adjusted 0.15 0.17 0.07 0.16 0.04 0.04 0.05 0.05 0.06
Dividends Per Share 0.00 0.00 0.00 0.00 0.00 0.01 0.01 0.01 0.02 0.01 0.01 0.01 0.02
Payout Ratio % 0.0 0.0 5.8 6.5 5.8 4.0 7.1 5.1 13.6 30.2 0.24 0.27 0.31
Total Shares Outstanding 9'822 9'822 9'822 9'822 9'822 11'296 11'296 12'139 12'139 12'139 12'838
Diluted Shares Outstanding 9'822 9'822 9'822 9'822 9'822 10'805 11'296 11'558 12'206 12'285 12'570
EBITDA 215 217 308 251 332 783 833 563 873 1'147 890 1'030 1'150 1'271
*Net income excludes extraordinary gains and losses and one-time charges.
Equivalent Estimates
Company Analysis - Financials I/IV
FiscalYear
Q.M.S Advisors | tel: +41 (0)78 922 08 77 | e-mail: [email protected] |
7/30/2019 Financial Analysis - Golden Agri-Resources Limited Cultivates, Harvests, Processes, Distributes, And Sells Crude Palm Oil and Palm Kernel. the Company Also Refines Crude Pal…
http://slidepdf.com/reader/full/financial-analysis-golden-agri-resources-limited-cultivates-harvests-processes 5/8
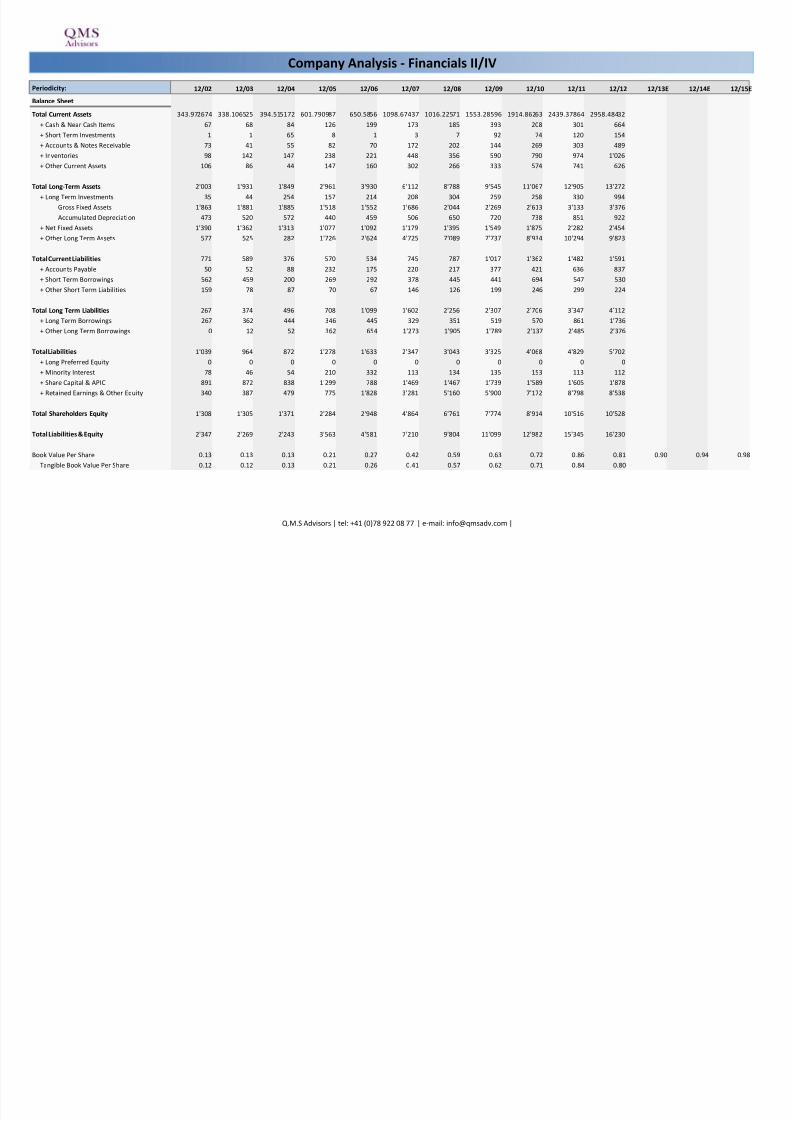
Periodicity: 12/02 12/03 12/04 12/05 12/06 12/07 12/08 12/09 12/10 12/11 12/12 12/13E 12/14E 12/15E
Balance Sheet
Total Current Assets 343.972674 338.106525 394.515172 601.790987 650.5856 1098.67437 1016.22571 1553.28596 1914.86263 2439.37864 2958.48432
+ Cash & Near Cash Items 67 68 84 126 199 173 185 393 208 301 664
+ Short Term Investments 1 1 65 8 1 3 7 92 74 120 154+ Accounts & Notes Receivable 73 41 55 82 70 172 202 144 269 303 489
+ Inventories 98 142 147 238 221 448 356 590 790 974 1'026
+ Other Current Assets 106 86 44 147 160 302 266 333 574 741 626
Total Long-Term Assets 2'003 1'931 1'849 2'961 3'930 6'112 8'788 9'545 11'067 12'905 13'272
+ Long Term Investments 35 44 254 157 214 208 304 259 258 330 994
Gross Fixed Assets 1'863 1'881 1'885 1'518 1'552 1'686 2'044 2'269 2'613 3'133 3'376
Accumulated Depreciation 473 520 572 440 459 506 650 720 738 851 922
+ Net Fixed Assets 1'390 1'362 1'313 1'077 1'092 1'179 1'395 1'549 1'875 2'282 2'454
+ Other Long Term Assets 577 525 282 1'726 2'624 4'725 7'089 7'737 8'934 10'294 9'823
Total Current Liabilities 771 589 376 570 534 745 787 1'017 1'362 1'482 1'591
+ Accounts Payable 50 52 88 232 175 220 217 377 421 636 837
+ Short Term Borrowings 562 459 200 269 292 378 445 441 694 547 530
+ Other Short Term Liabilities 159 78 87 70 67 146 126 199 246 299 224
Total Long Term Liabilities 267 374 496 708 1'099 1'602 2'256 2'307 2'706 3'347 4'112
+ Long Term Borrowings 267 362 444 346 445 329 351 519 570 861 1'736
+ Other Long Term Borrowings 0 12 52 362 654 1'273 1'905 1'789 2'137 2'485 2'376
Total Liabilities 1'039 964 872 1'278 1'633 2'347 3'043 3'325 4'068 4'829 5'702
+ Long Preferred Equity 0 0 0 0 0 0 0 0 0 0 0
+ Minority Interest 78 46 54 210 332 113 134 135 153 113 112
+ Share Capital & APIC 891 872 838 1'299 788 1'469 1'467 1'739 1'589 1'605 1'878
+ Retained Earnings & Other Equity 340 387 479 775 1'828 3'281 5'160 5'900 7'172 8'798 8'538
Total Shareholders Equity 1'308 1'305 1'371 2'284 2'948 4'864 6'761 7'774 8'914 10'516 10'528
Total Liabilities & Equity 2'347 2'269 2'243 3'563 4'581 7'210 9'804 11'099 12'982 15'345 16'230
Book Value Per Share 0.13 0.13 0.13 0.21 0.27 0.42 0.59 0.63 0.72 0.86 0.81 0.90 0.94 0.98
Tangible Book Value Per Share 0.12 0.12 0.13 0.21 0.26 0.41 0.57 0.62 0.71 0.84 0.80
Company Analysis - Financials II/IV
Q.M.S Advisors | tel: +41 (0)78 922 08 77 | e-mail: [email protected] |
7/30/2019 Financial Analysis - Golden Agri-Resources Limited Cultivates, Harvests, Processes, Distributes, And Sells Crude Palm Oil and Palm Kernel. the Company Also Refines Crude Pal…
http://slidepdf.com/reader/full/financial-analysis-golden-agri-resources-limited-cultivates-harvests-processes 6/8
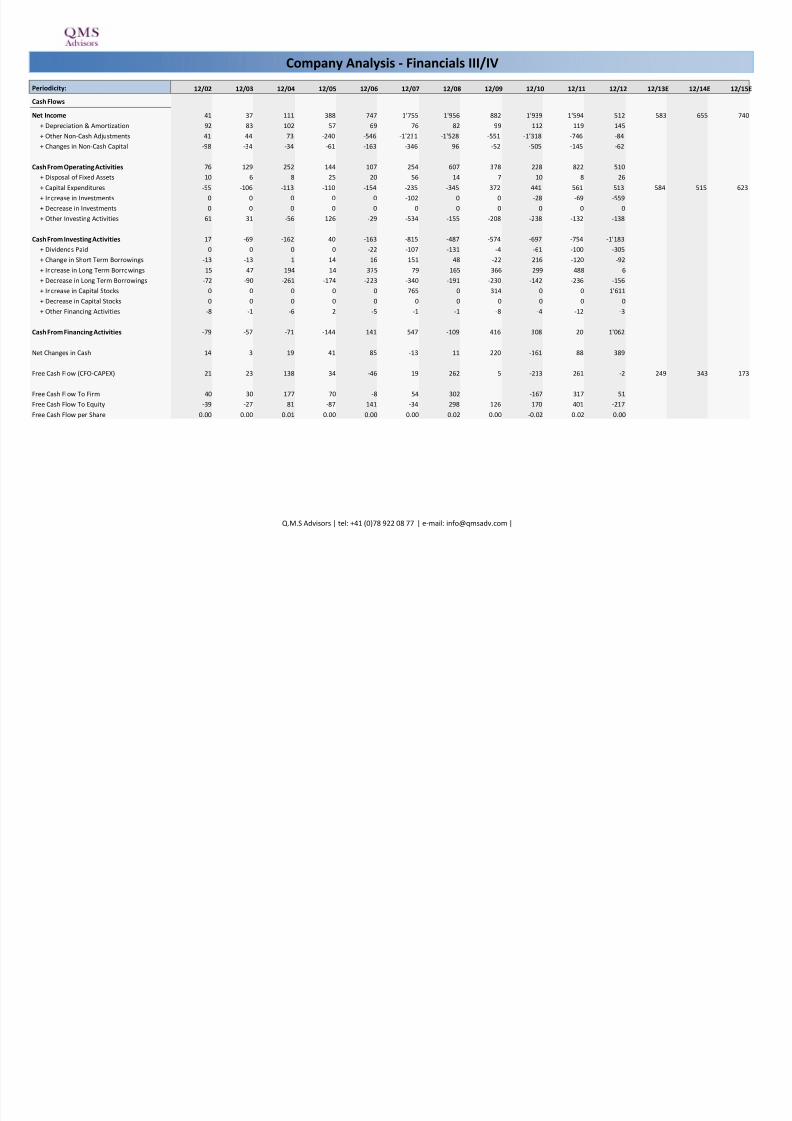
Periodicity: 12/02 12/03 12/04 12/05 12/06 12/07 12/08 12/09 12/10 12/11 12/12 12/13E 12/14E 12/15E
Cash Flows
Net Income 41 37 111 388 747 1'755 1'956 882 1'939 1'594 512 583 655 740
+ Depreciation & Amortization 92 83 102 57 69 76 82 99 112 119 145
+ Other Non-Cash Adjustments 41 44 73 -240 -546 -1'231 -1'528 -551 -1'318 -746 -84+ Changes in Non-Cash Capital -98 -34 -34 -61 -163 -346 96 -52 -505 -145 -62
Cash From Operating Activities 76 129 252 144 107 254 607 378 228 822 510
+ Disposal of Fixed Assets 10 6 8 25 20 56 14 7 10 8 26
+ Capital Expenditures -55 -106 -113 -110 -154 -235 -345 -372 -441 -561 -513 -584 -515 -623
+ Increase in Investments 0 0 0 0 0 -102 0 0 -28 -69 -559
+ Decrease in Investments 0 0 0 0 0 0 0 0 0 0 0
+ Other Investing Activities 61 31 -56 126 -29 -534 -155 -208 -238 -132 -138
Cash From Investing Activities 17 -69 -162 40 -163 -815 -487 -574 -697 -754 -1'183
+ Dividends Paid 0 0 0 0 -22 -107 -131 -4 -61 -100 -305
+ Change in Short Term Borrowings -13 -13 1 14 16 151 48 -22 216 -120 -92
+ Increase in Long Term Borrowings 15 47 194 14 375 79 165 366 299 488 6
+ Decrease in Long Term Borrowings -72 -90 -261 -174 -223 -340 -191 -230 -142 -236 -156
+ Increase in Capital Stocks 0 0 0 0 0 765 0 314 0 0 1'611
+ Decrease in Capital Stocks 0 0 0 0 0 0 0 0 0 0 0
+ Other Financing Activities -8 -1 -6 2 -5 -1 -1 -8 -4 -12 -3
Cash From Financing Activities -79 -57 -71 -144 141 547 -109 416 308 20 1'062
Net Changes in Cash 14 3 19 41 85 -13 11 220 -161 88 389
Free Cash Flow (CFO-CAPEX) 21 23 138 34 -46 19 262 5 -213 261 -2 249 343 173
Free Cash Flow To Firm 40 30 177 70 -8 54 302 -167 317 51
Free Cash Flow To Equity -39 -27 81 -87 141 -34 298 126 170 401 -217
Free Cash Flow per Share 0.00 0.00 0.01 0.00 0.00 0.00 0.02 0.00 -0.02 0.02 0.00
Company Analysis - Financials III/IV
Q.M.S Advisors | tel: +41 (0)78 922 08 77 | e-mail: [email protected] |
7/30/2019 Financial Analysis - Golden Agri-Resources Limited Cultivates, Harvests, Processes, Distributes, And Sells Crude Palm Oil and Palm Kernel. the Company Also Refines Crude Pal…
http://slidepdf.com/reader/full/financial-analysis-golden-agri-resources-limited-cultivates-harvests-processes 7/8
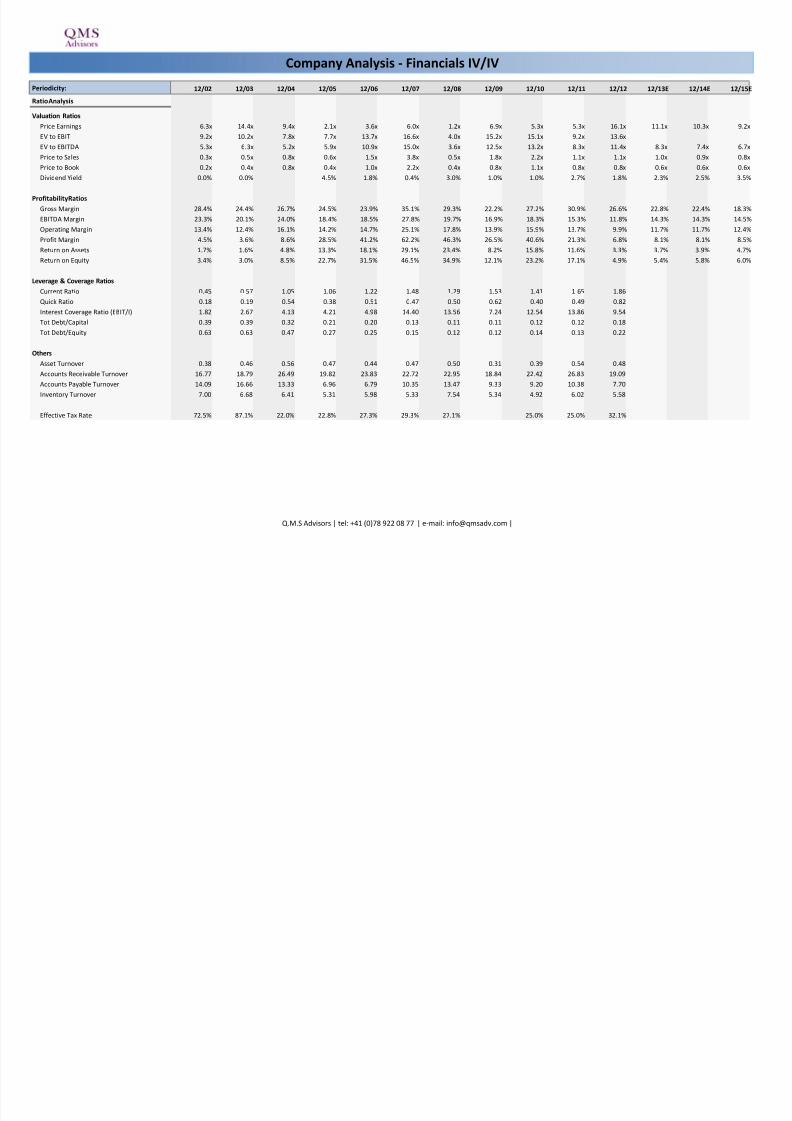
Periodicity: 12/02 12/03 12/04 12/05 12/06 12/07 12/08 12/09 12/10 12/11 12/12 12/13E 12/14E 12/15E
Ratio Analysis
Valuation Ratios
Price Earnings 6.3x 14.4x 9.4x 2.1x 3.6x 6.0x 1.2x 6.9x 5.3x 5.3x 16.1x 11.1x 10.3x 9.2x
EV to EBIT 9.2x 10.2x 7.8x 7.7x 13.7x 16.6x 4.0x 15.2x 15.1x 9.2x 13.6xEV to EBITDA 5.3x 6.3x 5.2x 5.9x 10.9x 15.0x 3.6x 12.5x 13.2x 8.3x 11.4x 8.3x 7.4x 6.7x
Price to Sales 0.3x 0.5x 0.8x 0.6x 1.5x 3.8x 0.5x 1.8x 2.2x 1.1x 1.1x 1.0x 0.9x 0.8x
Price to Book 0.2x 0.4x 0.8x 0.4x 1.0x 2.2x 0.4x 0.8x 1.1x 0.8x 0.8x 0.6x 0.6x 0.6x
Dividend Yield 0.0% 0.0% 4.5% 1.8% 0.4% 3.0% 1.0% 1.0% 2.7% 1.8% 2.3% 2.5% 3.5%
Profitability Ratios
Gross Margin 28.4% 24.4% 26.7% 24.5% 23.9% 35.1% 29.3% 22.2% 27.2% 30.9% 26.6% 22.8% 22.4% 18.3%
EBITDA Margin 23.3% 20.1% 24.0% 18.4% 18.5% 27.8% 19.7% 16.9% 18.3% 15.3% 11.8% 14.3% 14.3% 14.5%
Operating Margin 13.4% 12.4% 16.1% 14.2% 14.7% 25.1% 17.8% 13.9% 15.9% 13.7% 9.9% 11.7% 11.7% 12.4%
Profit Margin 4.5% 3.6% 8.6% 28.5% 41.2% 62.2% 46.3% 26.5% 40.6% 21.3% 6.8% 8.1% 8.1% 8.5%
Return on Assets 1.7% 1.6% 4.8% 13.3% 18.1% 29.1% 23.4% 8.2% 15.8% 11.6% 3.3% 3.7% 3.9% 4.7%
Return on Equity 3.4% 3.0% 8.5% 22.7% 31.5% 46.5% 34.9% 12.1% 23.2% 17.1% 4.9% 5.4% 5.8% 6.0%
Leverage & Coverage Ratios
Current Ratio 0.45 0.57 1.05 1.06 1.22 1.48 1.29 1.53 1.41 1.65 1.86
Quick Ratio 0.18 0.19 0.54 0.38 0.51 0.47 0.50 0.62 0.40 0.49 0.82
Interest Coverage Ratio (EBIT/I) 1.82 2.67 4.13 4.21 4.98 14.40 13.56 7.24 12.54 13.86 9.54
Tot Debt/Capital 0.39 0.39 0.32 0.21 0.20 0.13 0.11 0.11 0.12 0.12 0.18
Tot Debt/Equity 0.63 0.63 0.47 0.27 0.25 0.15 0.12 0.12 0.14 0.13 0.22
Others
Asset Turnover 0.38 0.46 0.56 0.47 0.44 0.47 0.50 0.31 0.39 0.54 0.48
Accounts Receivable Turnover 16.77 18.79 26.49 19.82 23.83 22.72 22.95 18.84 22.42 26.83 19.09
Accounts Payable Turnover 14.09 16.66 13.33 6.96 6.79 10.35 13.47 9.33 9.20 10.38 7.70
Inventory Turnover 7.00 6.68 6.41 5.31 5.98 5.33 7.54 5.34 4.92 6.02 5.58
Effective Tax Rate 72.5% 87.1% 22.0% 22.8% 27.3% 29.3% 27.1% 25.0% 25.0% 32.1%
Company Analysis - Financials IV/IV
Q.M.S Advisors | tel: +41 (0)78 922 08 77 | e-mail: [email protected] |
7/30/2019 Financial Analysis - Golden Agri-Resources Limited Cultivates, Harvests, Processes, Distributes, And Sells Crude Palm Oil and Palm Kernel. the Company Also Refines Crude Pal…
http://slidepdf.com/reader/full/financial-analysis-golden-agri-resources-limited-cultivates-harvests-processes 8/8
GOLDEN AGRI-
RESO
WILMAR
INTERNATI
GENTING
PLANTATI
INDOFOOD AGRI
RE
KUALA LUMPUR
KEPIOI CORP BHD
OLAM
INTERNATIONASTRA AGRO LEST
PP LONDON
SUMATRFIRST RESOURCES
HAP SENG
PLANTAT
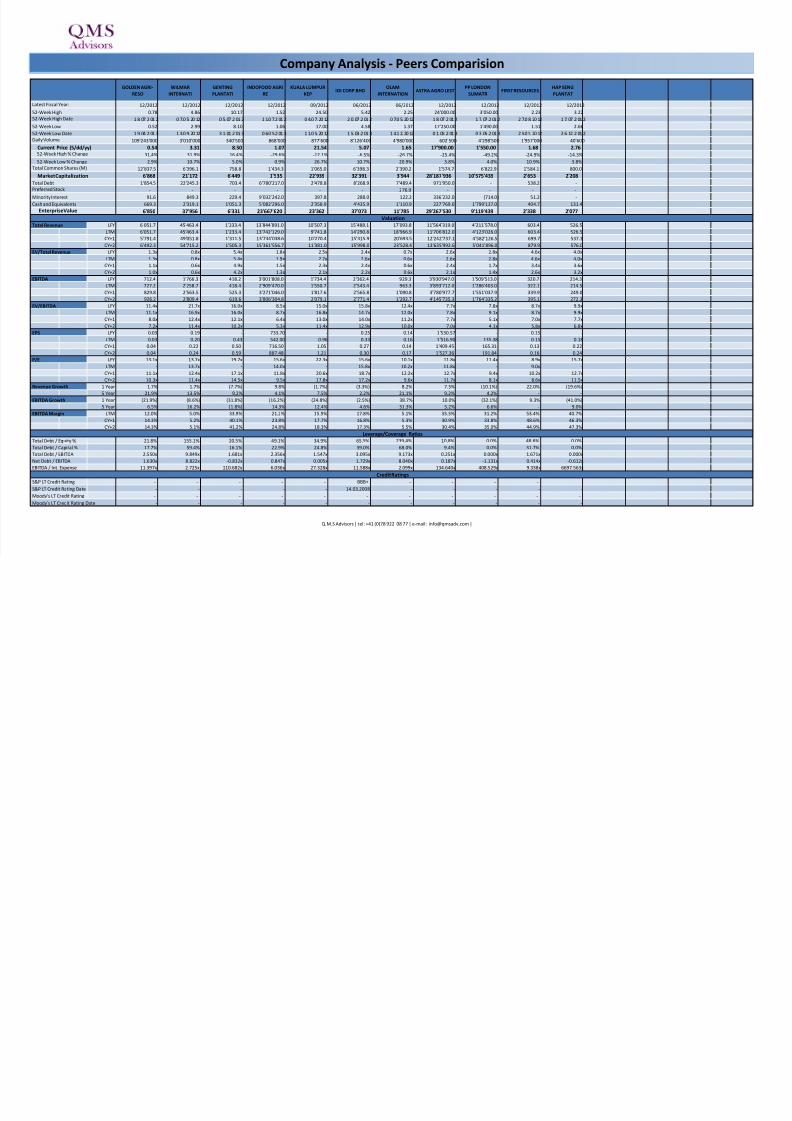
12/2012 12/2012 12/2012 12/2012 09/2012 06/2012 06/2012 12/2012 12/2012 12/2012 12/2012
0.78 4.86 10.17 1.52 24.50 5.42 2.25 24'000.00 3'050.00 2.23 3.22
1 8. 07 .2 01 2 0 7.0 5. 20 12 0 5. 07 .2 01 2 1 1.0 7.2 01 2 0 4.0 7. 20 12 2 0. 07 .2 01 2 0 7.0 5. 20 12 1 8. 07 .2 01 2 1 7. 07 .2 01 2 2 7.0 8. 20 12 1 7. 07 .2 01 2
0.52 2.99 8.10 1.06 17.00 4.58 1.37 17'250.00 1'490.00 1.51 2.66
1 9. 04 .2 01 3 1 3.0 9. 20 12 3 1. 01 .2 01 3 0 6.0 5.2 01 3 1 1.0 5. 20 12 1 5. 03 .2 01 3 1 4.1 2. 20 12 0 1. 05 .2 01 3 0 3. 05 .2 01 3 2 5.0 5. 20 12 2 6. 12 .2 01 2
109'243'000 3'010'000 340'500 868'000 877'600 8'126'400 4'980'000 602'500 4'298'500 1'957'000 40'600
0.54 3.31 8.50 1.07 21.54 5.07 1.65 17'900.00 1'550.00 1.68 2.76
-31.4% -31.9% -16.4% -29.6% -12.1% -6.5% -26.7% -25.4% -49.2% -24.9% -14.3%
2.9% 10.7% 5.0% 0.9% 26.7% 10.7% 20.9% 3.8% 4.0% 10.9% 3.8%
12'837.5 6'396.1 758.8 1'434.3 1'065.0 6'398.3 2'390.2 1'574.7 6'822.9 1'584.1 800.0
6'868 21'172 6'449 1'535 22'939 32'391 3'944 28'187'936 10'575'439 2'653 2'208
1'854.5 22'245.3 703.4 6'780'217.0 2'478.8 8'268.9 7'489.4 971'950.0 - 538.2 -
- - - - - - 276.9 - - - -
91.6 849.3 229.4 9'032'242.0 397.8 288.0 122.2 336'232.0 (714.0) 51.2 -
669.3 2'319.1 1'051.3 5'082'296.0 2'358.9 4'435.9 1'110.9 227'769.0 1'799'137.0 404.7 131.4
6'850 37'956 6'331 23'667'620 23'362 37'073 11'785 29'267'530 9'119'439 2'338 2'077
LFY 6'051.7 45'463.4 1'233.4 13'844'891.0 10'507.3 15'488.1 17'093.8 11'564'319.0 4'211'578.0 603.4 526.5
LTM 6'051.7 45'463.4 1'233.4 13'742'129.0 9'741.8 14'290.8 18'966.9 11'706'812.0 4'123'026.0 603.4 526.5
CY+1 5'791.4 49'051.8 1'311.5 13'734'038.6 10'270.4 15'315.9 20'693.5 12'242'737.1 4'582'126.5 699.7 537.3
CY+2 6'492.3 54'715.2 1'505.3 15'361'556.7 11'381.0 15'998.0 23'528.4 13'635'992.6 5'041'896.0 879.9 576.0
LFY 1.3x 0.8x 5.4x 1.8x 2.5x 2.4x 0.7x 2.6x 2.8x 4.6x 4.0x
LTM 1.3x 0.8x 5.4x 1.9x 2.7x 2.6x 0.6x 2.6x 2.8x 4.6x 4.0x
CY+1 1.1x 0.6x 4.9x 1.5x 2.3x 2.4x 0.6x 2.4x 1.7x 3.4x 3.6x
CY+2 1.0x 0.6x 4.2x 1.3x 2.1x 2.2x 0.6x 2.1x 1.4x 2.6x 3.2x
LFY 712.4 1'766.3 418.2 3'001'808.0 1'734.4 2'362.4 929.3 3'930'947.0 1'509'513.0 320.7 214.3
LTM 727.2 2'258.7 418.4 2'909'470.0 1'550.7 2'543.4 963.3 3'893'712.0 1'286'403.0 322.1 214.5
CY+1 829.8 2'563.5 525.3 3'271'046.0 1'817.6 2'565.8 1'090.8 3'780'977.7 1'551'037.9 339.9 249.0
CY+2 926.2 2'809.4 619.6 3'806'304.8 2'079.1 2'771.4 1'292.7 4'145'735.3 1'764'335.2 395.1 272.3
LFY 11.4x 21.7x 16.0x 8.5x 15.0x 15.8x 12.4x 7.7x 7.8x 8.7x 9.9x
LTM 11.1x 16.9x 16.0x 8.7x 16.8x 14.7x 12.0x 7.8x 9.1x 8.7x 9.9x
CY+1 8.0x 12.4x 12.1x 6.4x 13.0x 14.0x 11.2x 7.7x 5.1x 7.0x 7.7x
CY+2 7.2x 11.4x 10.2x 5.3x 11.4x 12.9x 10.0x 7.0x 4.1x 5.8x 6.8x
LFY 0.03 0.19 - 733.70 - 0.25 0.14 1'530.57 - 0.15 -
LTM 0.03 0.20 0.43 542.00 0.96 0.33 0.16 1'516.90 135.38 0.15 0.18
CY+1 0.04 0.22 0.50 716.50 1.05 0.27 0.14 1'409.45 165.31 0.13 0.22
CY+2 0.04 0.24 0.59 887.48 1.21 0.30 0.17 1'527.36 191.84 0.16 0.24
LFY 13.1x 13.7x 19.7x 15.6x 22.3x 15.6x 10.1x 11.8x 11.4x 8.9x 15.7x
LTM - 13.7x - 14.0x - 15.8x 10.2x 11.8x - 9.0x -
CY+1 11.1x 12.4x 17.1x 11.8x 20.6x 18.7x 12.2x 12.7x 9.4x 10.2x 12.7x
CY+2 10.3x 11.4x 14.5x 9.5x 17.8x 17.2x 9.6x 11.7x 8.1x 8.6x 11.5x
1 Year 1.7% 1.7% (7.7%) 9.8% (1.7%) (3.3%) 8.2% 7.3% (10.1%) 22.0% (19.6%)
5 Year 21.9% 13.5% 9.2% 4.1% 7.5% 2.2% 21.1% 9.2% 4.2% - -
1 Year (21.9%) (8.6%) (31.8%) (16.2%) (24.8%) (2.5%) 38.7% 10.0% (32.1%) 9.3% (41.0%)
5 Year 6.5% 16.2% (1.8%) 14.3% 12.4% 4.6% 31.3% 5.2% 6.6% - 9.0%
LTM 12.0% 5.0% 33.9% 21.2% 15.9% 17.8% 5.1% 33.3% 31.2% 53.4% 40.7%CY+1 14.3% 5.2% 40.1% 23.8% 17.7% 16.8% 5.3% 30.9% 33.8% 48.6% 46.3%
CY+2 14.3% 5.1% 41.2% 24.8% 18.3% 17.3% 5.5% 30.4% 35.0% 44.9% 47.3%
Total Debt / Equity % 21.8% 155.1% 20.5% 49.1% 34.9% 65.5% 239.4% 10.8% 0.0% 48.6% 0.0%
Total Debt / Capital % 17.7% 59.4% 16.1% 22.9% 24.8% 39.0% 68.0% 9.4% 0.0% 31.7% 0.0%
Total Debt / EBITDA 2.550x 9.849x 1.681x 2.356x 1.547x 3.095x 9.173x 0.251x 0.000x 1.671x 0.000x
Net Debt / EBITDA 1.630x 8.822x -0.832x 0.847x 0.005x 1.729x 8.040x 0.187x -1.131x 0.414x -0.612x
EBITDA / Int. Expense 11.397x 2.725x 110.682x 6.036x 27.328x 11.588x 2.099x 134.640x 408.529x 9.338x 6697.563x
S&P LT Credit Rating - - - - - BBB+ - - - - -
S&P LT Credit Rating Date - - - - - 14.03.2008 - - - - -
Moody's LT Credit Rating - - - - - - - - - - -
Moody's LT Credit Rating Date - - - - - - - - - - -
52-Week High Date
52-Week Low
Latest Fiscal Year:
52-Week High
Total Debt
Market Capitalization
Daily Volume
52-Week Low % Change
Current Price (5/dd/yy)52-Week High % Change
Cash and Equivalents
EBITDA
EV/EBITDA
Enterprise Value
Valuation
Preferred Stock
52-Week Low Date
Minority Interest
Total Common Shares (M)
P/E
Revenue Growth
Total Revenue
EV/Total Revenue
EPS
EBITDA Growth
EBITDA Margin
Credit Ratings
Leverage/Coverage Ratios
Company Analysis - Peers Comparision
Q.M.S Advisors | tel: +41 (0)78 922 08 77 | e-mail: [email protected] |