Embed Size (px)
Citation preview

8/8/2019 Financial Analysis Raw Info First Copy
http://slidepdf.com/reader/full/financial-analysis-raw-info-first-copy 1/38
INTRODUCTION
Finance is regarded as “THE LIFE BLOOD OF BUSINESS
ENTERPRISE”. Finance function has become so important that it has given
birth to financial management as a separate subject. So, this subject is
acquiring universal applicability. Financial Management is that managerial
activity which is concerned with the planning and controlling of the firm’s
financial resources. As a separate activity or discipline is of recent origin it
was a branch of economics till 1890. Still today it has no unique knowledge
of its own, and it draws heavily on economy for its theoretical concepts.
The subject of financial management is of immense interest to both
academicians and practicing managers. It is of great interest to
academicians because the subject is still developing, and there are still
certain areas where controversies exist for which no unanimous solutions
have been reached as yet. Practicing Managers are interested in this subject
because among the most crucial decisions of the firm are those which relate
8/8/2019 Financial Analysis Raw Info First Copy
http://slidepdf.com/reader/full/financial-analysis-raw-info-first-copy 2/38
to finance and an understanding of the theory of financial management
provides them with conceptual and analytical insights.
Scope of Finance Management:
Firms create manufacturing capacities for production for goods; some
provide services to customers. They sell their goods or services to earn
profits. They raise funds to acquire manufacturing and other facilities.
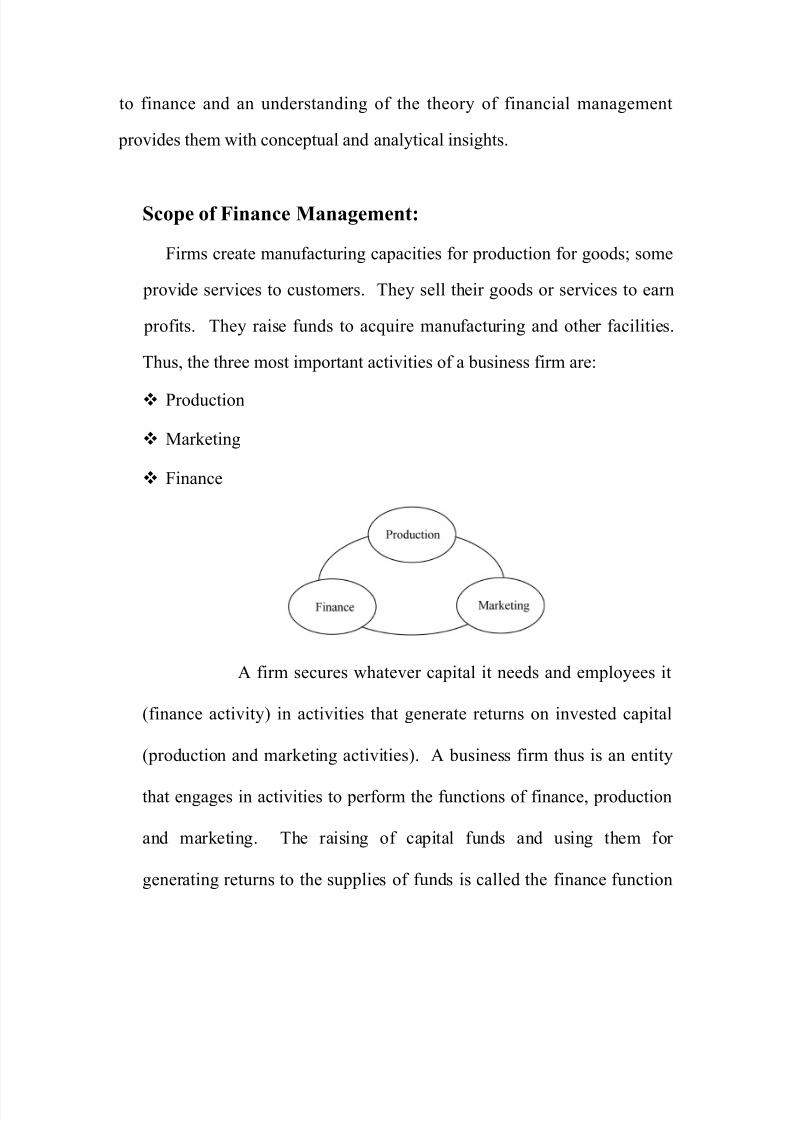
Thus, the three most important activities of a business firm are:
Production
Marketing
Finance
A firm secures whatever capital it needs and employees it
(finance activity) in activities that generate returns on invested capital
(production and marketing activities). A business firm thus is an entity
that engages in activities to perform the functions of finance, production
and marketing. The raising of capital funds and using them for
generating returns to the supplies of funds is called the finance function
8/8/2019 Financial Analysis Raw Info First Copy
http://slidepdf.com/reader/full/financial-analysis-raw-info-first-copy 3/38
of the firm.
FUNCTION OF FINANCIAL MANAGEMENT
Two significant contribution to the development of modern theory of
financial management are:
Theory of Portfolio Management developed by Harry Markowitz in
1950, which deals with portfolio selection with risky investment. This
theory uses statistical concepts to quantify the risk-return
characteristics of holding a group/portfolio of securities, investment or
assets.
The theory of Leverage and Valuation of Fire developed by
Modigliani and Miller in 1958. They have shown by introducing
analytical approach as to how the financial decision making in any
firm be oriented towards maximization of the value of the firm and the
maximization of the shareholders wealth.
Type of Financial Actions:
1. The Financial Management of trading or manufacturing firms
2. Financial Management of Financial Institutions.
8/8/2019 Financial Analysis Raw Info First Copy
http://slidepdf.com/reader/full/financial-analysis-raw-info-first-copy 4/38
3. Financial activities relating to investment activities.
International Finance:
Public Finance:
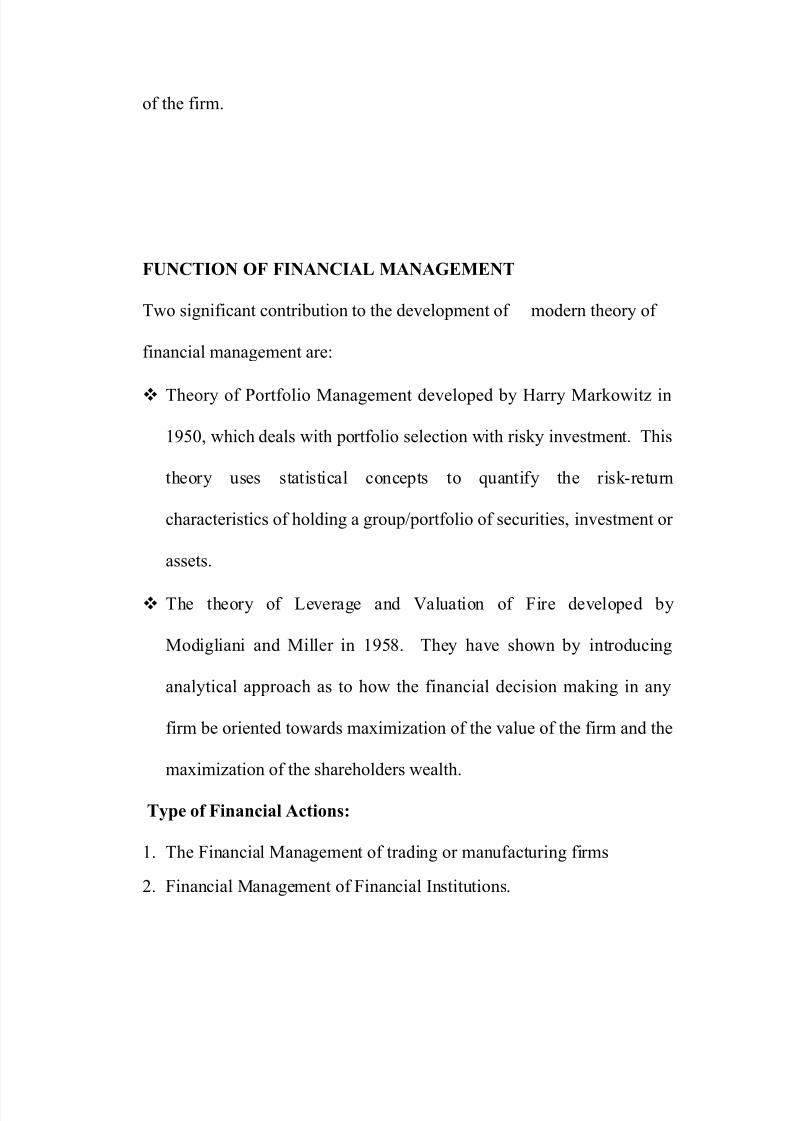
Functions are broadly classified into three groups. Those relating to
resource allocation, those covering the financing of these investments and
theses determining how much cash are taken out and how much reinvested.
• Investment decision
• Financing decision
• Dividend decision
• Liquidity decision
I) Investment Decision:
Firms have scarce resources that must be allocated among competitive uses.
The financial management provides a frame work for firms to take these
8/8/2019 Financial Analysis Raw Info First Copy
http://slidepdf.com/reader/full/financial-analysis-raw-info-first-copy 5/38
decisions wisely. The investment decisions include not only those that
create revenues and profits (e.g. introducing a new product line) but also
those that save money.
So, the investment decisions are the decisions relating to assets composition
of the firm. Assets can be classified into fixed assets and current assets, and
therefore the investment decisions can also be bifurcated into Capital
Budgeting decisions and the Working Capital Management.
The Capital Budgeting decisions are more crucial for
any firm. A finance manager may be asked to decide about.
1. Which asset should be purchased out of different alternative options;
2. To buy an asset or to get it on lease;
3. To produce a part of the final product or to procure it from some other
supplier;
4. To by or not an other firm as a running concern;
5. Proposal of merger of other group firms to avail the synergies of consolidation.
Working Capital Management, on the other hand, deals with the
Management of current assets of the firm. Though the current assets do not
contribute directly to the earnings, yet their existence is necessitated for the
proper, efficient and optimum utilization of fixed assets. There are dangers
of both the excessive working capital as well as the shortage of working
capital. A finance manager has to ensure sufficient and adequate working
capital to the firm.
8/8/2019 Financial Analysis Raw Info First Copy
http://slidepdf.com/reader/full/financial-analysis-raw-info-first-copy 6/38
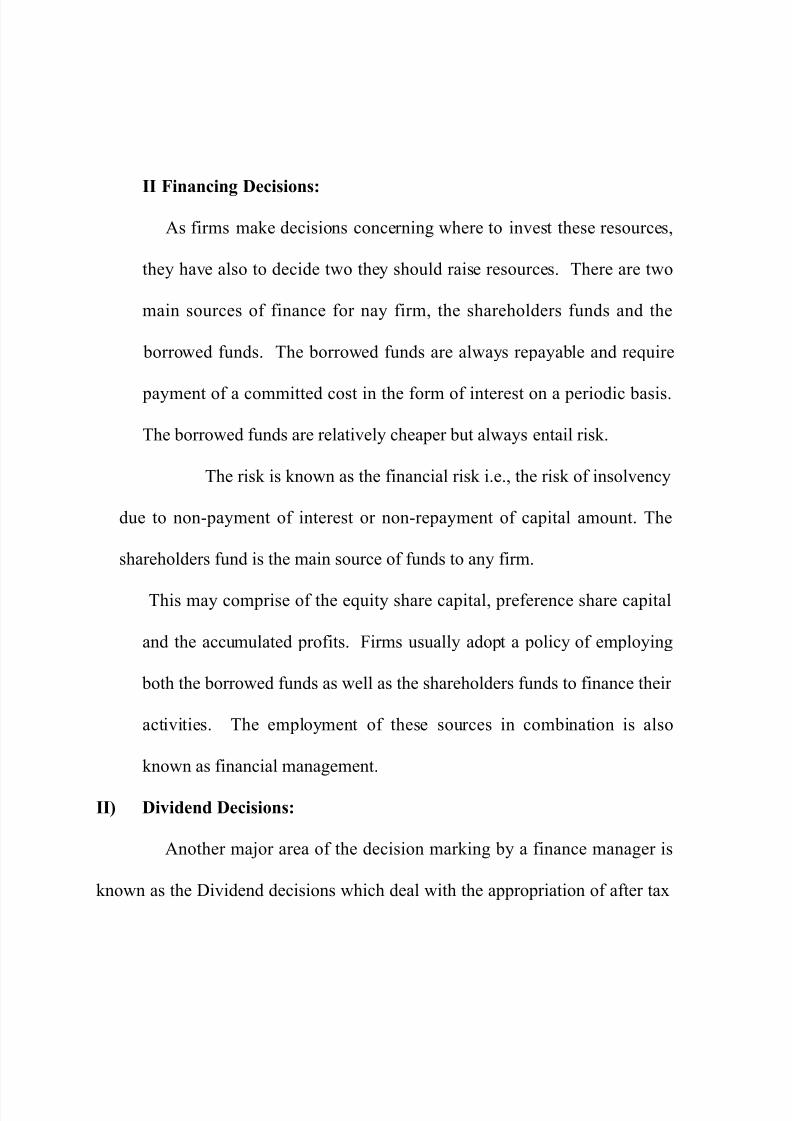
II Financing Decisions:
As firms make decisions concerning where to invest these resources,
they have also to decide two they should raise resources. There are two
main sources of finance for nay firm, the shareholders funds and the
borrowed funds. The borrowed funds are always repayable and require
payment of a committed cost in the form of interest on a periodic basis.
The borrowed funds are relatively cheaper but always entail risk.
The risk is known as the financial risk i.e., the risk of insolvency
due to non-payment of interest or non-repayment of capital amount. The
shareholders fund is the main source of funds to any firm.
This may comprise of the equity share capital, preference share capital
and the accumulated profits. Firms usually adopt a policy of employing
both the borrowed funds as well as the shareholders funds to finance their
activities. The employment of these sources in combination is also
known as financial management.
II) Dividend Decisions:
Another major area of the decision marking by a finance manager is
known as the Dividend decisions which deal with the appropriation of after tax
8/8/2019 Financial Analysis Raw Info First Copy
http://slidepdf.com/reader/full/financial-analysis-raw-info-first-copy 7/38
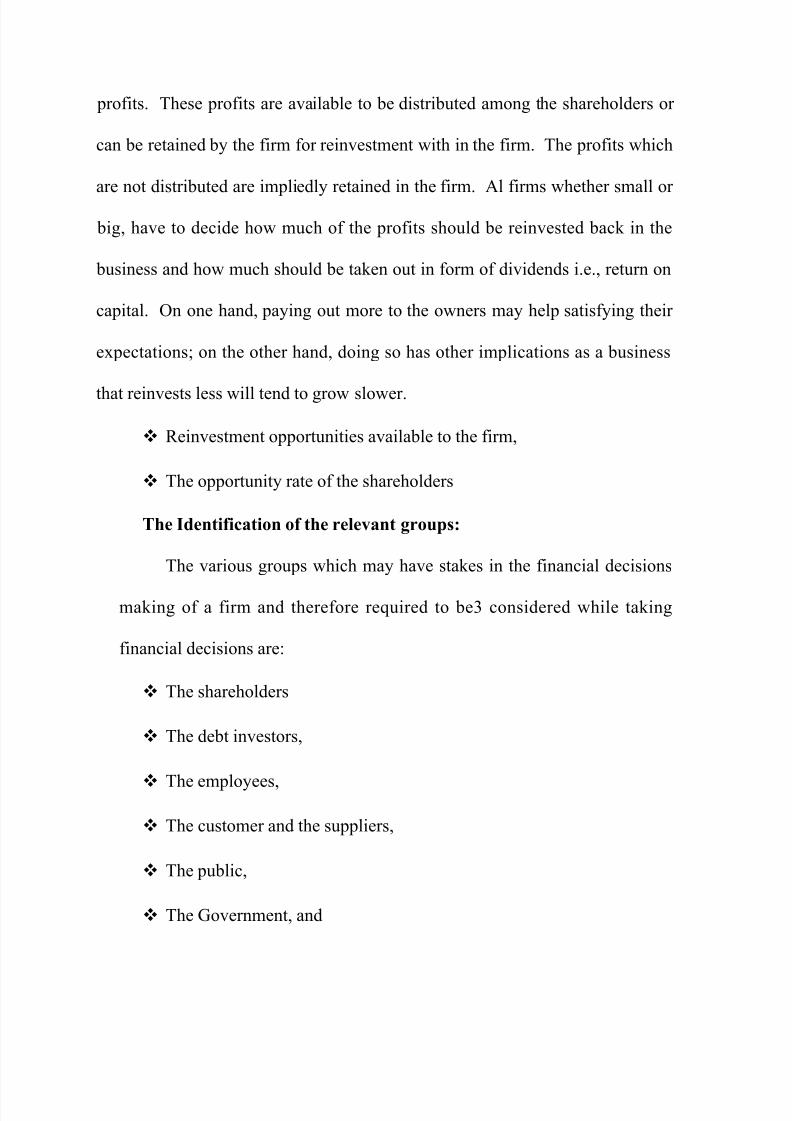
profits. These profits are available to be distributed among the shareholders or
can be retained by the firm for reinvestment with in the firm. The profits which
are not distributed are impliedly retained in the firm. Al firms whether small or
big, have to decide how much of the profits should be reinvested back in the
business and how much should be taken out in form of dividends i.e., return on
capital. On one hand, paying out more to the owners may help satisfying their
expectations; on the other hand, doing so has other implications as a business
that reinvests less will tend to grow slower.
Reinvestment opportunities available to the firm,
The opportunity rate of the shareholders
The Identification of the relevant groups:
The various groups which may have stakes in the financial decisions
making of a firm and therefore required to be3 considered while taking
financial decisions are:
The shareholders
The debt investors,
The employees,
The customer and the suppliers,
The public,
The Government, and
8/8/2019 Financial Analysis Raw Info First Copy
http://slidepdf.com/reader/full/financial-analysis-raw-info-first-copy 8/38
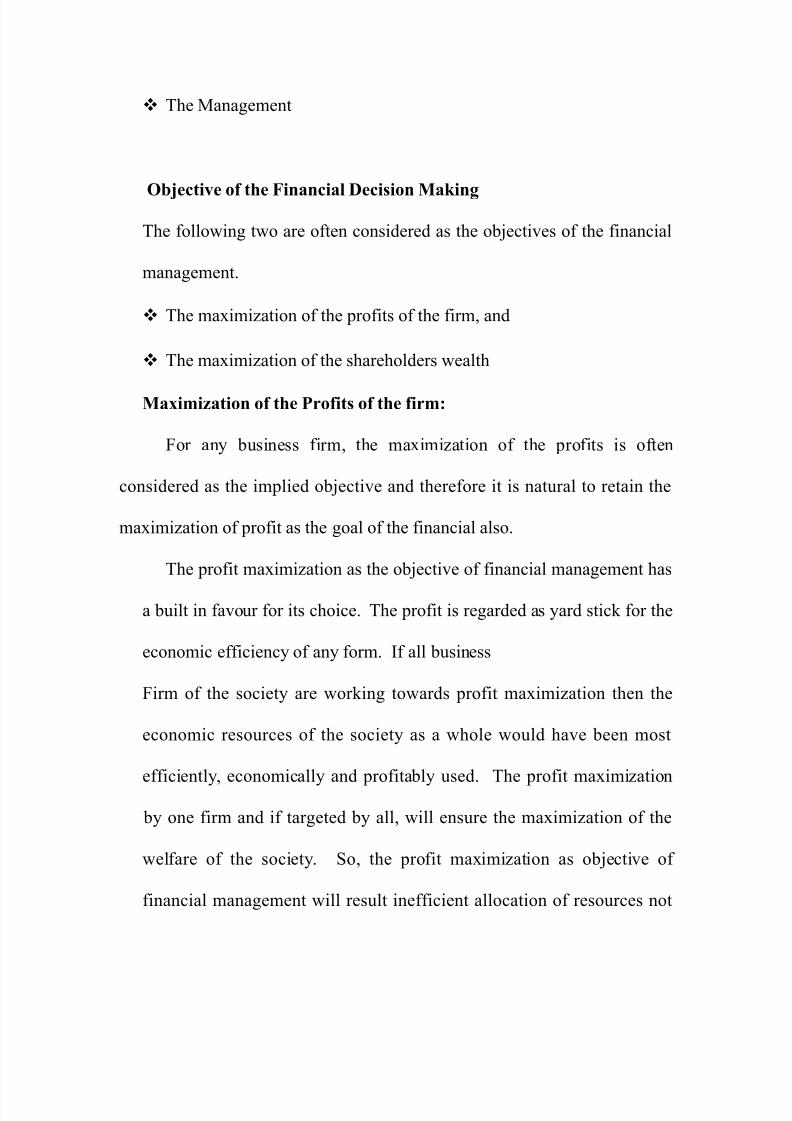
The Management
Objective of the Financial Decision Making
The following two are often considered as the objectives of the financial
management.
The maximization of the profits of the firm, and
The maximization of the shareholders wealth
Maximization of the Profits of the firm:
For any business firm, the maximization of the profits is often
considered as the implied objective and therefore it is natural to retain the
maximization of profit as the goal of the financial also.
The profit maximization as the objective of financial management has
a built in favour for its choice. The profit is regarded as yard stick for the
economic efficiency of any form. If all business
Firm of the society are working towards profit maximization then the
economic resources of the society as a whole would have been most
efficiently, economically and profitably used. The profit maximization
by one firm and if targeted by all, will ensure the maximization of the
welfare of the society. So, the profit maximization as objective of
financial management will result inefficient allocation of resources not
8/8/2019 Financial Analysis Raw Info First Copy
http://slidepdf.com/reader/full/financial-analysis-raw-info-first-copy 9/38
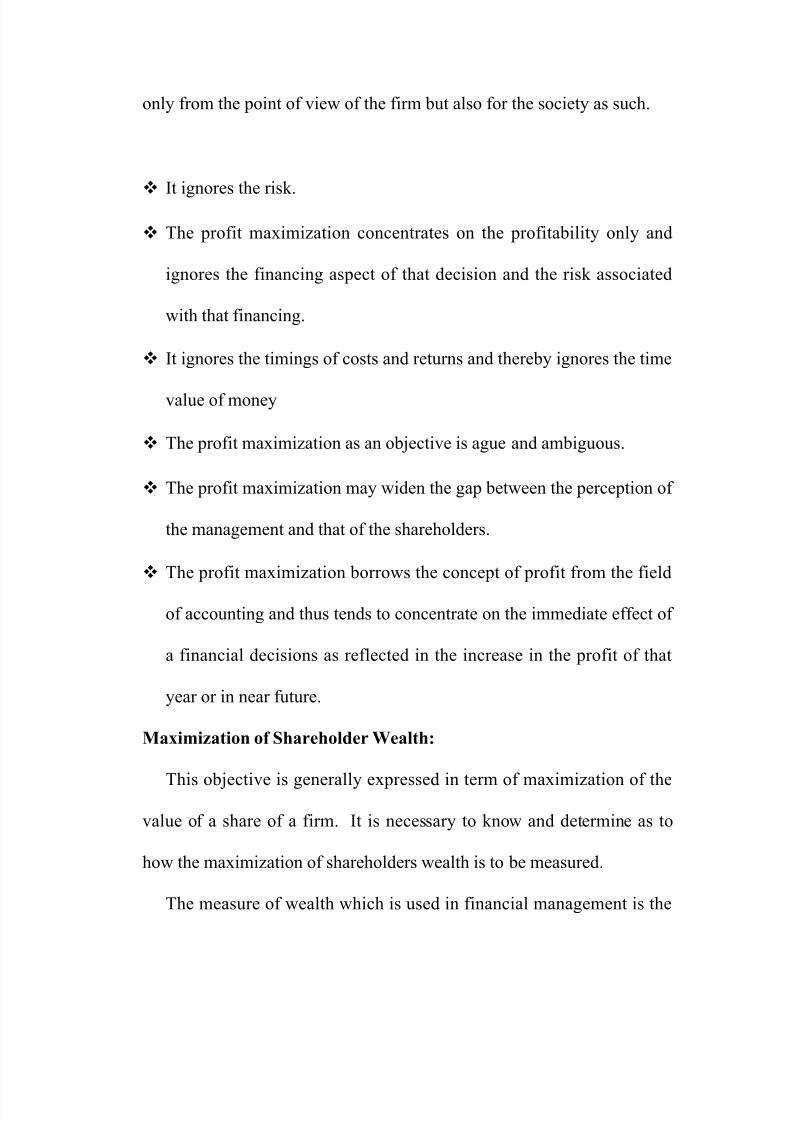
only from the point of view of the firm but also for the society as such.
It ignores the risk.
The profit maximization concentrates on the profitability only and
ignores the financing aspect of that decision and the risk associated
with that financing.
It ignores the timings of costs and returns and thereby ignores the time
value of money
The profit maximization as an objective is ague and ambiguous.
The profit maximization may widen the gap between the perception of
the management and that of the shareholders.
The profit maximization borrows the concept of profit from the field
of accounting and thus tends to concentrate on the immediate effect of
a financial decisions as reflected in the increase in the profit of that
year or in near future.
Maximization of Shareholder Wealth:
This objective is generally expressed in term of maximization of the
value of a share of a firm. It is necessary to know and determine as to
how the maximization of shareholders wealth is to be measured.
The measure of wealth which is used in financial management is the
8/8/2019 Financial Analysis Raw Info First Copy
http://slidepdf.com/reader/full/financial-analysis-raw-info-first-copy 10/38
concept of economic value. The economic value is defined as the present
value of the future cash flows generated by a decision, discounted as
appropriate rate of discount which reflects the degree of associated risk.
This measure of economic value is based on cash flows rather than profit.
The economic value concept is objective in its approach and also takes
into account the timing of cash flows and the level of risk through the
discounting process.
Profit Maximization Versus Wealth Maximization:
The objective of profit maximization measures the performance of a
firm by a looking at its total profit. The objective of maximization of the
shareholders wealth is operational and objective in its approach. A firm
that wishes to maximize the profits may opt to pay no dividend and to
reinvest the retained earnings, whereas a firm that wishes to maximize
the shareholders wealth may pay regular dividends.
THE CHANGING ROLE OF FINANCIAL MANAGEMENT:
Many changes in the contemporary world, financial management has
undergone significant changes over the years. The financial management
has a very limited role in business enterprise. Finance Manger is
responsible only for maintaining financial records, preparing reports of
the company’s status, performance and arranging funds recorded by
8/8/2019 Financial Analysis Raw Info First Copy
http://slidepdf.com/reader/full/financial-analysis-raw-info-first-copy 11/38
8/8/2019 Financial Analysis Raw Info First Copy
http://slidepdf.com/reader/full/financial-analysis-raw-info-first-copy 12/38
IMPORTANCE OF FINANCIAL MANGEMENT:
Finance Management is of greater importance on the present
corporate world. It is a science of money, which permits the authorizes
to go further.
SIGNIFICANCE OF FINANCIAL MANAGEMENT CAN BE
SUMMARISED AS:
It assists in the assessment of financial needs of industry large or
small and indicates the internal and external resources for meeting them.
It assesses the efficiency and effectiveness of the financial institution in
mobilizing individual or corporate science. It also prescribes various
means for such mobilization of savings into desirable investment
channels.
It assists the management while investing the funds in profitable
projects by analyzing the viability of that project through capital
budgeting techniques. It permits the management to safeguard against
the interest of shareholders by properly utilizing the funds procured from
different sources and it also regulates and controls the funds to get
maximize use.
8/8/2019 Financial Analysis Raw Info First Copy
http://slidepdf.com/reader/full/financial-analysis-raw-info-first-copy 13/38
METHODOLOGY OF THE STUDY
This study is made through two sources.
1. Primary Data:
The primary data comprises information collected during discussions with
Head of finance Department and from the meeting with staff.
2. Secondary Data:
The secondary data has been collected from information through
Annual Reports, Public Report, Bulletins and other Printed Materials
supplied by the Company.
methods
primary secondary

8/8/2019 Financial Analysis Raw Info First Copy
http://slidepdf.com/reader/full/financial-analysis-raw-info-first-copy 14/38
Chap -- 3
8/8/2019 Financial Analysis Raw Info First Copy
http://slidepdf.com/reader/full/financial-analysis-raw-info-first-copy 15/38
NATURE OF RATIOS
Ratio analysis is a widely used tool of finance analysis. The
term ratio in it refers to the relation ship expressed in mathematical terms between individual figures of group of figures connected with each other in
some logical manner and are selected from financial statements of the
concern. The ratio analysis is based on the fact that a single accounting
figure by itself may not communicate any meaningful information but
when expressed as a relative to some other figure, it may definitely provide
some significant information. The relation between two or more
accounting figures/groups is called a FINANCIAL RATIO. A financial
ratio helps to express the relationship between two accounting figures in
such a way that users can draw conclusions about the performance,
strengths and weakness of a firm.
STANDARDS OF COMPARISON:
The ratio analysis involves comparison for a useful interpretation of the
financial statements. A single ratio in itself does not indicate favorable
or unfavorable condition. It should be compared with some standard.Standards of comparison may consist of:
Past ratios, i.e. ratios calculated from the financial statements of the same
firm.
Competitors ratios i.e. ratios of some selected firms, especially the most
8/8/2019 Financial Analysis Raw Info First Copy
http://slidepdf.com/reader/full/financial-analysis-raw-info-first-copy 16/38
progressive and successful competitor, at the same in time.
Industry ratios i.e. ratios of the industry to which the firm belongs.
ADVANTGAGES OF RATIOS
Useful for evaluating performance in terms of profitability and
financial stability
Useful for intra and inter firm comparison.
Useful forecasting and budgeting.
It is just in a tabular form over a period of years indicates the trendof the business.
Simple to understand rather than the reading but the figures of
financial statement.
Key tool in the hand of modern financial management.
Enables outside parties to assess the strength and weakness of the
firm.
Ratio analysis is very useful for raking management decision and
also highlights the performance in the area of profitability, financial
stability and operational efficiency.
LIMITATIONS OF FINANCIAL RATIOS
The ratio analysis is widely used of technique to evaluate the
financial position and performance of business. But there are certain
problems in using ratios. The analyst should be aware of these
problems. The following are some of the limitations the ratio
analysis.
8/8/2019 Financial Analysis Raw Info First Copy
http://slidepdf.com/reader/full/financial-analysis-raw-info-first-copy 17/38
It is difficult to decide on the proper basis of comparison.
The comparison is rendered difficult because of differences in
situations of two companies or of one company over years.
The price level changes make the interpretations of ratios invalid.
The difference in the definitions of items in the balance sheet and
the profit and loss statement make the interpretation of ratios
difficult.
The ratios calculated at a point of time are less informative and
defective as they suffer from short term changes.
Difference in accounting policies and accounting period make theaccounting data of two firms non-comparable as also the accounting
ratios.
It is very difficult to generalize whether a particular ratio is good or
bad. For example, a low current ratio may be said “bad” from the
point of view of low liquidity, but a high current ratio may not be
“good” as this may result from inefficient working capital
management.
Several ratios, calculated from the accounting date, can be grouped
into various classes according to financial activity or function to be
evaluated. As stated earlier, the parties interested in financial analysis are
short and long-term creditors, owners and management.
“Short-term creditors” main interest is in the liquidity position or the
short-term solvency of the firm. Long-term creditors, on the other hand, and
more interested in the long-term solvency and profitability of the firm.
Similarly, owners concentrate on the firms profitability and financial
condition. Management is interested on in evaluating every aspect of the
8/8/2019 Financial Analysis Raw Info First Copy
http://slidepdf.com/reader/full/financial-analysis-raw-info-first-copy 18/38
firms performance. They have to protect the interests of all parties and see
that the firm grows profitably. In view of the requirements of the various
users of ratios, we may classify them into the following four important
categories.
Types of Ratio:
Liquidity Ratios
Leverage Ratios
Activity Ratios
Profitability Ratios
I) Liquidity Ratio:
The liquidity refers to the maintenance of cash, bank balance
and those assets, which are easily convertible into cash in order to
meet the liabilities as and when arising. So, the liquidity ratios study
the firm’s short-term solvency and its ability to pay off the liabilities.
Current Ratio:
Current ratio is the ratio of current assets and current liabilities.Current assets are assets which can be covered into cash within one
year and include
cash in hand and at bank, bills receivable, net sundry debtors, stock of
raw materials, finished goods and work in progress, prepaid expenses,
outstanding and occurred incomes, and short term or temporary
investments.
Current liabilities are liabilities, which are to be repaid within a periodof 1 year and include Bills payable, Sundry Creditors, Bank
Overdraft, Outstanding Expenses, Incomes received in advanced,
proposed dividend, provision for taxation, unclaimed dividends and
short term loans and advances repayable within 1 year.
8/8/2019 Financial Analysis Raw Info First Copy
http://slidepdf.com/reader/full/financial-analysis-raw-info-first-copy 19/38
Current Assets
Current Ratio= -----------------------------------
Current Liabilities
A Current ratio of 2:1 is considered as ideal: if a business has an
undertaking with its bankers to meet its working capital requirements
short notices, a current ratio of is adequate.
Quick Ratio :
Quick Assets
Quick Ratio = ----------------------------------------
Quick Liabilities
A quick ratio of 1 is considered as ideal. A quick ratio of less than 1is indicative of inadequate liquidity of the business. A very high quick
ratio is also not available, as funds can be more profitably employed.
Absolute Liquid Ratio
It is the ratio of Absolute Liquid Assets to Quick Liabilities.
However, for calculation purposes, it is taken as ratio of Absolute
Liquid Assets of Current Liabilities. Trade investment or Marketable
securities are equivalent of cash therefore, they may be included in thecomputation of absolute liquid ratio.
Absolute Liquid Assets
8/8/2019 Financial Analysis Raw Info First Copy
http://slidepdf.com/reader/full/financial-analysis-raw-info-first-copy 20/38
Absolute Quick Ratio = -------------------------------------
Current Liabilities
II) Leverage Ratios:
Leverage ratios indicate the relative interest of owners and creditors in a
business. It shows the proportions of debt and equity in financing the firm’s
assets the long-term solvency of a firm can be examined by using leverage
ratios. The long-term creditors like debenture holders, financial institutions
etc., are more concerned with the firms long-term financial strength.
There are two aspects of the long-term solvency of a firm ability to repay the principal when due, and regular payment of the interest they leverage ratio
are calculated to measure the financial rest and firms abilities of using debt.
TOTAL DEBT RATIO:
Total debt will include short and long-term borrowings from financial
institutions debentures bonds. Capital employed will include total debt
and net worth.
The firm may be interested in knowing the proportion of the interest
bearing debt in the capital structure by calculating total debt ratio. A
highly debt burdened firm will find difficulty in raising funds from
creditors and owners in future. Creditors treat the owner’s equities as
a margin of safety.
Total Debt
Total Ratio = --------------------------------
Capital Employed
DEBT-EQUITY RATIO:
8/8/2019 Financial Analysis Raw Info First Copy
http://slidepdf.com/reader/full/financial-analysis-raw-info-first-copy 21/38
It reflects the relative claims of creditors and shareholders against the
assets of the business. Debt, usually, refers to long-term liabilities.
Equity includes preference share capital and reserves.
The relationship describing the lenders contribution for each refers of the owner’s contribution is called debt equity ratio.
A high ratio shows a large share of financing by the creditors
relatively to the owners and therefore, larger claim against the assets
of the firm. A low ratio implies a smaller claim of creditors. The debt
equity indicates the margin of satisfy to the creditors so, there is no
doubt the Beth High and Low debt equity ratios are not desirable.
What is needed is a ratio, which strikes a proper balance between debt
and equity.
Total Debt
Debt-Equity Ratio = ----------------------------
Net worth
Some financial experts opine that ‘debt’ should include current
liabilities also. However, this is not a popular practice. In case of
preference share capital, it is treated as a part of shareholders funds,
but if the preference shares are redeemable, they are taken as a part of
long-term debt shareholder funds are also known as proprietor funds
and it includes items equity share capital, reserves, and surplus. A
debt equity ratio of 3:1 is considered ideal.
PROPRIETORY RATIOS:
8/8/2019 Financial Analysis Raw Info First Copy
http://slidepdf.com/reader/full/financial-analysis-raw-info-first-copy 22/38
It expresses the relationship between net worth and total assets.
Net worth
Property ratio = ----------------------------
Total Assets
Net worth = Equity share capital + Preference share capital + reserves
– Fictitious assets.
Total Assets = Fixed assets + current assets (excluding fictitious
assets)
Reserves earmarked specifically for a particular purpose should not be
included in calculation of net worth. A high proprietor’s ratio is indicative of
strong financial position of the business. The higher the ratio, the better it is.
FIXED ASSETS RATIO:
Fixed Assets
Fixed Assets = ----------------------------------------
Capital employed
Capital employed – Equity share capital + preference share capital +
Reserves + long term liabilities – Fictitious assets.
This ratio indicates the mode of financing the fixed assets. A
financially well-managed company will have its fixed assets financed
by long-term funds. Therefore, the fixed assets ratio should never bemore than a ratio of 0.67 is considered idea
8/8/2019 Financial Analysis Raw Info First Copy
http://slidepdf.com/reader/full/financial-analysis-raw-info-first-copy 23/38
INTEREST COVERAGE RATIOS:
This interest coverage ratio is computed by dividing earnings before
interests and taxed by interest charges.
Debt
Interest Coverage Ratio = ------------------
Interest
The interest coverage ratio shows the number of times the interest
charges are covered by funds that are or demurely available for their
payment. A high ratio is desirable but too high ratio indicates that the firmis very conservative in using debt and that is not using credit to the debt
advantage of shareholder. A lower ratio indicates excessive use of debt or
inefficiency operations. The firm should make efforts to improve the
operating efficiency or to retire debt to have a comfortable coverage ratio.
III) ACTIVITY RATIOS:
Activity ratios measure the efficiency or effectiveness with
which a firm manages its resources or assets. They calculate thespeed with which various assets, in which funds are blocked up, get
converted into sales.
TOTAL ASSETS TURNOVER RATIOS:
The assets turnover ratio, measures the efficiency of a firm in
managing and utilizing its assets. The higher the turnover ratio, the
more efficiency the management and utilization of the assets while
low turnover ratio is indicative of under-utilization of available
resources and presence idle capacity. The total assets turnover ratio is
computed by dividing sales by total assets.

8/8/2019 Financial Analysis Raw Info First Copy
http://slidepdf.com/reader/full/financial-analysis-raw-info-first-copy 24/38
S a l e s
Total assets turnover ratio = --------------------------
Total Assets
8/8/2019 Financial Analysis Raw Info First Copy
http://slidepdf.com/reader/full/financial-analysis-raw-info-first-copy 25/38
WORKING CAPITAL TURNOVER RATIOS:
Cost of goods sold
Working capital turnover ratio = ----------------------------------
Working Capital
Where if cost of goods sold is known. Net sales can be taken in
the numerator.
Working capital = Current Assets – Current liabilities.
A high working capital turnover ratio indicates efficiency
utilization of the firm’s funds. However, it should not result in
overtrading.
DEBTORS TURNOER RATIO:
Debtor’s turnover ratio expresses the relationship between
debtors and sales. It is calculated.
Net credit sales
Debtors Turnover Ratio = ------------------------------------
Average debtors
Net credit sales inspire credit sales after adjusting for salesreturns. In case information no credit sale is not available. “Sales”
can be taken in the numerator. Debtors include bills receivable.
Debtors should be taken at Gross Value, without adjusting provisions
for bad debts. In case, average debtors can’t be found; closing balance
of debtors should be taken in the denominator. A high debtors

8/8/2019 Financial Analysis Raw Info First Copy
http://slidepdf.com/reader/full/financial-analysis-raw-info-first-copy 26/38
turnover ratio or a low debt collection period is indicative of a sound
credit management policy. A debtors turnover collection period of
30-36 days is considered ideal.

8/8/2019 Financial Analysis Raw Info First Copy
http://slidepdf.com/reader/full/financial-analysis-raw-info-first-copy 27/38
DEBT COLLECTION PERIOD:
The debt collection period measures the quality of debtors since it
indicates the speed of the collection. The shorter the average
collection period implies the prompt payment by debtors.
No. of days year
Debt collection period = ------------------------------------------------
Debtors turn over ratio
An excessively long collection period implies a very liberal and
inefficient credit and collection performance. This certainly delays thecollection of each and impairs the firm’s liquidity. The average no. of days
for which debtors remain outstanding is called debt collection period or
average collection period.
CREDITORS TURNOVER RATIO:
Creditors turnover ratio expresses the relationship between creditors
and purchases.
Net Credit Purchase
Creditors turnover Ratio = -----------------------------------------------
Average Creditors
Net credit purchases imply credit purchases after adjusting for
purchases returns. In case information on credit purchases is not
available purchase may be taken in the numerator. Creditors include bills payable. In case avenue creditors can’t be found, closing balance
of creditors should be taken in the denominator.
The creditors turnover ratio is 12 or more. However, very less
creditors turnover ratio, or a high debt payment period, may indicate
the firm’s inability in meeting its obligations in time.
8/8/2019 Financial Analysis Raw Info First Copy
http://slidepdf.com/reader/full/financial-analysis-raw-info-first-copy 28/38
PAYMENT PERIOD RATIO:
Credit turnover rate can also be expressed in terms of number of days
taken by the business to pay off its debts. It is termed as debt payment
period which is calculated as:
Number of days in a year
Payment Period Ratio= --------------------------------------------
Creditor’s turnover ratio
FIXED ASSETS TURNOVER RATIO: It is defined as
Net Sales
Fixed Assets Turnover Ratio= ----------------------------
Fixed Assets
Fixed assets imply net fixed assets i.e. after depreciation.
A high fixed assets turnover ratio indicates better utilization of the
firm’s fixed assets. A ratio around 5 is considered ideal.
INVENTORY TURNOVER RATIO:
Stock turnover ratio indicates the number of times the stock has
turned over into sale sin the year. It is calculated as
Cost of goods sold
Inventory Turnover Ratio= --------------------------------------------
Average Inventory
Cost of goods sold = Sales Gross Profit
Average Stock = (Opening stock and closing stock ½)
8/8/2019 Financial Analysis Raw Info First Copy
http://slidepdf.com/reader/full/financial-analysis-raw-info-first-copy 29/38
In case, information regarding cost of goods sold is not
known. Sales may be taken in the numerator. Similarly, if average stock
can’t be calculated, closing stock should be taken in the denominator.
A stock turnover ratio of ‘8’ is considered ideal. A high stock turnover ratioindicates that the stocks are fast moving and get converted into sales
quickly. However, it may also be on account of holding low amount of
stocks and replenishing stocks in larger number of installments.
IV) PROFITABILITY RATIO:
It measures the overall performance and effectiveness of the
firm. Poor operational performance may indicate poor sales and hence poor
profits. A lower profitability may arise due to the lack of control over the
expenses. Bankers, financial institutions and other creditors look at the
profitability’s. Ratio as an indicator whether or not the firm earns
substantially more than it pays interest for the use of borrowed funds and
whether the ultimate repayment of their debt appear reasonably certain
owner are interested to know the profitability as it indicates the return which
they can get on this instruments. Profitability ratios measure the profitability
of a concern generally. They are calculated either in relation to sales or in
relation to investment.
8/8/2019 Financial Analysis Raw Info First Copy
http://slidepdf.com/reader/full/financial-analysis-raw-info-first-copy 30/38
NET PROFIT RATIO:
It indicates the result of the overall operation of the firm.
The higher the ratio, per profitable is the business. The net
profit ratio is reassured by dividing net profit buy sales. The net profit
ratio indicates management efficiency in manufacturing
administrating and selling the products. This ratio is the overall firm’s
ability to turn each rupee of sale into net profit. If the net profit
margin is inadequate, the firm fails to achieve satisfactory return on
shareholder’s funds.
Profit After Tax
Net Profit Ratio = ------------------------------------
Net Sales
A firm with high net profit margin can make better use of
favorable conditions. Such as rising selling prices, falling cost of
products or increasing demand for the product. Such a firm will be
able to accelerate its profits at a faster rate than a firm with a low net
profit margin. This ratio also indicates the firm capacity to withstand
adverse economic conditions.
RETURN ON NETWORTH RATIO:
It indicates the return, which the shareholders are earning on
their resources invested in the business.
Profit after tax
Return on net worth ratio = -------------------------------------- Net Wroth
Net worth = Shareholders funds = Equity share capital + Preference
share capital + Reserves – Factious Assets.
8/8/2019 Financial Analysis Raw Info First Copy
http://slidepdf.com/reader/full/financial-analysis-raw-info-first-copy 31/38
The higher the ratio, the better it is for the shareholders.
However, inter firm comparisons should be made to ascertain if the
returns from the company are adequate. A trend analysis of the ratio
over the past few years much is done to find out the growth or
deterioration in the profitability of the business.
RETURN ON ASSETS RATIO: It is calculated as:
Profit after tax
Return on assets ratio = ---------------------------------
Total Assets
Total assets do not include fictitious assets. The higher the ratio, the
better it is.
EARNINGS PER SHARE RATIO:
Earnings per share are the net profit after tax and preferences
dividend, which is earned on the capital representative of one equity
share. It calculated as:
Profit after tax
Earning per share ratio = -------------------------------------------- Number of ordinary share

8/8/2019 Financial Analysis Raw Info First Copy
http://slidepdf.com/reader/full/financial-analysis-raw-info-first-copy 32/38
FUNDS FLOW STATEMENT
Definition of Funds:
Funds may mean change in financial resources, arising from
changes in working capital items and from financing and investing activities
8/8/2019 Financial Analysis Raw Info First Copy
http://slidepdf.com/reader/full/financial-analysis-raw-info-first-copy 33/38
of the enterprise, which may involve only non-current items.
The funds flow statement analyses only the causes of changes in
the firm’s working capital position. The cash flow statement is prepared to
analyze changes in the flow of cash only. These statements fail to consider the changes in the firm’s total financial resources. They do not reveal some
significant items that do not affect the firm’s cash or working capital
position, but considerably influence the financing and asset mix of the firm.
But funds or cash flow statement will not include this transaction, as it does
not involve any change in cash or working capital. A comprehensive
statement of changes in financial position would disclose this information
along with information on cash or working capital changes.
The statement of changes in financial position is an extension of the funds flow statement or the cash flow statement. It is more informative
and comprehensive in indicating the changes in the firm’s financial position.
However, the analysis of changes in the firm’s cash position or working
capital is still very significant. Therefore, to get better insights, a firm may
prepare a comprehensive, all- Inclusive, statement of changes in financial
position incorporating changes in the firm’s cash and working capital
position. The preparation and use of the statement of changes in financial
position involving:
• Changes in the firm’s working capital position,
• Changes in the firm’s cash position, and
• Changes in the firm’s total financial resources.
8/8/2019 Financial Analysis Raw Info First Copy
http://slidepdf.com/reader/full/financial-analysis-raw-info-first-copy 34/38
Funds flow statement:
The statement of changes in financial position, prepared to
determine only the sources and uses of working capital between dates of two
balance sheets, is known as the funds flow statement.
Working capital is defined as the difference between current
assets and current liabilities. Working capital determines the liquidity
position of the firm.
As historical analysis, the statement of changes in working
capital reveals to management the way in which working capital was
obtained and used. With this insight, management can prepare the estimates
of working capital flows. A statement reporting the changes in workingcapital is useful in addition to the financial statements. A projected statement
of changes in working capital is immensely useful in the firm’s long-range
planning. Management, for example, wants to anticipate the working capital
flows in order to plan the repayment schedules of its long-term debt. For a
fast growth and expansion, a fir needs larger amount of working capital.
Therefore, estimates of working capital on a long-term basis are also
required to determine whether or not adequate working capital will be
generated to meet the firm’s expansion. If not, the firm can makearrangements in advance to procure funds from outside to meet its needs.
Concept of working capital flow:
The working capital flow or fund arises when the net effect
of a transaction is to increase or decrease the amount of working capital.
Normally, a firm will have some transactions that will change net working
capital and some that will cause no change in net working capital.
Transactions that change net working capital include most of the items of the profit and loss account and those business events that simultaneously affect
both current and non-current balance sheet items. On the order hand,
transactions that do not increase or decrease working capital include those
that affect only current accounts or only non current accounts.
8/8/2019 Financial Analysis Raw Info First Copy
http://slidepdf.com/reader/full/financial-analysis-raw-info-first-copy 35/38
The concept of working capital flow may be summarized as follows:
• The net working capital increases or decreases when a
transaction involves a current account and non-current
account.
• The net working capital remains unaffected when a
transaction involves only current accounts.
• The net working capital remains unaffected when a
transaction involves only non-current accounts.
Sources of working capital:
The typical sources of working capital are summarized below:
1. funds from operation(adjusted net income)
2. sale of non-current assets:
• Sale of long-term investments (shares, bonds/debentures etc.)
• Sale of tangible fixed assets like land. Building, plant, or
copyrights.
3. long-term financing:
• long term borrowings(institutional loans, debentures,
bonds ,etc)
• Issuance of equity and preference shares.
8/8/2019 Financial Analysis Raw Info First Copy
http://slidepdf.com/reader/full/financial-analysis-raw-info-first-copy 36/38
4. Short-term financing such as bank borrowings.
Uses of working capital:
The typical uses of working capital are as follows:
1. Adjusted net loss from operation
2. Purchase of non-current assets:
• Purchase of long-term investments like shares,
bonds/debentures etc.
• Purchase of intangible fixed assets, like goodwill, patents,
copyrights etc.
• Purchase of tangible fixed assets, like land, building, plant,
machinery, equipments etc.
3. Repayment of long-term debt(debentures or bonds) and short-term
debt(bank borrowing)
4. Redemption of redeemable preference shares
5. Payment of cash dividend.
Forms of Funds Flow Statement:
The statement of changes in working capital or funds flow is the
summary of sources and uses of working capital. This statement may be
presented in two parts.
The first part explains the causes of the change in amount of
working capital from the end of one period to another. It gives a list of
sources which provide working capital was applied.
The second part of the statement contains an analysis of the
changes in the working capital items. This part of the statement shows items
of current assets and current liabilities at the beginning and at the end of the
accounting period and the effect of their changes between two periods on the
8/8/2019 Financial Analysis Raw Info First Copy
http://slidepdf.com/reader/full/financial-analysis-raw-info-first-copy 37/38
working capital.
Significance of Funds Flow Statement:
The utility of the funds flow statement stems from the fact that itenables shareholders, creditors and other interested in the enterprise to
evaluate the uses of funds by the enterprise and to determine how these uses
are financed. Thus, the outside parties can have clear knowledge about the
financial policies that the company has pursued. In the light of the
information so supplied by statement, the outsiders can decide whether or
not to invest in the enterprise and on what terms funds have to be invested.
The funds statement provides an insight into the financial operations of a
business enterprise- an insight immensely valuable to the financial manager in analyzing the past and future expansion plans of the enterprise and the
impact of these plans on the enterprise liquidity. He can detect imbalances in
the uses of funds and undertake remedial actions.
With the help of the funds statement the analyst can evaluate the
financing pattern of the enterprise. An analysis of the major sources of funds
in the past reveals what portion of the growth was financed internally and
what portion externally. The statement is also meaningful in judging
whether the company has grown at too fast a rate and whether financing is
strained.
Comparative statements
A simple method of tracing periodic changes in the financial
performance of a company is to prepare comparative statements.
Comparative financial statements will contain items at least for two periods.
Changes----increases and decreases----in income statement and balance
8/8/2019 Financial Analysis Raw Info First Copy
http://slidepdf.com/reader/full/financial-analysis-raw-info-first-copy 38/38
sheet over period can be shown in two ways: (1) aggregate changes and
(2) proportional changes.
Drawing special columns for aggregate amount or percentage, or
both, of increases and decreases, can indicate aggregate changes. Recording percentage calculated in relation to a common base in special columns, on
the other hand, shows relative, or proportional, changes. For example, in the
case of profit and loss statement, sales figure is assumed to be common base
and all other items are expressed as percentage of sales. Similarly, the
balance sheet items are expressed as percentage of total assets or total funds.
The financial statements prepared in terms of common base percentage are
called common size statements. This kind of analysis is called vertical
analysis and it indicates static relationships since relative changes are
studied at a specific date.
An investigation of the Comparative financial statements helps to
highlight the significant facts and points out the items which need further
analysis. The published balance sheets and profit and loss accounts of joint-
stock companies in India are presented in two-year comparative form. Some
of the companies also report to shareholders condensed comparative
statements covering an extended period of years. From analytical point of
view, such statements are quite useful to investors.