Embed Size (px)
Citation preview
Record catastrophe activity, reduced favourable prior accident year claims development and unacceptable results in Asia Pacific and Latin American Operations drove an underwriting loss despite improved cost efficiency.
General overviewMy commencement as Group Chief Financial Officer coincided with the appointment of Pat Regan as the Group’s Chief Executive Officer. During these early months, a key focus for me has been working with the Group Executive Committee to develop the program of work which you will have read about in Pat’s Chief Executive Officer’s report and referenced in the Chairman’s message.
The program’s near-term focus is on reducing complexity, simplifying the portfolio and delivering underlying performance improvement. One important focus of mine, which is critical to our performance improvement ambitions, is the successful rollout and implementation across the Group of the “Cell Performance Review” discipline which has been successfully implemented in Australian & New Zealand Operations.
As has been the case in Australian & New Zealand Operations, implementation of cell reviews will drive greater accountability for divisional performance down to a more granular level, ensuring that performance improvement plans are not only realistic but are also being successfully executed. Performance monitoring will take place by way of a structured timetable of cell reviews to ensure there is stronger accountability, more timely decision making and that all cells in our business have strong performance improvement plans and a disciplined approach to execution.
The rollout and implementation of cell reviews, including the consistent and accurate global reporting of cell performance, is one of my key priorities in 2018.
Consistent with our objective of reducing complexity and simplifying the portfolio, we have decided to exit our Latin American Operations which will see QBE reduce its geographic footprint and focus its ambition on being an “international” as distinct from a “global” insurer, with meaningful operations in the major insurance market hubs.
With respect to the recently announced 2017 results, I would like to discuss three broad areas:
1. Financial performance.
2. Investment strategy and performance.
3. Financial strength and capital management.
Financial and operations overview
Group Chief Financial Officer’s report10
1. Financial performance QBE reported a statutory net loss after tax of $1,249 million compared with a net profit after tax of $844 million in 2016.
The headline after tax loss included two significant non-cash items: a $700 million North American goodwill impairment charge and a $230 million write down of the carrying value of the deferred tax asset in our North American Operations due to a reduction in the US corporate tax rate to 21% from 35%. Both items are discussed in more detail later in my report.
Excluding these and other non-cash items, the loss after tax on a cash basis was $258 million and compares with a cash profit of $898 million in 2016.
The Group’s combined operating ratio increased to 104.1% 1,2,3, from 93.7% 1,3,4 in the prior year, primarily due to extreme catastrophe experience, a significantly reduced level of positive prior accident year claims development and an increase in the attritional claims ratio, which more than offset an improved combined commission and expense ratio.
Excluding the net cost of large individual risk and catastrophe claims in excess of the Group’s aggregate reinsurance limit, the 2017 combined operating ratio would have been 98.2% 1,2,3.
From my perspective, the key themes to emerge from the 2017 full year result are set out below:
(a) North American Operations heavily impacted by catastrophes and claims reserve strengthening
North American Operation’s result was heavily impacted by second half catastrophes including Hurricanes Harvey, Irma and Maria and the Californian wildfires. Excluding the cost of large individual risk and catastrophe claims in excess of the division’s aggregate reinsurance limit, North American Operations delivered a combined operating ratio of 102.2% 1,3, up from 98.5% 1,3 in the prior year. The deterioration in the underwriting result reflected a more normal Crop result following an outstanding 2016, coupled with an increase in the attritional claims ratio due to adverse weather-related claims and generally competitive pricing conditions.
During 2017, we completed a further loss portfolio transfer (LPT) which, together with the LPT undertaken in 2016, has removed in excess of $850 million of potentially volatile claims liabilities from our balance sheet. The LPTs, coupled with a $116 million second half claims reserve strengthening, lay a stronger foundation for improved profitability and reduced earnings volatility as we progress into 2018.
(b) Deterioration in Asia Pacific Operations due to lapse in underwriting discipline
Asia Pacific Operations reported an unacceptable combined operating ratio of 115.5% 1, up from 95.6% 1 in the prior period. The result includes a material increase in attritional claims activity across a number of portfolios and territories but especially in Hong Kong workers’ compensation and in property and marine classes in Hong Kong, Singapore and Indonesia. In addition to the competitive market landscape, the heightened attritional claims activity in these portfolios reflects a disappointing lapse in risk selection and underwriting discipline that led to an increase in exposure to higher hazard risks.
The Hong Kong workers’ compensation portfolio contributed around half of the division’s $100 million underwriting loss, including a material strengthening of prior accident year claims reserves.
1 Excludes the impact of changes in risk-free rates used to discount net outstanding claims.
2 Excludes one-off adverse impact on the Group’s underwriting result due to the Ogden decision in the UK.
3 Excludes transactions to reinsure US liabilities.4 Excludes transactions to reinsure UK liabilities.
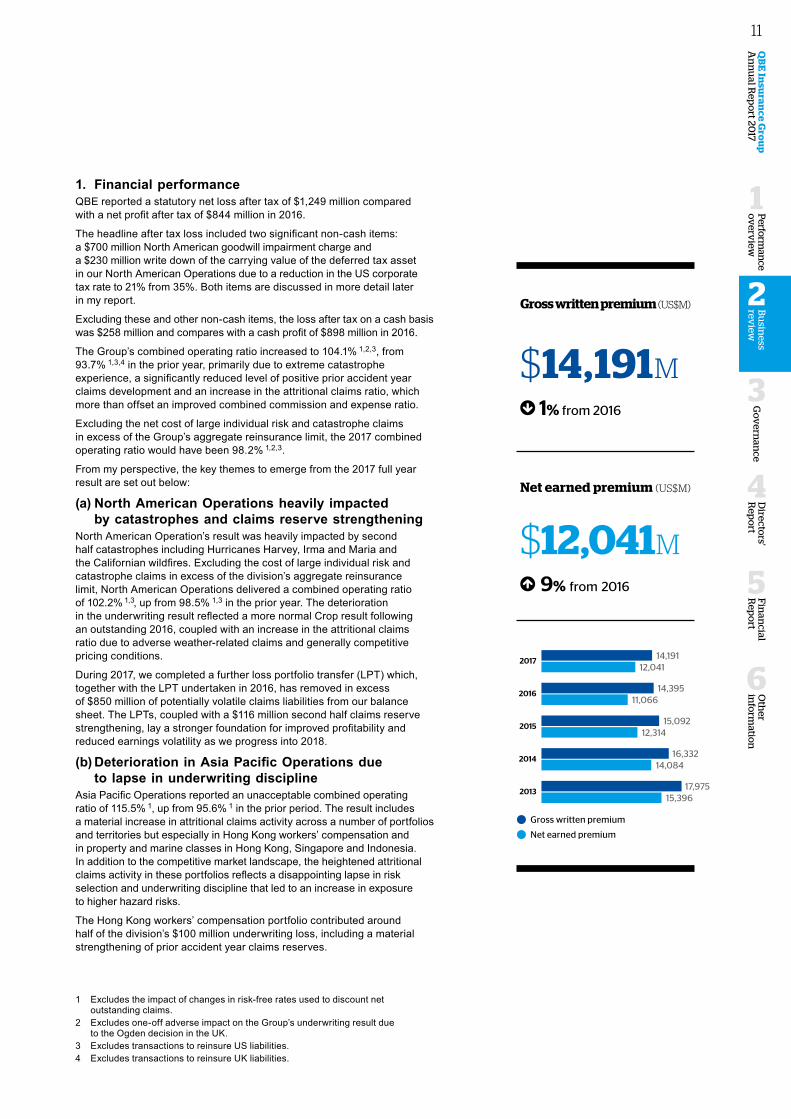
Gross written premium (US$M)
$14,191M 1% from 2016
Net earned premium (US$M)
$12,041M 9% from 2016
Gross written premium and net earned premium (US$M)
2013
2014
2015
2016
201714,191
12,041
14,39511,066
15,09212,314
16,33214,084
17,97515,396
Gross written premium 5%
Net earned premium 10%
Gross written premium and net earned premium (US$M)
2012
2013
2014
2015
201614,395
11,066
15,09212,314
16,33214,084
17,97515,396
18,43415,798
Gross written premium 5%
Net earned premium 10%
Gross written premium and net earned premium (US$M)
2012
2013
2014
2015
201614,395
11,066
15,09212,314
16,33214,084
17,97515,396
18,43415,798
Gross written premium 5%
Net earned premium 10%
Oth
er in
form
ation
6
Fin
ancial
Rep
ort
5
Go
vern
ance
3
Directo
rs' R
epo
rt
4
QB
E In
suran
ce Gro
up
A
nn
ual R
epo
rt 2017
Bu
siness
review
2
Perform
ance
ov
erview
1
11
(c) Continued solid results in European Operations despite reduced positive prior accident year claims development
Despite challenging market conditions and significant exposure to the catastrophes in North America and the Caribbean, European Operations once again produced a strong underwriting result reporting a combined operating ratio of 95.2% 1,2 reflecting the maintenance of strong underwriting discipline and especially strong reinsurance protections. The result was assisted by $141 million 2 of favourable prior accident year claims development, albeit down on the prior year.
While premium rates reduced further during the year, the pace of decline slowed significantly and the recent January 2018 renewals give some early cause for optimism that the extended soft pricing cycle has abated.
(d) Further improvement in Australian & New Zealand OperationsPerformance improvement in Australian & New Zealand Operations remains focused on premium rate increases, tightened terms and conditions, improved underwriting discipline and claims management initiatives, all of which are now embedded in to the cell performance review process. Premium rate increases averaged 6.1% (excluding NSW CTP where regulatory reforms are driving reduced small claims frequency leading to significant premium rate reductions). Premium retention was stable at around 82%, consistent with a market-wide upswing in premium rates.
As foreshadowed, our Lenders’ Mortgage Insurance (LMI) business reported a higher combined operating ratio consistent with a cyclical slowdown in the Australian mortgage insurance industry. Notwithstanding reduced LMI earnings, Australian & New Zealand Operations’ combined operating ratio improved to 92.0% 1 from 92.4% 1 in the prior period, underpinned by a 1.8% improvement in the attritional claims ratio or 2.5% excluding LMI.
2. Investment strategy and performanceOur investments delivered a net return of 3.2% compared with 2.9% in the prior year.
Investment performance in 2017 exceeded expectations, with the fixed income portfolio benefiting from credit spread compression throughout the year and growth assets delivering very strong returns. Tactical positioning during the year added value beyond the underlying asset class performances, as we held more credit early in the year and less duration in the second half.
Exposure to growth assets peaked at 13.2% of total investment assets in April; however, after an especially strong performance, was reduced to 10.2% at year end.
3. Financial strength and capital managementWhile the Group’s capital position remains strong when measured against both regulatory and rating agency capital requirements, severe second half catastrophe experience coupled with dividends paid and the share buyback resulted in our APRA PCA multiple falling to 1.64x at 31 December 2017 from 1.76x a year earlier.
Following a material strengthening of risk margins and completion of the LPT, the probability of adequacy (PoA) of outstanding claims increased from 89.5% to 90.0%, the mid-point of our benchmark 87.5–92.5% PoA range.
Cash remittances from the operating divisions remained strong at $1,022 million compared with $1,106 million in the prior period. Dividend coverage remains very strong at 1.8x.
Group head office cash flowsFOR THE YEAR ENDED 31 DECEMBER 2017
US$M2016
US$M
Opening head office cash balance 1,007 845 Total divisional remittances 1,022 1,106 Net interest on parent entity borrowings (196) (81)Gross organic cash flow 826 1,025 Dividends paid (570) (535)Net organic cash flow 256 490 Other (including share purchases) (228) (328)Closing head office cash balance 1,035 1,007
As noted in February 2017, QBE established a three-year cumulative on-market share buyback facility of up to A$1 billion, with a current target of acquiring not more than A$333 million in any one calendar year. During 2017, QBE purchased A$139 million of QBE shares resulting in the cancellation of 13 million shares or 0.9% of issued capital.
Whilst we remain committed to the share buyback, we intend to adopt a considered approach, especially in the first half of 2018 as we look to gradually increase our PCA multiple within our 1.6–1.8x benchmark range.
1 Excludes the impact of changes in risk-free rates used to discount net outstanding claims.2 Excludes one-off adverse impact on the Group’s underwriting result due to the Ogden decision in the UK.
Group Chief Financial Officer’s report12
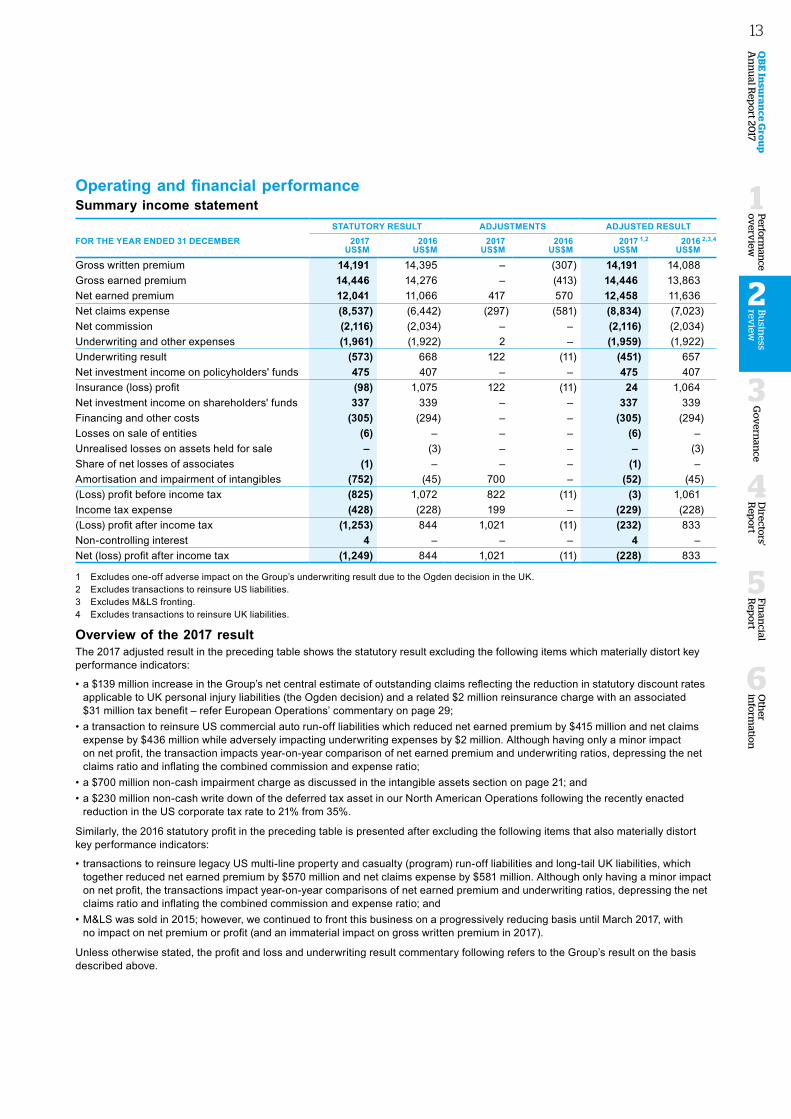
Operating and financial performanceSummary income statement
STATUTORY RESULT ADJUSTMENTS ADJUSTED RESULTFOR THE YEAR ENDED 31 DECEMBER 2017
US$M2016
US$M2017
US$M2016
US$M 2017 1,2
US$M 2016 2,3,4
US$M
Gross written premium 14,191 14,395 – (307) 14,191 14,088 Gross earned premium 14,446 14,276 – (413) 14,446 13,863 Net earned premium 12,041 11,066 417 570 12,458 11,636 Net claims expense (8,537) (6,442) (297) (581) (8,834) (7,023)Net commission (2,116) (2,034) – – (2,116) (2,034)Underwriting and other expenses (1,961) (1,922) 2 – (1,959) (1,922)Underwriting result (573) 668 122 (11) (451) 657 Net investment income on policyholders' funds 475 407 – – 475 407 Insurance (loss) profit (98) 1,075 122 (11) 24 1,064 Net investment income on shareholders' funds 337 339 – – 337 339 Financing and other costs (305) (294) – – (305) (294)Losses on sale of entities (6) – – – (6) – Unrealised losses on assets held for sale – (3) – – – (3)Share of net losses of associates (1) – – – (1) – Amortisation and impairment of intangibles (752) (45) 700 – (52) (45)(Loss) profit before income tax (825) 1,072 822 (11) (3) 1,061 Income tax expense (428) (228) 199 – (229) (228)(Loss) profit after income tax (1,253) 844 1,021 (11) (232) 833 Non-controlling interest 4 – – – 4 – Net (loss) profit after income tax (1,249) 844 1,021 (11) (228) 833
1 Excludes one-off adverse impact on the Group’s underwriting result due to the Ogden decision in the UK.2 Excludes transactions to reinsure US liabilities.3 Excludes M&LS fronting.4 Excludes transactions to reinsure UK liabilities.
Overview of the 2017 result The 2017 adjusted result in the preceding table shows the statutory result excluding the following items which materially distort key performance indicators:
• a $139 million increase in the Group’s net central estimate of outstanding claims reflecting the reduction in statutory discount rates applicable to UK personal injury liabilities (the Ogden decision) and a related $2 million reinsurance charge with an associated $31 million tax benefit – refer European Operations’ commentary on page 29;
• a transaction to reinsure US commercial auto run-off liabilities which reduced net earned premium by $415 million and net claims expense by $436 million while adversely impacting underwriting expenses by $2 million. Although having only a minor impact on net profit, the transaction impacts year-on-year comparison of net earned premium and underwriting ratios, depressing the net claims ratio and inflating the combined commission and expense ratio;
• a $700 million non-cash impairment charge as discussed in the intangible assets section on page 21; and• a $230 million non-cash write down of the deferred tax asset in our North American Operations following the recently enacted
reduction in the US corporate tax rate to 21% from 35%.
Similarly, the 2016 statutory profit in the preceding table is presented after excluding the following items that also materially distort key performance indicators:
• transactions to reinsure legacy US multi-line property and casualty (program) run-off liabilities and long-tail UK liabilities, which together reduced net earned premium by $570 million and net claims expense by $581 million. Although only having a minor impact on net profit, the transactions impact year-on-year comparisons of net earned premium and underwriting ratios, depressing the net claims ratio and inflating the combined commission and expense ratio; and
• M&LS was sold in 2015; however, we continued to front this business on a progressively reducing basis until March 2017, with no impact on net premium or profit (and an immaterial impact on gross written premium in 2017).
Unless otherwise stated, the profit and loss and underwriting result commentary following refers to the Group’s result on the basis described above.
Oth
er in
form
ation
6
Fin
ancial
Rep
ort
5
Go
vern
ance
3
Directo
rs' R
epo
rt
4
QB
E In
suran
ce Gro
up
A
nn
ual R
epo
rt 2017
Bu
siness
review
2
Perform
ance
ov
erview
1
13
The Group incurred a 2017 pre-tax loss of $3 million, compared with a pre-tax profit of $1,061 million in the prior year, primarily reflecting a $772 million increase in the net cost of large individual risk and catastrophe claims and a $329 million reduction in the contribution from positive prior accident year claims development.
The Group’s effective tax rate was materially distorted by significant catastrophe claims in our North American Operations, where an already substantial deferred tax asset precluded recognition of further tax losses, as well as in Equator Re. Tax expense was incurred in the profitable Australian & New Zealand and European Operations. As a result, the Group recognised $229 million of tax expense against a $3 million pre-tax loss which, in addition to the operational profit drivers, contributed to a net loss after tax of $228 million compared with a net profit after tax of $833 million in the prior year.
Excluding amortisation of intangibles and other non-cash items, the Group incurred a loss after tax on a cash basis of $258 million compared with an $898 million cash profit reported in the prior year.
On a constant currency basis, gross written premium increased by 0.5% while net earned premium grew by 7%, partially reflecting reduced reinsurance expense.
The combined operating ratio increased to 104.1% 1 from 93.7% 1 in the prior year, primarily due to adverse catastrophe experience which saw the net cost of large individual risk and catastrophe claims increase to 14.6% of net earned premium from 9.1% in the prior year. The combined operating ratio was also adversely impacted by a reduced level of positive prior accident year claims development coupled with a largely Crop driven increase in the attritional claims ratio (following an outstanding Crop result in 2016), which more than offset an improved combined commission and expense ratio.
Excluding the net cost of large individual risk and catastrophe claims retained in excess of the Group’s aggregate reinsurance protection, the 2017 combined operating ratio would have been 98.2% 1.
The net investment return on policyholders’ funds increased to 3.0% from 2.6% in the prior year, contributing 3.8% to the insurance profit margin compared with 3.5% in 2016. Returns were enhanced by mark-to-market gains on sovereign and corporate bonds coupled with strong growth/risk asset returns partially offset by foreign exchange losses, while the prior year benefited from significant foreign exchange gains.
The Group reported an insurance profit of $24 million, down significantly from $1,064 million in the prior year. The insurance profit margin fell to 0.2% from 9.1% in the prior period.
Investment income on shareholders’ funds was broadly stable at $337 million. Stronger underlying returns were offset by the non-recurrence of significant prior year foreign exchange gains.
Financing and other costs increased to $305 million from $294 million in the prior year, including costs associated with the settlement of the class action which more than offset reduced interest costs following significant refinancing activities over the past two years.
1 Excludes the impact of changes in risk-free rates used to discount net outstanding claims.
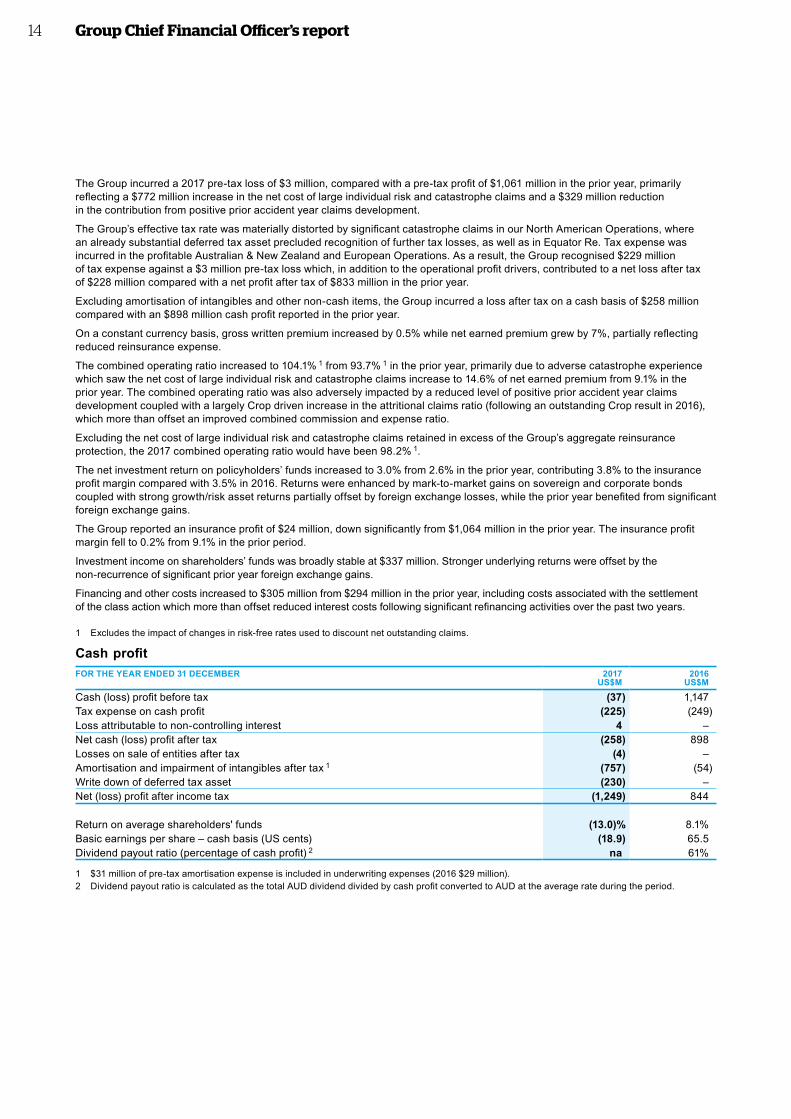
Cash profitFOR THE YEAR ENDED 31 DECEMBER 2017
US$M2016
US$M
Cash (loss) profit before tax (37) 1,147 Tax expense on cash profit (225) (249)Loss attributable to non-controlling interest 4 – Net cash (loss) profit after tax (258) 898 Losses on sale of entities after tax (4) – Amortisation and impairment of intangibles after tax 1 (757) (54)Write down of deferred tax asset (230) –Net (loss) profit after income tax (1,249) 844
Return on average shareholders' funds (13.0)% 8.1%Basic earnings per share – cash basis (US cents) (18.9) 65.5 Dividend payout ratio (percentage of cash profit) 2 na 61%
1 $31 million of pre-tax amortisation expense is included in underwriting expenses (2016 $29 million).2 Dividend payout ratio is calculated as the total AUD dividend divided by cash profit converted to AUD at the average rate during the period.
Group Chief Financial Officer’s report14
Premium incomeGross written premium increased marginally to $14,191 million compared with $14,088 million in the prior year.
On an average basis and compared with 2016, sterling depreciated against the US dollar by 5% while the Australian dollar and Euro appreciated by 3% and 2% respectively. Currency movements favourably impacted gross written premium by $36 million relative to the prior period.
Gross written premium increased by 0.5% on a constant currency basis, reflecting modest growth in North American and European Operations coupled with inflation-led growth in Argentina, largely offset by a slight decline in Australian & New Zealand and Asia Pacific Operations.
Assisted by firming market conditions in Australian & New Zealand Operations, overall premium rate momentum turned positive during the year. Group-wide premium rate increases averaged 1.7% 1 compared with an average reduction of 0.5% 1 in 2016. Although remaining highly competitive and still below the level of claims inflation, pricing conditions improved in North American and European Operations while deteriorating in Asia Pacific Operations.
North American Operations reported an underlying 1% 2 increase in gross written premium, assisted by an average premium rate increase of 0.7% compared with flat in the prior year. Continued strong growth in Specialty coupled with increased Crop income following higher commodity prices, higher coverage demand and policy count growth were partly offset by a reduction in Property & Casualty income. This reduction followed the 2016 decision to exit mono-line commercial auto insurance and the mid-year termination of a heavily property catastrophe exposed condominium program.
European Operations’ gross written premium was up 0.4% on a constant currency basis. This is a solid outcome given the competitive pricing landscape that saw an average premium rate reduction of 0.2% during the year, an improvement on the average premium rate reduction of 2.4% experienced in the prior year.
Australian & New Zealand Operations reported a 1% reduction in gross written premium on a constant currency basis. An average premium rate increase of 5.3% compared with 1.2% in the prior year coupled with broadly stable retention was offset by a significant and targeted reduction in new business volumes in selected classes of business.
Asia Pacific Operations’ gross written premium fell 3% on a constant currency basis, consistent with increased competitive pressure as evidenced by average premium rate reductions of 2.3% compared with 0.1% in the prior year. A targeted reduction in Hong Kong workers’ compensation and marine business in Singapore and Indonesia, coupled with increased lapses in Thailand post the announcement of our intention to sell, more than offset personal lines premium growth through the Manulife distribution relationship.
Latin American Operations’ gross written premium grew 4% on a constant currency basis, underpinned by an average premium rate increase of 10.1% (largely driven by Argentine motor inflation) compared with 4.1% in the prior year, partially offset by the mid-year sale of the Chilean business and contraction in Ecuador due to soft market pricing and a weak economy.
Net earned premium increased 7% on a constant currency basis, partially reflecting reduced reinsurance spend following the renegotiation and restructuring of the Group’s 2017 reinsurance protections.
1 Group premium rate movements exclude Latin America where high inflation distorts the headline premium rate movements.2 Excludes $142 million of Latin American premium income fronted on behalf of Equator Re in 2016.
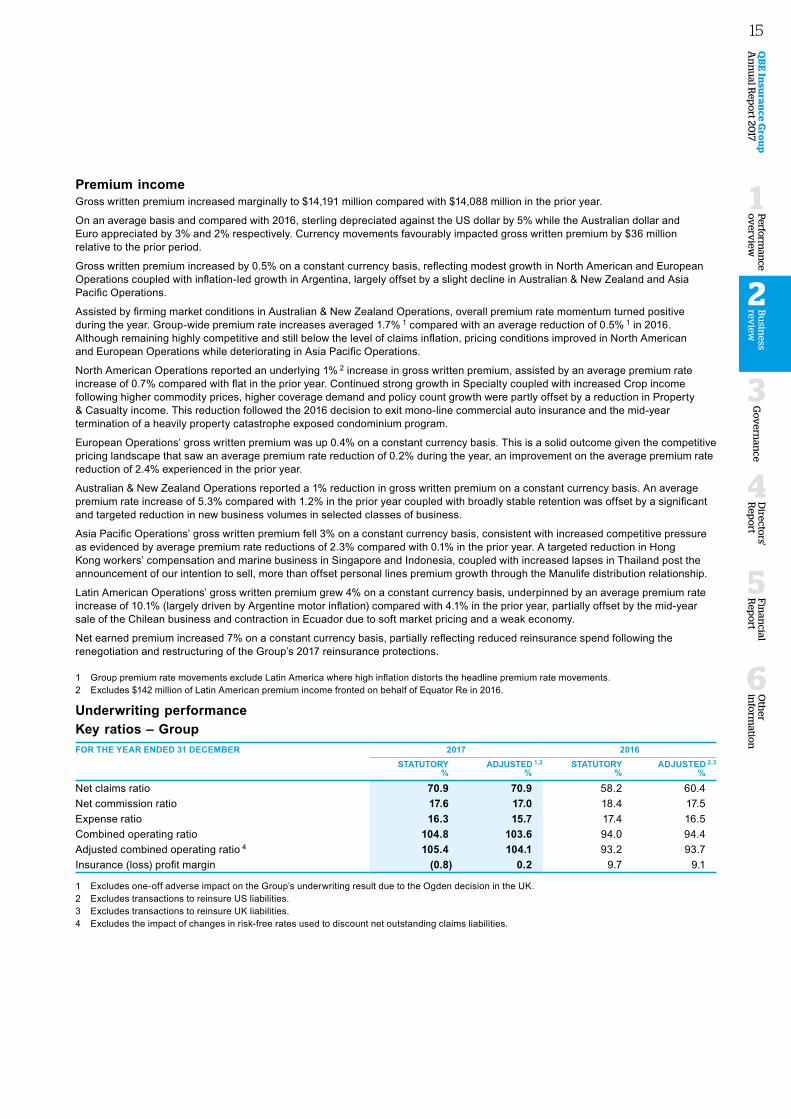
Underwriting performanceKey ratios – GroupFOR THE YEAR ENDED 31 DECEMBER 2017 2016
STATUTORY%
ADJUSTED 1,2
% STATUTORY
%ADJUSTED 2,3
%
Net claims ratio 70.9 70.9 58.2 60.4 Net commission ratio 17.6 17.0 18.4 17.5 Expense ratio 16.3 15.7 17.4 16.5 Combined operating ratio 104.8 103.6 94.0 94.4 Adjusted combined operating ratio 4 105.4 104.1 93.2 93.7 Insurance (loss) profit margin (0.8) 0.2 9.7 9.1
1 Excludes one-off adverse impact on the Group’s underwriting result due to the Ogden decision in the UK. 2 Excludes transactions to reinsure US liabilities.3 Excludes transactions to reinsure UK liabilities.4 Excludes the impact of changes in risk-free rates used to discount net outstanding claims liabilities.
Oth
er in
form
ation
6
Fin
ancial
Rep
ort
5
Go
vern
ance
3
Directo
rs' R
epo
rt
4
QB
E In
suran
ce Gro
up
A
nn
ual R
epo
rt 2017
Bu
siness
review
2
Perform
ance
ov
erview
1
15
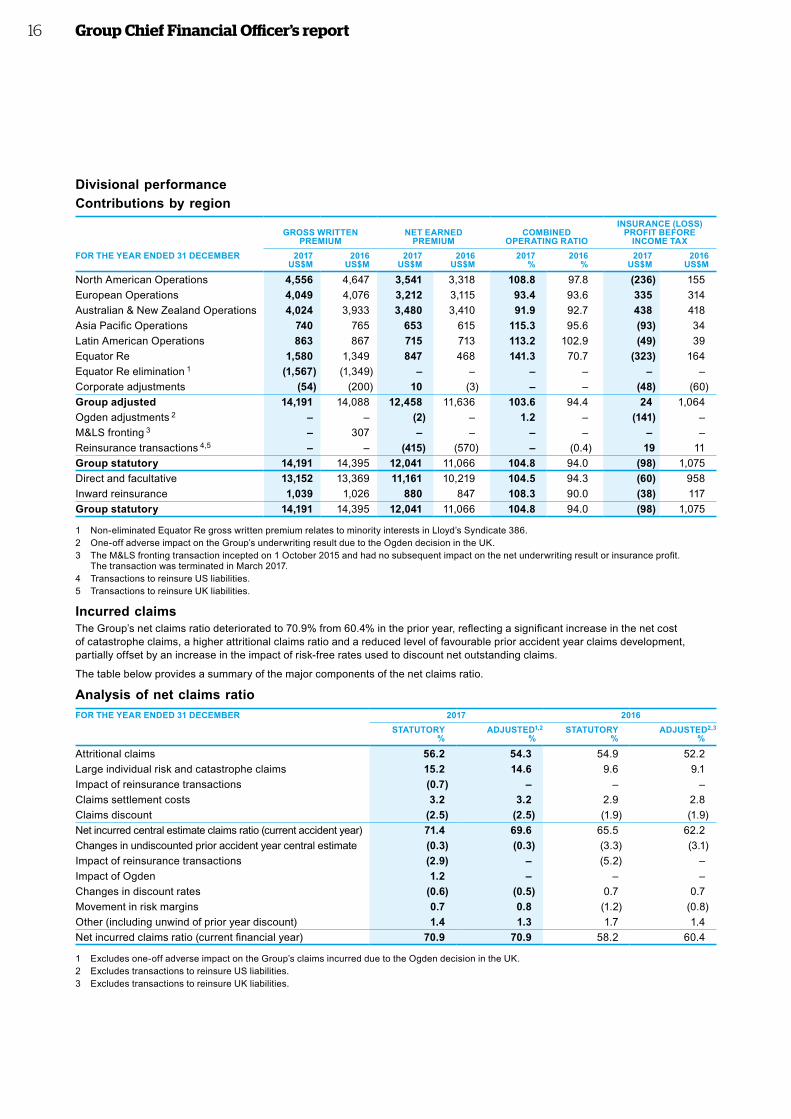
Divisional performanceContributions by region
GROSS WRITTEN
PREMIUMNET EARNED
PREMIUMCOMBINED
OPERATING RATIO
INSURANCE (LOSS) PROFIT BEFORE
INCOME TAXFOR THE YEAR ENDED 31 DECEMBER 2017
US$M2016
US$M2017
US$M2016
US$M2017
%2016
%2017
US$M2016
US$M
North American Operations 4,556 4,647 3,541 3,318 108.8 97.8 (236) 155 European Operations 4,049 4,076 3,212 3,115 93.4 93.6 335 314 Australian & New Zealand Operations 4,024 3,933 3,480 3,410 91.9 92.7 438 418 Asia Pacific Operations 740 765 653 615 115.3 95.6 (93) 34 Latin American Operations 863 867 715 713 113.2 102.9 (49) 39 Equator Re 1,580 1,349 847 468 141.3 70.7 (323) 164 Equator Re elimination 1 (1,567) (1,349) – – – – – – Corporate adjustments (54) (200) 10 (3) – – (48) (60)Group adjusted 14,191 14,088 12,458 11,636 103.6 94.4 24 1,064 Ogden adjustments 2 – – (2) – 1.2 – (141) – M&LS fronting 3 – 307 – – – – – – Reinsurance transactions 4,5 – – (415) (570) – (0.4) 19 11Group statutory 14,191 14,395 12,041 11,066 104.8 94.0 (98) 1,075 Direct and facultative 13,152 13,369 11,161 10,219 104.5 94.3 (60) 958Inward reinsurance 1,039 1,026 880 847 108.3 90.0 (38) 117Group statutory 14,191 14,395 12,041 11,066 104.8 94.0 (98) 1,075
1 Non-eliminated Equator Re gross written premium relates to minority interests in Lloyd’s Syndicate 386.2 One-off adverse impact on the Group’s underwriting result due to the Ogden decision in the UK. 3 The M&LS fronting transaction incepted on 1 October 2015 and had no subsequent impact on the net underwriting result or insurance profit.
The transaction was terminated in March 2017.4 Transactions to reinsure US liabilities.5 Transactions to reinsure UK liabilities.
Incurred claimsThe Group’s net claims ratio deteriorated to 70.9% from 60.4% in the prior year, reflecting a significant increase in the net cost of catastrophe claims, a higher attritional claims ratio and a reduced level of favourable prior accident year claims development, partially offset by an increase in the impact of risk-free rates used to discount net outstanding claims.
The table below provides a summary of the major components of the net claims ratio.
Analysis of net claims ratioFOR THE YEAR ENDED 31 DECEMBER 2017 2016
STATUTORY%
ADJUSTED1,2
%STATUTORY
%ADJUSTED2,3
%
Attritional claims 56.2 54.3 54.9 52.2 Large individual risk and catastrophe claims 15.2 14.6 9.6 9.1 Impact of reinsurance transactions (0.7) – – – Claims settlement costs 3.2 3.2 2.9 2.8 Claims discount (2.5) (2.5) (1.9) (1.9)Net incurred central estimate claims ratio (current accident year) 71.4 69.6 65.5 62.2 Changes in undiscounted prior accident year central estimate (0.3) (0.3) (3.3) (3.1)Impact of reinsurance transactions (2.9) – (5.2) – Impact of Ogden 1.2 – – – Changes in discount rates (0.6) (0.5) 0.7 0.7 Movement in risk margins 0.7 0.8 (1.2) (0.8)Other (including unwind of prior year discount) 1.4 1.3 1.7 1.4 Net incurred claims ratio (current financial year) 70.9 70.9 58.2 60.4
1 Excludes one-off adverse impact on the Group’s claims incurred due to the Ogden decision in the UK.2 Excludes transactions to reinsure US liabilities. 3 Excludes transactions to reinsure UK liabilities.
Group Chief Financial Officer’s report16
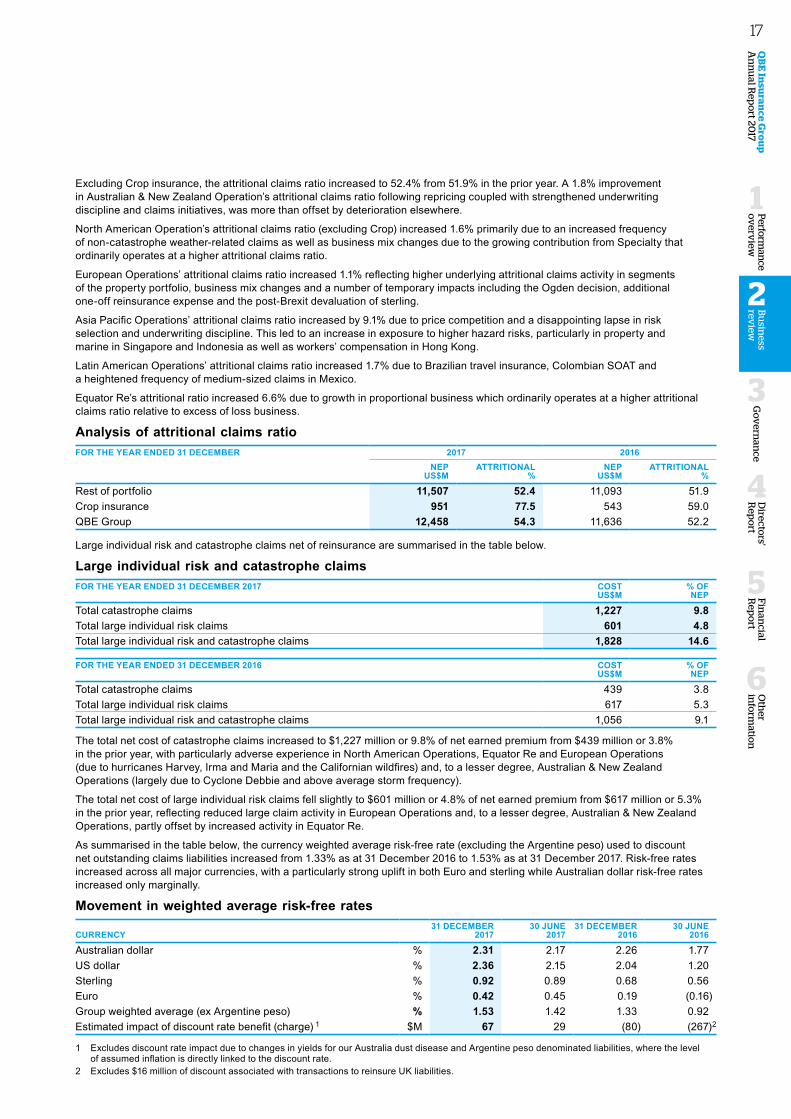
Excluding Crop insurance, the attritional claims ratio increased to 52.4% from 51.9% in the prior year. A 1.8% improvement in Australian & New Zealand Operation’s attritional claims ratio following repricing coupled with strengthened underwriting discipline and claims initiatives, was more than offset by deterioration elsewhere.
North American Operation’s attritional claims ratio (excluding Crop) increased 1.6% primarily due to an increased frequency of non-catastrophe weather-related claims as well as business mix changes due to the growing contribution from Specialty that ordinarily operates at a higher attritional claims ratio.
European Operations’ attritional claims ratio increased 1.1% reflecting higher underlying attritional claims activity in segments of the property portfolio, business mix changes and a number of temporary impacts including the Ogden decision, additional one-off reinsurance expense and the post-Brexit devaluation of sterling.
Asia Pacific Operations’ attritional claims ratio increased by 9.1% due to price competition and a disappointing lapse in risk selection and underwriting discipline. This led to an increase in exposure to higher hazard risks, particularly in property and marine in Singapore and Indonesia as well as workers’ compensation in Hong Kong.
Latin American Operations’ attritional claims ratio increased 1.7% due to Brazilian travel insurance, Colombian SOAT and a heightened frequency of medium-sized claims in Mexico.
Equator Re’s attritional ratio increased 6.6% due to growth in proportional business which ordinarily operates at a higher attritional claims ratio relative to excess of loss business.
Analysis of attritional claims ratioFOR THE YEAR ENDED 31 DECEMBER 2017 2016
NEP US$M
ATTRITIONAL %
NEP US$M
ATTRITIONAL %
Rest of portfolio 11,507 52.4 11,093 51.9 Crop insurance 951 77.5 543 59.0 QBE Group 12,458 54.3 11,636 52.2
Large individual risk and catastrophe claims net of reinsurance are summarised in the table below.
Large individual risk and catastrophe claimsFOR THE YEAR ENDED 31 DECEMBER 2017 COST
US$M% OF NEP
Total catastrophe claims 1,227 9.8Total large individual risk claims 601 4.8Total large individual risk and catastrophe claims 1,828 14.6
FOR THE YEAR ENDED 31 DECEMBER 2016 COST US$M
% OF NEP
Total catastrophe claims 439 3.8 Total large individual risk claims 617 5.3 Total large individual risk and catastrophe claims 1,056 9.1
The total net cost of catastrophe claims increased to $1,227 million or 9.8% of net earned premium from $439 million or 3.8% in the prior year, with particularly adverse experience in North American Operations, Equator Re and European Operations (due to hurricanes Harvey, Irma and Maria and the Californian wildfires) and, to a lesser degree, Australian & New Zealand Operations (largely due to Cyclone Debbie and above average storm frequency).
The total net cost of large individual risk claims fell slightly to $601 million or 4.8% of net earned premium from $617 million or 5.3% in the prior year, reflecting reduced large claim activity in European Operations and, to a lesser degree, Australian & New Zealand Operations, partly offset by increased activity in Equator Re.
As summarised in the table below, the currency weighted average risk-free rate (excluding the Argentine peso) used to discount net outstanding claims liabilities increased from 1.33% as at 31 December 2016 to 1.53% as at 31 December 2017. Risk-free rates increased across all major currencies, with a particularly strong uplift in both Euro and sterling while Australian dollar risk-free rates increased only marginally.
Movement in weighted average risk-free rates
CURRENCY31 DECEMBER
201730 JUNE
201731 DECEMBER
201630 JUNE
2016
Australian dollar % 2.31 2.17 2.26 1.77US dollar % 2.36 2.15 2.04 1.20Sterling % 0.92 0.89 0.68 0.56Euro % 0.42 0.45 0.19 (0.16)Group weighted average (ex Argentine peso) % 1.53 1.42 1.33 0.92Estimated impact of discount rate benefit (charge) 1 $M 67 29 (80) (267) 2
1 Excludes discount rate impact due to changes in yields for our Australia dust disease and Argentine peso denominated liabilities, where the level of assumed inflation is directly linked to the discount rate.
2 Excludes $16 million of discount associated with transactions to reinsure UK liabilities.
Oth
er in
form
ation
6
Fin
ancial
Rep
ort
5
Go
vern
ance
3
Directo
rs' R
epo
rt
4
QB
E In
suran
ce Gro
up
A
nn
ual R
epo
rt 2017
Bu
siness
review
2
Perform
ance
ov
erview
1
17
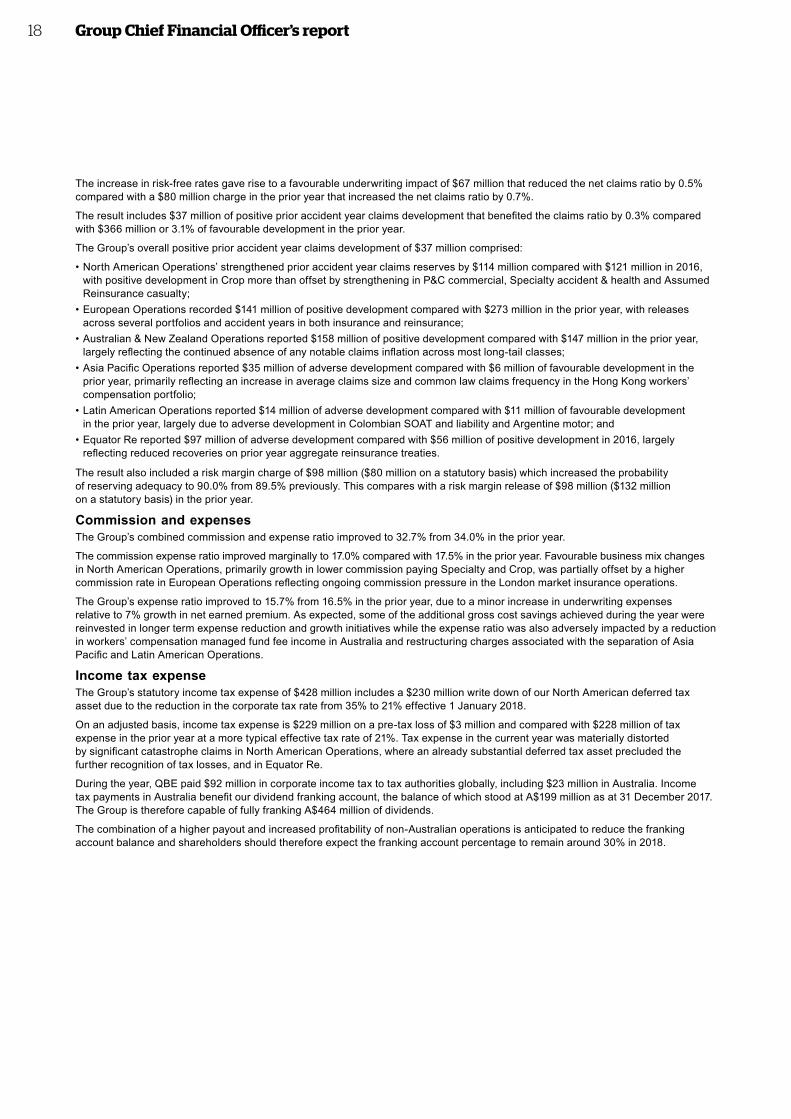
The increase in risk-free rates gave rise to a favourable underwriting impact of $67 million that reduced the net claims ratio by 0.5% compared with a $80 million charge in the prior year that increased the net claims ratio by 0.7%.
The result includes $37 million of positive prior accident year claims development that benefited the claims ratio by 0.3% compared with $366 million or 3.1% of favourable development in the prior year.
The Group’s overall positive prior accident year claims development of $37 million comprised:
• North American Operations’ strengthened prior accident year claims reserves by $114 million compared with $121 million in 2016, with positive development in Crop more than offset by strengthening in P&C commercial, Specialty accident & health and Assumed Reinsurance casualty;
• European Operations recorded $141 million of positive development compared with $273 million in the prior year, with releases across several portfolios and accident years in both insurance and reinsurance;
• Australian & New Zealand Operations reported $158 million of positive development compared with $147 million in the prior year, largely reflecting the continued absence of any notable claims inflation across most long-tail classes;
• Asia Pacific Operations reported $35 million of adverse development compared with $6 million of favourable development in the prior year, primarily reflecting an increase in average claims size and common law claims frequency in the Hong Kong workers’ compensation portfolio;
• Latin American Operations reported $14 million of adverse development compared with $11 million of favourable development in the prior year, largely due to adverse development in Colombian SOAT and liability and Argentine motor; and
• Equator Re reported $97 million of adverse development compared with $56 million of positive development in 2016, largely reflecting reduced recoveries on prior year aggregate reinsurance treaties.
The result also included a risk margin charge of $98 million ($80 million on a statutory basis) which increased the probability of reserving adequacy to 90.0% from 89.5% previously. This compares with a risk margin release of $98 million ($132 million on a statutory basis) in the prior year.
Commission and expenses The Group’s combined commission and expense ratio improved to 32.7% from 34.0% in the prior year.
The commission expense ratio improved marginally to 17.0% compared with 17.5% in the prior year. Favourable business mix changes in North American Operations, primarily growth in lower commission paying Specialty and Crop, was partially offset by a higher commission rate in European Operations reflecting ongoing commission pressure in the London market insurance operations.
The Group’s expense ratio improved to 15.7% from 16.5% in the prior year, due to a minor increase in underwriting expenses relative to 7% growth in net earned premium. As expected, some of the additional gross cost savings achieved during the year were reinvested in longer term expense reduction and growth initiatives while the expense ratio was also adversely impacted by a reduction in workers’ compensation managed fund fee income in Australia and restructuring charges associated with the separation of Asia Pacific and Latin American Operations.
Income tax expenseThe Group’s statutory income tax expense of $428 million includes a $230 million write down of our North American deferred tax asset due to the reduction in the corporate tax rate from 35% to 21% effective 1 January 2018.
On an adjusted basis, income tax expense is $229 million on a pre-tax loss of $3 million and compared with $228 million of tax expense in the prior year at a more typical effective tax rate of 21%. Tax expense in the current year was materially distorted by significant catastrophe claims in North American Operations, where an already substantial deferred tax asset precluded the further recognition of tax losses, and in Equator Re.
During the year, QBE paid $92 million in corporate income tax to tax authorities globally, including $23 million in Australia. Income tax payments in Australia benefit our dividend franking account, the balance of which stood at A$199 million as at 31 December 2017. The Group is therefore capable of fully franking A$464 million of dividends.
The combination of a higher payout and increased profitability of non-Australian operations is anticipated to reduce the franking account balance and shareholders should therefore expect the franking account percentage to remain around 30% in 2018.
Group Chief Financial Officer’s report18
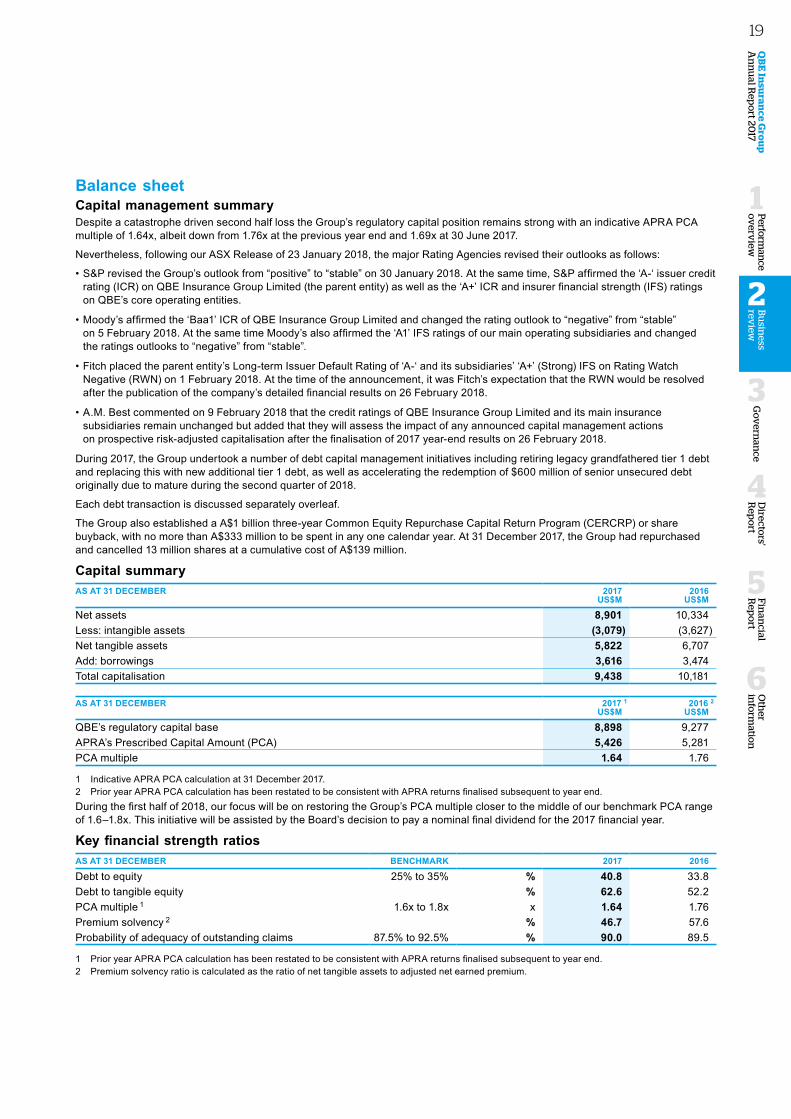
Balance sheet Capital management summaryDespite a catastrophe driven second half loss the Group’s regulatory capital position remains strong with an indicative APRA PCA multiple of 1.64x, albeit down from 1.76x at the previous year end and 1.69x at 30 June 2017.
Nevertheless, following our ASX Release of 23 January 2018, the major Rating Agencies revised their outlooks as follows:
• S&P revised the Group’s outlook from “positive” to “stable” on 30 January 2018. At the same time, S&P affirmed the ‘A-‘ issuer credit rating (ICR) on QBE Insurance Group Limited (the parent entity) as well as the ‘A+’ ICR and insurer financial strength (IFS) ratings on QBE’s core operating entities.
• Moody’s affirmed the ‘Baa1’ ICR of QBE Insurance Group Limited and changed the rating outlook to “negative” from “stable” on 5 February 2018. At the same time Moody’s also affirmed the ‘A1’ IFS ratings of our main operating subsidiaries and changed the ratings outlooks to “negative” from “stable”.
• Fitch placed the parent entity’s Long-term Issuer Default Rating of ‘A-‘ and its subsidiaries’ ‘A+’ (Strong) IFS on Rating Watch Negative (RWN) on 1 February 2018. At the time of the announcement, it was Fitch’s expectation that the RWN would be resolved after the publication of the company’s detailed financial results on 26 February 2018.
• A.M. Best commented on 9 February 2018 that the credit ratings of QBE Insurance Group Limited and its main insurance subsidiaries remain unchanged but added that they will assess the impact of any announced capital management actions on prospective risk-adjusted capitalisation after the finalisation of 2017 year-end results on 26 February 2018.
During 2017, the Group undertook a number of debt capital management initiatives including retiring legacy grandfathered tier 1 debt and replacing this with new additional tier 1 debt, as well as accelerating the redemption of $600 million of senior unsecured debt originally due to mature during the second quarter of 2018.
Each debt transaction is discussed separately overleaf.
The Group also established a A$1 billion three-year Common Equity Repurchase Capital Return Program (CERCRP) or share buyback, with no more than A$333 million to be spent in any one calendar year. At 31 December 2017, the Group had repurchased and cancelled 13 million shares at a cumulative cost of A$139 million.
Capital summaryAS AT 31 DECEMBER 2017
US$M2016
US$M
Net assets 8,901 10,334Less: intangible assets (3,079) (3,627)Net tangible assets 5,822 6,707Add: borrowings 3,616 3,474Total capitalisation 9,438 10,181
AS AT 31 DECEMBER 2017 1
US$M2016 2
US$M
QBE’s regulatory capital base 8,898 9,277APRA’s Prescribed Capital Amount (PCA) 5,426 5,281PCA multiple 1.64 1.76
1 Indicative APRA PCA calculation at 31 December 2017.2 Prior year APRA PCA calculation has been restated to be consistent with APRA returns finalised subsequent to year end.During the first half of 2018, our focus will be on restoring the Group’s PCA multiple closer to the middle of our benchmark PCA range of 1.6–1.8x. This initiative will be assisted by the Board’s decision to pay a nominal final dividend for the 2017 financial year.
Key financial strength ratiosAS AT 31 DECEMBER BENCHMARK 2017 2016
Debt to equity 25% to 35% % 40.8 33.8Debt to tangible equity % 62.6 52.2PCA multiple 1 1.6x to 1.8x x 1.64 1.76Premium solvency 2 % 46.7 57.6Probability of adequacy of outstanding claims 87.5% to 92.5% % 90.0 89.5
1 Prior year APRA PCA calculation has been restated to be consistent with APRA returns finalised subsequent to year end.2 Premium solvency ratio is calculated as the ratio of net tangible assets to adjusted net earned premium.
Oth
er in
form
ation
6
Fin
ancial
Rep
ort
5
Go
vern
ance
3
Directo
rs' R
epo
rt
4
QB
E In
suran
ce Gro
up
A
nn
ual R
epo
rt 2017
Bu
siness
review
2
Perform
ance
ov
erview
1
19
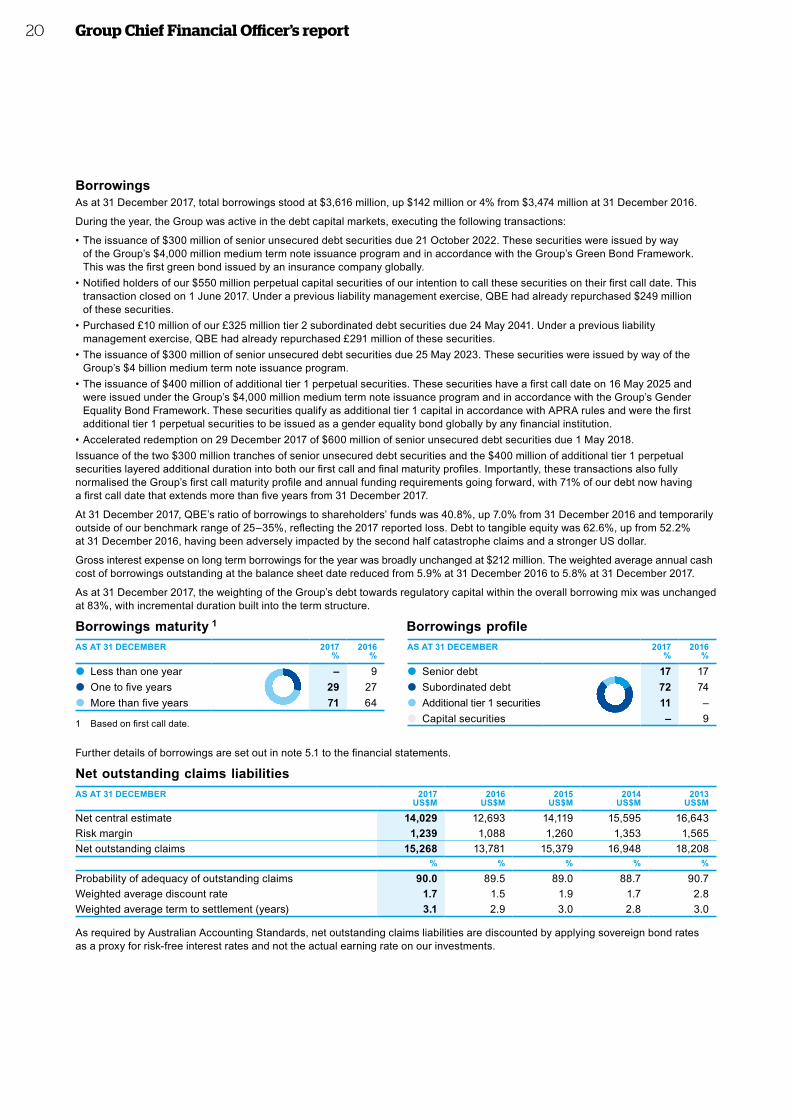
BorrowingsAs at 31 December 2017, total borrowings stood at $3,616 million, up $142 million or 4% from $3,474 million at 31 December 2016.
During the year, the Group was active in the debt capital markets, executing the following transactions:
• The issuance of $300 million of senior unsecured debt securities due 21 October 2022. These securities were issued by way of the Group’s $4,000 million medium term note issuance program and in accordance with the Group’s Green Bond Framework. This was the first green bond issued by an insurance company globally.
• Notified holders of our $550 million perpetual capital securities of our intention to call these securities on their first call date. This transaction closed on 1 June 2017. Under a previous liability management exercise, QBE had already repurchased $249 million of these securities.
• Purchased £10 million of our £325 million tier 2 subordinated debt securities due 24 May 2041. Under a previous liability management exercise, QBE had already repurchased £291 million of these securities.
• The issuance of $300 million of senior unsecured debt securities due 25 May 2023. These securities were issued by way of the Group’s $4 billion medium term note issuance program.
• The issuance of $400 million of additional tier 1 perpetual securities. These securities have a first call date on 16 May 2025 and were issued under the Group’s $4,000 million medium term note issuance program and in accordance with the Group’s Gender Equality Bond Framework. These securities qualify as additional tier 1 capital in accordance with APRA rules and were the first additional tier 1 perpetual securities to be issued as a gender equality bond globally by any financial institution.
• Accelerated redemption on 29 December 2017 of $600 million of senior unsecured debt securities due 1 May 2018.Issuance of the two $300 million tranches of senior unsecured debt securities and the $400 million of additional tier 1 perpetual securities layered additional duration into both our first call and final maturity profiles. Importantly, these transactions also fully normalised the Group’s first call maturity profile and annual funding requirements going forward, with 71% of our debt now having a first call date that extends more than five years from 31 December 2017.
At 31 December 2017, QBE’s ratio of borrowings to shareholders’ funds was 40.8%, up 7.0% from 31 December 2016 and temporarily outside of our benchmark range of 25–35%, reflecting the 2017 reported loss. Debt to tangible equity was 62.6%, up from 52.2% at 31 December 2016, having been adversely impacted by the second half catastrophe claims and a stronger US dollar.
Gross interest expense on long term borrowings for the year was broadly unchanged at $212 million. The weighted average annual cash cost of borrowings outstanding at the balance sheet date reduced from 5.9% at 31 December 2016 to 5.8% at 31 December 2017.
As at 31 December 2017, the weighting of the Group’s debt towards regulatory capital within the overall borrowing mix was unchanged at 83%, with incremental duration built into the term structure.
Borrowings maturity 1 Borrowings profileAS AT 31 DECEMBER 2017
%2016
%AS AT 31 DECEMBER 2017
%2016
%
Less than one year
Borrowings maturity
Borrowings pro�le
– 9 Senior debtBorrowings
maturityBorrowings
pro�le 17 17One to five years 29 27 Subordinated debt 72 74More than five years 71 64 Additional tier 1 securities 11 –
Capital securities – 91 Based on first call date.
Further details of borrowings are set out in note 5.1 to the financial statements.
Net outstanding claims liabilitiesAS AT 31 DECEMBER 2017
US$M2016
US$M2015
US$M2014
US$M2013
US$M
Net central estimate 14,029 12,693 14,119 15,595 16,643Risk margin 1,239 1,088 1,260 1,353 1,565Net outstanding claims 15,268 13,781 15,379 16,948 18,208
% % % % %
Probability of adequacy of outstanding claims 90.0 89.5 89.0 88.7 90.7Weighted average discount rate 1.7 1.5 1.9 1.7 2.8Weighted average term to settlement (years) 3.1 2.9 3.0 2.8 3.0
As required by Australian Accounting Standards, net outstanding claims liabilities are discounted by applying sovereign bond rates as a proxy for risk-free interest rates and not the actual earning rate on our investments.
Group Chief Financial Officer’s report20
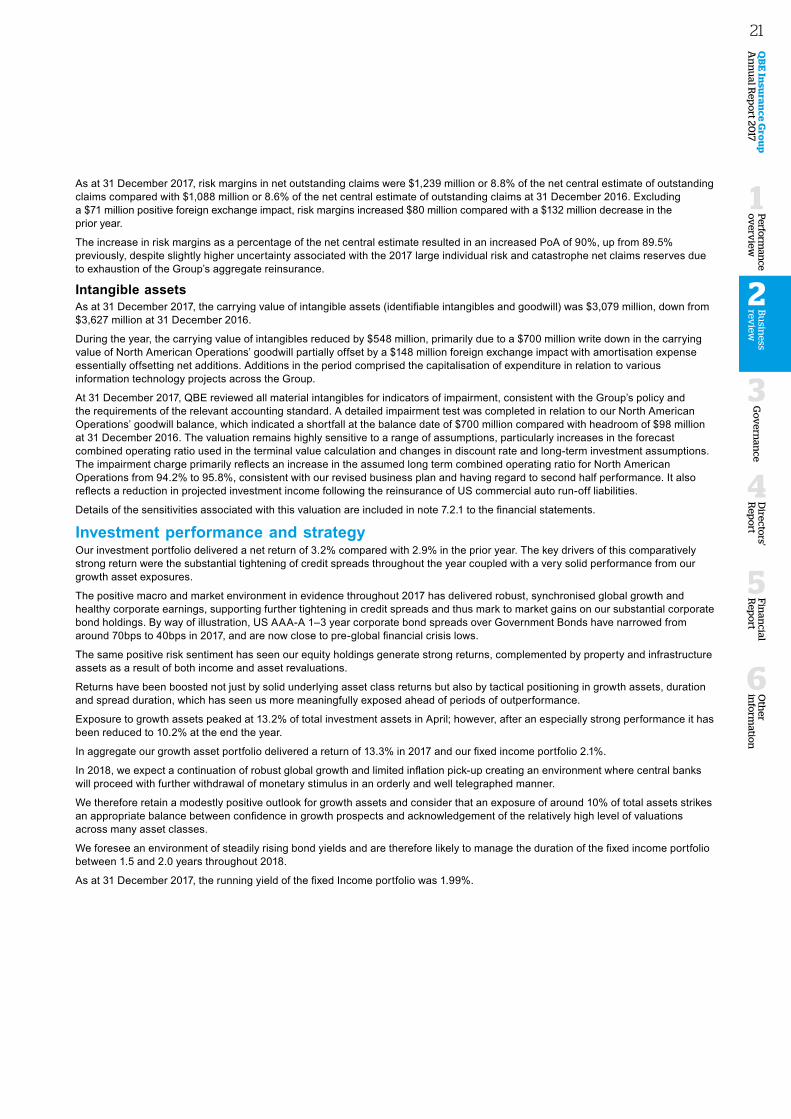
As at 31 December 2017, risk margins in net outstanding claims were $1,239 million or 8.8% of the net central estimate of outstanding claims compared with $1,088 million or 8.6% of the net central estimate of outstanding claims at 31 December 2016. Excluding a $71 million positive foreign exchange impact, risk margins increased $80 million compared with a $132 million decrease in the prior year.
The increase in risk margins as a percentage of the net central estimate resulted in an increased PoA of 90%, up from 89.5% previously, despite slightly higher uncertainty associated with the 2017 large individual risk and catastrophe net claims reserves due to exhaustion of the Group’s aggregate reinsurance.
Intangible assets As at 31 December 2017, the carrying value of intangible assets (identifiable intangibles and goodwill) was $3,079 million, down from $3,627 million at 31 December 2016.
During the year, the carrying value of intangibles reduced by $548 million, primarily due to a $700 million write down in the carrying value of North American Operations’ goodwill partially offset by a $148 million foreign exchange impact with amortisation expense essentially offsetting net additions. Additions in the period comprised the capitalisation of expenditure in relation to various information technology projects across the Group.
At 31 December 2017, QBE reviewed all material intangibles for indicators of impairment, consistent with the Group’s policy and the requirements of the relevant accounting standard. A detailed impairment test was completed in relation to our North American Operations’ goodwill balance, which indicated a shortfall at the balance date of $700 million compared with headroom of $98 million at 31 December 2016. The valuation remains highly sensitive to a range of assumptions, particularly increases in the forecast combined operating ratio used in the terminal value calculation and changes in discount rate and long-term investment assumptions. The impairment charge primarily reflects an increase in the assumed long term combined operating ratio for North American Operations from 94.2% to 95.8%, consistent with our revised business plan and having regard to second half performance. It also reflects a reduction in projected investment income following the reinsurance of US commercial auto run-off liabilities.
Details of the sensitivities associated with this valuation are included in note 7.2.1 to the financial statements.
Investment performance and strategy Our investment portfolio delivered a net return of 3.2% compared with 2.9% in the prior year. The key drivers of this comparatively strong return were the substantial tightening of credit spreads throughout the year coupled with a very solid performance from our growth asset exposures.
The positive macro and market environment in evidence throughout 2017 has delivered robust, synchronised global growth and healthy corporate earnings, supporting further tightening in credit spreads and thus mark to market gains on our substantial corporate bond holdings. By way of illustration, US AAA-A 1–3 year corporate bond spreads over Government Bonds have narrowed from around 70bps to 40bps in 2017, and are now close to pre-global financial crisis lows.
The same positive risk sentiment has seen our equity holdings generate strong returns, complemented by property and infrastructure assets as a result of both income and asset revaluations.
Returns have been boosted not just by solid underlying asset class returns but also by tactical positioning in growth assets, duration and spread duration, which has seen us more meaningfully exposed ahead of periods of outperformance.
Exposure to growth assets peaked at 13.2% of total investment assets in April; however, after an especially strong performance it has been reduced to 10.2% at the end the year.
In aggregate our growth asset portfolio delivered a return of 13.3% in 2017 and our fixed income portfolio 2.1%.
In 2018, we expect a continuation of robust global growth and limited inflation pick-up creating an environment where central banks will proceed with further withdrawal of monetary stimulus in an orderly and well telegraphed manner.
We therefore retain a modestly positive outlook for growth assets and consider that an exposure of around 10% of total assets strikes an appropriate balance between confidence in growth prospects and acknowledgement of the relatively high level of valuations across many asset classes.
We foresee an environment of steadily rising bond yields and are therefore likely to manage the duration of the fixed income portfolio between 1.5 and 2.0 years throughout 2018.
As at 31 December 2017, the running yield of the fixed Income portfolio was 1.99%.
Oth
er in
form
ation
6
Fin
ancial
Rep
ort
5
Go
vern
ance
3
Directo
rs' R
epo
rt
4
QB
E In
suran
ce Gro
up
A
nn
ual R
epo
rt 2017
Bu
siness
review
2
Perform
ance
ov
erview
1
21
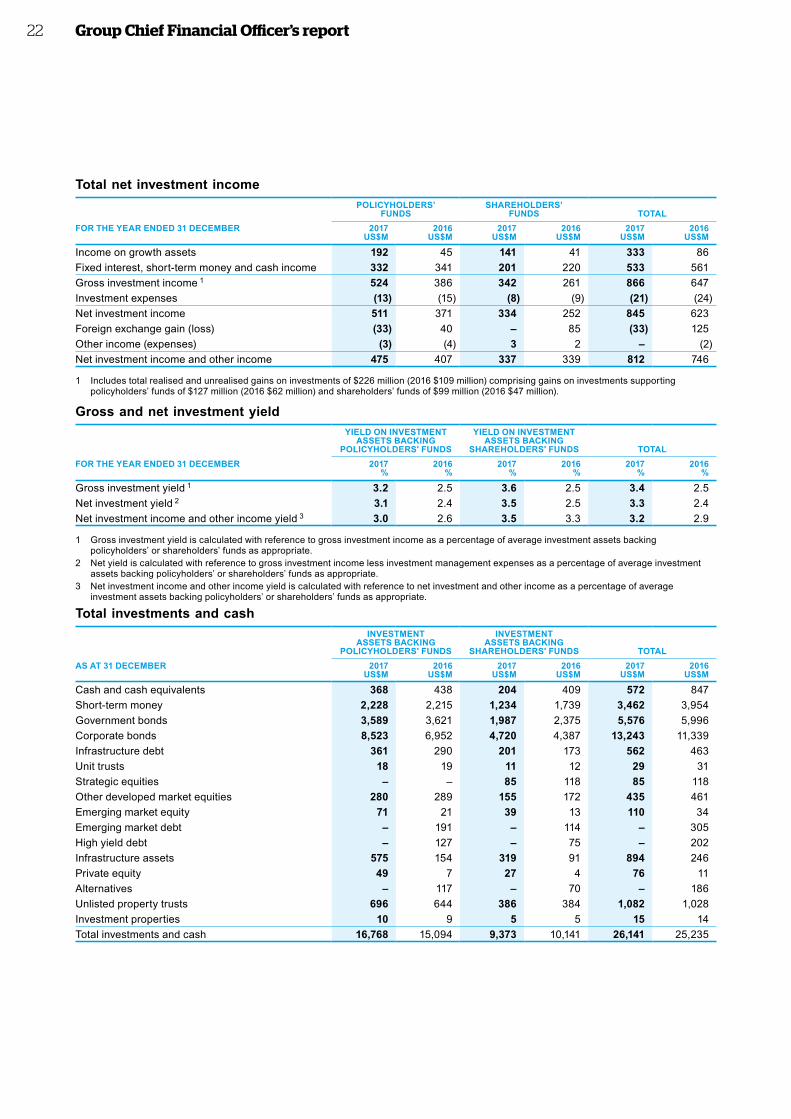
Total net investment income
POLICYHOLDERS’
FUNDSSHAREHOLDERS’
FUNDS TOTALFOR THE YEAR ENDED 31 DECEMBER 2017
US$M2016
US$M2017
US$M2016
US$M2017
US$M2016
US$M
Income on growth assets 192 45 141 41 333 86Fixed interest, short-term money and cash income 332 341 201 220 533 561Gross investment income 1 524 386 342 261 866 647Investment expenses (13) (15) (8) (9) (21) (24)Net investment income 511 371 334 252 845 623Foreign exchange gain (loss) (33) 40 – 85 (33) 125Other income (expenses) (3) (4) 3 2 – (2)Net investment income and other income 475 407 337 339 812 746
1 Includes total realised and unrealised gains on investments of $226 million (2016 $109 million) comprising gains on investments supporting policyholders’ funds of $127 million (2016 $62 million) and shareholders’ funds of $99 million (2016 $47 million).
Gross and net investment yield
YIELD ON INVESTMENT ASSETS BACKING
POLICYHOLDERS' FUNDS
YIELD ON INVESTMENT ASSETS BACKING
SHAREHOLDERS' FUNDS TOTALFOR THE YEAR ENDED 31 DECEMBER 2017
%2016
%2017
%2016
%2017
%2016
%
Gross investment yield 1 3.2 2.5 3.6 2.5 3.4 2.5Net investment yield 2 3.1 2.4 3.5 2.5 3.3 2.4Net investment income and other income yield 3 3.0 2.6 3.5 3.3 3.2 2.9
1 Gross investment yield is calculated with reference to gross investment income as a percentage of average investment assets backing policyholders’ or shareholders’ funds as appropriate.
2 Net yield is calculated with reference to gross investment income less investment management expenses as a percentage of average investment assets backing policyholders’ or shareholders’ funds as appropriate.
3 Net investment income and other income yield is calculated with reference to net investment and other income as a percentage of average investment assets backing policyholders’ or shareholders’ funds as appropriate.
Total investments and cashINVESTMENT
ASSETS BACKING POLICYHOLDERS' FUNDS
INVESTMENT ASSETS BACKING
SHAREHOLDERS' FUNDS TOTALAS AT 31 DECEMBER 2017
US$M2016
US$M2017
US$M2016
US$M2017
US$M2016
US$M
Cash and cash equivalents 368 438 204 409 572 847 Short-term money 2,228 2,215 1,234 1,739 3,462 3,954 Government bonds 3,589 3,621 1,987 2,375 5,576 5,996 Corporate bonds 8,523 6,952 4,720 4,387 13,243 11,339 Infrastructure debt 361 290 201 173 562 463 Unit trusts 18 19 11 12 29 31 Strategic equities – – 85 118 85 118 Other developed market equities 280 289 155 172 435 461 Emerging market equity 71 21 39 13 110 34 Emerging market debt – 191 – 114 – 305 High yield debt – 127 – 75 – 202 Infrastructure assets 575 154 319 91 894 246Private equity 49 7 27 4 76 11Alternatives – 117 – 70 – 186Unlisted property trusts 696 644 386 384 1,082 1,028 Investment properties 10 9 5 5 15 14 Total investments and cash 16,768 15,094 9,373 10,141 26,141 25,235
Group Chief Financial Officer’s report22
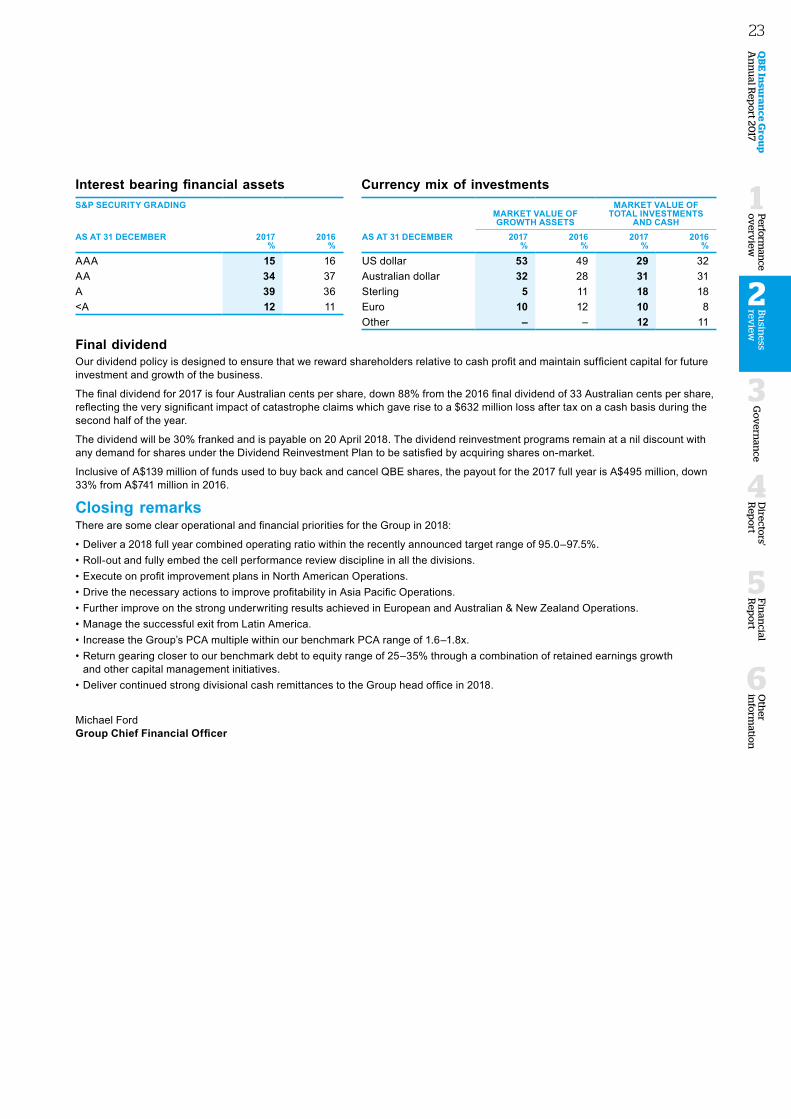
Interest bearing financial assets Currency mix of investmentsS&P SECURITY GRADING
2017%
2016%
MARKET VALUE OF GROWTH ASSETS
MARKET VALUE OFTOTAL INVESTMENTS
AND CASH AS AT 31 DECEMBER AS AT 31 DECEMBER 2017
% 2016
%2017
% 2016
%
AAA 15 16 US dollar 53 49 29 32AA 34 37 Australian dollar 32 28 31 31 A 39 36 Sterling 5 11 18 18 <A 12 11 Euro 10 12 10 8
Other – – 12 11
Final dividendOur dividend policy is designed to ensure that we reward shareholders relative to cash profit and maintain sufficient capital for future investment and growth of the business.
The final dividend for 2017 is four Australian cents per share, down 88% from the 2016 final dividend of 33 Australian cents per share, reflecting the very significant impact of catastrophe claims which gave rise to a $632 million loss after tax on a cash basis during the second half of the year.
The dividend will be 30% franked and is payable on 20 April 2018. The dividend reinvestment programs remain at a nil discount with any demand for shares under the Dividend Reinvestment Plan to be satisfied by acquiring shares on-market.
Inclusive of A$139 million of funds used to buy back and cancel QBE shares, the payout for the 2017 full year is A$495 million, down 33% from A$741 million in 2016.
Closing remarksThere are some clear operational and financial priorities for the Group in 2018:
• Deliver a 2018 full year combined operating ratio within the recently announced target range of 95.0–97.5%.• Roll-out and fully embed the cell performance review discipline in all the divisions.• Execute on profit improvement plans in North American Operations.• Drive the necessary actions to improve profitability in Asia Pacific Operations.• Further improve on the strong underwriting results achieved in European and Australian & New Zealand Operations.• Manage the successful exit from Latin America.• Increase the Group’s PCA multiple within our benchmark PCA range of 1.6–1.8x. • Return gearing closer to our benchmark debt to equity range of 25–35% through a combination of retained earnings growth
and other capital management initiatives.• Deliver continued strong divisional cash remittances to the Group head office in 2018.
Michael Ford Group Chief Financial Officer
Oth
er in
form
ation
6
Fin
ancial
Rep
ort
5
Go
vern
ance
3
Directo
rs' R
epo
rt
4
QB
E In
suran
ce Gro
up
A
nn
ual R
epo
rt 2017
Bu
siness
review
2
Perform
ance
ov
erview
1
23