Embed Size (px)
Citation preview
CHAPTER 7 Financial Assets
After studying this chapter,
you should be able to:
L.O. 7-1. Explain what
fi nancial assets are, how they
differ from other types of assets,
and why there is a variety of mea-
surement standards for different
categories of fi nancial assets.
L.O. 7-2. Evaluate the nature
of a fi nancial asset to classify it
into one of seven categories: sub-
sidiaries, joint operations, joint
ventures, associates, fair value
through profi t or loss, fair value
through OCI, and amortized cost.
L.O. 7-3. Identify the
measurement approach appropri-
ate to the seven categories of
fi nancial assets and explain the
general nature of the various
measurement approaches.
L.O. 7-4. Analyze historical
cost and fair value information
to determine the appropriate
post-purchase balance sheet
measurement and income
recognition for three categories
of fi nancial assets: fair value
through profi t or loss, fair value
through OCI, and amortized cost.
L.O. 7-5. Apply present
value techniques to account for
investments in debt instruments.
LEARNING OBJECTIVES
The Bank of Montreal, also known as BMO Financial Group ( www.bmo.com ,
Toronto Stock Exchange ticker: BMO), is one of the six national chartered banks
in Canada with a history dating back almost two centuries to 1817. Among the
company’s $537 billion in assets reported on its balance sheet of October 31,
2013, are the following fi nancial assets (in billions of dollars):
Measurement basis Amount
Fair value, with changes fl owing through profi t or loss $ 75.2
Fair value, with changes fl owing through OCI 53.1
Amortized cost 278.3
Consolidation (17 companies) † —
Total $406.6
† The amount for subsidiaries is not presented in this table because there is no single amount on the fi nancial statements that would represent the investment in subsidiaries.
The items in this table raise a number of interesting questions. What is the
meaning of the different measurement bases? What types of assets are in each
category? Why is there such a variety of reporting methods?
CPA competencies addressed in this chapter: 1.1.2 Evaluates the appropriateness of the basis of fi nancial reporting (Level B) b. Methods of measurement 1.2.1 Develops or evaluates appropriate accounting policies and procedures – Ethical professional
judgment (Level B) 1.2.2 Evaluates treatment for routine transactions (Level A) k. Financial instruments l. Investments in associates/signifi cant infl uence * 1.2.3 Evaluates treatment of non-routine transactions (Level B) h. Consolidated fi nancial statements subsequent to acquisition date * i. Joint ventures: proportionate consolidation or equity method * 1.3.2 Prepares routine fi nancial statement note disclosure (Level B)
292
* These items are discussed at Level C in this chapter, as they are covered in greater detail in advanced textbooks and courses.
M07_LO5943_SE_03_C07.indd 292M07_LO5943_SE_03_C07.indd 292 11/06/15 1:51 PM11/06/15 1:51 PM
A . In t roduct ion 293
A. INTRODUCTION What are fi nancial assets and how do they diff er from other kinds of assets? In account-ing, fi nance, and to a large extent in general usage, fi nancial assets are those based on contractual agreements relating to future cash fl ows. Common examples of fi nan-cial assets are investments in stocks and bonds; these investments entitle the holder to future dividends and interest, even if those future payments could be uncertain. An investment in equipment is not a fi nancial asset—while the equipment could help gen-erate future cash fl ows, there is no contract that identifi es the potential cash fl owing to the owner of the equipment. Items such as equipment, land, buildings, and inventory are typically called “real assets.” 1
Because financial assets are based on contracts, another way to think about the difference between financial and real assets is to consider whether there is a “counterparty.” An investment in shares has a counterparty who issued those shares and who is expected to pay dividends in the future. An investment in bonds has a counterparty who is obligated to repay interest and principal on the bonds. A financial asset appears on the left-hand side of the balance sheet of the investor;
fi nancial asset An asset arising
from contractual agreements on
future cash fl ows.
L.O. 7-1. Explain what
fi nancial assets are, how they
differ from other types of assets,
and why there is a variety of mea-
surement standards for different
categories of fi nancial assets.
CONTENTS
A. INTRODUCTION 293
B. OVERVIEW OF FINANCIAL ASSET CLASSIFICATION 295
C. STRATEGIC EQUITY INVESTMENTS 296
1. Subsidiaries 296
2. Joint operations 298
3. Joint ventures 299
4. Associates 300
D. NON-STRATEGIC INVESTMENTS 302
1. Fair value through profi t or loss (FVPL) 303
2. Fair value through other comprehensive income (FVOCI) 305
3. Amortized cost 305
4. Exception for equity investments with an irrevocable election 305
5. Reclassifi cations from one category to another 307
6. Example: A debt investment to illustrate the differences among FVPL, FVOCI,
and amortized cost 308
E. AMORTIZATION OF DEBT INVESTMENTS 311
1. The effective interest method 311
2. Using amortized cost in the accounting for fi nancial assets 313
F. IMPAIRMENT OF INVESTMENTS IN DEBT 316
G. SUBSTANTIVE DIFFERENCES BETWEEN RELEVANT IFRS AND ASPE 316
H. SUMMARY 317
I. ANSWERS TO CHECKPOINT QUESTIONS 318
J. GLOSSARY 318
K. REFERENCES 319
L. PROBLEMS 319
M. MINI-CASES 332
7
1. “Real assets” should not be confused with “real property,” which is a term originating from common law referring to land and buildings (i.e., real estate).
293
M07_LO5943_SE_03_C07.indd 293M07_LO5943_SE_03_C07.indd 293 11/06/15 1:51 PM11/06/15 1:51 PM
294 CHAPTER 7 F inanc ia l Asse ts
a similar item should be on the right-hand side of the balance sheet of the coun-terparty as a liability or equity. Thinking about it this way, it is clear that a piece of equipment is not a financial asset—there is no counterparty opposite the equip-ment owner, and the equipment does not appear on the right-hand side of anyone’s balance sheet.
From the above, we can see that one entity’s fi nancial asset and the counterparty’s liability or equity are two sides of the same coin. That “coin” is a fi nancial instrument , which is formally defi ned as follows in IAS 32 paragraph 11:
¶11 A financial instrument is any contract that gives rise to a financial asset of one entity and a financial liability or equity instrument of another entity. 2
This chapter will focus on the asset side of fi nancial instruments ; Chapters 11 through 14 discuss financial liabilities, equity, and more complex financial instruments.
The most important accounting issue for fi nancial assets is the measurement basis for reporting their values on the balance sheet date. There is no single mea-surement basis that is suitable for all fi nancial assets because the trade-off between the relevance and other qualitative characteristics of those measurements depends on management’s intent with respect to those investments. For instance, an enter-prise investing in the common shares of another company can own anywhere from a small fraction up to 100% of the latter company. When the investment is relatively small, the market price (if available) is a relevant and verifi able measure of how much the company would be able to obtain from selling those shares. In the case where one company (the “parent”) owns a majority of the shares of another (the “subsidiary”), the market price is not particularly relevant because in such instances the parent does not intend to sell its holdings. In addition, the majority ownership implies a special economic relationship between the two companies—a relationship that would signifi cantly change if the parent company were to sell its shares in the subsidiary. The parent also has inside information about the subsidiary not available to potential buyers. For all these reasons, the subsidiary’s share price (again, if avail-able), which is based on publicly available information, is not necessarily a reliable indicator of value of the subsidiary to the parent.
The need for diff erent measurement bases, however, does not imply that all mea-surement bases are possible for every kind of investment. Instead, accounting standards specify the criteria for diff erent classifi cations of fi nancial assets and the corresponding accounting treatment that is judged to be appropriate for that category. These stan-dards have experienced signifi cant changes over the last two decades, with this chapter refl ecting the recent comprehensive overhaul in IFRS 9 issued in 2014 and eff ective beginning January 1, 2017.
The next section lays out a comprehensive system for classifying fi nancial assets and provides an overview of the accounting method appropriate to each category. Sec-tions C, D, and E will then look at the accounting for specifi c types of fi nancial assets in more detail.
fi nancial instrument Any contract
that gives rise to (i) a fi nancial asset
for one entity and (ii) a fi nancial
liability or equity instrument for
another entity.
INFORMATION ASYMMETRY
THRESHOLDCONCEPT
CONCEPTUAL FRAMEWORK
THRESHOLDCONCEPT
2. Copyright (c) 2012 IFRS Foundation.
CHECKPOINT CP7-1 Why are accounts receivable fi nancial assets and inventories are not?
M07_LO5943_SE_03_C07.indd 294M07_LO5943_SE_03_C07.indd 294 11/06/15 1:51 PM11/06/15 1:51 PM

B. Overv iew o f F inanc ia l Asse t C lass i f i ca t i on 295
B. OVERVIEW OF FINANCIAL ASSET CLASSIFICATION
In general, people tend to think about fi nancial instruments in terms of whether they have the nature of equity, a derivative, or debt. These three general groupings refl ect the economic characteristics of the instruments themselves. An equity instrument is a contract that gives the holder the residual interest in an entity after deducting all of its liabilities; an example is common share (see IFRS—IAS 32). A derivative is a fi nancial instrument with all three of the following characteristics: (i) its value changes accord-ing to a specifi ed variable, such as an interest rate, stock price, and so on; (ii) it requires no initial net investment or a small investment relative to non-derivative contracts with similar exposure to the specifi ed variable; and (iii) it is settled at a future date. An example of a derivative is a stock option, which entitles the holder of the option to buy (or sell) a certain number of shares at a particular price over a specifi ed period of time. A debt instrument , while not specifi cally defi ned in IFRS, includes any fi nan-cial instrument that is not an equity instrument or a derivative. A bond is a common example of a debt instrument.
While this three-way grouping is useful for describing the nature of the fi nancial instruments, they are not suffi ciently specifi c to refl ect the reasons why enterprises invest in them, and those reasons are important factors in determining the appropri-ate accounting method. As a result, accounting standards separate fi nancial assets into seven mutually exclusive categories: 3
1. subsidiaries 2. investments in joint operations 3. investments in joint ventures 4. investments in associated companies 5. measured at fair value through profi t or loss (FVPL) 6. measured at fair value through other comprehensive income (FVOCI) 7. measured at amortized cost
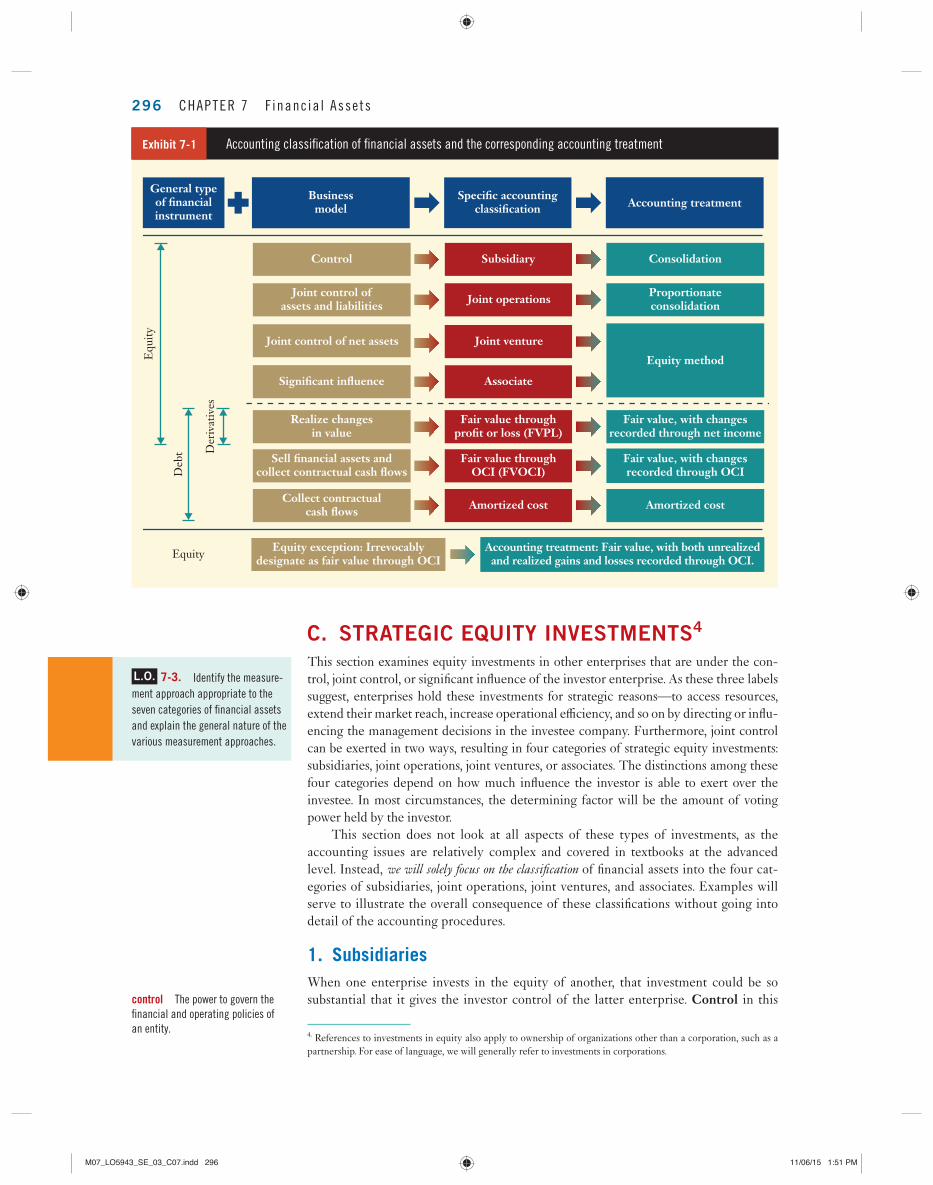
These categories will be explained more fully below. At this point, it is useful to obtain an overview of how these seven categories arise, how they relate to the three-way grouping (equity, derivative, debt), and which accounting methods are appropriate for each. Exhibit 7-1 illustrates these relationships.
As this diagram shows, depending on the reason for the investment, an equity investment can be classifi ed into one of fi ve categories: a subsidiary, a joint opera-tion, a joint venture, an associate, FVPL. In contrast, derivatives are always classifi ed as FVPL. Investments in debt instruments can be classifi ed as FVPL, FVOCI or amortized cost.
We now look at each of the seven categories of financial assets individually in the following two sections. Section C will look at the top four categories in Exhibit 7-1 , which are known as strategic equity investments and usually held for the long term. Section D will look at the remaining categories, which are non-strategic in nature.
equity instrument A contract that
gives the holder the residual interest
in an entity after deducting all of its
liabilities; an example is a common
share.
derivative A fi nancial instrument
with all three of the following
characteristics: (i) its value changes
according to a specifi ed variable,
such as an interest rate or stock
price; (ii) it requires no initial net
investment or a small investment
relative to non-derivative contracts
with similar exposure to the specifi ed
variable; and (iii) it is settled at a
future date.
debt instrument Any fi nancial
instrument that is not an equity
instrument or a derivative.
3. Technically, cash is another category of fi nancial assets. The accounting for cash is straightforward and previously addressed in Chapter 5 , so it is not repeated here.
L.O. 7-2. Evaluate the nature
of a fi nancial asset to classify
it into one of seven categories:
subsidiaries, joint operations, joint
ventures, associates, fair value
through profi t or loss, fair value
through OCI, and amortized cost.
CHECKPOINT CP7-2
Why is it not suffi cient to simply identify investments as equity, debt, or a derivative
for accounting purposes?
M07_LO5943_SE_03_C07.indd 295M07_LO5943_SE_03_C07.indd 295 11/06/15 1:51 PM11/06/15 1:51 PM
296 CHAPTER 7 F inanc ia l Asse ts
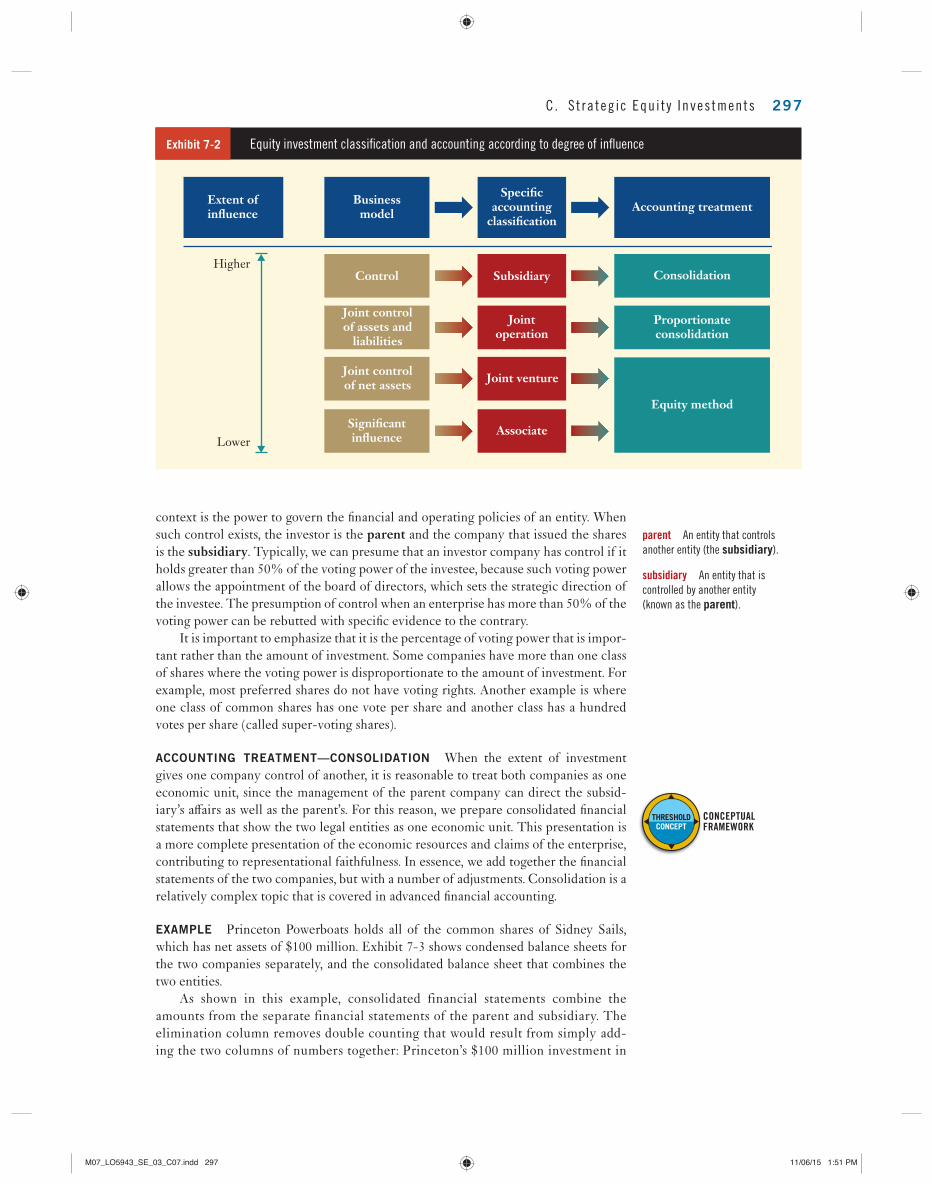
C. STRATEGIC EQUITY INVESTMENTS 4 This section examines equity investments in other enterprises that are under the con-trol, joint control, or signifi cant infl uence of the investor enterprise. As these three labels suggest, enterprises hold these investments for strategic reasons—to access resources, extend their market reach, increase operational effi ciency, and so on by directing or infl u-encing the management decisions in the investee company. Furthermore, joint control can be exerted in two ways, resulting in four categories of strategic equity investments: subsidiaries, joint operations, joint ventures, or associates. The distinctions among these four categories depend on how much infl uence the investor is able to exert over the investee. In most circumstances, the determining factor will be the amount of voting power held by the investor.
This section does not look at all aspects of these types of investments, as the accounting issues are relatively complex and covered in textbooks at the advanced level. Instead, we will solely focus on the classifi cation of fi nancial assets into the four cat-egories of subsidiaries, joint operations, joint ventures, and associates. Examples will serve to illustrate the overall consequence of these classifi cations without going into detail of the accounting procedures.
1. Subsidiaries
When one enterprise invests in the equity of another, that investment could be so substantial that it gives the investor control of the latter enterprise. Control in this
L.O. 7-3. Identify the measure-
ment approach appropriate to the
seven categories of fi nancial assets
and explain the general nature of the
various measurement approaches.
control The power to govern the
fi nancial and operating policies of
an entity.
Exhibit 7-1 Accounting classifi cation of fi nancial assets and the corresponding accounting treatment
Businessmodel
Equity method
Consolidation
Fair value, with changesrecorded through net income
Fair value, with changesrecorded through OCI
Amortized cost
Accounting treatment
Proportionateconsolidation
Specific accountingclassification
Subsidiary
Joint operations
Joint venture
Associate
Fair value throughprofit or loss (FVPL)
Fair value throughOCI (FVOCI)
Amortized cost
Realize changesin value
Collect contractualcash flows
Sell financial assets andcollect contractual cash flows
Accounting treatment: Fair value, with both unrealizedand realized gains and losses recorded through OCI.
Equity exception: Irrevocablydesignate as fair value through OCIEquity
General typeof financialinstrument
Significant influence
Joint control ofassets and liabilities
Joint control of net assets
Control
Equ
ity
Deb
t Der
ivat
ives
4. References to investments in equity also apply to ownership of organizations other than a corporation, such as a partnership. For ease of language, we will generally refer to investments in corporations.
M07_LO5943_SE_03_C07.indd 296M07_LO5943_SE_03_C07.indd 296 11/06/15 1:51 PM11/06/15 1:51 PM
C. S t ra teg ic Equ i t y Inves tments 297
context is the power to govern the fi nancial and operating policies of an entity. When such control exists, the investor is the parent and the company that issued the shares is the subsidiary . Typically, we can presume that an investor company has control if it holds greater than 50% of the voting power of the investee, because such voting power allows the appointment of the board of directors, which sets the strategic direction of the investee. The presumption of control when an enterprise has more than 50% of the voting power can be rebutted with specifi c evidence to the contrary.
It is important to emphasize that it is the percentage of voting power that is impor-tant rather than the amount of investment. Some companies have more than one class of shares where the voting power is disproportionate to the amount of investment. For example, most preferred shares do not have voting rights. Another example is where one class of common shares has one vote per share and another class has a hundred votes per share (called super-voting shares).
ACCOUNTING TREATMENT—CONSOLIDATION When the extent of investment gives one company control of another, it is reasonable to treat both companies as one economic unit, since the management of the parent company can direct the subsid-iary’s aff airs as well as the parent’s. For this reason, we prepare consolidated fi nancial statements that show the two legal entities as one economic unit. This presentation is a more complete presentation of the economic resources and claims of the enterprise, contributing to representational faithfulness. In essence, we add together the fi nancial statements of the two companies, but with a number of adjustments. Consolidation is a relatively complex topic that is covered in advanced fi nancial accounting.
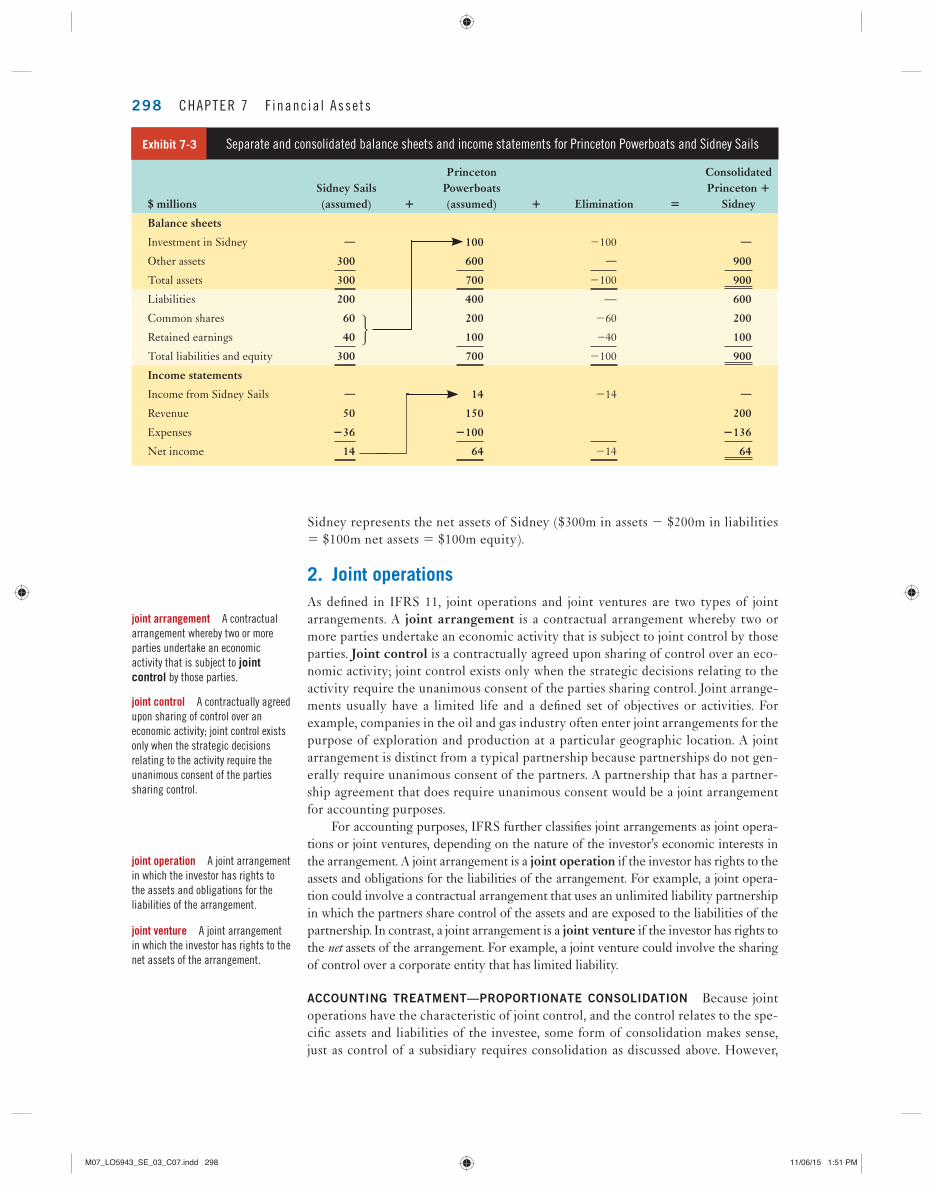
EXAMPLE Princeton Powerboats holds all of the common shares of Sidney Sails, which has net assets of $100 million. Exhibit 7-3 shows condensed balance sheets for the two companies separately, and the consolidated balance sheet that combines the two entities.
As shown in this example, consolidated financial statements combine the amounts from the separate financial statements of the parent and subsidiary. The elimination column removes double counting that would result from simply add-ing the two columns of numbers together: Princeton’s $100 million investment in
parent An entity that controls
another entity (the subsidiary ).
subsidiary An entity that is
controlled by another entity
(known as the parent ).
CONCEPTUAL FRAMEWORK
THRESHOLDCONCEPT
Exhibit 7-2 Equity investment classifi cation and accounting according to degree of infl uence
Equity method
Consolidation
Accounting treatment
Proportionateconsolidation
Extent ofinfluence
Higher
Lower
Businessmodel
Significantinfluence
Joint controlof assets and
liabilities
Control
Joint controlof net assets
Specificaccounting
classification
Subsidiary
Jointoperation
Associate
Joint venture
M07_LO5943_SE_03_C07.indd 297M07_LO5943_SE_03_C07.indd 297 11/06/15 1:51 PM11/06/15 1:51 PM
298 CHAPTER 7 F inanc ia l Asse ts
Sidney represents the net assets of Sidney ($300m in assets 2 $200m in liabilities 5 $100m net assets 5 $100m equity).
2. Joint operations
As defi ned in IFRS 11, joint operations and joint ventures are two types of joint arrangements. A joint arrangement is a contractual arrangement whereby two or more parties undertake an economic activity that is subject to joint control by those parties. Joint control is a contractually agreed upon sharing of control over an eco-nomic activity; joint control exists only when the strategic decisions relating to the activity require the unanimous consent of the parties sharing control. Joint arrange-ments usually have a limited life and a defi ned set of objectives or activities. For example, companies in the oil and gas industry often enter joint arrangements for the purpose of exploration and production at a particular geographic location. A joint arrangement is distinct from a typical partnership because partnerships do not gen-erally require unanimous consent of the partners. A partnership that has a partner-ship agreement that does require unanimous consent would be a joint arrangement for accounting purposes.
For accounting purposes, IFRS further classifi es joint arrangements as joint opera-tions or joint ventures, depending on the nature of the investor’s economic interests in the arrangement. A joint arrangement is a joint operation if the investor has rights to the assets and obligations for the liabilities of the arrangement. For example, a joint opera-tion could involve a contractual arrangement that uses an unlimited liability partnership in which the partners share control of the assets and are exposed to the liabilities of the partnership. In contrast, a joint arrangement is a joint venture if the investor has rights to the net assets of the arrangement. For example, a joint venture could involve the sharing of control over a corporate entity that has limited liability.
ACCOUNTING TREATMENT—PROPORTIONATE CONSOLIDATION Because joint operations have the characteristic of joint control, and the control relates to the spe-cifi c assets and liabilities of the investee, some form of consolidation makes sense, just as control of a subsidiary requires consolidation as discussed above. However,
joint arrangement A contractual
arrangement whereby two or more
parties undertake an economic
activity that is subject to joint
control by those parties.
joint control A contractually agreed
upon sharing of control over an
economic activity; joint control exists
only when the strategic decisions
relating to the activity require the
unanimous consent of the parties
sharing control.
joint operation A joint arrangement
in which the investor has rights to
the assets and obligations for the
liabilities of the arrangement.
joint venture A joint arrangement
in which the investor has rights to the
net assets of the arrangement.
$ millionsSidney Sails (assumed) 1
Princeton Powerboats (assumed) 1 Elimination 5
Consolidated Princeton 1
Sidney
Balance sheets
Investment in Sidney — 100 2100 —
Other assets 300 600 — 900
Total assets 300 700 2100 900
Liabilities 200 400 — 600
Common shares 60 200 260 200
Retained earnings 40 100 −40 100
Total liabilities and equity 300 700 2100 900
Income statements
Income from Sidney Sails — 14 214 —
Revenue 50 150 200
Expenses 236 2100 2136
Net income 14 64 214 64
Exhibit 7-3 Separate and consolidated balance sheets and income statements for Princeton Powerboats and Sidney Sails
J
M07_LO5943_SE_03_C07.indd 298M07_LO5943_SE_03_C07.indd 298 11/06/15 1:51 PM11/06/15 1:51 PM
C. S t ra teg ic Equ i t y Inves tments 299
full consolidation is inappropriate because more than one party shares control. Con-sequently, the appropriate accounting method is proportionate consolidation, which takes the investor’s proportionate share of the joint operation’s assets, liabilities, and income and adds it to the investor’s accounts. For example, if Parson Petroleum is a 40% partner in a joint operation, then it includes 40% of the joint operation in its consolidated fi nancial statements.
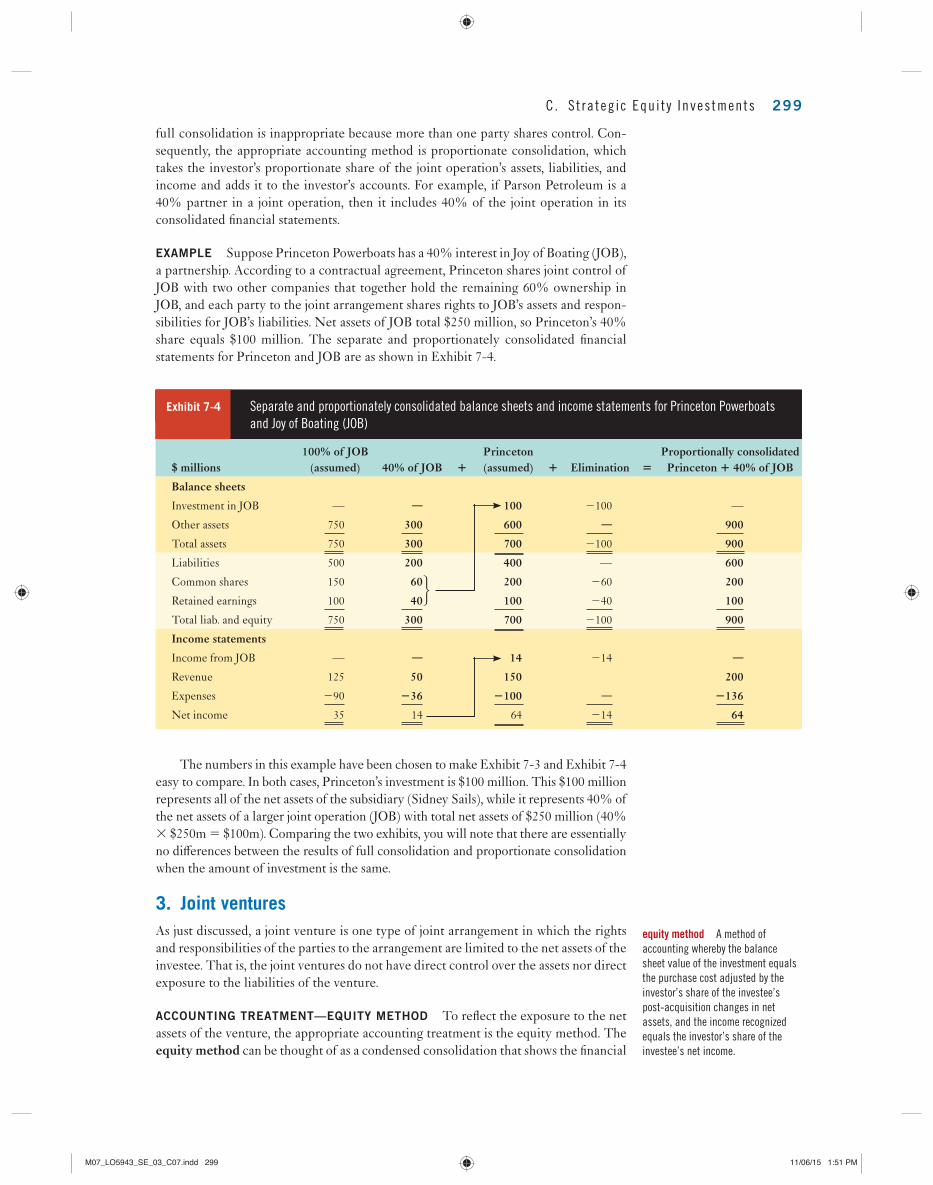
EXAMPLE Suppose Princeton Powerboats has a 40% interest in Joy of Boating (JOB), a partnership. According to a contractual agreement, Princeton shares joint control of JOB with two other companies that together hold the remaining 60% ownership in JOB, and each party to the joint arrangement shares rights to JOB’s assets and respon-sibilities for JOB’s liabilities. Net assets of JOB total $250 million, so Princeton’s 40% share equals $100 million. The separate and proportionately consolidated fi nancial statements for Princeton and JOB are as shown in Exhibit 7-4 .
The numbers in this example have been chosen to make Exhibit 7-3 and Exhibit 7-4 easy to compare. In both cases, Princeton’s investment is $100 million. This $100 million represents all of the net assets of the subsidiary (Sidney Sails), while it represents 40% of the net assets of a larger joint operation (JOB) with total net assets of $250 million (40% 3 $250m 5 $100m). Comparing the two exhibits, you will note that there are essentially no diff erences between the results of full consolidation and proportionate consolidation when the amount of investment is the same.
3. Joint ventures
As just discussed, a joint venture is one type of joint arrangement in which the rights and responsibilities of the parties to the arrangement are limited to the net assets of the investee. That is, the joint ventures do not have direct control over the assets nor direct exposure to the liabilities of the venture.
ACCOUNTING TREATMENT—EQUITY METHOD To refl ect the exposure to the net assets of the venture, the appropriate accounting treatment is the equity method. The equity method can be thought of as a condensed consolidation that shows the fi nancial
equity method A method of
accounting whereby the balance
sheet value of the investment equals
the purchase cost adjusted by the
investor’s share of the investee’s
post-acquisition changes in net
assets, and the income recognized
equals the investor’s share of the
investee’s net income.
$ millions100% of JOB
(assumed) 40% of JOB 1
Princeton (assumed) 1 Elimination 5
Proportionally consolidated Princeton 1 40% of JOB
Balance sheets
Investment in JOB — — 100 2100 —
Other assets 750 300 600 — 900
Total assets 750 300 700 2100 900
Liabilities 500 200 400 — 600
Common shares 150 60 200 260 200
Retained earnings 100 40 100 240 100
Total liab. and equity 750 300 700 2100 900
Income statements
Income from JOB — — 14 214 —
Revenue 125 50 150 200
Expenses 290 236 2100 — 2136
Net income 35 14 64 214 64
Exhibit 7-4 Separate and proportionately consolidated balance sheets and income statements for Princeton Powerboats
and Joy of Boating (JOB)
J
M07_LO5943_SE_03_C07.indd 299M07_LO5943_SE_03_C07.indd 299 11/06/15 1:51 PM11/06/15 1:51 PM
300 CHAPTER 7 F inanc ia l Asse ts
position and results of operations of the investee on a net basis on the balance sheet and income statement in one line (each). The balance sheet shows the value of the investment equal to the purchase cost adjusted by the investor’s share of the invest-ee’s post-acquisition changes in net assets. The income statement shows the investor’s share of the investee’s net income. An example of the equity method will follow the discussion of associates, which also uses the equity method.
4. Associates
In some instances, an enterprise’s investment in another is not suffi cient to give it con-trol, but nevertheless it is able to aff ect the strategic direction of the latter company. In these situations, we say that the investor has signifi cant infl uence , the power to participate in the fi nancial and operating policy decisions of the investee (but not to the extent of control or joint control). When the investor company has signifi cant infl u-ence, we call the investee an associate of the investor; sometimes, entities also use the term “affi liate.” We presume that signifi cant infl uence exists if the investor holds between 20% and 50% (inclusive) of the voting power of the investee, and no sig-nifi cant infl uence otherwise. Similar to the determination of whether control exists, if the percentage voting power results in the presumption of signifi cant infl uence, that presumption can be refuted with specifi c evidence to the contrary.
While it is clear that the upper limit of 50% makes sense in that any higher invest-ment would confer control, why can we presume that there is signifi cant infl uence for investments with 20%, 25%, or 45% voting power? Why do we presume that there is no signifi cant infl uence below 20%?
There are two distinct reasons for this presumption. The fi rst is that an investor often does not require more than 50% of votes to be in a position to appoint/elect members onto the investee’s board of directors, particularly for publicly traded fi rms with diff used ownership. Representation on the board of directors gives the investor infl uence, but not control, over the strategic direction of the investee.
The second reason is more subtle but perhaps more important. It is that the extent of the investment itself provides strong positive evidence, not just a presumption, that the investor does have signifi cant infl uence. Why? It is because signifi cant infl uence is the most likely reason for a level of ownership that is as high as 50%. Portfolio theory in fi nance concludes that investors can achieve better risk–return trade-off s by diver-sifying investments. Thus, if the only reason for an investment is to obtain the highest return at the lowest risk, an enterprise can do better by having a portfolio of many investments rather than one large, concentrated holding in one company. The fact that an enterprise does have a high level of investment in another indicates that it is willing to bear the additional risk of the concentrated investment in return for the ability to infl uence the direction of the investee. In other words, fi nance theory suggests that it is not rational for an enterprise to hold a large position in the equity of another company if it did not want, and is not able to exercise, signifi cant infl uence.
The ability to exert signifi cant infl uence is valuable to the investor because it helps reduce the two types of information asymmetry discussed in Chapter 1 . Having rep-resentation on the board of directors and generally being able to participate in the governance of the investee alleviates the moral hazard inherent in the agency relation-ship between ownership and management. At the same time, an investor company with signifi cant infl uence faces less adverse selection because it is able to obtain better (i.e., inside) information on the investee in comparison to other investors who do not have such infl uence.
If you refl ect on these points about why signifi cant infl uence confers advantages over portfolio investments—advantages that compensate for the additional risk of con-centrated holdings—you should see that the same arguments apply to situations of full control or joint control discussed above. For this reason, the accounting treatment
signifi cant infl uence The power
to participate in the fi nancial and
operating policy decisions of the
investee (but not to the extent of
control or joint control ).
associate An entity over which the
investor has signifi cant infl uence
and that is neither a subsidiary nor
an interest in a joint venture.
INFORMATION ASYMMETRY
THRESHOLDCONCEPT
M07_LO5943_SE_03_C07.indd 300M07_LO5943_SE_03_C07.indd 300 11/06/15 1:51 PM11/06/15 1:51 PM

C. S t ra teg ic Equ i t y Inves tments 301
for investments with signifi cant infl uence has some of the features of consolidation. However, signifi cant infl uence is not control, so the investor and investee cannot be considered one economic unit. Thus, we do not combine the fi nancial statements of the two entities. The accounting method that produces results similar to consolidation but without actually consolidating the fi nancial statements is called the equity method.
ACCOUNTING TREATMENT—EQUITY METHOD As noted above, the equity method can be thought of as a condensed consolidation that shows the investor’s share of the net assets and net income of the investee. The following example uses an investment in an associate to illustrate the equity method. The eff ects are similar for a joint venture accounted for under the equity method.
EXAMPLE Princeton Powerboats has a third investment, a 20% interest in Asymmetric Spinnaker Company (ASC). Princeton has determined that it can and does exert signifi cant infl uence over ASC.
As shown in Exhibit 7-5 , ASC has total assets of $1,500m and liabilities of $1,000m, so net assets equal $500m. Princeton owns 20% of ASC, so it shows $100 million (20% 3 $500m 5 $100m) as “Investment in ASC” on the balance sheet. On its income statement, Princeton shows $14 million as “Income from ASC” for its 20% share of ASC’s net income of $70 million.
To compare and contrast consolidation, proportionate consolidation, and the equity method, let’s review the fi nancial statements of Princeton in the three examples given above. Note that Princeton has an equal dollar amount of investment in each of the three companies ($100 million) so that the only diff erence is the accounting method.
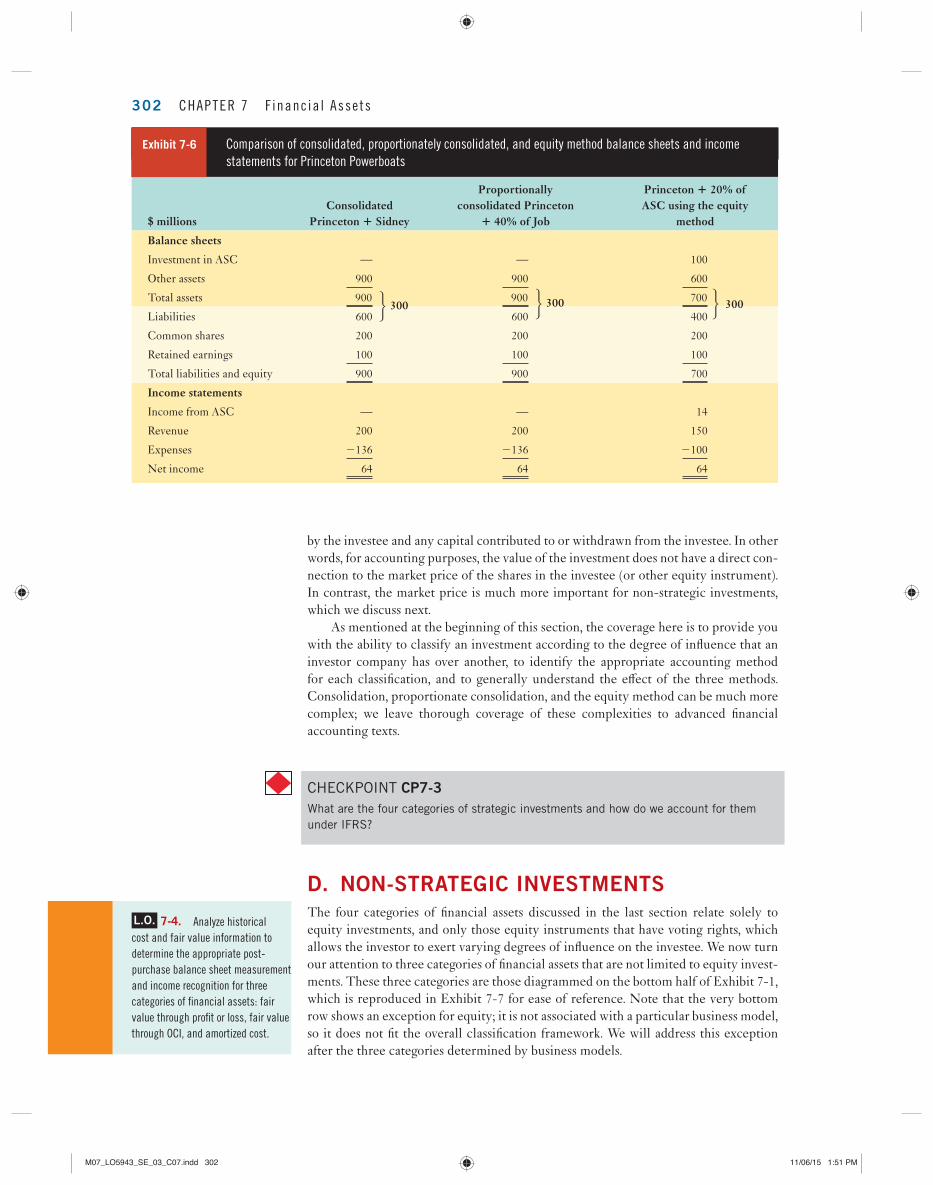
As Exhibit 7-6 shows, the net asset positions for the three scenarios are identical ($300 million), as are the amounts of net income ($64 million). However, the equity method diff ers from consolidation and proportionate consolidation in the components of net assets and net income. Whereas the two consolidation methods include the individ-ual line items (assets, liabilities, revenues, expenses) of the subsidiary, the equity method nets out liabilities against assets and expenses against revenue. Thus, the three methods are equivalent on a net basis, but they diff er in terms of the individual line items.
Another important point to note is that for all four types of strategic investments, the value of the investment goes up and down with the income earned or losses incurred
$ millions 100% of ASC 20% of ASC Princeton under equity method
Balance sheets
Investment in ASC — — 100
Other assets 1,500 300 600
Total assets 1,500 300 700
Liabilities 1,000 200 400
Common shares 300 60 200
Retained earnings 200 40 100
Total liab. and equity 1,500 300 700
Income statements
Income from ASC — — 14
Revenue 250 50 150
Expenses 2180 236 2100
Net income 70 14 64
Exhibit 7-5 Balance sheets and income statements for Princeton Powerboats and Asymmetric Spinnaker Company (ASC)
J
M07_LO5943_SE_03_C07.indd 301M07_LO5943_SE_03_C07.indd 301 11/06/15 1:51 PM11/06/15 1:51 PM
302 CHAPTER 7 F inanc ia l Asse ts
by the investee and any capital contributed to or withdrawn from the investee. In other words, for accounting purposes, the value of the investment does not have a direct con-nection to the market price of the shares in the investee (or other equity instrument). In contrast, the market price is much more important for non-strategic investments, which we discuss next.
As mentioned at the beginning of this section, the coverage here is to provide you with the ability to classify an investment according to the degree of infl uence that an investor company has over another, to identify the appropriate accounting method for each classifi cation, and to generally understand the eff ect of the three methods. Consolidation, proportionate consolidation, and the equity method can be much more complex; we leave thorough coverage of these complexities to advanced fi nancial accounting texts.
$ millionsConsolidated
Princeton 1 Sidney
Proportionally consolidated Princeton
1 40% of Job
Princeton 1 20% of ASC using the equity
method
Balance sheets
Investment in ASC — — 100
Other assets 900 900 600
Total assets 900 300
900 300 700 300
Liabilities 600 600 400
Common shares 200 200 200
Retained earnings 100 100 100
Total liabilities and equity 900 900 700
Income statements
Income from ASC — — 14
Revenue 200 200 150
Expenses 2136 2136 2100
Net income 64 64 64
Exhibit 7-6 Comparison of consolidated, proportionately consolidated, and equity method balance sheets and income
statements for Princeton Powerboats
J J J
CHECKPOINT CP7-3 What are the four categories of strategic investments and how do we account for them
under IFRS?
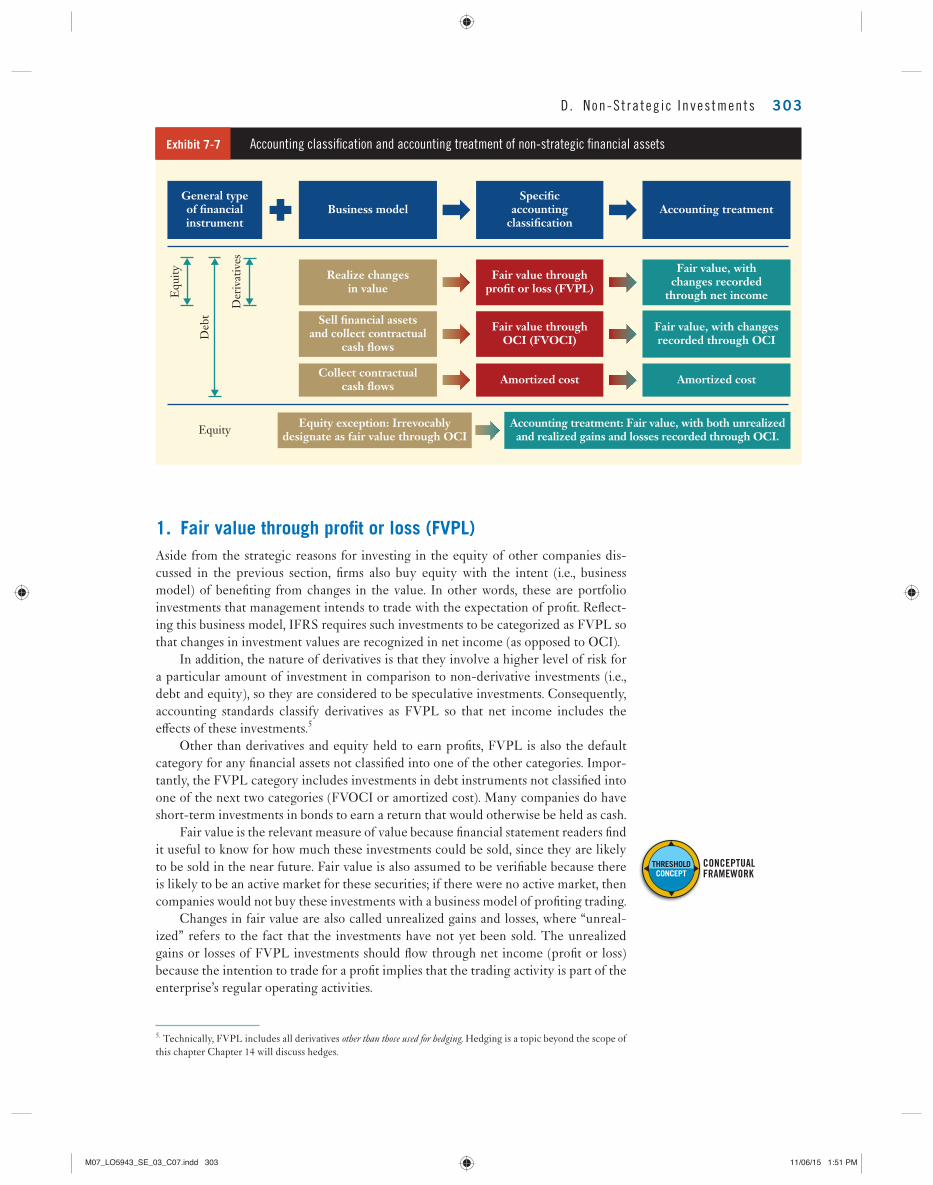
D. NON-STRATEGIC INVESTMENTS The four categories of fi nancial assets discussed in the last section relate solely to equity investments, and only those equity instruments that have voting rights, which allows the investor to exert varying degrees of infl uence on the investee. We now turn our attention to three categories of fi nancial assets that are not limited to equity invest-ments. These three categories are those diagrammed on the bottom half of Exhibit 7-1 , which is reproduced in Exhibit 7-7 for ease of reference. Note that the very bottom row shows an exception for equity; it is not associated with a particular business model, so it does not fi t the overall classifi cation framework. We will address this exception after the three categories determined by business models.
L.O. 7-4. Analyze historical
cost and fair value information to
determine the appropriate post-
purchase balance sheet measurement
and income recognition for three
categories of fi nancial assets: fair
value through profi t or loss, fair value
through OCI, and amortized cost.
M07_LO5943_SE_03_C07.indd 302M07_LO5943_SE_03_C07.indd 302 11/06/15 1:51 PM11/06/15 1:51 PM
D. Non-St ra teg ic Inves tments 303
1. Fair value through profi t or loss (FVPL)
Aside from the strategic reasons for investing in the equity of other companies dis-cussed in the previous section, fi rms also buy equity with the intent (i.e., business model) of benefi ting from changes in the value. In other words, these are portfolio investments that management intends to trade with the expectation of profi t. Refl ect-ing this business model, IFRS requires such investments to be categorized as FVPL so that changes in investment values are recognized in net income (as opposed to OCI).
In addition, the nature of derivatives is that they involve a higher level of risk for a particular amount of investment in comparison to non-derivative investments (i.e., debt and equity), so they are considered to be speculative investments. Consequently, accounting standards classify derivatives as FVPL so that net income includes the eff ects of these investments. 5
Other than derivatives and equity held to earn profi ts, FVPL is also the default category for any fi nancial assets not classifi ed into one of the other categories. Impor-tantly, the FVPL category includes investments in debt instruments not classifi ed into one of the next two categories (FVOCI or amortized cost). Many companies do have short-term investments in bonds to earn a return that would otherwise be held as cash.
Fair value is the relevant measure of value because fi nancial statement readers fi nd it useful to know for how much these investments could be sold, since they are likely to be sold in the near future. Fair value is also assumed to be verifi able because there is likely to be an active market for these securities; if there were no active market, then companies would not buy these investments with a business model of profi ting trading.
Changes in fair value are also called unrealized gains and losses, where “unreal-ized” refers to the fact that the investments have not yet been sold. The unrealized gains or losses of FVPL investments should fl ow through net income (profi t or loss) because the intention to trade for a profi t implies that the trading activity is part of the enterprise’s regular operating activities.
Exhibit 7-7 Accounting classifi cation and accounting treatment of non-strategic fi nancial assets
General typeof financialinstrument
Accounting treatment
Fair value, withchanges recorded
through net income
Fair value, with changesrecorded through OCI
Amortized cost
Specificaccounting
classification
Fair value throughprofit or loss (FVPL)
Fair value throughOCI (FVOCI)
Amortized cost
Business model
Realize changesin value
Collect contractualcash flows
Sell financial assetsand collect contractual
cash flows
Accounting treatment: Fair value, with both unrealizedand realized gains and losses recorded through OCI.
Equity exception: Irrevocablydesignate as fair value through OCIEquity
Equ
ity
Deb
t
Der
ivat
ives
5. Technically, FVPL includes all derivatives other than those used for hedging . Hedging is a topic beyond the scope of this chapter Chapter 14 will discuss hedges .
CONCEPTUAL FRAMEWORK
THRESHOLDCONCEPT
M07_LO5943_SE_03_C07.indd 303M07_LO5943_SE_03_C07.indd 303 11/06/15 1:51 PM11/06/15 1:51 PM

304 CHAPTER 7 F inanc ia l Asse ts
If Holberg classifi es these investments as FVPL, the company would record the following journal entries:
Date Transaction Company # Shares Amount per share Total
2017
Sept. 20 Bought Royal Bank 400 $60.00 $24,000
Nov. 15 Bought TELUS 500 40.00 20,000
Nov. 24 Dividends Royal Bank 400 0.50 200
Dec. 31 Year-end closing price Royal Bank 400 63.00 25,200
Dec. 31 Year-end closing price TELUS 500 39.00 19,500
2018
Jan. 10 Sold Royal Bank 400 62.50 25,000
Exhibit 7-8 Holberg Enterprises’ equity investments
For example, suppose Holberg Enterprises had the following transactions relating to its equity portfolio (and had no other portfolio equity investments):
Sept. 20 Dr. FVPL investments—Royal Bank 24,000
Cr. Cash 24,000
Nov. 15 Dr. FVPL investments—TELUS 20,000
Cr. Cash 20,000
Nov. 24 Dr. Cash 200
Cr. Dividend income 200
Dec. 31 Dr. FVPL investments—Royal Bank 1,200
Cr. Gain (loss) on FVPL investments ($25,200 – $24,000) 1,200
Dec. 31 Dr. Gain (loss) on FVPL investments ($19,500 − $20,000) 500
Cr. FVPL investments—TELUS 500
Jan. 10 Dr. Cash 25,000
Dr. Gain (loss) on FVPL investments 200
Cr. FVPL investments—Royal Bank 25,200
Exhibit 7-9 Journal entries to record Holberg’s investments if classifi ed as FVPL
Notice that the year-end journal entries to adjust the investments to fair value result in gains or losses, which are unrealized, that fl ow through income. The write-up of the Royal Bank shares to $63/share at the year-end later results in a loss of $0.50/share, or $200 in total, when the shares are sold for $62.50. Through the entire holding period of these shares, Holberg recorded $1,200 2 200 5 $1,000 of gains and $200 of dividend income.
Regarding the year-end journal entries for the re-measurement of the invest-ments to fair value, the above shows the simplest way to represent the adjustment to the balance sheet (i.e., the debit to FVPL investments). In practice, enterprises will use a valuation account, such as “Valuation adjustments on FVPL invest-ments.” This practice is similar to the use of a contra account for allowance for doubtful accounts. Doing so allows the records to reflect fair value adjustments while preserving cost information, which is required to compute gains or losses for tax purposes when the enterprise later sells the investments. However, it is important to note that the valuation account can be positive or negative, whereas
M07_LO5943_SE_03_C07.indd 304M07_LO5943_SE_03_C07.indd 304 11/06/15 1:51 PM11/06/15 1:51 PM
D. Non-St ra teg ic Inves tments 305
the allowance for doubtful accounts must always reduce the value of receivables (i.e., it must have a credit or zero balance).
2. Fair value through other comprehensive income (FVOCI)
The FVOCI category includes debt securities included in a business model with which the entity intends (i) to profi t from changes in value and (ii) to collect cash fl ows to which the entity is entitled. Note that neither equity investments nor derivatives can be classifi ed as FVOCI.
FVOCI means that the balance sheet reports these investments at fair value, while changes in value fl ow through OCI in the statement of comprehensive income (not through net income). Therefore, FVPL and FVOCI have the same reporting outcomes on the balance sheet, but they diff er in the statement of comprehensive income. The eff ect of fair value changes fl ow through net income under FVPL, but through OCI under FVOCI. When an entity sells investments measured at FVOCI, the total gain or loss fl ows through income.
Since equity investments cannot be classifi ed as FVOCI, Holberg’s investments in the shares of Royal Bank and TELUS cannot be used to illustrate the accounting for this category. Instead, we will defer briefl y until Sub-section 6 a complete example illustrating the accounting for FVOCI.
Note that the diff erence in treatment between FVPL and FVOCI applies only to unrealized gains and losses. For both categories, realized gains and losses from actual disposals of the fi nancial assets fl ow through net income, not OCI. In other words, OCI is recycled into net income.
CHECKPOINT CP7-4 What is the key difference between the accounting treatments for FVPL and FVOCI
investments?
3. Amortized cost
Amortized cost is a category of fi nancial investments that have fi xed or determinable payments representing principal and interest, and the entity intends to collect these contractual cash fl ows. This category applies only to debt investments. Implementa-tion of the amortized cost method requires discounted cash fl ow analysis, which we discuss in Section E.
4. Exception for equity investments with an irrevocable
election
IFRS 9 provides for an exception to the treatment of equity investments that would otherwise be classifi ed as FVPL. This exception allows an entity to elect to present changes in the fair value of an investment through OCI. This election must satisfy three conditions: it must be made when the entity initially acquires the investment; the investment must be in equity; and the election is irrevocable, meaning that the invest-ment cannot be reclassifi ed later into another category.
The results of designating a particular equity investment in this manner are not exactly the same as discussed above for the FVOCI category. While the entity holds the investment, any dividends received would be recorded in net income, while changes in fair value fl ow through OCI, just like for the FVOCI category. However, upon sale/ derecognition, any gain or loss does not fl ow through net income, but continues to go into OCI. At this time, the accumulated other comprehensive income (AOCI) for this
M07_LO5943_SE_03_C07.indd 305M07_LO5943_SE_03_C07.indd 305 11/06/15 1:51 PM11/06/15 1:51 PM
306 CHAPTER 7 F inanc ia l Asse ts
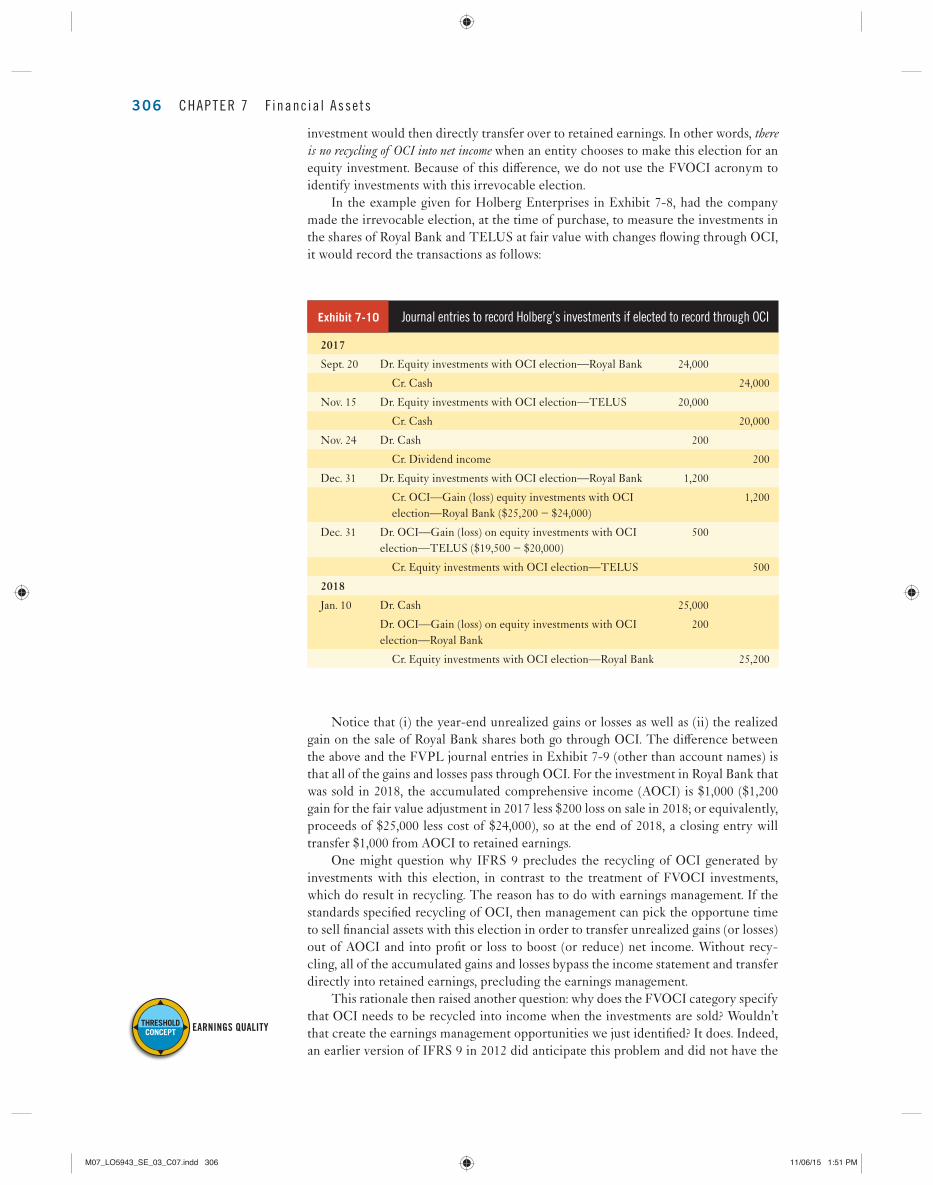
Notice that (i) the year-end unrealized gains or losses as well as (ii) the realized gain on the sale of Royal Bank shares both go through OCI. The diff erence between the above and the FVPL journal entries in Exhibit 7-9 (other than account names) is that all of the gains and losses pass through OCI. For the investment in Royal Bank that was sold in 2018, the accumulated comprehensive income (AOCI) is $1,000 ($1,200 gain for the fair value adjustment in 2017 less $200 loss on sale in 2018; or equivalently, proceeds of $25,000 less cost of $24,000), so at the end of 2018, a closing entry will transfer $1,000 from AOCI to retained earnings.
One might question why IFRS 9 precludes the recycling of OCI generated by investments with this election, in contrast to the treatment of FVOCI investments, which do result in recycling. The reason has to do with earnings management. If the standards specifi ed recycling of OCI, then management can pick the opportune time to sell fi nancial assets with this election in order to transfer unrealized gains (or losses) out of AOCI and into profi t or loss to boost (or reduce) net income. Without recy-cling, all of the accumulated gains and losses bypass the income statement and transfer directly into retained earnings, precluding the earnings management.
This rationale then raised another question: why does the FVOCI category specify that OCI needs to be recycled into income when the investments are sold? Wouldn’t that create the earnings management opportunities we just identifi ed? It does. Indeed, an earlier version of IFRS 9 in 2012 did anticipate this problem and did not have the
2017
Sept. 20 Dr. Equity investments with OCI election—Royal Bank 24,000
Cr. Cash 24,000
Nov. 15 Dr. Equity investments with OCI election—TELUS 20,000
Cr. Cash 20,000
Nov. 24 Dr. Cash 200
Cr. Dividend income 200
Dec. 31 Dr. Equity investments with OCI election—Royal Bank 1,200
Cr. OCI—Gain (loss) equity investments with OCI election—Royal Bank ($25,200 − $24,000)
1,200
Dec. 31 Dr. OCI—Gain (loss) on equity investments with OCI election—TELUS ($19,500 − $20,000)
500
Cr. Equity investments with OCI election—TELUS 500
2018
Jan. 10 Dr. Cash 25,000
Dr. OCI—Gain (loss) on equity investments with OCI election—Royal Bank
200
Cr. Equity investments with OCI election—Royal Bank 25,200
Exhibit 7-10 Journal entries to record Holberg’s investments if elected to record through OCI
investment would then directly transfer over to retained earnings. In other words, there is no recycling of OCI into net income when an entity chooses to make this election for an equity investment. Because of this diff erence, we do not use the FVOCI acronym to identify investments with this irrevocable election.
In the example given for Holberg Enterprises in Exhibit 7-8 , had the company made the irrevocable election, at the time of purchase, to measure the investments in the shares of Royal Bank and TELUS at fair value with changes fl owing through OCI, it would record the transactions as follows:
EARNINGS QUALITY THRESHOLDCONCEPT
M07_LO5943_SE_03_C07.indd 306M07_LO5943_SE_03_C07.indd 306 11/06/15 1:51 PM11/06/15 1:51 PM
D. Non-St ra teg ic Inves tments 307
FVOCI category at all. The category was later added in 2014 after considerable feed-back and lobbying, particularly from fi nancial institutions with large holdings of debt investments that would otherwise have been classifi ed as either FVPL or amortized cost. Many commenters stated that they used a business model for their debt invest-ments that was neither solely to trade for profi t, nor solely to collect contractual cash fl ows, but was rather a combination of the two. The IASB agreed and added the FVOCI category to accommodate the hybrid business model.
5. Reclassifi cations from one category to another
The classifi cation of fi nancial assets into the diff erent categories discussed above depends on business models selected by management rather than the characteristics inherent in the investments themselves. Consequently, changes in management inten-tion can result in a change in classifi cation. However, if there are no constraints on the ability of management to reclassify, then there could be signifi cant opportuni-ties for companies to manage earnings. For example, consider what would happen if a company were to reclassify an investment with unrealized gains from FVOCI to FVPL. Similarly, what if a company reclassifi es an investment with unrealized losses from FVPL to FVOCI? These reclassifi cations would allow management to increase earnings by recognizing unrealized gains and deferring losses. To prevent this oppor-tunistic activity from occurring, IFRS 9 provides specifi c guidance for these situations.
Note that derivatives can only be classifi ed as FVPL (again, with the exception of derivatives used in hedging). Likewise, investments in equity can only be classifi ed as FVPL, with the exception of those for which the entity has made an irrevocable elec-tion to measure at fair value through OCI. In all these cases, no reclassifi cations are possible. Thus, what remain are investments in debt.
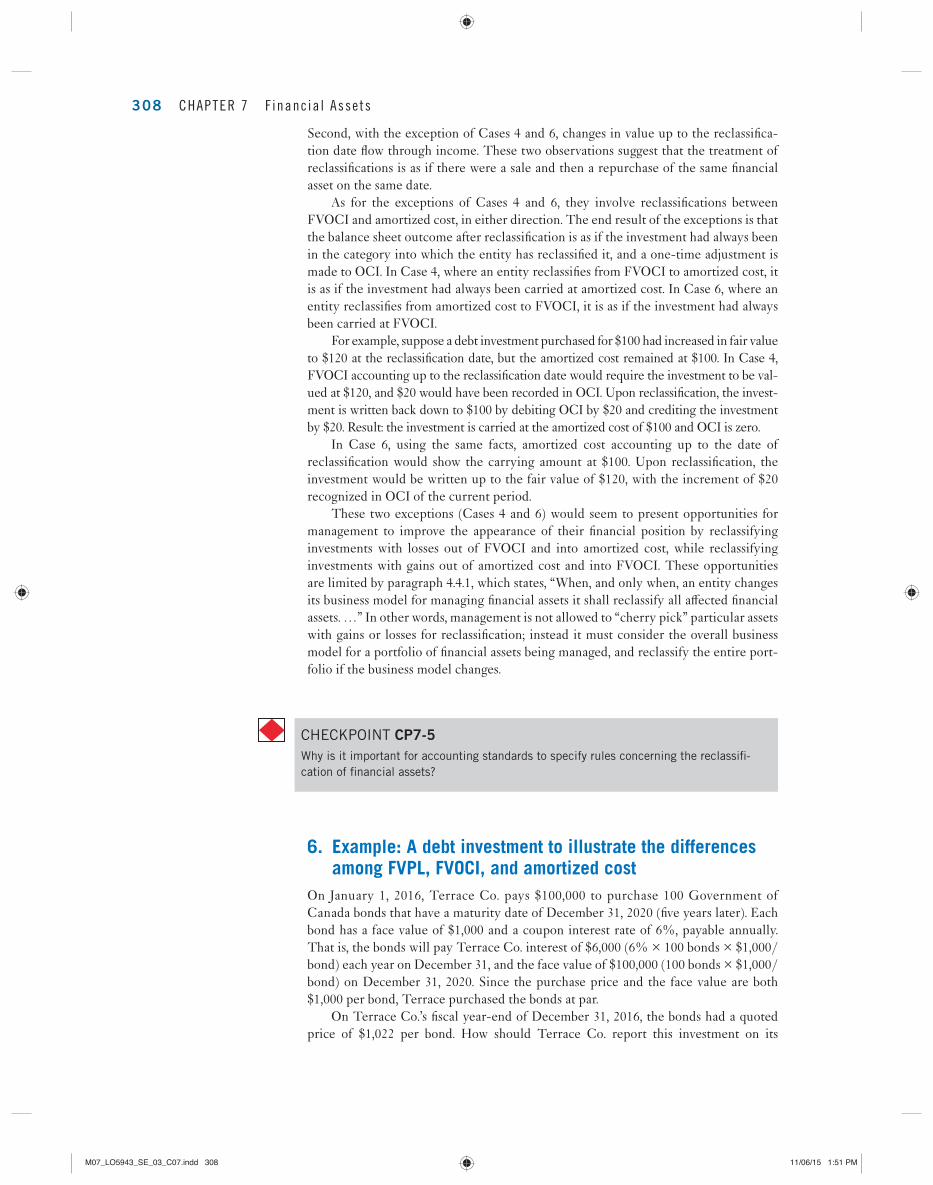
As illustrated in Exhibit 7-1 and again in Exhibit 7-7 , debt investments can be classifi ed as FVPL, FVOCI, or amortized cost. Reclassifi cations out of and into these three categories produce six possible permutations, which are all addressed in IFRS 9, in paragraphs 5.6.2 to 5.6.7. The following table summarizes these six reclassifi cation scenarios. Note that in all cases, the reclassifi cation is treated prospectively, such that there are no restatements of prior results.
We can make some generalization from this table. First, with the exception of Case 4, when a reclassifi cation occurs, the fi nancial asset is re-measured to fair value.
EARNINGS QUALITY THRESHOLDCONCEPT
Case From ToIFRS 9 para.
Balance sheet value on reclassifi cation
Changes in value up to reclassifi cation date
1. FVPL FVOCI 5.6.6 Fair value (Fair value – carrying value) recognized in income
2. FVPL Amortized cost
5.6.3 Fair value (Fair value – carrying value) recognized in income
3. FVOCI FVPL 5.6.7 Fair value OCI up to reclassifi cation date recognized in income
4. FVOCI Amortized cost
5.6.5 Amortized cost computed using information from original purchase
OCI up to reclassifi cation date off set against fair value
5. Amortized cost
FVPL 5.6.2 Fair value (Fair value – carrying value) recognized in income
6. Amortized cost
FVOCI 5.6.4 Fair value (Fair value – carrying value) recognized in OCI
Exhibit 7-11 Reclassifi cations of debt investments
M07_LO5943_SE_03_C07.indd 307M07_LO5943_SE_03_C07.indd 307 11/06/15 1:51 PM11/06/15 1:51 PM
308 CHAPTER 7 F inanc ia l Asse ts
Second, with the exception of Cases 4 and 6, changes in value up to the reclassifi ca-tion date fl ow through income. These two observations suggest that the treatment of reclassifi cations is as if there were a sale and then a repurchase of the same fi nancial asset on the same date.
As for the exceptions of Cases 4 and 6, they involve reclassifi cations between FVOCI and amortized cost, in either direction. The end result of the exceptions is that the balance sheet outcome after reclassifi cation is as if the investment had always been in the category into which the entity has reclassifi ed it, and a one-time adjustment is made to OCI. In Case 4, where an entity reclassifi es from FVOCI to amortized cost, it is as if the investment had always been carried at amortized cost. In Case 6, where an entity reclassifi es from amortized cost to FVOCI, it is as if the investment had always been carried at FVOCI.
For example, suppose a debt investment purchased for $100 had increased in fair value to $120 at the reclassifi cation date, but the amortized cost remained at $100. In Case 4, FVOCI accounting up to the reclassifi cation date would require the investment to be val-ued at $120, and $20 would have been recorded in OCI. Upon reclassifi cation, the invest-ment is written back down to $100 by debiting OCI by $20 and crediting the investment by $20. Result: the investment is carried at the amortized cost of $100 and OCI is zero.
In Case 6, using the same facts, amortized cost accounting up to the date of reclassifi cation would show the carrying amount at $100. Upon reclassifi cation, the investment would be written up to the fair value of $120, with the increment of $20 recognized in OCI of the current period.
These two exceptions (Cases 4 and 6) would seem to present opportunities for management to improve the appearance of their fi nancial position by reclassifying investments with losses out of FVOCI and into amortized cost, while reclassifying investments with gains out of amortized cost and into FVOCI. These opportunities are limited by paragraph 4.4.1, which states, “When, and only when, an entity changes its business model for managing fi nancial assets it shall reclassify all aff ected fi nancial assets. …” In other words, management is not allowed to “cherry pick” particular assets with gains or losses for reclassifi cation; instead it must consider the overall business model for a portfolio of fi nancial assets being managed, and reclassify the entire port-folio if the business model changes.
6. Example: A debt investment to illustrate the differences
among FVPL, FVOCI, and amortized cost
On January 1, 2016, Terrace Co. pays $100,000 to purchase 100 Government of Canada bonds that have a maturity date of December 31, 2020 (fi ve years later). Each bond has a face value of $1,000 and a coupon interest rate of 6%, payable annually. That is, the bonds will pay Terrace Co. interest of $6,000 (6% × 100 bonds × $1,000/bond) each year on December 31, and the face value of $100,000 (100 bonds × $1,000/bond) on December 31, 2020. Since the purchase price and the face value are both $1,000 per bond, Terrace purchased the bonds at par.
On Terrace Co.’s fi scal year-end of December 31, 2016, the bonds had a quoted price of $1,022 per bond. How should Terrace Co. report this investment on its
CHECKPOINT CP7-5 Why is it important for accounting standards to specify rules concerning the reclassifi -
cation of fi nancial assets?
M07_LO5943_SE_03_C07.indd 308M07_LO5943_SE_03_C07.indd 308 11/06/15 1:51 PM11/06/15 1:51 PM
D. Non-St ra teg ic Inves tments 309
December 31, 2016 balance sheet? How should the company report any changes in fair value? How much income or comprehensive income would be reported (ignoring income taxes)?
Intend to trade:
If Terrace Co. holds the bonds in a business model that sells bonds for a profi t, it would classify this investment as FVPL. It would report the bonds on its balance sheet at fair value of $102,200 (100 bonds 3 $1,022/bond). On its income statement, Terrace Co. would report an unrealized gain of $2,200 ($102,200 2 $100,000). The interest income is $6,000, so the net eff ect is $6,000 1 $2,200 5 $8,200 reported in income.
Intend to hold or trade
If Terrace Co. holds the bonds in a business model that both holds the investments to collect contractual cash fl ows and sells them for profi t, it would classify the bonds as FVOCI. It would report the bonds on its bal-ance sheet at fair value of $102,200, the same as for the held-for-trading category. However, it would not report an unrealized gain of $2,200 on the income statement. Rather, Terrace Co. would report the unrealized gain in other comprehensive income. The $6,000 interest income would be reported in the income statement.
Intend to hold:
If Terrace Co. intends to hold the bonds until December 31, 2020, so as to collect all the cash fl ows from the bond, then it would classify them as held to maturity. In this case, its balance sheet would report the amor-tized cost of the bonds at $100,000. The income statement would report interest income of $6,000.
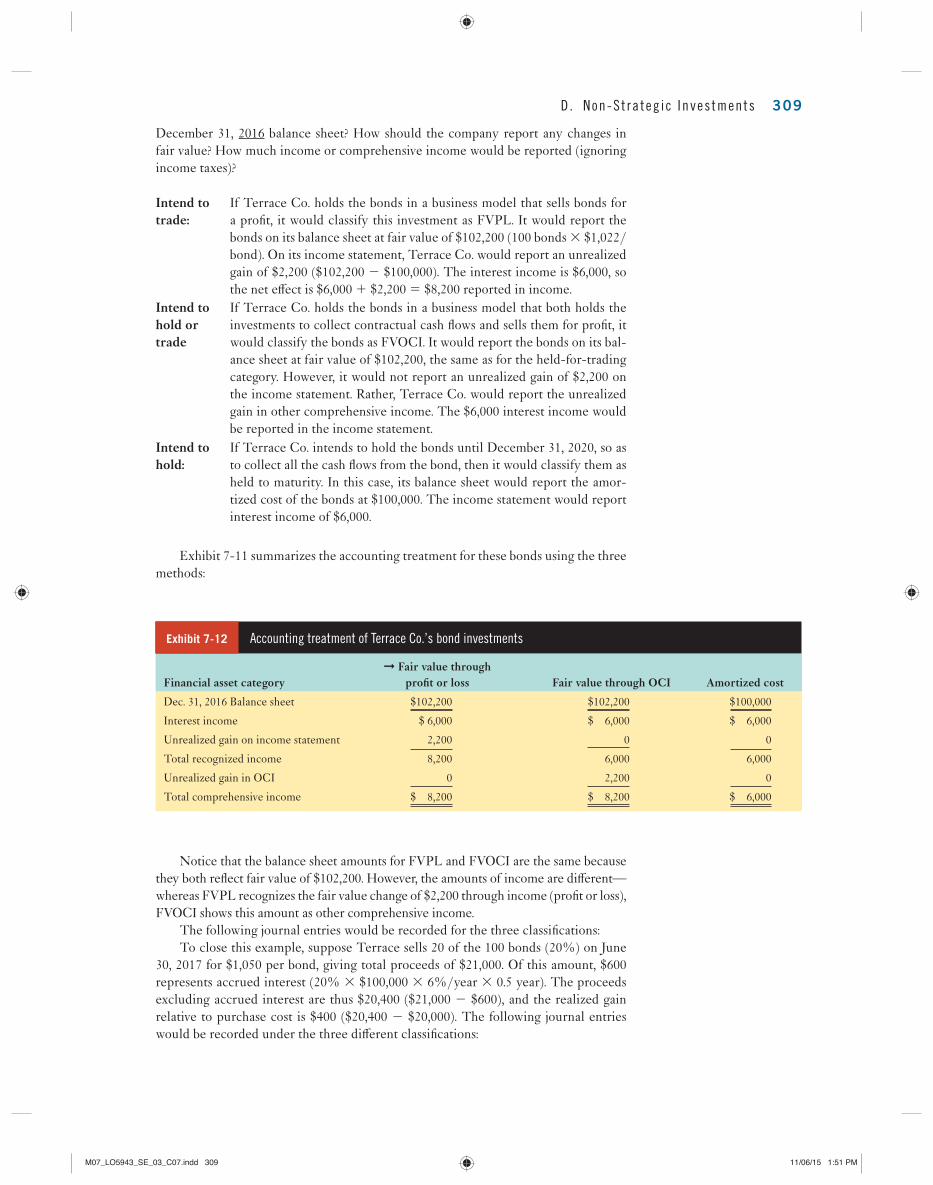
Exhibit 7-11 summarizes the accounting treatment for these bonds using the three methods:
Financial asset category➞ Fair value through
profi t or loss Fair value through OCI Amortized cost
Dec. 31, 2016 Balance sheet $102,200 $102,200 $100,000
Interest income $ 6,000 $ 6,000 $ 6,000
Unrealized gain on income statement 2,200 0 0
Total recognized income 8,200 6,000 6,000
Unrealized gain in OCI 0 2,200 0
Total comprehensive income $ 8,200 $ 8,200 $ 6,000
Exhibit 7-12 Accounting treatment of Terrace Co.’s bond investments
Notice that the balance sheet amounts for FVPL and FVOCI are the same because they both refl ect fair value of $102,200. However, the amounts of income are diff erent—whereas FVPL recognizes the fair value change of $2,200 through income (profi t or loss), FVOCI shows this amount as other comprehensive income.
The following journal entries would be recorded for the three classifi cations: To close this example, suppose Terrace sells 20 of the 100 bonds (20%) on June
30, 2017 for $1,050 per bond, giving total proceeds of $21,000. Of this amount, $600 represents accrued interest (20% 3 $100,000 3 6%/year 3 0.5 year). The proceeds excluding accrued interest are thus $20,400 ($21,000 2 $600), and the realized gain relative to purchase cost is $400 ($20,400 2 $20,000). The following journal entries would be recorded under the three diff erent classifi cations:
M07_LO5943_SE_03_C07.indd 309M07_LO5943_SE_03_C07.indd 309 11/06/15 1:51 PM11/06/15 1:51 PM

310 CHAPTER 7 F inanc ia l Asse ts
If classifi ed as FVPL
Dr. Cash 21,000
Dr. Loss on sale of FVPL investments* 40
Cr. FVPL investments (20 3 $1,022) 20,440
Cr. Interest income 600
If classifi ed as available for sale
Dr. Cash 21,000
Dr. OCI on FVOCI investments (20 3 $22) 440
Cr. FVOCI investments (20 3 $1,022) 20,440
Cr. Interest income 600
Cr. Gain on sale of FVOCI investments † 400
If classifi ed as held to maturity
Dr. Cash 21,000
Cr. Amortized cost investments (20 3 $1,000) 20,000
Cr. Interest income 600
Cr. Gain on sale of Amortized cost investments ‡ 400
*Gain (loss) 5 Proceeds net of interest 2 Carrying value 5 $20,400 2 $20,440
† Gain 5 Proceeds net of interest 2 Cost 5 $20,400 2 $20,000
‡ Gain 5 Proceeds net of interest 2 Cost 5 $20,400 2 $20,000
Exhibit 7-14 Journal entries to account for the sale of 20% of Terrace
Co.’s bond investments
Financial asset category FVPL FVOCI Amortized cost
Dr. Cr. Dr. Cr. Dr. Cr.
Jan. 1, 2016 Purchase
Dr. FVPL investments 100,000 — —
Dr. FVOCI investments — 100,000 —
Dr. Amortized cost investments — — 100,000
Cr. Cash 100,000 100,000 100,000
Dec. 31, 2016
Recognition of interest income
Dr. Cash or interest receivable 6,000 6,000 6,000
Cr. Interest income 6,000 6,000 6,000
Dec. 31, 2016 Re-measurement
Dr. FVPL investments 2,200 — —
Cr. Gain on FVPL investments 2,200 — —
Dr. FVOCI investments — 2,200 —
Cr. OCI on FVOCI investments — 2,200 —
Exhibit 7-13 Journal entries to account for Terrace’s bond investments
Several points are worth noting about the above journal entries.
1. Regardless of the investments’ categorization, the amount removed/credited from the balance sheet is proportionate to the amount recorded on the balance sheet account.
2. The entry to record the proceeds from sale needs to distinguish the interest com-ponent, if any. (For equity investments, any dividend income would be similarly separated.)
M07_LO5943_SE_03_C07.indd 310M07_LO5943_SE_03_C07.indd 310 11/06/15 1:51 PM11/06/15 1:51 PM
E . Amor t i za t i on o f Debt Inves tments 311
3. For FVPL investments, the gain or loss recognized through the income statement is the diff erence between (i) the proceeds net of interest income and (ii) the fair value on the balance sheet. In this case, the proceeds net of interest are $20,400, while the balance sheet fair value is $20,440, resulting in a loss of $40.
4. For FVOCI and amortized cost investments, the gain or loss equals the diff erence between (i) the proceeds net of interest income and (ii) the amortized cost of the investment. Thus the gain is equal to $20,400 2 $20,000 5 $400.
5. For FVOCI investments, OCI related to the investment needs to be reversed out of equity. In this case, $440 of OCI is debited out of equity.
The example of Terrace Co.’s investment is the simplest of examples, as the company purchased the bonds at par. In such cases, there is no amortization and the amortized cost method is just the cost method. In instances where a bond is purchased at a non-par amount, there will be amortization. Furthermore, this amor-tization is necessary not just for the amortized cost method, but also for FVOCI investments. We look at this issue in more detail in Section E.
E. AMORTIZATION OF DEBT INVESTMENTS As you have learned in introductory accounting, enterprises can use a number of dif-ferent methods to amortize (or depreciate) non-fi nancial items such as property, plant, and equipment. In contrast, IFRS permits only one method to amortize debt instru-ments: the eff ective interest method . This method calculates the amortized cost of a fi nancial asset at each reporting date as the present value of the asset’s cash fl ows discounted at the eff ective interest rate or yield . The yield is the discount rate that produces a present value equal to the purchase price of the fi nancial asset. The yield is also called the internal rate of return (IRR) in fi nance. (For a review of present value techniques, refer to Appendix B at the end of this book .)
1. The effective interest method
To understand this method, consider the underlying substance of an investment in a debt instrument such as a bond. Suppose a bond has a $1,000 face value and a coupon interest rate of 6% per year. This bond promises to pay $60 (6% 3 $1,000) each year, plus $1,000 when the bond matures. (At this point, we do not yet need to be explicit about when this bond matures.)
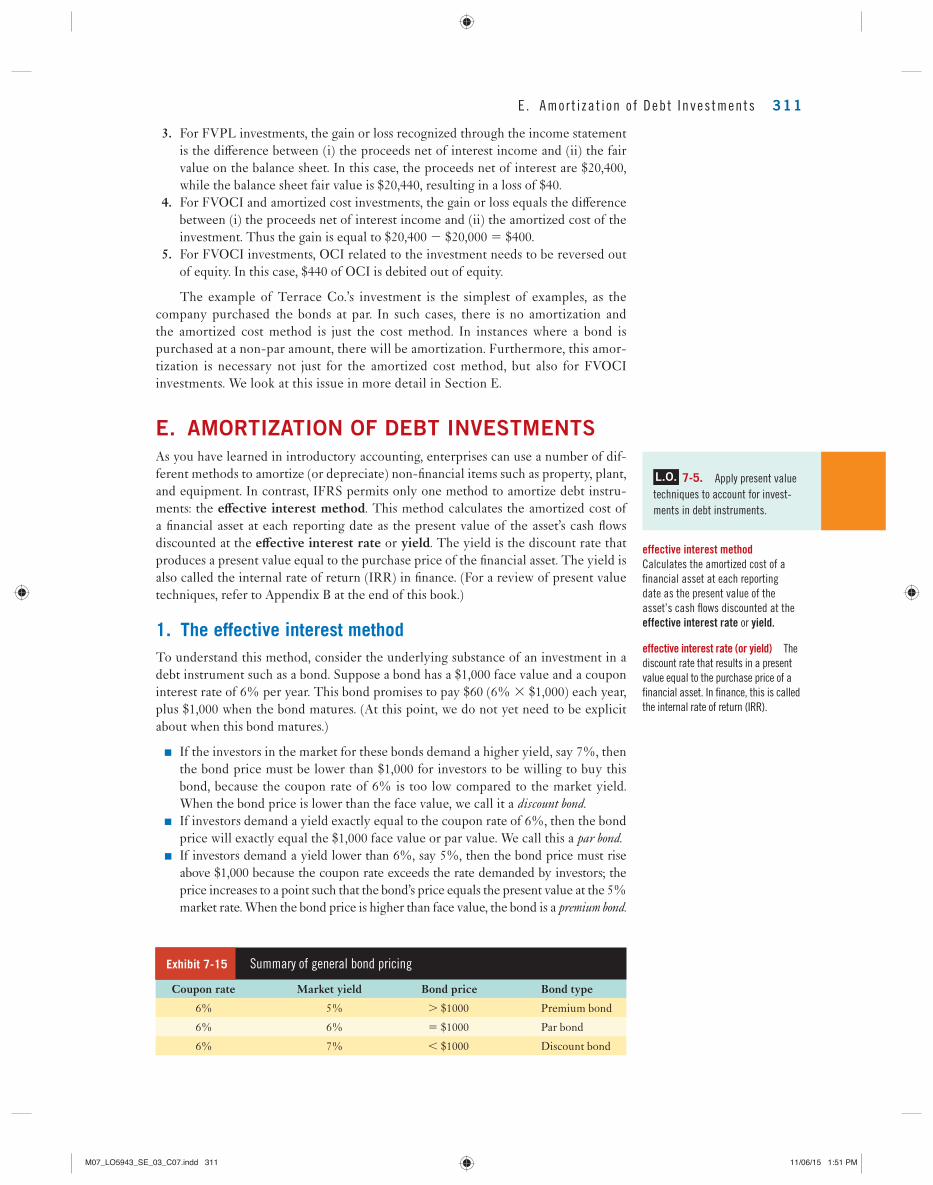
■ If the investors in the market for these bonds demand a higher yield, say 7%, then the bond price must be lower than $1,000 for investors to be willing to buy this bond, because the coupon rate of 6% is too low compared to the market yield. When the bond price is lower than the face value, we call it a discount bond .
■ If investors demand a yield exactly equal to the coupon rate of 6%, then the bond price will exactly equal the $1,000 face value or par value. We call this a par bond .
■ If investors demand a yield lower than 6%, say 5%, then the bond price must rise above $1,000 because the coupon rate exceeds the rate demanded by investors; the price increases to a point such that the bond’s price equals the present value at the 5% market rate. When the bond price is higher than face value, the bond is a premium bond .
L.O. 7-5. Apply present value
techniques to account for invest-
ments in debt instruments.
effective interest method Calculates the amortized cost of a
fi nancial asset at each reporting
date as the present value of the
asset’s cash fl ows discounted at the
effective interest rate or yield.
effective interest rate (or yield) The
discount rate that results in a present
value equal to the purchase price of a
fi nancial asset. In fi nance, this is called
the internal rate of return (IRR).
Coupon rate Market yield Bond price Bond type
6% 5% . $1000 Premium bond
6% 6% 5 $1000 Par bond
6% 7% , $1000 Discount bond
Exhibit 7-15 Summary of general bond pricing
M07_LO5943_SE_03_C07.indd 311M07_LO5943_SE_03_C07.indd 311 11/06/15 1:51 PM11/06/15 1:51 PM
312 CHAPTER 7 F inanc ia l Asse ts
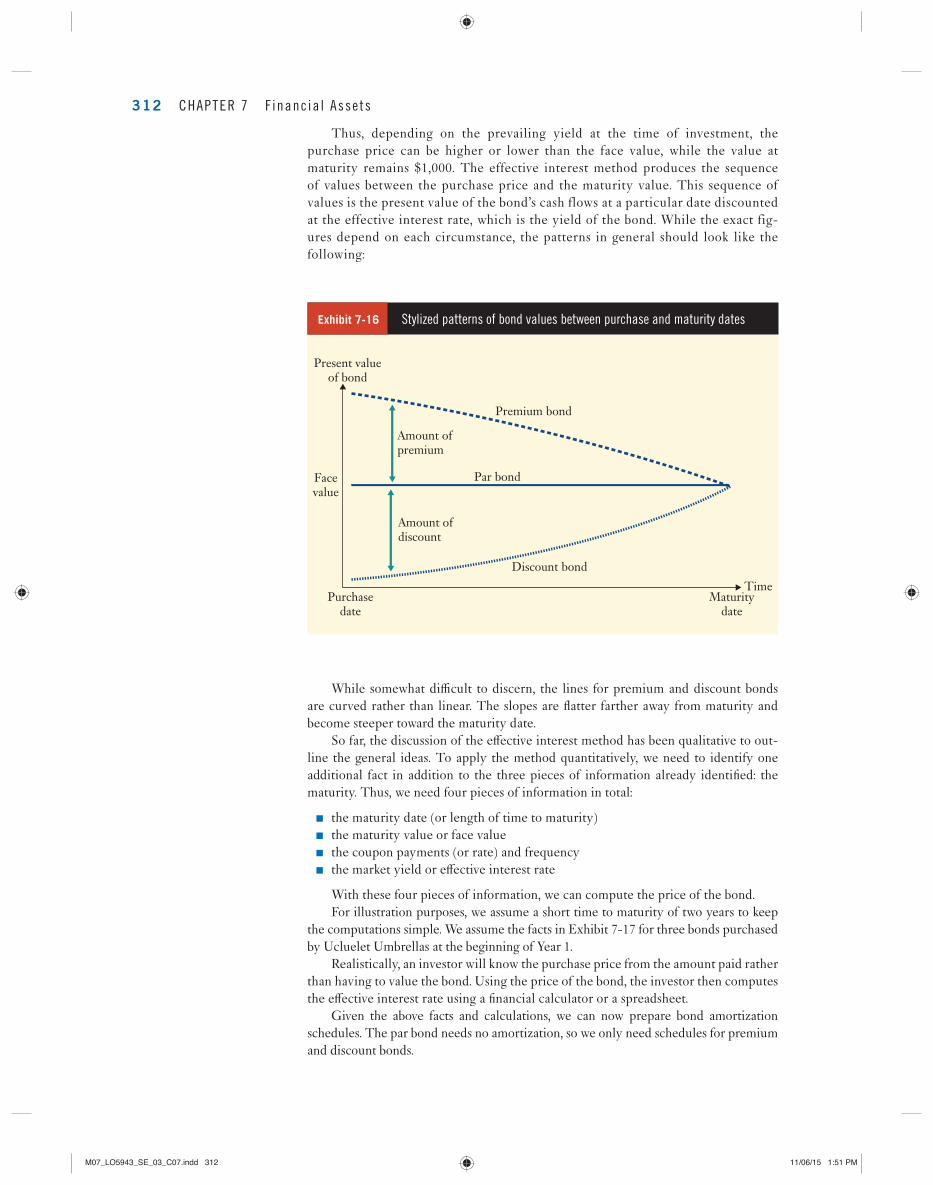
While somewhat diffi cult to discern, the lines for premium and discount bonds are curved rather than linear. The slopes are fl atter farther away from maturity and become steeper toward the maturity date.
So far, the discussion of the eff ective interest method has been qualitative to out-line the general ideas. To apply the method quantitatively, we need to identify one additional fact in addition to the three pieces of information already identifi ed: the maturity. Thus, we need four pieces of information in total:
■ the maturity date (or length of time to maturity) ■ the maturity value or face value ■ the coupon payments (or rate) and frequency ■ the market yield or eff ective interest rate
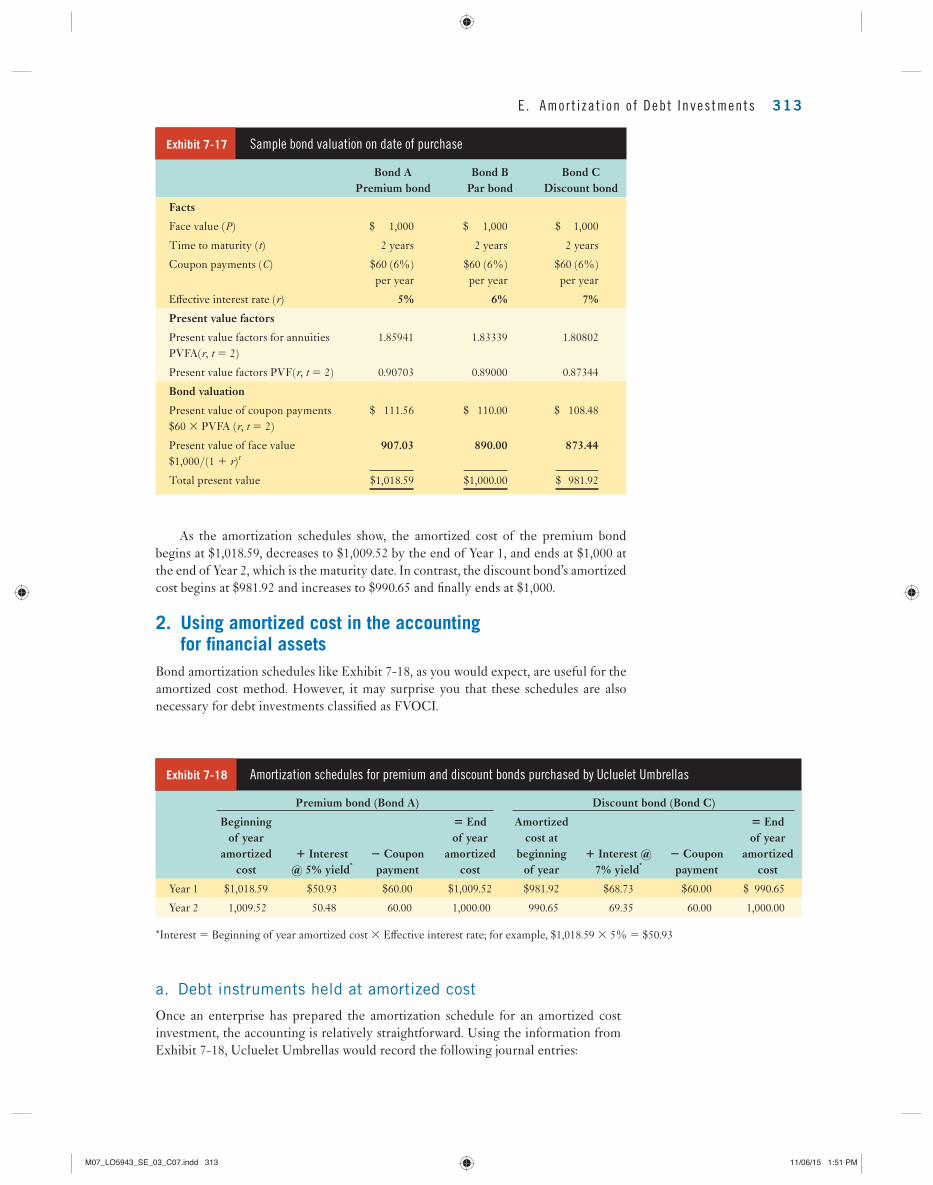
With these four pieces of information, we can compute the price of the bond. For illustration purposes, we assume a short time to maturity of two years to keep
the computations simple. We assume the facts in Exhibit 7-17 for three bonds purchased by Ucluelet Umbrellas at the beginning of Year 1.
Realistically, an investor will know the purchase price from the amount paid rather than having to value the bond. Using the price of the bond, the investor then computes the eff ective interest rate using a fi nancial calculator or a spreadsheet.
Given the above facts and calculations, we can now prepare bond amortization schedules. The par bond needs no amortization, so we only need schedules for premium and discount bonds.
Thus, depending on the prevailing yield at the time of investment, the purchase price can be higher or lower than the face value, while the value at maturity remains $1,000. The effective interest method produces the sequence of values between the purchase price and the maturity value. This sequence of values is the present value of the bond’s cash flows at a particular date discounted at the effective interest rate, which is the yield of the bond. While the exact fig-ures depend on each circumstance, the patterns in general should look like the following:
Exhibit 7-16 Stylized patterns of bond values between purchase and maturity dates
Present valueof bond
Amount ofpremium
Amount ofdiscount
Purchasedate
Maturitydate
Facevalue
Par bond
Premium bond
Discount bond
Time
M07_LO5943_SE_03_C07.indd 312M07_LO5943_SE_03_C07.indd 312 11/06/15 1:51 PM11/06/15 1:51 PM
E . Amor t i za t i on o f Debt Inves tments 313
As the amortization schedules show, the amortized cost of the premium bond begins at $1,018.59, decreases to $1,009.52 by the end of Year 1, and ends at $1,000 at the end of Year 2, which is the maturity date. In contrast, the discount bond’s amortized cost begins at $981.92 and increases to $990.65 and fi nally ends at $1,000.
2. Using amortized cost in the accounting
for fi nancial assets
Bond amortization schedules like Exhibit 7-18 , as you would expect, are useful for the amortized cost method. However, it may surprise you that these schedules are also necessary for debt investments classifi ed as FVOCI.
Premium bond (Bond A) Discount bond (Bond C)
Beginning of year
amortized cost
1 Interest @ 5% yield *
2 Coupon payment
5 End of year
amortized cost
Amortized cost at
beginning of year
1 Interest @ 7% yield *
2 Coupon payment
5 End of year
amortized cost
Year 1 $1,018.59 $50.93 $60.00 $1,009.52 $981.92 $68.73 $60.00 $ 990.65
Year 2 1,009.52 50.48 60.00 1,000.00 990.65 69.35 60.00 1,000.00
* Interest 5 Beginning of year amortized cost 3 Eff ective interest rate; for example, $1,018.59 3 5% 5 $50.93
Exhibit 7-18 Amortization schedules for premium and discount bonds purchased by Ucluelet Umbrellas
Exhibit 7-17 Sample bond valuation on date of purchase
Bond A Premium bond
Bond B Par bond
Bond C Discount bond
Facts
Face value ( P ) $ 1,000 $ 1,000 $ 1,000
Time to maturity ( t ) 2 years 2 years 2 years
Coupon payments ( C ) $60 (6%) per year
$60 (6%) per year
$60 (6%) per year
Eff ective interest rate ( r ) 5% 6% 7%
Present value factors
Present value factors for annuities PVFA( r , t 5 2)
1.85941 1.83339 1.80802
Present value factors PVF( r , t 5 2) 0.90703 0.89000 0.87344
Bond valuation
Present value of coupon payments $60 3 PVFA ( r , t 5 2)
$ 111.56 $ 110.00 $ 108.48
Present value of face value $1,000/(1 1 r ) t
907.03 890.00 873.44
Total present value $1,018.59 $1,000.00 $ 981.92
a. Debt instruments held at amortized cost
Once an enterprise has prepared the amortization schedule for an amortized cost investment, the accounting is relatively straightforward. Using the information from Exhibit 7-18 , Ucluelet Umbrellas would record the following journal entries:
M07_LO5943_SE_03_C07.indd 313M07_LO5943_SE_03_C07.indd 313 11/06/15 1:51 PM11/06/15 1:51 PM

314 CHAPTER 7 F inanc ia l Asse ts
As shown in the journal entries at the end of Years 1 and 2, Ucluelet adjusts the investment account balance each year when the purchase price diff ers from the par/face/maturity value. The adjustments are the reason this method is called “amortized cost.” The adjustment is downward in the case of the premium bond (Bond A) and upward in the case of the discount bond (Bond C). In both cases, the adjustment brings the invest-ment balance, the amortized cost, toward the par value of $1,000. In addition, the amount of the amortization increases over time (e.g., Bond A amortization: Year 1 5 $9.07, Year 2 5 $9.52), just as illustrated in the increasing steepness of the lines graphed in Exhibit 7-16 .
b. Debt instruments held at FVOCI
If an enterprise has debt instruments classifi ed as FVOCI, it needs to keep track of the invest-ments’ amortized cost, and overlay the fair value through the OCI method. There are two distinct reasons for changes in the value of debt investments. The fi rst is the predictable change in value according to the amortization schedule. The second is the unpredictable changes in value due to changes in demand for the debt instrument, which could result from change in market interest rates, changes in credit risk for the instrument, and so on.
To see this interaction, we will use Ucluelet’s investment in Bond A, which is a premium bond. Repeating the facts for ease of reference, Ucluelet purchased the $1,000 bond for $1,018.59, with two years to maturity, $60 per year annual coupon payments, and yield of 5%. To illustrate the fair value method, we now also assume that the price of the bond decreases to $987 at the end of Year 1. At the end of Year 2, the fair value increases back up to $1,000 (as would be expected on the maturity date).
Based on these facts, Ucluelet would prepare the following schedule to track the carrying value of the investment and to determine the amounts of unrealized gain or loss due to fair value changes:
Premium bond (Bond A) Discount bond (Bond C)
PurchaseDr. AC invest. (Bond A) 1,018.59 Dr. AC invest. (Bond C) 981.92
Cr. Cash 1,018.59 * Cr. Cash 981.92 *
Dr. Cash 60.00 Dr. Cash 60.00
End of Year 1 Cr. AC invest. (Bond A) 9.07 † Dr. AC invest. (Bond C) 8.73 †
Cr. Interest revenue 50.93 ‡ Cr. Interest revenue 68.73 ‡
Dr. Cash 60.00 Dr. Cash 60.00
End of Year 2 Cr. AC invest. (Bond A) 9.52 † Dr. AC invest. (Bond C) 9.35 †
Cr. Interest revenue 50.48 ‡ Cr. Interest revenue 69.35 ‡
MaturityDr. Cash 1,000.00 Dr. Cash 1,000.00
Cr. AC invest. (Bond A) 1,000.00 Cr. AC invest. (Bond C) 1,000.00
* See Exhibit 7-18 for these fi gures. † The adjustment to the investment account (i.e., the amortization) is the diff erence between the cash coupon payment and the interest income at the eff ective interest rate. ‡ The amount of interest revenue equals the beginning balance in the investment account, measured at amortized cost, multiplied by the eff ective interest rate. These amounts were previously calculated in Exhibit 7-18 .
Exhibit 7-19 Journal entries for Ucluelet’s bonds if held at amortized cost (AC)
Beginning of year
carrying value 1 Interest * 2 Coupon payment
5 Carrying value before fair value
adjustmentFair value at end of year
Unrealized gain (loss) 5 Fair value 2 Carrying value
Year 1 $1,018.59 $50.93 $60.00 $1,009.52 $987.00 ($22.52)
Year 2 987.00 50.48 60.00 977.48 1,000.00 22.52
* The amount of interest was calculated in Exhibit 7-18 ; it is equal to the amortized cost × eff ective interest rate (5% in this case).
Exhibit 7-20 Continuity schedule for Ucluelet’s premium bond (Bond A) if carried at fair value
M07_LO5943_SE_03_C07.indd 314M07_LO5943_SE_03_C07.indd 314 11/06/15 1:51 PM11/06/15 1:51 PM
E . Amor t i za t i on o f Debt Inves tments 315
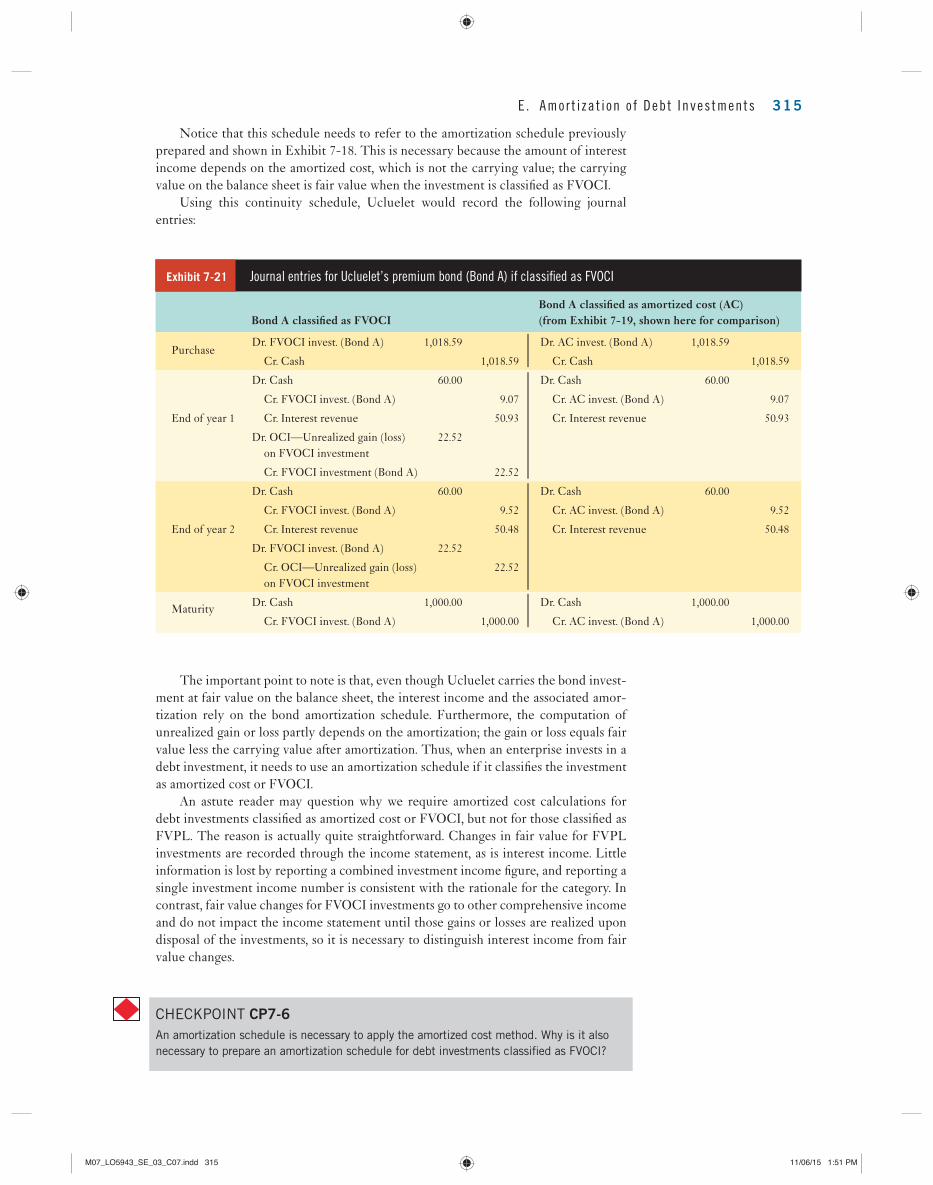
Notice that this schedule needs to refer to the amortization schedule previously prepared and shown in Exhibit 7-18 . This is necessary because the amount of interest income depends on the amortized cost, which is not the carrying value; the carrying value on the balance sheet is fair value when the investment is classifi ed as FVOCI.
Using this continuity schedule, Ucluelet would record the following journal entries:
Bond A classifi ed as FVOCIBond A classifi ed as amortized cost (AC) (from Exhibit 7-19 , shown here for comparison)
PurchaseDr. FVOCI invest. (Bond A) 1,018.59 Dr. AC invest. (Bond A) 1,018.59
Cr. Cash 1,018.59 Cr. Cash 1,018.59
Dr. Cash 60.00 Dr. Cash 60.00
Cr. FVOCI invest. (Bond A) 9.07 Cr. AC invest. (Bond A) 9.07
End of year 1 Cr. Interest revenue 50.93 Cr. Interest revenue 50.93
Dr. OCI—Unrealized gain (loss) on FVOCI investment
22.52
Cr. FVOCI investment (Bond A) 22.52
Dr. Cash 60.00 Dr. Cash 60.00
Cr. FVOCI invest. (Bond A) 9.52 Cr. AC invest. (Bond A) 9.52
End of year 2 Cr. Interest revenue 50.48 Cr. Interest revenue 50.48
Dr. FVOCI invest. (Bond A) 22.52
Cr. OCI—Unrealized gain (loss) on FVOCI investment
22.52
Maturity Dr. Cash 1,000.00 Dr. Cash 1,000.00
Cr. FVOCI invest. (Bond A) 1,000.00 Cr. AC invest. (Bond A) 1,000.00
Exhibit 7-21 Journal entries for Ucluelet’s premium bond (Bond A) if classifi ed as FVOCI
The important point to note is that, even though Ucluelet carries the bond invest-ment at fair value on the balance sheet, the interest income and the associated amor-tization rely on the bond amortization schedule. Furthermore, the computation of unrealized gain or loss partly depends on the amortization; the gain or loss equals fair value less the carrying value after amortization. Thus, when an enterprise invests in a debt investment, it needs to use an amortization schedule if it classifi es the investment as amortized cost or FVOCI.
An astute reader may question why we require amortized cost calculations for debt investments classifi ed as amortized cost or FVOCI, but not for those classifi ed as FVPL. The reason is actually quite straightforward. Changes in fair value for FVPL investments are recorded through the income statement, as is interest income. Little information is lost by reporting a combined investment income fi gure, and reporting a single investment income number is consistent with the rationale for the category. In contrast, fair value changes for FVOCI investments go to other comprehensive income and do not impact the income statement until those gains or losses are realized upon disposal of the investments, so it is necessary to distinguish interest income from fair value changes.
CHECKPOINT CP7-6 An amortization schedule is necessary to apply the amortized cost method. Why is it also
necessary to prepare an amortization schedule for debt investments classifi ed as FVOCI?
M07_LO5943_SE_03_C07.indd 315M07_LO5943_SE_03_C07.indd 315 11/06/15 1:51 PM11/06/15 1:51 PM
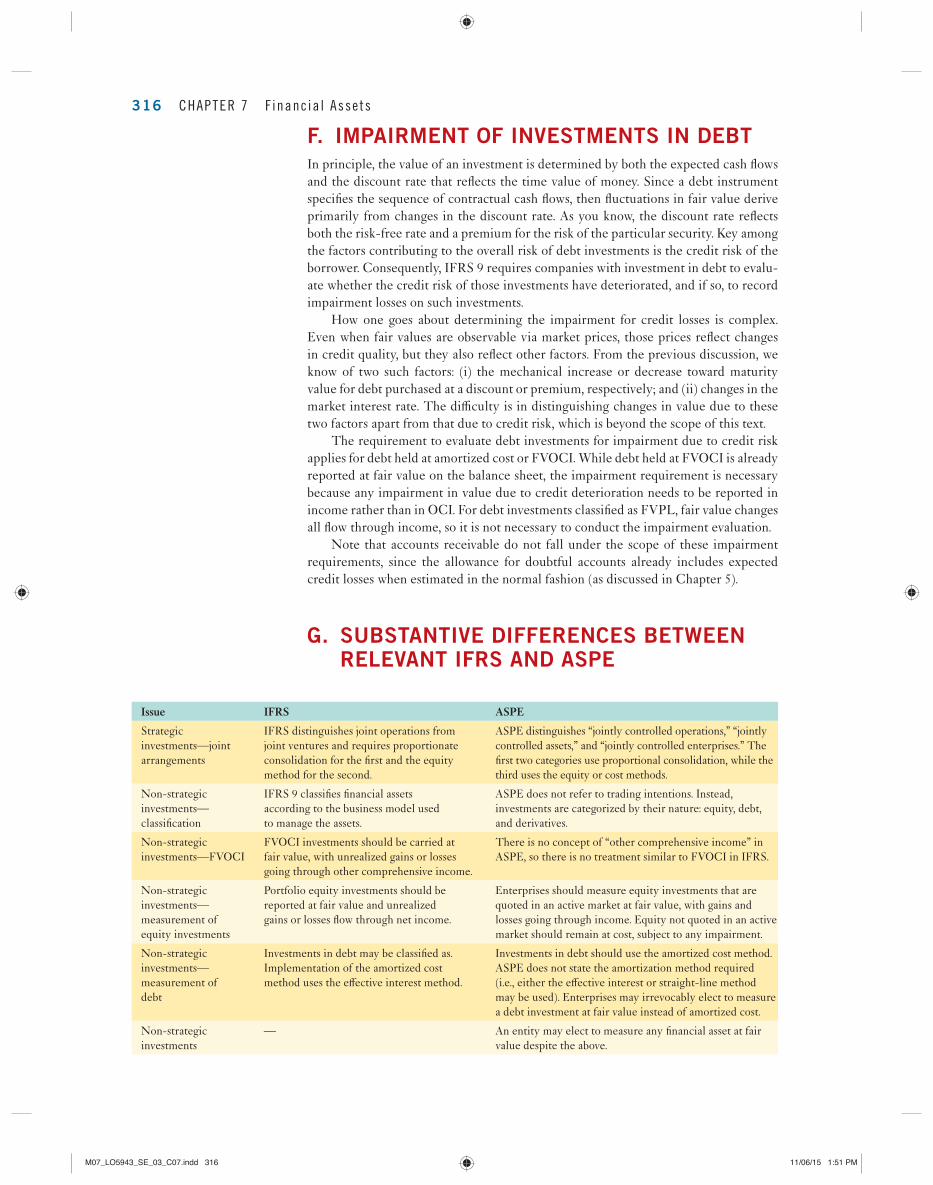
316 CHAPTER 7 F inanc ia l Asse ts
F. IMPAIRMENT OF INVESTMENTS IN DEBT In principle, the value of an investment is determined by both the expected cash fl ows and the discount rate that refl ects the time value of money. Since a debt instrument specifi es the sequence of contractual cash fl ows, then fl uctuations in fair value derive primarily from changes in the discount rate. As you know, the discount rate refl ects both the risk-free rate and a premium for the risk of the particular security. Key among the factors contributing to the overall risk of debt investments is the credit risk of the borrower. Consequently, IFRS 9 requires companies with investment in debt to evalu-ate whether the credit risk of those investments have deteriorated, and if so, to record impairment losses on such investments.
How one goes about determining the impairment for credit losses is complex. Even when fair values are observable via market prices, those prices refl ect changes in credit quality, but they also refl ect other factors. From the previous discussion, we know of two such factors: (i) the mechanical increase or decrease toward maturity value for debt purchased at a discount or premium, respectively; and (ii) changes in the market interest rate. The diffi culty is in distinguishing changes in value due to these two factors apart from that due to credit risk , which is beyond the scope of this text .
The requirement to evaluate debt investments for impairment due to credit risk applies for debt held at amortized cost or FVOCI. While debt held at FVOCI is already reported at fair value on the balance sheet, the impairment requirement is necessary because any impairment in value due to credit deterioration needs to be reported in income rather than in OCI. For debt investments classifi ed as FVPL, fair value changes all fl ow through income, so it is not necessary to conduct the impairment evaluation.
Note that accounts receivable do not fall under the scope of these impairment requirements, since the allowance for doubtful accounts already includes expected credit losses when estimated in the normal fashion (as discussed in Chapter 5 ) .
G. SUBSTANTIVE DIFFERENCES BETWEEN RELEVANT IFRS AND ASPE
Issue IFRS ASPE
Strategic investments—joint arrangements
IFRS distinguishes joint operations from joint ventures and requires proportionate consolidation for the fi rst and the equity method for the second.
ASPE distinguishes “jointly controlled operations,” “jointly controlled assets,” and “jointly controlled enterprises.” The fi rst two categories use proportional consolidation, while the third uses the equity or cost methods.
Non-strategic investments— classifi cation
IFRS 9 classifi es fi nancial assets according to the business model used to manage the assets.
ASPE does not refer to trading intentions. Instead, investments are categorized by their nature: equity, debt, and derivatives.
Non-strategic investments—FVOCI
FVOCI investments should be carried at fair value, with unrealized gains or losses going through other comprehensive income.
There is no concept of “other comprehensive income” in ASPE, so there is no treatment similar to FVOCI in IFRS.
Non-strategic investments— measurement of equity investments
Portfolio equity investments should be reported at fair value and unrealized gains or losses fl ow through net income.
Enterprises should measure equity investments that are quoted in an active market at fair value, with gains and losses going through income. Equity not quoted in an active market should remain at cost, subject to any impairment.
Non-strategic investments—measurement of debt
Investments in debt may be classifi ed as. Implementation of the amortized cost method uses the eff ective interest method.
Investments in debt should use the amortized cost method. ASPE does not state the amortization method required (i.e., either the eff ective interest or straight-line method may be used). Enterprises may irrevocably elect to measure a debt investment at fair value instead of amortized cost.
Non-strategic investments
— An entity may elect to measure any fi nancial asset at fair value despite the above.
M07_LO5943_SE_03_C07.indd 316M07_LO5943_SE_03_C07.indd 316 11/06/15 1:51 PM11/06/15 1:51 PM
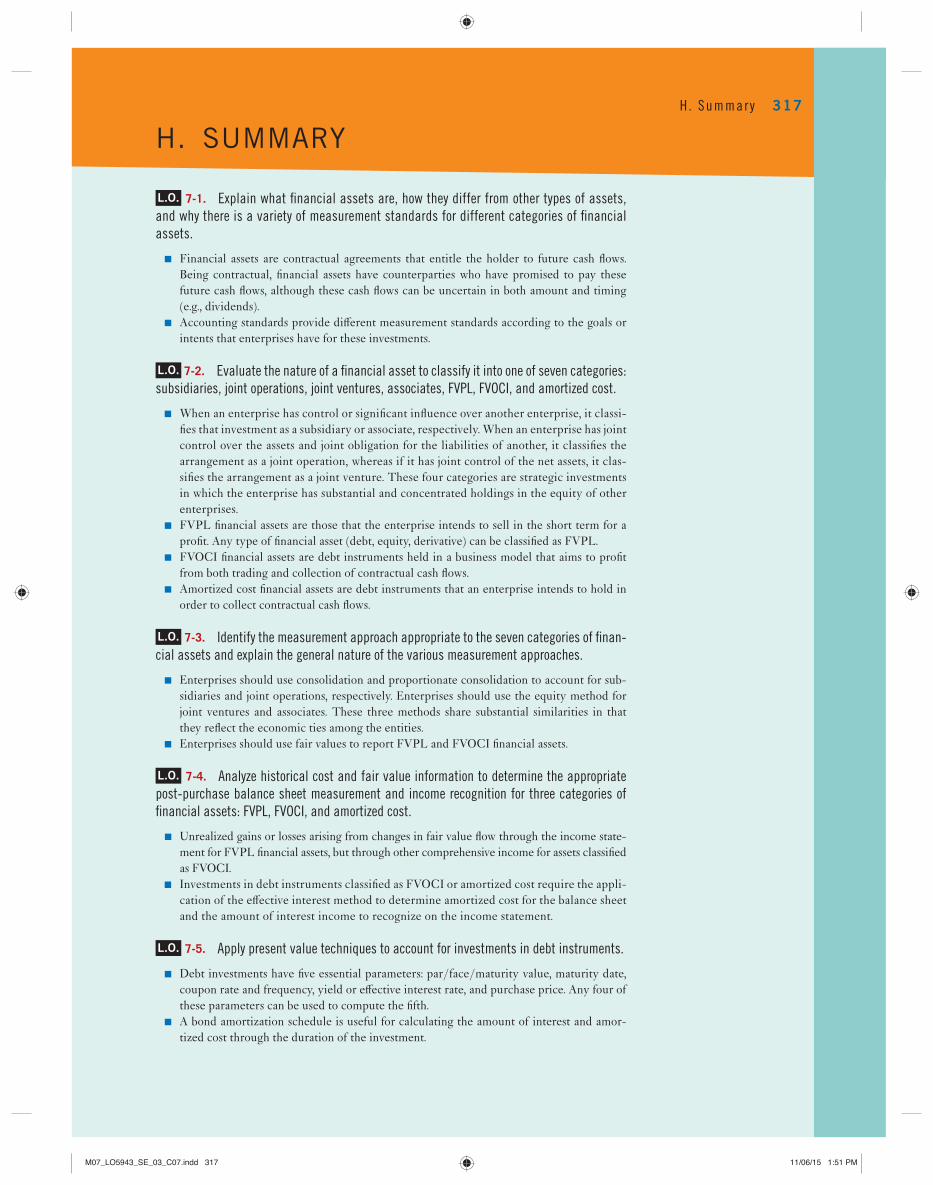
H. SUMMARY
H. Summary 317
L.O. 7-1. Explain what fi nancial assets are, how they differ from other types of assets,
and why there is a variety of measurement standards for different categories of fi nancial
assets.
■ Financial assets are contractual agreements that entitle the holder to future cash fl ows. Being contractual, fi nancial assets have counterparties who have promised to pay these future cash fl ows, although these cash fl ows can be uncertain in both amount and timing (e.g., dividends).
■ Accounting standards provide diff erent measurement standards according to the goals or intents that enterprises have for these investments.
L.O. 7-2. Evaluate the nature of a fi nancial asset to classify it into one of seven categories:
subsidiaries, joint operations, joint ventures, associates, FVPL, FVOCI, and amortized cost.
■ When an enterprise has control or signifi cant infl uence over another enterprise, it classi-fi es that investment as a subsidiary or associate, respectively. When an enterprise has joint control over the assets and joint obligation for the liabilities of another, it classifi es the arrangement as a joint operation, whereas if it has joint control of the net assets, it clas-sifi es the arrangement as a joint venture. These four categories are strategic investments in which the enterprise has substantial and concentrated holdings in the equity of other enterprises.
■ FVPL fi nancial assets are those that the enterprise intends to sell in the short term for a profi t. Any type of fi nancial asset (debt, equity, derivative) can be classifi ed as FVPL.
■ FVOCI fi nancial assets are debt instruments held in a business model that aims to profi t from both trading and collection of contractual cash fl ows.
■ Amortized cost fi nancial assets are debt instruments that an enterprise intends to hold in order to collect contractual cash fl ows.
L.O. 7-3. Identify the measurement approach appropriate to the seven categories of fi nan-
cial assets and explain the general nature of the various measurement approaches.
■ Enterprises should use consolidation and proportionate consolidation to account for sub-sidiaries and joint operations, respectively. Enterprises should use the equity method for joint ventures and associates. These three methods share substantial similarities in that they refl ect the economic ties among the entities.
■ Enterprises should use fair values to report FVPL and FVOCI fi nancial assets.
L.O. 7-4. Analyze historical cost and fair value information to determine the appropriate
post-purchase balance sheet measurement and income recognition for three categories of
fi nancial assets: FVPL, FVOCI, and amortized cost.
■ Unrealized gains or losses arising from changes in fair value fl ow through the income state-ment for FVPL fi nancial assets, but through other comprehensive income for assets classifi ed as FVOCI.
■ Investments in debt instruments classifi ed as FVOCI or amortized cost require the appli-cation of the eff ective interest method to determine amortized cost for the balance sheet and the amount of interest income to recognize on the income statement.
L.O. 7-5. Apply present value techniques to account for investments in debt instruments.
■ Debt investments have fi ve essential parameters: par/face/maturity value, maturity date, coupon rate and frequency, yield or eff ective interest rate, and purchase price. Any four of these parameters can be used to compute the fi fth.
■ A bond amortization schedule is useful for calculating the amount of interest and amor-tized cost through the duration of the investment.
M07_LO5943_SE_03_C07.indd 317M07_LO5943_SE_03_C07.indd 317 11/06/15 1:51 PM11/06/15 1:51 PM
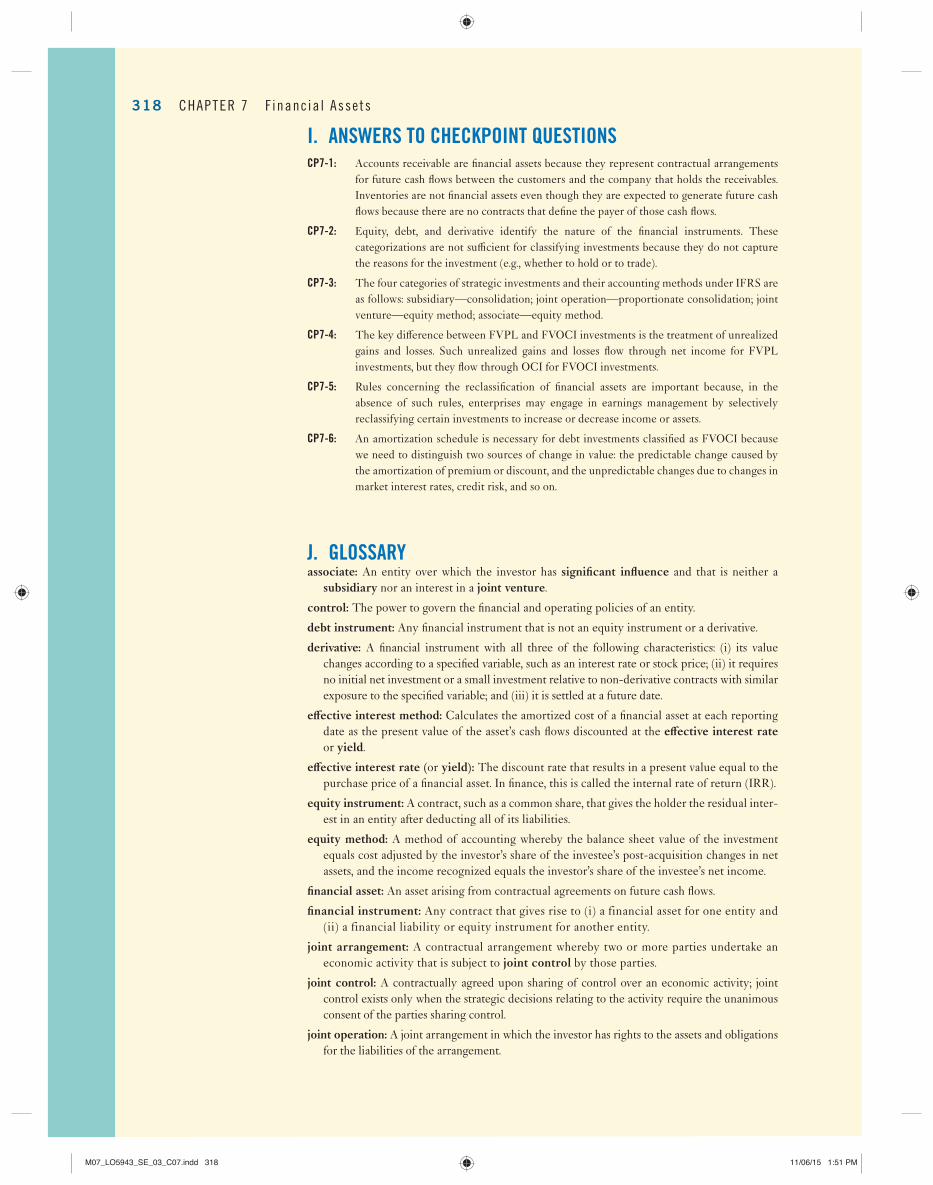
I. ANSWERS TO CHECKPOINT QUESTIONS
CP7-1: Accounts receivable are fi nancial assets because they represent contractual arrangements for future cash fl ows between the customers and the company that holds the receivables. Inventories are not fi nancial assets even though they are expected to generate future cash fl ows because there are no contracts that defi ne the payer of those cash fl ows.
CP7-2: Equity, debt, and derivative identify the nature of the fi nancial instruments. These categorizations are not suffi cient for classifying investments because they do not capture the reasons for the investment (e.g., whether to hold or to trade).
CP7-3: The four categories of strategic investments and their accounting methods under IFRS are as follows: subsidiary—consolidation; joint operation—proportionate consolidation; joint venture—equity method; associate—equity method.
CP7-4: The key diff erence between FVPL and FVOCI investments is the treatment of unrealized gains and losses. Such unrealized gains and losses fl ow through net income for FVPL investments, but they fl ow through OCI for FVOCI investments.
CP7-5: Rules concerning the reclassifi cation of fi nancial assets are important because, in the absence of such rules, enterprises may engage in earnings management by selectively reclassifying certain investments to increase or decrease income or assets.
CP7-6: An amortization schedule is necessary for debt investments classifi ed as FVOCI because we need to distinguish two sources of change in value: the predictable change caused by the amortization of premium or discount, and the unpredictable changes due to changes in market interest rates, credit risk, and so on.
J. GLOSSARY associate: An entity over which the investor has signifi cant infl uence and that is neither a
subsidiary nor an interest in a joint venture .
control: The power to govern the fi nancial and operating policies of an entity.
debt instrument: Any fi nancial instrument that is not an equity instrument or a derivative.
derivative: A fi nancial instrument with all three of the following characteristics: (i) its value changes according to a specifi ed variable, such as an interest rate or stock price; (ii) it requires no initial net investment or a small investment relative to non-derivative contracts with similar exposure to the specifi ed variable; and (iii) it is settled at a future date.
eff ective interest method: Calculates the amortized cost of a fi nancial asset at each reporting date as the present value of the asset’s cash fl ows discounted at the eff ective interest rate or yield .
eff ective interest rate (or yield): The discount rate that results in a present value equal to the purchase price of a fi nancial asset. In fi nance, this is called the internal rate of return (IRR).
equity instrument: A contract, such as a common share, that gives the holder the residual inter-est in an entity after deducting all of its liabilities.
equity method: A method of accounting whereby the balance sheet value of the investment equals cost adjusted by the investor’s share of the investee’s post-acquisition changes in net assets, and the income recognized equals the investor’s share of the investee’s net income.
fi nancial asset: An asset arising from contractual agreements on future cash fl ows.
fi nancial instrument: Any contract that gives rise to (i) a financial asset for one entity and (ii) a financial liability or equity instrument for another entity.
joint arrangement: A contractual arrangement whereby two or more parties undertake an economic activity that is subject to joint control by those parties.
joint control: A contractually agreed upon sharing of control over an economic activity; joint control exists only when the strategic decisions relating to the activity require the unanimous consent of the parties sharing control.
joint operation: A joint arrangement in which the investor has rights to the assets and obligations for the liabilities of the arrangement.
318 CHAPTER 7 F inanc ia l Asse ts
M07_LO5943_SE_03_C07.indd 318M07_LO5943_SE_03_C07.indd 318 11/06/15 1:51 PM11/06/15 1:51 PM
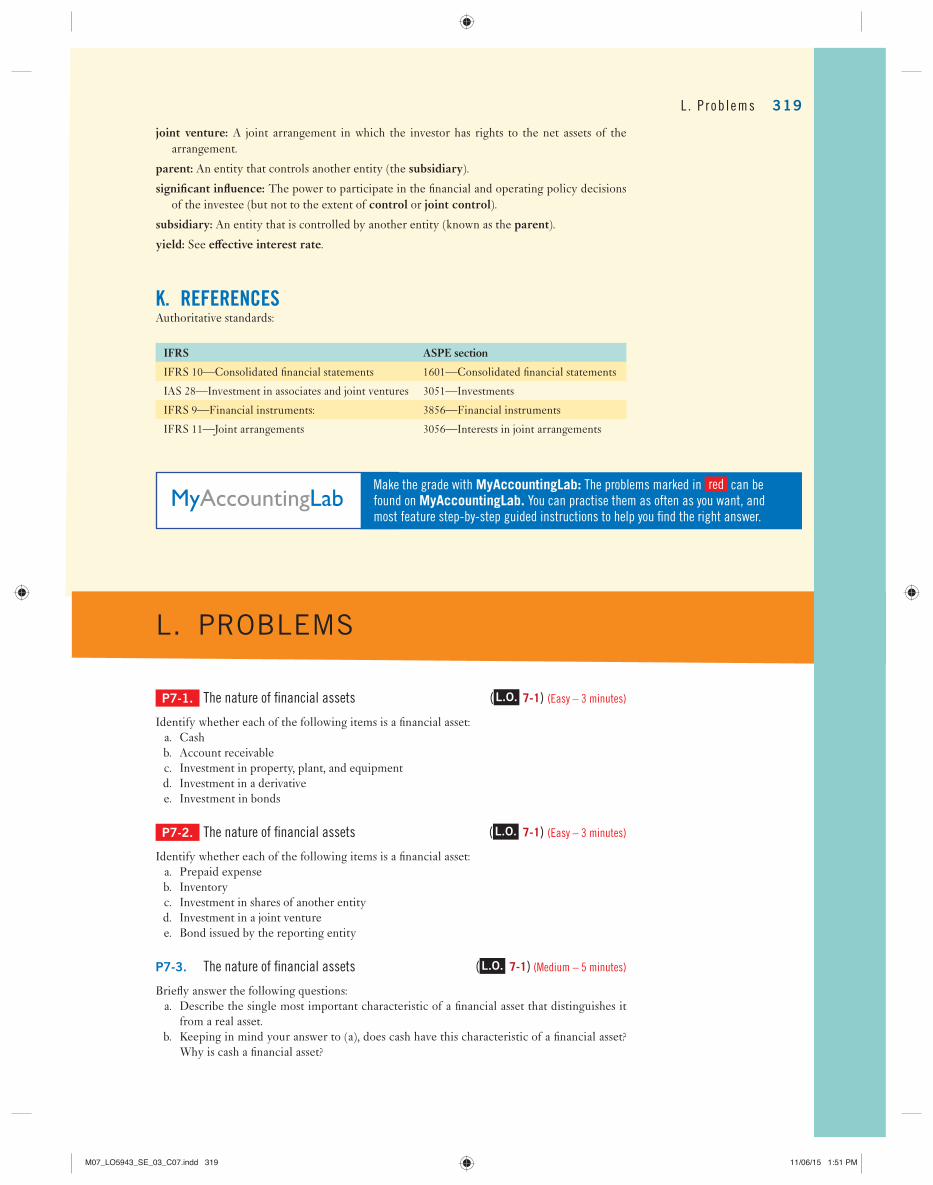
joint venture: A joint arrangement in which the investor has rights to the net assets of the arrangement.
parent: An entity that controls another entity (the subsidiary ).
signifi cant infl uence: The power to participate in the fi nancial and operating policy decisions of the investee (but not to the extent of control or joint control ).
subsidiary: An entity that is controlled by another entity (known as the parent ).
yield: See eff ective interest rate .
K. REFERENCES Authoritative standards:
IFRS ASPE section
IFRS 10—Consolidated fi nancial statements 1601—Consolidated fi nancial statements
IAS 28—Investment in associates and joint ventures 3051—Investments
IFRS 9—Financial instruments: 3856—Financial instruments
IFRS 11—Joint arrangements 3056—Interests in joint arrangements
MyAccountingLab Make the grade with MyAccountingLab: The problems marked in red can be
found on MyAccountingLab. You can practise them as often as you want, and
most feature step-by-step guided instructions to help you fi nd the right answer.
L. PROBLEMS
P7-1. The nature of fi nancial assets ( L.O. 7-1 ) (Easy – 3 minutes)
Identify whether each of the following items is a fi nancial asset: a. Cash b. Account receivable c. Investment in property, plant, and equipment d. Investment in a derivative e. Investment in bonds
P7-2. The nature of fi nancial assets ( L.O. 7-1 ) (Easy – 3 minutes)
Identify whether each of the following items is a fi nancial asset: a. Prepaid expense b. Inventory c. Investment in shares of another entity d. Investment in a joint venture e. Bond issued by the reporting entity
P7-3. The nature of fi nancial assets ( L.O. 7-1 ) (Medium – 5 minutes)
Briefl y answer the following questions: a. Describe the single most important characteristic of a fi nancial asset that distinguishes it
from a real asset. b. Keeping in mind your answer to (a), does cash have this characteristic of a fi nancial asset?
Why is cash a fi nancial asset?
L . P rob lems 319
M07_LO5943_SE_03_C07.indd 319M07_LO5943_SE_03_C07.indd 319 11/06/15 1:51 PM11/06/15 1:51 PM
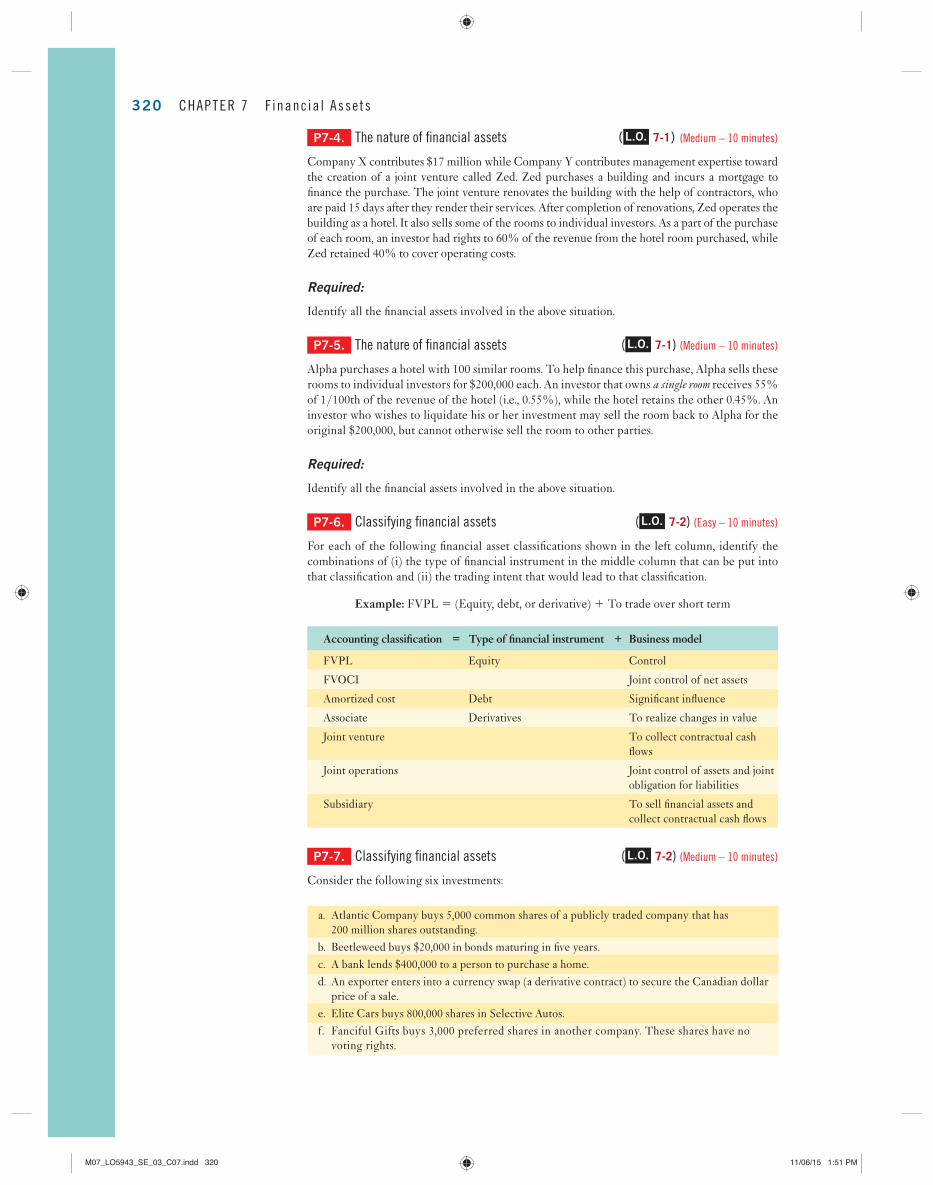
320 CHAPTER 7 F inanc ia l Asse ts
P7-4. The nature of fi nancial assets ( L.O. 7-1 ) (Medium – 10 minutes)
Company X contributes $17 million while Company Y contributes management expertise toward the creation of a joint venture called Zed. Zed purchases a building and incurs a mortgage to fi nance the purchase. The joint venture renovates the building with the help of contractors, who are paid 15 days after they render their services. After completion of renovations, Zed operates the building as a hotel. It also sells some of the rooms to individual investors. As a part of the purchase of each room, an investor had rights to 60% of the revenue from the hotel room purchased, while Zed retained 40% to cover operating costs.
Required:
Identify all the fi nancial assets involved in the above situation.
P7-5. The nature of fi nancial assets ( L.O. 7-1 ) (Medium – 10 minutes)
Alpha purchases a hotel with 100 similar rooms. To help fi nance this purchase, Alpha sells these rooms to individual investors for $200,000 each. An investor that owns a single room receives 55% of 1/100th of the revenue of the hotel (i.e., 0.55%), while the hotel retains the other 0.45%. An investor who wishes to liquidate his or her investment may sell the room back to Alpha for the original $200,000, but cannot otherwise sell the room to other parties.
Required:
Identify all the fi nancial assets involved in the above situation.
P7-6. Classifying fi nancial assets ( L.O. 7-2 ) (Easy – 10 minutes)
For each of the following fi nancial asset classifi cations shown in the left column, identify the combinations of (i) the type of fi nancial instrument in the middle column that can be put into that classifi cation and (ii) the trading intent that would lead to that classifi cation.
Example: FVPL 5 (Equity, debt, or derivative) 1 To trade over short term
Accounting classifi cation 5 Type of fi nancial instrument 1 Business model
FVPL Equity Control
FVOCI Joint control of net assets
Amortized cost Debt Signifi cant infl uence
Associate Derivatives To realize changes in value
Joint venture To collect contractual cash fl ows
Joint operations Joint control of assets and joint obligation for liabilities
Subsidiary To sell fi nancial assets and collect contractual cash fl ows
P7-7. Classifying fi nancial assets ( L.O. 7-2 ) (Medium – 10 minutes)
Consider the following six investments:
a. Atlantic Company buys 5,000 common shares of a publicly traded company that has 200 million shares outstanding.
b. Beetleweed buys $20,000 in bonds maturing in fi ve years. c. A bank lends $400,000 to a person to purchase a home. d. An exporter enters into a currency swap (a derivative contract) to secure the Canadian dollar
price of a sale. e. Elite Cars buys 800,000 shares in Selective Autos. f . Fanciful Gifts buys 3,000 preferred shares in another company. These shares have no
voting rights.
M07_LO5943_SE_03_C07.indd 320M07_LO5943_SE_03_C07.indd 320 11/06/15 1:51 PM11/06/15 1:51 PM
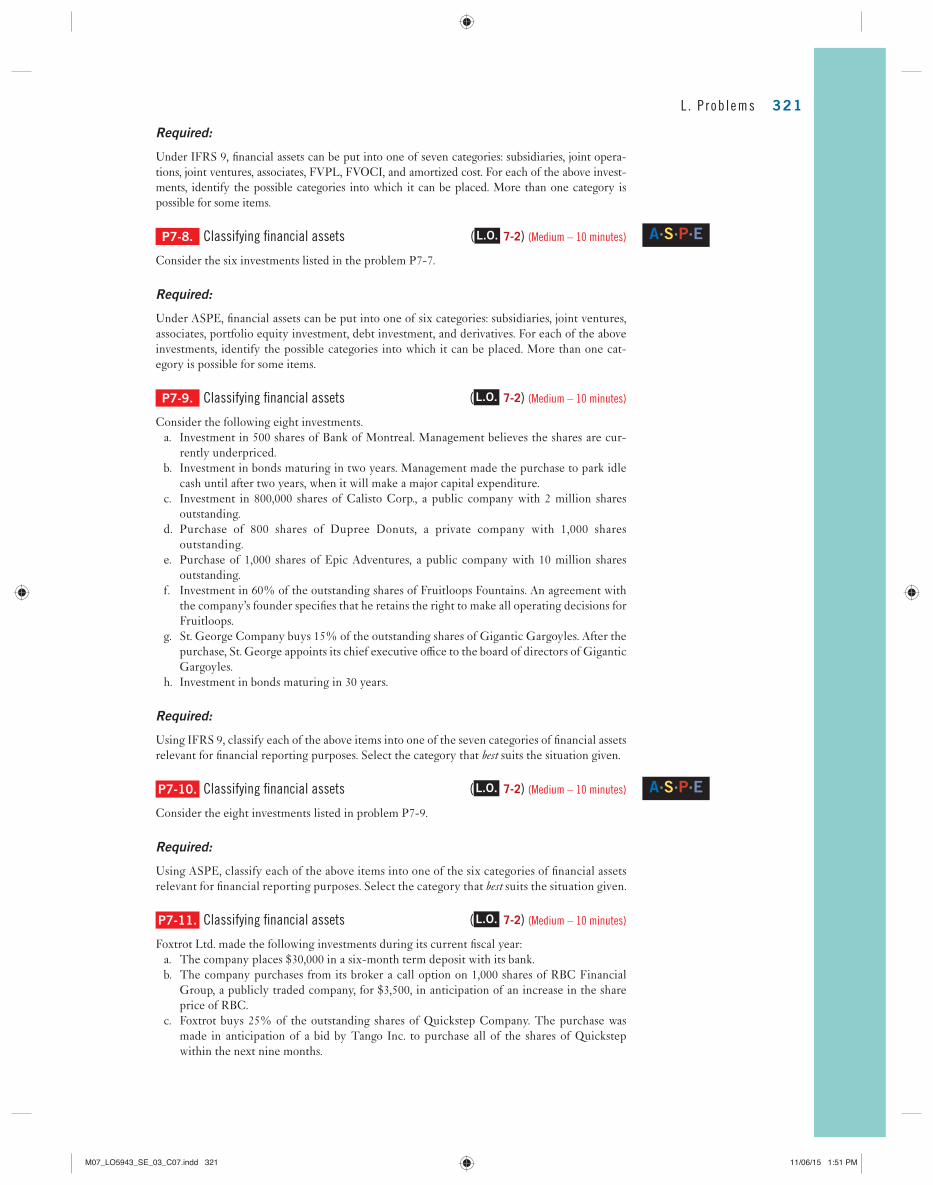
Required:
Under IFRS 9, fi nancial assets can be put into one of seven categories: subsidiaries, joint opera-tions, joint ventures, associates, FVPL, FVOCI, and amortized cost. For each of the above invest-ments, identify the possible categories into which it can be placed. More than one category is possible for some items.
P7-8. Classifying fi nancial assets ( L.O. 7-2 ) (Medium – 10 minutes)
Consider the six investments listed in the problem P7-7.
Required:
Under ASPE, fi nancial assets can be put into one of six categories: subsidiaries, joint ventures, associates, portfolio equity investment, debt investment, and derivatives. For each of the above investments, identify the possible categories into which it can be placed. More than one cat-egory is possible for some items.
P7-9. Classifying fi nancial assets ( L.O. 7-2 ) (Medium – 10 minutes)
Consider the following eight investments. a. Investment in 500 shares of Bank of Montreal. Management believes the shares are cur-
rently underpriced. b. Investment in bonds maturing in two years. Management made the purchase to park idle
cash until after two years, when it will make a major capital expenditure. c. Investment in 800,000 shares of Calisto Corp., a public company with 2 million shares
outstanding. d. Purchase of 800 shares of Dupree Donuts, a private company with 1,000 shares
outstanding. e. Purchase of 1,000 shares of Epic Adventures, a public company with 10 million shares
outstanding. f. Investment in 60% of the outstanding shares of Fruitloops Fountains. An agreement with
the company’s founder specifi es that he retains the right to make all operating decisions for Fruitloops.
g. St. George Company buys 15% of the outstanding shares of Gigantic Gargoyles. After the purchase, St. George appoints its chief executive offi ce to the board of directors of Gigantic Gargoyles.
h. Investment in bonds maturing in 30 years.
Required:
Using IFRS 9, classify each of the above items into one of the seven categories of fi nancial assets relevant for fi nancial reporting purposes. Select the category that best suits the situation given.
P7-10. Classifying fi nancial assets ( L.O. 7-2 ) (Medium – 10 minutes)
Consider the eight investments listed in problem P7-9.
Required:
Using ASPE, classify each of the above items into one of the six categories of fi nancial assets relevant for fi nancial reporting purposes. Select the category that best suits the situation given.
P7-11. Classifying fi nancial assets ( L.O. 7-2 ) (Medium – 10 minutes)
Foxtrot Ltd. made the following investments during its current fi scal year: a. The company places $30,000 in a six-month term deposit with its bank. b. The company purchases from its broker a call option on 1,000 shares of RBC Financial
Group, a publicly traded company, for $3,500, in anticipation of an increase in the share price of RBC.
c. Foxtrot buys 25% of the outstanding shares of Quickstep Company. The purchase was made in anticipation of a bid by Tango Inc. to purchase all of the shares of Quickstep within the next nine months.
A.S.P.E
A.S.P.E
L . P rob lems 321
M07_LO5943_SE_03_C07.indd 321M07_LO5943_SE_03_C07.indd 321 11/06/15 1:51 PM11/06/15 1:51 PM

322 CHAPTER 7 F inanc ia l Asse ts
d. The company buys $15,000 of shares in Encana, a publicly traded corporation with a mar-ket capitalization of more than $20 billion.
Required:
Identify how Foxtrot should categorize the above fi nancial assets under IFRS 9. Briefl y explain the reason for the classifi cation.
P7-12. Classifying fi nancial assets ( L.O. 7-2 ) (Medium – 10 minutes)
Refer to the information in the problem P7-11.
Required:
Using ASPE, identify how Foxtrot should categorize the above fi nancial assets. Briefl y explain the reason for the classifi cation.
P7-13. Initial recognition of fi nancial assets ( L.O. 7-3 ) (Medium – 15 minutes)
On January 1, 2018, Investor’s Club Inc. (ICI) made a number of non-strategic investments detailed below:
a. The company acquired 100,000 ordinary shares in Norman Inc. for $5 cash per share plus a $10,000 transaction fee. ICI’s management did not make any specifi c election with respect to the classifi cation of this investment.
b. ICI purchased 5,000, $25, 3.0% cumulative preferred shares in Bleay Inc. for $130,000 including transaction costs of $5,000. ICI irrevocably elected to present changes in fair value through OCI.
c. ICI paid $2,393,859 plus a $50,000 transaction fee for $2.5 million of 3.5% semi-annual bonds issued by Zoe Corp. that mature in fi ve years. The eff ective rate of interest earned is 2.0% PER PERIOD. The objective of the company’s business model for this type of asset is to hold the investment for the purpose of collecting the contractual cash fl ows.
Required:
Record the journal entries necessary to refl ect the foregoing transactions. Briefl y justify your chosen treatment.
P7-14. Subsequent measurement of fi nancial assets ( L.O. 7-4 ) (Medium – 15 minutes)
Refer to the facts set out in P7-13 above and consider the following additional information: a. On July 1, 2018, ICI received a $43,750 interest payment on the Zoe Corp. bonds. The next
interest payment is due on January 1, 2019. b. On September 30, 2018, ICI received a $3,750 dividend on the Bleay Inc. cumulative
preferred shares. c. On December 31, 2018, ICI received a $2,000 dividend on the Norman Inc. ordinary shares. d. The market value of the Norman Inc. ordinary shares as at December 31, 2018, was $4.90
per share. e. The market value of the Bleay Inc.’s cumulative preferred shares as at December 31, 2018,
was $26.25 per share. f. The market value of the investment in the Zoe Corp. bonds as at December 31, 2018, was
$2,500,000.
ICI has a December 31 year-end. It does not prepare interim fi nancial statements.
Required:
Prepare the necessary journal entries to record income earned on these assets in 2018 and the requisite fair value adjustments at December 31, 2018.
P7-15. Post-purchase measurement of fi nancial assets ( L.O. 7-3 ) (Easy – 10 minutes)
After the initial purchase, fi nancial assets can be reported using one of six measurement bases under IFRS:
A.S.P.E
M07_LO5943_SE_03_C07.indd 322M07_LO5943_SE_03_C07.indd 322 11/06/15 1:51 PM11/06/15 1:51 PM
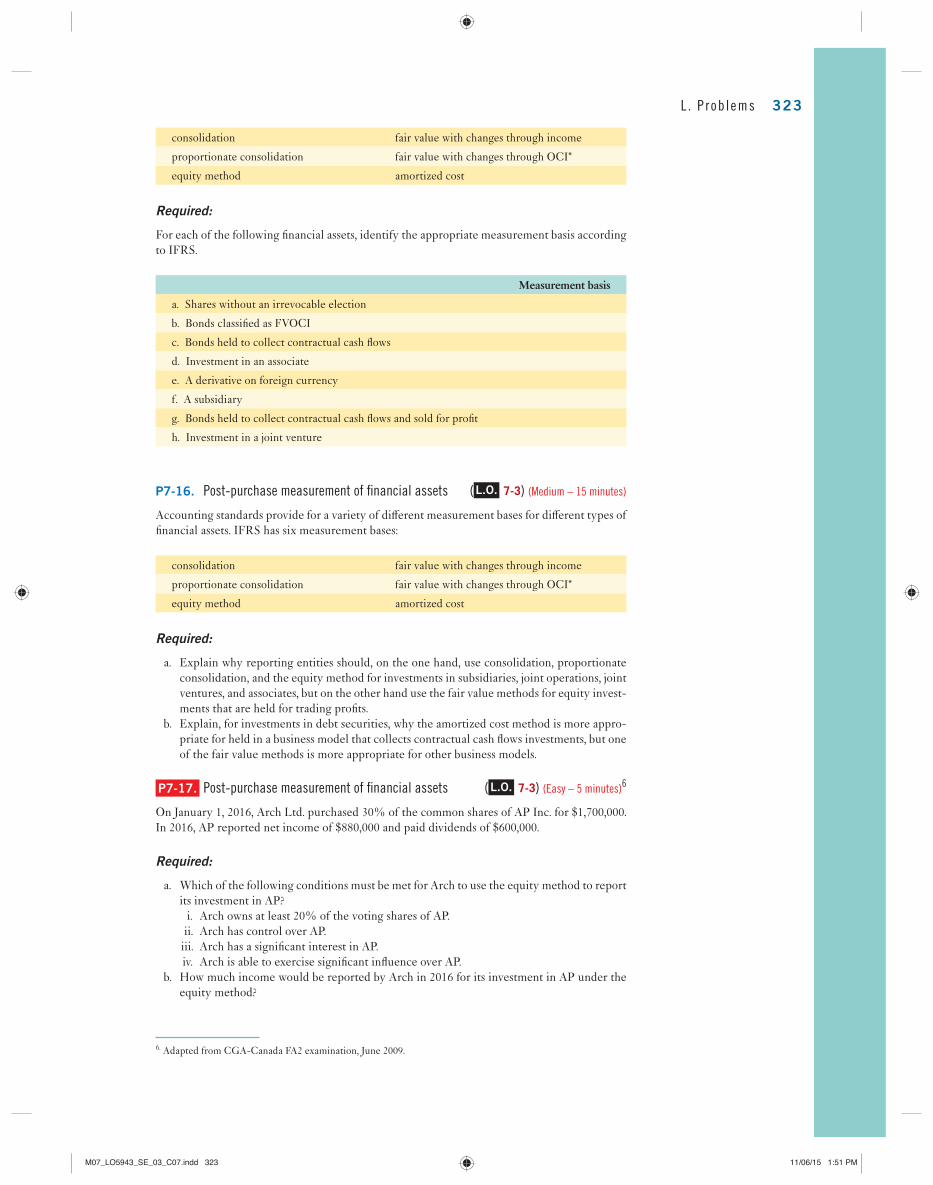
consolidation fair value with changes through income
proportionate consolidation fair value with changes through OCI*
equity method amortized cost
Required:
For each of the following fi nancial assets, identify the appropriate measurement basis according to IFRS.
Measurement basis
a. Shares without an irrevocable election
b. Bonds classifi ed as FVOCI
c. Bonds held to collect contractual cash fl ows
d. Investment in an associate
e. A derivative on foreign currency
f. A subsidiary
g. Bonds held to collect contractual cash fl ows and sold for profi t
h. Investment in a joint venture
P7-16. Post-purchase measurement of fi nancial assets ( L.O. 7-3 ) (Medium – 15 minutes)
Accounting standards provide for a variety of diff erent measurement bases for diff erent types of fi nancial assets. IFRS has six measurement bases:
consolidation fair value with changes through income
proportionate consolidation fair value with changes through OCI*
equity method amortized cost
Required:
a. Explain why reporting entities should, on the one hand, use consolidation, proportionate consolidation, and the equity method for investments in subsidiaries, joint operations, joint ventures, and associates, but on the other hand use the fair value methods for equity invest-ments that are held for trading profi ts.
b. Explain, for investments in debt securities, why the amortized cost method is more appro-priate for held in a business model that collects contractual cash fl ows investments, but one of the fair value methods is more appropriate for other business models.
P7-17. Post-purchase measurement of fi nancial assets ( L.O. 7-3 ) (Easy – 5 minutes) 6
On January 1, 2016, Arch Ltd. purchased 30% of the common shares of AP Inc. for $1,700,000. In 2016, AP reported net income of $880,000 and paid dividends of $600,000.
Required:
a. Which of the following conditions must be met for Arch to use the equity method to report its investment in AP? i. Arch owns at least 20% of the voting shares of AP. ii. Arch has control over AP. iii. Arch has a signifi cant interest in AP. iv. Arch is able to exercise signifi cant infl uence over AP.
b. How much income would be reported by Arch in 2016 for its investment in AP under the equity method?
6. Adapted from CGA-Canada FA2 examination, June 2009.
L . P rob lems 323
M07_LO5943_SE_03_C07.indd 323M07_LO5943_SE_03_C07.indd 323 11/06/15 1:51 PM11/06/15 1:51 PM
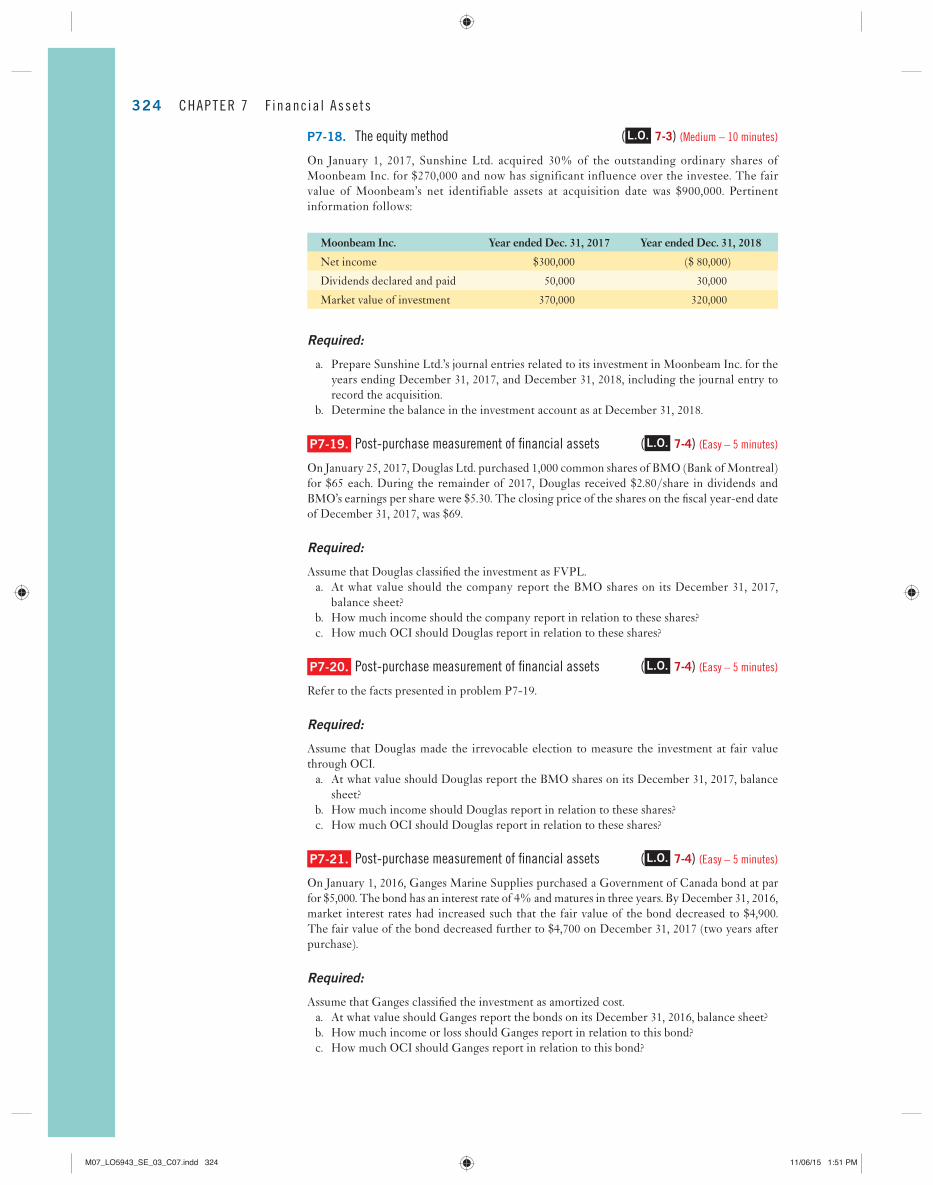
324 CHAPTER 7 F inanc ia l Asse ts
P7-18. The equity method ( L.O. 7-3 ) (Medium – 10 minutes)
On January 1, 2017, Sunshine Ltd. acquired 30% of the outstanding ordinary shares of Moonbeam Inc. for $270,000 and now has significant influence over the investee. The fair value of Moonbeam’s net identifiable assets at acquisition date was $900,000. Pertinent information follows:
Moonbeam Inc. Year ended Dec. 31, 2017 Year ended Dec. 31, 2018
Net income $300,000 ($ 80,000)
Dividends declared and paid 50,000 30,000
Market value of investment 370,000 320,000
Required:
a. Prepare Sunshine Ltd.’s journal entries related to its investment in Moonbeam Inc. for the years ending December 31, 2017, and December 31, 2018, including the journal entry to record the acquisition.
b. Determine the balance in the investment account as at December 31, 2018.
P7-19. Post-purchase measurement of fi nancial assets ( L.O. 7-4 ) (Easy – 5 minutes)
On January 25, 2017, Douglas Ltd. purchased 1,000 common shares of BMO (Bank of Montreal) for $65 each. During the remainder of 2017, Douglas received $2.80/share in dividends and BMO’s earnings per share were $5.30. The closing price of the shares on the fi scal year-end date of December 31, 2017, was $69.
Required:
Assume that Douglas classifi ed the investment as FVPL. a. At what value should the company report the BMO shares on its December 31, 2017,
balance sheet? b. How much income should the company report in relation to these shares? c. How much OCI should Douglas report in relation to these shares?
P7-20. Post-purchase measurement of fi nancial assets ( L.O. 7-4 ) (Easy – 5 minutes)
Refer to the facts presented in problem P7-19.
Required:
Assume that Douglas made the irrevocable election to measure the investment at fair value through OCI.
a. At what value should Douglas report the BMO shares on its December 31, 2017, balance sheet?
b. How much income should Douglas report in relation to these shares? c. How much OCI should Douglas report in relation to these shares?
P7-21. Post-purchase measurement of fi nancial assets ( L.O. 7-4 ) (Easy – 5 minutes)
On January 1, 2016, Ganges Marine Supplies purchased a Government of Canada bond at par for $5,000. The bond has an interest rate of 4% and matures in three years. By December 31, 2016, market interest rates had increased such that the fair value of the bond decreased to $4,900. The fair value of the bond decreased further to $4,700 on December 31, 2017 (two years after purchase).
Required:
Assume that Ganges classifi ed the investment as amortized cost. a. At what value should Ganges report the bonds on its December 31, 2016, balance sheet? b. How much income or loss should Ganges report in relation to this bond? c. How much OCI should Ganges report in relation to this bond?
M07_LO5943_SE_03_C07.indd 324M07_LO5943_SE_03_C07.indd 324 11/06/15 1:51 PM11/06/15 1:51 PM
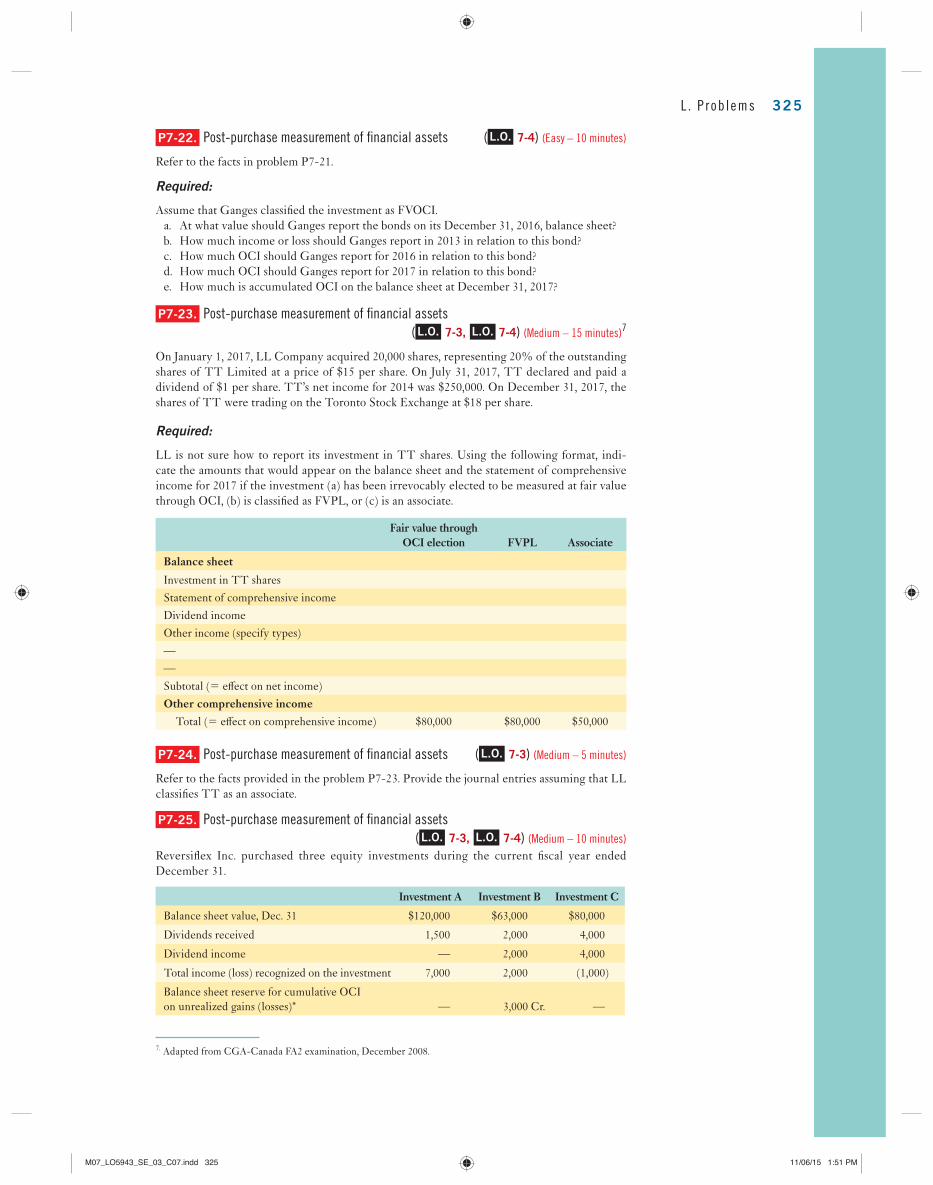
P7-22. Post-purchase measurement of fi nancial assets ( L.O. 7-4 ) (Easy – 10 minutes)
Refer to the facts in problem P7-21.
Required:
Assume that Ganges classifi ed the investment as FVOCI. a. At what value should Ganges report the bonds on its December 31, 2016, balance sheet? b. How much income or loss should Ganges report in 2013 in relation to this bond? c . How much OCI should Ganges report for 2016 in relation to this bond? d. How much OCI should Ganges report for 2017 in relation to this bond? e. How much is accumulated OCI on the balance sheet at December 31, 2017?
P7-23. Post-purchase measurement of fi nancial assets
( L.O. 7-3, L.O. 7-4 ) (Medium – 15 minutes) 7
On January 1, 2017, LL Company acquired 20,000 shares, representing 20% of the outstanding shares of TT Limited at a price of $15 per share. On July 31, 2017, TT declared and paid a dividend of $1 per share. TT’s net income for 2014 was $250,000. On December 31, 2017, the shares of TT were trading on the Toronto Stock Exchange at $18 per share.
Required:
LL is not sure how to report its investment in TT shares. Using the following format, indi-cate the amounts that would appear on the balance sheet and the statement of comprehensive income for 2017 if the investment (a) has been irrevocably elected to be measured at fair value through OCI, (b) is classifi ed as FVPL, or (c) is an associate.
Fair value through
OCI election FVPL Associate
Balance sheet
Investment in TT shares
Statement of comprehensive income
Dividend income
Other income (specify types)
—
—
Subtotal (5 eff ect on net income)
Other comprehensive income Total (5 eff ect on comprehensive income) $80,000 $80,000 $50,000
P7-24. Post-purchase measurement of fi nancial assets ( L.O. 7-3 ) (Medium – 5 minutes)
Refer to the facts provided in the problem P7-23. Provide the journal entries assuming that LL classifi es TT as an associate.
P7-25. Post-purchase measurement of fi nancial assets
( L.O. 7-3, L.O. 7-4 ) (Medium – 10 minutes)
Reversifl ex Inc. purchased three equity investments during the current fi scal year ended December 31.
Investment A Investment B Investment C
Balance sheet value, Dec. 31 $120,000 $63,000 $80,000
Dividends received 1,500 2,000 4,000
Dividend income — 2,000 4,000
Total income (loss) recognized on the investment 7,000 2,000 (1,000)
Balance sheet reserve for cumulative OCI on unrealized gains (losses)* — 3,000 Cr. —
7. Adapted from CGA-Canada FA2 examination, December 2008.
L . P rob lems 325
M07_LO5943_SE_03_C07.indd 325M07_LO5943_SE_03_C07.indd 325 11/06/15 1:51 PM11/06/15 1:51 PM
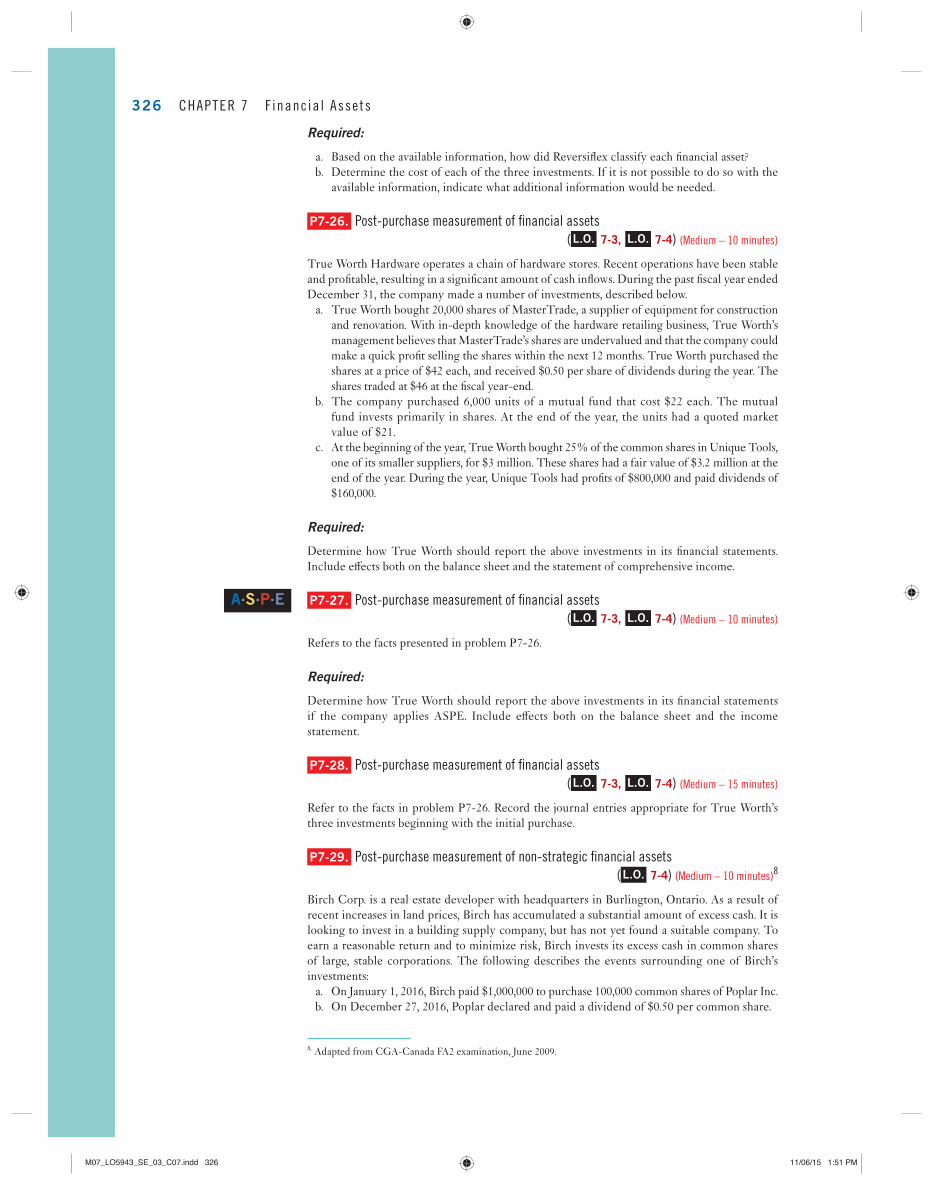
326 CHAPTER 7 F inanc ia l Asse ts
Required:
a. Based on the available information, how did Reversifl ex classify each fi nancial asset? b. Determine the cost of each of the three investments. If it is not possible to do so with the
available information, indicate what additional information would be needed.
P7-26. Post-purchase measurement of fi nancial assets
( L.O. 7-3, L.O. 7-4 ) (Medium – 10 minutes)
True Worth Hardware operates a chain of hardware stores. Recent operations have been stable and profi table, resulting in a signifi cant amount of cash infl ows. During the past fi scal year ended December 31, the company made a number of investments, described below.
a. True Worth bought 20,000 shares of MasterTrade, a supplier of equipment for construction and renovation. With in-depth knowledge of the hardware retailing business, True Worth’s management believes that MasterTrade’s shares are undervalued and that the company could make a quick profi t selling the shares within the next 12 months. True Worth purchased the shares at a price of $42 each, and received $0.50 per share of dividends during the year. The shares traded at $46 at the fi scal year-end.
b. The company purchased 6,000 units of a mutual fund that cost $22 each. The mutual fund invests primarily in shares. At the end of the year, the units had a quoted market value of $21.
c. At the beginning of the year, True Worth bought 25% of the common shares in Unique Tools, one of its smaller suppliers, for $3 million. These shares had a fair value of $3.2 million at the end of the year. During the year, Unique Tools had profi ts of $800,000 and paid dividends of $160,000.
Required:
Determine how True Worth should report the above investments in its fi nancial statements. Include eff ects both on the balance sheet and the statement of comprehensive income.
P7-27. Post-purchase measurement of fi nancial assets
( L.O. 7-3, L.O. 7-4 ) (Medium – 10 minutes)
Refers to the facts presented in problem P7-26.
Required:
Determine how True Worth should report the above investments in its fi nancial statements if the company applies ASPE. Include eff ects both on the balance sheet and the income statement.
P7-28. Post-purchase measurement of fi nancial assets
( L.O. 7-3, L.O. 7-4 ) (Medium – 15 minutes)
Refer to the facts in problem P7-26. Record the journal entries appropriate for True Worth’s three investments beginning with the initial purchase.
P7-29. Post-purchase measurement of non-strategic fi nancial assets
( L.O. 7-4 ) (Medium – 10 minutes) 8
Birch Corp. is a real estate developer with headquarters in Burlington, Ontario. As a result of recent increases in land prices, Birch has accumulated a substantial amount of excess cash. It is looking to invest in a building supply company, but has not yet found a suitable company. To earn a reasonable return and to minimize risk, Birch invests its excess cash in common shares of large, stable corporations. The following describes the events surrounding one of Birch’s investments:
a. On January 1, 2016, Birch paid $1,000,000 to purchase 100,000 common shares of Poplar Inc. b. On December 27, 2016, Poplar declared and paid a dividend of $0.50 per common share.
A.S.P.E
8. Adapted from CGA-Canada FA2 examination, June 2009.
M07_LO5943_SE_03_C07.indd 326M07_LO5943_SE_03_C07.indd 326 11/06/15 1:51 PM11/06/15 1:51 PM
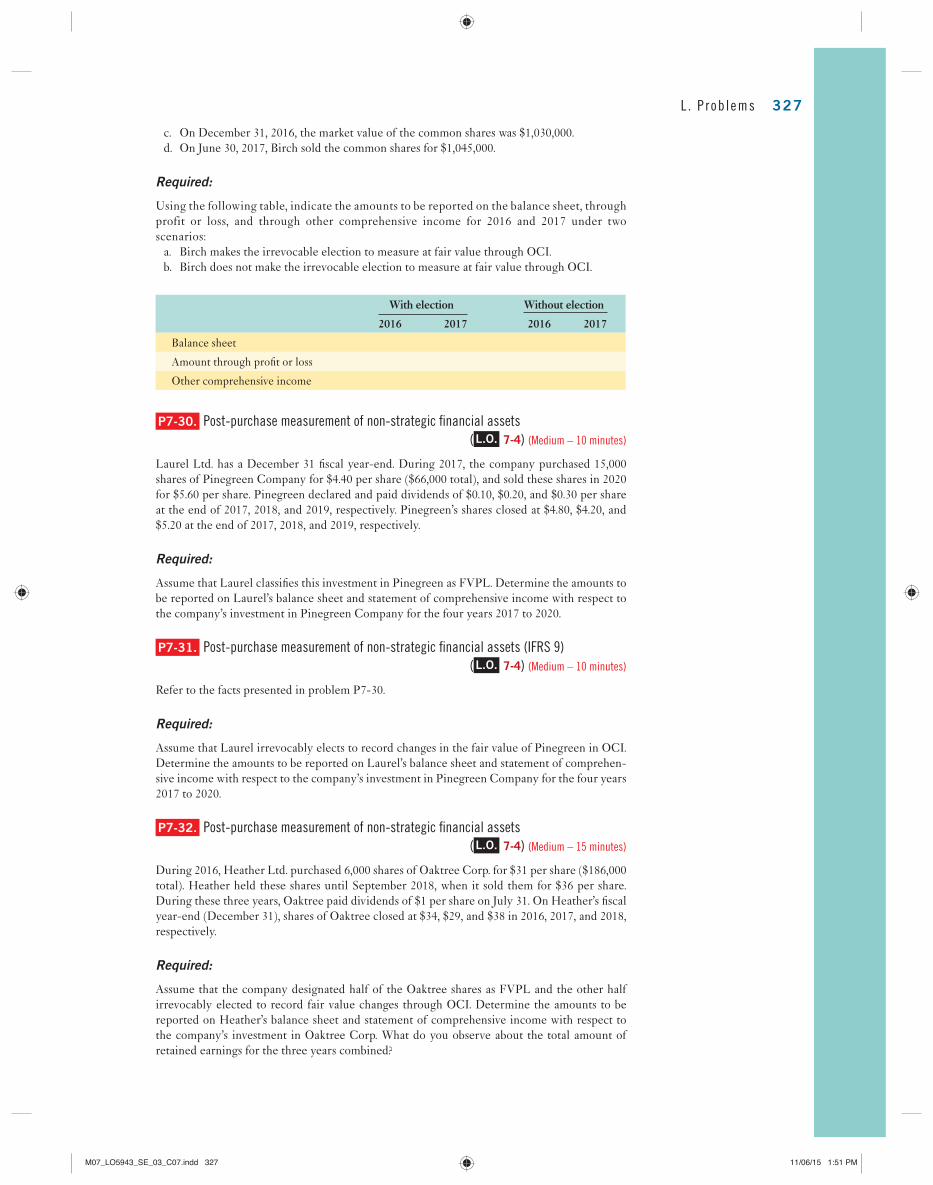
c. On December 31, 2016, the market value of the common shares was $1,030,000. d. On June 30, 2017, Birch sold the common shares for $1,045,000.
Required:
Using the following table, indicate the amounts to be reported on the balance sheet, through profit or loss, and through other comprehensive income for 2016 and 2017 under two scenarios:
a. Birch makes the irrevocable election to measure at fair value through OCI. b. Birch does not make the irrevocable election to measure at fair value through OCI.
With election Without election
2016 2017 2016 2017
Balance sheet
Amount through profi t or loss
Other comprehensive income
P7-30. Post-purchase measurement of non-strategic fi nancial assets
( L.O. 7-4 ) (Medium – 10 minutes)
Laurel Ltd. has a December 31 fi scal year-end. During 2017, the company purchased 15,000 shares of Pinegreen Company for $4.40 per share ($66,000 total), and sold these shares in 2020 for $5.60 per share. Pinegreen declared and paid dividends of $0.10, $0.20, and $0.30 per share at the end of 2017, 2018, and 2019, respectively. Pinegreen’s shares closed at $4.80, $4.20, and $5.20 at the end of 2017, 2018, and 2019, respectively.
Required:
Assume that Laurel classifi es this investment in Pinegreen as FVPL. Determine the amounts to be reported on Laurel’s balance sheet and statement of comprehensive income with respect to the company’s investment in Pinegreen Company for the four years 2017 to 2020.
P7-31. Post-purchase measurement of non-strategic fi nancial assets (IFRS 9)
( L.O. 7-4 ) (Medium – 10 minutes)
Refer to the facts presented in problem P7-30.
Required:
Assume that Laurel irrevocably elects to record changes in the fair value of Pinegreen in OCI. Determine the amounts to be reported on Laurel’s balance sheet and statement of comprehen-sive income with respect to the company’s investment in Pinegreen Company for the four years 2017 to 2020.
P7-32. Post-purchase measurement of non-strategic fi nancial assets
( L.O. 7-4 ) (Medium – 15 minutes)
During 2016, Heather Ltd. purchased 6,000 shares of Oaktree Corp. for $31 per share ($186,000 total). Heather held these shares until September 2018, when it sold them for $36 per share. During these three years, Oaktree paid dividends of $1 per share on July 31. On Heather’s fi scal year-end (December 31), shares of Oaktree closed at $34, $29, and $38 in 2016, 2017, and 2018, respectively.
Required:
Assume that the company designated half of the Oaktree shares as FVPL and the other half irrevocably elected to record fair value changes through OCI. Determine the amounts to be reported on Heather’s balance sheet and statement of comprehensive income with respect to the company’s investment in Oaktree Corp. What do you observe about the total amount of retained earnings for the three years combined?
L . P rob lems 327
M07_LO5943_SE_03_C07.indd 327M07_LO5943_SE_03_C07.indd 327 11/06/15 1:51 PM11/06/15 1:51 PM
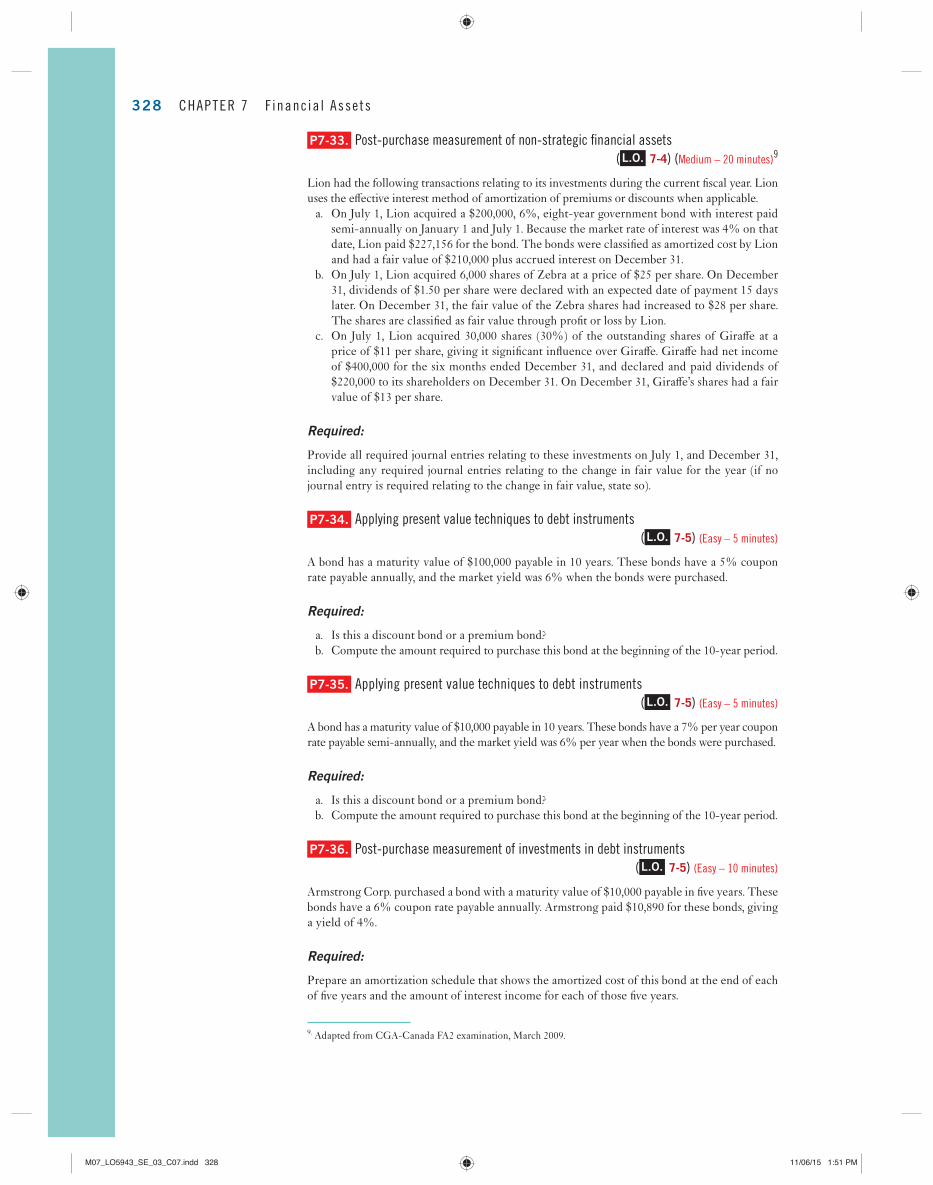
328 CHAPTER 7 F inanc ia l Asse ts
P7-33. Post-purchase measurement of non-strategic fi nancial assets
( L.O. 7-4 ) (Medium – 20 minutes) 9
Lion had the following transactions relating to its investments during the current fi scal year. Lion uses the eff ective interest method of amortization of premiums or discounts when applicable.
a. On July 1, Lion acquired a $200,000, 6%, eight-year government bond with interest paid semi-annually on January 1 and July 1. Because the market rate of interest was 4% on that date, Lion paid $227,156 for the bond. The bonds were classifi ed as amortized cost by Lion and had a fair value of $210,000 plus accrued interest on December 31.
b. On July 1, Lion acquired 6,000 shares of Zebra at a price of $25 per share. On December 31, dividends of $1.50 per share were declared with an expected date of payment 15 days later. On December 31, the fair value of the Zebra shares had increased to $28 per share. The shares are classifi ed as fair value through profi t or loss by Lion.
c. On July 1, Lion acquired 30,000 shares (30%) of the outstanding shares of Giraff e at a price of $11 per share, giving it signifi cant infl uence over Giraff e. Giraff e had net income of $400,000 for the six months ended December 31, and declared and paid dividends of $220,000 to its shareholders on December 31. On December 31, Giraff e’s shares had a fair value of $13 per share.
Required:
Provide all required journal entries relating to these investments on July 1, and December 31, including any required journal entries relating to the change in fair value for the year (if no journal entry is required relating to the change in fair value, state so).
P7-34. Applying present value techniques to debt instruments
( L.O. 7-5 ) (Easy – 5 minutes)
A bond has a maturity value of $100,000 payable in 10 years. These bonds have a 5% coupon rate payable annually, and the market yield was 6% when the bonds were purchased.
Required:
a. Is this a discount bond or a premium bond? b. Compute the amount required to purchase this bond at the beginning of the 10-year period.
P7-35. Applying present value techniques to debt instruments
( L.O. 7-5 ) (Easy – 5 minutes)
A bond has a maturity value of $10,000 payable in 10 years. These bonds have a 7% per year coupon rate payable semi-annually, and the market yield was 6% per year when the bonds were purchased.
Required:
a. Is this a discount bond or a premium bond? b. Compute the amount required to purchase this bond at the beginning of the 10-year period.
P7-36. Post-purchase measurement of investments in debt instruments
( L.O. 7-5 ) (Easy – 10 minutes)
Armstrong Corp. purchased a bond with a maturity value of $10,000 payable in fi ve years. These bonds have a 6% coupon rate payable annually. Armstrong paid $10,890 for these bonds, giving a yield of 4%.
Required:
Prepare an amortization schedule that shows the amortized cost of this bond at the end of each of fi ve years and the amount of interest income for each of those fi ve years.
9. Adapted from CGA-Canada FA2 examination, March 2009.
M07_LO5943_SE_03_C07.indd 328M07_LO5943_SE_03_C07.indd 328 11/06/15 1:51 PM11/06/15 1:51 PM

P7-37. Post-purchase measurement of investments in debt instruments
( L.O. 7-5 ) (Easy – 10 minutes)
Refer to the facts in problem P7-36.
Required:
Using the straight-line alternative permitted under ASPE, prepare an amortization schedule that shows the amortized cost of this bond at the end of each of fi ve years and the amount of interest income for each of those fi ve years.
P7-38. Post-purchase measurement of investments in debt instruments
( L.O. 7-5 ) (Easy – 10 minutes)
On January 1, 2013, Bamfi eld Company purchased bonds with a maturity value of $10,000 for $9,147. These bonds have a 4% per year coupon rate payable semi-annually on June 30 and December 31. The bond matures on December 31, 2017. On January 1, 2013, the market yield for bonds of equivalent risk and maturity was 6% per year.
Required:
Prepare an amortization schedule that shows the amortized cost of this bond at the end of each of fi ve years and the amount of interest income for each of those fi ve years.
P7-39. Post-purchase measurement of investments in debt instruments
( L.O. 7-5 ) (Easy – 10 minutes)
Refer to the facts in problem P7-38.
Required:
Using the straight-line alternative permitted under ASPE, prepare an amortization schedule that shows the amortized cost of this bond at the end of each of fi ve years and the amount of interest income for each of those fi ve years.
P7-40. Determining the effective interest rate
( L.O. 7-3, L.O. 7-4, L.O. 7-5 ) (Medium – 15 minutes)
On January 1, 2018, Dudas Inc. paid $917,783 plus a $5,000 transaction fee to acquire $1,000,000 in bonds that mature in 10 years. The bonds pay interest annually at 4.0% per annum on December 31. Dudas Inc. classifi es its investment as a fi nancial asset at amortized cost, which is in keeping with the objective of its business model and the contractual cash fl ow characteristics of the investment.
Dudas Inc. has a December 31 year-end. It does not accrue interest income during the year.
Required:
a. Determine the eff ective interest rate that Dudas is earning on its investment. Use a fi nancial calculator or spreadsheet.
b. Prepare the journal entry to record the acquisition of the investment. c. Prepare the journal entry to record the receipt of interest on December 31, 2018. d. Prepare the journal entry to record the receipt of interest on December 31, 2019.
P7-41. Post-purchase measurement of investments in debt instruments
( L.O. 7-4, L.O. 7-5 ) (Medium – 20 minutes)
The Argyle Company acquired a $10 million face value bond that has an 8% coupon rate (pays interest annually on December 31) on January 1, 2017. The bond matures on December 31, 2022. On January 1, 2017, the market yield for bonds of equivalent risk and maturity was 6%.
A.S.P.E
A.S.P.E
L . P rob lems 329
M07_LO5943_SE_03_C07.indd 329M07_LO5943_SE_03_C07.indd 329 11/06/15 1:51 PM11/06/15 1:51 PM
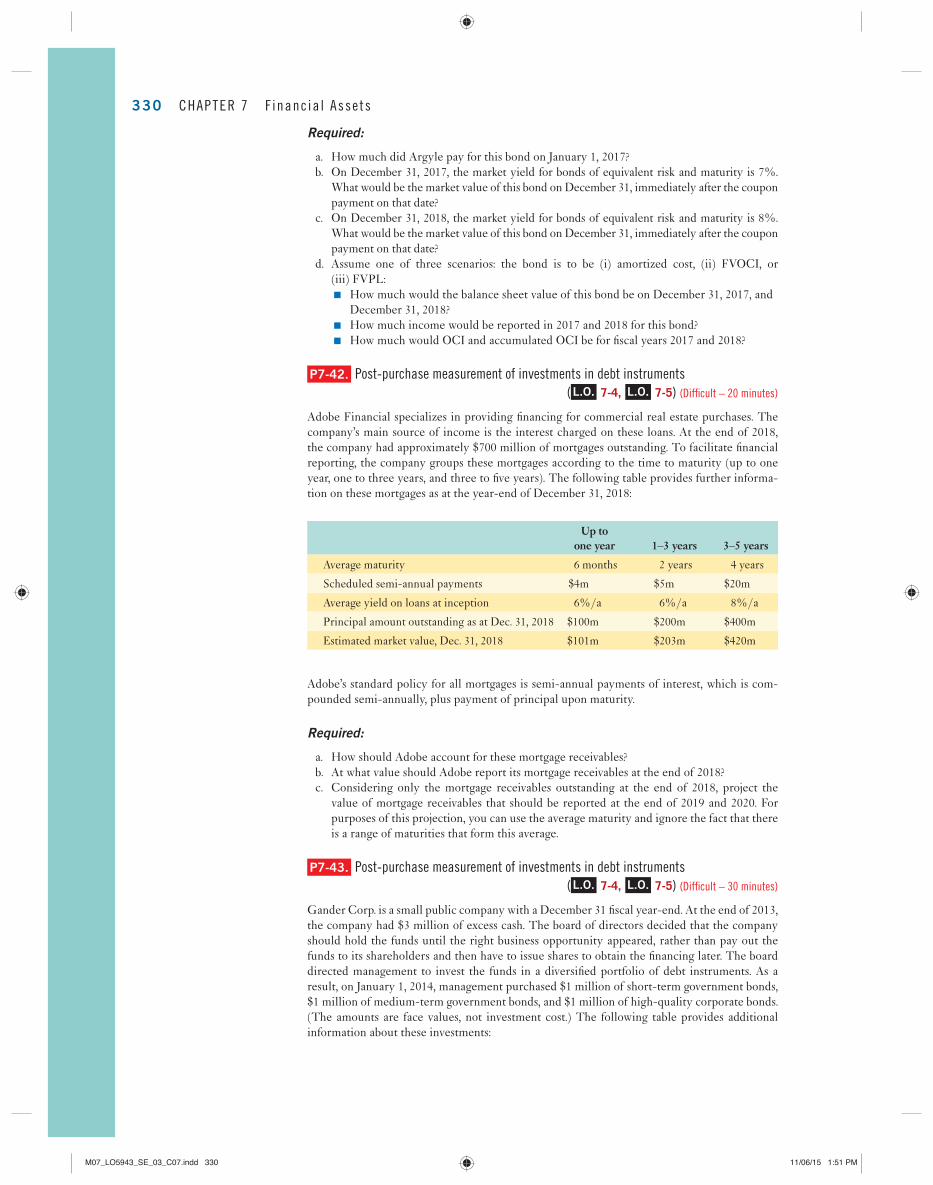
330 CHAPTER 7 F inanc ia l Asse ts
Required:
a. How much did Argyle pay for this bond on January 1, 2017? b. On December 31, 2017, the market yield for bonds of equivalent risk and maturity is 7%.
What would be the market value of this bond on December 31, immediately after the coupon payment on that date?
c. On December 31, 2018, the market yield for bonds of equivalent risk and maturity is 8%. What would be the market value of this bond on December 31, immediately after the coupon payment on that date?
d. Assume one of three scenarios: the bond is to be (i) amortized cost, (ii) FVOCI, or (iii) FVPL: ■ How much would the balance sheet value of this bond be on December 31, 2017, and
December 31, 2018? ■ How much income would be reported in 2017 and 2018 for this bond? ■ How much would OCI and accumulated OCI be for fi scal years 2017 and 2018?
P7-42. Post-purchase measurement of investments in debt instruments
( L.O. 7-4, L.O. 7-5 ) (Diffi cult – 20 minutes)
Adobe Financial specializes in providing fi nancing for commercial real estate purchases. The company’s main source of income is the interest charged on these loans. At the end of 2018, the company had approximately $700 million of mortgages outstanding. To facilitate fi nancial reporting, the company groups these mortgages according to the time to maturity (up to one year, one to three years, and three to fi ve years). The following table provides further informa-tion on these mortgages as at the year-end of December 31, 2018:
Up to
one year 1–3 years 3–5 years
Average maturity 6 months 2 years 4 years
Scheduled semi-annual payments $4m $5m $20m
Average yield on loans at inception 6%/a 6%/a 8%/a
Principal amount outstanding as at Dec. 31, 2018 $100m $200m $400m
Estimated market value, Dec. 31, 2018 $101m $203m $420m
Adobe’s standard policy for all mortgages is semi-annual payments of interest, which is com-pounded semi-annually, plus payment of principal upon maturity.
Required:
a. How should Adobe account for these mortgage receivables? b. At what value should Adobe report its mortgage receivables at the end of 2018? c. Considering only the mortgage receivables outstanding at the end of 2018, project the
value of mortgage receivables that should be reported at the end of 2019 and 2020. For purposes of this projection, you can use the average maturity and ignore the fact that there is a range of maturities that form this average.
P7-43. Post-purchase measurement of investments in debt instruments
( L.O. 7-4, L.O. 7-5 ) (Diffi cult – 30 minutes)
Gander Corp. is a small public company with a December 31 fi scal year-end. At the end of 2013, the company had $3 million of excess cash. The board of directors decided that the company should hold the funds until the right business opportunity appeared, rather than pay out the funds to its shareholders and then have to issue shares to obtain the fi nancing later. The board directed management to invest the funds in a diversifi ed portfolio of debt instruments. As a result, on January 1, 2014, management purchased $1 million of short-term government bonds, $1 million of medium-term government bonds, and $1 million of high-quality corporate bonds. (The amounts are face values, not investment cost.) The following table provides additional information about these investments:
M07_LO5943_SE_03_C07.indd 330M07_LO5943_SE_03_C07.indd 330 11/06/15 1:51 PM11/06/15 1:51 PM
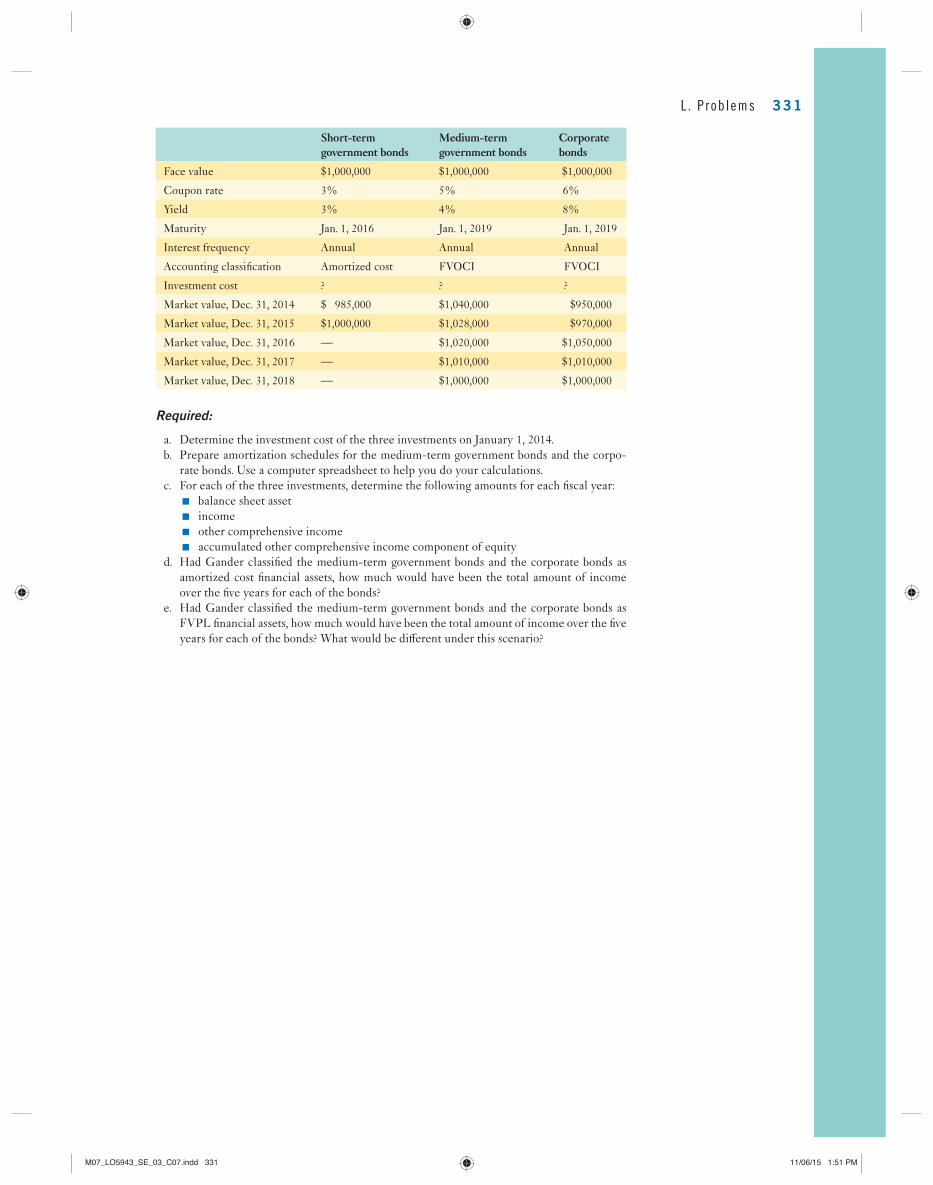
Short-term government bonds
Medium-term government bonds
Corporate bonds
Face value $1,000,000 $1,000,000 $1,000,000
Coupon rate 3% 5% 6%
Yield 3% 4% 8%
Maturity Jan. 1, 2016 Jan. 1, 2019 Jan. 1, 2019
Interest frequency Annual Annual Annual
Accounting classifi cation Amortized cost FVOCI FVOCI
Investment cost ? ? ?
Market value, Dec. 31, 2014 $ 985,000 $1,040,000 $950,000
Market value, Dec. 31, 2015 $1,000,000 $1,028,000 $970,000
Market value, Dec. 31, 2016 — $1,020,000 $1,050,000
Market value, Dec. 31, 2017 — $1,010,000 $1,010,000
Market value, Dec. 31, 2018 — $1,000,000 $1,000,000
Required:
a. Determine the investment cost of the three investments on January 1, 2014. b. Prepare amortization schedules for the medium-term government bonds and the corpo-
rate bonds. Use a computer spreadsheet to help you do your calculations. c. For each of the three investments, determine the following amounts for each fi scal year:
■ balance sheet asset ■ income ■ other comprehensive income ■ accumulated other comprehensive income component of equity
d. Had Gander classifi ed the medium-term government bonds and the corporate bonds as amortized cost fi nancial assets, how much would have been the total amount of income over the fi ve years for each of the bonds?
e. Had Gander classifi ed the medium-term government bonds and the corporate bonds as FVPL fi nancial assets, how much would have been the total amount of income over the fi ve years for each of the bonds? What would be diff erent under this scenario?
L . P rob lems 331
M07_LO5943_SE_03_C07.indd 331M07_LO5943_SE_03_C07.indd 331 11/06/15 1:51 PM11/06/15 1:51 PM
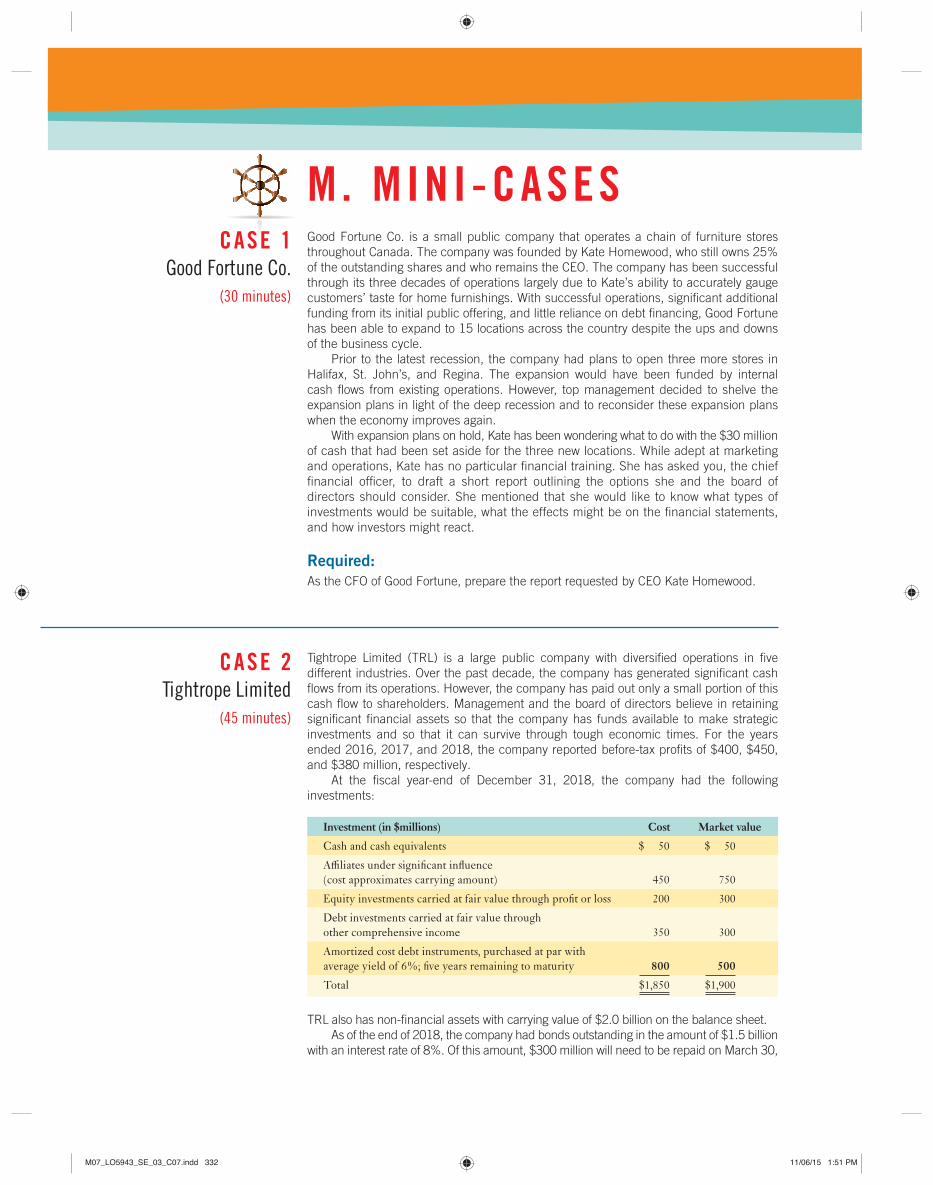
M . MINI-CASES CASE 1
Good Fortune Co.
(30 minutes)
Good Fortune Co. is a small public company that operates a chain of furniture stores throughout Canada. The company was founded by Kate Homewood, who still owns 25% of the outstanding shares and who remains the CEO. The company has been successful through its three decades of operations largely due to Kate’s ability to accurately gauge customers’ taste for home furnishings. With successful operations, signifi cant additional funding from its initial public offering, and little reliance on debt fi nancing, Good Fortune has been able to expand to 15 locations across the country despite the ups and downs of the business cycle.
Prior to the latest recession, the company had plans to open three more stores in Halifax, St. John’s, and Regina. The expansion would have been funded by internal cash fl ows from existing operations. However, top management decided to shelve the expansion plans in light of the deep recession and to reconsider these expansion plans when the economy improves again.
With expansion plans on hold, Kate has been wondering what to do with the $30 million of cash that had been set aside for the three new locations. While adept at marketing and operations, Kate has no particular fi nancial training. She has asked you, the chief fi nancial offi cer, to draft a short report outlining the options she and the board of directors should consider. She mentioned that she would like to know what types of investments would be suitable, what the effects might be on the fi nancial statements, and how investors might react.
Required: As the CFO of Good Fortune, prepare the report requested by CEO Kate Homewood.
CASE 2Tightrope Limited
(45 minutes)
Tightrope Limited (TRL) is a large public company with diversifi ed operations in fi ve different industries. Over the past decade, the company has generated signifi cant cash fl ows from its operations. However, the company has paid out only a small portion of this cash fl ow to shareholders. Management and the board of directors believe in retaining signifi cant fi nancial assets so that the company has funds available to make strategic investments and so that it can survive through tough economic times. For the years ended 2016, 2017, and 2018, the company reported before-tax profi ts of $400, $450, and $380 million, respectively.
At the fi scal year-end of December 31, 2018, the company had the following investments:
Investment (in $millions) Cost Market value
Cash and cash equivalents $ 50 $ 50
Affi liates under signifi cant infl uence (cost approximates carrying amount) 450 750
Equity investments carried at fair value through profi t or loss 200 300
Debt investments carried at fair value through other comprehensive income 350 300
Amortized cost debt instruments, purchased at par with average yield of 6%; fi ve years remaining to maturity 800 500
Total $1,850 $1,900
TRL also has non-fi nancial assets with carrying value of $2.0 billion on the balance sheet. As of the end of 2018, the company had bonds outstanding in the amount of $1.5 billion
with an interest rate of 8%. Of this amount, $300 million will need to be repaid on March 30,
M07_LO5943_SE_03_C07.indd 332M07_LO5943_SE_03_C07.indd 332 11/06/15 1:51 PM11/06/15 1:51 PM
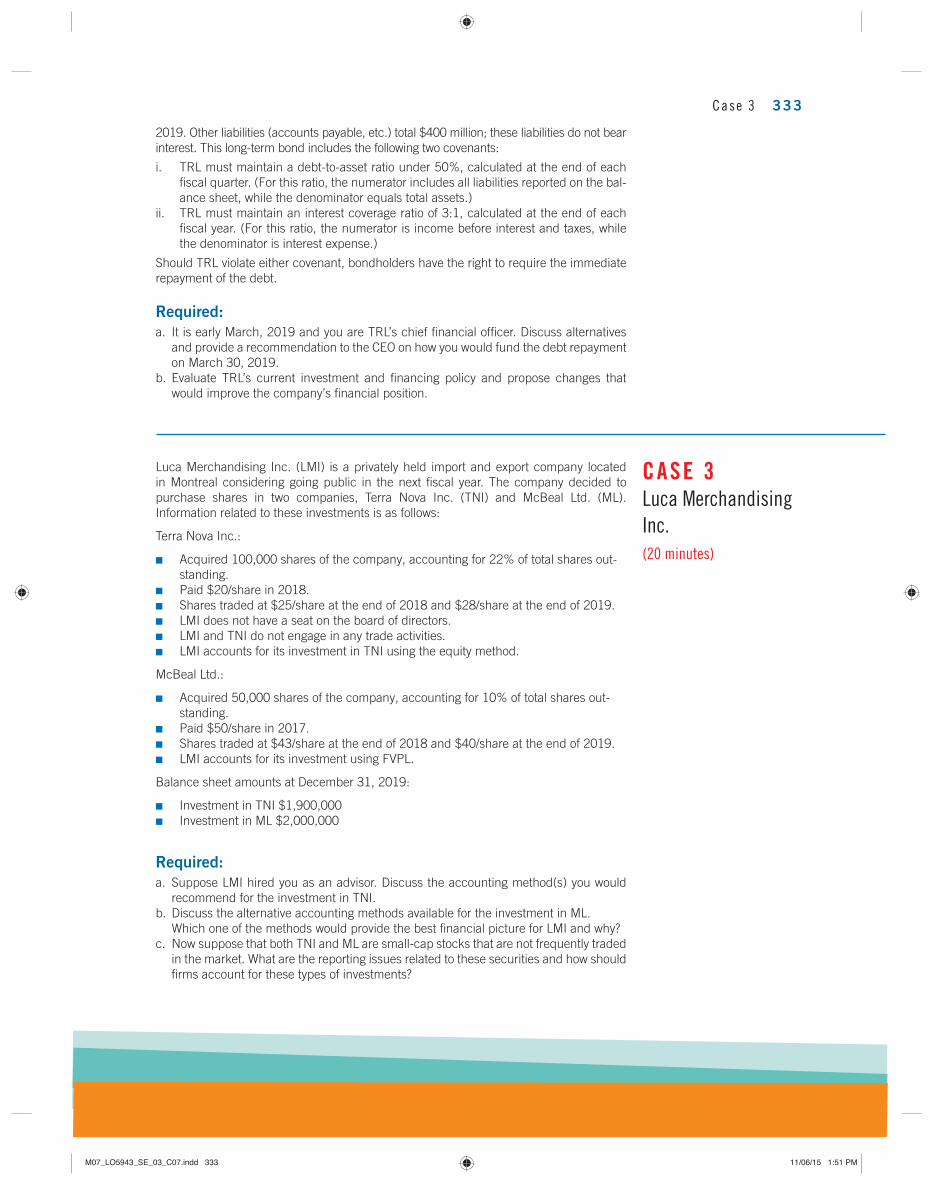
2019. Other liabilities (accounts payable, etc.) total $400 million; these liabilities do not bear interest. This long-term bond includes the following two covenants:
i. TRL must maintain a debt-to-asset ratio under 50%, calculated at the end of each fi scal quarter. (For this ratio, the numerator includes all liabilities reported on the bal-ance sheet, while the denominator equals total assets.)
ii. TRL must maintain an interest coverage ratio of 3:1, calculated at the end of each fi scal year. (For this ratio, the numerator is income before interest and taxes, while the denominator is interest expense.)
Should TRL violate either covenant, bondholders have the right to require the immediate repayment of the debt.
Required: a. It is early March, 2019 and you are TRL’s chief fi nancial offi cer. Discuss alternatives
and provide a recommendation to the CEO on how you would fund the debt repayment on March 30, 2019.
b. Evaluate TRL’s current investment and fi nancing policy and propose changes that would improve the company’s fi nancial position.
CASE 3Luca Merchandising
Inc.
(20 minutes)
Luca Merchandising Inc. (LMI) is a privately held import and export company located in Montreal considering going public in the next fi scal year. The company decided to purchase shares in two companies, Terra Nova Inc. (TNI) and McBeal Ltd. (ML). Information related to these investments is as follows:
Terra Nova Inc.:
■ Acquired 100,000 shares of the company, accounting for 22% of total shares out-standing.
■ Paid $20/share in 2018. ■ Shares traded at $25/share at the end of 2018 and $28/share at the end of 2019. ■ LMI does not have a seat on the board of directors. ■ LMI and TNI do not engage in any trade activities. ■ LMI accounts for its investment in TNI using the equity method.
McBeal Ltd.:
■ Acquired 50,000 shares of the company, accounting for 10% of total shares out-standing.
■ Paid $50/share in 2017. ■ Shares traded at $43/share at the end of 2018 and $40/share at the end of 2019. ■ LMI accounts for its investment using FVPL.
Balance sheet amounts at December 31, 2019:
■ Investment in TNI $1,900,000 ■ Investment in ML $2,000,000
Required: a. Suppose LMI hired you as an advisor. Discuss the accounting method(s) you would
recommend for the investment in TNI. b. Discuss the alternative accounting methods available for the investment in ML.
Which one of the methods would provide the best fi nancial picture for LMI and why? c. Now suppose that both TNI and ML are small-cap stocks that are not frequently traded
in the market. What are the reporting issues related to these securities and how should fi rms account for these types of investments?
Case 3 333
M07_LO5943_SE_03_C07.indd 333M07_LO5943_SE_03_C07.indd 333 11/06/15 1:51 PM11/06/15 1:51 PM


![Securitisation of Financial Assets[1]](https://img.pdfslide.net/doc/110x75/54678fbfaf79597e338b5588/securitisation-of-financial-assets1.jpg)