Embed Size (px)
Citation preview

may 31, 2015 & 2014FINANCIAL & AUDIT REPORT

CONTENTS
FINANCIAL OVERVIEW 2014 - 2015 ........................................................................................................ 2
MANAGEMENT STATEMENT OF RESPONSIBILITY ............................................................................ 3
REPORT OF INDEPENDENT CERTIFIED PUBLIC ACCOUNTANTS ................................................... 4
CONSOLIDATED FINANCIAL STATEMENTS
Consolidated Statements of Financial Position .................................................................................. 7
Consolidated Statements of Activities ............................................................................................... 8
Consolidated Statements of Cash Flows .......................................................................................... 10
Notes to Consolidated Financial Statements .................................................................................... 11
INDEPENDENT CERTIFIED PUBLIC ACCOUNTANT’S REPORT ON ADDITIONAL INFORMATION ................................................................................................................. 38
OTHER FINANCIAL INFORMATION (not subjected to auditing procedures)
Tuition and Fees, Room and Board 2006-2015 ............................................................................... 40
Student Enrollment 2005-2014 ........................................................................................................ 41
Student Selectivity 2006-2015 ......................................................................................................... 42
Endowment Market Value 2006-2015 ............................................................................................. 43
Net Assets and Liabilities 2006-2015 .............................................................................................. 44

ELON UNIVERSITY FINANCIAL OVERVIEW 2014 – 2015
2
We are pleased to present to you the continued strong financial results of another productive year at Elon University. The institution’s financial strength is indicative of accomplishments in all of its programs. Some of these are detailed below. http://www.elon.edu/e-web/bft/business/annual_report_2015/. Elon’s hallmark is the strong, mentoring relationships students develop with faculty and staff, and the result is a university with a growing national reputation for excellence. Elon graduates become the ambitious contributors, creative problem-solvers and ethical leaders the world needs. Again this year, Elon was among the nation’s top producers of Fulbright Student Scholars, and the university received recognition for the quality of its Peace Corps Prep Program. Academic programs continued to reach higher levels of quality this year, with the School of Education receiving honors from the National Council on Teacher Quality, the Martha and Spencer Love School of Business earning recognition from Princeton Review as the nation’s #1 best-administered business school, and the university as a whole being named one of four “Rising Stars” by Forbes magazine. Again this year, Elon was recognized as the nation’s leading master’s-level university in study abroad by the Institute of International Education, an affirmation of the university’s strong emphasis on creating global citizens who can navigate complex cultural issues and bring about positive change. Elon’s high-impact academic programs that “Focus on Student Success” were recognized for excellence by U.S. News & World Report, including study abroad, internships, service learning, undergraduate research, learning communities, first-year experiences and senior capstone experiences. U.S. News ranks Elon the #1 Southern master’s-level university, Kiplinger’s Personal Finance magazine and the Fiske Guide to Colleges rank Elon among the best values in private higher education, and Elon’s undergraduate business program earned a top-50 national ranking in Bloomberg Businessweek’s 2014 survey. Elon places a high priority on civic engagement, and for the eighth consecutive year, Elon was recognized by the President’s Community Service Honor Roll as a national leader in service-learning. The university also received accolades for its environmental initiatives from U.S. News and the Sierra Club, and for the sixth consecutive year, Elon was named one of the most “environmentally responsible green colleges” in the nation by Princeton Review. Elon continues to invest in its academic programs and facilities. This year, Elon graduated the first class of its physician assistant studies program in the School of Health Sciences; the class achieved a 100% pass rate on board examinations and a 100% employment rate. The Global Neighborhood opened in August 2014, comprising 252,500 square feet with five residential facilities and the Global Commons building, an important component of the university’s residential campus initiative that aims to fully integrate residential and learning experiences. The Global Commons includes the Isabella Cannon Global Education Center and faculty offices for the Core Curriculum; the Great Hall, a spacious community and study space overlooking Lake Mary Nell; and a computer lab, media room and the Argo Tea cafe. January 2015 marked the opening of the Inman Admissions Welcome Center, which serves as the university’s new front door for prospective students and their families. This two-story, 32,000-square-foot building consolidates all campus visit, admissions and financial planning staff into one central location. Scott Studios, a 14,000-square-foot building with a 160-seat studio theater, a 3,200-square-foot dance and rehearsal studio, six music practice rooms, a workshop and dressing room also opened in the 2014-15 academic year. Increasing enrollment in Elon’s undergraduate and graduate programs provides a solid financial base for the institution. All major financial indicators moved in a favorable direction this past year, which is detailed in the following pages. Some highlights include an increase in assets and net assets (assets minus liabilities) of 7.3% and 12.9%, respectively, as well as a 7.0% growth in net tuition revenue (tuition minus financial aid). The university endowment continued its recent growth and ended the year with a market value of $215 million on May 31, 2015, the highest in Elon’s history. This strong financial foundation, combined with the significant program achievements noted on the website, places Elon in an excellent position to meet the aspirations of its strategic plan, the Elon Commitment. Leo M. Lambert President Gerald Whittington Senior Vice President for Business, Finance and Technology

ELON UNIVERSITY MANAGEMENT STATEMENT OF RESPONSIBILITY
3
The management of Elon University has prepared the accompanying consolidated financial statements in accordance with generally accepted accounting principles and is responsible for their integrity, objectivity and fair presentation.
The management of Elon University maintains a system of internal control designed to provide reasonable assurance, on a cost effective basis, that assets are safeguarded, transactions are executed in accordance with management’s authorization and financial records are reliable for preparing financial statements. This system of control provides reasonable assurance that errors or irregularities that could be material to the consolidated financial statements are prevented or detected within a timely period. Key elements in the system include the communication of policies and procedures, selection and training of qualified personnel, and organizational arrangements that provide an appropriated division of responsibility. Management believes that, as of May 31, 2015 and 2014, Elon University’s system of internal control was adequate to accomplish the objectives discussed herein.
Elon University’s Board of Trustees addresses its oversight responsibility for the consolidated financial statements through its Audit Committee, which is composed of Trustees who are independent of Elon University management. The Audit Committee meets at least three times annually with the university management and independent auditor to review matters relating to financial reporting, auditing and internal control. To ensure auditor independence, the independent auditor has full and free access to the Audit Committee during the meetings both with management present and in executive session without management present.
The independent accounting firm is engaged to audit, in accordance with auditing standards generally accepted in the United States of America, the financial statements of Elon University. The auditor was given unrestricted access to all financial records and related data including minutes of all meetings of the Board of Trustees and its committees. All representations made to the independent auditor by university management during the audit were true and accurate and to the best of their knowledge and belief.
Leo M. Lambert President
Gerald Whittington Senior Vice President for Business, Finance and Technology
Grant Thornton LLP 201 S College Street, Suite 2500 Charlotte, NC 28244-0100
T 704.632.3500 F 704.334.7701 www.GrantThornton.com
Grant Thornton LLP U.S. member firm of Grant Thornton International Ltd
4
To the Board of Trustees of Elon University:
We have audited the accompanying consolidated financial statements of Elon University (the “University”) (a nonprofit North Carolina corporation), which comprise the consolidated balance sheets as of May 31, 2015 and 2014, and the related consolidated statements of activities, and cash flows for the years then ended, and the related notes to the financial statements.
Management’s responsibility for the financial statements Management is responsible for the preparation and fair presentation of these consolidated financial statements in accordance with accounting principles generally accepted in the United States of America; this includes the design, implementation, and maintenance of internal control relevant to the preparation and fair presentation of consolidated financial statements that are free from material misstatement, whether due to fraud or error.
Auditor’s responsibility Our responsibility is to express an opinion on these consolidated financial statements based on our audits. We conducted our audits in accordance with auditing standards generally accepted in the United States of America. Those standards require that we plan and perform the audit to obtain reasonable assurance about whether the consolidated financial statements are free from material misstatement.
An audit involves performing procedures to obtain audit evidence about the amounts and disclosures in the consolidated financial statements. The procedures selected depend on the auditor’s judgment, including the assessment of the risks of material misstatement of the consolidated financial statements, whether due to fraud or error. In making those risk assessments, the auditor considers internal control relevant to the entity’s preparation and fair presentation of the consolidated financial statements in order to design audit procedures that are appropriate in the circumstances, but not for the purpose of expressing an opinion on the effectiveness of the entity’s internal control. Accordingly, we express no such opinion. An audit also includes evaluating the appropriateness of accounting policies used and the reasonableness of significant accounting estimates made by management, as well as evaluating the overall presentation of the consolidated financial statements.
REPORT OF INDEPENDENT CERTIFIED PUBLIC ACCOUNTANTS

Grant Thornton LLP U.S. member firm of Grant Thornton International Ltd
5
We believe that the audit evidence we have obtained is sufficient and appropriate to provide a basis for our audit opinion.
Opinion In our opinion, the consolidated financial statements referred to above present fairly, in all material respects, the financial position of the University as of May 31, 2015 and 2014, and the results of its operations and its cash flows for the years then ended in accordance with accounting principles generally accepted in the United States of America.
Charlotte, North Carolina September 18, 2015

6
THIS PAGE INTENTIONALLY LEFT BLANK
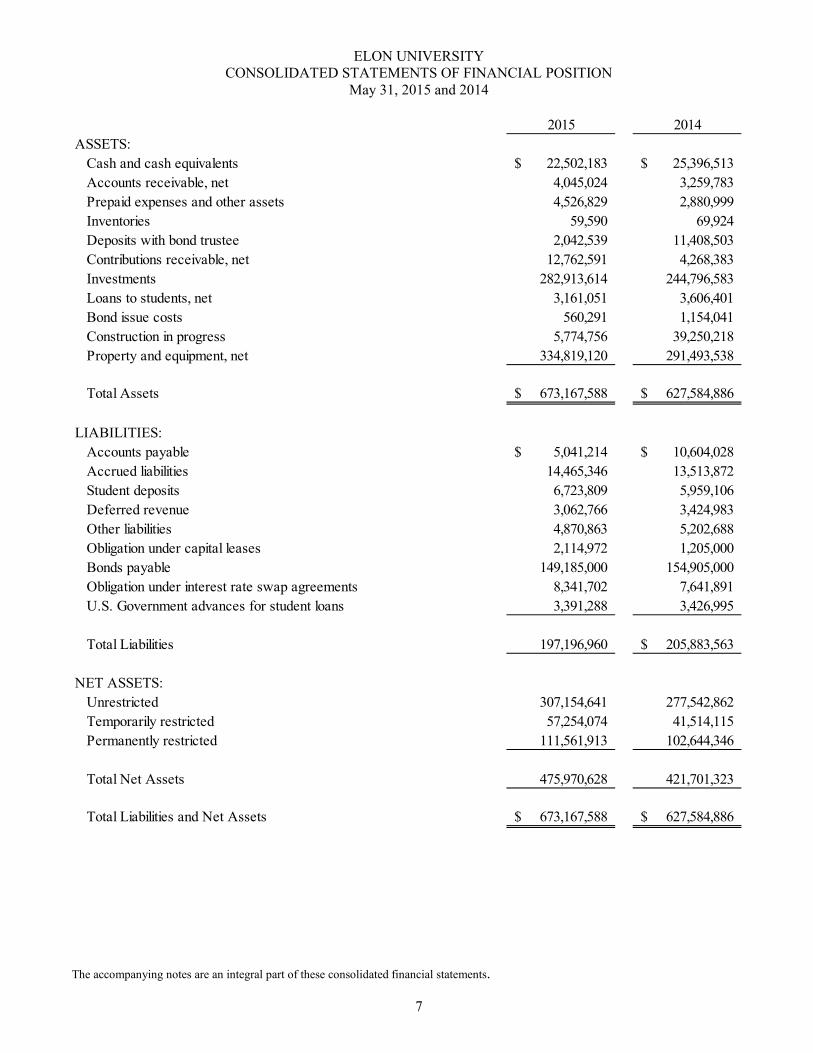
ELON UNIVERSITY CONSOLIDATED STATEMENTS OF FINANCIAL POSITION
May 31, 2015 and 2014
7
2015 2014ASSETS:
Cash and cash equivalents 22,502,183$ 25,396,513$ Accounts receivable, net 4,045,024 3,259,783 Prepaid expenses and other assets 4,526,829 2,880,999 Inventories 59,590 69,924 Deposits with bond trustee 2,042,539 11,408,503 Contributions receivable, net 12,762,591 4,268,383 Investments 282,913,614 244,796,583 Loans to students, net 3,161,051 3,606,401 Bond issue costs 560,291 1,154,041 Construction in progress 5,774,756 39,250,218 Property and equipment, net 334,819,120 291,493,538
Total Assets 673,167,588$ 627,584,886$
LIABILITIES:Accounts payable 5,041,214$ 10,604,028$ Accrued liabilities 14,465,346 13,513,872 Student deposits 6,723,809 5,959,106 Deferred revenue 3,062,766 3,424,983 Other liabilities 4,870,863 5,202,688 Obligation under capital leases 2,114,972 1,205,000 Bonds payable 149,185,000 154,905,000 Obligation under interest rate swap agreements 8,341,702 7,641,891 U.S. Government advances for student loans 3,391,288 3,426,995
Total Liabilities 197,196,960 205,883,563$
NET ASSETS:Unrestricted 307,154,641 277,542,862 Temporarily restricted 57,254,074 41,514,115 Permanently restricted 111,561,913 102,644,346
Total Net Assets 475,970,628 421,701,323
Total Liabilities and Net Assets 673,167,588$ 627,584,886$
The accompanying notes are an integral part of these consolidated financial statements.

ELON UNIVERSITY CONSOLIDATED STATEMENT OF ACTIVITIES
For the Year Ended May 31, 2015
8
UnrestrictedTemporarily Restricted
Permanently Restricted Total
CHANGES IN NET ASSETS:Revenues and gains:
Tuition and fees 206,204,589$ -$ -$ 206,204,589$ Tuition discount (37,665,892) - - (37,665,892)
Net tuition 168,538,697 - - 168,538,697
Sales and service of auxiliary enterprises 37,964,619 - - 37,964,619 Federal grants 1,005,355 - - 1,005,355 State grants 1,326,579 - - 1,326,579 Other grants 695,664 - - 695,664 Contributions 2,771,413 5,061,461 4,882,747 12,715,621 Contributions - pledges - 15,761,558 32,453 15,794,011 Investment income 563,778 245,396 - 809,174 Gain on investments 7,803,995 6,490,087 3,719,329 18,013,411 Loss on disposal of property and equipment (84,459) - - (84,459) Athletics 3,688,534 245,394 - 3,933,928 Other sources 1,735,078 157,984 82,420 1,975,482
Total Revenues and Gains 226,009,253 27,961,880 8,716,949 262,688,082 Net Assets Released From/To Restrictions 12,021,303 (12,221,921) 200,618 - Total Revenues and Gains and Other Support 238,030,556 15,739,959 8,917,567 262,688,082
Expenses:Instruction 100,340,874 - - 100,340,874 Student services 33,976,385 - - 33,976,385 Auxiliary enterprises 36,444,625 - - 36,444,625 Academic support 7,597,740 - - 7,597,740 Institutional support 29,359,342 - - 29,359,342
Total Expenses 207,718,966 - - 207,718,966
Increase in Net Assets before change in interest rate swap agreements 30,311,590 15,739,959 8,917,567 54,969,116
Change in value of interest rate swap agreements (699,811) - - (699,811)
Increase in Net Assets 29,611,779 15,739,959 8,917,567 54,269,305
Net Assets - Beginning of Year 277,542,862 41,514,115 102,644,346 421,701,323
Net Assets - End of Period 307,154,641$ 57,254,074$ 111,561,913$ 475,970,628$
The accompanying notes are an integral part of these consolidated financial statements.

ELON UNIVERSITY CONSOLIDATED STATEMENT OF ACTIVITIES
For the Year Ended May 31, 2014
9
UnrestrictedTemporarily Restricted
Permanently Restricted Total
CHANGES IN NET ASSETS:Revenues and gains:
Tuition and fees 193,131,718$ -$ -$ 193,131,718$ Tuition discount (35,621,787) - - (35,621,787)
Net tuition 157,509,931 - - 157,509,931
Sales and service of auxiliary enterprises 36,041,360 - - 36,041,360 Federal grants 893,052 - - 893,052 State grants 1,468,509 - - 1,468,509 Other grants 391,933 - - 391,933 Contributions 3,103,566 6,077,026 3,699,333 12,879,925 Contributions - pledges - 821,152 502,423 1,323,575 Investment income 348,151 351,071 - 699,222 Gain on investments 10,921,126 6,470,229 4,825,151 22,216,506 Loss on disposal of property and equipment (156,723) - - (156,723) Athletics 3,402,505 182,218 - 3,584,723 Other sources 1,429,689 163,216 46,035 1,638,940
Total Revenues and Gains 215,353,099 14,064,912 9,072,942 238,490,953 Net Assets Released From/To Restrictions 6,485,281 (6,485,141) (140) - Total Revenues and Gains and Other Support 221,838,380 7,579,771 9,072,802 238,490,953
Expenses:Instruction 91,146,649 - - 91,146,649 Student services 30,251,781 - - 30,251,781 Auxiliary enterprises 32,804,350 - - 32,804,350 Academic support 7,562,620 - - 7,562,620 Institutional support 28,111,082 - - 28,111,082
Total Expenses 189,876,482 - - 189,876,482
Increase in Net Assets before change in interest rate swap agreements 31,961,898 7,579,771 9,072,802 48,614,471
Change in value of interest rate swap agreements 1,484,725 - - 1,484,725
Increase in Net Assets 33,446,623 7,579,771 9,072,802 50,099,196
Net Assets - Beginning of Year 244,096,239 33,934,344 93,571,544 371,602,127
Net Assets - End of Period 277,542,862$ 41,514,115$ 102,644,346$ 421,701,323$
The accompanying notes are an integral part of these consolidated financial statements.

ELON UNIVERSITY CONSOLIDATED STATEMENTS OF CASH FLOWS
May 31, 2015 and 2014
10
2015 2014CASH FLOWS FROM OPERATING ACTIVITIES:
Increase in Net Assets 54,269,305$ 50,099,196$ Adjustments to Reconcile Increase in Net Assets to Net Cash Provided by Operating Activities:
Depreciation 11,222,127 10,245,061 Change in value of interest rate swap agreements 699,811 (1,484,725) Amortization of bond issue costs 44,889 84,267 Contributions of assets - other (6,840,363) (819,742) Contributions of assets - property and equipment - - Contributions of assets - endowment (453,499) (868,867) Contributions restricted to endowment (4,232,792) (3,332,889) Gain on investments (18,013,411) (22,216,506)
Debt extinguishment issuance costs 914,296 - Loss on disposal of property and equipment 84,459 156,723 (Increase) decrease in:
Accounts receivable (785,241) (135,705) Prepaid expenses and other assets (1,645,830) (817,373) Inventories 10,334 8,287 Contributions receivable (8,494,208) 1,256,708 Loans to students 445,350 268,437
Increase (decrease) in:Accounts payable (5,562,814) 2,777,041 Accrued liabilities 927,362 830,355 Student deposits 764,703 451,807 Deferred revenue (362,217) 477,211 Other liabilities (331,825) (391,434) U.S. Government advances for student loans (35,707) (28,679)
Net cash provided by operating activities 22,624,729 36,559,173
CASH FLOWS FROM INVESTING ACTIVITIES:Proceeds from sales and maturities of investments 7,909,854 9,507,451 Purchases of investments (21,173,111) (19,931,046) Proceeds from disposal of property and equipment 18,275 309,796 Purchases of property and equipment (19,435,774) (42,698,850) Decrease in deposits with bond trustee 9,365,964 25,886,682
Net cash used by investing activities (23,314,792) (26,925,967)
CASH FLOWS FROM FINANCING ACTIVITIES:Proceeds from bond issuance 100,310,000 - Payments for bond issue costs (365,435) - Reduction of capital lease liabilities (805,123) (521,068) Principal payments on bonds (5,720,000) (4,490,000) Debt extinguishment (100,310,000) - Contributions restricted to endowment 4,686,291 4,201,756
Net cash used in financing activities (2,204,267) (809,312)
Net increase (decrease) in cash and cash equivalents (2,894,330) 8,823,894
Cash and cash equivalents, Beginning of year 25,396,513 16,572,619
Cash and cash equivalents, End of year 22,502,183$ 25,396,513$
The accompanying notes are an integral part of these consolidated financial statements.

ELON UNIVERSITY NOTES TO CONSOLIDATED FINANCIAL STATEMENTS
For the Years Ended May 31, 2015 and 2014
11
NOTE A: Summary of Significant Accounting Policies
(1) Organization
Elon University is a private institution of higher education located in Elon, North Carolina.
(2) Tax Status
The university is a not-for-profit organization that is exempt from federal and North Carolina income taxes under Section 501(c)(3) of the Internal Revenue Code and is classified by the Internal Revenue Service as other than a private foundation.
(3) Consolidation
Occasionally the university will establish separate entities for use in specific investment transactions. To date, these entities have been limited in form to single-member Delaware limited liability companies (LLC), with the university as the single member. The consolidated financial statements include the accounts of the university and all such single-member LLCs. All inter-organizational balances and transactions have been eliminated.
(4) Basis of Presentation
The accompanying consolidated financial statements of the university have been prepared on the accrual basis of accounting and in accordance with the reporting principles of not-for-profit accounting. Accounting standards require unconditional promises-to-give be recorded as receivables and revenue within the appropriate net asset category.
(5) Classification of Net Assets
The accompanying consolidated financial statements have been prepared to present balances and transactions according to the existence or absence of donor-imposed restrictions. Accordingly, net assets and changes therein are classified as follows:
Unrestricted – Net assets that are not subject to donor-imposed stipulations. Unrestricted net assets may be designated for specific purposes by actions of the Board of Trustees or may otherwise be limited by contractual agreements with outside parties.
Temporarily Restricted – Net assets subject to donor-imposed stipulations that will be met either by actions of the university and/or the passage of time, and the portion of time restricted perpetual endowment funds that are subject to an enacted version of the North Carolina Uniform Prudent Management of Institutional Funds Act (UPMIFA).
Permanently Restricted – Net assets subject to donor-imposed stipulations that are used for a specific purpose, preserved and not sold or if sold, reinvested in other similar assets. Such assets primarily include the university’s permanent endowment funds.
Revenues are reported as increases in unrestricted net assets unless use of the related assets is limited by donor-imposed restrictions. Expenses are reported as decreases in unrestricted net assets. Gains and losses on investments and other assets or liabilities are reported as increases or decreases in unrestricted net assets unless use is restricted by donor stipulations or by law. Expirations of donor-imposed stipulations that simultaneously increase one class of net assets and decrease another are reported as a reclassification between applicable classes of net assets (assets released from/to restriction).

ELON UNIVERSITY NOTES TO CONSOLIDATED FINANCIAL STATEMENTS
For the Years Ended May 31, 2015 and 2014
12
(6) Fund Accounting
In order to ensure observance of limitations and restrictions placed on the use of the resources available to the university, the accounts of the university are maintained in accordance with the principles of “fund accounting”. This is the procedure by which resources for various purposes are classified, for accounting purposes, into funds that are in accordance with the activities or objectives specified. Separate accounts are maintained for each fund.
(7) Cash and Cash Equivalents
For purposes of the financial statements, cash and cash equivalents consist of highly liquid investment accounts with original maturities of three months or less. Such assets, reported at fair value, primarily consist of depository account balances, money market funds and accounts. The university maintains its cash and cash equivalents with several financial institutions covered by the Federal Depository Insurance Corporation (FDIC). At various times throughout the year, the university may maintain bank accounts in excess of the FDIC-insured limit. Management believes the risk associated with these bank accounts is minimal.
(8) Accounts Receivable
Accounts receivable include obligations from students in the normal course of operations and consist principally of billings for Summer Session I, post graduate programs and summer trips. Student receivables are stated at the amount billed, are uncollateralized and unpaid accounts bear no interest.
Payment for all classes is due on or before registration day of each semester. Students are not allowed to register until payment has been made. The university does extend credit plans to its students in the normal course of business. These credit plans must be prearranged and all payments are due before the close of the semester. The total amount included in accounts receivable at May 31, 2015 past due 120 days or more is $467,172. Payments of accounts receivable are allocated to the specific student account.
The carrying amount of accounts receivable is reduced by a valuation allowance that reflects management’s best estimate of the amounts that will not be collected. Management individually reviews all accounts receivable balances that exceed 180 days from the billing date and, based on an assessment of current creditworthiness, estimates the portion, if any, of the balance that will not be collected. The total of the allowance is $65,000 at May 31, 2015 and 2014.
(9) Inventories
Inventories are stated at the lower of cost or market. Cost is determined on a first-in, first-out basis. Inventories consist of office supplies, computer hardware and fuel.
(10) Deposits with Bond Trustee
Deposits with bond trustee consist of unexpended proceeds from the 2012 bond issue. These funds are invested in short-term, highly liquid securities and will be used for construction of certain facilities.
(11) Contributions Receivable
Contributions receivable are stated at present value, net of an allowance for uncollectible contributions receivable. The allowance is based on management’s analysis of specific promises made. Present value is calculated using a discount rate of 3.25%.

ELON UNIVERSITY NOTES TO CONSOLIDATED FINANCIAL STATEMENTS
For the Years Ended May 31, 2015 and 2014
13
(12) Investments
The university’s investments include a diverse portfolio of securities and investment vehicles. The university reports investments in marketable securities with readily determinable fair values and all investments in debt securities at fair value in the Consolidated Statements of Financial Position. Alternative investments, predominately a minority ownership interest in a limited partnership investment fund, are reported at net asset value as provided by the investees and in accordance with applicable professional literature. Management of the university believes the carrying amount of these financial instruments is a reasonable estimate of the fair value. Unrealized gains and losses are included in the change in net assets in the accompanying Consolidated Statements of Activities. The university reports its real estate investments at fair value as of the dates the investments are purchased by or donated to the university.
(13) Endowment Funds
A donor’s stipulation that requires a gift to be invested in perpetuity or for a specified term creates an endowment fund. Net appreciation on endowment funds is not permanently restricted unless such net appreciation has been permanently restricted by the donor or by law. Accordingly, market appreciation on permanently restricted endowment funds is generally classified in the consolidated financial statements as part of temporarily restricted net assets. It is the practice of the university to prudently invest pooled endowment funds consistent with the endowment asset allocation policy approved by the Board of Trustees. The university’s spending policy is based on the moving three year average of the market value of the pooled endowment which equated to a spending policy rate of 4.5% at May 31, 2015 and 2014.
(14) Split-Interest Agreements
Split-interest agreements with donors consist primarily of irrevocable charitable remainder trusts and charitable gift annuities. Assets held in trusts are included in investments. The contribution is recognized when the agreement is signed and the institution receives the assets. Annuity and other split-interest obligations are adjusted annually at the end of each fiscal year.
(15) Loans to Students
Loans to students include Federal Perkins and institutional loans which are reported at estimated net realizable amounts.
(16) Bond Issue Costs
Bond issue costs are capitalized and amortized over the life of the underlying bonds using the straight-line method.
(17) Interest Rate Swap Agreements
Cash flows from hedging transactions are classified in the same category as the cash flow of the related hedged item.

ELON UNIVERSITY NOTES TO CONSOLIDATED FINANCIAL STATEMENTS
For the Years Ended May 31, 2015 and 2014
14
(18) Property and Equipment
It is the university’s policy to capitalize property and equipment valued over $5,000. Purchased property and equipment are capitalized at cost. Donations of property and equipment are recorded as support at estimated fair value. Such donations are reported as unrestricted contributions unless the donor has restricted the donated asset to a specific purpose. Property and equipment donated with explicit restrictions on use and contributions of cash that must be used to acquire property and equipment are reported as temporarily or permanently restricted support. In the absence of donor stipulations regarding how long donated assets must be maintained, the university reports expirations of donor restrictions when the donated or acquired assets are placed in service. The university reclassifies temporarily restricted net assets to unrestricted net assets at that time. Property and equipment are depreciated using the straight-line method over the estimated useful lives of the assets.
Works of art are capitalized by the university at cost, or fair value if donated. As these items are not subject to normal wear or obsolescence, depreciation is not recognized.
Library resources are capitalized at cost, or fair value if donated. Depreciation is recorded using the straight-line method over estimated useful lives.
(19) Revenue Recognition
Tuition revenues for the fall and spring are recognized in the academic semester to which they relate. Revenues and expenses relating to summer session activities that are completed prior to fiscal year-end are recognized in the current fiscal year.
(20) Contributions
Contributions are recognized when the donor makes a promise to give a gift to the university that is, in substance, unconditional. Contributions, on which the donor imposes no restrictions, are reported as increases in unrestricted net assets. All other donor-restricted contributions are reported as increases in temporarily or permanently restricted net assets, depending on the nature of the restrictions. It is the university’s policy to release restrictions on contributions received for long-lived assets when the asset is acquired or put into service.
If the university is able to satisfy a donor’s restrictions in the same period the contribution is received, the restricted contribution is reported as unrestricted support. The expiration of a donor-imposed restriction on a contribution or on endowment income is recognized in the period in which the restriction expires and at that time the related resources are reclassified to unrestricted net assets. A restriction expires when the stipulated time has elapsed, when the stipulated purpose for which the resource was restricted has been fulfilled, or both.
(21) Use of Estimates
The preparation of consolidated financial statements in conformity with U.S. generally accepted accounting principles requires management to make estimates and assumptions that affect the reported amounts of assets and liabilities and disclosure of contingent assets and liabilities at the date of the financial statements and the reported amounts of revenues and expenses during the reporting period. Actual results could differ from those estimates.
ELON UNIVERSITY NOTES TO CONSOLIDATED FINANCIAL STATEMENTS
For the Years Ended May 31, 2015 and 2014
15
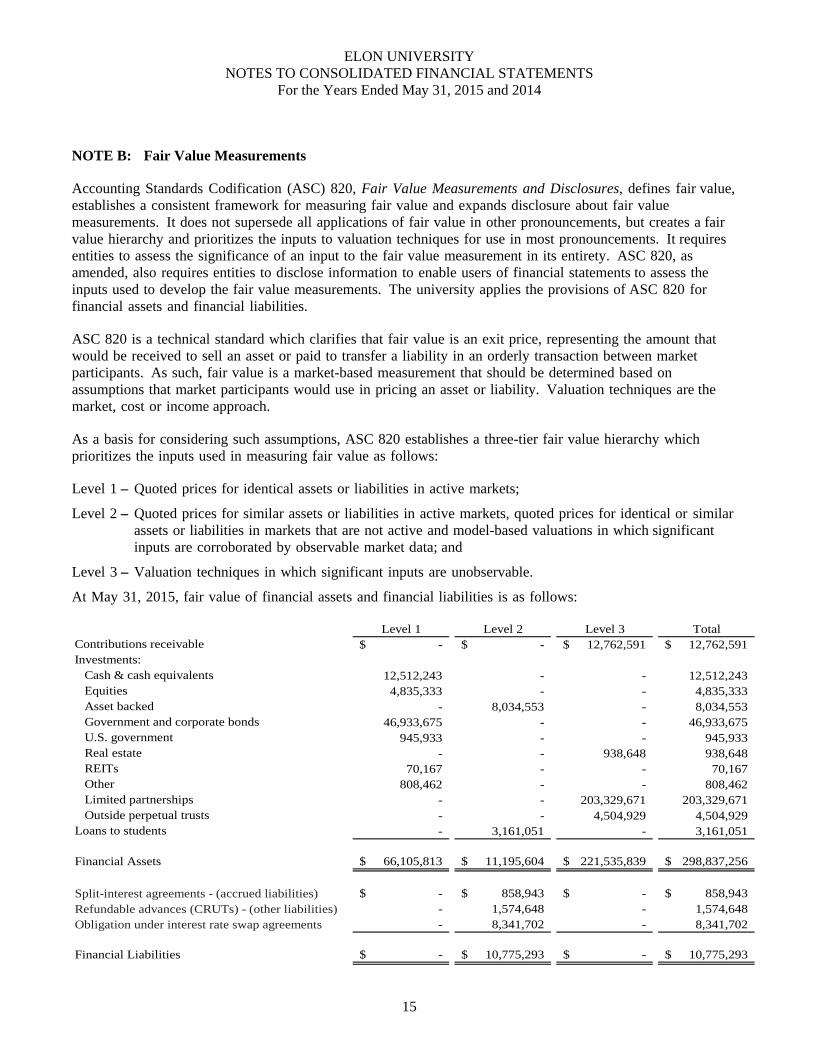
NOTE B: Fair Value Measurements
Accounting Standards Codification (ASC) 820, Fair Value Measurements and Disclosures, defines fair value, establishes a consistent framework for measuring fair value and expands disclosure about fair value measurements. It does not supersede all applications of fair value in other pronouncements, but creates a fair value hierarchy and prioritizes the inputs to valuation techniques for use in most pronouncements. It requires entities to assess the significance of an input to the fair value measurement in its entirety. ASC 820, as amended, also requires entities to disclose information to enable users of financial statements to assess the inputs used to develop the fair value measurements. The university applies the provisions of ASC 820 for financial assets and financial liabilities.
ASC 820 is a technical standard which clarifies that fair value is an exit price, representing the amount that would be received to sell an asset or paid to transfer a liability in an orderly transaction between market participants. As such, fair value is a market-based measurement that should be determined based on assumptions that market participants would use in pricing an asset or liability. Valuation techniques are the market, cost or income approach.
As a basis for considering such assumptions, ASC 820 establishes a three-tier fair value hierarchy which prioritizes the inputs used in measuring fair value as follows:
Level 1 – Quoted prices for identical assets or liabilities in active markets;
Level 2 – Quoted prices for similar assets or liabilities in active markets, quoted prices for identical or similar assets or liabilities in markets that are not active and model-based valuations in which significant inputs are corroborated by observable market data; and
Level 3 – Valuation techniques in which significant inputs are unobservable.
At May 31, 2015, fair value of financial assets and financial liabilities is as follows:
Level 1 Level 2 Level 3 TotalContributions receivable -$ -$ 12,762,591$ 12,762,591$ Investments:
Cash & cash equivalents 12,512,243 - - 12,512,243 Equities 4,835,333 - - 4,835,333 Asset backed - 8,034,553 - 8,034,553 Government and corporate bonds 46,933,675 - - 46,933,675 U.S. government 945,933 - - 945,933 Real estate - - 938,648 938,648 REITs 70,167 - - 70,167 Other 808,462 - - 808,462 Limited partnerships - - 203,329,671 203,329,671 Outside perpetual trusts - - 4,504,929 4,504,929
Loans to students - 3,161,051 - 3,161,051
Financial Assets 66,105,813$ 11,195,604$ 221,535,839$ 298,837,256$
Split-interest agreements - (accrued liabilities) -$ 858,943$ -$ 858,943$ Refundable advances (CRUTs) - (other liabilities) - 1,574,648 - 1,574,648 Obligation under interest rate swap agreements - 8,341,702 - 8,341,702
Financial Liabilities -$ 10,775,293$ -$ 10,775,293$

ELON UNIVERSITY NOTES TO CONSOLIDATED FINANCIAL STATEMENTS
For the Years Ended May 31, 2015 and 2014
16
At May 31, 2014, fair value of financial assets and financial liabilities is as follows:
Level 1 Level 2 Level 3 TotalContributions receivable -$ -$ 4,268,383$ 4,268,383$ Investments:
Cash & cash equivalents 21,950,753 - - 21,950,753 Domestic equities/funds 3,397,129 - - 3,397,129 Foreign equities/funds 1,282,841 - - 1,282,841 Asset backed - 5,682,577 - 5,682,577 Government and corporate bonds 28,629,118 - - 28,629,118 U.S. government 957,719 - - 957,719 Real estate - - 938,648 938,648 REITs 85,083 - - 85,083 Other 778,376 - - 778,376 Limited partnerships - - 176,570,089 176,570,089 Outside perpetual trusts - - 4,524,250 4,524,250
Loans to students - 3,606,401 - 3,606,401
Financial Assets 57,081,019$ 9,288,978$ 186,301,370$ 252,671,367$
Split-interest agreements - (accrued liabilities) -$ 738,313$ -$ 738,313$ Refundable advances (CRUTs) - (other liabilities) - 1,526,085 - 1,526,085 Obligation under interest rate swap agreements - 7,641,891 - 7,641,891
Financial Liabilities -$ 9,906,289$ -$ 9,906,289$
There were no significant transfers between Level 1 and Level 2 and there were no transfers in or out of Level 3.
At May 31, 2015, valuation methodologies used to measure fair value of financial assets and financial liabilities are as follows:
Contributions receivable and loans to students – Valuation is based on the present value of promised or contractually obligated future cash flows, net of an estimated collection allowance. The collection allowance is based on historical trends of collection, the type of obligor (individual or corporation/foundation), general economic conditions and the university’s internal policies.
Investments – To the extent that the university directly owns and controls the investment, valuation is based on unadjusted quoted prices for identical assets in active markets that the university can access. Real estate is recorded at the acquisition price if purchased and appraised value if donated. For other investments, predominately “alternative investments”, valuation is based on information supplied by external investment managers in accordance with FASB ASU 2009-12, Investments in Certain Entities that Calculate Net Asset Value per Share (or its equivalent). Management of the university believes this information is a reasonable estimate of fair value; however, because the alternative investments are not readily marketable and subject to redemption restrictions, the fair value is subject to uncertainty and therefore may differ from the amounts ultimately realized from these investments.

ELON UNIVERSITY NOTES TO CONSOLIDATED FINANCIAL STATEMENTS
For the Years Ended May 31, 2015 and 2014
17
Outside perpetual trusts – The university holds beneficial interests in perpetual trusts administered by outside trustees. The fair value of these interests is based on the values of the underlying investments in the trusts which are established by the trustees using unadjusted quoted prices for identical assets in active markets. The university revalues its interest annually in these trusts based on information provided by the trustees.
Split-interest agreements – Valuation is based on the present value of estimated future payments to the beneficiaries over their life expectancies.
Refundable advances - CRUTs – Valuation is based on the value of assets held by the university as trustee of the respective trusts. Assets consist of cash and investments.
Obligations under interest rate swap agreements – Valuation is provided by an experienced financial institution on a mark-to-market basis and, whenever possible, utilizes observable market data including yields and spreads, but may be based in part on assumptions concerning interest rates, credit rates, discount rates and other factors.
The following schedule summarizes changes in fair value of Level 3 financial assets during the years ended May 31, 2014 and 2015:
Contributions Receivable Real Estate
Alternative Investments
Outside Perpetual Trusts Total
Balance, May 31, 2013 5,525,091$ 938,648$ 146,846,271$ 4,230,645$ 157,540,655$
Change in value 85,901 - 21,660,292 340,554 22,086,747 Purchases/Gifts - - 14,980,000 3,575 14,983,575 Pledges 1,323,575 - - - 1,323,575 Sales - - (6,916,474) (50,524) (6,966,998) Collections (2,666,184) - - - (2,666,184)
Balance, May 31, 2014 4,268,383$ 938,648$ 176,570,089$ 4,524,250$ 186,301,370$
Change in value (1,695,990) - 18,215,267 89,204 16,608,481 Purchases/Gifts - - 16,160,000 25,426 16,185,426 Pledges 17,475,000 - - - 17,475,000 Sales - - (7,615,685) (133,951) (7,749,636) Collections (7,284,802) - - - (7,284,802)
Balance, May 31, 2015 12,762,591$ 938,648$ 203,329,671$ 4,504,929$ 221,535,839$
Change in value of contributions receivable is included in contributions on the Consolidated Statements of Activities. Changes in the value of real estate, alternative investments and outside perpetual trusts are included in gain/loss on investments on the Consolidated Statements of Activities.
The above table presents additional information about Level 3 assets measured at fair value. Both observable and unobservable inputs may be used to determine the fair value of positions classified within the Level 3 category. As a result, unrealized gains and losses for assets within the Level 3 category in the table above may include changes in fair value that were attributable to both observable and unobservable inputs.

ELON UNIVERSITY NOTES TO CONSOLIDATED FINANCIAL STATEMENTS
For the Years Ended May 31, 2015 and 2014
18
Alternative investments consist predominantly of a minority ownership interest in a limited partnership investment fund (Fund) whose investment strategy focuses on varied and nontraditional investment opportunities in an effort to provide a diversified, single-portfolio for investors. The Fund invests primarily in investment vehicles (e.g. hedge funds and private equity funds) or pooled accounts managed by unaffiliated third parties mainly through master trading vehicles, as well as direct investments in securities and other assets.
Specifically, the Fund has two long term return goals which are consistent with the university’s objective for endowment returns: (1) to outperform a traditional 70% equities/30% bonds portfolio with less downside volatility and (2) to preserve purchasing power by generating at least a 5% return after inflation. The Fund’s portfolio is globally diversified and allocated across multiple asset classes including equities, real assets, commodities/resources and fixed income instruments and is invested for total return; generating current income is not an objective. The long-term, total return objective dictates a significant allocation to asset classes expected to generate equity-like returns. The risks inherent in higher returning asset classes can normally be reduced through diversification, which is a key principal of the Fund’s asset allocation approach.
A majority of the Fund’s investments include limited partnership interests (sub-partnerships) whose investments are principally comprised of illiquid, non-publicly traded securities. Other Fund investments include exchange traded funds and derivative contracts (e.g. futures contracts, options, forward currency contracts and swap agreements). These and other investments are subject to various risk factors including market, credit and industry risk. Market risk represents the potential loss in value of financial instruments caused by movements in market variables, such as interest rates. Other risks affecting these investments include, but are not limited to, increasing competition, rapid changes in technology and changes in economic conditions.
Generally, the university’s alternative investments are redeemable once annually at net asset value, but require a written redemption request at least 180 days prior to the annual redemption date. Due to the illiquid nature of alternative investments, all redemptions are subject to the general partner’s approval and may be limited or suspended entirely. Additionally, sale of all or part of the alternative investments to a third party is not allowed.
The university is contractually committed to provide additional funding for alternative investments under the terms of these partnership agreements. At May 31, 2015, these unfunded commitments amounted to $16,700.
NOTE C: Contributions Receivable
The payment timing of outstanding contributions receivable at May 31, 2015, is estimated to be:
Permanently Restricted
Temporarily Restricted Unrestricted Total
One Year 559,172$ 2,976,701$ -$ 3,535,873$ 2 - 4 Years 516,872 6,991,926 - 7,508,798 5 Plus Years 41,496 1,676,424 - 1,717,920
Total 1,117,540$ 11,645,051$ -$ 12,762,591$

ELON UNIVERSITY NOTES TO CONSOLIDATED FINANCIAL STATEMENTS
For the Years Ended May 31, 2015 and 2014
19
The payment timing of outstanding contributions receivable at May 31, 2014, is estimated to be:
Permanently Restricted
Temporarily Restricted Unrestricted Total
One Year 1,102,392$ 1,203,700$ -$ 2,306,092$ 2 - 4 Years 519,248 1,332,666 - 1,851,914 5 Plus Years 6,639 103,738 - 110,377
Total 1,628,279$ 2,640,104$ -$ 4,268,383$
Contributions receivable are shown net of a collection allowance of $1,218,488 and $430,490 and a discount of $746,171 and $120,477 at May 31, 2015 and 2014, respectively.
A concentration exists when a pledge balance from an individual donor, to include entities under the donor’s control, exceeds 10% of the total amounts receivable. These concentrations amounted to $9,975,800 and $748,400 at May 31, 2015 and 2014, respectively.
NOTE D: Investments
Major categories of investments at May 31, 2015 and 2014, are as follows:
Cost Market Cost MarketNon-endowment funds:
Money market funds 9,389,763$ 9,389,763$ 18,203,544$ 18,203,544$ Certificates of deposit 2,028,693 2,028,693 2,016,534 2,016,534 Equities 797,427 594,808 797,863 501,443 Fixed income 53,065,911 53,053,063 32,308,317 32,363,964 U.S. government obligations 1,046,508 945,933 1,029,232 936,896 Real estate 336,747 336,747 336,747 336,747 Other 580,654 580,654 542,243 542,243
Alternative investments 491,842 604,068 491,843 571,469 67,737,545 67,533,729 55,726,323 55,472,840
Endowment and similar funds: Money market funds 1,222,388$ 1,222,391$ 1,845,116$ 1,848,464$ Equities 4,677,008 6,890,081 4,554,465 6,633,066 Fixed income 3,126,614 3,186,267 3,271,240 3,395,429 U.S. government obligations - - 20,529 20,823 Real estate 601,901 601,901 601,901 601,901 Other 735,821 753,642 788,611 825,440
Alternative investments 130,725,000 202,725,603 119,652,120 175,998,620 141,088,732 215,379,885 130,733,982 189,323,743
Total 208,826,277$ 282,913,614$ 186,460,305$ 244,796,583$
2015 2014

ELON UNIVERSITY NOTES TO CONSOLIDATED FINANCIAL STATEMENTS
For the Years Ended May 31, 2015 and 2014
20
All investments are subject to risk of loss or decline in value. As such, it is at least reasonably possible that changes in the values of investments will occur in the near term, and that such changes could materially affect the amount reported in the university’s consolidated financial statements.
Investment returns are reported net of investment fees. The amount of fees paid during the fiscal years ended May 31, 2015 and 2014, are $1,562,167 and $1,957,358 respectively.
NOTE E: Endowment and Similar Funds
The university’s endowment consists of individual funds established for a variety of educational purposes. The endowment includes both donor-restricted funds and funds designated by the Board of Trustees to function as endowments. As required by generally accepted accounting principles, net assets associated with endowment funds, including funds designated by the Board of Trustees to function as endowments, are classified and reported based on the existence or absence of donor-imposed restrictions.
In 2008, North Carolina adopted UPMIFA, which the university has interpreted as requiring the preservation of the historical value (corpus) of the donor-restricted endowment funds absent explicit donor stipulations to the contrary. As a result of this interpretation, the university classifies as permanently restricted net assets (1) the original value of gifts donated to the permanent endowment, (2) the original value of subsequent gifts to the permanent endowment, and (3) accumulations to the permanent endowment made in accordance with the direction of the applicable donor gift instrument at the time the accumulation is added to the fund. If the endowment assets earn investment returns beyond the amount necessary to maintain the endowment assets’ historical value, that excess is available for appropriation and; therefore, classified as temporarily restricted net assets until appropriated for expenditure. The university records the investment returns on the specific-purpose endowment funds in temporarily restricted net assets and makes those earnings available for expenditure for the donor-restricted purposes.
In accordance with UPMIFA, the university considers the following factors in making a determination to appropriate or accumulate donor-restricted endowment funds:
1. The duration and preservation of the fund; 2. The purposes of the donor-restricted endowment fund; 3. General economic conditions; 4. Effect of inflation and deflation; 5. The expected total return from income and the appreciation of investments; 6. Other resources of the university; and 7. The investment policies of the university.
The endowment pool utilizes a total return strategy in which investment returns are achieved through both capital appreciation (realized and unrealized) and current yield (interest and dividends). External investment managers are employed to oversee the endowment and tasked with the objective of achieving returns that equal or exceed five percentage points (net of fees and in excess of spending and inflation). These investment managers utilize a highly diversified mixture of equities, fixed income and alternative investments. The university’s primary investment objective is to maximize total return within reasonable and prudent levels of risk while maintaining sufficient liquidity to meet disbursement needs and ensure preservation of capital.

ELON UNIVERSITY NOTES TO CONSOLIDATED FINANCIAL STATEMENTS
For the Years Ended May 31, 2015 and 2014
21
The Board of Trustees has approved an endowment spending policy whereby distributions are based on the moving three year average of the market value of the pooled endowment. The applicable rate was 4.5% for the years ended May 31, 2015 and 2014. Actual endowment return earned in excess of distributions under this policy is reinvested as part of the university’s endowment. For years where actual endowment return is less than distributions under the policy, the shortfall is covered by available gains from prior years. Specific appropriation for expenditure of unrestricted funds under the university’s endowment spending policy occurs each spring when the Board approves the university’s operating budget for the ensuing fiscal year. All donor-restricted returns are invested until appropriated for expenditure by the institution.
Endowment totals as of May 31, 2015 and 2014, are as follows:
2015 2014Contributions receivable, net 1,117,540$ 1,628,279$ Investments 215,379,885 189,323,743 Accrued and other liabilities (2,272,853) (2,264,399)
Total 214,224,572$ 188,687,623$
Endowment net asset compositions as of May 31, 2015 and 2014, are as follows:
2015 2014Unrestricted – Board designated 73,656,029$ 59,819,217$ Unrestricted – Donor designated 4,833,133 4,003,663 Temporarily restricted 25,543,231 23,283,189 Permanently restricted 110,192,179 101,581,554
Total 214,224,572$ 188,687,623$

ELON UNIVERSITY NOTES TO CONSOLIDATED FINANCIAL STATEMENTS
For the Years Ended May 31, 2015 and 2014
22
Changes in endowment net assets during the years ended May 31, 2015 and 2014, are as follows:
UnrestrictedTemporarily Restricted
Permanently Restricted Total
Balance, May 31, 2013 46,068,942$ 20,192,900$ 92,557,310$ 158,819,152$
Contributions - Donors - 50,000 4,201,756 4,251,756 Contributions - Board designated 9,500,000 - - 9,500,000 Investment income - 38,635 - 38,635 Gain on investments 10,772,213 6,626,437 4,822,628 22,221,278 Spending policy (2,518,415) (3,617,452) - (6,135,867) Transfers 140 (7,331) (140) (7,331)
Balance, May 31, 2014 63,822,880$ 23,283,189$ 101,581,554$ 188,687,623$
Contributions - Donors - - 4,686,291 4,686,291 Contributions - Board designated 10,000,000 - - 10,000,000 Investment income - 138,973 - 138,973 Gain on investments 7,772,996 6,559,641 3,723,716 18,056,353 Spending policy (3,106,714) (4,153,057) - (7,259,771) Transfers - (285,515) 200,618 (84,897)
Balance, May 31, 2015 78,489,162$ 25,543,231$ 110,192,179$ 214,224,572$
The fair value of assets associated with individual donor restricted endowment funds may fall below the historic gift value. These deficiencies amounted to $0 at May 31, 2015 and 2014. In accordance with GAAP, deficiencies of this nature first reduce available temporarily restricted net assets. Any remaining loss shall reduce unrestricted net assets. While UPMIFA allows spending from these so-called underwater funds, the university’s policy restricts spending from underwater funds.

ELON UNIVERSITY NOTES TO CONSOLIDATED FINANCIAL STATEMENTS
For the Years Ended May 31, 2015 and 2014
23
NOTE F: Planned Giving Agreements and Trusts
The university is a party to four types of planned giving agreements. The specific terms vary between donors and the agreements can be generally described as follows:
Outside Perpetual Trusts
These are trusts created by donors for the benefit of the university and are reported as investments in the Consolidated Statements of Financial Position. Third-party trustees hold the assets. The university has a perpetual and enforceable right to income generated from the trusts. They are valued based on the estimated future cash receipts from the trusts’ assets. The university has a one-half right to income generated from one of these trusts and full rights to income generated from the remaining trusts.
2015 2014Trustee distributions restricted to scholarship:
Asset value 1,265,112$ 1,220,000$ Trustee distributions 40,489 31,440
Trustee distributions restricted to professorship:Asset value 990,100$ 984,700$ Trustee distributions 42,732 39,509
Unrestricted trustee distributions:Asset value 2,249,717$ 2,319,550$ Trustee distributions 129,353 87,485
Pooled (or Life) Income Fund
These are arrangements in which the university pools, invests, and manages life income gifts from many different donors. The funds are unitized and donors are assigned a specific number of units based on the relationship of the fair value of their contribution to the fair value of the pool as a whole at the time the donor enters the pool. During the term of the life income gifts, the donor, or beneficiaries specified by the donor, receives the actual income earned on the donor’s units in the pool. Upon death, the donor’s units revert to the university. The assets are recorded as investments in the Consolidated Statements of Financial Position at fair value.
2015 2014Asset value 71,353$ 272,957$

ELON UNIVERSITY NOTES TO CONSOLIDATED FINANCIAL STATEMENTS
For the Years Ended May 31, 2015 and 2014
24
Charitable Gift Annuities
These are arrangements between donors and the university in which the donors contribute assets to the university in exchange for a promise by the university to pay a fixed amount for a specified period of time to individuals named by the donors. No trust exists, the assets received are held as general assets of the university, and the annuity liability is a general obligation of the university and is included in the accrued liabilities in the Consolidated Statements of Financial Position. The assets received are recognized at fair value when received, and an annuity payment liability is recognized at the present value of future cash flows expected to be paid to the beneficiary.
2015 2014Annuities liability 600,644$ 640,717$ Total contributions to charitable gift annuities 30,000 - Change in value of charitable gift annuities (35,188) (41,425)
Charitable Remainder Unitrusts
A charitable remainder unitrust is an arrangement in which a donor establishes and funds a trust with specified distributions to be made to a designated beneficiary or beneficiaries over the trust’s term. Upon termination of the trust, the university receives the assets remaining in the trust. The distributions to the beneficiaries are for a specified percentage of the trust’s fair market value as determined annually. Distributions to the beneficiaries are made from income and then principal to the extent income is not sufficient. Obligations to the beneficiaries are limited to the assets of the trust. The present value of the unitrust liability is included in accrued liabilities in the Consolidated Statements of Financial Position.
2015 2014Unitrust liability 173,002$ 165,453$ Change in value of charitable remainder trusts 15,543 21,062
NOTE G: Loans to Students
Federal Perkins loans are low-interest federally funded student loans that participating schools make to eligible undergraduate students. Elon student loans are made from institutional and donor funds. No interest accrues on these student loans while a student is enrolled at least halftime at any accredited school of higher education.
2015 2014Perkins loans receivable are due from students, payable in monthly or quarterlyminimum installments of $40 or $120, respectively. Interest is computed at anannual rate of 5%. These loans are unsecured. Receivables are net of anallowance for doubtful accounts totaling $40,000 at May 31, 2015 and 2014. 2,869,441$ 3,197,508$
Elon loans receivable are due from students, payable in minimum monthlyinstallments of $50. Interest is computed at an annual rate not to exceed 5%. Some of these loans are secured by a cosigner. Receivables are net of an allowance for doubtful accounts totaling $50,000 and $33,000 at May 31, 2015 and 2014, respectively. 291,610 408,893
Total 3,161,051$ 3,606,401$

ELON UNIVERSITY NOTES TO CONSOLIDATED FINANCIAL STATEMENTS
For the Years Ended May 31, 2015 and 2014
25
NOTE H: Financing Receivables
The university makes uncollateralized loans to students based on financial need through a federal government loan program and institutional resources. The university participates in the Perkins federal revolving loan program, wherein the university acts as an agent for the federal government in administering the loan program. Funds advanced by the federal government for use in this program are ultimately refundable to the government and are classified as liabilities in the Consolidated Statements of Financial Position (U.S. government advances for student loans). Outstanding loans cancelled under the program result in a reduction of the funds available for loan and a decrease in the liability to the government.
Institutional loans are funded with donor funds restricted for student loan purposes and university funds made available to meet demonstrated need.
Allowances for doubtful accounts are established by considering a variety of factors including prior collection experience, analysis of past due loans, the financial condition of specific borrowers and other current economic factors which could influence the ability of loan recipients to repay amounts due. Institutional loan balances are written off only when they are deemed to be permanently uncollectible.
At May 31, 2015 and 2014, student loans are as follows:
2015 2014Federal Perkins loan program 2,909,441$ 3,237,508$ Institutional loans 341,610 441,893
3,251,051 3,679,401 Less allowance for doubtful accounts:Beginning of the year (73,000) (70,000) Increases (29,902) (23,412) Charge offs 12,902 20,412 End of year (90,000) (73,000)
Student loans receivable, net 3,161,051$ 3,606,401$
At May 31, 2015 and 2014, past due amounts are as follows:
1-60 Days Past Due
60-90 Days Past Due
Over 90 Days Past Due Total
2015 12,740$ 1,102$ 580,250$ 594,092$ 2014 3,429 1,786 572,797 578,012
A default rate is defined as the failure of a borrower to make an installment payment when due or to comply with a written repayment agreement. At May 31, 2015 and 2014, default rates are as follows:
2015 2014Federal Perkins loan program 2.35% 2.34%Institutional loans - Undergraduate 0.98% 1.22%Institutional loans - Graduate 7.15% 7.71%

ELON UNIVERSITY NOTES TO CONSOLIDATED FINANCIAL STATEMENTS
For the Years Ended May 31, 2015 and 2014
26
NOTE I: Construction in Progress
Projects in process at May 31, 2015 and 2014, are as follows:
2015 Project DescriptionCosts Incurred
Through 5/31/15Estimated Date of Completion
Communications Expansion 1,570,497$ August 2016Danieley Commons Renovation and Addition 927,050 August 2015Danieley Recreation Building 1,248,525 August 2015Music Renovation at Arts West 1,587,267 August 2015Other projects 441,417 Various
Total 5,774,756$
2014 Project DescriptionCosts Incurred
Through 5/31/14Estimated Date of Completion
Global Neighborhood Phase 2 (2012 bond issue) 28,899,743$ August 2014Inman Admissions Welcome Center 4,060,795 January 2015Scott Studio 1,783,196 August 2014Communications Expansion 1,353,541 August 2016Psychology and Human Services Studies 2,421,030 July 2014Other projects 731,913 Various
Total 39,250,218$

ELON UNIVERSITY NOTES TO CONSOLIDATED FINANCIAL STATEMENTS
For the Years Ended May 31, 2015 and 2014
27
NOTE J: Property and Equipment
Property and equipment at May 31, 2015 and 2014, are as follows:
2015 2014Land and land improvements 55,195,564$ 51,858,359$ Buildings 347,407,633 299,107,267 Computers and related equipment 5,274,137 5,028,065 Library resources 8,871,158 9,522,979 Vehicles 4,870,562 4,805,764 Audiovisual equipment 3,455,775 2,757,956 Science equipment 2,395,186 2,341,005 Software 2,104,534 2,122,786 Telephone systems and equipment 159,295 159,295 Other moveable assets 11,454,862 10,257,338 Collections 2,062,874 2,062,874
443,251,580 390,023,688 Less: Accumulated depreciation 108,432,460 98,530,150
Total 334,819,120$ 291,493,538$
Depreciation expense is $11,222,127 and $10,245,061 for the years ended May 31, 2015 and 2014 respectively.
NOTE K: Accrued Liabilities
Accrued liabilities at May 31, 2015 and 2014 are as follows:
2015 2014Salaries and wages 8,204,170$ 7,645,782$ Compensated absences 3,945,538 3,663,666 Split-interest agreements 858,943 738,313 Employee benefits and payroll taxes (3,552) (2,013) Conditional asset retirement obligations 488,160 464,044 Accrued other liabilities 972,087 1,004,080
Total 14,465,346$ 13,513,872$
Compensated Absences
Eligibility for vacation is based on continuous service with the university. Employees earn vacation based on their length of service. The maximum number of accumulated vacation days an employee may carry forward into each calendar year is 20. Accumulated vacation time may be used or paid at time of separation. Other accrued compensated absences are by employee contract.
The university also provides two additional paid days off each year, which are designated as personal leave days. The personal leave days must be used within the calendar year and will not carry over into the next calendar year. Since the university has no obligation to the accumulated personal leave until it is taken, no liability for unpaid personal leave has been recorded in these financial statements.
ELON UNIVERSITY NOTES TO CONSOLIDATED FINANCIAL STATEMENTS
For the Years Ended May 31, 2015 and 2014
28
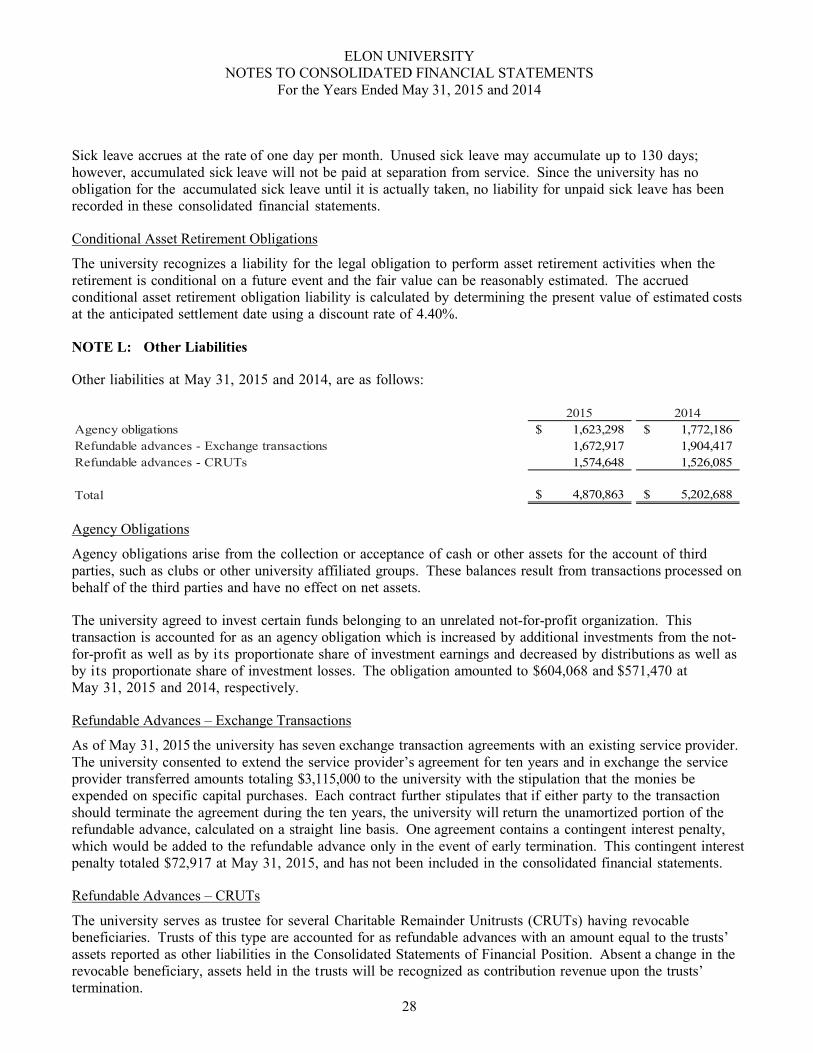
Sick leave accrues at the rate of one day per month. Unused sick leave may accumulate up to 130 days; however, accumulated sick leave will not be paid at separation from service. Since the university has no obligation for the accumulated sick leave until it is actually taken, no liability for unpaid sick leave has been recorded in these consolidated financial statements.
Conditional Asset Retirement Obligations
The university recognizes a liability for the legal obligation to perform asset retirement activities when the retirement is conditional on a future event and the fair value can be reasonably estimated. The accrued conditional asset retirement obligation liability is calculated by determining the present value of estimated costs at the anticipated settlement date using a discount rate of 4.40%.
NOTE L: Other Liabilities
Other liabilities at May 31, 2015 and 2014, are as follows:
2015 2014Agency obligations 1,623,298$ 1,772,186$ Refundable advances - Exchange transactions 1,672,917 1,904,417 Refundable advances - CRUTs 1,574,648 1,526,085
Total 4,870,863$ 5,202,688$
Agency Obligations
Agency obligations arise from the collection or acceptance of cash or other assets for the account of third parties, such as clubs or other university affiliated groups. These balances result from transactions processed on behalf of the third parties and have no effect on net assets.
The university agreed to invest certain funds belonging to an unrelated not-for-profit organization. This transaction is accounted for as an agency obligation which is increased by additional investments from the not-for-profit as well as by its proportionate share of investment earnings and decreased by distributions as well as by its proportionate share of investment losses. The obligation amounted to $604,068 and $571,470 at May 31, 2015 and 2014, respectively.
Refundable Advances – Exchange Transactions
As of May 31, 2015 the university has seven exchange transaction agreements with an existing service provider. The university consented to extend the service provider’s agreement for ten years and in exchange the service provider transferred amounts totaling $3,115,000 to the university with the stipulation that the monies be expended on specific capital purchases. Each contract further stipulates that if either party to the transaction should terminate the agreement during the ten years, the university will return the unamortized portion of the refundable advance, calculated on a straight line basis. One agreement contains a contingent interest penalty, which would be added to the refundable advance only in the event of early termination. This contingent interest penalty totaled $72,917 at May 31, 2015, and has not been included in the consolidated financial statements.
Refundable Advances – CRUTs
The university serves as trustee for several Charitable Remainder Unitrusts (CRUTs) having revocable beneficiaries. Trusts of this type are accounted for as refundable advances with an amount equal to the trusts’ assets reported as other liabilities in the Consolidated Statements of Financial Position. Absent a change in the revocable beneficiary, assets held in the trusts will be recognized as contribution revenue upon the trusts’ termination.

ELON UNIVERSITY NOTES TO CONSOLIDATED FINANCIAL STATEMENTS
For the Years Ended May 31, 2015 and 2014
29
NOTE M: Obligation Under Capital Leases
The university has entered into various lease agreements for buildings, computers and related equipment. The leases expire at various dates through December 31, 2030. For financial reporting purposes, minimum lease payments have been capitalized.
Property held under capital leases at May 31, 2015 and 2014, is as follows:
2015 2014Buildings, computers and related equipment 4,124,768$ 2,409,672$ Less: Accumulated amortization 2,050,373 1,248,837
Total 2,074,395$ 1,160,835$
Amortization of assets under capital leases is included in depreciation expense and amounted to $801,535 and $595,238 for the years ended May 31, 2015 and 2014, respectively.
Future minimum lease payments under capital leases and the net present value of the future minimum lease payments at May 31, 2015, are as follows
Year ending May 31 Amount2016 548,461$ 2017 442,094 2018 335,979 2019 254,201 2020 220,407 Thereafter 1,458,134
Total lease payments 3,259,276
Less: Amounts representing interest 1,144,304
Present value of future minimum lease payments 2,114,972$
Total interest costs incurred related to the obligation under capital leases are $66,577 and $32,553 for the years ended May 31, 2015 and 2014, respectively.
NOTE N: Bonds Payable
The following bonds were issued through the North Carolina Capital Facilities Finance Agency. On September 1, 2014, the university extinguished the outstanding debt related to revenue bonds series 1997, 1998, 2000, 2001C, 2006, 2010 and 2011, and entered into an agreement with Wells Fargo Bank and SunTrust Bank to arrange debt refinancing through a direct purchase. Revenue Bond Series 2014A, in the amount of $39,385,000 was issued as a direct purchase by Wells Fargo and Revenue Bond Series 2014B, in the amount of $60,325,000 was issued as a direct purchase by SunTrust. The existing maturity dates did not change. Revenue Bond Series 2012 was not part of the refinancing and remains as direct purchase bonds held by BB&T. The university has made certain covenants including use of the proceeds and sale of project property.

ELON UNIVERSITY NOTES TO CONSOLIDATED FINANCIAL STATEMENTS
For the Years Ended May 31, 2015 and 2014
30
Remaining principal balances at May 31, 2015 and 2014, are as follows:
2015 2014Revenue Bonds, Series 1997 - $17,815,000, bearing a weekly variable marketinterest rate paid monthly. Principal payments began in 2001 and continuedthrough 2003 and began again in 2009 and continued through August 2014.
-$ 11,930,000$ Revenue Bonds, Series 1998 - $14,010,000, bearing a weekly variable marketinterest rate paid monthly. Principal payments began in 2001 and continued through August 2014. - 6,155,000 Revenue Bonds, Series 2000 - $4,325,000, bearing a weekly variable marketinterest rate paid monthly. Principal payments began in 2002 and continued through August 2014. - 2,280,000 Revenue Bonds, Series 2001C - $7,255,000, bearing a weekly variable marketinterest rate paid monthly. Principal payments began in 2004 and continued through August 2014. - 4,670,000 Revenue Bonds, Series 2006 - $18,905,000, bearing a weekly variable marketinterest rate paid monthly. Principal payments began in 2008 and continuedthrough August 2014. The bonds are subject to an interest rate swap agreementreferenced in Note O.
- 14,950,000 Revenue Bonds, Series 2010 - $21,135,000, bearing a weekly variable marketinterest rate paid monthly. Principal payments began in 2013 and continuedthrough August 2014. The bonds are subject to an interest rate swap agreementreferenced in Note O. - 19,985,000 Revenue Bonds, Series 2011 - $40,340,000, bearing a weekly variable marketinterest rate paid monthly. Principal payments began in 2014 and continuedthrough 2014. The bonds are subject to an interest rate swap agreementreferenced in Note O.
- 40,340,000 Revenue Bonds, Series 2012 - $54,595,000, bearing a weekly variable marketinterest rate paid monthly. Principal payments began in 2015 and will continue through 2037. The interest rate at May 31, 2015, is 1.25%. 54,095,000 54,595,000 Revenue Bonds, Series 2014A - $39,985,000, bearing a weekly variable marketinterest rate paid monthly. Principal payments began in 2015 and will continue through 2035. The bonds are subject to an interest rate swap agreement referenced in Note O. The interest rate at May 31, 2015, is 0.65%.
35,875,000 - Revenue Bonds, Series 2014B - $60,325,000, bearing a weekly variable marketinterest rate paid monthly. Principal payments began in 2015 and will continue through 2036. The bonds are subject to an interest rate swap agreementreferenced in Note O. The interest rate at May 31, 2015, is 1.19%. 59,215,000 -
Total 149,185,000$ 154,905,000$

ELON UNIVERSITY NOTES TO CONSOLIDATED FINANCIAL STATEMENTS
For the Years Ended May 31, 2015 and 2014
31
Aggregate maturities of bonds payable at May 31, 2015, are as follows:
Amount2016 5,930,000$ 2017 6,145,000 2018 6,365,000 2019 6,595,000 2020 5,880,000 Thereafter 118,270,000
Total 149,185,000$
Total interest costs incurred related to bonds payable are $3,666,405 and $3,157,988 for the years ended May 31, 2015 and 2014, respectively, and of these amounts $328,633 and $498,629, respectively, are capitalized as a cost of construction.
NOTE O: Obligation Under Interest Rate Swap Agreements
The university has recorded three interest rate swap agreements on the Consolidated Statements of Financial Position at fair value. One agreement involves series 2014A and two agreements involve series 2014B. These agreements allow the university to exchange variable for fixed rate interest payment obligations. The series 2006, 2010 and 2011 bonds were extinguished September 30, 2014; however, the interest rate swap agreement remains in effect. The swap agreements are used to minimize the impact of future interest rate changes. Effective July 1, 2012 management renegotiated these agreements, under substantially similar terms from the previous provider Bank of America to Wells Fargo.
Under the agreements, payments are made or received based on the difference between fixed rates listed below and 70% of the USD-LIBOR BBA index. The university anticipates holding the interest rate swap agreements until all debt under the agreements has been retired. Principal maturities on the remaining debt conclude in 2036.
The university has only limited involvement with derivative financial instruments and does not use them for trading purposes. Fair value is determined by a third party on a mark-to-market basis. The change in value of the interest rate swap agreements is shown as a separate line item in the Consolidated Statements of Activities.
The obligation under interest rate swap agreements at May 31, 2015 and 2014, is as follows:
Fixed Rate 2015 Fixed Rate 2014Series 2014A 3.78% 2,773,719$ Series 2006 3.78% 2,593,678$ Series 2014B 3.30% 1,867,039 Series 2010 3.30% 1,913,858 Series 2014B 3.01% 3,700,944 Series 2011 3.01% 3,134,355
Total 8,341,702$ 7,641,891$

ELON UNIVERSITY NOTES TO CONSOLIDATED FINANCIAL STATEMENTS
For the Years Ended May 31, 2015 and 2014
32
NOTE P: Temporarily and Permanently Restricted Net Assets
Temporarily restricted net assets at May 31, 2015 and 2014, are as follows:
2015 2014Contributions to buildings and equipment 19,758,312$ 7,490,497$ Endowment related funds 32,034,432 28,879,983 Split-interest agreements and term endowments 586,098 793,469 Non-endowed contributions for scholarships and operations 5,003,099 4,350,166
Temporarily restricted net assets 57,381,941$ 41,514,115$
Permanently restricted net assets at May 31, 2015 and 2014, are as follows:
2015 2014Permanent endowment funds 109,254,481$ 99,866,639$ Contributions receivable, net 1,117,540 1,628,279 Split-interest agreements and term endowments 556,215 515,750 Student loan funds 633,677 633,678
Permanently restricted net assets 111,561,913$ 102,644,346$

ELON UNIVERSITY NOTES TO CONSOLIDATED FINANCIAL STATEMENTS
For the Years Ended May 31, 2015 and 2014
33
NOTE Q: Financial Aid (Tuition Discount)
The university awards financial aid based on academic merit, need and leadership. Gross tuition discounts are 18.3% and 18.4% for the years ended May 31, 2015 and 2014, respectively. The unfunded discount rate is 15.9% and 15.7% for the years ended May 31, 2015 and 2014, respectively. Funded tuition discounts are derived from endowment revenue, private gifts and federal and state aid. Unfunded tuition discounts are derived from the general operating revenues of the university and income earned on Board designated funds (quasi endowment).
Total Tuition and Fees Dollars Percentage Dollars PercentageUnfunded discount - general 31,133,250$ 15.1% 29,017,846$ 15.0%Unfunded discount - quasi 1,709,200 0.8% 1,326,300 0.7%
Total unfunded discount 32,842,450 15.9% 30,344,146 15.7%Funded discount 4,823,442 2.4% 5,277,641 2.7%
Total 37,665,892$ 18.3% 35,621,787$ 18.4%
Gross tuition and fees 206,204,589$ 193,131,718$
Undergraduate Tuition and Fees Dollars Percentage Dollars PercentageUnfunded discount - general 26,844,019$ 14.6% 25,087,883$ 14.6%Unfunded discount - quasi 1,709,200 0.9% 1,326,300 0.8%
Total unfunded discount 28,553,219 15.5% 26,414,183 15.4%Funded discount 4,659,170 2.5% 5,019,847 2.9%
Total 33,212,389$ 18.0% 31,434,030$ 18.3%
Gross tuition and fees 184,060,375$ 171,415,385$
2015 2014
2015 2014

ELON UNIVERSITY NOTES TO CONSOLIDATED FINANCIAL STATEMENTS
For the Years Ended May 31, 2015 and 2014
34
NOTE R: Gift Revenue
Major categories of gift revenue for the years ending May 31, 2015 and 2014, are as follows:
2015 2014Annual Funds 1,830,253$ 1,803,672$ Endowment and similar funds 4,915,199 4,251,756 Capital projects 18,639,326 4,721,706 Restricted to programs 2,380,003 2,683,377 Restricted to scholarships 744,851 742,989
Total 28,509,632$ 14,203,500$
NOTE S: Allocation of Expenses
Expenses which are not directly charged to specific programs are allocated to those programs based on estimates. The totals of these allocations are $40,866,770 and $36,841,490 for the years ended May 31, 2015 and 2014, respectively. Allocations of specific program expenses are as follows:
Program Physical Plant DepreciationDebt
Service/Other TotalInstruction 5,191,032$ 3,657,107$ 2,763,039$ 11,611,178$ Student services 2,533,201 1,577,483 847,521 4,958,205 Auxiliary 8,771,071 5,404,677 6,910,430 21,086,178 Academic support 638,623 397,053 437,673 1,473,349 Institutional support 318,358 185,807 1,233,695 1,737,860
Total 17,452,285$ 11,222,127$ 12,192,358$ 40,866,770$
Program Physical Plant DepreciationDebt
Service/Other TotalInstruction 5,107,795$ 3,549,420$ 2,018,768$ 10,675,983$ Student services 2,316,961 1,407,246 675,409 4,399,616 Auxiliary 8,042,454 4,683,618 5,237,045 17,963,117 Academic support 670,505 407,981 332,759 1,411,245 Institutional support 343,909 196,796 1,850,824 2,391,529
Total 16,481,624$ 10,245,061$ 10,114,805$ 36,841,490$
2015
2014

ELON UNIVERSITY NOTES TO CONSOLIDATED FINANCIAL STATEMENTS
For the Years Ended May 31, 2015 and 2014
35
NOTE T: Retirement Plan
The university has a defined contribution pension plan covering substantially all employees. The plan has no post service benefits or further liabilities beyond the periodic contribution for each participating employee. Total contributions by the university to this plan are $6,023,153 and $5,615,723 for the years ended May 31, 2015 and 2014, respectively.
NOTE U: Fund Raising
Fundraising costs are $5,102,198 and $4,639,961 for the years ended May 31, 2015 and 2014, respectively. These costs are included with other costs and are shown as institutional support on the Consolidated Statement of Activities.
NOTE V: Student Housing
CHF – Elon, LLC, a 501(c)(3) corporation, is a wholly-owned subsidiary of Collegiate Housing Foundation, another 501(c)(3) organization, and exists to provide student housing for Elon University students. CHF – Elon, LLC and Collegiate Housing Foundation are independent of Elon University.
In 2006, CHF – Elon, LLC, using the proceeds of a taxable bond issue with no recourse to Elon University, constructed a 516-bed student housing facility on 13.852 acres of land leased from the university. The lease, which expires in 2035, provides for annual distributions of net available cash flow as the lease payment to Elon University. Additionally, the university has contractually agreed to manage this housing project over the life of the ground lease.
CHF – Elon, LLC has a June 30 fiscal year end. As such, calculation of any ground lease payment due the university (net available cash flow) will be determined after the close of CHF – Elon, LLC’s fiscal year and is not earned by the university until that time. The university earned ground lease income of $467,709 and $698,796 during the years ended May 31, 2015 and May 31, 2014, respectively.
While fulfilling its management functions, the university will collect rental income and incur reimbursable expenses on behalf of CHF – Elon, LLC. Unsettled balances related to these transactions amounted to a net receivable of $224,578 and $454,326 at May 31, 2015 and May 31, 2014, respectively. These balances are classified as accounts receivable in the Consolidated Statements of Financial Position.
NOTE W: Income Taxes
The university is exempt from federal income taxes under Section 501(c)(3) of the Internal Revenue Code, except on net income derived from activities unrelated to its business purpose. The university believes that it has sufficient justification for any tax positions taken, including allocation of expenses to its unrelated business income and as such, does not have any uncertain tax positions that are material to the consolidated financial statements.
Generally, federal income tax returns are subject to examination by the Internal Revenue Service for three years after they are filed. As of the report date September 18, 2015, the university’s federal Exempt Organization Business Income Tax Return (Form 990-T) for fiscal years ending 2014, 2013 and 2012 remain subject to said examination.

ELON UNIVERSITY NOTES TO CONSOLIDATED FINANCIAL STATEMENTS
For the Years Ended May 31, 2015 and 2014
36
NOTE X: Supplemental Disclosures of Cash Flow Information
During the years ended May 31, 2015 and 2014, cash payments for interest on bonds and capital leases amounted to $3,404,349 and $2,691,912, respectively. These numbers are net of amounts capitalized as cost of construction.
The university received noncash contributions in stock and other assets totaling $7,293,862 and $1,688,609 during the years ended May 31, 2015 and 2014, respectively.
During the year ended May 31, 2015, the university engaged in a like-kind exchange transaction valued at $240,011. The cost of the property acquired and the cost of the property disposed have been excluded from the Consolidated Statements of Cash Flows. There were no like-kind property exchange transactions in the year ended May 31, 2014.
The university added distressed assets resulting in a noncash increase in accrued liabilities of $24,112 and $121,761 during the years ended May 31, 2015 and 2014, respectively.
Computers and related equipment costing $191,583 and $688,180 were acquired under the terms of capital leases during the years ended May 31, 2015 and 2014, respectively. The cost of property acquired as well as the initial lease obligations have been excluded from the Consolidated Statements of Cash Flows.
Buildings costing $1,523,512 and $0 were acquired under the terms of capital leases during the years ended May 31, 2015 and 2014, respectively. The cost of the buildings acquired as well as the initial lease obligations have been excluded from the Consolidated Statements of Cash Flows.
NOTE Y: Commitments and Contingencies
(1) Department of Education Funds
Funds received by Elon University from the United States Department of Education are subject to audit and retroactive adjustment by the Department of Education, which reserves the right to audit prior fiscal years. Such audits can result in the payment of additional funds to the Department of Education. Management believes that the result of any audit will not have a material effect on the university’s consolidated financial statements.
(2) Construction and Purchase Commitments
As of May 31, 2015 the university had outstanding contractual commitments and purchase orders totaling $18,637,998.
(3) Investment Commitments
Elon University is obligated under investment fund agreements to periodically advance additional funding for these investments up to specified levels. At May 31, 2015, the university had future commitments of $16,700.

ELON UNIVERSITY NOTES TO CONSOLIDATED FINANCIAL STATEMENTS
For the Years Ended May 31, 2015 and 2014
37
(4) Operating Leases
The university leases buildings, equipment and vehicles under operating leases that will expire in various years through 2030. Rent expense was $1,117,413 and $1,212,406 for the years ended May 31, 2015 and 2014, respectively. Commitments for minimum future rental payments for each of the next five years and thereafter are as follows:
Year Ending Amount2016 751,011$ 2017 554,161 2018 521,573 2019 512,371 2020 418,615 Thereafter 2,919,578
Total minimum future rental payments 5,677,309$
The university also leases apartments and houses for student housing under operating leases that will expire in 2016. Rent expense was $444,000 and $979,240 for the years ended May 31, 2015 and 2014, respectively. Rent expense is more than offset by housing revenue received from students living in these units. The university has a commitment of $36,000 for minimum future rental payments at May 31, 2015.
Several of the aforementioned leases contain renewal options for varying periods of time.
(5) Employment Related Commitments
Elon University has entered into employment related agreements with certain employees which obligate the university to potential future payments. At May 31, 2015, the maximum potential future payments under these agreements are $11,507,920.
(6) Contingencies
The university is involved in various legal actions occurring in the normal course of activities. While the final outcomes cannot be determined at this time, management is of the opinion that the resolution of these legal actions will not have a material effect on the university’s consolidated financial position.
NOTE Z: Subsequent Events
Subsequent events related to the consolidated financial statements have been evaluated through September 18, 2015, the date the consolidated financial statements were issued, and it has been determined that there are no events that require adjustment to, or disclosure in, these financial statements.

Grant Thornton LLP 201 S College Street, Suite 2500 Charlotte, NC 28244-0100
T 704.632.3500 F 704.334.7701 www.GrantThornton.com
Grant Thornton LLP U.S. member firm of Grant Thornton International Ltd
38
To the Board of Trustees of Elon University:
We have audited, in accordance with auditing standards generally accepted in the United States of America, the consolidated financial statements of Elon University as of and for the years ended May 31, 2015 and 2014, and our report thereon dated September 18, 2015, expressed an unmodified opinion on those financial statements. Our audit was performed for the purpose of forming an opinion on these consolidated financial statements as a whole.
The accompanying graphs of tuition and fees, room and board 2006-2015, student enrollment 2005-2014, student selectivity 2006-2015, endowment market value 2006-2015 and net assets and liabilities 2005-2014 are presented for purposes of additional analysis and are not a required part of the consolidated financial statements. Such information has not been subjected to the auditing procedures applied in the audit of the consolidated financial statements, and accordingly, we do not express an opinion or provide any assurance on it.
Charlotte, North Carolina September 18, 2015
INDEPENDENT CERTIFIED PUBLIC ACCOUNTANT’S LETTER

39
ADDITIONAL INFORMATION PROVIDED BY ELON UNIVERSITY

40
This graph was not subjected to auditing procedures.
Please see the independent auditor’s report on additional information at page 38.
ELON UNIVERSITY
TUITION AND FEES, ROOM AND BOARD2006–2015
$46,000
$42,000
$38,000
$34,000
$30,000
$26,000
$22,000
$18,000
$14,000
$10,000
$6,000
2006 2007 2008 2009 2010 2011 2012 2013 2014 2015
Tuition & fees only
Room & board only
Total tuition, fees, room & board
This graph shows the increase in tuition and fees, and room/board rates over a 10-year period.
FALL TUITION FEES ROOM BOARD TOTAL
2006 $20,171 $270 $3,320 $3,530 $27,291
2007 $21,886 $280 $3,536 $3,760 $29,462
2008 $23,746 $330 $3,766 $3,747 $31,589
2009 $25,159 $330 $3,992 $4,244 $33,725
2010 $26,480 $347 $4,192 $4,456 $35,475
2011 $27,534 $347 $4,440 $4,650 $36,971
2012 $28,633 $347 $4,690 $4,790 $38,460
2013 $29,750 $399 $4,953 $4,944 $40,046
2014 $30,848 $399 $5,231 $5,436 $41,914
2015 $31,773 $399 $5,399 $5,599 $43,170

40 41
ELON UNIVERSITY
STUDENT ENROLLMENT 2005–2014
6,500
6,000
5,500
5,000
4,500
4,000
2005 2006 2007 2008 2009 2010 2011 2012 2013 2014
This graph shows a 10-year trend of total enrollment on a head-count basis. Enrollment has been impacted by incoming freshman classes, continuing improved retention, and the addition of new graduate programs.
YEAR UNDERGRADUATE GRADUATE TOTAL
2005 4,702 254 4,956
2006 4,849 381 5,230
2007 4,939 517 5,456
2008 4,992 636 5,628
2009 4,995 671 5,666
2010 5,032 677 5,709
2011 5,225 691 5,916
2012 5,357 672 6,029
2013 5,599 706 6,305
2014 5,782 701 6,483
This graph was not subjected to auditing procedures.
Please see the independent auditor’s report on additional information at page 38.
6,483
5,456
5,628 5,6665,709
5,916 6,029
5,230
4,956
6,305

This graph was not subjected to auditing procedures.
Please see the independent auditor’s report on additional information at page 38.
42
2400
2000
1600
1200
800
400
0
2006 2007 2008 2009 2010 2011 2012 2013 2014 2015
ELON UNIVERSITY
STUDENT SELECTIVITY2006–2015
Reading & Math
Reading, Math & Writing
Measures of student quality have remained consistently high over the last 10 years. Applications for undergraduate admission exceeded 10,250 and the average SAT score is 1830.*
* Beginning in 2007, the SAT maximum score was raised from 1600 to 2400 because of the addition of a writing section. Each section has a maximum score of 800.
SAT
SCO
RES
YEAR APPLICATIONS SAT SCORES SAT SCORES
2006 9,204 1216
2007 9,380 1220 1830
2008 9,434 1225 1840
2009 9,041 1225 1843
2010 9,771 1218 1830
2011 9,079 1218 1832
2012 10,241 1229 1846
2013 9,949 1222 1831
2014 10,442 1222 1834
2015 10,257 1220 1830

ELON UNIVERSITY
ENDOWMENT MARKET VALUE (000)2006–2015
2006 2007 2008 2009 2010 2011 2012 2013 2014 2015
$66,951
$79,896
$86,530$82,145
$103,448
$123,656
$132,001
$159,009
$189,324
$215,380
The overall trend of the endowment market value has been positive over the past 10 years.
$60,000
$70,000
$80,000
$90,000
$100,000
$110,000
$120,000
$130,000
$140,000
$150,000
$160,000
$170,000
$180,000
$190,000
$200,000
$210,000
$220,000
This graph was not subjected to auditing procedures.
Please see the independent auditor’s report on additional information at page 38.
42 43

This graph was not subjected to auditing procedures.
Please see the independent auditor’s report on additional information at page 38.
44
ELON UNIVERSITY
NET ASSETS AND LIABILITIES (000) 2006–2015
The University has experienced a positive overall trend in net assets over the past 10 years which has allowed for the expansion of campus facilities and programs.
YEAR NET ASSETS DEBTALL OTHER LIABILITIES
2006 $210,408 $67,475 $22,573
2007 $244,249 $64,562 $25,735
2008 $260,879 $61,090 $24,499
2009 $257,314 $57,940 $28,952
2010 $285,253 $75,785 $32,342
2011 $320,022 $72,355 $36,506
2012 $325,321 $109,105 $48,320
2013 $371,602 $159,395 $48,058
2014 $421,701 $154,905 $50,979
2015 $475,971 $149,185 $48,012
THIS PAGE INTENTIONALLY LEFT BLANK.
$0
2006 2007 2008 2009 2010 2011 2012 2013 2014 2015
$50,000
$100,000
$150,000
$200,000
$250,000
$300,000
$350,000
$400,000
$450,000
$500,000
$550,000
Net Assets
Debt
All Other Liabilities

FINANCIAL & AUDIT REPORTMAY 31, 2015 & 2014