Embed Size (px)
Citation preview
Deutsche BankDeutsche Bank
Financial Data Supplement Q4 201716 March 2018
Deutsche Bank Q4 2017 Financial Data Supplement _________________________________________________________________________________________________________________________________________
1
Due to rounding, numbers presented throughout this document may not sum precisely to the totals we provide and percentages may not precisely reflect the absolute figures.
All segment figures reflect segment composition as of 31 December 2017.
Q4 2017 Financial Data Supplement
Deutsche Bank consolidatedFinancial summary 2Consolidated Statement of Income 3Net revenues 4
Segment detailCorporate & Investment Bank 5Private & Commercial Bank 6Deutsche Asset Management 7Non-Core Operations Unit 8Consolidation & Adjustments 9
Risk and capitalCredit risk 10Regulatory capital 11
Consolidated Balance SheetAssets 12Liabilities and total equity 13
Leverage ratio measures 14
Non-GAAP financial measures 15
Definition of certain financial measures 19
Footnotes 22
Deutsche Bank Q4 2017 Financial Data Supplement _________________________________________________________________________________________________________________________________________
FY 2015 Q1 2016 Q2 2016 Q3 2016 Q4 2016 FY 2016 Q1 2017 Q2 2017 Q3 2017 Q4 2017 FY 2017Q4 2017 vs.
Q4 2016Q4 2017 vs.
Q3 2017FY 2017 vs.
FY 2016Key financial information
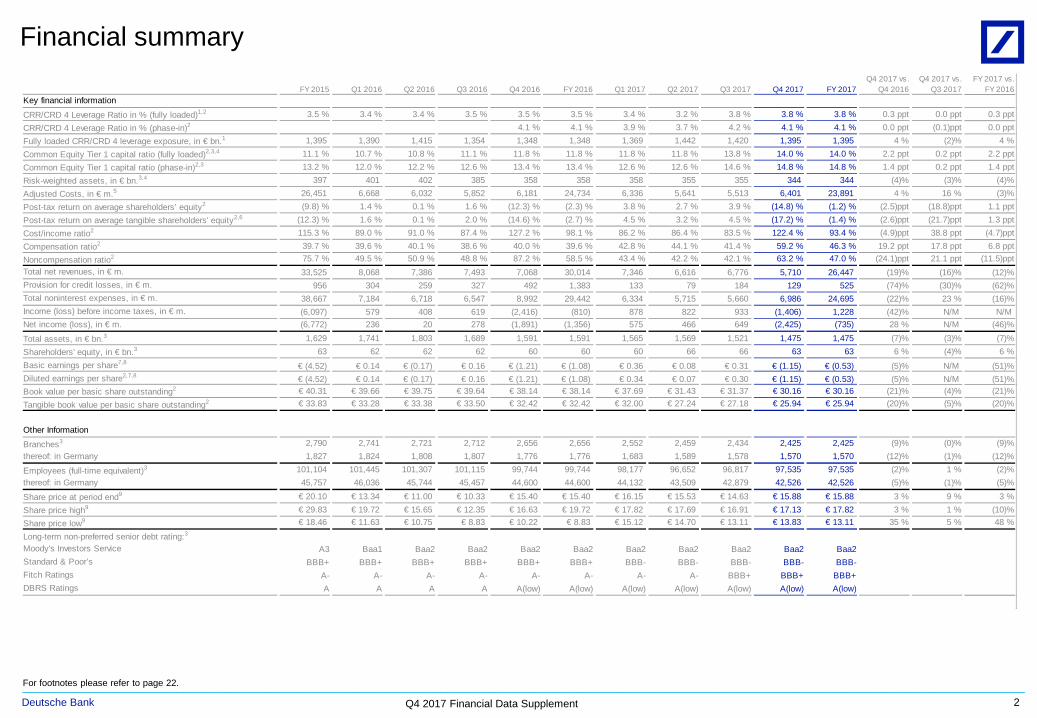
CRR/CRD 4 Leverage Ratio in % (fully loaded)1,2 3.5 % 3.4 % 3.4 % 3.5 % 3.5 % 3.5 % 3.4 % 3.2 % 3.8 % 3.8 % 3.8 % 0.3 ppt 0.0 ppt 0.3 pptCRR/CRD 4 Leverage Ratio in % (phase-in)2 4.1 % 4.1 % 3.9 % 3.7 % 4.2 % 4.1 % 4.1 % 0.0 ppt (0.1)ppt 0.0 pptFully loaded CRR/CRD 4 leverage exposure, in € bn.1 1,395 1,390 1,415 1,354 1,348 1,348 1,369 1,442 1,420 1,395 1,395 4 % (2)% 4 %Common Equity Tier 1 capital ratio (fully loaded)2,3,4 11.1 % 10.7 % 10.8 % 11.1 % 11.8 % 11.8 % 11.8 % 11.8 % 13.8 % 14.0 % 14.0 % 2.2 ppt 0.2 ppt 2.2 pptCommon Equity Tier 1 capital ratio (phase-in)2,3 13.2 % 12.0 % 12.2 % 12.6 % 13.4 % 13.4 % 12.6 % 12.6 % 14.6 % 14.8 % 14.8 % 1.4 ppt 0.2 ppt 1.4 pptRisk-weighted assets, in € bn.3,4 397 401 402 385 358 358 358 355 355 344 344 (4)% (3)% (4)%Adjusted Costs, in € m.5 26,451 6,668 6,032 5,852 6,181 24,734 6,336 5,641 5,513 6,401 23,891 4 % 16 % (3)%Post-tax return on average shareholders’ equity2 (9.8) % 1.4 % 0.1 % 1.6 % (12.3) % (2.3) % 3.8 % 2.7 % 3.9 % (14.8) % (1.2) % (2.5)ppt (18.8)ppt 1.1 pptPost-tax return on average tangible shareholders' equity2,6 (12.3) % 1.6 % 0.1 % 2.0 % (14.6) % (2.7) % 4.5 % 3.2 % 4.5 % (17.2) % (1.4) % (2.6)ppt (21.7)ppt 1.3 pptCost/income ratio2 115.3 % 89.0 % 91.0 % 87.4 % 127.2 % 98.1 % 86.2 % 86.4 % 83.5 % 122.4 % 93.4 % (4.9)ppt 38.8 ppt (4.7)pptCompensation ratio2 39.7 % 39.6 % 40.1 % 38.6 % 40.0 % 39.6 % 42.8 % 44.1 % 41.4 % 59.2 % 46.3 % 19.2 ppt 17.8 ppt 6.8 pptNoncompensation ratio2 75.7 % 49.5 % 50.9 % 48.8 % 87.2 % 58.5 % 43.4 % 42.2 % 42.1 % 63.2 % 47.0 % (24.1)ppt 21.1 ppt (11.5)pptTotal net revenues, in € m. 33,525 8,068 7,386 7,493 7,068 30,014 7,346 6,616 6,776 5,710 26,447 (19)% (16)% (12)%Provision for credit losses, in € m. 956 304 259 327 492 1,383 133 79 184 129 525 (74)% (30)% (62)%Total noninterest expenses, in € m. 38,667 7,184 6,718 6,547 8,992 29,442 6,334 5,715 5,660 6,986 24,695 (22)% 23 % (16)%Income (loss) before income taxes, in € m. (6,097) 579 408 619 (2,416) (810) 878 822 933 (1,406) 1,228 (42)% N/M N/M Net income (loss), in € m. (6,772) 236 20 278 (1,891) (1,356) 575 466 649 (2,425) (735) 28 % N/M (46)%
Total assets, in € bn.3 1,629 1,741 1,803 1,689 1,591 1,591 1,565 1,569 1,521 1,475 1,475 (7)% (3)% (7)%Shareholders' equity, in € bn.3 63 62 62 62 60 60 60 66 66 63 63 6 % (4)% 6 %Basic earnings per share7,8 € (4.52) € 0.14 € (0.17) € 0.16 € (1.21) € (1.08) € 0.36 € 0.08 € 0.31 € (1.15) € (0.53) (5)% N/M (51)%Diluted earnings per share2,7,8 € (4.52) € 0.14 € (0.17) € 0.16 € (1.21) € (1.08) € 0.34 € 0.07 € 0.30 € (1.15) € (0.53) (5)% N/M (51)%Book value per basic share outstanding2 € 40.31 € 39.66 € 39.75 € 39.64 € 38.14 € 38.14 € 37.69 € 31.43 € 31.37 € 30.16 € 30.16 (21)% (4)% (21)%Tangible book value per basic share outstanding2 € 33.83 € 33.28 € 33.38 € 33.50 € 32.42 € 32.42 € 32.00 € 27.24 € 27.18 € 25.94 € 25.94 (20)% (5)% (20)%
Other Information
Branches3 2,790 2,741 2,721 2,712 2,656 2,656 2,552 2,459 2,434 2,425 2,425 (9)% (0)% (9)%thereof: in Germany 1,827 1,824 1,808 1,807 1,776 1,776 1,683 1,589 1,578 1,570 1,570 (12)% (1)% (12)%
Employees (full-time equivalent)3 101,104 101,445 101,307 101,115 99,744 99,744 98,177 96,652 96,817 97,535 97,535 (2)% 1 % (2)%thereof: in Germany 45,757 46,036 45,744 45,457 44,600 44,600 44,132 43,509 42,879 42,526 42,526 (5)% (1)% (5)%
Share price at period end9 € 20.10 € 13.34 € 11.00 € 10.33 € 15.40 € 15.40 € 16.15 € 15.53 € 14.63 € 15.88 € 15.88 3 % 9 % 3 %Share price high9 € 29.83 € 19.72 € 15.65 € 12.35 € 16.63 € 19.72 € 17.82 € 17.69 € 16.91 € 17.13 € 17.82 3 % 1 % (10)%Share price low9 € 18.46 € 11.63 € 10.75 € 8.83 € 10.22 € 8.83 € 15.12 € 14.70 € 13.11 € 13.83 € 13.11 35 % 5 % 48 %
Long-term non-preferred senior debt rating:3
Moody's Investors Service A3 Baa1 Baa2 Baa2 Baa2 Baa2 Baa2 Baa2 Baa2 Baa2 Baa2Standard & Poor’s BBB+ BBB+ BBB+ BBB+ BBB+ BBB+ BBB- BBB- BBB- BBB- BBB-Fitch Ratings A- A- A- A- A- A- A- A- BBB+ BBB+ BBB+DBRS Ratings A A A A A(low) A(low) A(low) A(low) A(low) A(low) A(low)
Financial summary
For footnotes please refer to page 22.
2
Deutsche Bank Q4 2017 Financial Data Supplement _________________________________________________________________________________________________________________________________________
(In € m.) FY 2015 Q1 2016 Q2 2016 Q3 2016 Q4 2016 FY 2016 Q1 2017 Q2 2017 Q3 2017 Q4 2017 FY 2017Q4 2017 vs.
Q4 2016Q4 2017 vs.
Q3 2017FY 2017 vs.
FY 2016
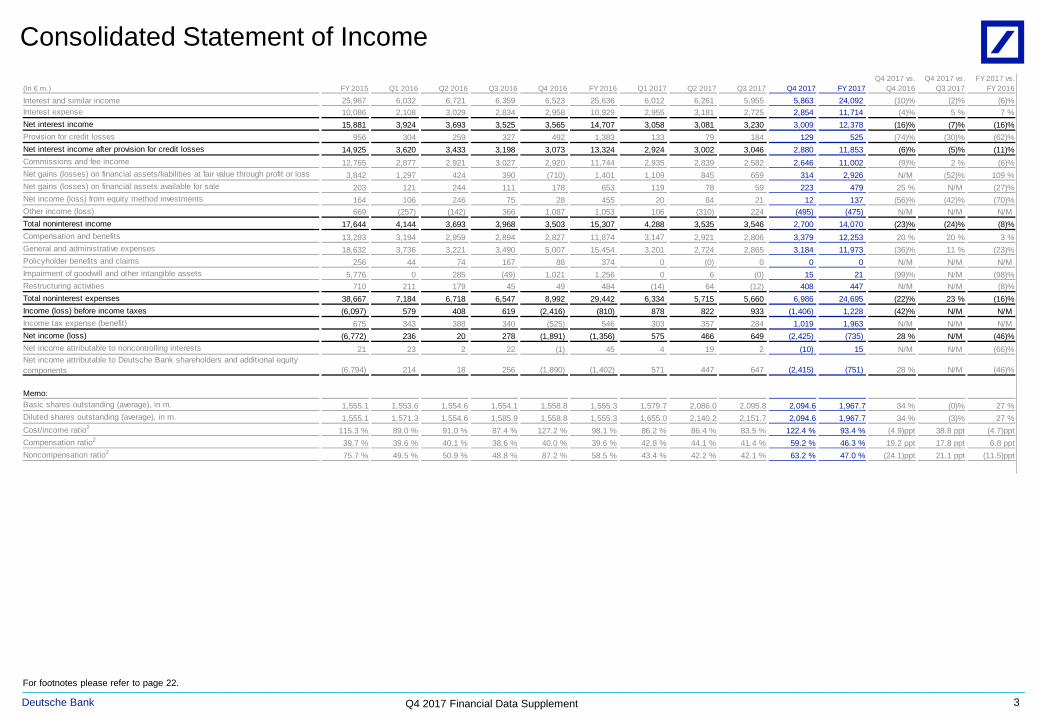
Interest and similar income 25,967 6,032 6,721 6,359 6,523 25,636 6,012 6,261 5,955 5,863 24,092 (10)% (2)% (6)%Interest expense 10,086 2,108 3,029 2,834 2,958 10,929 2,955 3,181 2,725 2,854 11,714 (4)% 5 % 7 %Net interest income 15,881 3,924 3,693 3,525 3,565 14,707 3,058 3,081 3,230 3,009 12,378 (16)% (7)% (16)%Provision for credit losses 956 304 259 327 492 1,383 133 79 184 129 525 (74)% (30)% (62)%Net interest income after provision for credit losses 14,925 3,620 3,433 3,198 3,073 13,324 2,924 3,002 3,046 2,880 11,853 (6)% (5)% (11)%Commissions and fee income 12,765 2,877 2,921 3,027 2,920 11,744 2,935 2,839 2,582 2,646 11,002 (9)% 2 % (6)%Net gains (losses) on financial assets/liabilities at fair value through profit or loss 3,842 1,297 424 390 (710) 1,401 1,109 845 659 314 2,926 N/M (52)% 109 %Net gains (losses) on financial assets available for sale 203 121 244 111 178 653 119 78 59 223 479 25 % N/M (27)%Net income (loss) from equity method investments 164 106 246 75 28 455 20 84 21 12 137 (56)% (42)% (70)%Other income (loss) 669 (257) (142) 366 1,087 1,053 106 (310) 224 (495) (475) N/M N/M N/M Total noninterest income 17,644 4,144 3,693 3,968 3,503 15,307 4,288 3,535 3,546 2,700 14,070 (23)% (24)% (8)%Compensation and benefits 13,293 3,194 2,959 2,894 2,827 11,874 3,147 2,921 2,806 3,379 12,253 20 % 20 % 3 %General and administrative expenses 18,632 3,736 3,221 3,490 5,007 15,454 3,201 2,724 2,865 3,184 11,973 (36)% 11 % (23)%Policyholder benefits and claims 256 44 74 167 88 374 0 (0) 0 0 0 N/M N/M N/M Impairment of goodwill and other intangible assets 5,776 0 285 (49) 1,021 1,256 0 6 (0) 15 21 (99)% N/M (98)%Restructuring activities 710 211 179 45 49 484 (14) 64 (12) 408 447 N/M N/M (8)%Total noninterest expenses 38,667 7,184 6,718 6,547 8,992 29,442 6,334 5,715 5,660 6,986 24,695 (22)% 23 % (16)%Income (loss) before income taxes (6,097) 579 408 619 (2,416) (810) 878 822 933 (1,406) 1,228 (42)% N/M N/M Income tax expense (benefit) 675 343 388 340 (525) 546 303 357 284 1,019 1,963 N/M N/M N/M Net income (loss) (6,772) 236 20 278 (1,891) (1,356) 575 466 649 (2,425) (735) 28 % N/M (46)%Net income attributable to noncontrolling interests 21 23 2 22 (1) 45 4 19 2 (10) 15 N/M N/M (66)%Net income attributable to Deutsche Bank shareholders and additional equity components (6,794) 214 18 256 (1,890) (1,402) 571 447 647 (2,415) (751) 28 % N/M (46)%
Memo:Basic shares outstanding (average), in m. 1,555.1 1,553.6 1,554.6 1,554.1 1,558.8 1,555.3 1,579.7 2,086.0 2,095.8 2,094.6 1,967.7 34 % (0)% 27 %Diluted shares outstanding (average), in m. 1,555.1 1,571.3 1,554.6 1,585.9 1,558.8 1,555.3 1,655.0 2,140.2 2,151.7 2,094.6 1,967.7 34 % (3)% 27 %Cost/income ratio2 115.3 % 89.0 % 91.0 % 87.4 % 127.2 % 98.1 % 86.2 % 86.4 % 83.5 % 122.4 % 93.4 % (4.9)ppt 38.8 ppt (4.7)pptCompensation ratio2 39.7 % 39.6 % 40.1 % 38.6 % 40.0 % 39.6 % 42.8 % 44.1 % 41.4 % 59.2 % 46.3 % 19.2 ppt 17.8 ppt 6.8 pptNoncompensation ratio2 75.7 % 49.5 % 50.9 % 48.8 % 87.2 % 58.5 % 43.4 % 42.2 % 42.1 % 63.2 % 47.0 % (24.1)ppt 21.1 ppt (11.5)ppt
Consolidated Statement of Income
3
For footnotes please refer to page 22.
Deutsche Bank Q4 2017 Financial Data Supplement _________________________________________________________________________________________________________________________________________
(In € m.) FY 2015 Q1 2016 Q2 2016 Q3 2016 Q4 2016 FY 2016 Q1 2017 Q2 2017 Q3 2017 Q4 2017 FY 2017Q4 2017 vs.
Q4 2016Q4 2017 vs.
Q3 2017FY 2017 vs.
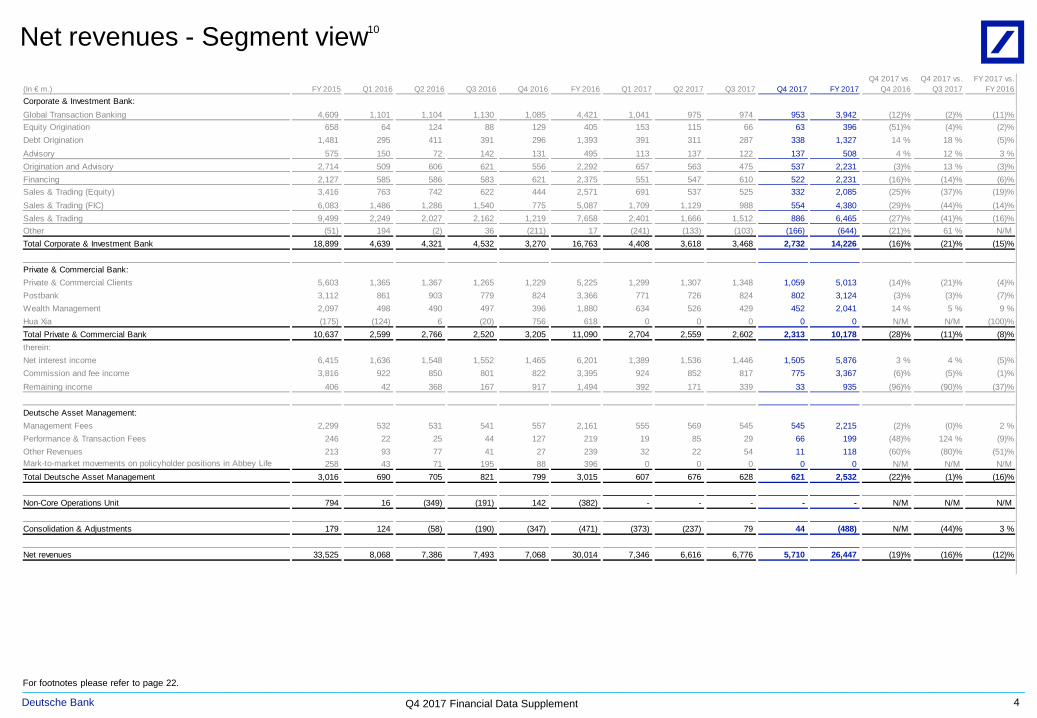
FY 2016Corporate & Investment Bank:Global Transaction Banking 4,609 1,101 1,104 1,130 1,085 4,421 1,041 975 974 953 3,942 (12)% (2)% (11)%Equity Origination 658 64 124 88 129 405 153 115 66 63 396 (51)% (4)% (2)%Debt Origination 1,481 295 411 391 296 1,393 391 311 287 338 1,327 14 % 18 % (5)%Advisory 575 150 72 142 131 495 113 137 122 137 508 4 % 12 % 3 %Origination and Advisory 2,714 509 606 621 556 2,292 657 563 475 537 2,231 (3)% 13 % (3)%Financing 2,127 585 586 583 621 2,375 551 547 610 522 2,231 (16)% (14)% (6)%Sales & Trading (Equity) 3,416 763 742 622 444 2,571 691 537 525 332 2,085 (25)% (37)% (19)%Sales & Trading (FIC) 6,083 1,486 1,286 1,540 775 5,087 1,709 1,129 988 554 4,380 (29)% (44)% (14)%Sales & Trading 9,499 2,249 2,027 2,162 1,219 7,658 2,401 1,666 1,512 886 6,465 (27)% (41)% (16)%Other (51) 194 (2) 36 (211) 17 (241) (133) (103) (166) (644) (21)% 61 % N/M Total Corporate & Investment Bank 18,899 4,639 4,321 4,532 3,270 16,763 4,408 3,618 3,468 2,732 14,226 (16)% (21)% (15)%
Private & Commercial Bank:Private & Commercial Clients 5,603 1,365 1,367 1,265 1,229 5,225 1,299 1,307 1,348 1,059 5,013 (14)% (21)% (4)%Postbank 3,112 861 903 779 824 3,366 771 726 824 802 3,124 (3)% (3)% (7)%Wealth Management 2,097 498 490 497 396 1,880 634 526 429 452 2,041 14 % 5 % 9 %Hua Xia (175) (124) 6 (20) 756 618 0 0 0 0 0 N/M N/M (100)%Total Private & Commercial Bank 10,637 2,599 2,766 2,520 3,205 11,090 2,704 2,559 2,602 2,313 10,178 (28)% (11)% (8)%therein:Net interest income 6,415 1,636 1,548 1,552 1,465 6,201 1,389 1,536 1,446 1,505 5,876 3 % 4 % (5)%Commission and fee income 3,816 922 850 801 822 3,395 924 852 817 775 3,367 (6)% (5)% (1)%Remaining income 406 42 368 167 917 1,494 392 171 339 33 935 (96)% (90)% (37)%
Deutsche Asset Management:Management Fees 2,299 532 531 541 557 2,161 555 569 545 545 2,215 (2)% (0)% 2 %Performance & Transaction Fees 246 22 25 44 127 219 19 85 29 66 199 (48)% 124 % (9)%Other Revenues 213 93 77 41 27 239 32 22 54 11 118 (60)% (80)% (51)%Mark-to-market movements on policyholder positions in Abbey Life 258 43 71 195 88 396 0 0 0 0 0 N/M N/M N/M Total Deutsche Asset Management 3,016 690 705 821 799 3,015 607 676 628 621 2,532 (22)% (1)% (16)%
Non-Core Operations Unit 794 16 (349) (191) 142 (382) - - - - - N/M N/M N/M
Consolidation & Adjustments 179 124 (58) (190) (347) (471) (373) (237) 79 44 (488) N/M (44)% 3 %
Net revenues 33,525 8,068 7,386 7,493 7,068 30,014 7,346 6,616 6,776 5,710 26,447 (19)% (16)% (12)%
Net revenues - Segment view
4
10
For footnotes please refer to page 22.
Deutsche Bank Q4 2017 Financial Data Supplement _________________________________________________________________________________________________________________________________________
(In € m., unless stated otherwise) FY 2015 Q1 2016 Q2 2016 Q3 2016 Q4 2016 FY 2016 Q1 2017 Q2 2017 Q3 2017 Q4 2017 FY 2017Q4 2017 vs.
Q4 2016Q4 2017 vs.
Q3 2017FY 2017 vs.
FY 2016
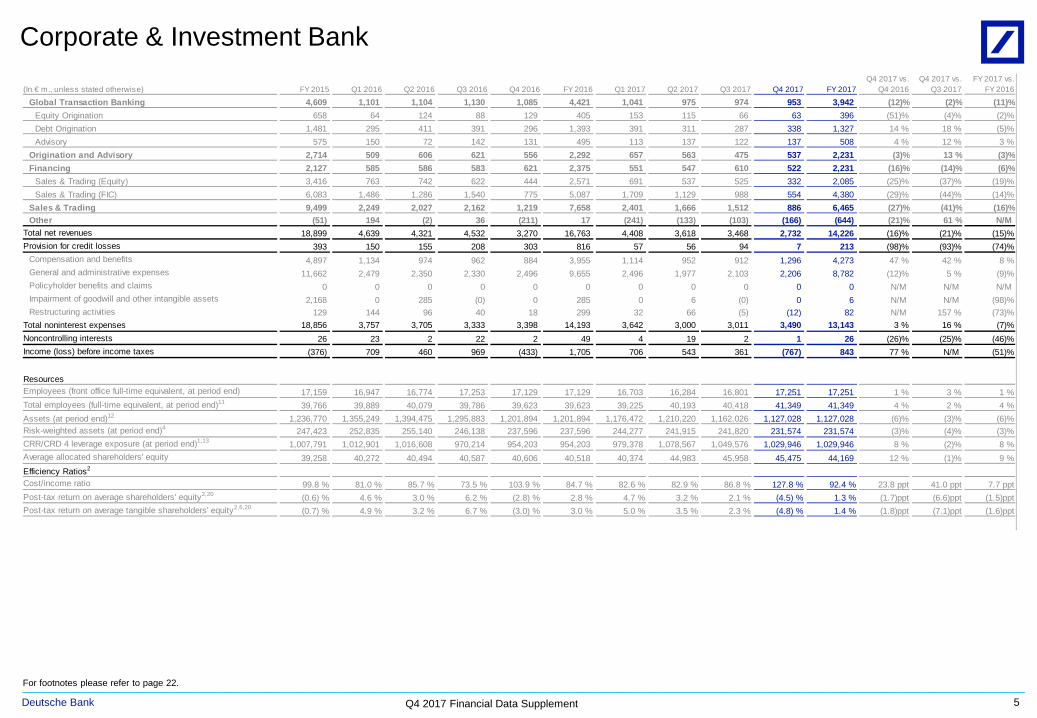
Global Transaction Banking 4,609 1,101 1,104 1,130 1,085 4,421 1,041 975 974 953 3,942 (12)% (2)% (11)%Equity Origination 658 64 124 88 129 405 153 115 66 63 396 (51)% (4)% (2)%Debt Origination 1,481 295 411 391 296 1,393 391 311 287 338 1,327 14 % 18 % (5)%Advisory 575 150 72 142 131 495 113 137 122 137 508 4 % 12 % 3 %
Origination and Advisory 2,714 509 606 621 556 2,292 657 563 475 537 2,231 (3)% 13 % (3)%Financing 2,127 585 586 583 621 2,375 551 547 610 522 2,231 (16)% (14)% (6)%
Sales & Trading (Equity) 3,416 763 742 622 444 2,571 691 537 525 332 2,085 (25)% (37)% (19)%Sales & Trading (FIC) 6,083 1,486 1,286 1,540 775 5,087 1,709 1,129 988 554 4,380 (29)% (44)% (14)%
Sales & Trading 9,499 2,249 2,027 2,162 1,219 7,658 2,401 1,666 1,512 886 6,465 (27)% (41)% (16)%Other (51) 194 (2) 36 (211) 17 (241) (133) (103) (166) (644) (21)% 61 % N/M
Total net revenues 18,899 4,639 4,321 4,532 3,270 16,763 4,408 3,618 3,468 2,732 14,226 (16)% (21)% (15)%Provision for credit losses 393 150 155 208 303 816 57 56 94 7 213 (98)% (93)% (74)%
Compensation and benefits 4,897 1,134 974 962 884 3,955 1,114 952 912 1,296 4,273 47 % 42 % 8 %General and administrative expenses 11,662 2,479 2,350 2,330 2,496 9,655 2,496 1,977 2,103 2,206 8,782 (12)% 5 % (9)%Policyholder benefits and claims 0 0 0 0 0 0 0 0 0 0 0 N/M N/M N/M Impairment of goodwill and other intangible assets 2,168 0 285 (0) 0 285 0 6 (0) 0 6 N/M N/M (98)%Restructuring activities 129 144 96 40 18 299 32 66 (5) (12) 82 N/M 157 % (73)%
Total noninterest expenses 18,856 3,757 3,705 3,333 3,398 14,193 3,642 3,000 3,011 3,490 13,143 3 % 16 % (7)%Noncontrolling interests 26 23 2 22 2 49 4 19 2 1 26 (26)% (25)% (46)%Income (loss) before income taxes (376) 709 460 969 (433) 1,705 706 543 361 (767) 843 77 % N/M (51)%
ResourcesEmployees (front office full-time equivalent, at period end) 17,159 16,947 16,774 17,253 17,129 17,129 16,703 16,284 16,801 17,251 17,251 1 % 3 % 1 %Total employees (full-time equivalent, at period end)11 39,766 39,889 40,079 39,786 39,623 39,623 39,225 40,193 40,418 41,349 41,349 4 % 2 % 4 %Assets (at period end)12 1,236,770 1,355,249 1,394,475 1,295,883 1,201,894 1,201,894 1,176,472 1,210,220 1,162,026 1,127,028 1,127,028 (6)% (3)% (6)%Risk-weighted assets (at period end)4 247,423 252,835 255,140 246,138 237,596 237,596 244,277 241,915 241,820 231,574 231,574 (3)% (4)% (3)%CRR/CRD 4 leverage exposure (at period end)1,13 1,007,791 1,012,901 1,016,608 970,214 954,203 954,203 979,378 1,078,567 1,049,576 1,029,946 1,029,946 8 % (2)% 8 %Average allocated shareholders' equity 39,258 40,272 40,494 40,587 40,606 40,518 40,374 44,983 45,958 45,475 44,169 12 % (1)% 9 %Efficiency Ratios2
Cost/income ratio 99.8 % 81.0 % 85.7 % 73.5 % 103.9 % 84.7 % 82.6 % 82.9 % 86.8 % 127.8 % 92.4 % 23.8 ppt 41.0 ppt 7.7 pptPost-tax return on average shareholders' equity2,20 (0.6) % 4.6 % 3.0 % 6.2 % (2.8) % 2.8 % 4.7 % 3.2 % 2.1 % (4.5) % 1.3 % (1.7)ppt (6.6)ppt (1.5)pptPost-tax return on average tangible shareholders' equity2,6,20 (0.7) % 4.9 % 3.2 % 6.7 % (3.0) % 3.0 % 5.0 % 3.5 % 2.3 % (4.8) % 1.4 % (1.8)ppt (7.1)ppt (1.6)ppt
Corporate & Investment Bank
5
For footnotes please refer to page 22.
Deutsche Bank Q4 2017 Financial Data Supplement _________________________________________________________________________________________________________________________________________
(In € m., unless stated otherwise) FY 2015 Q1 2016 Q2 2016 Q3 2016 Q4 2016 FY 2016 Q1 2017 Q2 2017 Q3 2017 Q4 2017 FY 2017Q4 2017 vs.
Q4 2016Q4 2017 vs.
Q3 2017FY 2017 vs.
FY 2016
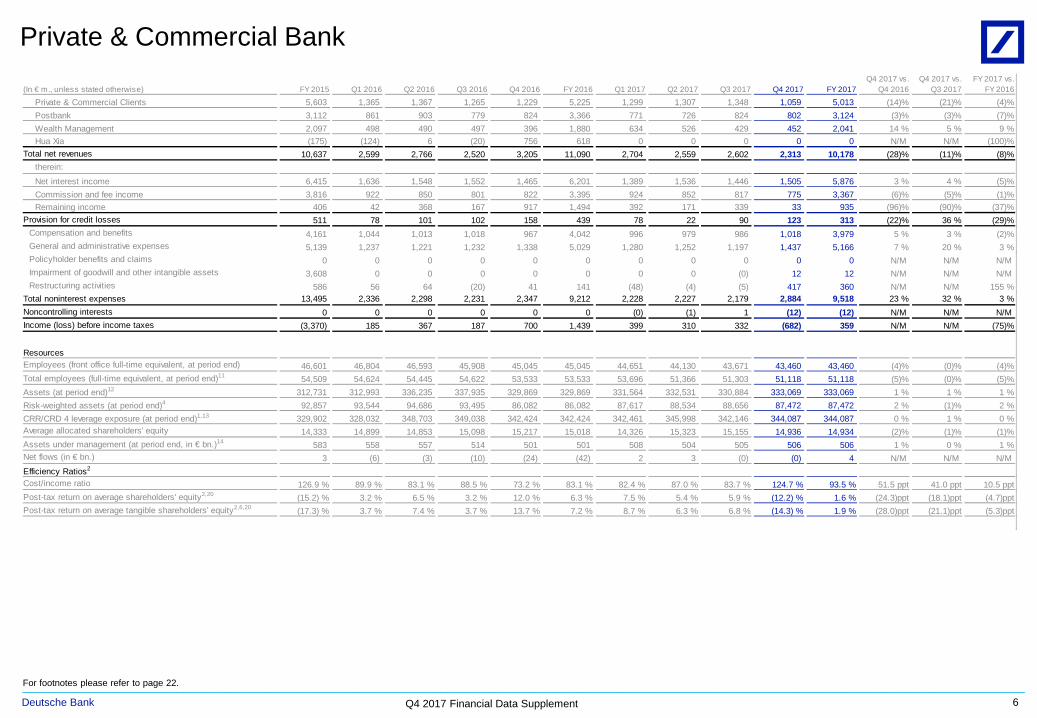
Private & Commercial Clients 5,603 1,365 1,367 1,265 1,229 5,225 1,299 1,307 1,348 1,059 5,013 (14)% (21)% (4)%Postbank 3,112 861 903 779 824 3,366 771 726 824 802 3,124 (3)% (3)% (7)%Wealth Management 2,097 498 490 497 396 1,880 634 526 429 452 2,041 14 % 5 % 9 %Hua Xia (175) (124) 6 (20) 756 618 0 0 0 0 0 N/M N/M (100)%
Total net revenues 10,637 2,599 2,766 2,520 3,205 11,090 2,704 2,559 2,602 2,313 10,178 (28)% (11)% (8)%therein:
Net interest income 6,415 1,636 1,548 1,552 1,465 6,201 1,389 1,536 1,446 1,505 5,876 3 % 4 % (5)%Commission and fee income 3,816 922 850 801 822 3,395 924 852 817 775 3,367 (6)% (5)% (1)%Remaining income 406 42 368 167 917 1,494 392 171 339 33 935 (96)% (90)% (37)%
Provision for credit losses 511 78 101 102 158 439 78 22 90 123 313 (22)% 36 % (29)%Compensation and benefits 4,161 1,044 1,013 1,018 967 4,042 996 979 986 1,018 3,979 5 % 3 % (2)%General and administrative expenses 5,139 1,237 1,221 1,232 1,338 5,029 1,280 1,252 1,197 1,437 5,166 7 % 20 % 3 %Policyholder benefits and claims 0 0 0 0 0 0 0 0 0 0 0 N/M N/M N/M Impairment of goodwill and other intangible assets 3,608 0 0 0 0 0 0 0 (0) 12 12 N/M N/M N/M Restructuring activities 586 56 64 (20) 41 141 (48) (4) (5) 417 360 N/M N/M 155 %
Total noninterest expenses 13,495 2,336 2,298 2,231 2,347 9,212 2,228 2,227 2,179 2,884 9,518 23 % 32 % 3 %Noncontrolling interests 0 0 0 0 0 0 (0) (1) 1 (12) (12) N/M N/M N/M Income (loss) before income taxes (3,370) 185 367 187 700 1,439 399 310 332 (682) 359 N/M N/M (75)%
ResourcesEmployees (front office full-time equivalent, at period end) 46,601 46,804 46,593 45,908 45,045 45,045 44,651 44,130 43,671 43,460 43,460 (4)% (0)% (4)%Total employees (full-time equivalent, at period end)11 54,509 54,624 54,445 54,622 53,533 53,533 53,696 51,366 51,303 51,118 51,118 (5)% (0)% (5)%Assets (at period end)12 312,731 312,993 336,235 337,935 329,869 329,869 331,564 332,531 330,884 333,069 333,069 1 % 1 % 1 %Risk-weighted assets (at period end)4 92,857 93,544 94,686 93,495 86,082 86,082 87,617 88,534 88,656 87,472 87,472 2 % (1)% 2 %CRR/CRD 4 leverage exposure (at period end)1,13 329,902 328,032 348,703 349,038 342,424 342,424 342,461 345,998 342,146 344,087 344,087 0 % 1 % 0 %Average allocated shareholders' equity 14,333 14,899 14,853 15,098 15,217 15,018 14,326 15,323 15,155 14,936 14,934 (2)% (1)% (1)%Assets under management (at period end, in € bn.)14 583 558 557 514 501 501 508 504 505 506 506 1 % 0 % 1 %Net flows (in € bn.) 3 (6) (3) (10) (24) (42) 2 3 (0) (0) 4 N/M N/M N/M Efficiency Ratios2
Cost/income ratio 126.9 % 89.9 % 83.1 % 88.5 % 73.2 % 83.1 % 82.4 % 87.0 % 83.7 % 124.7 % 93.5 % 51.5 ppt 41.0 ppt 10.5 pptPost-tax return on average shareholders' equity2,20 (15.2) % 3.2 % 6.5 % 3.2 % 12.0 % 6.3 % 7.5 % 5.4 % 5.9 % (12.2) % 1.6 % (24.3)ppt (18.1)ppt (4.7)pptPost-tax return on average tangible shareholders' equity2,6,20 (17.3) % 3.7 % 7.4 % 3.7 % 13.7 % 7.2 % 8.7 % 6.3 % 6.8 % (14.3) % 1.9 % (28.0)ppt (21.1)ppt (5.3)ppt
Private & Commercial Bank
6
For footnotes please refer to page 22.
Deutsche Bank Q4 2017 Financial Data Supplement _________________________________________________________________________________________________________________________________________
(In € m., unless stated otherwise) FY 2015 Q1 2016 Q2 2016 Q3 2016 Q4 2016 FY 2016 Q1 2017 Q2 2017 Q3 2017 Q4 2017 FY 2017Q4 2017 vs.
Q4 2016Q4 2017 vs.
Q3 2017FY 2017 vs.
FY 2016
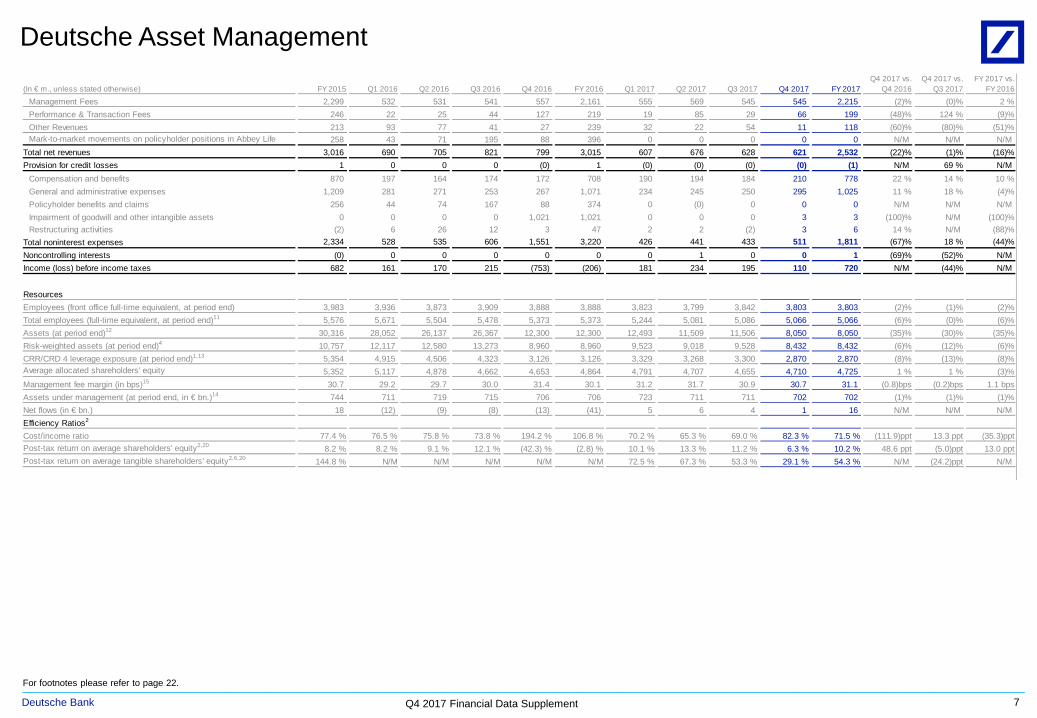
Management Fees 2,299 532 531 541 557 2,161 555 569 545 545 2,215 (2)% (0)% 2 %Performance & Transaction Fees 246 22 25 44 127 219 19 85 29 66 199 (48)% 124 % (9)%Other Revenues 213 93 77 41 27 239 32 22 54 11 118 (60)% (80)% (51)%Mark-to-market movements on policyholder positions in Abbey Life 258 43 71 195 88 396 0 0 0 0 0 N/M N/M N/M
Total net revenues 3,016 690 705 821 799 3,015 607 676 628 621 2,532 (22)% (1)% (16)%Provision for credit losses 1 0 0 0 (0) 1 (0) (0) (0) (0) (1) N/M 69 % N/M
Compensation and benefits 870 197 164 174 172 708 190 194 184 210 778 22 % 14 % 10 %General and administrative expenses 1,209 281 271 253 267 1,071 234 245 250 295 1,025 11 % 18 % (4)%Policyholder benefits and claims 256 44 74 167 88 374 0 (0) 0 0 0 N/M N/M N/M Impairment of goodwill and other intangible assets 0 0 0 0 1,021 1,021 0 0 0 3 3 (100)% N/M (100)%Restructuring activities (2) 6 26 12 3 47 2 2 (2) 3 6 14 % N/M (88)%
Total noninterest expenses 2,334 528 535 606 1,551 3,220 426 441 433 511 1,811 (67)% 18 % (44)%Noncontrolling interests (0) 0 0 0 0 0 0 1 0 0 1 (69)% (52)% N/M Income (loss) before income taxes 682 161 170 215 (753) (206) 181 234 195 110 720 N/M (44)% N/M
ResourcesEmployees (front office full-time equivalent, at period end) 3,983 3,936 3,873 3,909 3,888 3,888 3,823 3,799 3,842 3,803 3,803 (2)% (1)% (2)%Total employees (full-time equivalent, at period end)11 5,576 5,671 5,504 5,478 5,373 5,373 5,244 5,081 5,086 5,066 5,066 (6)% (0)% (6)%Assets (at period end)12 30,316 28,052 26,137 26,367 12,300 12,300 12,493 11,509 11,506 8,050 8,050 (35)% (30)% (35)%Risk-weighted assets (at period end)4 10,757 12,117 12,580 13,273 8,960 8,960 9,523 9,018 9,528 8,432 8,432 (6)% (12)% (6)%CRR/CRD 4 leverage exposure (at period end)1,13 5,354 4,915 4,506 4,323 3,126 3,126 3,329 3,268 3,300 2,870 2,870 (8)% (13)% (8)%Average allocated shareholders' equity 5,352 5,117 4,878 4,662 4,653 4,864 4,791 4,707 4,655 4,710 4,725 1 % 1 % (3)%Management fee margin (in bps)15 30.7 29.2 29.7 30.0 31.4 30.1 31.2 31.7 30.9 30.7 31.1 (0.8)bps (0.2)bps 1.1 bpsAssets under management (at period end, in € bn.)14 744 711 719 715 706 706 723 711 711 702 702 (1)% (1)% (1)%Net flows (in € bn.) 18 (12) (9) (8) (13) (41) 5 6 4 1 16 N/M N/M N/M Efficiency Ratios2
Cost/income ratio 77.4 % 76.5 % 75.8 % 73.8 % 194.2 % 106.8 % 70.2 % 65.3 % 69.0 % 82.3 % 71.5 % (111.9)ppt 13.3 ppt (35.3)pptPost-tax return on average shareholders' equity2,20 8.2 % 8.2 % 9.1 % 12.1 % (42.3) % (2.8) % 10.1 % 13.3 % 11.2 % 6.3 % 10.2 % 48.6 ppt (5.0)ppt 13.0 pptPost-tax return on average tangible shareholders' equity2,6,20 144.8 % N/M N/M N/M N/M N/M 72.5 % 67.3 % 53.3 % 29.1 % 54.3 % N/M (24.2)ppt N/M
Deutsche Asset Management
7
For footnotes please refer to page 22.
Deutsche Bank Q4 2017 Financial Data Supplement _________________________________________________________________________________________________________________________________________
(In € m., unless stated otherwise) FY 2015 Q1 2016 Q2 2016 Q3 2016 Q4 2016 FY 2016 Q1 2017 Q2 2017 Q3 2017 Q4 2017 FY 2017Q4 2017 vs.
Q4 2016Q4 2017 vs.
Q3 2017FY 2017 vs.
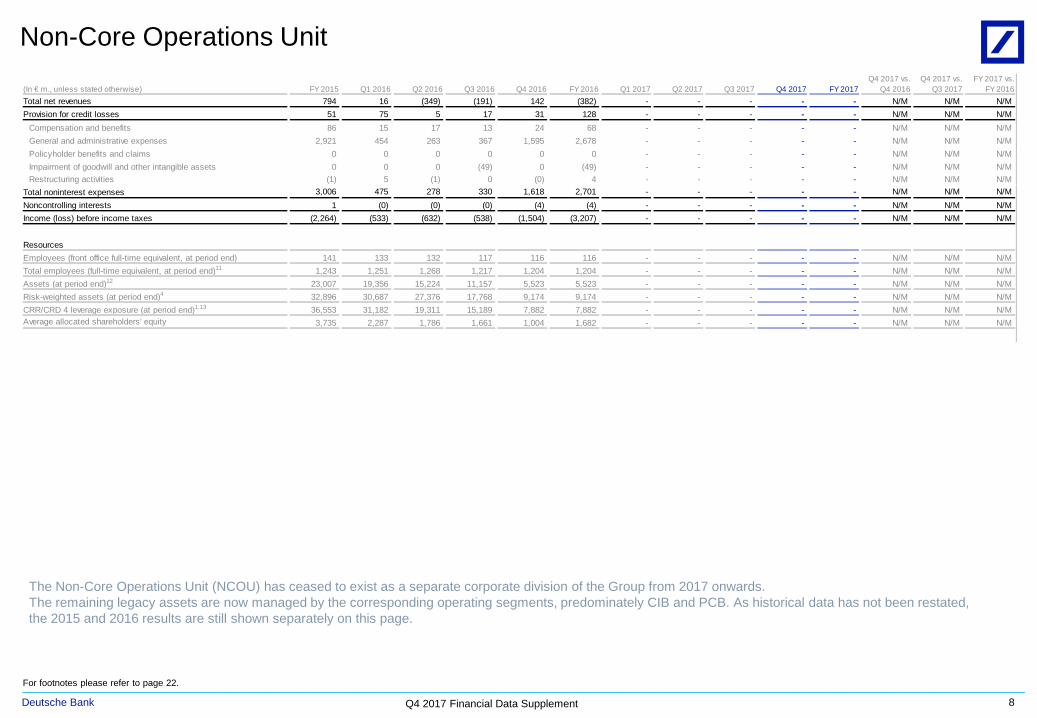
FY 2016Total net revenues 794 16 (349) (191) 142 (382) - - - - - N/M N/M N/M Provision for credit losses 51 75 5 17 31 128 - - - - - N/M N/M N/M
Compensation and benefits 86 15 17 13 24 68 - - - - - N/M N/M N/M General and administrative expenses 2,921 454 263 367 1,595 2,678 - - - - - N/M N/M N/M Policyholder benefits and claims 0 0 0 0 0 0 - - - - - N/M N/M N/M Impairment of goodwill and other intangible assets 0 0 0 (49) 0 (49) - - - - - N/M N/M N/M Restructuring activities (1) 5 (1) 0 (0) 4 - - - - - N/M N/M N/M
Total noninterest expenses 3,006 475 278 330 1,618 2,701 - - - - - N/M N/M N/M Noncontrolling interests 1 (0) (0) (0) (4) (4) - - - - - N/M N/M N/M Income (loss) before income taxes (2,264) (533) (632) (538) (1,504) (3,207) - - - - - N/M N/M N/M
ResourcesEmployees (front office full-time equivalent, at period end) 141 133 132 117 116 116 - - - - - N/M N/M N/M Total employees (full-time equivalent, at period end)11 1,243 1,251 1,268 1,217 1,204 1,204 - - - - - N/M N/M N/M Assets (at period end)12 23,007 19,356 15,224 11,157 5,523 5,523 - - - - - N/M N/M N/M Risk-weighted assets (at period end)4 32,896 30,687 27,376 17,768 9,174 9,174 - - - - - N/M N/M N/M CRR/CRD 4 leverage exposure (at period end)1,13 36,553 31,182 19,311 15,189 7,882 7,882 - - - - - N/M N/M N/M Average allocated shareholders' equity 3,735 2,287 1,786 1,661 1,004 1,682 - - - - - N/M N/M N/M
Non-Core Operations Unit
8
For footnotes please refer to page 22.
The Non-Core Operations Unit (NCOU) has ceased to exist as a separate corporate division of the Group from 2017 onwards.The remaining legacy assets are now managed by the corresponding operating segments, predominately CIB and PCB. As historical data has not been restated, the 2015 and 2016 results are still shown separately on this page.
Deutsche Bank Q4 2017 Financial Data Supplement _________________________________________________________________________________________________________________________________________
(In € m., unless stated otherwise) FY 2015 Q1 2016 Q2 2016 Q3 2016 Q4 2016 FY 2016 Q1 2017 Q2 2017 Q3 2017 Q4 2017 FY 2017Q4 2017 vs.
Q4 2016Q4 2017 vs.
Q3 2017FY 2017 vs.
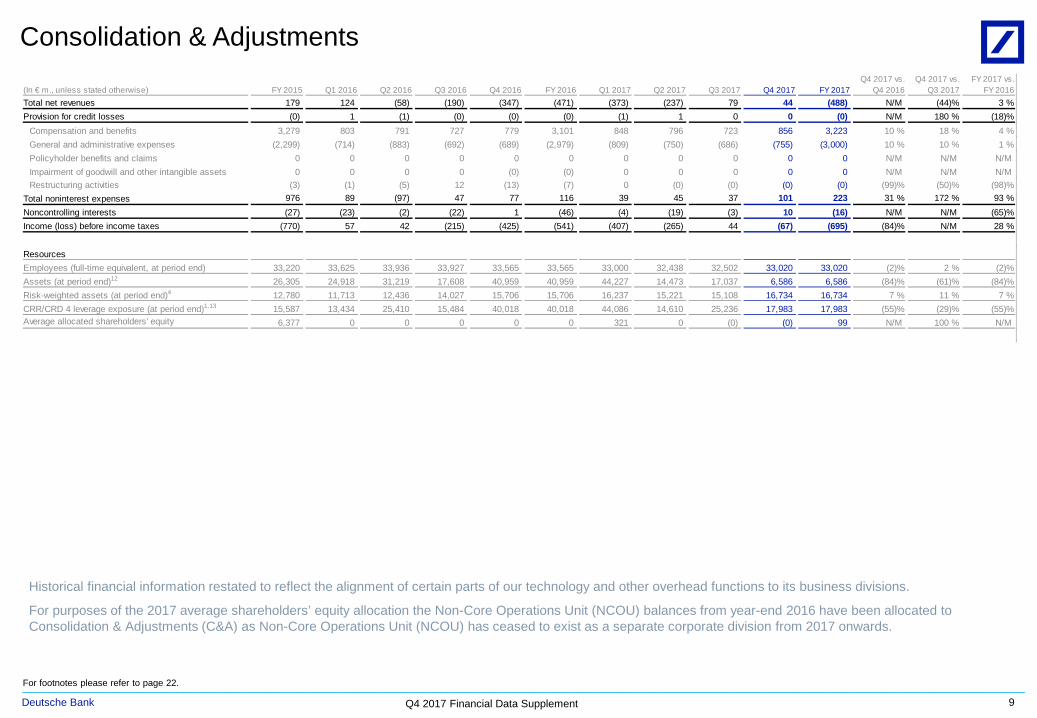
FY 2016Total net revenues 179 124 (58) (190) (347) (471) (373) (237) 79 44 (488) N/M (44)% 3 %Provision for credit losses (0) 1 (1) (0) (0) (0) (1) 1 0 0 (0) N/M 180 % (18)%
Compensation and benefits 3,279 803 791 727 779 3,101 848 796 723 856 3,223 10 % 18 % 4 %General and administrative expenses (2,299) (714) (883) (692) (689) (2,979) (809) (750) (686) (755) (3,000) 10 % 10 % 1 %Policyholder benefits and claims 0 0 0 0 0 0 0 0 0 0 0 N/M N/M N/M Impairment of goodwill and other intangible assets 0 0 0 0 (0) (0) 0 0 0 0 0 N/M N/M N/M Restructuring activities (3) (1) (5) 12 (13) (7) 0 (0) (0) (0) (0) (99)% (50)% (98)%
Total noninterest expenses 976 89 (97) 47 77 116 39 45 37 101 223 31 % 172 % 93 %Noncontrolling interests (27) (23) (2) (22) 1 (46) (4) (19) (3) 10 (16) N/M N/M (65)%Income (loss) before income taxes (770) 57 42 (215) (425) (541) (407) (265) 44 (67) (695) (84)% N/M 28 %
ResourcesEmployees (full-time equivalent, at period end) 33,220 33,625 33,936 33,927 33,565 33,565 33,000 32,438 32,502 33,020 33,020 (2)% 2 % (2)%Assets (at period end)12 26,305 24,918 31,219 17,608 40,959 40,959 44,227 14,473 17,037 6,586 6,586 (84)% (61)% (84)%Risk-weighted assets (at period end)4 12,780 11,713 12,436 14,027 15,706 15,706 16,237 15,221 15,108 16,734 16,734 7 % 11 % 7 %CRR/CRD 4 leverage exposure (at period end)1,13 15,587 13,434 25,410 15,484 40,018 40,018 44,086 14,610 25,236 17,983 17,983 (55)% (29)% (55)%Average allocated shareholders' equity 6,377 0 0 0 0 0 321 0 (0) (0) 99 N/M 100 % N/M
Consolidation & Adjustments
9
For footnotes please refer to page 22.
Historical financial information restated to reflect the alignment of certain parts of our technology and other overhead functions to its business divisions.
For purposes of the 2017 average shareholders’ equity allocation the Non-Core Operations Unit (NCOU) balances from year-end 2016 have been allocated to Consolidation & Adjustments (C&A) as Non-Core Operations Unit (NCOU) has ceased to exist as a separate corporate division from 2017 onwards.
Deutsche Bank Q4 2017 Financial Data Supplement _________________________________________________________________________________________________________________________________________
(In € m., unless stated otherwise) FY 2015 Q1 2016 Q2 2016 Q3 2016 Q4 2016 FY 2016 Q1 2017 Q2 2017 Q3 2017 Q4 2017 FY 2017Q4 2017 vs.
Q4 2016Q4 2017 vs.
Q3 2017FY 2017 vs.
FY 2016Allowance for loan losses
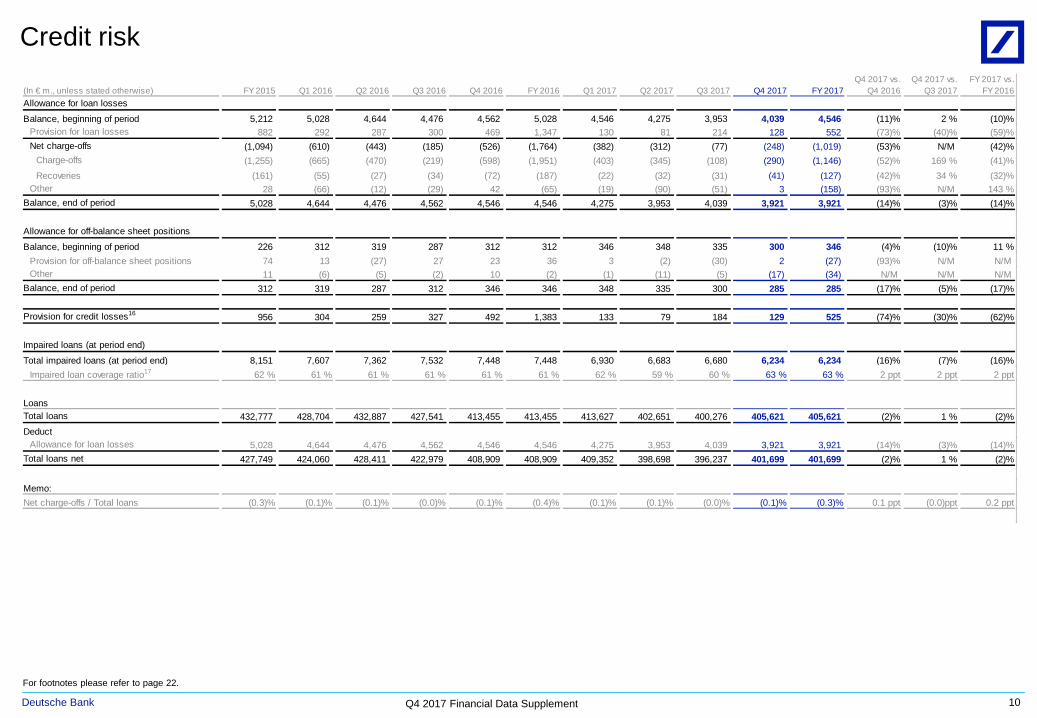
Balance, beginning of period 5,212 5,028 4,644 4,476 4,562 5,028 4,546 4,275 3,953 4,039 4,546 (11)% 2 % (10)%Provision for loan losses 882 292 287 300 469 1,347 130 81 214 128 552 (73)% (40)% (59)%Net charge-offs (1,094) (610) (443) (185) (526) (1,764) (382) (312) (77) (248) (1,019) (53)% N/M (42)%
Charge-offs (1,255) (665) (470) (219) (598) (1,951) (403) (345) (108) (290) (1,146) (52)% 169 % (41)%Recoveries (161) (55) (27) (34) (72) (187) (22) (32) (31) (41) (127) (42)% 34 % (32)%
Other 28 (66) (12) (29) 42 (65) (19) (90) (51) 3 (158) (93)% N/M 143 %Balance, end of period 5,028 4,644 4,476 4,562 4,546 4,546 4,275 3,953 4,039 3,921 3,921 (14)% (3)% (14)%
Allowance for off-balance sheet positions
Balance, beginning of period 226 312 319 287 312 312 346 348 335 300 346 (4)% (10)% 11 %Provision for off-balance sheet positions 74 13 (27) 27 23 36 3 (2) (30) 2 (27) (93)% N/M N/M Other 11 (6) (5) (2) 10 (2) (1) (11) (5) (17) (34) N/M N/M N/M
Balance, end of period 312 319 287 312 346 346 348 335 300 285 285 (17)% (5)% (17)%
Provision for credit losses16 956 304 259 327 492 1,383 133 79 184 129 525 (74)% (30)% (62)%
Impaired loans (at period end)
Total impaired loans (at period end) 8,151 7,607 7,362 7,532 7,448 7,448 6,930 6,683 6,680 6,234 6,234 (16)% (7)% (16)%Impaired loan coverage ratio17 62 % 61 % 61 % 61 % 61 % 61 % 62 % 59 % 60 % 63 % 63 % 2 ppt 2 ppt 2 ppt
LoansTotal loans 432,777 428,704 432,887 427,541 413,455 413,455 413,627 402,651 400,276 405,621 405,621 (2)% 1 % (2)%Deduct
Allowance for loan losses 5,028 4,644 4,476 4,562 4,546 4,546 4,275 3,953 4,039 3,921 3,921 (14)% (3)% (14)%Total loans net 427,749 424,060 428,411 422,979 408,909 408,909 409,352 398,698 396,237 401,699 401,699 (2)% 1 % (2)%
Memo:Net charge-offs / Total loans (0.3)% (0.1)% (0.1)% (0.0)% (0.1)% (0.4)% (0.1)% (0.1)% (0.0)% (0.1)% (0.3)% 0.1 ppt (0.0)ppt 0.2 ppt
Credit risk
10
For footnotes please refer to page 22.
Deutsche Bank Q4 2017 Financial Data Supplement _________________________________________________________________________________________________________________________________________
(In € m., unless stated otherwise) Dec 31, 2015 Mar 31, 2016 Jun 30, 2016 Sep 30, 2016 Dec 31, 2016 Mar 31, 2017 Jun 30, 2017 Jun 30, 2017 Sep 30, 2017 Dec 31, 2017Dec 31, 2017 vs.
Dec 31, 2016
Regulatory capital (fully loaded)3
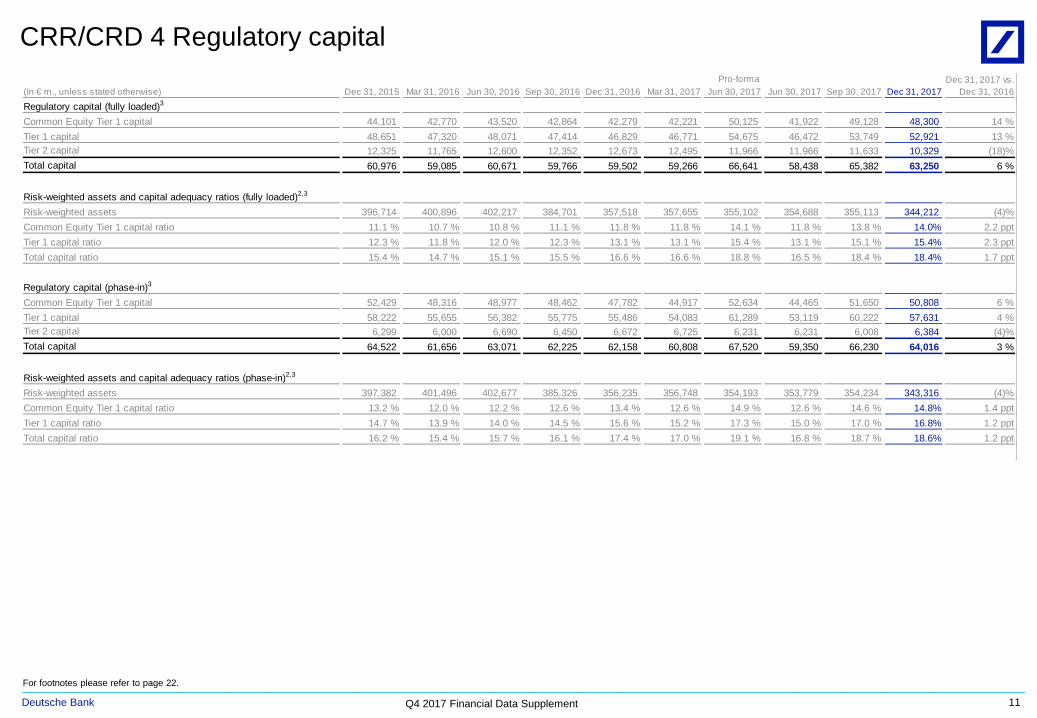
Common Equity Tier 1 capital 44,101 42,770 43,520 42,864 42,279 42,221 50,125 41,922 49,128 48,300 14 %Tier 1 capital 48,651 47,320 48,071 47,414 46,829 46,771 54,675 46,472 53,749 52,921 13 %Tier 2 capital 12,325 11,765 12,600 12,352 12,673 12,495 11,966 11,966 11,633 10,329 (18)%Total capital 60,976 59,085 60,671 59,766 59,502 59,266 66,641 58,438 65,382 63,250 6 %
Risk-weighted assets and capital adequacy ratios (fully loaded)2,3
Risk-weighted assets 396,714 400,896 402,217 384,701 357,518 357,655 355,102 354,688 355,113 344,212 (4)%Common Equity Tier 1 capital ratio 11.1 % 10.7 % 10.8 % 11.1 % 11.8 % 11.8 % 14.1 % 11.8 % 13.8 % 14.0% 2.2 pptTier 1 capital ratio 12.3 % 11.8 % 12.0 % 12.3 % 13.1 % 13.1 % 15.4 % 13.1 % 15.1 % 15.4% 2.3 pptTotal capital ratio 15.4 % 14.7 % 15.1 % 15.5 % 16.6 % 16.6 % 18.8 % 16.5 % 18.4 % 18.4% 1.7 ppt
Regulatory capital (phase-in)3
Common Equity Tier 1 capital 52,429 48,316 48,977 48,462 47,782 44,917 52,634 44,465 51,650 50,808 6 %Tier 1 capital 58,222 55,655 56,382 55,775 55,486 54,083 61,289 53,119 60,222 57,631 4 %Tier 2 capital 6,299 6,000 6,690 6,450 6,672 6,725 6,231 6,231 6,008 6,384 (4)%Total capital 64,522 61,656 63,071 62,225 62,158 60,808 67,520 59,350 66,230 64,016 3 %
Risk-weighted assets and capital adequacy ratios (phase-in)2,3
Risk-weighted assets 397,382 401,496 402,677 385,326 356,235 356,748 354,193 353,779 354,234 343,316 (4)%Common Equity Tier 1 capital ratio 13.2 % 12.0 % 12.2 % 12.6 % 13.4 % 12.6 % 14.9 % 12.6 % 14.6 % 14.8% 1.4 pptTier 1 capital ratio 14.7 % 13.9 % 14.0 % 14.5 % 15.6 % 15.2 % 17.3 % 15.0 % 17.0 % 16.8% 1.2 pptTotal capital ratio 16.2 % 15.4 % 15.7 % 16.1 % 17.4 % 17.0 % 19.1 % 16.8 % 18.7 % 18.6% 1.2 ppt
Pro-forma
CRR/CRD 4 Regulatory capital
11
For footnotes please refer to page 22.
Deutsche Bank Q4 2017 Financial Data Supplement _________________________________________________________________________________________________________________________________________
(In € m., unless stated otherwise) Dec 31, 2015 Mar 31, 2016 Jun 30, 2016 Sep 30, 2016 Dec 31, 2016 Mar 31, 2017 Jun 30, 2017 Sep 30, 2017 Dec 31, 2017Dec 31, 2017 vs.
Dec 31, 2016
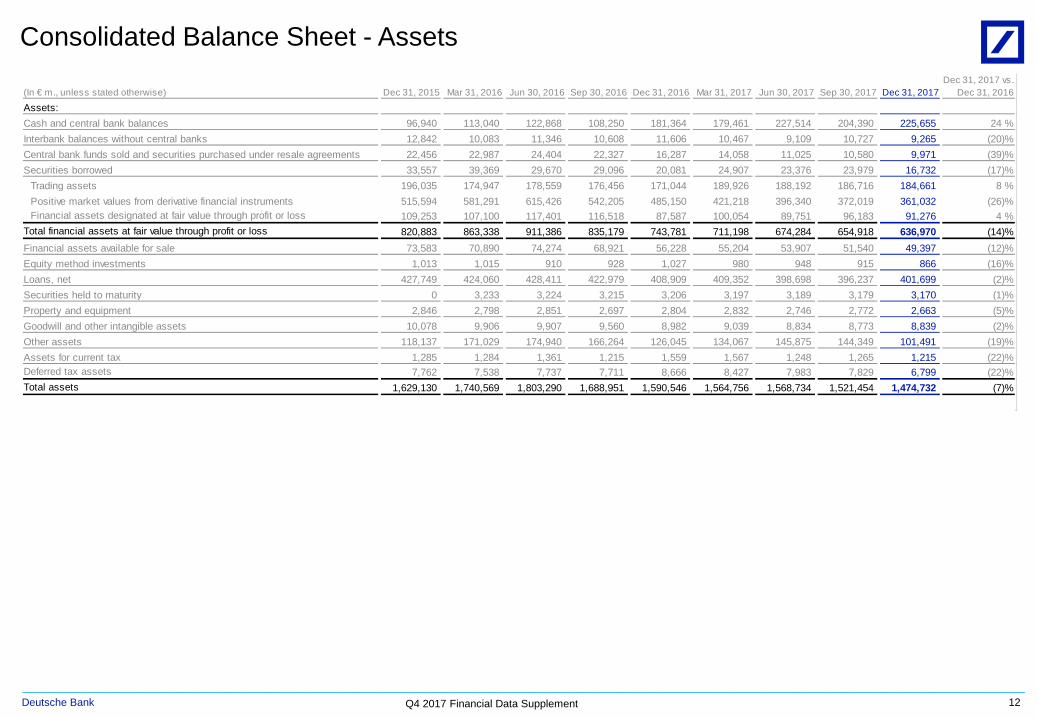
Assets:Cash and central bank balances 96,940 113,040 122,868 108,250 181,364 179,461 227,514 204,390 225,655 24 %Interbank balances without central banks 12,842 10,083 11,346 10,608 11,606 10,467 9,109 10,727 9,265 (20)%Central bank funds sold and securities purchased under resale agreements 22,456 22,987 24,404 22,327 16,287 14,058 11,025 10,580 9,971 (39)%Securities borrowed 33,557 39,369 29,670 29,096 20,081 24,907 23,376 23,979 16,732 (17)%
Trading assets 196,035 174,947 178,559 176,456 171,044 189,926 188,192 186,716 184,661 8 %Positive market values from derivative financial instruments 515,594 581,291 615,426 542,205 485,150 421,218 396,340 372,019 361,032 (26)%Financial assets designated at fair value through profit or loss 109,253 107,100 117,401 116,518 87,587 100,054 89,751 96,183 91,276 4 %
Total financial assets at fair value through profit or loss 820,883 863,338 911,386 835,179 743,781 711,198 674,284 654,918 636,970 (14)%Financial assets available for sale 73,583 70,890 74,274 68,921 56,228 55,204 53,907 51,540 49,397 (12)%Equity method investments 1,013 1,015 910 928 1,027 980 948 915 866 (16)%Loans, net 427,749 424,060 428,411 422,979 408,909 409,352 398,698 396,237 401,699 (2)%Securities held to maturity 0 3,233 3,224 3,215 3,206 3,197 3,189 3,179 3,170 (1)%Property and equipment 2,846 2,798 2,851 2,697 2,804 2,832 2,746 2,772 2,663 (5)%Goodwill and other intangible assets 10,078 9,906 9,907 9,560 8,982 9,039 8,834 8,773 8,839 (2)%Other assets 118,137 171,029 174,940 166,264 126,045 134,067 145,875 144,349 101,491 (19)%Assets for current tax 1,285 1,284 1,361 1,215 1,559 1,567 1,248 1,265 1,215 (22)%Deferred tax assets 7,762 7,538 7,737 7,711 8,666 8,427 7,983 7,829 6,799 (22)%Total assets 1,629,130 1,740,569 1,803,290 1,688,951 1,590,546 1,564,756 1,568,734 1,521,454 1,474,732 (7)%
Consolidated Balance Sheet - Assets
12
Deutsche Bank Q4 2017 Financial Data Supplement _________________________________________________________________________________________________________________________________________
(In € m., unless stated otherwise) Dec 31, 2015 Mar 31, 2016 Jun 30, 2016 Sep 30, 2016 Dec 31, 2016 Mar 31, 2017 Jun 30, 2017 Sep 30, 2017 Dec 31, 2017Dec 31, 2017 vs.
Dec 31, 2016
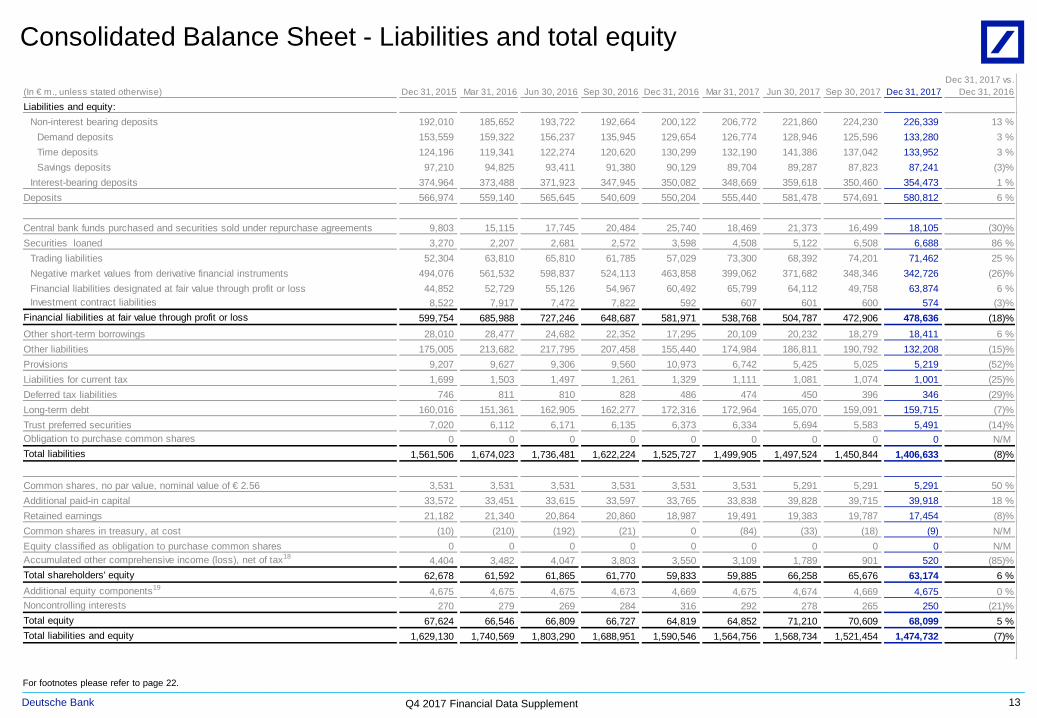
Liabilities and equity:Non-interest bearing deposits 192,010 185,652 193,722 192,664 200,122 206,772 221,860 224,230 226,339 13 %
Demand deposits 153,559 159,322 156,237 135,945 129,654 126,774 128,946 125,596 133,280 3 %Time deposits 124,196 119,341 122,274 120,620 130,299 132,190 141,386 137,042 133,952 3 %Savings deposits 97,210 94,825 93,411 91,380 90,129 89,704 89,287 87,823 87,241 (3)%
Interest-bearing deposits 374,964 373,488 371,923 347,945 350,082 348,669 359,618 350,460 354,473 1 %Deposits 566,974 559,140 565,645 540,609 550,204 555,440 581,478 574,691 580,812 6 %
Central bank funds purchased and securities sold under repurchase agreements 9,803 15,115 17,745 20,484 25,740 18,469 21,373 16,499 18,105 (30)%Securities loaned 3,270 2,207 2,681 2,572 3,598 4,508 5,122 6,508 6,688 86 %
Trading liabilities 52,304 63,810 65,810 61,785 57,029 73,300 68,392 74,201 71,462 25 %Negative market values from derivative financial instruments 494,076 561,532 598,837 524,113 463,858 399,062 371,682 348,346 342,726 (26)%Financial liabilities designated at fair value through profit or loss 44,852 52,729 55,126 54,967 60,492 65,799 64,112 49,758 63,874 6 %Investment contract liabilities 8,522 7,917 7,472 7,822 592 607 601 600 574 (3)%
Financial liabilities at fair value through profit or loss 599,754 685,988 727,246 648,687 581,971 538,768 504,787 472,906 478,636 (18)%Other short-term borrowings 28,010 28,477 24,682 22,352 17,295 20,109 20,232 18,279 18,411 6 %Other liabilities 175,005 213,682 217,795 207,458 155,440 174,984 186,811 190,792 132,208 (15)%Provisions 9,207 9,627 9,306 9,560 10,973 6,742 5,425 5,025 5,219 (52)%Liabilities for current tax 1,699 1,503 1,497 1,261 1,329 1,111 1,081 1,074 1,001 (25)%Deferred tax liabilities 746 811 810 828 486 474 450 396 346 (29)%Long-term debt 160,016 151,361 162,905 162,277 172,316 172,964 165,070 159,091 159,715 (7)%Trust preferred securities 7,020 6,112 6,171 6,135 6,373 6,334 5,694 5,583 5,491 (14)%Obligation to purchase common shares 0 0 0 0 0 0 0 0 0 N/M Total liabilities 1,561,506 1,674,023 1,736,481 1,622,224 1,525,727 1,499,905 1,497,524 1,450,844 1,406,633 (8)%
Common shares, no par value, nominal value of € 2.56 3,531 3,531 3,531 3,531 3,531 3,531 5,291 5,291 5,291 50 %Additional paid-in capital 33,572 33,451 33,615 33,597 33,765 33,838 39,828 39,715 39,918 18 %Retained earnings 21,182 21,340 20,864 20,860 18,987 19,491 19,383 19,787 17,454 (8)%Common shares in treasury, at cost (10) (210) (192) (21) 0 (84) (33) (18) (9) N/M Equity classified as obligation to purchase common shares 0 0 0 0 0 0 0 0 0 N/M Accumulated other comprehensive income (loss), net of tax18 4,404 3,482 4,047 3,803 3,550 3,109 1,789 901 520 (85)%Total shareholders' equity 62,678 61,592 61,865 61,770 59,833 59,885 66,258 65,676 63,174 6 %Additional equity components19 4,675 4,675 4,675 4,673 4,669 4,675 4,674 4,669 4,675 0 %Noncontrolling interests 270 279 269 284 316 292 278 265 250 (21)%Total equity 67,624 66,546 66,809 66,727 64,819 64,852 71,210 70,609 68,099 5 %Total liabilities and equity 1,629,130 1,740,569 1,803,290 1,688,951 1,590,546 1,564,756 1,568,734 1,521,454 1,474,732 (7)%
Consolidated Balance Sheet - Liabilities and total equity
13
For footnotes please refer to page 22.
Deutsche Bank Q4 2017 Financial Data Supplement _________________________________________________________________________________________________________________________________________
(In € bn., unless stated otherwise) Dec 31, 2015 Mar 31, 2016 Jun 30, 2016 Sep 30, 2016 Dec 31, 2016 Mar 31, 2017 Jun 30, 2017 Jun 30, 2017 Sep 30, 2017 Dec 31, 2017Dec 31, 2017 vs.
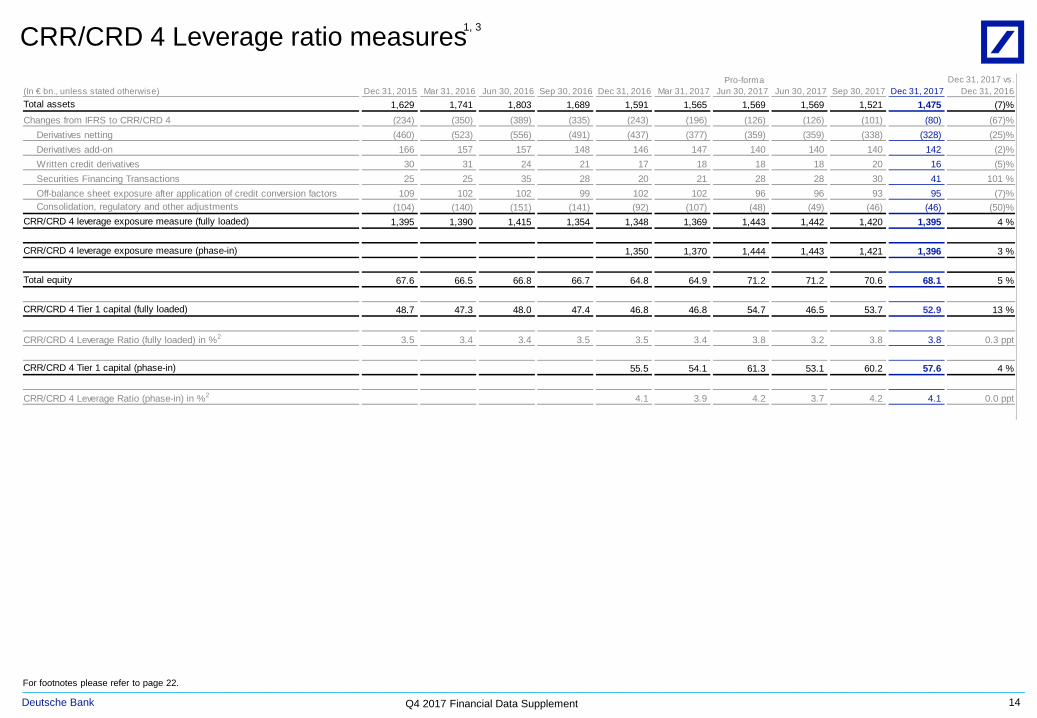
Dec 31, 2016Total assets 1,629 1,741 1,803 1,689 1,591 1,565 1,569 1,569 1,521 1,475 (7)%Changes from IFRS to CRR/CRD 4 (234) (350) (389) (335) (243) (196) (126) (126) (101) (80) (67)%
Derivatives netting (460) (523) (556) (491) (437) (377) (359) (359) (338) (328) (25)%Derivatives add-on 166 157 157 148 146 147 140 140 140 142 (2)%Written credit derivatives 30 31 24 21 17 18 18 18 20 16 (5)%Securities Financing Transactions 25 25 35 28 20 21 28 28 30 41 101 %Off-balance sheet exposure after application of credit conversion factors 109 102 102 99 102 102 96 96 93 95 (7)%Consolidation, regulatory and other adjustments (104) (140) (151) (141) (92) (107) (48) (49) (46) (46) (50)%
CRR/CRD 4 leverage exposure measure (fully loaded) 1,395 1,390 1,415 1,354 1,348 1,369 1,443 1,442 1,420 1,395 4 %
CRR/CRD 4 leverage exposure measure (phase-in) 1,350 1,370 1,444 1,443 1,421 1,396 3 %
Total equity 67.6 66.5 66.8 66.7 64.8 64.9 71.2 71.2 70.6 68.1 5 %
CRR/CRD 4 Tier 1 capital (fully loaded) 48.7 47.3 48.0 47.4 46.8 46.8 54.7 46.5 53.7 52.9 13 %
CRR/CRD 4 Leverage Ratio (fully loaded) in %2 3.5 3.4 3.4 3.5 3.5 3.4 3.8 3.2 3.8 3.8 0.3 ppt
CRR/CRD 4 Tier 1 capital (phase-in) 55.5 54.1 61.3 53.1 60.2 57.6 4 %
CRR/CRD 4 Leverage Ratio (phase-in) in %2 4.1 3.9 4.2 3.7 4.2 4.1 0.0 ppt
Pro-forma
CRR/CRD 4 Leverage ratio measures
14
For footnotes please refer to page 22.
1, 3
Deutsche Bank Q4 2017 Financial Data Supplement _________________________________________________________________________________________________________________________________________
(In € m., unless stated otherwise) FY 2015 Q1 2016 Q2 2016 Q3 2016 Q4 2016 FY 2016 Q1 2017 Q2 2017 Q3 2017 Q4 2017 FY 2017Q4 2017 vs.
Q4 2016Q4 2017 vs.
Q3 2017FY 2017 vs.
FY 2016
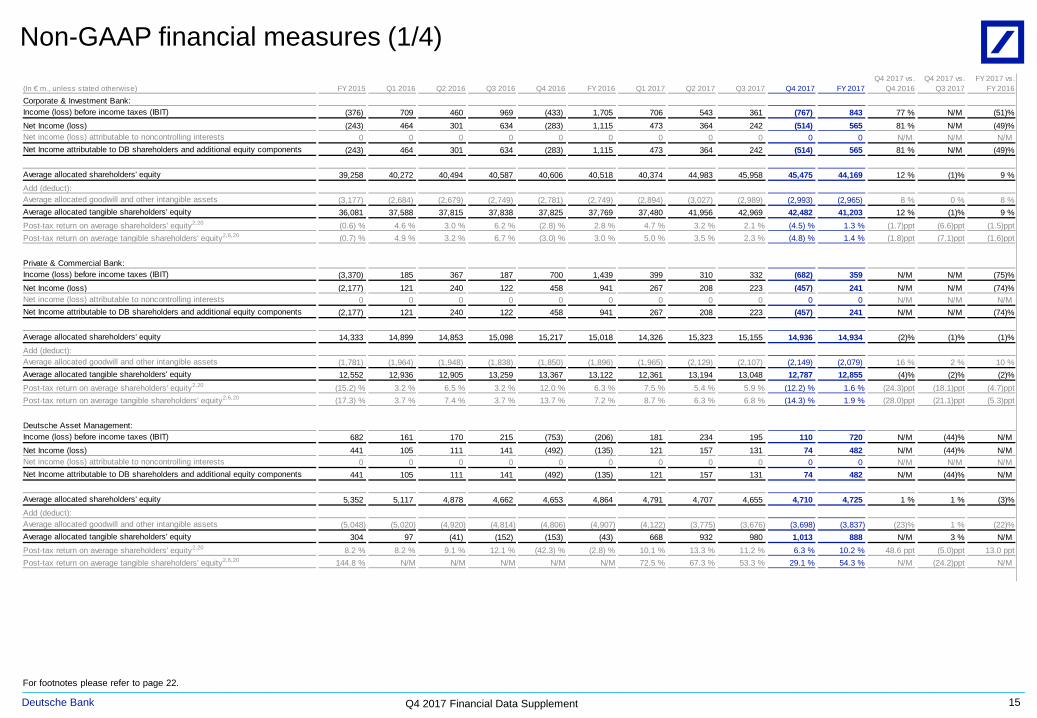
Corporate & Investment Bank:Income (loss) before income taxes (IBIT) (376) 709 460 969 (433) 1,705 706 543 361 (767) 843 77 % N/M (51)%Net Income (loss) (243) 464 301 634 (283) 1,115 473 364 242 (514) 565 81 % N/M (49)%Net income (loss) attributable to noncontrolling interests 0 0 0 0 0 0 0 0 0 0 0 N/M N/M N/M Net Income attributable to DB shareholders and additional equity components (243) 464 301 634 (283) 1,115 473 364 242 (514) 565 81 % N/M (49)%
Average allocated shareholders' equity 39,258 40,272 40,494 40,587 40,606 40,518 40,374 44,983 45,958 45,475 44,169 12 % (1)% 9 %Add (deduct):Average allocated goodwill and other intangible assets (3,177) (2,684) (2,679) (2,749) (2,781) (2,749) (2,894) (3,027) (2,989) (2,993) (2,965) 8 % 0 % 8 %Average allocated tangible shareholders' equity 36,081 37,588 37,815 37,838 37,825 37,769 37,480 41,956 42,969 42,482 41,203 12 % (1)% 9 %Post-tax return on average shareholders' equity2,20 (0.6) % 4.6 % 3.0 % 6.2 % (2.8) % 2.8 % 4.7 % 3.2 % 2.1 % (4.5) % 1.3 % (1.7)ppt (6.6)ppt (1.5)pptPost-tax return on average tangible shareholders' equity2,6,20 (0.7) % 4.9 % 3.2 % 6.7 % (3.0) % 3.0 % 5.0 % 3.5 % 2.3 % (4.8) % 1.4 % (1.8)ppt (7.1)ppt (1.6)ppt
Private & Commercial Bank:Income (loss) before income taxes (IBIT) (3,370) 185 367 187 700 1,439 399 310 332 (682) 359 N/M N/M (75)%Net Income (loss) (2,177) 121 240 122 458 941 267 208 223 (457) 241 N/M N/M (74)%Net income (loss) attributable to noncontrolling interests 0 0 0 0 0 0 0 0 0 0 0 N/M N/M N/M Net Income attributable to DB shareholders and additional equity components (2,177) 121 240 122 458 941 267 208 223 (457) 241 N/M N/M (74)%
Average allocated shareholders' equity 14,333 14,899 14,853 15,098 15,217 15,018 14,326 15,323 15,155 14,936 14,934 (2)% (1)% (1)%Add (deduct):Average allocated goodwill and other intangible assets (1,781) (1,964) (1,948) (1,838) (1,850) (1,896) (1,965) (2,129) (2,107) (2,149) (2,079) 16 % 2 % 10 %Average allocated tangible shareholders' equity 12,552 12,936 12,905 13,259 13,367 13,122 12,361 13,194 13,048 12,787 12,855 (4)% (2)% (2)%Post-tax return on average shareholders' equity2,20 (15.2) % 3.2 % 6.5 % 3.2 % 12.0 % 6.3 % 7.5 % 5.4 % 5.9 % (12.2) % 1.6 % (24.3)ppt (18.1)ppt (4.7)pptPost-tax return on average tangible shareholders' equity2,6,20 (17.3) % 3.7 % 7.4 % 3.7 % 13.7 % 7.2 % 8.7 % 6.3 % 6.8 % (14.3) % 1.9 % (28.0)ppt (21.1)ppt (5.3)ppt
Deutsche Asset Management:Income (loss) before income taxes (IBIT) 682 161 170 215 (753) (206) 181 234 195 110 720 N/M (44)% N/M Net Income (loss) 441 105 111 141 (492) (135) 121 157 131 74 482 N/M (44)% N/M Net income (loss) attributable to noncontrolling interests 0 0 0 0 0 0 0 0 0 0 0 N/M N/M N/M Net Income attributable to DB shareholders and additional equity components 441 105 111 141 (492) (135) 121 157 131 74 482 N/M (44)% N/M
Average allocated shareholders' equity 5,352 5,117 4,878 4,662 4,653 4,864 4,791 4,707 4,655 4,710 4,725 1 % 1 % (3)%Add (deduct):Average allocated goodwill and other intangible assets (5,048) (5,020) (4,920) (4,814) (4,806) (4,907) (4,122) (3,775) (3,676) (3,698) (3,837) (23)% 1 % (22)%Average allocated tangible shareholders' equity 304 97 (41) (152) (153) (43) 668 932 980 1,013 888 N/M 3 % N/M Post-tax return on average shareholders' equity2,20 8.2 % 8.2 % 9.1 % 12.1 % (42.3) % (2.8) % 10.1 % 13.3 % 11.2 % 6.3 % 10.2 % 48.6 ppt (5.0)ppt 13.0 pptPost-tax return on average tangible shareholders' equity2,6,20 144.8 % N/M N/M N/M N/M N/M 72.5 % 67.3 % 53.3 % 29.1 % 54.3 % N/M (24.2)ppt N/M
Non-GAAP financial measures (1/4)
15
For footnotes please refer to page 22.
Deutsche Bank Q4 2017 Financial Data Supplement _________________________________________________________________________________________________________________________________________
(In € m., unless stated otherwise) FY 2015 Q1 2016 Q2 2016 Q3 2016 Q4 2016 FY 2016 Q1 2017 Q2 2017 Q3 2017 Q4 2017 FY 2017Q4 2017 vs.
Q4 2016Q4 2017 vs.
Q3 2017FY 2017 vs.
FY 2016
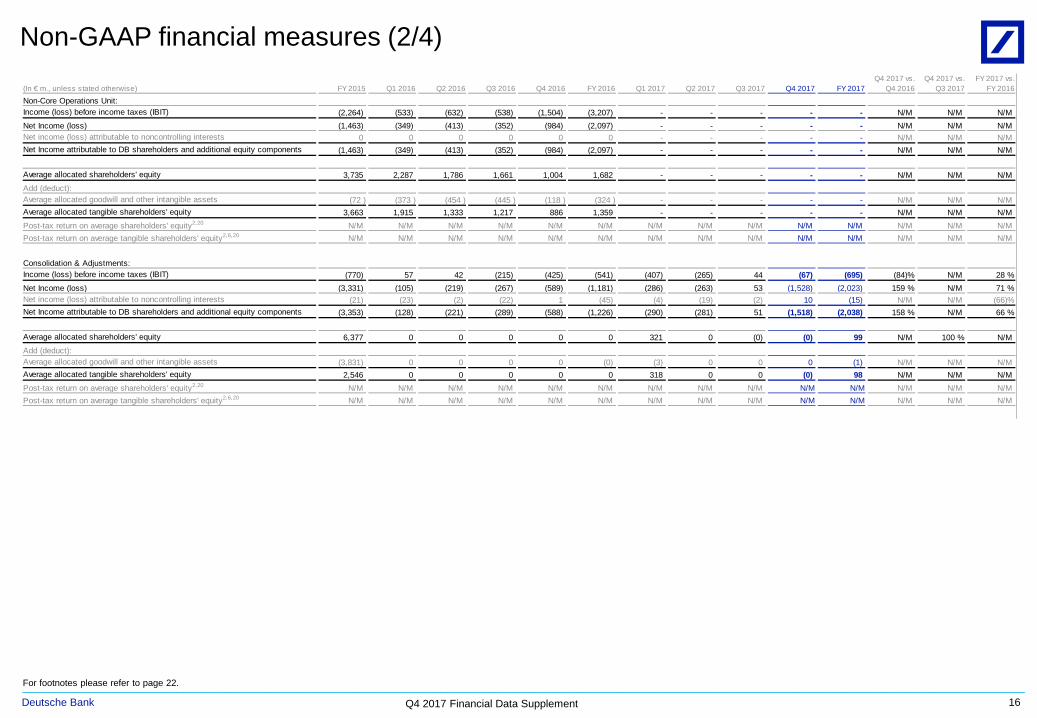
Non-Core Operations Unit:Income (loss) before income taxes (IBIT) (2,264) (533) (632) (538) (1,504) (3,207) - - - - - N/M N/M N/M Net Income (loss) (1,463) (349) (413) (352) (984) (2,097) - - - - - N/M N/M N/M Net income (loss) attributable to noncontrolling interests 0 0 0 0 0 0 - - - - - N/M N/M N/M Net Income attributable to DB shareholders and additional equity components (1,463) (349) (413) (352) (984) (2,097) - - - - - N/M N/M N/M
Average allocated shareholders' equity 3,735 2,287 1,786 1,661 1,004 1,682 - - - - - N/M N/M N/M Add (deduct):Average allocated goodwill and other intangible assets (72 ) (373 ) (454 ) (445 ) (118 ) (324 ) - - - - - N/M N/M N/M Average allocated tangible shareholders' equity 3,663 1,915 1,333 1,217 886 1,359 - - - - - N/M N/M N/M Post-tax return on average shareholders' equity2,20 N/M N/M N/M N/M N/M N/M N/M N/M N/M N/M N/M N/M N/M N/M Post-tax return on average tangible shareholders' equity2,6,20 N/M N/M N/M N/M N/M N/M N/M N/M N/M N/M N/M N/M N/M N/M
Consolidation & Adjustments:Income (loss) before income taxes (IBIT) (770) 57 42 (215) (425) (541) (407) (265) 44 (67) (695) (84)% N/M 28 %Net Income (loss) (3,331) (105) (219) (267) (589) (1,181) (286) (263) 53 (1,528) (2,023) 159 % N/M 71 %Net income (loss) attributable to noncontrolling interests (21) (23) (2) (22) 1 (45) (4) (19) (2) 10 (15) N/M N/M (66)%Net Income attributable to DB shareholders and additional equity components (3,353) (128) (221) (289) (588) (1,226) (290) (281) 51 (1,518) (2,038) 158 % N/M 66 %
Average allocated shareholders' equity 6,377 0 0 0 0 0 321 0 (0) (0) 99 N/M 100 % N/M Add (deduct):Average allocated goodwill and other intangible assets (3,831) 0 0 0 0 (0) (3) 0 0 0 (1) N/M N/M N/M Average allocated tangible shareholders' equity 2,546 0 0 0 0 0 318 0 0 (0) 98 N/M N/M N/M Post-tax return on average shareholders' equity2,20 N/M N/M N/M N/M N/M N/M N/M N/M N/M N/M N/M N/M N/M N/M Post-tax return on average tangible shareholders' equity2,6,20 N/M N/M N/M N/M N/M N/M N/M N/M N/M N/M N/M N/M N/M N/M
Non-GAAP financial measures (2/4)
16
For footnotes please refer to page 22.
Deutsche Bank Q4 2017 Financial Data Supplement _________________________________________________________________________________________________________________________________________
(In € m., unless stated otherwise) FY 2015 Q1 2016 Q2 2016 Q3 2016 Q4 2016 FY 2016 Q1 2017 Q2 2017 Q3 2017 Q4 2017 FY 2017Q4 2017 vs.
Q4 2016Q4 2017 vs.
Q3 2017FY 2017 vs.
FY 2016
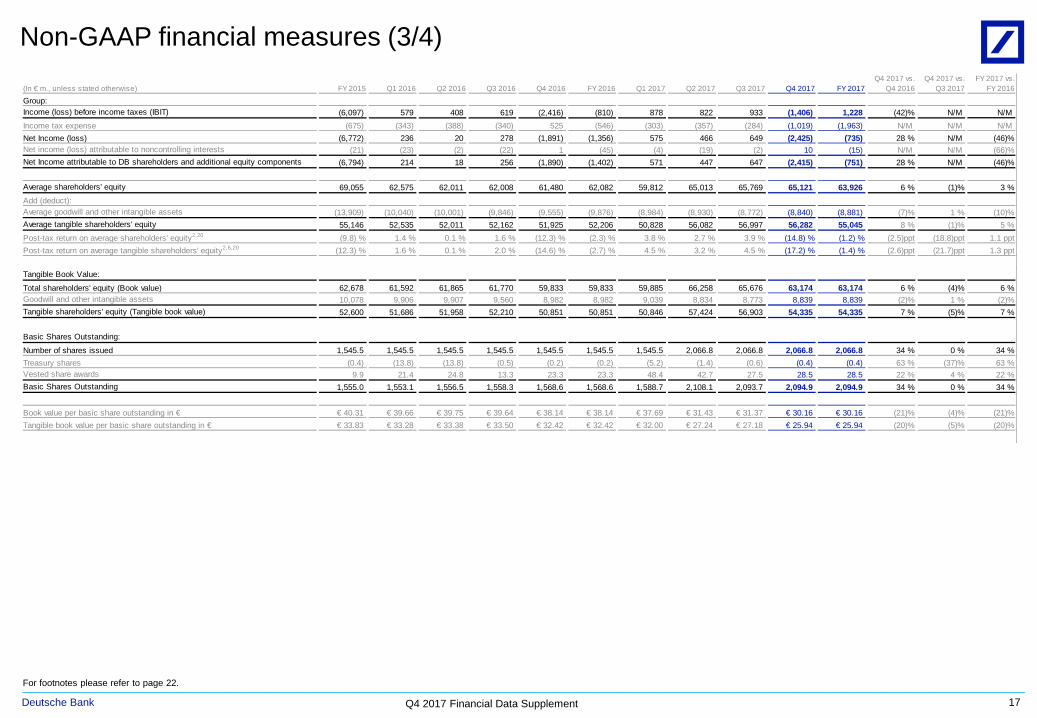
Group:Income (loss) before income taxes (IBIT) (6,097) 579 408 619 (2,416) (810) 878 822 933 (1,406) 1,228 (42)% N/M N/M Income tax expense (675) (343) (388) (340) 525 (546) (303) (357) (284) (1,019) (1,963) N/M N/M N/M Net Income (loss) (6,772) 236 20 278 (1,891) (1,356) 575 466 649 (2,425) (735) 28 % N/M (46)%Net income (loss) attributable to noncontrolling interests (21) (23) (2) (22) 1 (45) (4) (19) (2) 10 (15) N/M N/M (66)%Net Income attributable to DB shareholders and additional equity components (6,794) 214 18 256 (1,890) (1,402) 571 447 647 (2,415) (751) 28 % N/M (46)%
Average shareholders' equity 69,055 62,575 62,011 62,008 61,480 62,082 59,812 65,013 65,769 65,121 63,926 6 % (1)% 3 %Add (deduct):Average goodwill and other intangible assets (13,909) (10,040) (10,001) (9,846) (9,555) (9,876) (8,984) (8,930) (8,772) (8,840) (8,881) (7)% 1 % (10)%Average tangible shareholders' equity 55,146 52,535 52,011 52,162 51,925 52,206 50,828 56,082 56,997 56,282 55,045 8 % (1)% 5 %Post-tax return on average shareholders' equity2,20 (9.8) % 1.4 % 0.1 % 1.6 % (12.3) % (2.3) % 3.8 % 2.7 % 3.9 % (14.8) % (1.2) % (2.5)ppt (18.8)ppt 1.1 pptPost-tax return on average tangible shareholders' equity2,6,20 (12.3) % 1.6 % 0.1 % 2.0 % (14.6) % (2.7) % 4.5 % 3.2 % 4.5 % (17.2) % (1.4) % (2.6)ppt (21.7)ppt 1.3 ppt
Tangible Book Value:
Total shareholders' equity (Book value) 62,678 61,592 61,865 61,770 59,833 59,833 59,885 66,258 65,676 63,174 63,174 6 % (4)% 6 %Goodwill and other intangible assets 10,078 9,906 9,907 9,560 8,982 8,982 9,039 8,834 8,773 8,839 8,839 (2)% 1 % (2)%Tangible shareholders' equity (Tangible book value) 52,600 51,686 51,958 52,210 50,851 50,851 50,846 57,424 56,903 54,335 54,335 7 % (5)% 7 %
Basic Shares Outstanding:
Number of shares issued 1,545.5 1,545.5 1,545.5 1,545.5 1,545.5 1,545.5 1,545.5 2,066.8 2,066.8 2,066.8 2,066.8 34 % 0 % 34 %Treasury shares (0.4) (13.8) (13.8) (0.5) (0.2) (0.2) (5.2) (1.4) (0.6) (0.4) (0.4) 63 % (37)% 63 %Vested share awards 9.9 21.4 24.8 13.3 23.3 23.3 48.4 42.7 27.5 28.5 28.5 22 % 4 % 22 %Basic Shares Outstanding 1,555.0 1,553.1 1,556.5 1,558.3 1,568.6 1,568.6 1,588.7 2,108.1 2,093.7 2,094.9 2,094.9 34 % 0 % 34 %
Book value per basic share outstanding in € € 40.31 € 39.66 € 39.75 € 39.64 € 38.14 € 38.14 € 37.69 € 31.43 € 31.37 € 30.16 € 30.16 (21)% (4)% (21)%Tangible book value per basic share outstanding in € € 33.83 € 33.28 € 33.38 € 33.50 € 32.42 € 32.42 € 32.00 € 27.24 € 27.18 € 25.94 € 25.94 (20)% (5)% (20)%
Non-GAAP financial measures (3/4)
17
For footnotes please refer to page 22.
Deutsche Bank Q4 2017 Financial Data Supplement _________________________________________________________________________________________________________________________________________
In € m. FY 2015 Q1 2016 Q2 2016 Q3 2016 Q4 2016 FY 2016 Q1 2017 Q2 2017 Q3 2017 Q4 2017 FY 2017Q4 2017 vs.
Q4 2016Q4 2017 vs.
Q3 2017FY 2017 vs.
FY 2016
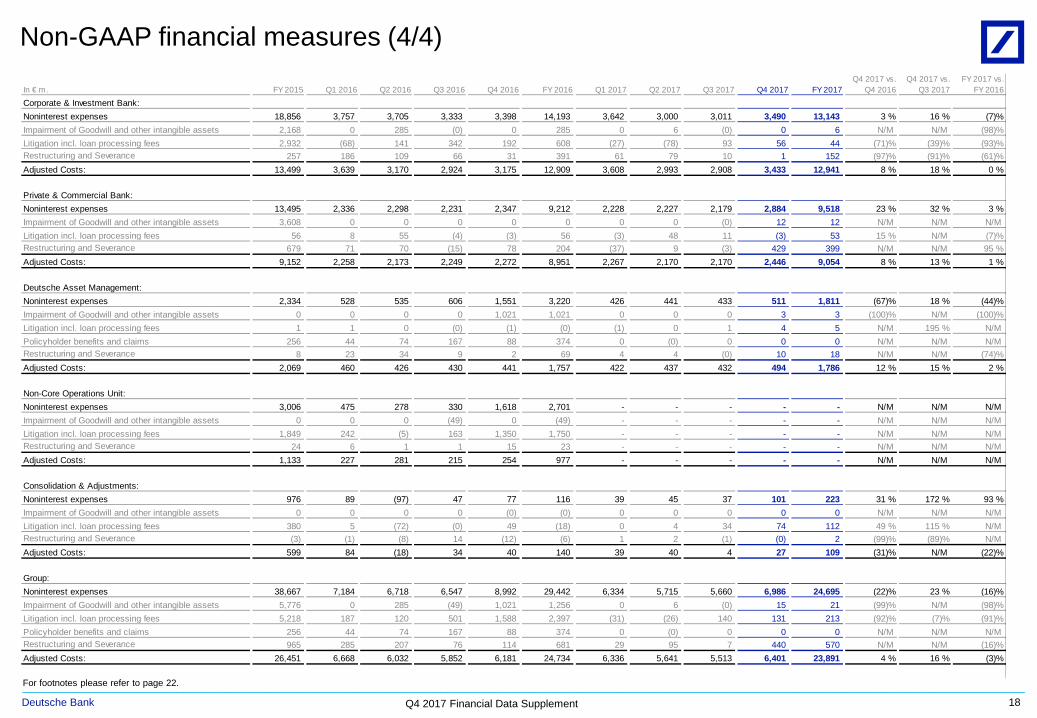
Corporate & Investment Bank:Noninterest expenses 18,856 3,757 3,705 3,333 3,398 14,193 3,642 3,000 3,011 3,490 13,143 3 % 16 % (7)%Impairment of Goodwill and other intangible assets 2,168 0 285 (0) 0 285 0 6 (0) 0 6 N/M N/M (98)%Litigation incl. loan processing fees 2,932 (68) 141 342 192 608 (27) (78) 93 56 44 (71)% (39)% (93)%Restructuring and Severance 257 186 109 66 31 391 61 79 10 1 152 (97)% (91)% (61)%Adjusted Costs: 13,499 3,639 3,170 2,924 3,175 12,909 3,608 2,993 2,908 3,433 12,941 8 % 18 % 0 %
Private & Commercial Bank:Noninterest expenses 13,495 2,336 2,298 2,231 2,347 9,212 2,228 2,227 2,179 2,884 9,518 23 % 32 % 3 %Impairment of Goodwill and other intangible assets 3,608 0 0 0 0 0 0 0 (0) 12 12 N/M N/M N/M Litigation incl. loan processing fees 56 8 55 (4) (3) 56 (3) 48 11 (3) 53 15 % N/M (7)%Restructuring and Severance 679 71 70 (15) 78 204 (37) 9 (3) 429 399 N/M N/M 95 %Adjusted Costs: 9,152 2,258 2,173 2,249 2,272 8,951 2,267 2,170 2,170 2,446 9,054 8 % 13 % 1 %
Deutsche Asset Management:Noninterest expenses 2,334 528 535 606 1,551 3,220 426 441 433 511 1,811 (67)% 18 % (44)%Impairment of Goodwill and other intangible assets 0 0 0 0 1,021 1,021 0 0 0 3 3 (100)% N/M (100)%Litigation incl. loan processing fees 1 1 0 (0) (1) (0) (1) 0 1 4 5 N/M 195 % N/M Policyholder benefits and claims 256 44 74 167 88 374 0 (0) 0 0 0 N/M N/M N/M Restructuring and Severance 8 23 34 9 2 69 4 4 (0) 10 18 N/M N/M (74)%Adjusted Costs: 2,069 460 426 430 441 1,757 422 437 432 494 1,786 12 % 15 % 2 %
Non-Core Operations Unit:Noninterest expenses 3,006 475 278 330 1,618 2,701 - - - - - N/M N/M N/M Impairment of Goodwill and other intangible assets 0 0 0 (49) 0 (49) - - - - - N/M N/M N/M Litigation incl. loan processing fees 1,849 242 (5) 163 1,350 1,750 - - - - - N/M N/M N/M Restructuring and Severance 24 6 1 1 15 23 - - - - - N/M N/M N/M Adjusted Costs: 1,133 227 281 215 254 977 - - - - - N/M N/M N/M
Consolidation & Adjustments:Noninterest expenses 976 89 (97) 47 77 116 39 45 37 101 223 31 % 172 % 93 %Impairment of Goodwill and other intangible assets 0 0 0 0 (0) (0) 0 0 0 0 0 N/M N/M N/M Litigation incl. loan processing fees 380 5 (72) (0) 49 (18) 0 4 34 74 112 49 % 115 % N/M Restructuring and Severance (3) (1) (8) 14 (12) (6) 1 2 (1) (0) 2 (99)% (89)% N/M Adjusted Costs: 599 84 (18) 34 40 140 39 40 4 27 109 (31)% N/M (22)%
Group:Noninterest expenses 38,667 7,184 6,718 6,547 8,992 29,442 6,334 5,715 5,660 6,986 24,695 (22)% 23 % (16)%Impairment of Goodwill and other intangible assets 5,776 0 285 (49) 1,021 1,256 0 6 (0) 15 21 (99)% N/M (98)%Litigation incl. loan processing fees 5,218 187 120 501 1,588 2,397 (31) (26) 140 131 213 (92)% (7)% (91)%Policyholder benefits and claims 256 44 74 167 88 374 0 (0) 0 0 0 N/M N/M N/M Restructuring and Severance 965 285 207 76 114 681 29 95 7 440 570 N/M N/M (16)%Adjusted Costs: 26,451 6,668 6,032 5,852 6,181 24,734 6,336 5,641 5,513 6,401 23,891 4 % 16 % (3)%
Non-GAAP financial measures (4/4)
18
For footnotes please refer to page 22.
Deutsche Bank Q4 2017 Financial Data Supplement _________________________________________________________________________________________________________________________________________
Definition of certain financial measures (1/3)
19
Non-GAAP Financial MeasuresThis document and other documents the Group has published or may publish contain non-GAAP financial measures. Non-GAAP financial measures are measures of the Group’s historical or future performance, financial position or cash flows that contain adjustments that exclude or include amounts that are included or excluded, as the case may be, from the most directly comparable measure calculated and presented in accordance with IFRS in the Group’s financial statements.
Return on Equity RatiosThe Group reports a post tax return on average shareholders’ equity and a post-tax return on average tangible shareholders’ equity, each of which is a non-GAAP financial measure.
The post-tax returns on average shareholders’ equity and average tangible shareholders' equity are calculated as net income (loss) attributable to Deutsche Bank shareholders as a percentage of average shareholders’ equity and average tangible shareholders' equity, respectively.
Net income (loss) attributable to Deutsche Bank shareholders is a non-GAAP financial measure and is defined as net income (loss) excluding post-tax income (loss) attributable to noncontrolling interests.
For the Group, it reflects the reported effective tax rate which was (72)% for the 4th quarter 2017 and 22 % for the prior year’s comparative period. The tax rate was 160 % for the year ended December 31, 2017 and (67)% for the prior year’s comparative period. For the segments, the applied tax rate was 33 % for all quarters in 2017 and 35 % for all reported periods in 2015 and 2016.
At the Group level, tangible shareholders' equity is shareholders’ equity as reported in the Consolidated Balance Sheet excluding goodwill and other intangible assets. Tangible shareholders’ equity for the segments is calculated by deducting goodwill and other intangible assets from shareholders’ equity as allocated to the segments. Shareholders’ equity and tangible shareholders’ equity are presented on an average basis.
The Group believes that a presentation of average tangible shareholders’ equity makes comparisons to its competitors easier, and refers to this measure in the return on equity ratios presented by the Group. However, average tangible shareholders’ equity is not a measure provided for in IFRS, and the Group’s ratios based on this measure should not be compared to other companies’ ratios without considering differences in the calculations.
Allocation of Average Shareholders’ EquityStarting 2017, the Group has refined its capital allocation methodology. Shareholders’ equity is now fully allocated to the Group’s segments based on the regulatory capital demand of each segment and is no longer capped at the amount of shareholders’ equity required to meet the externally communicated targets for the Group’s Common Equity Tier 1 ratio and the Group’s Leverage ratio. Regulatory capital demand reflects the combined contribution of each segment to the Groups’ Common Equity Tier 1 ratio, the Groups’ Leverage ratio and the Group’s Capital Loss under Stress.
Contributions in each of the three dimensions are weighted to reflect their relative importance and level of constraint for the Group.
Contributions to the Common Equity Tier 1 ratio and the Leverage ratio are measured through Risk Weighted Assets (RWA) and Leverage Ratio Exposure (LRE) assuming full implementation of CRR/CRD 4 rules. The Group’s Capital Loss under Stress is a measure of the Group’s overall economic risk exposure under a defined stress scenario.
Goodwill and other intangibles continue to be directly attributed to the Group’s segments in order to allow the determination of allocated tangible shareholders’ equity and the respective returns.
Shareholders’ equity and tangible shareholders’ equity is allocated on a monthly basis and averaged across quarters and for the full year. All reported periods in 2015 and 2016 have been restated.
Segment average shareholders' equity in December 2015 represents the spot values for the period end. The difference between the spot values of the segments and the average Group amount is captured in C&A.
Deutsche Bank Q4 2017 Financial Data Supplement _________________________________________________________________________________________________________________________________________
Definition of certain financial measures (2/3)
20
We also set forth in this and other documents such CRR/CRD 4 measures on a “fully loaded” basis, reflecting full application of the rules without consideration of the transitional provisions under CRR/CRD 4. With respect to risk-weighting, we assumed until third quarter 2017 in our CRR/CRD 4 “fully loaded” methodology for a limited subset of equity positions that the impact of the expiration of these transitional rules will be mitigated through sales of the underlying assets or other measures prior to the expiration of the grandfathering provisions by end of 2017.
Since the fourth quarter 2017 we have not applied this grandfathering rule anymore, but instead applied a risk weight between 190 % and 370 % determined based on Article 155 CRR under the CRR/CRD 4 fully loaded rules to all our equity positions. Consequently, in this regard, there are no transitional arrangements any longer considered in our fully loaded RWA numbers for December 31, 2017. Only for the comparative periods these transitional rules within the risk weighting were still applicable
Such fully loaded metrics are described in (i) “Management Report: Risk Report: Risk and Capital Performance: Capital and Leverage Ratio” on pages 136 to 152 of our Annual Report 2016 and “Supplementary Information: Non-GAAP Financial Measures: Fully Loaded CRR/CRD 4 Measures” on pages 471 to 472 of our Annual Report 2016 and in (ii) the subsections “Management Report: Risk Report: Risk and Capital Performance: Regulatory Capital”, “Management Report: Risk Report: Leverage Ratio” and “Other Information (unaudited): Fully loaded CRR/CRD 4 Measures” of our our Q1, Q2 and Q3 Interim Reports. Such sections also provide reconciliation to the respective CRR/CRD 4 transitional or IFRS values.
As the final implementation of CRR/CRD 4 may differ from our expectations, and our competitors’ assumptions and estimates regarding such implementation may vary, our fully loaded CRR/CRD 4 measures may not be comparable with similarly labeled measures used by our competitors.
Allocation of Average Shareholders’ Equity (cont’d)For purposes of the 2017 average shareholders’ equity allocation the Non-Core Operations Unit (NCOU) balances from year-end 2016 have been allocated to Consolidation & Adjustments (C&A) as Non-Core Operations Unit (NCOU) has ceased to exist as a separate corporate division from 2017 onwards.
Adjusted CostsAdjusted costs is one of the key performance indicators outlined in our strategy. It is a non-GAAP financial measure for which the most directly comparable IFRS financial measure is noninterest expenses. Adjusted costs is calculated by deducting from noninterest expenses under IFRS (i) impairment of goodwill and other intangible assets, (ii) litigation, (iii) policyholder benefits and claims and (iv) restructuring and severances. Policyholder benefits and claims arose from the Abbey Life Assurance business which was sold in late 2016 and so will not occur in future periods. The Group believes that a presentation of noninterest expenses excluding the impact of these items provides a more meaningful depiction of the costs associated with our operating businesses.
Fully loaded CRR/CRD 4 MeasuresSince January 1, 2014, our regulatory assets, exposures, risk-weighted assets, capital and ratios thereof are calculated for regulatory purposes under CRR/CRD4. CRR/CRD 4 provides for “transitional” (or “phase-in”) rules, under which capital instruments that are no longer eligible under the new rules are permitted to be phased out as the new rules on regulatory adjustments are phased in, as well as regarding the risk weighting of certain categories of assets. In some cases, CRR/CRD 4 maintains transitional rules that had been adopted in earlier capital adequacy frameworks through Basel 2 or Basel 2.5. These relate e.g. to the risk weighting of certain categories of assets and include rules permitting the grandfathering of equity investments at a risk-weight of 100 %.
Deutsche Bank Q4 2017 Financial Data Supplement _________________________________________________________________________________________________________________________________________
Definition of certain financial measures (3/3)
21
Book Value and Tangible Book Value per Basic Share OutstandingBook value per basic share outstanding and tangible book value per basic share outstanding are non-GAAP financial measures that are used and relied upon by investors and industry analysts as capital adequacy metrics. Book value per basic share outstanding represents the Bank’s total shareholders’ equity divided by the number of basic shares outstanding at period-end. Tangible book value represents the Bank’s total shareholders’ equity less goodwill and other intangible assets. Tangible book value per basic share outstanding is computed by dividing tangible book value by period-end basic shares outstanding.
Cost ratiosCost/income ratio: Noninterest expenses as a percentage of total net revenues, which are defined as net interest income before provision for credit losses plus noninterest income.
Compensation ratio: Compensation and benefits as a percentage of total net revenues, which are defined as net interest income before provision for credit losses plus noninterest income.
Noncompensation ratio: Noncompensation noninterest expenses, which are defined as total noninterest expenses less compensation and benefits, as a percentage of total net revenues, which are defined as net interest income before provision for credit losses plus noninterest income.
Other key ratiosDiluted earnings per share: Net income (loss) attributable to Deutsche Bank shareholders, which is defined as net income (loss) excluding noncontrollinginterests, divided by the weighted-average number of diluted shares outstanding. Diluted earnings per share assume the conversion into common shares of outstanding securities or other contracts to issue common stock, such as share options, convertible debt, unvested deferred share awards and forward contracts.
Other key ratios (cont’d)Book value per basic share outstanding: Book value per basic share outstanding is defined as shareholders’ equity divided by the number of basic shares outstanding (both at period end).
Tangible book value per basic share outstanding: Tangible book value per basic share outstanding is defined as shareholders’ equity less goodwill and other intangible assets, divided by the number of basic shares outstanding (both at period-end).
Tier 1 capital ratio: Tier 1 capital, as a percentage of the risk-weighted assets for credit, market and operational risk.
Common Equity Tier 1 capital ratio: Common Equity Tier 1 capital, as a percentage of the risk-weighted assets for credit, market and operational risk.
Fully loaded CRR/CRD4 Leverage Ratio: Tier 1 capital (CRR/CRD4 fully loaded), as a percentage of the CRR/CRD4 leverage ratio exposure measure (fully loaded).
Phase-in CRR/CRD4 Leverage Ratio: Tier 1 capital (CRR/CRD4 phase-in), as a percentage of the phase-in CRR/CRD4 leverage ratio exposure measure (phase-in).
Deutsche Bank Q4 2017 Financial Data Supplement _________________________________________________________________________________________________________________________________________
Footnotes
22
1. We calculate our leverage ratio exposure on a fully loaded basis in accordance with Article 429 of the CRR as per Delegated Regulation (EU) 2015/62 of October 10, 2014 published in the Official Journal of the European Union on January 17, 2015 amending Regulation (EU) No 575/2013.
2. Definitions of ratios are provided on pages 19, 20 and 21 of this document. 3. At period end. 4. Regulatory capital amounts, risk weighted assets and capital ratios are based upon
CRR/CRD 4 fully-loaded.5. The reconciliation of adjusted costs is provided on page 18 of this document.6. The reconciliation of average tangible shareholders‘ equity is provided on page 15-17
of this document.7. The number of average basic and diluted shares outstanding has been adjusted for
all periods before April 2017 in order to reflect the effect of the bonus component of subscription rights issues in April 2017 in connection with the capital increase.
8. Earnings were adjusted by € 298 million, € 276 million and € 228 million net of tax for the coupons paid on Additional Tier 1 Notes in April 2017, April 2016 and April 2015, respectively. The coupons paid on Additional Tier 1 Notes are not attributable to Deutsche Bank shareholders and therefore need to be deducted in the calculation in accordance with IAS 33.Diluted Earnings per Common Share include the numerator effect of assumed conversions. In case of a net loss potentially dilutive shares are not considered for the earnings per share calculation, because to do so would decrease the net loss per share.
9. Source for share price information: Bloomberg, based on XETRA; high and low based on intraday prices. To reflect the capital increase in 2017, the historical share prices up to and including March 20, 2017 (last trading day cum rights) have been adjusted with retroactive effect by multiplication with the correcting factor of 0.8925 (R-Factor).
10. Includes net interest income and net gains (losses) on financial assets/liabilities at fair value through profit or loss, net fee and commission income and remaining revenues.
11. Reflects front office employees and related Infrastructure employees (allocated on a pro forma basis).
12. Segment assets represent consolidated view, i.e. the amounts do not include intersegment balances (except for Central Liquidity Reserves, Shorts Coverage, Liquidity Portfolio and Repack reallocations from CIB to PCB and NCOU, regarding assets consumed by other segments but managed by CIB).
13. Contains Group-neutral reallocation of Central Liquidity Reserves to business divisions, majority re-allocated from CIB to PCB.
14. Assets under Management include assets held on behalf of customers for investment purposes and/or assets that are managed by DB. They are managed on a discretionary or advisory basis or are deposited with DB.
15. Annualized management fees devided by average Assets under Management.16. Includes provision for loan losses and provision for off-balance sheet positions. 17. Impaired loan coverage ratio: balance of the allowance for loan losses as a percentage
of impaired loans (both at period end).18. Excluding actuarial gains (losses) related to defined benefit plans, net of tax.19. Includes Additional Tier 1 Notes, which constitute unsecured and subordinated notes of
Deutsche Bank and are classified as equity in accordance with IFRS.20. Based on Net income (loss) attributable to Deutsche Bank shareholders (Post-tax).