Embed Size (px)
Citation preview
Tim Kaiser, Annamaria Lusardi, Lukas Menkhoff, and Carly Urban
Financial Education Affects Financial Knowledge and Downstream Behaviors effect of financial
May 28, 2020
1
Main question and relevance
Does financial education work?
Many countries (more than 70) have designed or are designing national strategies for financial literacy
It is important to rely on data and evidence
What does the evidence say?
2
A new meta-analysis
The research on financial literacy has exploded (thanks OECD-INFE)
Financial literacy has its own code in the Journal of Economic Literature (JEL) classification: G53! It is officially a field
Very hard to do a narrative review of so much work
A meta-analysis is a systematic quantitative literature review aggregating evidence from multiple studies on the same research question
3
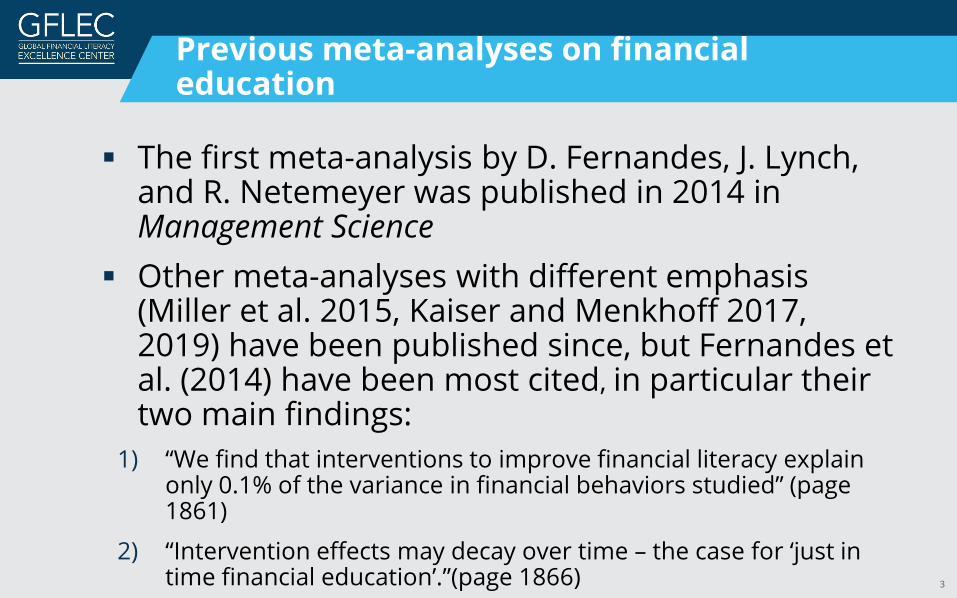
Previous meta-analyses on financial education
The first meta-analysis by D. Fernandes, J. Lynch, and R. Netemeyer was published in 2014 in Management Science
Other meta-analyses with different emphasis (Miller et al. 2015, Kaiser and Menkhoff 2017, 2019) have been published since, but Fernandes et al. (2014) have been most cited, in particular theirtwo main findings:
1) “We find that interventions to improve financial literacy explain only 0.1% of the variance in financial behaviors studied” (page 1861)
2) “Intervention effects may decay over time – the case for ‘just in time financial education’.”(page 1866)
4
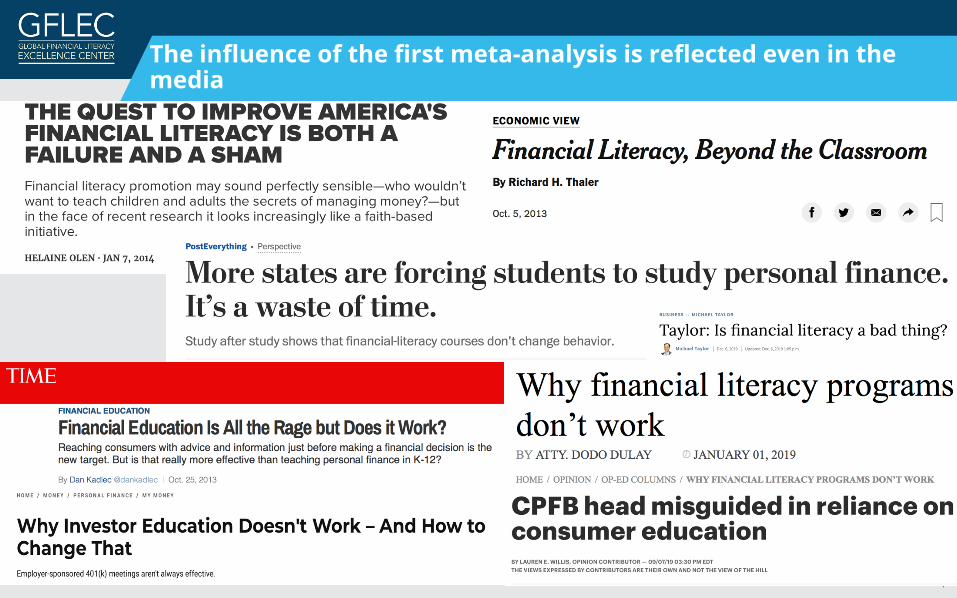
The influence of the first meta-analysis is reflected even in the media
5
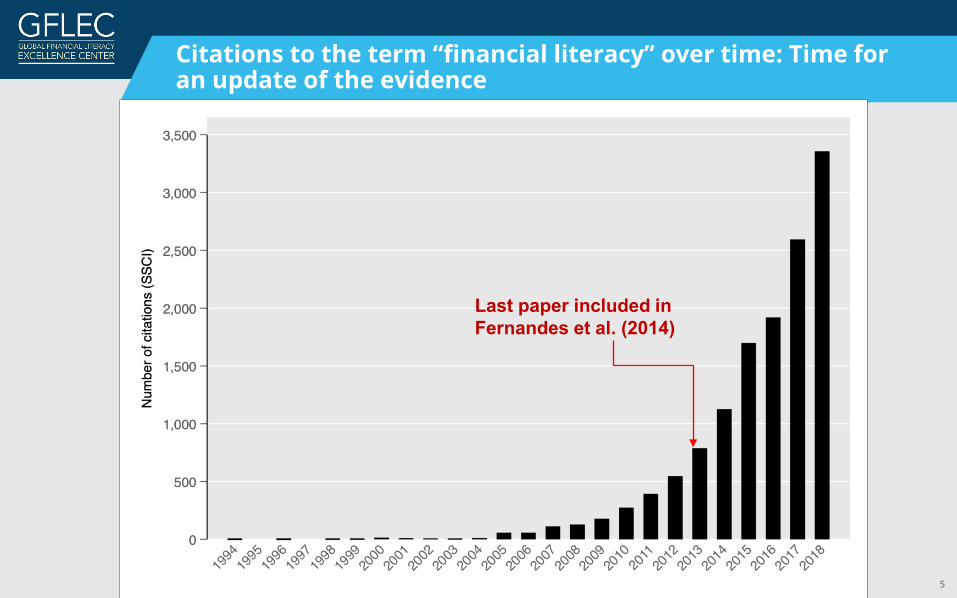
Citations to the term “financial literacy” over time: Time for an update of the evidence
Last paper included in Fernandes et al. (2014)
6
New meta-analysis relative to Fernandes et al. (2014)
Our study includes 76 RCTs (vs. 13) from 33 countries (vs. 8) with over 160,000 (vs. 23,000) individuals across the lifespan
We focused on the most rigorous studies (RCTs) only, where effects are usually found to be smallest
The sample include many low-income countries and experiments on low income individuals
Effects are measured after 30 weeks, on average, and up to more than two years. If there is a decay, effects are likely to be small
7
A preview of the findings
We found that: The estimated effect of financial education is at
least three times as large as the effect documented in Fernandes et al. (2014)
Accounting for differences in programs, effects are more than five times as large as the effects reported in Fernandes et al. (2014)
We do not find clear evidence of a dramatic decay of the effects of financial education over time. Effects persist up to two years after intervention
8
What we do in this paper
(1) We take stock of the new evidence− Focus on RCTs, which are considered the gold
standard of impact evaluation − Include all earlier studies and more than
quintuple the number of RCTs (from 13 to 76)− Many more studies in top economics-journals− Can look at different types of behavior in
addition to financial knowledge
9
What we do (cont.)
(2) Meticulous meta-analysis of these RCTs:− Account for heterogeneity in the effects of
financial education− Probe sensitivity of results to the choice of
model and interpretation of results− Consider the power of underlying studies− Considering potential publication bias− Analysis of intensity and decay of effects− Subgroup analyses
10
What we do in this paper (cont.)
(3) Calculations of the economic size of the effects and analysis of cost-effectiveness− What do the statistical effect sizes mean in
economic terms?− What is the average cost of financial education
and is it cost-effective?
11
Toward a meta-analysis
Main issues:
We have a large number of studies and many estimates of the effects of financial education
Papers may study multiple outcomes (e.g., different behaviors are studied)
Outcomes may vary across studies (e.g., some studies look at saving rates and others at the savings amount)
Interventions vary across studies; e.g., from giving an informational brochure to time-intense education programs
12
A primer on meta-analysis
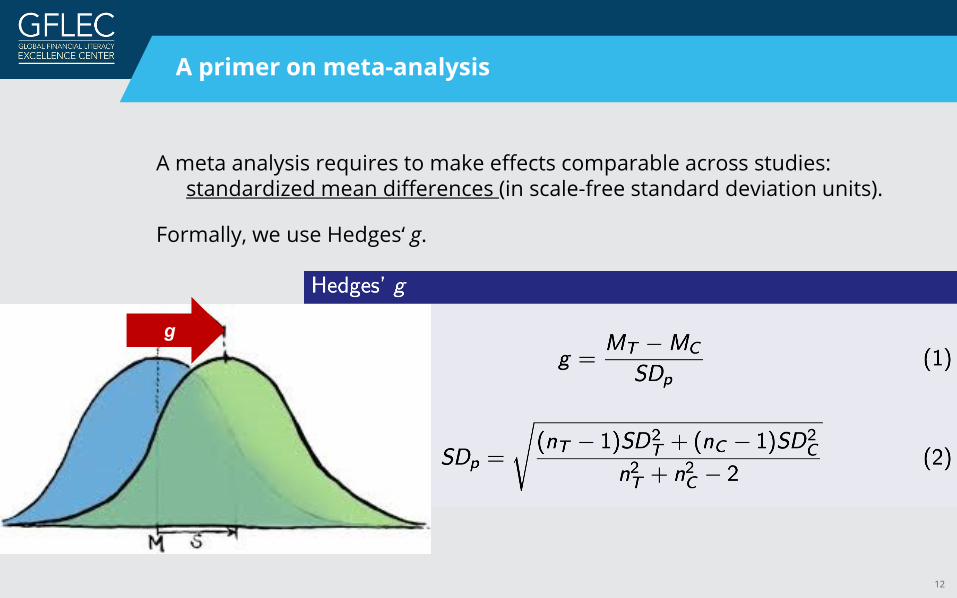
A meta analysis requires to make effects comparable across studies: standardized mean differences (in scale-free standard deviation units).
Formally, we use Hedges‘ g.
g
13
Example
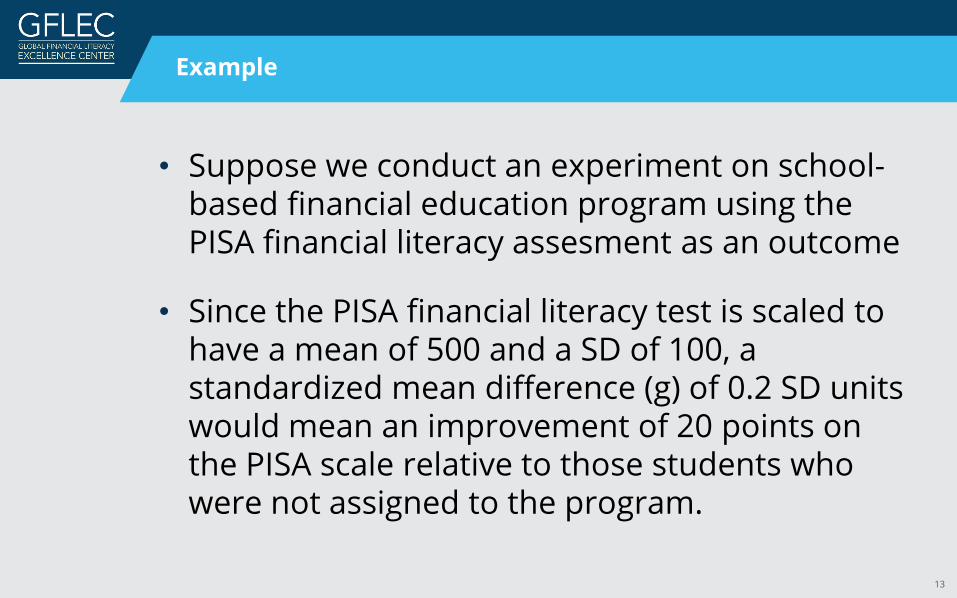
• Suppose we conduct an experiment on school-based financial education program using the PISA financial literacy assesment as an outcome
• Since the PISA financial literacy test is scaled to have a mean of 500 and a SD of 100, a standardized mean difference (g) of 0.2 SD units would mean an improvement of 20 points on the PISA scale relative to those students who were not assigned to the program.
14
A primer on meta-analysis
Meta-analysis model:
Consider a set of randomized experiments, each of them reporting estimates of treatment effects relative to a control group
Allow different experiments to result in different effects caused by the educational interventions (i.e., heterogeneity)
Since the goal is to arrive at a “general effect” of financial education, one has to choose weights for each study that reflect the size of study (measurement error) and the actual differences in results (true heterogeneity)
15
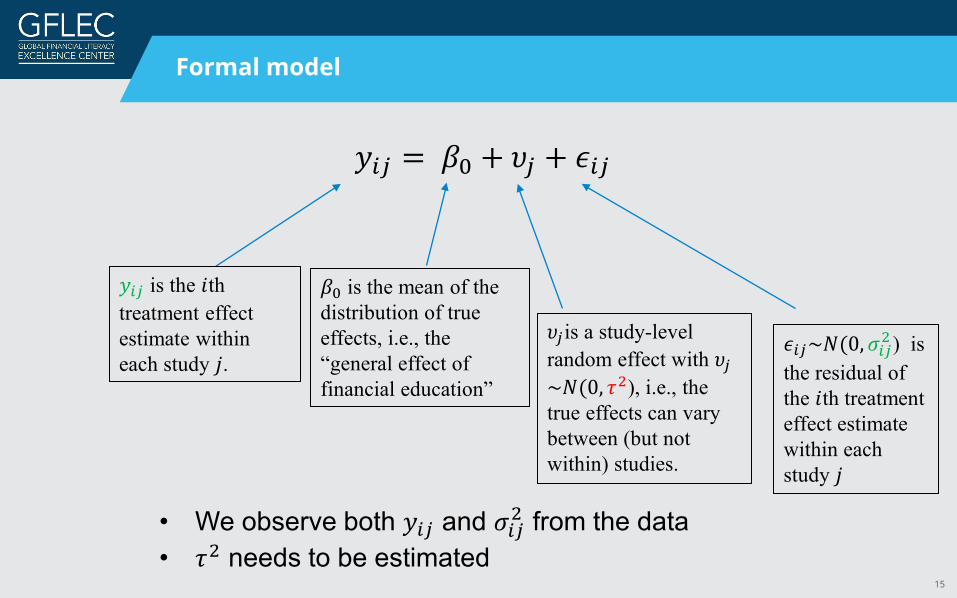
Formal model
𝑦𝑦𝑖𝑖𝑖𝑖 = 𝛽𝛽0 + 𝜐𝜐𝑖𝑖 + 𝜖𝜖𝑖𝑖𝑖𝑖
𝑦𝑦𝑖𝑖𝑖𝑖 is the 𝑖𝑖thtreatment effect estimate within each study 𝑗𝑗.
𝛽𝛽0 is the mean of the distribution of true effects, i.e., the “general effect of financial education”
𝜐𝜐𝑖𝑖is a study-level random effect with 𝜐𝜐𝑖𝑖~𝑁𝑁(0, 𝜏𝜏2), i.e., the true effects can vary between (but not within) studies.
𝜖𝜖𝑖𝑖𝑖𝑖~𝑁𝑁(0,𝜎𝜎𝑖𝑖𝑖𝑖2 ) is the residual of the 𝑖𝑖th treatment effect estimate within each study 𝑗𝑗
• We observe both 𝑦𝑦𝑖𝑖𝑖𝑖 and 𝜎𝜎𝑖𝑖𝑖𝑖2 from the data• 𝜏𝜏2 needs to be estimated
16
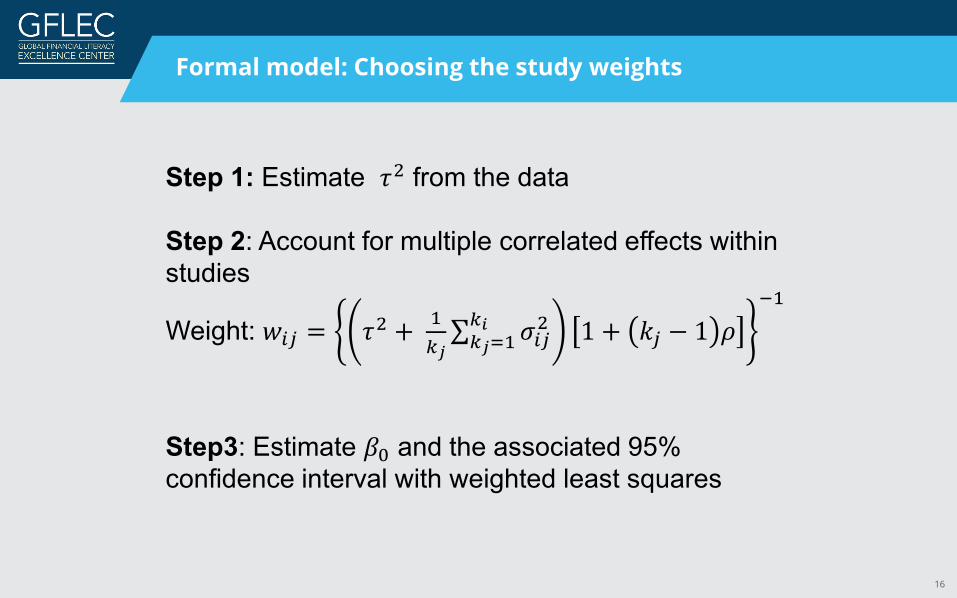
Formal model: Choosing the study weights
Step 1: Estimate 𝜏𝜏2 from the data
Step 2: Account for multiple correlated effects within studies
Weight: 𝑤𝑤𝑖𝑖𝑖𝑖 = 𝜏𝜏2 + 1𝑘𝑘𝑗𝑗∑𝑘𝑘𝑗𝑗=1𝑘𝑘𝑖𝑖 𝜎𝜎𝑖𝑖𝑖𝑖2 1 + 𝑘𝑘𝑖𝑖 − 1 𝜌𝜌
−1
Step3: Estimate 𝛽𝛽0 and the associated 95% confidence interval with weighted least squares
17
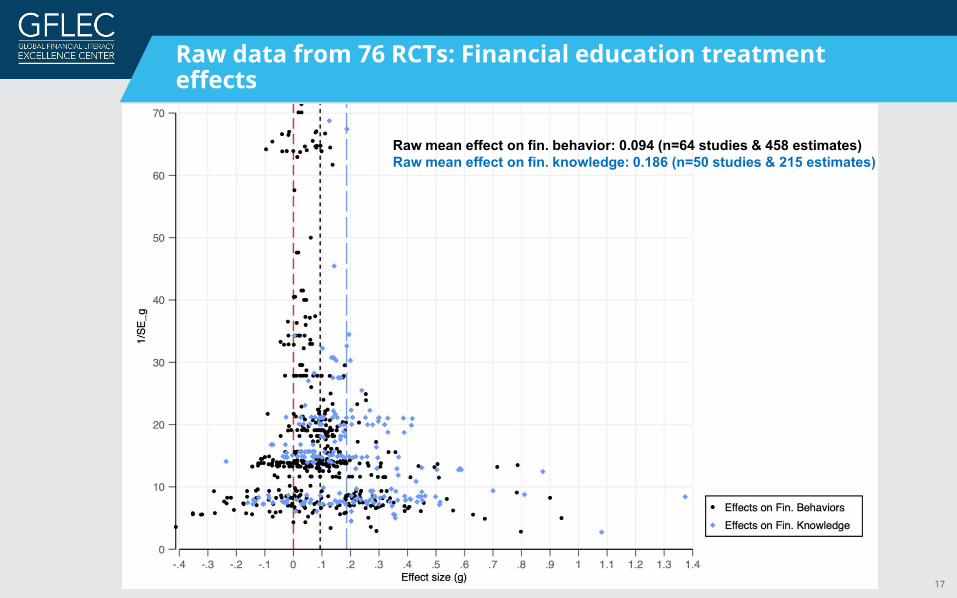
Raw data from 76 RCTs: Financial education treatment effects
Raw mean effect on fin. behavior: 0.094 (n=64 studies & 458 estimates) Raw mean effect on fin. knowledge: 0.186 (n=50 studies & 215 estimates)
18
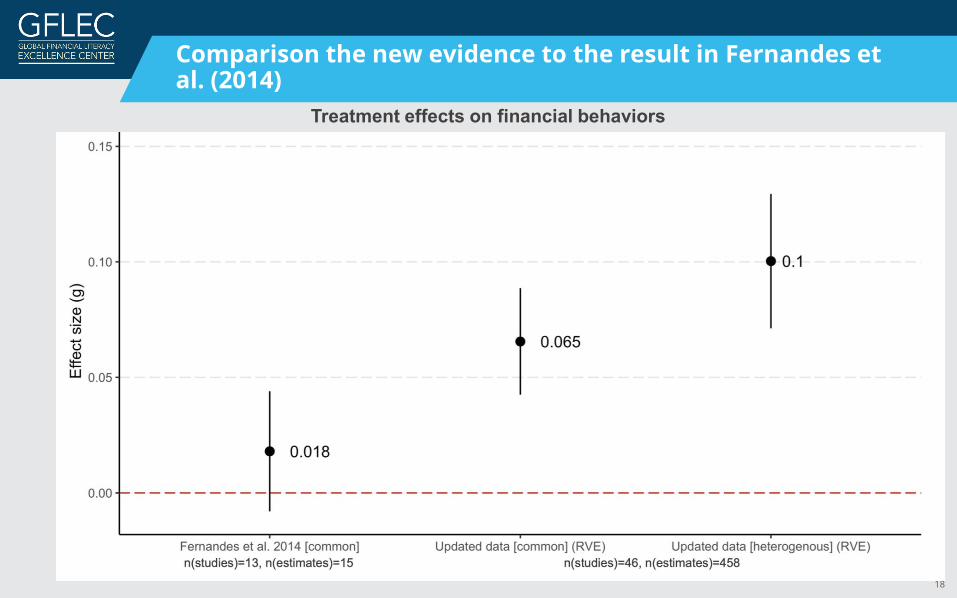
Comparison the new evidence to the result in Fernandes et al. (2014)
Treatment effects on financial behaviors
19
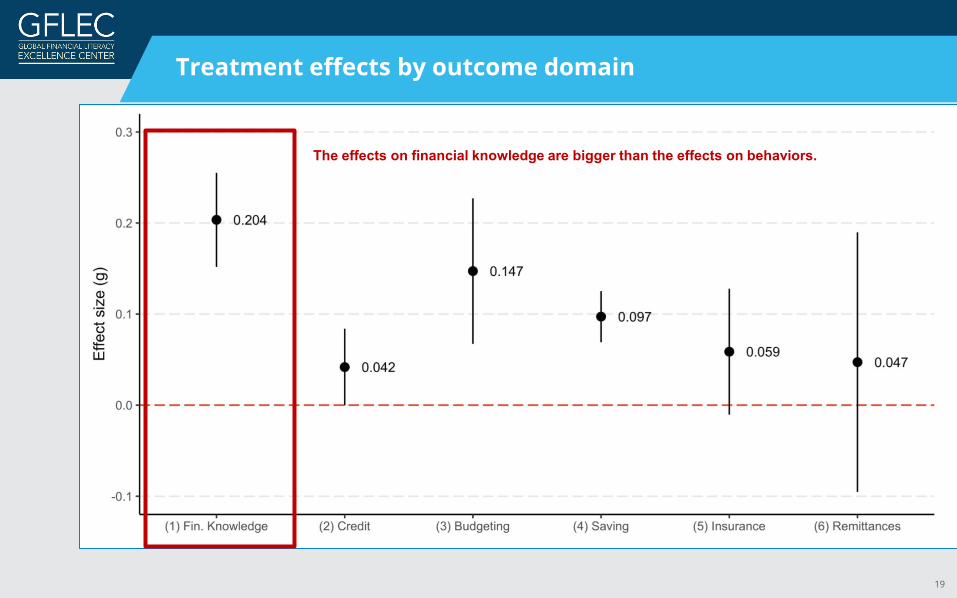
Treatment effects by outcome domain
The effects on financial knowledge are bigger than the effects on behaviors.
20
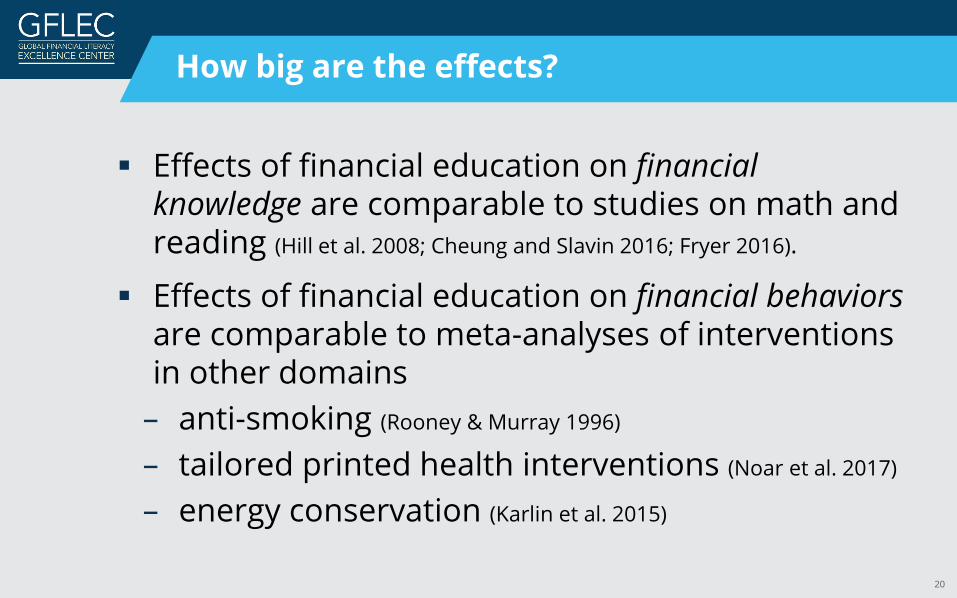
How big are the effects?
Effects of financial education on financial knowledge are comparable to studies on math and reading (Hill et al. 2008; Cheung and Slavin 2016; Fryer 2016).
Effects of financial education on financial behaviors are comparable to meta-analyses of interventions in other domains
– anti-smoking (Rooney & Murray 1996)
– tailored printed health interventions (Noar et al. 2017)
– energy conservation (Karlin et al. 2015)
21
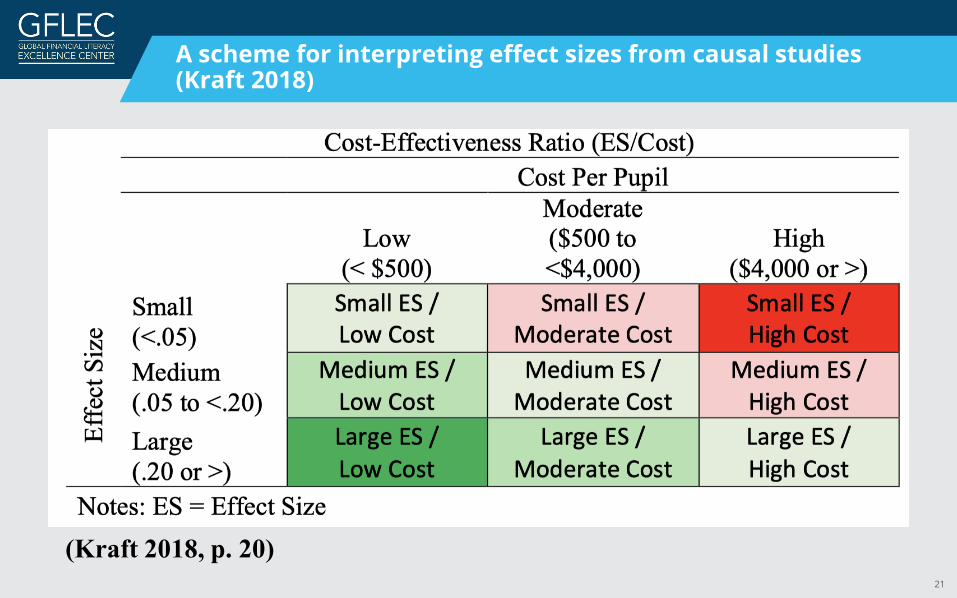
A scheme for interpreting effect sizes from causal studies (Kraft 2018)
(Kraft 2018, p. 20)
22
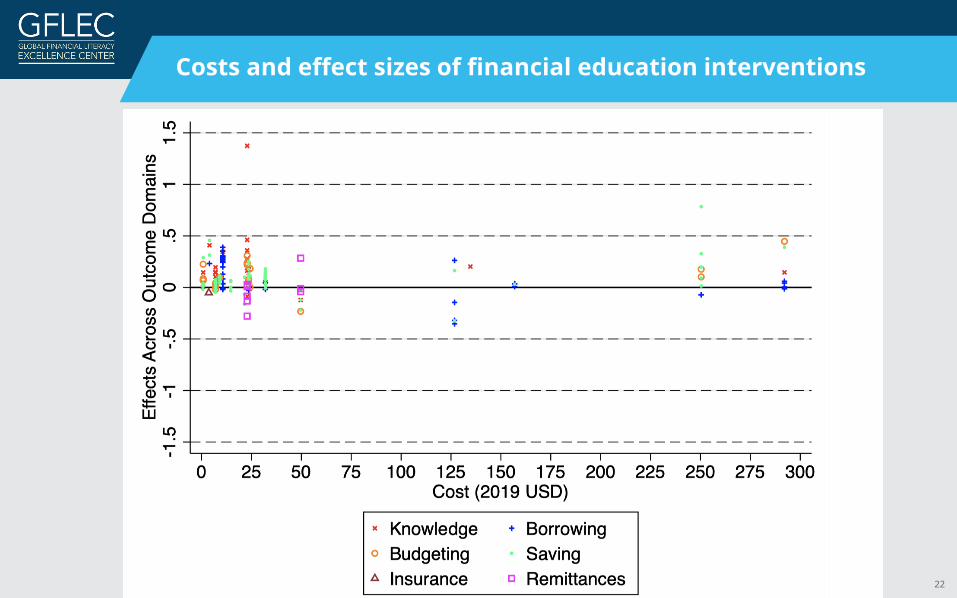
Costs and effect sizes of financial education interventions
23
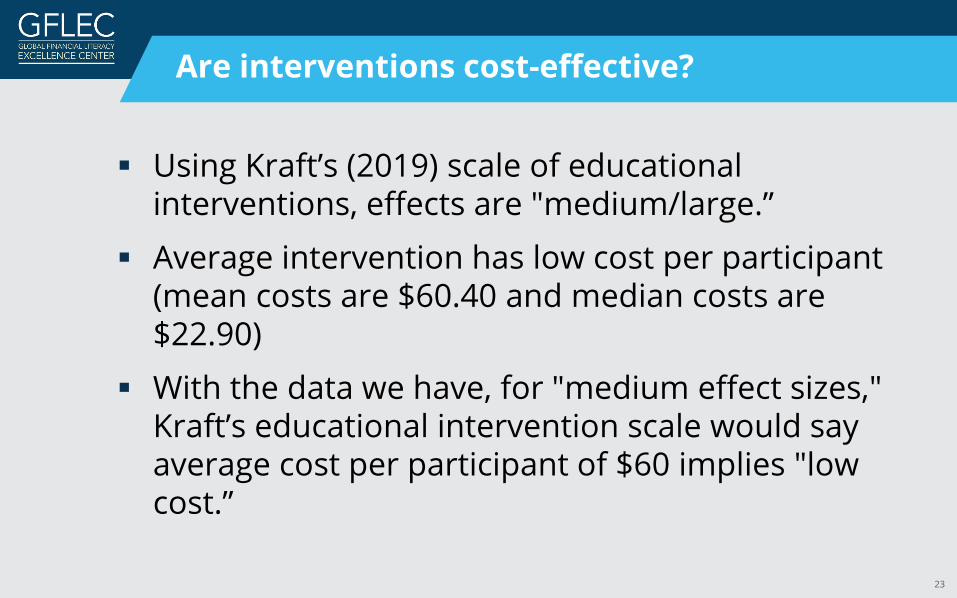
Are interventions cost-effective?
Using Kraft’s (2019) scale of educational interventions, effects are "medium/large.”
Average intervention has low cost per participant (mean costs are $60.40 and median costs are $22.90)
With the data we have, for "medium effect sizes," Kraft’s educational intervention scale would say average cost per participant of $60 implies "low cost.”
24
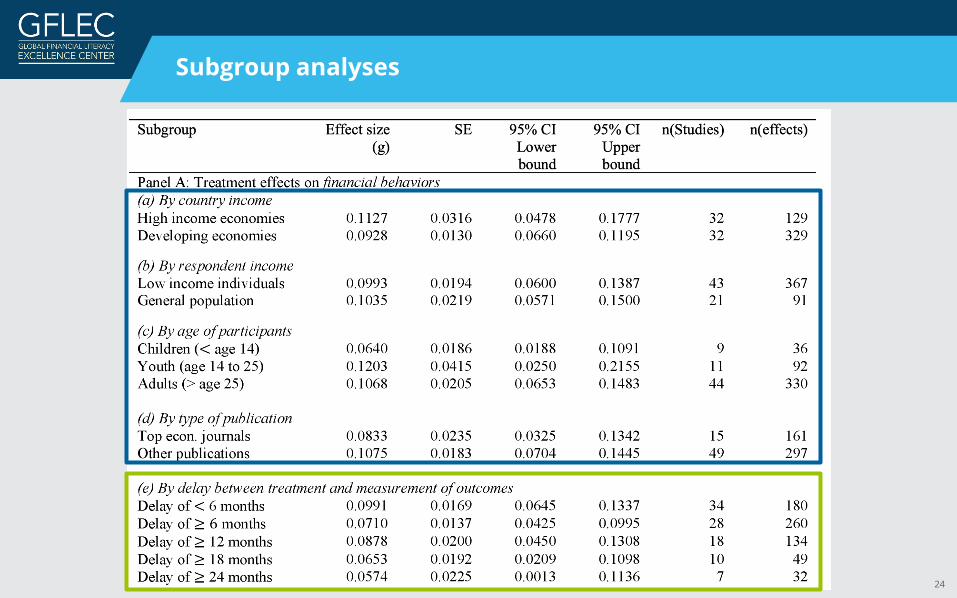
Subgroup analyses
25
Findings among sub-groups (1st block of the table)
No significant differences between high-income and developing economies (effects on behavior)
No significant differences between low-income individuals and general population
No differences across publications (if in top journals or not)
Financial education works for all age groups
26
Do the effects decay over time? (2nd block of the table)
Different from the initial meta-analysis (Fernandes et al 2014), we find no evidence to support or refute decay of effects 6 months or more after the intervention.
Note that their prediction was based on a very small sample of studies.
The effect on financial knowledge is estimated to be positive after more than one year in 5 studies.
The effect on behavior is estimated to be positive after more than two years after intervention in 7 studies
27
Main takeaways
1) Financial education works! Recent work shows clear evidence of positive effects of financial education on financial behaviors (+knowledge) Statistical effect size is at three times as large as the effect in
Fernandes et al. (2014) It may be up to five times as large (when allowing for between-
study heterogeneity in true effects) Robust to a lot of different approaches to meta-analysis and
even when accounting for publication selection for statistical significance
2) Policy recommendations should be based on economic effect sizes, not statistical effect sizes
3) No evidence of “rapid decay” but no evidence against it either
28
Final considerations
We need:
• more research on the long-term effectiveness of financial education programs
• more evidence on large-scale financial education programs
• more work on the cost-effectiveness of programs
• an academic journal dedicated to research on financial literacy and financial education (financial literacy is officially a field indexed in the JEL)
29
Financial education and Covid-19
• Now more than ever, people need to have the knowledge and skills to navigate the financial landscape (“sailing lessons show their worth during a storm”)
• It is important for families to be financially resilient to shocks, both big and small
• Financially resilient families will contribute to a more financially resilient society
Financial education programs can help achieve that goal!
30
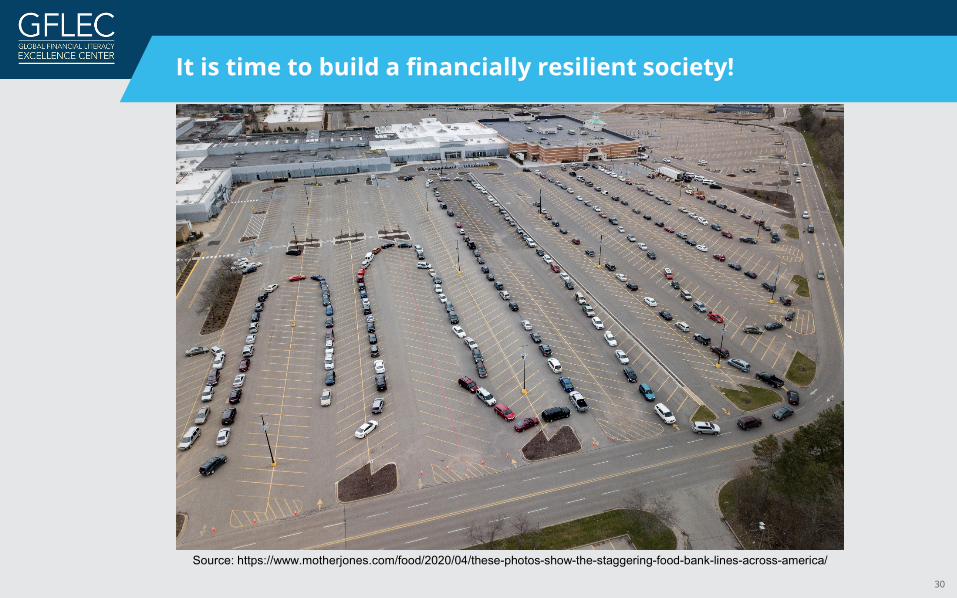
It is time to build a financially resilient society!
Source: https://www.motherjones.com/food/2020/04/these-photos-show-the-staggering-food-bank-lines-across-america/

Thank you!

Additional slides
33
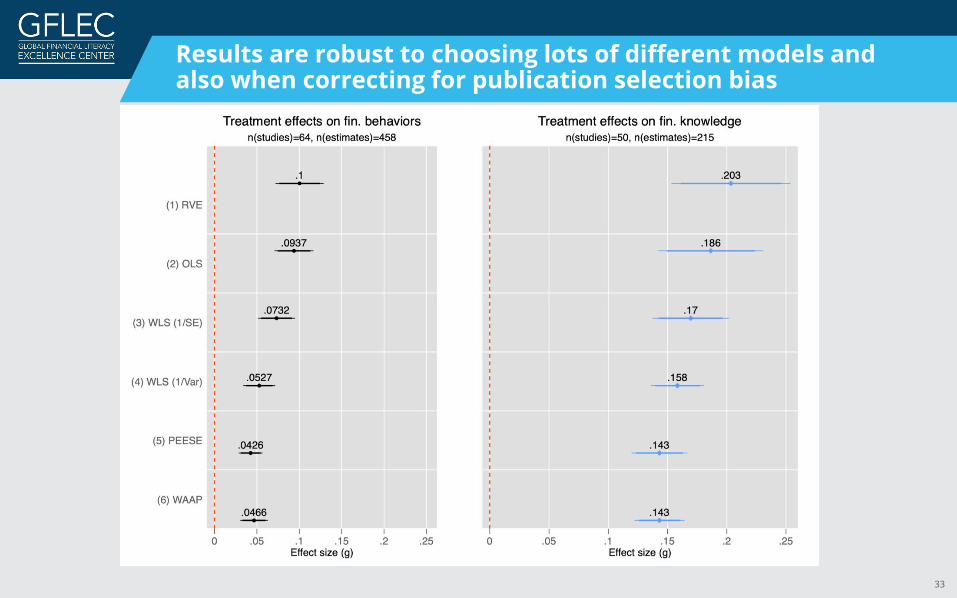
Results are robust to choosing lots of different models and also when correcting for publication selection bias
34
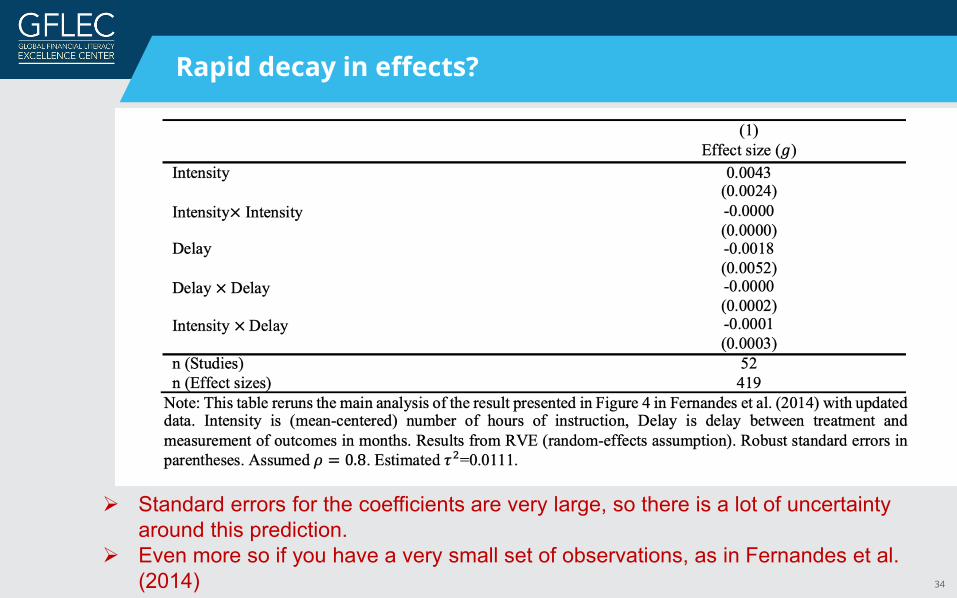
Rapid decay in effects?
Standard errors for the coefficients are very large, so there is a lot of uncertainty around this prediction.
Even more so if you have a very small set of observations, as in Fernandes et al. (2014)
35
Economic vs. statistical significance
Fernandes et al. (2014) effect size measure creates the illusion of miniscule effects, when they can be economically significant.
– “variance explained” is a misleading concept
Consider the following example: – Median effect of structured pedagogy interventions in developing countries =
0.13 SD units. (Evans et al. 2019) – In the Fernandes et al. (2014) metric: this intervention explains 0.36% of the
variance in learning outcomes. Seems small?
– Evans et al. (2019) report that this effect = ~0.6 years of “business as usual schooling”
– In separate analysis they estimate the returns to literacy in Kenya. The net present value of this intervention is 1,338 USD at an average annual income of 1,079 USD in 2015 PPP. Economically, this effect appears to be large.
36
External Validity
There are concerns that RCTs may have limited external validity.
This study increases the number of individuals in the interventions from Fernandes, Lynch, and Netermeyer (2014) from 23,000 to over 140,000.
But what about scale?
Findings are consistent with recent work studying post-2000 state-mandated financial education in U.S. high schools that relies upon quasi-experimental research. (Brown et Al, 2016; Harvey, 2019; Urban et Al, 2018; Stoddard and Urban, 2019)
Findings also consistent with large-scale RCTs, such as the school-based RCTs (e.g., Frisancho (2018))
37
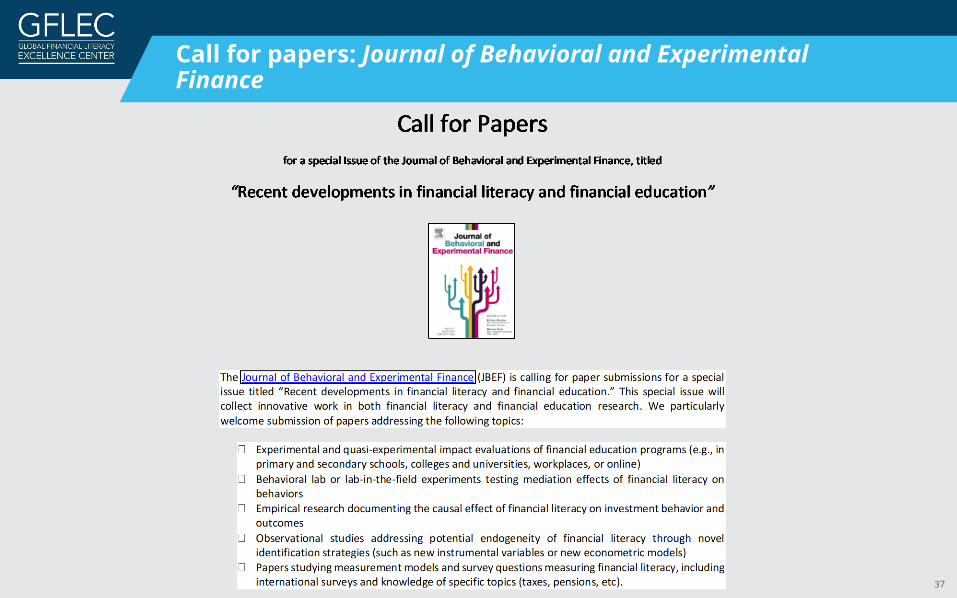
Call for papers: Journal of Behavioral and Experimental Finance

(202) 994-7148 | [email protected] | www.gflec.org