Embed Size (px)
Citation preview
Financial Firm Bankruptcy and Contagion
Jean Helwegea
University of South Carolina
and
Gaiyan Zhang
University of Missouri – St. Louis
May 28, 2013
JEL Classification: G21, G24, G28, G32, G33, E44, E58, E61
Keywords: Banks, counterparty contagion, information contagion, bankruptcy
We thank Giovanni Bassani, Ryan Benitez, Brian Betker, Régis Blazy, Art Boman, Nicole
Boyson, Kelly Cai, Moorad Choudhry, Pierre Collin-Dufresne, Lee Crabbe, Sergei Davydenko,
Shingo Goto, Robin Grieves, Jay Huang, Hung-gay Fung, Peter Iliev, Kevin James, Jan Jindra,
Stephen Lubben, Chris Muscarella, Matt Pritsker, Marianne Schulze-Ghattas, Larry Wall, Gang
Xiao, DH Zhang, and seminar participants at Auckland University of Technology, University of
Canterbury, Humboldt University, London School of Economics, North Carolina State
University, Northeastern University, the Office of Financial Research, Penn State University, St.
Louis University and University of South Carolina for helpful comments. Ruixue Geng, Raluca
Roman and Liyang Wang provided excellent research assistance.
a Corresponding author is Helwege: email – [email protected]. Phone – (803) 777-
4926
Zhang: email – [email protected]. Phone – (314)5166269.
Financial Firm Bankruptcy and Contagion
ABSTRACT
The Lehman bankruptcy highlights the potential for interconnectedness to cause negative
externalities through counterparty contagion, but the externalities may also arise from
information contagion. We examine contagion from troubled financial firms and find that
counterparty contagion is greater during recessions and in cases of riskier firms and larger and
more complex exposures. However, the counterparty exposures are small, especially among
banks that face diversification regulations, and do not typically cause a cascade of failures.
Information contagion is stronger for rivals in the same locale or the same line of business and is
stronger in cases of distress than in bankruptcies.
1
When companies file for bankruptcy other firms in the same industry often suffer as a result.
Lang and Stulz (1992) conclude that rivals’ stocks drop in response to the news because
investors learn about future industry cash flows from the filing. Consistent with their work,
Jorion and Zhang (2007) report that credit default swap (CDS) premiums typically rise for firms
in the same industry after a default. Theocharides (2008) and Hertzel and Officer (2012) show
evidence of similar patterns for corporate bonds and bank loans, respectively.1
While these studies show a significant industry impact from corporate bankruptcy, the
nature of the contagion is not well understood. The effects on other firms may owe to
information flows, which arise when the bankruptcy causes investors to update their beliefs
about firms that share similar characteristics of the failed firm (information contagion).2
However, the effects may also reflect counterparty contagion which occurs when a distressed
firm imposes losses on its creditors (Jorion and Zhang, 2009), or when a distressed firm
withdraws funding from its borrowers (Ivashina and Scharfstein, 2010).3 Losses for
counterparties seem more probable in cases of financial firms, which are more likely to do
business with other firms in the industry. Since the subprime crisis, many researchers have
emphasized interbank relationships and their potential for generating contagion. For example,
Acharya, Brownlees, Engle, Farazmand, and Richardson (2010) assert that “interconnections…in
a crisis may transfer risk and losses across financial firms, resulting in cascading failures.”
1Rivals’ securities prices may actually improve with the bankruptcy announcement if the event suggests lower capacity for the
industry and thus higher profits. Such positive returns are uncommon, but Zhang (2010) finds significant competitive effects
when firms exit bankruptcy.
2See Lang and Stulz (1992), Benzoni, Collin-Dufresne, Goldstein and Helwege (2012), and Veronesi (2000).
3 We use the term contagion to focus on causality, as opposed to firm correlations that may not involve a causal link.
Counterparty contagion arises from various kinds of bilateral transactions, which is different from other forms of contagion that
occur in intermediated markets (see Staum (2012)).
2
Rochet (2010) declares that the “complex nexus of OTC transactions” in interbank markets
generates negative externalities, so that one firm’s troubles may cause others. However, the
degree of bank interconnectedness, the severity of interbank contagion via counterparties, and its
impact on systemic risk in the U.S. financial system require more quantitative research.
The policy implications of financial firm failures vary sharply with the nature of the
contagion. As Helwege (2010) notes, if counterparty contagion dominates then aid to business
partners and clients of the bankrupt financial firm will be the most effective way to mitigate the
impact of a shock. In contrast, if information contagion is a larger source of valuation effects,
then government policy should focus on strategies that apply to a wide swath of the economy
rather than to a small set of firms with direct exposures to the failing firm.4
In this paper we investigate whether counterparty contagion and information contagion are
significant sources of contagion from troubled financial firms over the period 1980-2010. We
evaluate counterparty contagion by considering the breadth and magnitude of counterparty
exposures, as well as the impact of bankruptcies on equity returns and the frequency of cascades
of distress. We identify counterparties from bankruptcy court filings (see Jorion and Zhang
(2009)) and from sources related to the failures of Lehman Brothers and American International
Group (AIG). To examine whether information contagion is also a significant source of
contagion after controlling for counterparty effects, we extend the approach of Lang and Stulz
(1992) to firms in the same industry that operate in the same locale or that have similar assets
while excluding rivals that are also creditors of the failed firms.
4 Allen, Babus and Carletti (2009) conclude that “The developments after Lehman….in September 2008 suggest that contagion is
indeed a serious problem. However, contagion did not manifest itself as a wave of failures suggesting a more complex
phenomenon that is currently not well understood. A full understanding of contagion is necessary before adequate policy
responses can be designed.”
3
Overall, our study provides quantitative evidence that contagion among financial firms
reflects the similarity of financial firms’ business models as much as interbank lending. Both
counterparty contagion and information contagion have significant effects on other firms’ stock
prices. Counterparty contagion effects are larger for firms with greater exposures and exposures
involving derivatives, for firms with higher equity return volatilities, and during recessions.
Nonetheless, counterparty contagion effects are modest for most financial firm bankruptcies,
especially for commercial banks, which likely reflect the fact that many financial firms are
required to hold diversified portfolios. Furthermore, counterparty contagion does not typically
cause a cascade of failures. Information contagion effects are stronger for rivals in the same
locale or the same line of business and are stronger in cases of distress than in bankruptcies.
We show that counterparty risk is limited because exposures of other financial firms are
fairly small, which reflect regulations about diversification and the fact that undiversified risk is
not rewarded by the market. We find a higher degree of interconnectedness for Lehman and
AIG, but most of their creditors had exposures that were no more than ten percent of their equity.
These results support Scott (2012), who argues that interconnectedness was not the primary
driver of systemic risk in the recent financial crisis.
Contrary to prior studies of information contagion, such as Lang and Stulz (1992), we do not
find significant valuation effects on stocks in the same industry. However, we do find
information contagion when we examine firms in the same locale or the same line of business,
consistent with studies indicating that geographic proximity and similarity of assets are
significant determinants of other banks’ revaluations (Aharony and Swary (1996), Karafiath and
Glascock (1989) and Dickinson, Peterson, and Christiansen (1991)).5 These effects persist after
controlling for equity correlations between distressed firms and their rivals. We find stronger 5Pirinsky and Wang (2006) show strong comovements in the stock returns of firms headquartered in the same geographic area.
4
results for cases of distress, suggesting that information contagion is significant among firms that
are considered “too big to fail” (TBTF).
Ours is the first study to examine counterparty contagion and information contagion with a
large sample of financial firm bankruptcies and distresses. While counterparty contagion theory
highlights the damage that interconnectedness might cause in a financial system collapse,
empirical evidence that speaks to this channel is limited. One challenge in testing counterparty
contagion is to identify the counterparty relationship and the magnitude of the exposure. Our
study is able to overcome this hurdle with detailed information about counterparty and actual
exposure amounts. Our paper is closely related to Jorion and Zhang (2009) and Hertzel, Li,
Officer and Rodgers (2008) who examine ties between bankrupt firms and their creditors and
suppliers. While each finds significant negative valuation effects, most of their sample firms are
in the nonfinancial sector and their sample periods end before the recent financial crisis. Other
related papers include Ivashina and Scharfstein (2010), who examine linkages between banks
and their borrowers, and Furfine (2003), who uses data on interbank fund flows to simulate the
impact of various failure scenarios. In addition, several studies of counterparty contagion in the
wake of the financial crisis are based on a single large bankruptcy, such as that of Lehman
(Aragon and Strahan (2012), Chakrabarty and Zhang (2012), Fernando, May and Megginson
(2012), and Jorion and Zhang (2012)) or a large bank in India (Iyer and Peydró (2011)).
Information contagion from financial firm failures is examined by Aharony and Swary
(1983, 1996), Fenn and Cole (1994), Fields, Ross, Ghosh, and Johnson (1994), Fields, Klein, and
Myskowski (1998), Jorion and Zhang (2012) and Chakrabarty and Zhang (2012). However, few
of these authors consider counterparty risk and most examine a small sample of distressed
financial firms. Furthermore, most information contagion studies investigate spillover effects at
5
the industry level, whereas we conduct a finer analysis to test information contagion on industry
rival firms that share similar characteristics as distressed firms.
Our study contributes to a large literature on financial contagion channels including recent
papers on fire sales ((e.g, Allen, Babus, and Carletti (2011), Brunnermeier (2009), Shleifer and
Vishny (2011), and Wagner (2011)) and market liquidity (e.g., Boyson, Stahel and Stulz (2010),
Brunnermeier and Pedersen (2009), Covitz, Liang, and Suarez (2012), Dudleya and
Nimalendrana (2011), Gorton and Metrick (2012), Kacperczyk and Schnabl (2010), Longstaff
(2010), Mitchell and Pulvino (2012), and Strahan and Tanyeri (2013)). Fire sales might explain
why we find stronger information contagion effects for firms operating in the same business, as
they are likely to hold similar assets and would suffer greater losses from fire sales. Similarly,
industry information contagion effects may reflect liquidity problems among firms that rely on
the same markets for funding. We note that most of these studies rely on aggregate data whereas
our study is based on micro-level risk at the firm level.
In the next section we review related studies and present testable hypotheses. Section 2
summarizes our data and provides details on the event study methodology; Section 3 presents
empirical results and robustness tests; and Section 4 concludes.
1. Analytical Framework
Federal Reserve Chairman Ben Bernanke summarized the logic of counterparty contagion
theories well in his March 2009 television interview on CBS:
Interviewer: “Mr. Chairman, there are so many people…who say, ‘To hell with them.
They made bad bets. The wages of failure on Wall Street should be failure.’”
6
Bernanke: “Let me give you an analogy. If you have a neighbor who smokes in bed…If
suppose he sets fire to his house, and you might say to yourself, you know ‘I’m not
going to call the fire department. Let his house burn down. It’s fine with me.’ But then
of course,…what if your house is made of wood? And it’s right next door to his house?
What if the whole town is made of wood?...What needs to be done to make sure this
doesn’t happen in the future? How can we fireproof our houses? That’s where we are
now. We have a fire going on.”
Bernanke’s analogy aligns well with models of the interbank lending market posited by
Rochet and Tirole (1996), Allen and Gale (2000), and Eisenberg and Noe (2010), as well as with
the corporate bond pricing models of Jarrow and Yu (2001), Davis and Lo (2001), Giesecke and
Weber (2004), and Kraft and Steffensen (2007)). Counterparty risk is also an important element
of derivatives pricing (e.g., Cooper and Mello (1991)). More recently, counterparty contagion
theory research has focused on exchanges and clearinghouses as methods for mitigating this
source of systemic risk (Duffie and Zhu (2012) and Pirrong (2009)).
Hertzel, Li, Officer and Rodgers (2008) and Jorion and Zhang (2009) examine the impact of
bankruptcies on counterparties, but both studies focus on bankrupt nonfinancial firms and
periods before the subprime crisis. Thus, their results may understate the extent of contagion
arising from financial firms in financial crises. Studies that examine Lehman’s collapse and firms
with which it had direct business ties find a significant negative impact (Ivashina and Scharfstein
(2010), Aragon and Strahan (2012), Fernando, May and Megginson (2012), Jorion and Zhang
(2012), and Chakrabarty and Zhang (2012)). Using data from the subprime crisis, Arora, Gandhi
and Longstaff (2012) examine counterparty risk in CDS contracts while Iyer and Peydró (2011)
provide evidence of counterparty contagion from a large bank failure in India. A number of
7
systemic risk measurement studies show strong correlations between financial firms’ equities,
consistent with the existence of interconnectedness in capital markets.6 In sum, previous research
suggests that exposure to a bankrupt financial firm may be a significant source of contagion.
We examine counterparty contagion in cases of financial firm bankruptcies by investigating
the absolute and relative size of counterparty exposures and stock returns of firms with direct
business ties to the bankrupt company. If this is a significant element of financial firm
bankruptcies, creditors in a bankruptcy filing would be affected the most and those with the most
negative valuation effects would be the ones with the largest unsecured claims. In contrast, firms
with small debts or debts with low losses (collateralized debt) would not be affected as much:7
H1: Financial firm bankruptcies have negative effects on other financial firms that are creditors
and the magnitude of the effects is greatest among the unsecured creditors with the largest
claims.
Interconnectedness among financial firms is likely to be strongest at larger banks that have
substantial dealings in capital markets (Adrian and Brunnermeier (2010)). Such firms have larger
portfolios, more diverse product lines and are more likely to enter into bilateral contracts (such as
CDS and other derivatives) that directly impact the probability of failure of another firm (Giglio
(2011)). In contrast, community banks that fail may have a small impact because the losses
involved are smaller and because they fund their assets with retail deposits rather than global
6See Acharya, Pedersen, Phillipon and Richardson (2010), Adrian and Brunnemeier (2010), Billio, Getmansky, Lo and Pelizzon
(2012), Drehmann and Tarashev (2011), Huang, Zhang and Zhou (2009), Suh (2011), and Yang and Zhou (2012). Das, Duffie,
Kapadia and Saita (2007), Duffie, Eckner, Horel and Saita (2009) and Lando and Nielsen (2010) consider clusters of defaults that
may represent systemic risk.
7If collateral backing a secured debt or derivative is not sufficient for a secured creditor to recoup his entire claim, the impaired
part of the claim is included in the bankruptcy document as an unsecured creditor claim. Thus, by definition, the unsecured
creditor claims are more likely than collateralized debt to involve losses to related firms.
8
capital markets. Thus, an alternative formulation of H1 focuses on the effects of bankruptcy
filings by large firms:
H1a: Large financial firm bankruptcies have negative effects on other financial firms that are
creditors and the magnitude of the effects is greatest among the unsecured creditors with the
largest claims and those related to derivatives.
We could amend H1 and H1a to include cases of financial distress, as these troubled firms
would also impose costs on their creditors and the effects would also be greatest among the
distressed firms’ unsecured creditors. Specifically, creditors of distressed firms that have not yet
entered Chapter 11 will correctly forecast greater expected losses on their loans to these nearly
insolvent firms. However, the costs to counterparties should be smaller ceteris paribus than those
arising from Chapter 11 firms because the distressed firm might avoid default and pay its
creditors in full before the debt maturity date.8 Nonetheless, if the claims are large enough and
the failure is sudden, counterparty contagion could well apply to distressed firms as well as
bankrupt firms:
H1b: Distressed firms have negative effects on other financial firms that are creditors and the
magnitude of the effects is greatest among the unsecured creditors with the largest claims.
The most extreme negative effect on a counterparty occurs when a bankruptcy filing causes
losses that drive a creditor into bankruptcy, which in turn could cause a third bankruptcy. The
Economic Report of the President (2010) states that “Some crises …are triggered or exacerbated
by shocks to a small group of institutions that then spread to others. This spread, known as
contagion, is a form of negative externality imposed by distressed institutions. The recent
8 For example, a hedge fund that hears about the distress of its prime broker could move its business elsewhere before the firm
actually files for bankruptcy. Or, if the claim is a short-term debt contract such as an overnight repo or commercial paper, the
creditor may no longer be involved with the debtor firm when it files for bankruptcy protection.
9
financial crisis involved …counterparty contagion...…[as] illustrated in Figure 6-5…. Bank A
owes $1 billion to Bank B, which owes $1 billion to Bank C, with this same debt going through
the alphabet to Bank E. When Bank A goes out of business owing money to Bank B, then Bank
B cannot pay Bank C….One failure could lead to defaults all the way to Bank E.” Such logic
spurred the provision in Dodd-Frank requiring central clearing parties for derivatives trades
(Cecchetti, Gyntelberg and Hollanders (2009), Hull (2010), Pirrong (2011) and Duffie and Zhu
(2011)). Thus, we consider the frequency of subsequent bankruptcies in hypothesis H2:
H2: Financial firm bankruptcies cause other financial firms that are creditors to file for
bankruptcy, leading to a cascade of failures.
In contrast to counterparty contagion, Lang and Stulz (1992) consider information
contagion. Several theoretical papers consider how bankruptcy or distress might lead to losses on
stocks or bonds of other firms as investors incorporate the news about common factors into
securities prices (e.g., Veronesi (2000), Benzoni, Collin-Dufresne, Goldstein and Helwege
(2012), Giesecke (2004), King and Wadhani (1990), and Kodres and Pritsker (2002)).9
If information effects are an important factor in financial firm failures, then bankruptcy
filings will contain the most negative news for stocks of firms with similar businesses or subject
to the same common factors (Flannery (1998)). Aharony and Swary (1996) indicate that
geographic proximity to a failed firm is a significant determinant of other banks’ revaluations.10
The failures of First Republic Bank and Penn Square, studied by Karafiath and Glascock (1989)
9 Bai, Collin-Dufresne, Goldstein and Helwege (2012) consider a model of corporate bond pricing where contagion could
represent information effects or counterparty risk.
10Geographic proximity is especially important for depository institutions as they were restricted from operating across state lines
until 1994. While our proxy for geographic proximity (located in the same state) is a relatively coarse measure, it is sufficient to
find significant information contagion effects.

10
and Dickinson, Peterson, and Christiansen (1991), respectively, highlight the similarity of
competitors’ loan portfolios in understanding the externalities. However, most existing studies
on information contagion fail to control for counterparty effects. Exceptions are Jorion and
Zhang (2012) and Chakrabarty and Zhang (2012), who analyze Lehman’s bankruptcy. To
separate out information effects from counterparty effects, we exclude rival firms that are also
creditors of the event firms. Our third hypothesis is formulated as follows:
H3: Bankrupt and distressed financial firms have negative effects on other financial firms and
the magnitude of the effects is greatest among industry peers (firms in the same 4-digit SIC
code) that are in the same line of business or are located in the same state.
Note that H3 applies to distressed firms as well as bankrupt firms. We consider distressed
firms as well as bankrupt ones because the information that triggers losses on related firms’
stocks may appear well before the bankruptcy date. Further, distressed firms’ news may impact
competitors even if their troubles never result in a bankruptcy filing.
The relationship between size and information is not clear: While large firms’ failures may
impact all firms with related assets, simply because failures of large firms induce more reporting,
small firm bankruptcies may be more relevant for other small firms in the same geographic
locale because they have similar investments and funding sources.
Our focus is on negative externalities, but competitive effects could result in positive stock
returns for rivals (Slovin, Shushka and Polonchek (1999) and Egginton, Hilliard, Leibenberg and
Leibenberg (2010)). If competitive effects cause positive reactions, this should occur more often
among firms that operate in the same product markets.
11
H4: Bankrupt and distressed financial firms have positive effects on other financial firms and
the magnitude of the effects is greatest among industry peers (same 4-digit SIC code) that
are in the same line of business or are located in the same state.
2. Data and Methodology
Our analysis requires data on two types of firms: (1) troubled firms whose bankruptcy
filings or news of distress might generate negative externalities and (2) other firms that might
suffer from contagious episodes (counterparties and rivals). We examine the market reactions of
affected firms by applying standard event study methodologies.
We create equally weighted portfolios of creditors and of peer firms, where the latter
include firms in the same 4-digit SIC code that are not also creditors of the troubled firm.11 The
abnormal return ( jtAR ) for portfolio j on day t is defined as follows:
( )jt jt j j mtAR R R , (1)
where jtR is the rate of return for portfolio j on day t. The market model parameters ( jj , ) are
estimated using the CRSP value-weighted index as the market return ( )mtR . The CRSP return is
over a 200-trading-day window that ends 50 days before the event. We average these abnormal
returns over the event window [ 21,TT ], where 1T and 2T are the number of days relative to the day
of the bankruptcy announcement or the distress day. We follow MacKinley (1997) in measuring
statistical significance and we also report the proportion of negative abnormal returns among
individual stocks.
a. Bankruptcy filings
11 We construct equally-weighted portfolios, but we find similar (unreported) results with value-weighted portfolios.
12
We obtain our sample of 142 financial firm bankruptcies from www.bankruptcydata.com,
which we match to firms in CRSP and Compustat with SIC codes in the 6000 range in the period
1980-2010. This is also our source for data on creditors, which usually includes the names and
exposures of the top 20 unsecured claimants. The creditor data are available only for 88 of the
142 bankrupt firms because that information is largely available only after 1999. We obtain stock
return data for these counterparties by matching their names to those on CRSP.
b. Distressed firms
Using the procedure in Gilson (1989), we examine 3-year cumulative stock returns and
select the stocks of financial firms that are in the bottom 5% of the CRSP universe during the
years 1980-2010. We further limit the sample to firms that have assets above the sample median
in order to concentrate on episodes of distress that are important. Following Hertzel, Li, Officer
and Rodgers (2008), the distressed event date is the day when the firm’s stock price experiences
the largest decline in the 3-year period window.12 We investigate the news in Lexis-Nexis to
confirm that each distress day decline occurs as a result of new information about the firm. If we
find no news to explain the decline, we eliminate the observation. We also require that two
consecutive events involving firms in the same 4-digit SIC industry code be at least two weeks
apart in order to isolate the effects of information contagion. The distressed firms sample
includes 149 financial institutions. Their worst daily stock returns range from -6.5% to -90%.13
12 We also consider distressed firms’ quarterly earnings announcements by examining days with negative earnings surprises that
lead to negative returns. In unreported estimations, we find that these dates often indicate distress earlier than the distress days in
our analysis, but the effects of contagion are quite weak on such negative earnings days.
13 The distressed firms sample and the bankrupt firms sample are not mutually exclusive, so 36 of the 149 firms in the distressed
sample are also in the bankruptcy sample (the remaining firms are mostly excluded by the size restriction). In untabulated
results, we find that excluding the bankrupt firms from the distress sample does not qualitatively change our findings.
13
c. Rivals
We identify firms that may suffer from information contagion using Compustat’s 4-digit
industry codes.14 Rival firms must also have stock return data on CRSP in order to construct
portfolios. We exclude rival firms that are also creditors of troubled financial firms to separate
out information contagion from counterparty effects. Information from a bankruptcy or distress
event will be most relevant for firms that are operating in the same geographic area as the
troubled firm (Aharony and Swary (1996)), so we further narrow down the set of relevant peer
firms by also including data on locations from Compustat. A large number of bankrupt and
distressed financial firms get into trouble as a result of investments in real estate (Cole and White
(2012)), which cuts across 4-digit SIC industries. Thus, we also create portfolios of firms in the
real estate (RE) business by investigating the companies’ business lines in Lexis-Nexis. If the
news explicitly mentions that the troubled firm experienced distress due to real estate
investments, we set the RE variable to one. For rival firms, we create the RE indicator using the
following method: First, we read the descriptions of SIC codes (all the firms in SIC codes 6162,
65xx, and 6798 are in real estate). For other industries, we read Compustat business descriptions.
If terms such as ‘real estate’, ‘mortgage’, or ‘properties’ are mentioned in the blurb, the RE
variable is set to one. When the business descriptions in Compustat are abbreviated and
incomplete, we also read descriptions in Businessweek (which start with the same words as those
in Compustat, but are more detailed).15 If a firm in a non-RE SIC code industry does not have a
business description in either Compustat or Businessweek, its RE indicator value is missing.
d. Summary statistics
14Kahle and Walkling (1996) show that SIC codes frequently differ between CRSP and Compustat.
15See http://investing.businessweek.com/research/common/symbollookup/symbollookup.asp
14
Table I presents summary statistics on the bankrupt firms and distressed firms samples.
Panel A shows the time series of bankruptcy filings and worst days for the distressed firms. Not
surprisingly, the worst year in our sample is 2009, when 25 publicly traded financial firms
declared bankruptcy. Panel B shows the industries of these financial institutions. The largest
industry among the 4-digit SIC codes is commercial banking, whether we look at bankruptcies or
distress. These firms, along with other depository institutions, make SIC code 60 the largest of
the 2-digit categories. Several dozen insurers (SIC 63) are in both the bankrupt firms and
distressed firms samples, but life insurers tend to avoid bankruptcy to a greater extent than
property and casualty insurers. Mortgage brokers and real estate investment trusts (REITs) are
also common among the bankrupt firms, but only the REITs also have large numbers in the
sample of distressed firms. Panel C shows that the bankruptcies and cases of distress are more
often located in the most populous states. California, New York, Texas, Florida, Illinois,
Pennsylvania, North Carolina and Georgia are among the 15 largest states by population and
they contribute 68.3% and 48.3% of the observations to the bankruptcy and distressed firm
samples, respectively. Notably absent from the list are New Jersey and Michigan, which
contribute only a few observations to the samples despite their large population. Panel D
confirms the findings of Cole and White (2012) that many bankrupt and distressed financial
firms are exposed to declines in real estate values. Nearly two-thirds of the bankrupt firms are in
the real estate business.
Among the various reasons for investigating distressed firms separately from bankrupt firms
is the fact that some financial institutions were considered by regulators to be TBTF during our
sample period. Thus, the average bankrupt financial firm measured by assets could be much
smaller than the TBTF firm. By including distressed firms we are able to investigate the effects
15
of some of the TBTF companies (although if market participants are certain that the stock will be
treated favorably in a TBTF rescue, the equity may not fall sufficiently to be included in our
distressed firm sample either). Panel E shows that the distressed firms are indeed larger than the
bankrupt firms, even though Lehman ($691 b. in assets) is part of the bankrupt firms sample. Our
largest distressed firm is Royal Bank of Scotland, which ran into trouble during the subprime
crisis as a result of losses on mortgage-related assets. Other large distressed firms include
Citigroup, Fannie Mae, Freddie Mac, and Bear Stearns.
Table II shows data on the number of firms in the rival firm portfolios and the number of
creditors. There are fewer bankrupt and troubled firms with rivals that are located in the same
state, and some of the ones that do only have a few observations in the portfolios of affected
firms. The bankrupt and distressed firms in RE are much more likely to have a number of rivals
that are also in RE. Table II also shows the number of firms in our sample that are likely to be
affected by counterparty contagion in a bankruptcy. These creditors often do not have publicly
traded equity, which is necessary for an event study of the effect of counterparty contagion. The
main reason why creditors are not publicly traded is that they are trustees and thus do not
themselves bear the costs of counterparty risk.
Trustees are typically among the largest unsecured creditors of a bankrupt firm (Jorion and
Zhang (2009) and Helwege (2010)). For example, in the case of Washington Mutual (WAMU),
which went bankrupt in September 2008, the largest unsecured creditor is the Bank of New York
(BONY) as trustee for the junior subordinated debentures. These bondholders as a group are
16
owed $1.15 billion and BONY is responsible for filing the claim against WAMU, but BONY is
not owed $1.15 billion and BONY does not negotiate a recovery rate on the bond.16
While these claims are large, each of the bonds is owned by bondholders such as pension
funds, insurance companies, mutual funds and hedge funds. Evidence from Emaxx data reported
by Han and Zhou (2009) indicates that bonds are typically held by 103 institutional investors.
These data are based on large institutional investor reports to the SEC and insurance regulators,
so they provide a lower bound on the number of bondholders. Massa, Yasuda and Zhang (2010)
show that the investors in the Emaxx database hold approximately half of the par amount
outstanding of the bonds. Applying these figures to the largest bond claim owed by WAMU of
$1.15 billion, the typical bondholder exposure is estimated to be $5 to $10 million. Thus, even if
the ultimate creditors were reported instead of the trustees, the claims would likely be too small
to make the list of the top 20 creditors.17 In the sample of 88 firms with creditor information,
nearly all have at least one unsecured creditor that is not a trustee.
Table II shows that the many of the creditors that are not trustees are financial firms, as one
would expect if interconnectedness is a major element of a financial crisis. Indeed, the vast
majority (79 of 88) has at least one financial firm creditor at the time of the bankruptcy filing. In
results not shown, we find that this measure of interconnectedness is high for both commercial
banks and other financial firms. However, Jorion and Zhang (2009) and Helwege (2010) note
that commercial banks are unlikely to be the top unsecured creditors because bank regulations on
16 In fact, the next 12 largest unsecured creditors of WAMU are all BONY as trustee for some group of bondholders, with claims
ranging from $176 million to $805 million.
17 This aspect of our study is not peculiar to financial firm bankruptcies, as Jorion and Zhang (2009) report similar patterns for
their sample. Of 370 bankrupt firms that have investors in debt securities among their 20 largest unsecured creditors, only 270
have such creditors that are not trustees.
17
the size of loans to one borrower limit their exposures. As an example, the largest unsecured
WAMU creditor after the trustees is Verizon with a claim of about $7 million (presumably for
unpaid telephone bills). However, some bankruptcies, such as Lehman’s, have banks among the
top 20 creditors and these may be at the heart of financial crises.
A concern with the creditors in Table II is that the samples are small and thus that other
important counterparties are overlooked in our analysis. We address this issue in two ways. First,
we note that the smallest of the top 20 creditors often has a claim that is less than $20 million,
which means the omitted creditor claims would be too small to trigger a second bankruptcy and
therefore are not very interesting. Second, in the robustness tests section we also investigate the
exposures of counterparties of Lehman and American Home Mortgage (AHM) using data from
an alternative source, Epiq Systems debtorMatrix. The Epiq data include all the creditors of these
two firms.18 This concern is also mitigated somewhat by the data on counterparties of AIG,
which include all the creditor firms that regulators perceived as capable of causing disruptions in
capital markets. Data for AIG are also discussed as part of our robustness checks.
Lehman is the largest bankruptcy in the history of the United States, with nearly $700 billion
in assets at the time of its Chapter 11 filing. While Lehman was not considered TBTF by
regulators on September 15, 2008, many people say that it should have been. Indeed, Chairman
Bernanke stated in the above-quoted interview that he wished the government could have
rescued Lehman. A second large firm in our study, AIG, was undoubtedly a TBTF firm when it
became distressed in fall 2008. We know this because of its $85 billion emergency loan a few
days after Lehman collapsed. The loan was subsequently reworked and increased to ensure that
18The source for Lehman is http://chapter11.epiqsystems.com/LBH/claim/SearchClaims.aspx?rc=1, which is the same as in
Jorion and Zhang (2012). We use data on Lehman creditors from both sources (Epiq and www.bankruptcydata.com), whereas
AHM data are only in Epiq.
18
AIG was not forced into bankruptcy. Indeed, because its bailout was so large and famous, AIG’s
major creditors were the subject of Congressional testimony, which is the source of our data. The
testimony about AIG reveals 51 claims owed to 29 firms, including 19 publicly traded financial
firms with data on Compustat and CRSP (most of the rest are foreign banks).
3. Results
We present the results of three types of test in this section. To test H1 and H2, we analyze
the absolute and relative size of unsecured creditor claims and therefore the potential size of
exposures that could cause counterparty contagion. Another metric for the size of the exposure is
the number of creditors that subsequently file for bankruptcy as a result of large exposures.
Second, we conduct event studies on the bankruptcy announcements to determine if the impact
on creditors is greater than that on other firms in the financial sector. Lastly, we carry out event
studies on the effects of distress and bankruptcy on rival firms to determine the extent to which
contagion is information-based, as predicted by H3 and H4.
a. Counterparty contagion and the size of creditor exposures
In Table III we investigate the size of the claims owed by the sample of 88 firms with data
on creditor claims. Panel A shows the aggregate value of the claims and the overall distribution
of the debt. These firms owed more than $250 billion to their unsecured creditors, with the
average owed per bankruptcy reaching nearly $3 billion. However, most of the bankrupt firms
are small, so that the median amount owed to the top unsecured creditors is only $77.6 million.
Further, the money is mostly owed to trustees, not to other financial firms. Nearly half of the 88
bankruptcies have at least one creditor that is a trustee and these trustees are owed $226.6 billion,
or almost 90% of the aggregate owed to unsecured creditors. Once we eliminate the trustee
19
creditors, the amounts owed drop precipitously. So, even though nearly every bankrupt firm in
our sample has a financial firm as a creditor, which is consistent with the view of widespread
interconnectedness in capital markets, creditors that are also financial firms are only owed $27
billion in total, or only $344 million per bankruptcy on average.
Panel B of Table III shows data for the creditors that are financial firms. The mean amount
owed to these creditors is only $53.4 million and the median is sharply lower at less than $4
million. While these low figures may reflect the effect of TBTF policy, driving down the average
firm size among the 88 firms, we note that the Table III data include claims against Lehman and
WAMU, the two largest U.S. bankruptcies to date. Yet no claim of another financial institution is
as high as $2 billion and only 4 percent of the claims are above $1 billion. The largest single
claim is for $1.9875 billion owed by CIT, which filed for Ch. 11 protection in November 2009.
Note that the largest amount owed in the case of a bankrupt commercial bank is only $79.1
million. Thus, the potential for a cascade of bankruptcies among interconnected financial firm
creditors is smaller than that for creditors overall.
In order to gauge how large these exposures are relative to a creditor’s ability to absorb
losses, we require data on the size of the balance sheet of the creditor, which is only available for
the creditors that are publicly traded. We report the summary statistics related to their claims in
Panel C of Table III. Note that the publicly traded firms are generally larger than private firms,
so the creditors in Panel C are more likely to cause a financial panic. Despite their large size,
their average and median unsecured claims are smaller than in the total sample. And in cases of
bankrupt commercial banks, the claims are typically smaller still.
Compared to the overall assets of the publicly traded creditors, the claims owed to them by
bankrupt financial firms are very small. Panel D shows that these claims are only .05% of their
20
total assets on average. This is consistent with the conjecture in Helwege (2010) that financial
firm exposures are limited because regulations require diversification. In particular, bank
regulations require that loans to one borrower be no more than 15 percent of the capital of the
bank. Since few banks have capital that exceeds 10% of their assets, this effectively means that
most loans will be below 1.5% of assets. Likewise, insurance company regulations require
portfolios be diversified and the SEC constrains mutual funds as well.
Moreover, financial firms do not often extend credit that is uncollateralized. For example,
many bank loans are secured, repurchase agreements (repos) involve securities for borrowing,
and most derivative contracts are collateralized. Thus, some of the unsecured claims in a
bankruptcy will relate only to the portion of a secured loan that has insufficient collateral behind
it. Consequently, the average unsecured claim of a bank that is a creditor in a bankruptcy should
be well under 1.5% of assets if most financial firms observe rules related to diversification.
While the average and median exposures are quite small as a percentage of assets for
publicly traded creditors as a whole, Panel D shows that the figures are even smaller for
commercial banks than other creditors (mean of .03 versus .06). This reflects the fact that some
of the other publicly traded creditors are (unregulated) nonfinancial firms. We test whether
commercial creditors have exposures that are more than 1.5% of assets, which would indicate
that diversification regulations are not enforced. We find in Panel D that unsecured claims are
always less than 1.5% of the assets of the bank. Indeed this is true for all creditor firms in Panel
D, even when the creditor is not a regulated financial institution.
Although the creditors have small exposures when measured against their entire portfolios,
most financial institutions are highly levered firms. Thus the losses from financial firm
bankruptcies could be quite high as a fraction of the creditor’s equity. Panel E shows that
21
creditors stand to lose an average of about .25% of the market value of their equity as a result of
exposures to bankrupt firms, which is again consistent with a policy of diversifying risk.
Nonetheless, in some cases the losses are substantial - in one case as high as 12% of the firm’s
equity.19 While a loss of ten percent or more of the equity of a publicly traded company would
be an extreme event in the stock market, we note that none of the firms in the sample appear to
have large enough exposures to drive them to insolvency when another financial firm fails.
It may be that one single bankruptcy is not sufficient to cause a second failure, but that
financial institutions are interconnected in such a way that several failures would cause them to
collapse. We consider this mechanism by aggregating the claims of each creditor across all the
bankruptcies in the sample. Panel F shows that the aggregate claims for each creditor in our
database average about $84 million, which is only about twice that of the average amount per
creditor shown in the upper rows of the table ($53.4 for financial institutions and $46.3 for
publicly traded creditors). Thus, the creditors usually are not involved in more than two
bankruptcies during the sample period. The firm with the most claims in the dataset (four) is
Goldman Sachs, they only amounted to only 5.53% of its market value.20
The data in Panels A – F of Table III suggest that none of the exposures to the bankrupt
firms are large enough to wipe out the equity of the counterparties, even if all of the exposures
for a particular creditor are aggregated together. However, these bankrupt firms might be
19 Note that the bankruptcy of a commercial bank involves exposures that are very small, but when a commercial bank is a
creditor its losses are a higher fraction of its equity. This asymmetry in the risks suggests that the high leverage of commercial
banks is a larger factor than a greater degree of interconnectedness.
20 This doesn’t include Goldman Sachs’ exposure to Lehman, which is obtained from Epiq and may be overstated as described
below.
22
considered too small to cause systemic risk, as each one was allowed to fail. We consider the
exposures of larger firms such as Lehman and AIG later as a robustness check.
Another test of the potential for a cascade of failures from counterparty risk calculates the
number of firms that enter distress after suffering losses as creditors. We do this for the 90 firms
with data on creditors (the 88 bankruptcies in Table III, AHM and AIG) and their 287 publicly
traded creditors. Using CRSP delisting codes, bankruptcydata.com, and Lexis-Nexis, we find
that 10 of these creditor firms subsequently file for Chapter 11 protection, two file for Chapter 7
liquidation, another files for bankruptcy in Canada, two are acquired in distress (so they might
have gone bankrupt given more time as independent firms), and six more are among our list of
distressed firms. However, it is not clear that the any of these companies fell into distress as a
result of the first bankruptcy. Of the creditors that subsequently faced their own troubles, six
were suffered losses from AHM, but all were owed sums that were a small fraction of their
assets. It is unlikely that these creditors, including Lehman, Countrywide, WAMU, Bear Stearns
and MBIA, all failed as a result of AHM. Thus, these bankruptcies are not well described as part
of a domino-like chain reaction.
b. Counterparty contagion and stock market returns of creditors
Our second approach to evaluating the potential impact of counterparty contagion from
financial firm bankruptcies is an event study of the creditors’ stock returns on the bankruptcy
date. Table IV, Panel A shows that creditors suffer significant losses as a result of the
bankruptcies, with an average decline of slightly more than one percent (-1.09%, t=-2.16) over
the five day window centered on the filing announcement. Most of the creditors experience a
decline in value the day before the filing and their stock prices remain depressed for the
remainder of the five days. This evidence is consistent with the view that interconnectedness is a
23
significant source of contagion for financial firms and thus for financial crises. However, the
magnitude of the counterparty contagion effects is small and unlikely to cause additional failures.
Further, we note that the market reactions are larger for financial firms than for nonfinancial
firms, even though Table III showed that the latter group has larger exposures as a percentage of
assets. For example, the day 0 reaction for the financial firms is significant at -0.91%, but the
industrial companies’ reaction is insignificant. While interconnectedness among financial firms
is more frequently cited as a major factor for the subprime crisis, counterparty contagion effects
are not any larger among the bankruptcies that occurred after 2007.
We consider the multivariate analysis of counterparty contagion effects (creditor CARs) in
Panels B and C of Table IV. Panel B presents summary statistics on the variables used in the
regression while Panel C reports regression estimates. Note from Panel B that the exposure
measured as a fraction of total assets averages only 0.93%. The small exposure is not an artifact
of small bankrupt firms owing money to large creditors, as the average bankrupt firm has more
than $350 billion in assets (the largest bankrupt firm is Lehman Brothers) and creditors are
almost as large, averaging about $326 billion in assets. The largest creditor is Royal Bank of
Scotland, which was owed funds by Lehman. The mean exposure is much higher when
expressed as a fraction of the market value of the creditor’s equity, but at 2.67% it is still modest.
The mean volatility is 3.03% and the mean equity correlation is 0.24. About a quarter of the
claims are related to derivatives. More than half of the CARs are from recession periods,
reflecting the large number of financial firm bankruptcies during the subprime crisis and the
credit crunch of 1990-1991. The economic recession intervals are based on the NBER website. 21
21 http://www.nber.org/cycles/cyclesmain.html.
24
Panel C of Table IV shows regression estimates to explain the CARs on day 0 and, in model
(2), over the five day window including it. Supporting H1, we find that firms with higher
counterparty exposures have more negative CARs. In the first three models, we measure
exposure as a percentage of the creditor’s assets while models (4) and (5) use the equity of the
creditor to scale the claims. In all specifications, the results indicate that the more a firm is owed
by the bankrupt company the more the stock price of the creditor falls. However, the size of the
coefficient is fairly small. For example, using coefficients in model (1), the impact of a one
standard deviation increase in the exposure ratio is predicted to reduce the event day AR by only
0.55%. In models (3) and (5) we restrict the sample period to 2007-2010 to determine if
counterparty contagion has a larger effect during the subprime crisis. We find that the
coefficients in the later period are nearly identical to those found for the full sample period,
although the t-statistics associated with the coefficients are somewhat larger in absolute value.
The regressions in Panel C of Table IV control for the sizes of bankrupt firms and creditors, as
well as derivatives usage to test H1A’s prediction that the impact of counterparty contagion is
greater when the bankruptcy involves a large complex financial institution. We do not find
significant coefficients on size in any specification. This may reflect the offsetting effects of
information since some of the counterparties of the bankrupt firms are also competitors (a large
financial firm’s bankruptcy may leave greater market share for other firms, leading to positive
effects for those stocks). In contrast, we find that creditors with derivatives-related exposures
experience more negative reactions than those with other claims, consistent with the view that
complex financial institutions impose greater costs on the system when they fail. Derivatives
claims that are large have an even greater negative impact on the stock returns of the creditor.
However, we note that the derivatives results may also reflect information effects, which are also
25
apparent in the correlations of the equity returns of the creditors and debtor companies. If
interconnectedness is a major factor in counterparty contagion, then firms with similar use of
capital markets should have worse returns as a result of the bankruptcy, and thus we expect the
coefficient on the correlation to be negative (i.e., firms with higher correlations should be more
adversely affected). Instead, the correlation is usually positive for the event day AR. This might
occur if competitive positions of peers cause them to experience less negative effects.
Based on Merton (1974), a creditor that has unusually highly asset volatility and leverage
should be more likely to default on its debt. Thus, direct exposure to a failing counterparty is
more likely to push firm over the default boundary if the creditor is highly levered or its profits
are highly volatile. Volatility has the correct sign and is significant for both stock price reaction
metrics. Leverage also has the correct (negative) sign and it is significant using the 5-day CAR.
Importantly, we find that contagion effects are weaker for commercial bank creditors, as
shown by the positive coefficients on the commercial bank creditor dummy variable, which are
significant during the 2007-2010 subsample. The weaker contagion effect is likely a result of
following diversification rules imposed on commercial banks. Finally, bankruptcies that occur in
a recession should more often lead to a cascade of failures and we find that the recession
indicator is negative and significant for the event day AR.
c. Information contagion and stock market returns of rivals
Next we investigate information contagion with event studies related to the bankrupt
financial firm’s competitors that are not its creditors. Table V presents the results. The stock
market reactions of all firms in the bankrupt firms’ industries indicate that the typical competitor
does not experience a significant decline in its market value as a result of the bankruptcy filing.
Not only is the average day 0 return on these 142 portfolios insignificant, but none of the event
26
windows exhibits a significant negative return. Nor is any other single day return statistically
different from zero.
However, we note that the CARs in Table V could be insignificant even though information
contagion is important if the tests are not done on the relevant set of competitors or if
competitive effects offset negative news about common cash flows. Therefore, we first form
portfolios of firms that operate in the same state as the bankrupt firm (and, therefore, which are
more likely to be exposed to common regional factors). Table V shows that the day 0 impact is
again estimated at zero for these 96 bankruptcies. However, the CARs for all the longer event
windows are significantly negative. Further, the fraction of firms with negative returns is always
larger than 50 percent, indicating that the means are not skewed by outliers.
Likewise, we consider whether information contagion is more apparent among competitors
that are also focused on real estate. The 89 bankruptcies involving RE firms also involve more
information contagion than the sample as a whole, as the day 0 impact is significantly negative
(estimated AR is -0.69%) and all four windows reported in this panel of Table V have significant
negative t-statistics. The fraction of rival firms with negative returns is also always above half
among those rivals that are in the same business as the bankrupt firm. When we narrow the set of
competitors down further, by requiring similar geographic markets and a focus on real estate, the
estimates do not indicate any significant amount of information contagion. This might be due to
offsetting competitive effects for the bankruptcy sample. In untabulated results, we find similar
CARs for all of the four categories in Table V when we restrict the period to 2007-2010.
Information contagion may not be as important on the day of a bankruptcy filing as on a day
when the losses of the troubled firm have just been revealed to the market. Further, the
bankruptcy sample may not reveal as much information to the market as the distressed firm
27
sample as the latter group includes TBTF banks. Table VI shows the results of event studies of
information contagion for the 149 distressed firms on their worst stock return days. The excess
return on day 0 is -0.63% and significant. Nearly two thirds of the portfolio has a negative return.
The longer windows all show significant negative contagion effects as well. The greater stock
market reaction on distress days than on bankruptcy dates is consistent with the theory in Pastor
and Veronesi (2012) and the empirical finding of Jorion and Zhang (2007) that intra-industry
contagion effects are larger for sudden CDS spread jumps than for Chapter 11 bankruptcy
announcements. Our results may also reflect the fact that the distressed firms are still days away
from resolving their defaults, reducing the impact of competitive effects (see Zhang (2010)).
As with the bankrupt firm sample, we split the sample to determine how information about
distress affects the subset of rivals with similar locations and business lines. The results of our t-
tests in Table VI show that reactions are sharply higher for firms that are in the same state as the
distressed firm (the average day 0 CAR is -1.37% and the [-2, 2] window CAR is -2.85%).
Nearly 70% of the firms have negative returns. Our sample of distressed firms includes 82
financial institutions that suffered from RE losses. Table VI also shows that the industry
response related to these firms’ distress is significantly negative on average (-2.04% for day 0
and -2.56% for the [-2, 2] event window) and more than 70% of the firms have negative returns.
When we restrict the portfolios of rival firms’ stocks to include those of competitors in the same
state and the same line of business, the reactions are even more negative. For this group of firms,
the day 0 CAR is -2.84% and the CARs over longer windows have magnitudes that exceed 3%.
The information contagion effects are notably stronger for firms that encounter difficulty during
the subprime financial crisis. The two columns on the far right of Table VI show the mean CARs
and the fraction of firms with negative announcement effects for distressed firms during 2007-
28
2010. The average CARs range from -1.51% to as low as -9.84% and the announcement effects
are always more negative in the later time period than their counterparts in the overall sample.
The percentage of firms with negative announcement effects is comparable in both periods.
Taken together, the results in Tables V and VI suggest that other firms in the industry suffer
from stronger contagion effects if they are located in the same state or engage in similar business
as the troubled financial firm, as predicted by H3. We examine this hypothesis in greater detail
with cross-sectional regressions to explain rival firms’ CARs. The explanatory variables, shown
in Table VII, include proxies for the similarity of the assets, the size of the troubled firm, the
likelihood of default of the peer firm, a dummy variable for recessions and a measure of industry
concentration (to control for competitive effects as predicted by H4).
The regressions, reported in Table VIII, also show that information contagion is a factor in
cases of financial firm bankruptcies and distress. For each type of event, bankruptcy or distress,
we estimate regressions on portfolios of competitor stocks. The portfolios are formed based on
whether the stocks are in the same state, RE, or both. No matter how we define similarity (same
state, same business or both), the coefficients on the information contagion variables are
significant and have the predicted sign after controlling for equity correlations, which have the
expected negative sign. In addition, the regressions indicate that the positive competitive effects
are small as the Herfindahl measure is only significant in some of the regressions for the
bankruptcy sample. Recessions may make information effects even more negative, as this
indicator is significant in some specifications of the bankruptcy event regressions. The estimated
effects of recessions are consistent with the notion that rivals are less likely to benefit from
competitive effects in downturns.
29
As we find information contagion is significant for financial firms, we reconsider the results
on counterparty contagion to determine if some of the creditor stock returns owe to information
contagion as well as counterparty contagion. If information contagion is important for these
creditors, their returns should be similar to those of the other firms in the 4-digit SIC code that
are not creditors. In contrast, if counterparty contagion accounts for most of the impact on the
creditors’ stock returns, then the creditors’ excess return over the industry average return should
be about as large as their market-adjusted returns. In unreported results, we find that the impact
of bankruptcy on creditors is largely due to counterparty contagion since the creditors’ excess
returns over the industry is about the same as the excess returns over the market. For example,
the average industry-adjusted portfolio return is -1.05% over the [-2, 2] window, which is almost
the same as the -1.09% return over the five day window found in Panel A of Table IV.
d. Robustness Tests
In this section we consider three types of robustness checks: First we consider the
bankruptcies of some large companies as a check on whether the counterparty contagion of our
sample is representative of what would happen if a TBTF bank were to go into bankruptcy.
Second, we consider whether alternative calculations of excess returns would lead us to draw
different conclusions from our event studies. Lastly, we further investigate counterparty risk
along the supply chains of bankrupt and distressed firms using data from SEC filings.
A possible explanation for the small effects on counterparties in our data is that most of the
bankrupt companies that we study are small. Thus, the results could differ for interconnected
firms that transact more often in the capital markets. Similarly, one might expect greater
counterparty contagion for creditors that are involved in derivatives with large companies. We
address this issue by separately examining data on the creditors of Lehman, AHM, and AIG. In
30
addition to being very large firms whose bankruptcies are informative about TBTF cases,
Lehman and AHM have the advantage of having more detailed information on claims in the Epiq
dataset. 22 In addition, we are able to identify Lehman creditors from the Daily List of Companies
Reporting Lehman Bros. Exposure.23 AIG’s creditor data comes from Congressional testimony.
Lehman
We present creditor exposures for Lehman in Panel A of Table IX. We note that the largest
claim by a publicly traded creditor for Lehman in the table is actually larger than the largest such
claim in Table III, even though the latter includes data on Lehman. The reason why this occurs is
that the claims in the Epiq dataset are filed by creditors, some of whom asked for compensation
on losses related to derivatives contracts above what they could have suffered as a result of the
bankruptcy.24 We discuss the derivatives in more detail below, but we note that despite their size,
the largest claims against Lehman, and the majority of the money, are owed to trustees, as was
commonly the case among the firms in Table III. Outside of the trustees, the claims are mostly
quite small: The median claim is less than $5 million and the mean is $32 million.
22 There are more than 6,500 claims for Lehman, which we obtain from the Epiq. In contrast, the data in Table III (based on 88
bankruptcies, including that of Lehman) is based on the largest unsecured creditors listed in the bankruptcy petition.
23 See Jorion and Zhang (2012) for more information on this list.
24The International Swap Dealers Association (ISDA) master agreement, which applies to nearly all derivatives contracts, and
exceptions to the bankruptcy law for derivatives lead to the following outcome in Chapter 11 cases: The counterparty to an ISDA
contract with a bankrupt firm chooses whether to continue with the derivative or terminate it. If terminated, the creditor is
allowed to keep whatever collateral has so far been posted for the contract. If that collateral is insufficient to cover the creditors’
losses, it files a proof of claim for the remainder and that amount is listed among the debtor’s unsecured claims. The losses may
include the cost of acquiring a replacement contract. These claims appear in the Epiq data as “early termination agreement”
claims and they are noted as contingent in the data. The amount of the claim is determined by the fair value of a replacement at
the time of the bankruptcy filing.
31
Lehman also exhibits a high degree of interconnectedness using the number of financial firm
creditors as the metric for interconnectedness. Further, claims made by financial firms that are
public are substantially above average, with a mean claim size of $347.1 million. This result is
driven by the average size of derivatives contracts ($162.9 million) and claims that combine
bonds with derivatives ($1,258.9 million). These figures are exaggerated in two ways. First, the
derivatives claims are overstated, because they fail to adjust the costs for netting. Second, many
of the bond claims overstate the true loss from exposure to Lehman because they involve
lawsuits about securitization or guarantees from Lehman subsidiaries that did not default.
According to Cameron (2011), the derivative claims are excessive because each derivative
loss is affected by the bid-ask spread rather than netted and then adjusted for the bid-ask
spread.25 Evidence to support this view is the fact that when the Lehman estate disputed many of
the derivatives claims, its largest counterparties agreed to substantially revise their claims
downward.26 Scott (2012) also finds that claims filed against LBHI and its affiliates are
approximately four times higher than the most relevant real exposure figures.
25For example, if a creditor has two CDS contracts with Lehman, one where it is betting that Ford will default and another betting
that Ford will not default, then the net claim is zero and the creditor bears no cost in replacing the position. In contrast, the claims
filed by creditors are usually filed after each contract’s replacement value is calculated (using low bid prices that result from the
turmoil in the CDS market), which inflates the aggregate replacement costs of derivatives. Goldman filed a proof of claim that
showed that applying the netting procedure prior to making adjustments for bid-ask spreads on its 29,000 derivative contracts
would reduce the claim from $4.2 billion to $1.5 billion.
26Summe (2011) discusses the derivatives claims in the case of Lehman and notes they were a major source of recovered assets
for Lehman, reaching nearly $9 billion. This recovery reflects in large part an agreement among Lehman’s “big bank
counterparties” to reduce the claims associated with early termination agreement losses. She includes citations to documents
related to the agreement, many of which can be found on the Epiq website. The big bank counterparties were Bank of America,
Barclays, BNP Paribas, Citigroup, Credit Suisse, Deutsche Bank, Goldman Sachs, JP Morgan Chase, Merrill Lynch, Morgan
Stanley, Royal Bank of Scotland, Societe Generale and UBS.
32
Even if the derivatives claims actually imposed billions of dollars of losses on those
counterparties, these firms’ total assets are substantially higher. Panel A of Table IX shows that
the typical exposure among public financial firms is very small: the claim as a fraction of assets
among the public creditors is typically only .1% and even among the financial firms with the
large derivatives claims the mean claim is only .5% of assets. In results not shown, we find that
no commercial bank creditor was at risk of losing even 1.5% of assets to Lehman. Non-bank
creditors, which may not face stringent diversification regulations, rarely have exposures that
constitute more than 1.5% of assets. Among the publicly traded financial creditors, 93.2% have
an exposure that is below 1.5%.27 A t-test for whether the proportion of such firms with
exposures is greater than 1.5% is rejected with a test statistic of 5.9.
We also investigate the exposures as a fraction of the market value of the equity of the
publicly traded financial firm creditors. Since financial institutions are highly leveraged, it is
possible that even a small fraction of assets lent to Lehman could cause some financial firms to
fail. We find no evidence that this is the case. The 110 financial creditors are owed only 4.7% of
their equity on average and the median is only 1.1%. While these exposures are small, they are
larger than those noted for the sample as a whole in Table III. This could reflect the fact that
many financial firms’ market capitalizations had declined substantially by the time of the
Lehman bankruptcy, but it also owes to the fact that exposures to Lehman were higher as a
percent of assets than the typical exposure in Table III. The test statistic for whether the fraction
27 The largest exposure among these firms belongs to GLG Partners, a hedge fund started by Lehman that went public in 2007
and was still 25% owned by Lehman in September 2008.
33
of equity exposed to Lehman is above 15% is 8.5, rejecting the hypothesis that creditors of
Lehman’s bankruptcy typically defy diversification rules. 28
The largest exposures as a percent of assets are found among nonfinancial firms, which are
less often regulated and therefore under less pressure to diversify their assets. In addition, they
may find it optimal to have large exposures to other firms as suppliers or customers. Thus, as
many as a quarter of the industrial creditors of Lehman have claims that exceed 1.5% of assets
and a t-test for whether the mean exposure exceeds 1.5% cannot be rejected. While the mean
exposure is greatest among this group, it nonetheless only accounts for 4% of their assets on
average and the median exposure is only 0.1% of assets. The largest of the exposures, 90.4%,
belongs to 4Kids Entertainment, a toy company that lost money when it invested its working
capital in auction rate securities on Lehman’s advice and subsequently sued.29 In dollar amounts,
the largest claim by a nonfinancial firm belongs to Dynergy, an active participant in the energy
derivatives market.
Eight creditors of Lehman filed for Chapter 11 or Chapter 7 bankruptcy (including Nortel
which filed in Canada). One creditor is a hedge fund (Anthracite Investments), one is a bank
28 In addition to the derivatives claims, proof of claims are often inflated by claims for damages that would ordinarily be sought
via a lawsuit. The largest Lehman creditor that is not a trustee is Fannie Mae, which filed a proof of claim form stating that it was
owed over $15 billion, including two claims related to mortgage-backed security (MBS) transactions. The claim was essentially
an inexpensive way for Fannie Mae to file a lawsuit alleging Lehman misconduct in creating MBS (see Helwege (1999)). In
addition to lawsuits, the bonds and derivatives claims are larger than other claims in part because of guarantees. If a subsidiary of
Lehman does not file for bankruptcy and it continues to make payments on a bond that it issued, the entire bond will still be
included in the bankruptcy if Lehman guarantees the bond of the subsidiary. This is because the subsidiary might go bankrupt
some day for other reasons and their creditors at that point would want any assets that are available from the parent.
294Kids suffered these losses in summer 2008 and the suit began before the bankruptcy filing. The claim was for losses of $31.5
million in principal, interest of 9% and treble damages of about $95 million.
34
(Co-operative Bank, PLC), another is a municipal bond insurer (Ambac) and the rest are
nonfinancial firms. Two industrial firms, Dynergy and 4Kids Entertainment, with large
exposures to Lehman, did collapse after the Lehman filing, but their failures in 2011 did not
occur suddenly. Thus, the subsequent bankruptcies of Lehman’s creditors are also not well
described as a cascade of Ch. 11 filings of interconnected capital market participants. Royal
Bank of Scotland is the only large financial firm creditor of Lehman to fall into distress after
September 2008.30 These findings support Scott’s (2012) conclusion that interconnectedness was
not the primary driver of systemic risk following the collapse of Lehman.
One Lehman creditor not mentioned so far (because it is not publicly traded ) that can
clearly be described as failing due to the bankruptcy is the Reserve Primary Fund (RPF), a
money market mutual fund (mmmf) that “broke the buck” as a result of its losses on $785
million of Lehman debt. As Fisch and Roiter (2012) note, “the RPF loss was a rather modest
one: the fund ultimately lost less than 1% of its overall value.”31 However, SEC rules for mmmfs
require that they maintain an NAV of at least 99.5 cents and when they fall below the minimum
the SEC-sanctioned policy is to suspend redemptions and liquidate the fund. According to Fisch 30 A possible concern with this finding is whether a cascade of failures was avoided when the central bank intervened starting in
fall 2008. We note that the exposures were quite small at the time of the bankruptcy so even if those firms had not received a
bailout they would not have gone under as a result of counterparty exposures. Furthermore, few of the institutions that received
large bailouts in fall 2008 were listed as unsecured creditors in the Chapter 11 filing. For example, of the nine financial
institutions that received $125 billion in capital through TARP in October 2008 (Merrill Lynch, Goldman, Morgan Stanley, JP
Morgan, Bank of America, Citigroup, Wells Fargo, and Bank of New York Mellon), only Citigroup and BONY were listed by
Lehman as unsecured creditors in its Chapter 11 filing and both served as trustees for bondholders. While seven of the nine
(Wells and BONY were the exceptions) were derivatives creditors that subsequently filed proofs of claims (available in the Epiq
data), these claims only totaled about $10 billion and they were reduced sharply as part of the Big Bank Counterparties settlement
(see footnote 30). We note that AIG, which received an $85 billion bailout in September 2008, was not a Lehman creditor.
31 See Kacperczyk and Schnabl (2013) also.
35
and Roiter (2012), investors in the RPF lost the liquidity of their investment for almost a year.
Thus, while the trigger for RPF’s demise was Lehman’s bankruptcy, one could argue that its
failure owed more to the rigidity of the NAV rule and the SEC suspension policy.
AHM
Panel B of Table IX presents comparable results for AHM, which has no data on exposures
in bankruptcydata.com and thus is not part of the results in Table III. AHM is an interesting case
because it filed for bankruptcy on August 7, 2007 as a result of losses on Alt-A loans. As one of
the country’s largest mortgage originators, its demise was widely reported as a sign that trouble
in the subprime market had spread to better quality loans.32 As Panel B shows, most of its
unsecured creditors are financial firms, and a large fraction of these are commercial banks (SIC
6020), thrifts (6035) and investment banks (6211), the industries that are most often associated
with systemic risk. Yet, the exposures of these firms are small, typically well under $50 million
and always well under 1.5% of assets and 15% of equity. Notably, the repurchase (repo) claims
are also small, as these are typically secured loans and the unsecured claims related to repos
represent losses from insufficient collateral, not the full extent of the repo loan.
AIG
AIG’s creditors have much larger exposures than any of those reported for Lehman and
AHM (Panel C of Table IX), which supports the government’s claim that AIG would have had a
greater impact on the financial system. Moreover, Panel C shows that the vast majority of the
exposures are among commercial and investment banks, further bolstering the view that AIG
was systemically important. The largest exposures involve sophisticated capital markets
32 AHM’s employee base of about 7500 workers was hacked down to only 750 just a few days before its Chapter 11 filing,
reflecting severe funding problems. See USA Today (2007).
36
instruments, such as CDS, repurchases and CDOs. However, the counterparties to AIG are
among the largest financial institutions in the world, so even with exposures as high as $7 billion
for a single firm, none of the exposures exceed 1.5% percent of the creditor’s assets. Typically,
the potential losses are no more than a half percent of assets, which supports Goldman Sachs’
claim that it “had no material direct economic exposure to AIG.”33 Measured by the market value
of equity, the claims are substantially higher and Goldman’s statement is far less credible, as the
table shows that the exposures as a fraction of the market value of equity of the creditor are
sometimes as high as 27%. Goldman’s claims on AIG amounted to more than 20% of its equity
at the end of the second quarter of 2008. Nonetheless, the loss of equity would not be sufficient
by itself to push Goldman or any other AIG counterparty into bankruptcy.
The event study evidence on counterparty contagion suggests such effects are modest in our
sample, so a natural consideration is whether contagion is more readily apparent when we
examine the cases of Lehman and AIG. In Table X we investigate the impact of various negative
news days on their respective counterparties. For Lehman, we investigate six dates in 2008:
March 14 (the Bear Stearns deal), June 2 (ratings downgrade), June 9 (announcement of major
losses), August 19 (secret talks to raise capital stall), September 11 (news about a search for a
buyer) and September 15 (bankruptcy). For AIG, we examine four earnings announcement dates
between 2007 and its bailout in September 2008, each with a negative earnings surprise, and the
two dates involving financial problems at AIG (February 11, 2008 and September 15, 2008)
analyzed by Egginton et al. (2010).34
33 See http://www2.goldmansachs.com/media-relations/comments-and-responses/archive/aig-summary.html.
34Lehman reported losses in advance of earnings releases, so its announcement dates are less informative.
37
Panel A indicates that counterparty contagion has a significant impact on the stock returns of
Lehman’s creditors and the point estimates for the five day announcement window are nearly
double those of the full sample reported in Panel A of Table IV. The stock returns of Lehman’s
creditors fall by 1.24% on average over days 0 and 1 with a t-statistic of -3.33. The largest
negative returns occur on September 11, 2008, with the event day AR of -1.42% and the 3-day
CAR of -3.09% (t=-2.94). Much of the creditor portfolio response occurs within the financial
firm creditors, despite the fact that Table IX, Panel A shows that nearly all of their claims are
less than 1.5% of assets. Compared to the 4.7% mean exposure as a fraction of equity, the
declines in the counterparties’ market values are somewhat high, which could be due to
information about the loss of future business. As shown in the rightmost two columns, the firms
with the largest exposures, whether measured by assets or market value of equity, have the
largest stock market reactions to the bankruptcy filing and their stock prices fall by as much as
3.87% over the five day announcement window.
The collapse of AIG has a much larger impact than average on the firm’s counterparties.
Panel B of Table X shows that for AIG’s creditors, the effect over the five day announcement
window is -4.24%. The returns are noticeably lower for the creditors with higher exposures.
These six event days’ losses caused an average cumulative loss of nearly one-quarter of the
equity of AIG’s creditors, including a loss of more than 10% around the distress day in
September 2008.35 After AIG’s bailout, creditors experienced huge positive abnormal returns
(8.63% on day 1 and 9.53% on day 2), which is also consistent with a major role for counterparty
35This result should be interpreted with caution because the AIG’s distress day is also the Lehman’s bankruptcy day and thus
there may be confounding effects.
38
contagion. These results suggest counterparty contagion from a large financial institution is a
serious concern for other financial firms during a financial crisis.
Our second robustness check involves alternative event study methodologies for the
counterparty contagion analysis. For example, Table IV shows creditor stock returns using
portfolios of firms. An alternative approach is to treat each creditor firm separately and
calculates the average AR and CAR across creditors. In unreported results, we find that this
approach yields estimates of counterparty contagion effects that are slightly larger: rather than an
average return of -1.05 over the [-2, 2] event window, the return is -2.29% (t=-4.37) and if we
restrict the sample to financial creditors the average is -2.43% (t=-3.70). We also repeat these
event studies using the Fama-French and the 4-factor models to calculate excess returns and we
find that the (unreported) results are similar.
Next, we consider whether the stock market reaction to the bankruptcy filings is limited for
counterparties because investors are unaware of the exposures and the risk associated with them.
The logic behind this concern assumes that even after the company files its bankruptcy petition
listing its largest unsecured creditors the counterparty shareholders are unaware of the risk. The
fact that so many companies reported the true nature of their Lehman exposures to the Wall
Street Journal (the basis of the Dow Jones report used by Jorion and Zhang (2012)) suggests that
investors do become aware of the exposures from the bankruptcy filing. Moreover, these data
also indicate that the exposures are quite small.
Investors may be less informed about the degree of interconnectedness of financial
institutions in the case of distressed firms. We note, however, that all of the publicly traded
companies in our sample of counterparties are required to report material risks in their 10-K
filings related to important business relationships. Therefore, if the distressed firms are more
39
interconnected than our bankrupt firms or AIG, these exposures should be reported to their
shareholders as a matter of course. Following the strategy of Fee and Thomas (2004) and
Hertzel, Li, Officer and Rodgers (2008), we identify relationships using the Compustat segment
files from 1979-2010. Then we match the names of the customers and suppliers to our lists of
bankrupt and distressed firms to determine the extent to which these troubled financial firms
might have caused serious problems along the supply chain.
These public documents provide little evidence of interconnectedness, as few of our
bankrupt firms’ names in the lists of major customers and suppliers in Compustat. Five
companies list one of our bankrupt firms as important customers in their 10-K forms. However,
none of the five firms were involved in derivatives trading or interbank lending.36 Firms that list
our bankrupt firms as suppliers are equally rare. Of these, only American Home Mortgage’s SEC
filings suggest an important supplier-customer relationship with financial firms in the crisis
period.
The distressed firms are typically larger than the bankrupt firms and they are more often
listed as important customers in the SEC data. We find 40 of the distressed firms are listed as
important sources of revenue for 133 firms in a total of 373 reports, but these firms are rarely
connected through capital market transactions.37 Of the 118 instances where a distressed firm is
listed by a financial firm, only 17 are in SEC filings after 2006 and these more often involve
insurance companies. We also investigate our distressed firms to check whether they disclose
business relationships with financial firms in their SEC filings, but only three firms do and these
36 Three were nonfinancial firms while Clayton Holdings worked on due diligence in the issuance of Lehman MBS and Vornado
is a REIT that had Lehman as a tenant.
37 For example, the 40 distressed firms include AIG, Citigroup, Bear Stearns, and Royal Bank of Scotland but none of these four
firms is listed by a major financial firm near the time of the crisis.
40
are all mortgage originators that sell to Bank of America, Wells Fargo and Fannie Mae for MBS
issuance. In untabulated results, we do not find significant equity valuation effects along the
supply chain for bankrupt and distressed firms. In sum, these results also indicate that the
potential for counterparty contagion to cause a cascade of financial failures is small.
4. Conclusion
The recent financial crisis raises the question of why markets collapse after a major financial
firm files for bankruptcy or becomes distressed. Early studies of the spillover effects of
bankruptcies, which were mainly based on samples of nonfinancial firms, focused on the
information transmitted by such events. While the same effects could be equally important when
financial firms go bankrupt or become distressed, the recent financial crisis has focused
researchers’ attention on the potential for counterparty contagion. If counterparty contagion is a
major factor in cases of distressed financial firms, then government liquidity programs directed
at their creditors may substantially reduce the adverse impact of such failures on markets. Thus,
we evaluate information contagion and counterparty contagion to determine how these two
sources of contagion affect other financial firms.
We find that counterparty contagion is stronger for firms with larger and more complex
exposures, higher equity return volatilities and during recessions, while it is weaker for
commercial banks. The counterparty contagion effect is generally limited in magnitude, which
owes to the fact that most counterparties have rather small exposures to the bankrupt companies.
The largest exposures, revealed in the list of the largest unsecured creditors in the bankruptcy
petition, often belong to the trustees of publicly traded bonds and since these bonds are widely
held, the exposure of a single financial firm is substantially smaller. Other creditors are often
41
financial firms, suggesting highly interconnected financial institutions. But financial creditors are
rarely at risk of failing as a result of another firm’s troubles because these firms hold diversified
portfolios, as is often required by regulation. Our results point to the importance of
diversification regulations for financial firms as a method for mitigating systemic risk.
Information contagion is also a significant channel of contagion. When we examine rivals
of bankrupt firms located in the same state or same line of business, the magnitude of the effects
on rivals is comparable to that found for creditors. We also investigate information contagion
using a sample of distressed firms and find that information contagion is markedly higher in
cases of distress than at the time of the bankruptcy filing. These effects are also higher for rivals
that operate in similar geographic locales and in the same line of business, such as real estate.
Our results on information contagion suggest that financial crises may be attributable to similar
portfolio decisions by a number of financial firms that are revealed to be unsuccessful. When the
market learns about these problems from their failures, it penalizes other firms with similar
characteristics. If these firms represent a large fraction of the financial sector, their losses may
justify temporary central bank liquidity facilities as asset prices stabilize.
42
References
Acharya, V., C.T. Brownlees, R. Engle, F. Farazmand, and M. Richardson, 2010, Measuring
Systemic Risk, in `Regulating Wall Street: The Dodd-Frank Act and the New
Architecture of Global Finance', Wiley.
Adrian, T. and M. Brunnermeier, 2010, CoVar, working paper.
Aharony, J. and I. Swary, 1983, Contagion Effects from Bank Failures: Evidence from Capital
Markets, Journal of Business, 56, 305-322.
Aharony, J. and I. Swary, 1996, Additional Evidence on the Information-based Contagion
Effects of Bank Failures, Journal of Banking and Finance, 20, 57-69.
Allen F. and D. Gale, 2000, Financial Contagion, Journal of Political Economics, 108, 1-33.
Allen F., A. Babus and E. Carletti, 2009, Financial Crises: Theory and Evidence, Annual Review
of Financial Economics, 1, 97-116.
Aragon, G.O. and P.E. Strahan, 2012, Hedge Funds as Liquidity Providers: Evidence from the
the Lehman Bankruptcy, Journal of Financial Economics, 103, 570-586.
Arora, N., P. Gandhi and F.A. Longstaff, 2012, Counterparty Credit Risk and the Credit Default
Swap Market, Journal of Financial Economics, 103, 28-293.
Bai, J., P. Collin-Dufresne, R. Goldstein, and J. Helwege, 2012, On Bounding Credit Event Risk
Premia, working paper.
Benzoni, L., P. Collin-Dufresne, R. Goldstein, and J. Helwege, 2012, Modeling Credit Contagion
via the Updating of Fragile Beliefs, working paper.
Billio, M., M. Getmansky, A.W. Lo, and L. Pelizzon, 2012, Econometric Measures of Systemic
Risk in the Finance and Insurance Sectors, Journal of Financial Economics 104, 535–559
43
Boyson, N., C.W. Stahel, and R.M. Stulz, 2010, Hedge Fund Contagion and Liquidity Shocks,
Journal of Finance, 65, 1789–1816.
Brunnermeier, M., 2009, Deciphering the liquidity and credit crunch 2007–2008, Journal of
Economic Perspectives 23, 77–100.
Brunnermeier, M. and L.H. Pedersen, 2009, Market Liquidity and Funding Liquidity, Review of
Financial Studies, 22, 2201-2238.
Cameron, M., 2011, LBHI Administrators Push for Settlement of Derivatives Claims, Risk,
March 2.
Cecchetti. S.G., J. Gyntelberg and M. Hollanders, 2009, Central counterparties for over-the-
counter derivatives, Bank for International Settlements Quarterly Review, September.
Chakrabarty. B., and G. Zhang, 2012, Credit Contagion Channels: Market Microstructure
Evidence from Lehman Brothers’ Bankruptcy, Financial Management, 41, 320-343.
Cole, R.A. and L.J. White, 2012, Déjà Vu All over Again: The Causes of Commercial Bank
Failures This Time Around, Journal of Financial Services Research, 42, 5-29.
Cooper, I. and A. Mello, 1991, The Default Risk on Swaps, Journal of Finance, 46, 597-620.
Covitz, D., N. Liang, and G. Suarez, 2012, The Evolution of a Financial Crisis: Runs in the
Asset-Backed Commercial Paper Market, Journal of Finance, forthcoming.
Das, S., D. Duffie, N. Kapadia, and L. Saita, 2007, Common Failings: How Corporate Defaults
are Correlated, Journal of Finance 62, 93-117.
Davis, M. and V. Lo, 2001, Infectious Defaults, Quantitative Finance 1, 382-387.
Dickinson, A., D.R. Peterson, and W.A. Christiansen, 1991, An Empirical Investigation into the
Failure of First Republic Bank: Is There a Contagion Effect? Financial Review, 26, 303-
318.
44
Dudleya E. and M. Nimalendrana, 2011, Margins and Hedge Fund Contagion, Journal of
Financial and Quantitative Analysis, 46, 1227-1257.
Duffie, D., A. Eckner, G. Horel, and L. Saita, 2009, Frailty Correlated Default, Journal of
Finance, 2009, 64, 2089-2124.
Duffie, D. and H. Zhu, 2012, Does a Central Clearing Counterparty Reduce Counterparty Risk?,
Review of Asset Pricing Studies, 1, 74-95.
Drehmann, M and N Tarashev, 2011, Measuring the Systemic Importance of Interconnected
Banks, Working paper.
Economic Report of the President, 2010, available at
http://www.whitehouse.gov/sites/default/files/microsites/economic-report-president.pdf
Egginton, J., J.I. Hilliard, A.P. Liebenberg, and I.A. Liebenberg, I.A., 2010, What Effect did
AIG’s Bailout, and the Preceding Events, Have on its Competitors?, Risk Management
and Insurance Review, 2, 225-249.
Eisenberg, L. and T. H. Noe, 2010, Systemic Risk in Financial Systems, Management Science,
47, 236-249.
Fee, C. and S. Thomas, 2004, Sources of Gains in Horizontal Mergers: Evidence from Customer,
Supplier, and Rival Firms, Journal of Financial Economics, 74, 423–460.
Fenn, G., and R. Cole, 1994, Announcements of Asset Quality Problems and Contagion Effects
in the Life Insurance Industry, Journal of Financial Economics, 35, 181-198.
Fernando, C., A. May, and W. Megginson, 2012, The Value of Investment Banking
Relationships: Evidence from the Collapse of Lehman Brothers, Journal of Finance, 67,
235-270.
45
Fields, J.A., J.B. Ross, C. Ghosh, and K.B. Johnson, 1994, Junk Bonds, Life Insurer Insolvency,
and Stock Market Reactions: The Case of First Executive Corporation, Journal of
Financial Services Research, 8, 95-111.
Fields, J.A., L.S. Klein, and E. Myskowski, 1998, Lloyd's Financial Distress and Contagion
within the US Property and Liability Insurance Industry, Journal of Risk and Uncertainty,
16, 173-185.
Fisch, J.E. and E.D. Roiter, 2012, A Floating NAV for Money Market Funds: Fix or Fantasy?
University of Illinois Law Review, 4, 1003-1050.
Flannery, M.J., 1998, Using Market Information in Prudent Bank Supervision: A Review of the
U.S. Empirical Evidence, Journal of Money, Credit and Banking, 30, 273-305.
Furfine, C.H., 2003, Interbank Exposures: Quantifying the Risk of Contagion, Journal of Money,
Credit and Banking, 35, 111-128.
Gieseceke, K., 2004, Correlated Default with Incomplete Information, Journal of Banking and
Finance, 28, 1521-1545.
Gieseceke, K. and S. Weber, 2004, Cyclical Correlations, Credit Contagion, and Portfolio
Losses, Journal of Banking and Finance, 25, 3009-3036.
Giglio, S., 2011, Credit Default Swap Spreads and Systemic Financial Risk, Working paper.
Gilson, S.C., 1989, Management Turnover and Financial Distress, Journal of Financial
Economics, 25, 241-262.
Gorton, G. and A. Metrick, 2012, Securitized banking and the run on repo. Journal of Financial
Economics, 104, 425-451.
Han, S. and X. Zhou, 2009, Information Asymmetry in Corporate Bond Trading, Credit Risk,
and Yield Spread, working paper.
46
Helwege, J., 1999, How Long Do Junk Bonds Spend in Default?, Journal of Finance, 54, 341-
357.
Helwege, J., 2010, Financial Firm Bankruptcy and Systemic Risk, Journal of International
Financial Markets, Institutions, and Money, 33, 231-261.
Hertzel, M., and M. Officer, 2012, Industry Contagion in Loan Spreads, Journal of Financial
Economics, 103, 493-506.
Hertzel, M., Z. Li, M. Officer and K. Rodgers, 2008, Inter-firm Linkages and the Wealth Effects
of Financial Distress along the Supply Chain, Journal of Financial Economics, 87, 374-
387.
Huang, X., H. Zhou, and H. Zhu, 2009, A Framework for Assessing the Systemic Risk of Major
Financial Institutions, Journal of Banking and Finance, 33, 2036-2049.
Ivashina, V. and D. Scharfstein, 2010, Bank Lending during the Financial Crisis of 2008,
Journal of Financial Economics, 97, 319-338.
Iyer, R., and J. L. Peydró, 2011, Interbank Contagion at Work: Evidence from a Natural
Experiment, Review of Financial Studies 24, 1337-1377.
Jarrow, R. and F. Yu, 2001, Counterparty Risk and the Pricing of Defaultable Securities, Journal
of Finance 56, 1765-1799.
Jorion, P. and G. Zhang, 2007, Good and Bad Credit Contagion: Evidence from Credit Default
Swaps, Journal of Financial Economics, 84, 860-883.
Jorion, P. and G. Zhang, 2009, Counterparty Risk, Journal of Financial Economics, 64, 2053-
2087.
Jorion, P. and G. Zhang, 2012, Financial Contagion and Lehman Brothers’ Bankruptcy, working
paper.
47
Kacperczyk, M. and P. Schnabl, 2010, When Safe Proved Risky: Commercial Paper during the
Financial Crisis of 2007-2009, Journal of Economic Perspectives, 24, 29-50.
Kacperczyk, M. and P. Schnabl, 2013, How Safe are Money Market Funds?, forthcoming
Quarterly Journal of Economics.
Kahle, K.M. and R.A. Walkling, 1996, The Impact of Industry Classifications on Financial
Research, Journal of Financial and Quantitative Analysis, 31, 309-335.
Karafiath, I. and J. Glascock, 1989, Intra-Industry Effects of a Regulatory Shift: Capital Market
Evidence from Penn Square, Financial Review, 24, 123-134.
King, M.A., and S. Wadhwani, 1990, Transmission of Volatility between Stock Markets, Review
of Financial Studies, 3, 5-33.
Kodres, L.E. and M. Pritsker, 2002, A Rational Expectations Model of Financial Contagion,
Journal of Finance, 57, 769-799.
Kraft, H. and M. Steffensen, 2007, Bankruptcy, Counterparty Risk and Contagion, Review of
Finance, 11, 209-252.
Lando, D. and M. S. Nielsen, 2010, Correlation in corporate defaults: Contagion or conditional
independence? Journal of Financial Intermediation, 19, 355-372.
Lang, L.H.P. and R.M. Stulz, 1992, Contagion and Competitive Intra-Industry Effects of
Bankruptcy Announcements, Journal of Financial Economics, 32, 45-60.
Longstaff, .F.A., 2010, The Subprime Credit Crisis and Contagion in Financial Markets, Journal
of Financial Economics, 97, 436-450.
MacKinley, A.C, 1997, Event Studies in Economics and Finance, Journal of Economic
Literature, 35, 13-39.
48
Massa, M., A. Yasuda, and L. Zhang, 2010, Investment Horizon of the Bond Investor Base and
the Leverage of the Firm, working paper.
Merton, R., 1974, On the Pricing of Corporate Debt: The Risk Structure of Interest Rates,
Journal of Finance, 29, 449-470.
Mitchell, M. and T. Pulvino, 2012, Arbitrage Crashes and the Speed of Capital, Journal of
Financial Economics, 104, 469-490.
Pastor, L. and P. Veronesi, 2012, Uncertainty about Government Policy and Stock Prices,
Journal of Finance, 67, 1219-1264.
Pirrong, C., 2009, The Inefficiency of Clearing Mandates, Policy Analysis, 665, 1-39.
Pirinsky, C. and Q. Wang, 2006, Does Corporate Headquarters Location Matter for Stock
Returns? Journal of Finance, 61, 1991-2015.
Rochet, J., 2010, Systemic Risk: Changing the Regulatory Perspective, International Journal of
Central Banking, 6, 259-276.
Rochet, J. and J. Tirole, 1996, Interbank Lending and Systemic Risk, Journal of Money, Credit
and Banking, 28, 733-762.
Slovin, M., M. Shushka, and J. Polenchek, 1999, An Analysis of Contagion and Competitive
Effects at Commercial Banks, Journal of Financial Economics, 54, 197-225.
Shleifer, A., and R. W. Vishny, 2011, Fire Sales in Finance and Macroeconomics, Journal of
Economic Perspectives, 25, 29-48.
Staum, J. C. Counterparty Contagion in Context: Contributions to Systemic Risk, working paper.
Strahan, P.E. and B. Tanyeri, 2013. Once Burned, Twice Shy: Money Market Fund Responses to
a Systemic Liquidity Shock, Journal of Financial and Quantitative Analysis, forthcoming.
49
Suh, S., 2011, An Analysis of Contagion and Competitive Effects at Commercial Banks, Journal
of Financial Intermediation, 24, 341-358.
Summe, K., 2011, Misconceptions about Lehman Brothers Bankruptcy and the Role Derivatives
Played, Stanford Law Review Online, 64, 16-21.
Theocharides, G., 2008, Contagion: Evidence from the Bond Market, working paper.
USA Today, 2007, American Home Mortgage Files for Bankruptcy, August 7.
Veronesi, P., 2000, How Does Information Quality Affect Stock Returns? Journal of Finance,
55, 807-837.
Wagner, W., 2011, Systemic Liquidation Risk and the Diversity-Diversification Trade-off,
Journal of Finance 64, 1141-1175.
Yang, J. and Y. Zhou, 2012, Credit Risk Spillovers among Financial Institutions around the
Global Credit Crisis: Firm Level Evidence, Management Science, forthcoming.
Zhang, G., 2010, Emerging from Chapter 11 Bankruptcy: Is It Good News or Bad News for
Industry Competitors? Financial Management, 39, 1719–1742.
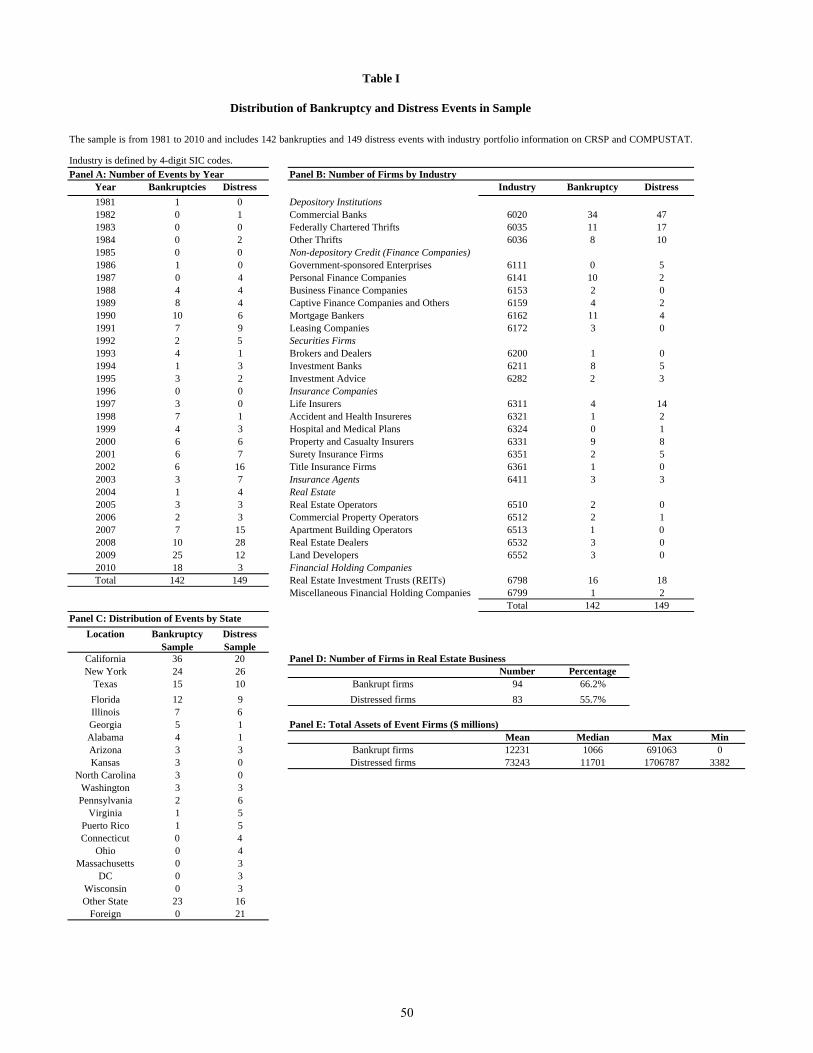
Year Bankruptcies Distress Industry Bankruptcy Distress
1981 1 0 Depository Institutions 1982 0 1 Commercial Banks 6020 34 471983 0 0 Federally Chartered Thrifts 6035 11 171984 0 2 Other Thrifts 6036 8 101985 0 0 Non-depository Credit (Finance Companies)1986 1 0 Government-sponsored Enterprises 6111 0 51987 0 4 Personal Finance Companies 6141 10 21988 4 4 Business Finance Companies 6153 2 01989 8 4 Captive Finance Companies and Others 6159 4 21990 10 6 Mortgage Bankers 6162 11 41991 7 9 Leasing Companies 6172 3 01992 2 5 Securities Firms1993 4 1 Brokers and Dealers 6200 1 01994 1 3 Investment Banks 6211 8 51995 3 2 Investment Advice 6282 2 31996 0 0 Insurance Companies1997 3 0 Life Insurers 6311 4 141998 7 1 Accident and Health Insureres 6321 1 21999 4 3 Hospital and Medical Plans 6324 0 12000 6 6 Property and Casualty Insurers 6331 9 82001 6 7 Surety Insurance Firms 6351 2 52002 6 16 Title Insurance Firms 6361 1 02003 3 7 Insurance Agents 6411 3 32004 1 4 Real Estate2005 3 3 Real Estate Operators 6510 2 02006 2 3 Commercial Property Operators 6512 2 12007 7 15 Apartment Building Operators 6513 1 02008 10 28 Real Estate Dealers 6532 3 02009 25 12 Land Developers 6552 3 02010 18 3 Financial Holding CompaniesTotal 142 149 Real Estate Investment Trusts (REITs) 6798 16 18
Miscellaneous Financial Holding Companies 6799 1 2Total 142 149
Location Bankruptcy Sample
Distress Sample
California 36 20New York 24 26 Number Percentage
Texas 15 10 Bankrupt firms 94 66.2%
Florida 12 9 Distressed firms 83 55.7%Illinois 7 6Georgia 5 1Alabama 4 1 Mean Median Max MinArizona 3 3 Bankrupt firms 12231 1066 691063 0Kansas 3 0 Distressed firms 73243 11701 1706787 3382
North Carolina 3 0Washington 3 3Pennsylvania 2 6
Virginia 1 5Puerto Rico 1 5Connecticut 0 4
Ohio 0 4Massachusetts 0 3
DC 0 3Wisconsin 0 3Other State 23 16
Foreign 0 21
Panel E: Total Assets of Event Firms ($ millions)
Panel A: Number of Events by Year Panel B: Number of Firms by Industry
The sample is from 1981 to 2010 and includes 142 bankrupties and 149 distress events with industry portfolio information on CRSP and COMPUSTAT.
Industry is defined by 4-digit SIC codes.
Table I
Distribution of Bankruptcy and Distress Events in Sample
Panel C: Distribution of Events by State
Panel D: Number of Firms in Real Estate Business
50
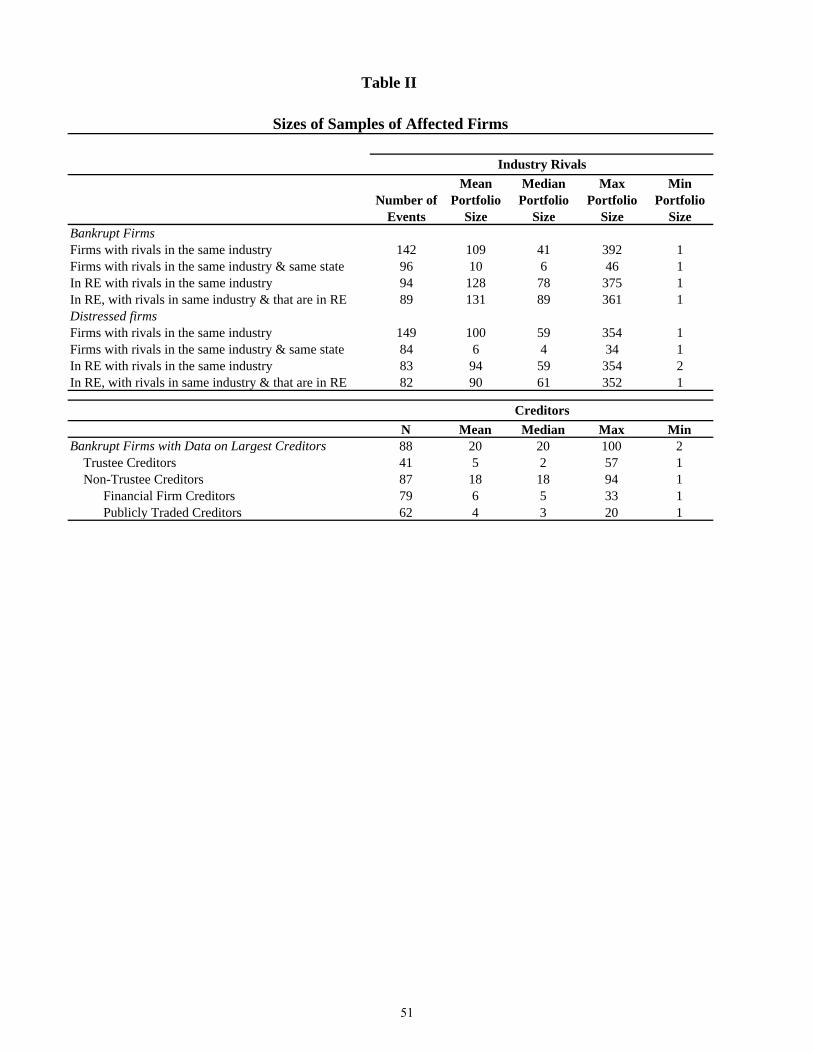
Mean Median Max MinNumber of Portfolio Portfolio Portfolio Portfolio
Events Size Size Size SizeBankrupt FirmsFirms with rivals in the same industry 142 109 41 392 1Firms with rivals in the same industry & same state 96 10 6 46 1In RE with rivals in the same industry 94 128 78 375 1In RE, with rivals in same industry & that are in RE 89 131 89 361 1Distressed firmsFirms with rivals in the same industry 149 100 59 354 1Firms with rivals in the same industry & same state 84 6 4 34 1In RE with rivals in the same industry 83 94 59 354 2In RE, with rivals in same industry & that are in RE 82 90 61 352 1
N Mean Median Max MinBankrupt Firms with Data on Largest Creditors 88 20 20 100 2 Trustee Creditors 41 5 2 57 1 Non-Trustee Creditors 87 18 18 94 1 Financial Firm Creditors 79 6 5 33 1 Publicly Traded Creditors 62 4 3 20 1
Sizes of Samples of Affected Firms
Table II
Industry Rivals
Creditors
51
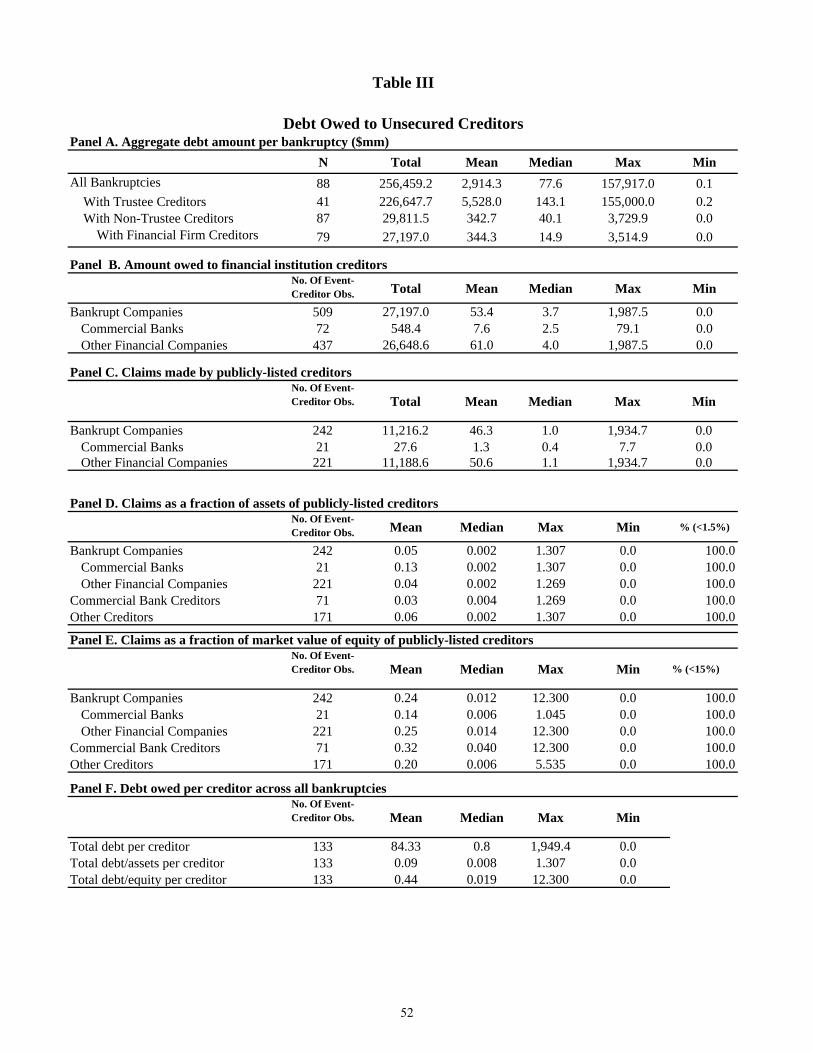
N Total Mean Median Max Min
All Bankruptcies 88 256,459.2 2,914.3 77.6 157,917.0 0.1 With Trustee Creditors 41 226,647.7 5,528.0 143.1 155,000.0 0.2 With Non-Trustee Creditors 87 29,811.5 342.7 40.1 3,729.9 0.0 With Financial Firm Creditors 79 27,197.0 344.3 14.9 3,514.9 0.0
No. Of Event-Creditor Obs. Total Mean Median Max Min
Bankrupt Companies 509 27,197.0 53.4 3.7 1,987.5 0.0Commercial Banks 72 548.4 7.6 2.5 79.1 0.0Other Financial Companies 437 26,648.6 61.0 4.0 1,987.5 0.0
No. Of Event-Creditor Obs. Total Mean Median Max Min
Bankrupt Companies 242 11,216.2 46.3 1.0 1,934.7 0.0Commercial Banks 21 27.6 1.3 0.4 7.7 0.0Other Financial Companies 221 11,188.6 50.6 1.1 1,934.7 0.0
No. Of Event-Creditor Obs. Mean Median Max Min % (<1.5%)
Bankrupt Companies 242 0.05 0.002 1.307 0.0 100.0Commercial Banks 21 0.13 0.002 1.307 0.0 100.0Other Financial Companies 221 0.04 0.002 1.269 0.0 100.0
Commercial Bank Creditors 71 0.03 0.004 1.269 0.0 100.0Other Creditors 171 0.06 0.002 1.307 0.0 100.0
No. Of Event-Creditor Obs. Mean Median Max Min % (<15%)
Bankrupt Companies 242 0.24 0.012 12.300 0.0 100.0Commercial Banks 21 0.14 0.006 1.045 0.0 100.0Other Financial Companies 221 0.25 0.014 12.300 0.0 100.0
Commercial Bank Creditors 71 0.32 0.040 12.300 0.0 100.0Other Creditors 171 0.20 0.006 5.535 0.0 100.0
No. Of Event-Creditor Obs. Mean Median Max Min
Total debt per creditor 133 84.33 0.8 1,949.4 0.0Total debt/assets per creditor 133 0.09 0.008 1.307 0.0Total debt/equity per creditor 133 0.44 0.019 12.300 0.0
Panel E. Claims as a fraction of market value of equity of publicly-listed creditors
Panel F. Debt owed per creditor across all bankruptcies
Table III
Panel A. Aggregate debt amount per bankruptcy ($mm)Debt Owed to Unsecured Creditors
Panel D. Claims as a fraction of assets of publicly-listed creditors
Panel B. Amount owed to financial institution creditors
Panel C. Claims made by publicly-listed creditors
52
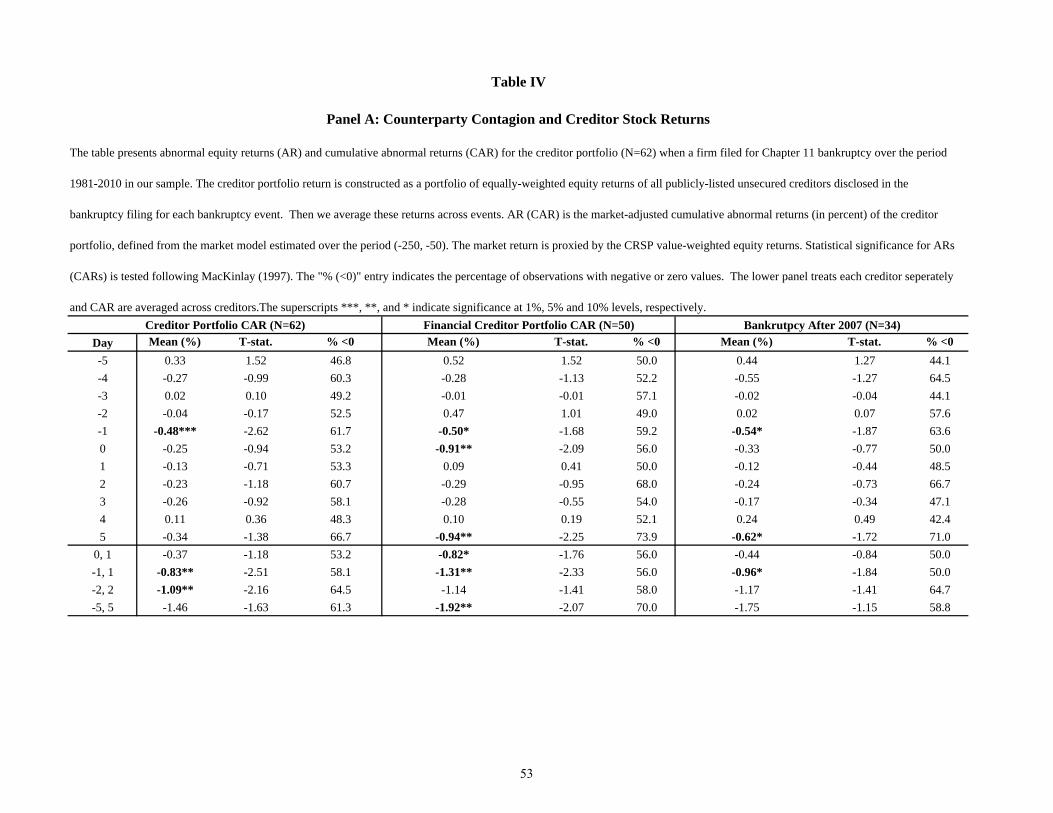
Day Mean (%) T-stat. % <0 Mean (%) T-stat. % <0 Mean (%) T-stat. % <0
-5 0.33 1.52 46.8 0.52 1.52 50.0 0.44 1.27 44.1
-4 -0.27 -0.99 60.3 -0.28 -1.13 52.2 -0.55 -1.27 64.5
-3 0.02 0.10 49.2 -0.01 -0.01 57.1 -0.02 -0.04 44.1
-2 -0.04 -0.17 52.5 0.47 1.01 49.0 0.02 0.07 57.6
-1 -0.48*** -2.62 61.7 -0.50* -1.68 59.2 -0.54* -1.87 63.6
0 -0.25 -0.94 53.2 -0.91** -2.09 56.0 -0.33 -0.77 50.0
1 -0.13 -0.71 53.3 0.09 0.41 50.0 -0.12 -0.44 48.5
2 -0.23 -1.18 60.7 -0.29 -0.95 68.0 -0.24 -0.73 66.7
3 -0.26 -0.92 58.1 -0.28 -0.55 54.0 -0.17 -0.34 47.1
4 0.11 0.36 48.3 0.10 0.19 52.1 0.24 0.49 42.4
5 -0.34 -1.38 66.7 -0.94** -2.25 73.9 -0.62* -1.72 71.0
0, 1 -0.37 -1.18 53.2 -0.82* -1.76 56.0 -0.44 -0.84 50.0
-1, 1 -0.83** -2.51 58.1 -1.31** -2.33 56.0 -0.96* -1.84 50.0
-2, 2 -1.09** -2.16 64.5 -1.14 -1.41 58.0 -1.17 -1.41 64.7
-5, 5 -1.46 -1.63 61.3 -1.92** -2.07 70.0 -1.75 -1.15 58.8
Financial Creditor Portfolio CAR (N=50)Creditor Portfolio CAR (N=62)
The table presents abnormal equity returns (AR) and cumulative abnormal returns (CAR) for the creditor portfolio (N=62) when a firm filed for Chapter 11 bankruptcy over the period
1981-2010 in our sample. The creditor portfolio return is constructed as a portfolio of equally-weighted equity returns of all publicly-listed unsecured creditors disclosed in the
bankruptcy filing for each bankruptcy event. Then we average these returns across events. AR (CAR) is the market-adjusted cumulative abnormal returns (in percent) of the creditor
portfolio, defined from the market model estimated over the period (-250, -50). The market return is proxied by the CRSP value-weighted equity returns. Statistical significance for ARs
(CARs) is tested following MacKinlay (1997). The "% (<0)" entry indicates the percentage of observations with negative or zero values. The lower panel treats each creditor seperately
and CAR are averaged across creditors.The superscripts ***, **, and * indicate significance at 1%, 5% and 10% levels, respectively.
Panel A: Counterparty Contagion and Creditor Stock Returns
Table IV
Bankrutpcy After 2007 (N=34)
53
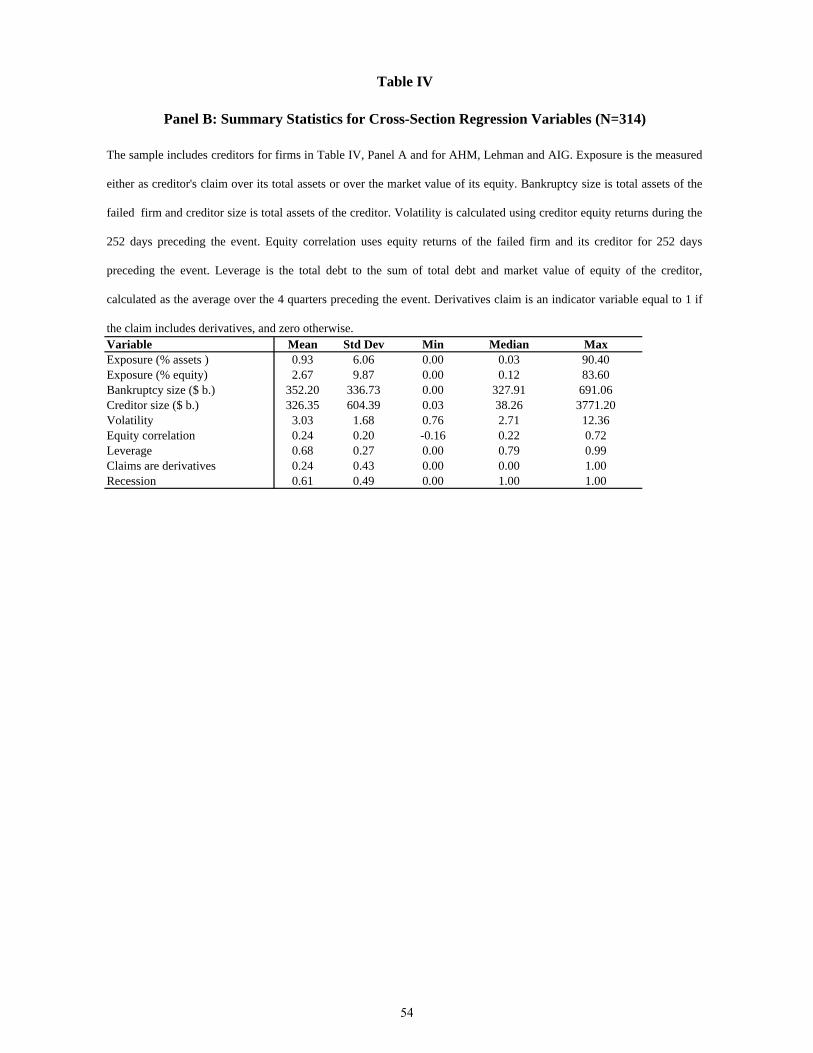
Variable Mean Std Dev Min Median MaxExposure (% assets ) 0.93 6.06 0.00 0.03 90.40Exposure (% equity) 2.67 9.87 0.00 0.12 83.60Bankruptcy size ($ b.) 352.20 336.73 0.00 327.91 691.06Creditor size ($ b.) 326.35 604.39 0.03 38.26 3771.20Volatility 3.03 1.68 0.76 2.71 12.36Equity correlation 0.24 0.20 -0.16 0.22 0.72Leverage 0.68 0.27 0.00 0.79 0.99Claims are derivatives 0.24 0.43 0.00 0.00 1.00Recession 0.61 0.49 0.00 1.00 1.00
The sample includes creditors for firms in Table IV, Panel A and for AHM, Lehman and AIG. Exposure is the measured
either as creditor's claim over its total assets or over the market value of its equity. Bankruptcy size is total assets of the
failed firm and creditor size is total assets of the creditor. Volatility is calculated using creditor equity returns during the
252 days preceding the event. Equity correlation uses equity returns of the failed firm and its creditor for 252 days
preceding the event. Leverage is the total debt to the sum of total debt and market value of equity of the creditor,
calculated as the average over the 4 quarters preceding the event. Derivatives claim is an indicator variable equal to 1 if
the claim includes derivatives, and zero otherwise.
Panel B: Summary Statistics for Cross-Section Regression Variables (N=314)
Table IV
54
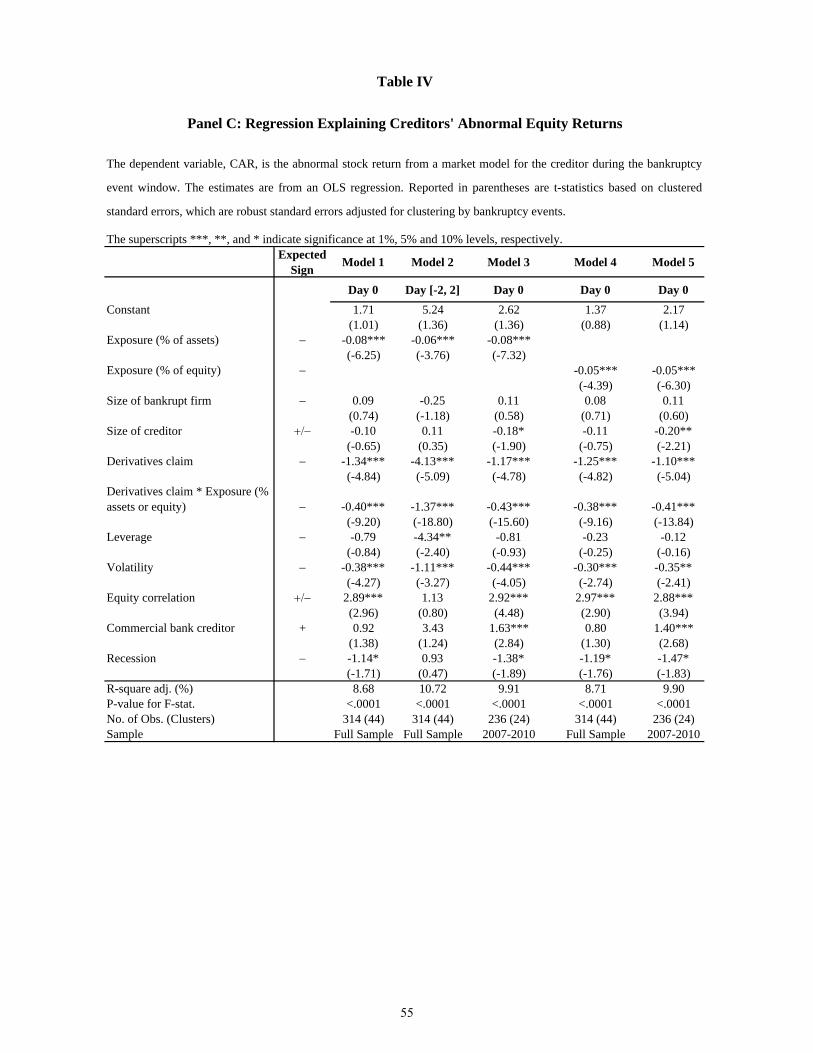
Expected
SignModel 1 Model 2 Model 3 Model 4 Model 5
Day 0 Day [-2, 2] Day 0 Day 0 Day 0
Constant 1.71 5.24 2.62 1.37 2.17(1.01) (1.36) (1.36) (0.88) (1.14)
Exposure (% of assets) -0.08*** -0.06*** -0.08***(-6.25) (-3.76) (-7.32)
Exposure (% of equity) -0.05*** -0.05***(-4.39) (-6.30)
Size of bankrupt firm 0.09 -0.25 0.11 0.08 0.11(0.74) (-1.18) (0.58) (0.71) (0.60)
Size of creditor -0.10 0.11 -0.18* -0.11 -0.20**(-0.65) (0.35) (-1.90) (-0.75) (-2.21)
Derivatives claim -1.34*** -4.13*** -1.17*** -1.25*** -1.10***(-4.84) (-5.09) (-4.78) (-4.82) (-5.04)
Derivatives claim * Exposure (% assets or equity) -0.40*** -1.37*** -0.43*** -0.38*** -0.41***
(-9.20) (-18.80) (-15.60) (-9.16) (-13.84)Leverage -0.79 -4.34** -0.81 -0.23 -0.12
(-0.84) (-2.40) (-0.93) (-0.25) (-0.16)Volatility -0.38*** -1.11*** -0.44*** -0.30*** -0.35**
(-4.27) (-3.27) (-4.05) (-2.74) (-2.41)Equity correlation 2.89*** 1.13 2.92*** 2.97*** 2.88***
(2.96) (0.80) (4.48) (2.90) (3.94)Commercial bank creditor + 0.92 3.43 1.63*** 0.80 1.40***
(1.38) (1.24) (2.84) (1.30) (2.68)Recession -1.14* 0.93 -1.38* -1.19* -1.47*
(-1.71) (0.47) (-1.89) (-1.76) (-1.83)R-square adj. (%) 8.68 10.72 9.91 8.71 9.90P-value for F-stat. <.0001 <.0001 <.0001 <.0001 <.0001No. of Obs. (Clusters) 314 (44) 314 (44) 236 (24) 314 (44) 236 (24)Sample Full Sample Full Sample 2007-2010 Full Sample 2007-2010
The dependent variable, CAR, is the abnormal stock return from a market model for the creditor during the bankruptcy
event window. The estimates are from an OLS regression. Reported in parentheses are t-statistics based on clustered
standard errors, which are robust standard errors adjusted for clustering by bankruptcy events.
The superscripts ***, **, and * indicate significance at 1%, 5% and 10% levels, respectively.
Panel C: Regression Explaining Creditors' Abnormal Equity Returns
Table IV
55
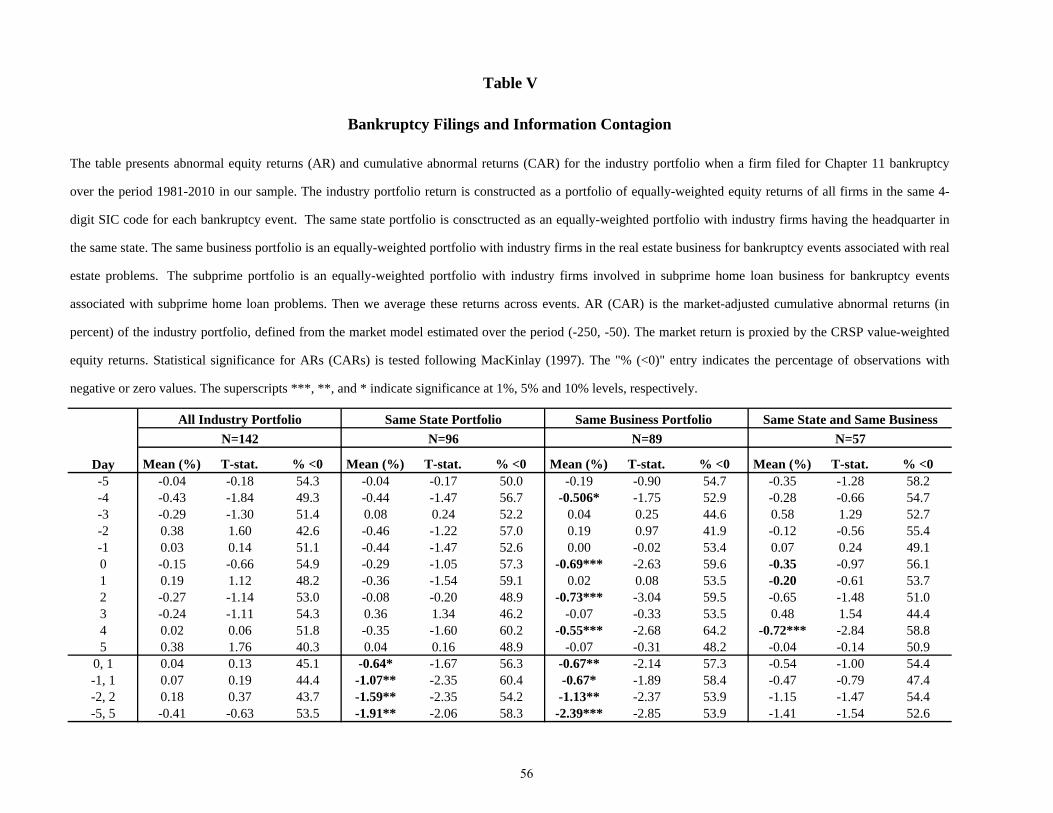
Day Mean (%) T-stat. % <0 Mean (%) T-stat. % <0 Mean (%) T-stat. % <0 Mean (%) T-stat. % <0-5 -0.04 -0.18 54.3 -0.04 -0.17 50.0 -0.19 -0.90 54.7 -0.35 -1.28 58.2-4 -0.43 -1.84 49.3 -0.44 -1.47 56.7 -0.506* -1.75 52.9 -0.28 -0.66 54.7-3 -0.29 -1.30 51.4 0.08 0.24 52.2 0.04 0.25 44.6 0.58 1.29 52.7-2 0.38 1.60 42.6 -0.46 -1.22 57.0 0.19 0.97 41.9 -0.12 -0.56 55.4-1 0.03 0.14 51.1 -0.44 -1.47 52.6 0.00 -0.02 53.4 0.07 0.24 49.10 -0.15 -0.66 54.9 -0.29 -1.05 57.3 -0.69*** -2.63 59.6 -0.35 -0.97 56.11 0.19 1.12 48.2 -0.36 -1.54 59.1 0.02 0.08 53.5 -0.20 -0.61 53.72 -0.27 -1.14 53.0 -0.08 -0.20 48.9 -0.73*** -3.04 59.5 -0.65 -1.48 51.03 -0.24 -1.11 54.3 0.36 1.34 46.2 -0.07 -0.33 53.5 0.48 1.54 44.44 0.02 0.06 51.8 -0.35 -1.60 60.2 -0.55*** -2.68 64.2 -0.72*** -2.84 58.85 0.38 1.76 40.3 0.04 0.16 48.9 -0.07 -0.31 48.2 -0.04 -0.14 50.9
0, 1 0.04 0.13 45.1 -0.64* -1.67 56.3 -0.67** -2.14 57.3 -0.54 -1.00 54.4-1, 1 0.07 0.19 44.4 -1.07** -2.35 60.4 -0.67* -1.89 58.4 -0.47 -0.79 47.4-2, 2 0.18 0.37 43.7 -1.59** -2.35 54.2 -1.13** -2.37 53.9 -1.15 -1.47 54.4-5, 5 -0.41 -0.63 53.5 -1.91** -2.06 58.3 -2.39*** -2.85 53.9 -1.41 -1.54 52.6
N=142 N=96 N=89 N=57
The table presents abnormal equity returns (AR) and cumulative abnormal returns (CAR) for the industry portfolio when a firm filed for Chapter 11 bankruptcy
over the period 1981-2010 in our sample. The industry portfolio return is constructed as a portfolio of equally-weighted equity returns of all firms in the same 4-
digit SIC code for each bankruptcy event. The same state portfolio is consctructed as an equally-weighted portfolio with industry firms having the headquarter in
the same state. The same business portfolio is an equally-weighted portfolio with industry firms in the real estate business for bankruptcy events associated with real
estate problems. The subprime portfolio is an equally-weighted portfolio with industry firms involved in subprime home loan business for bankruptcy events
associated with subprime home loan problems. Then we average these returns across events. AR (CAR) is the market-adjusted cumulative abnormal returns (in
percent) of the industry portfolio, defined from the market model estimated over the period (-250, -50). The market return is proxied by the CRSP value-weighted
equity returns. Statistical significance for ARs (CARs) is tested following MacKinlay (1997). The "% (<0)" entry indicates the percentage of observations with
negative or zero values. The superscripts ***, **, and * indicate significance at 1%, 5% and 10% levels, respectively.
Table V
Bankruptcy Filings and Information Contagion
All Industry Portfolio Same State Portfolio Same Business Portfolio Same State and Same Business
56
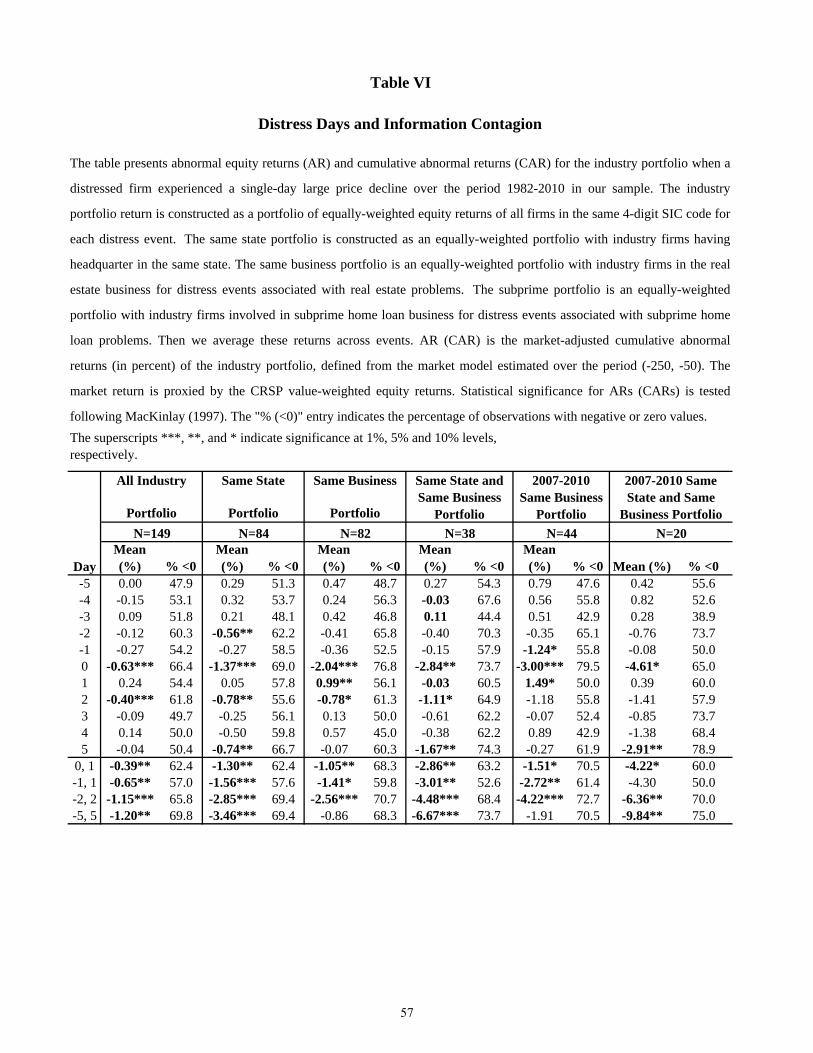
DayMean (%) % <0
Mean (%) % <0
Mean (%) % <0
Mean (%) % <0
Mean (%) % <0 Mean (%) % <0
-5 0.00 47.9 0.29 51.3 0.47 48.7 0.27 54.3 0.79 47.6 0.42 55.6-4 -0.15 53.1 0.32 53.7 0.24 56.3 -0.03 67.6 0.56 55.8 0.82 52.6-3 0.09 51.8 0.21 48.1 0.42 46.8 0.11 44.4 0.51 42.9 0.28 38.9-2 -0.12 60.3 -0.56** 62.2 -0.41 65.8 -0.40 70.3 -0.35 65.1 -0.76 73.7-1 -0.27 54.2 -0.27 58.5 -0.36 52.5 -0.15 57.9 -1.24* 55.8 -0.08 50.00 -0.63*** 66.4 -1.37*** 69.0 -2.04*** 76.8 -2.84** 73.7 -3.00*** 79.5 -4.61* 65.01 0.24 54.4 0.05 57.8 0.99** 56.1 -0.03 60.5 1.49* 50.0 0.39 60.02 -0.40*** 61.8 -0.78** 55.6 -0.78* 61.3 -1.11* 64.9 -1.18 55.8 -1.41 57.93 -0.09 49.7 -0.25 56.1 0.13 50.0 -0.61 62.2 -0.07 52.4 -0.85 73.74 0.14 50.0 -0.50 59.8 0.57 45.0 -0.38 62.2 0.89 42.9 -1.38 68.45 -0.04 50.4 -0.74** 66.7 -0.07 60.3 -1.67** 74.3 -0.27 61.9 -2.91** 78.9
0, 1 -0.39** 62.4 -1.30** 62.4 -1.05** 68.3 -2.86** 63.2 -1.51* 70.5 -4.22* 60.0-1, 1 -0.65** 57.0 -1.56*** 57.6 -1.41* 59.8 -3.01** 52.6 -2.72** 61.4 -4.30 50.0-2, 2 -1.15*** 65.8 -2.85*** 69.4 -2.56*** 70.7 -4.48*** 68.4 -4.22*** 72.7 -6.36** 70.0-5, 5 -1.20** 69.8 -3.46*** 69.4 -0.86 68.3 -6.67*** 73.7 -1.91 70.5 -9.84** 75.0
Table VI
2007-2010 Same Business
Portfolio
2007-2010 Same State and Same
Business Portfolio
N=44 N=20
The table presents abnormal equity returns (AR) and cumulative abnormal returns (CAR) for the industry portfolio when a
distressed firm experienced a single-day large price decline over the period 1982-2010 in our sample. The industry
portfolio return is constructed as a portfolio of equally-weighted equity returns of all firms in the same 4-digit SIC code for
each distress event. The same state portfolio is constructed as an equally-weighted portfolio with industry firms having
headquarter in the same state. The same business portfolio is an equally-weighted portfolio with industry firms in the real
estate business for distress events associated with real estate problems. The subprime portfolio is an equally-weighted
portfolio with industry firms involved in subprime home loan business for distress events associated with subprime home
loan problems. Then we average these returns across events. AR (CAR) is the market-adjusted cumulative abnormal
returns (in percent) of the industry portfolio, defined from the market model estimated over the period (-250, -50). The
market return is proxied by the CRSP value-weighted equity returns. Statistical significance for ARs (CARs) is tested
following MacKinlay (1997). The "% (<0)" entry indicates the percentage of observations with negative or zero values.
Same State and Same Business
Portfolio
N=38
The superscripts ***, **, and * indicate significance at 1%, 5% and 10% levels, respectively.
N=149 N=84 N=82
Distress Days and Information Contagion
Same Business
Portfolio
All Industry
Portfolio
Same State
Portfolio
57
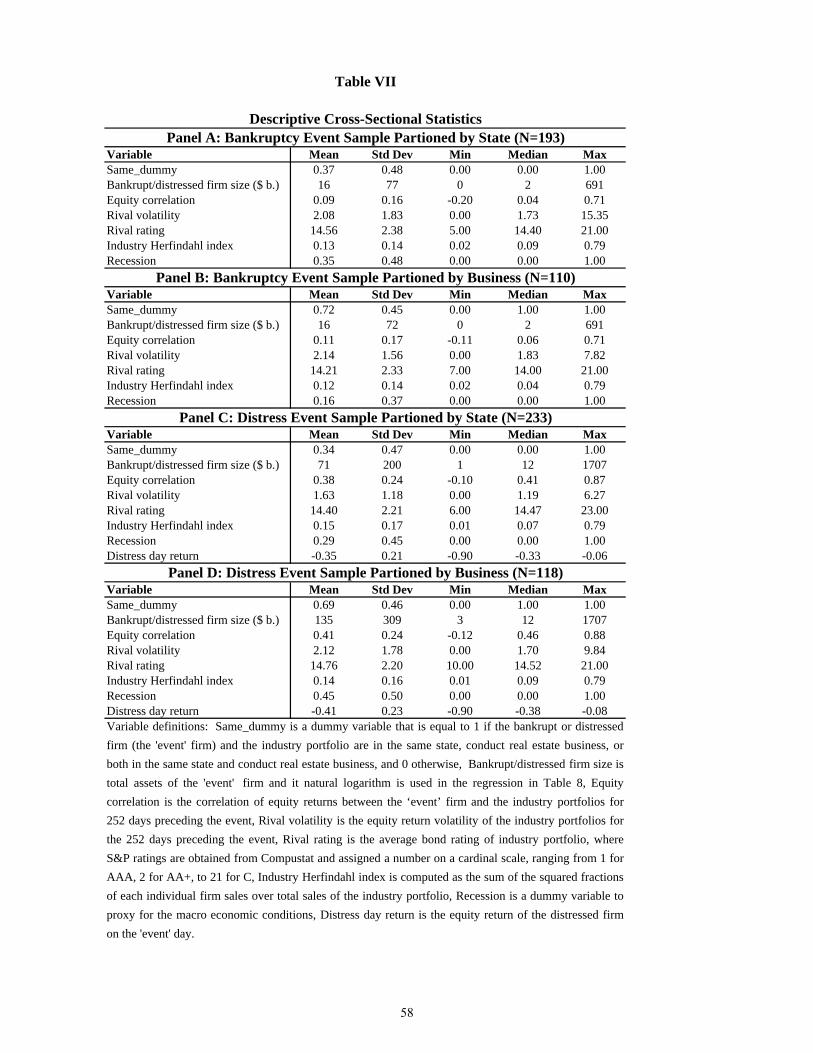
Variable Mean Std Dev Min Median MaxSame_dummy 0.37 0.48 0.00 0.00 1.00Bankrupt/distressed firm size ($ b.) 16 77 0 2 691Equity correlation 0.09 0.16 -0.20 0.04 0.71Rival volatility 2.08 1.83 0.00 1.73 15.35Rival rating 14.56 2.38 5.00 14.40 21.00Industry Herfindahl index 0.13 0.14 0.02 0.09 0.79Recession 0.35 0.48 0.00 0.00 1.00
Variable Mean Std Dev Min Median MaxSame_dummy 0.72 0.45 0.00 1.00 1.00Bankrupt/distressed firm size ($ b.) 16 72 0 2 691Equity correlation 0.11 0.17 -0.11 0.06 0.71Rival volatility 2.14 1.56 0.00 1.83 7.82Rival rating 14.21 2.33 7.00 14.00 21.00Industry Herfindahl index 0.12 0.14 0.02 0.04 0.79Recession 0.16 0.37 0.00 0.00 1.00
Variable Mean Std Dev Min Median MaxSame_dummy 0.34 0.47 0.00 0.00 1.00Bankrupt/distressed firm size ($ b.) 71 200 1 12 1707Equity correlation 0.38 0.24 -0.10 0.41 0.87Rival volatility 1.63 1.18 0.00 1.19 6.27Rival rating 14.40 2.21 6.00 14.47 23.00Industry Herfindahl index 0.15 0.17 0.01 0.07 0.79Recession 0.29 0.45 0.00 0.00 1.00Distress day return -0.35 0.21 -0.90 -0.33 -0.06
Variable Mean Std Dev Min Median MaxSame_dummy 0.69 0.46 0.00 1.00 1.00Bankrupt/distressed firm size ($ b.) 135 309 3 12 1707Equity correlation 0.41 0.24 -0.12 0.46 0.88Rival volatility 2.12 1.78 0.00 1.70 9.84Rival rating 14.76 2.20 10.00 14.52 21.00Industry Herfindahl index 0.14 0.16 0.01 0.09 0.79Recession 0.45 0.50 0.00 0.00 1.00Distress day return -0.41 0.23 -0.90 -0.38 -0.08Variable definitions: Same_dummy is a dummy variable that is equal to 1 if the bankrupt or distressed
firm (the 'event' firm) and the industry portfolio are in the same state, conduct real estate business, or
both in the same state and conduct real estate business, and 0 otherwise, Bankrupt/distressed firm size is
total assets of the 'event' firm and it natural logarithm is used in the regression in Table 8, Equity
correlation is the correlation of equity returns between the ‘event’ firm and the industry portfolios for
252 days preceding the event, Rival volatility is the equity return volatility of the industry portfolios for
the 252 days preceding the event, Rival rating is the average bond rating of industry portfolio, where
S&P ratings are obtained from Compustat and assigned a number on a cardinal scale, ranging from 1 for
AAA, 2 for AA+, to 21 for C, Industry Herfindahl index is computed as the sum of the squared fractions
of each individual firm sales over total sales of the industry portfolio, Recession is a dummy variable to
proxy for the macro economic conditions, Distress day return is the equity return of the distressed firm
on the 'event' day.
Table VII
Descriptive Cross-Sectional StatisticsPanel A: Bankruptcy Event Sample Partioned by State (N=193)
Panel B: Bankruptcy Event Sample Partioned by Business (N=110)
Panel C: Distress Event Sample Partioned by State (N=233)
Panel D: Distress Event Sample Partioned by Business (N=118)
58
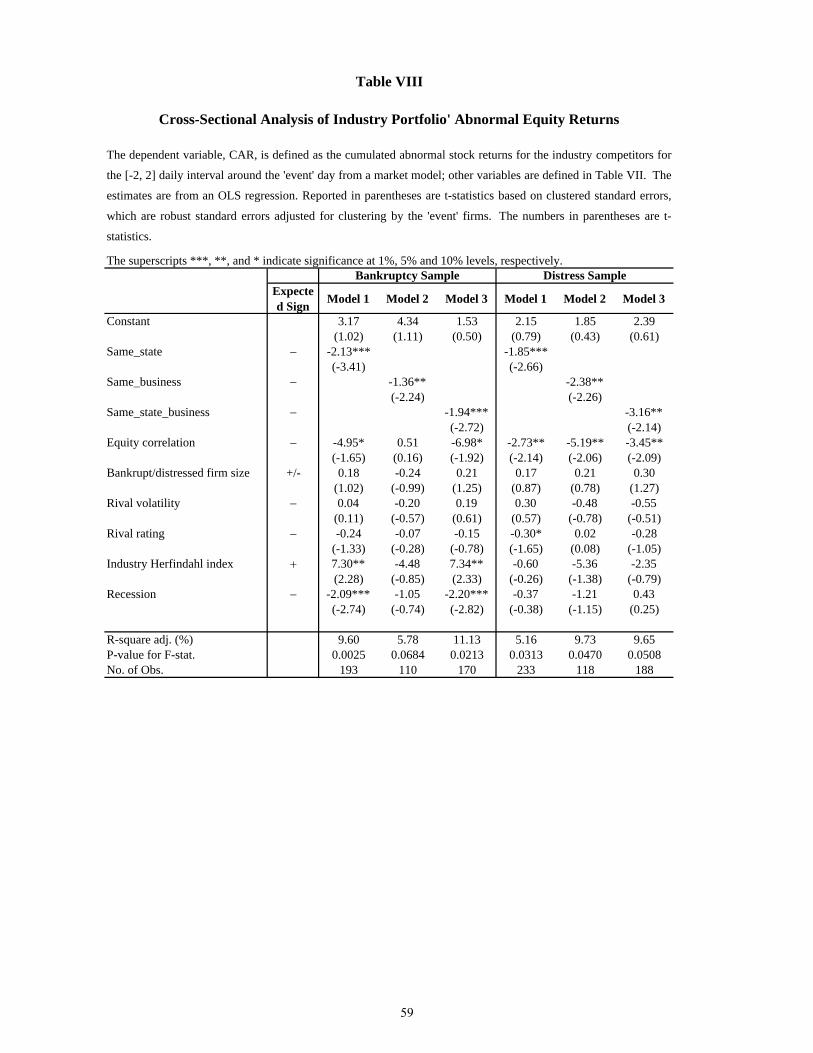
Expected Sign
Model 1 Model 2 Model 3 Model 1 Model 2 Model 3
Constant 3.17 4.34 1.53 2.15 1.85 2.39(1.02) (1.11) (0.50) (0.79) (0.43) (0.61)
Same_state -2.13*** -1.85***(-3.41) (-2.66)
Same_business -1.36** -2.38**(-2.24) (-2.26)
Same_state_business -1.94*** -3.16**(-2.72) (-2.14)
Equity correlation -4.95* 0.51 -6.98* -2.73** -5.19** -3.45**(-1.65) (0.16) (-1.92) (-2.14) (-2.06) (-2.09)
Bankrupt/distressed firm size +/- 0.18 -0.24 0.21 0.17 0.21 0.30(1.02) (-0.99) (1.25) (0.87) (0.78) (1.27)
Rival volatility 0.04 -0.20 0.19 0.30 -0.48 -0.55(0.11) (-0.57) (0.61) (0.57) (-0.78) (-0.51)
Rival rating -0.24 -0.07 -0.15 -0.30* 0.02 -0.28(-1.33) (-0.28) (-0.78) (-1.65) (0.08) (-1.05)
Industry Herfindahl index 7.30** -4.48 7.34** -0.60 -5.36 -2.35(2.28) (-0.85) (2.33) (-0.26) (-1.38) (-0.79)
Recession -2.09*** -1.05 -2.20*** -0.37 -1.21 0.43(-2.74) (-0.74) (-2.82) (-0.38) (-1.15) (0.25)
R-square adj. (%) 9.60 5.78 11.13 5.16 9.73 9.65P-value for F-stat. 0.0025 0.0684 0.0213 0.0313 0.0470 0.0508No. of Obs. 193 110 170 233 118 188
Bankruptcy Sample Distress Sample
Table VIII
Cross-Sectional Analysis of Industry Portfolio' Abnormal Equity Returns
The dependent variable, CAR, is defined as the cumulated abnormal stock returns for the industry competitors for
the [-2, 2] daily interval around the 'event' day from a market model; other variables are defined in Table VII. The
estimates are from an OLS regression. Reported in parentheses are t-statistics based on clustered standard errors,
which are robust standard errors adjusted for clustering by the 'event' firms. The numbers in parentheses are t-
statistics.
The superscripts ***, **, and * indicate significance at 1%, 5% and 10% levels, respectively.
59
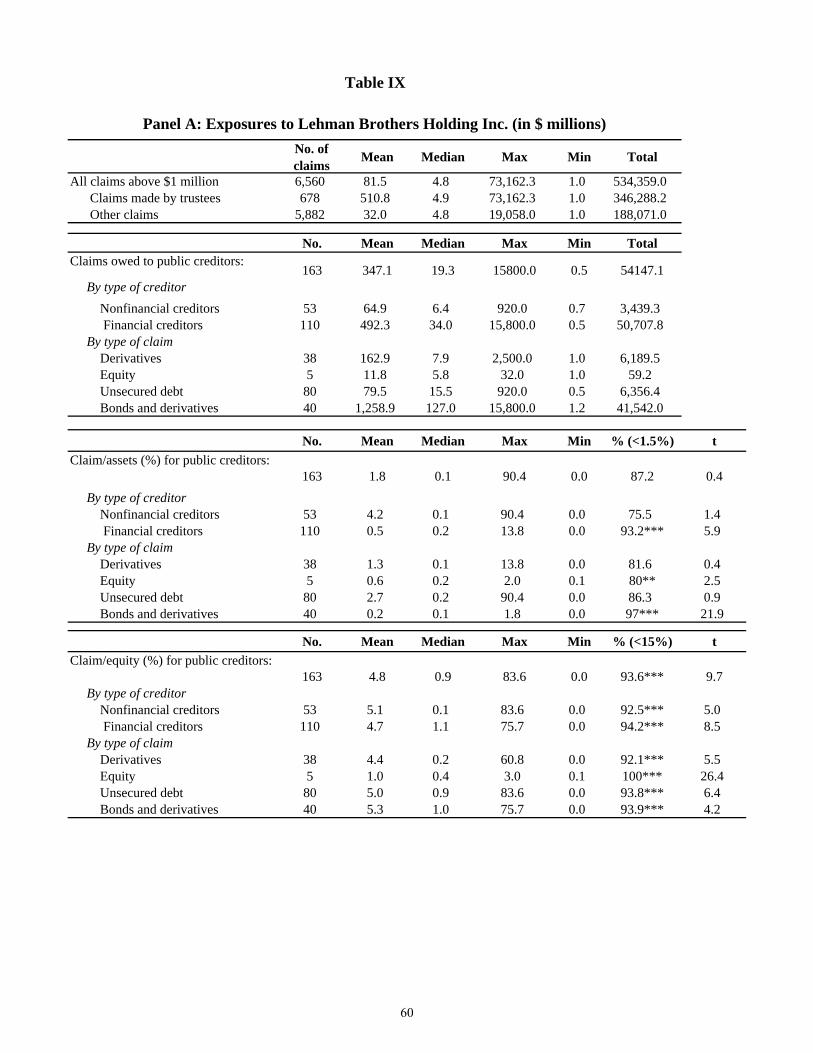
No. of claims
Mean Median Max Min Total
All claims above $1 million 6,560 81.5 4.8 73,162.3 1.0 534,359.0 Claims made by trustees 678 510.8 4.9 73,162.3 1.0 346,288.2 Other claims 5,882 32.0 4.8 19,058.0 1.0 188,071.0
No. Mean Median Max Min TotalClaims owed to public creditors:
163 347.1 19.3 15800.0 0.5 54147.1 By type of creditor
Nonfinancial creditors 53 64.9 6.4 920.0 0.7 3,439.3 Financial creditors 110 492.3 34.0 15,800.0 0.5 50,707.8 By type of claim Derivatives 38 162.9 7.9 2,500.0 1.0 6,189.5 Equity 5 11.8 5.8 32.0 1.0 59.2 Unsecured debt 80 79.5 15.5 920.0 0.5 6,356.4 Bonds and derivatives 40 1,258.9 127.0 15,800.0 1.2 41,542.0
No. Mean Median Max Min % (<1.5%) t
Claim/assets (%) for public creditors:163 1.8 0.1 90.4 0.0 87.2 0.4
By type of creditor Nonfinancial creditors 53 4.2 0.1 90.4 0.0 75.5 1.4 Financial creditors 110 0.5 0.2 13.8 0.0 93.2*** 5.9 By type of claim Derivatives 38 1.3 0.1 13.8 0.0 81.6 0.4 Equity 5 0.6 0.2 2.0 0.1 80** 2.5 Unsecured debt 80 2.7 0.2 90.4 0.0 86.3 0.9 Bonds and derivatives 40 0.2 0.1 1.8 0.0 97*** 21.9
No. Mean Median Max Min % (<15%) t
Claim/equity (%) for public creditors:163 4.8 0.9 83.6 0.0 93.6*** 9.7
By type of creditor Nonfinancial creditors 53 5.1 0.1 83.6 0.0 92.5*** 5.0 Financial creditors 110 4.7 1.1 75.7 0.0 94.2*** 8.5 By type of claim Derivatives 38 4.4 0.2 60.8 0.0 92.1*** 5.5 Equity 5 1.0 0.4 3.0 0.1 100*** 26.4 Unsecured debt 80 5.0 0.9 83.6 0.0 93.8*** 6.4 Bonds and derivatives 40 5.3 1.0 75.7 0.0 93.9*** 4.2
Panel A: Exposures to Lehman Brothers Holding Inc. (in $ millions)
Table IX
60
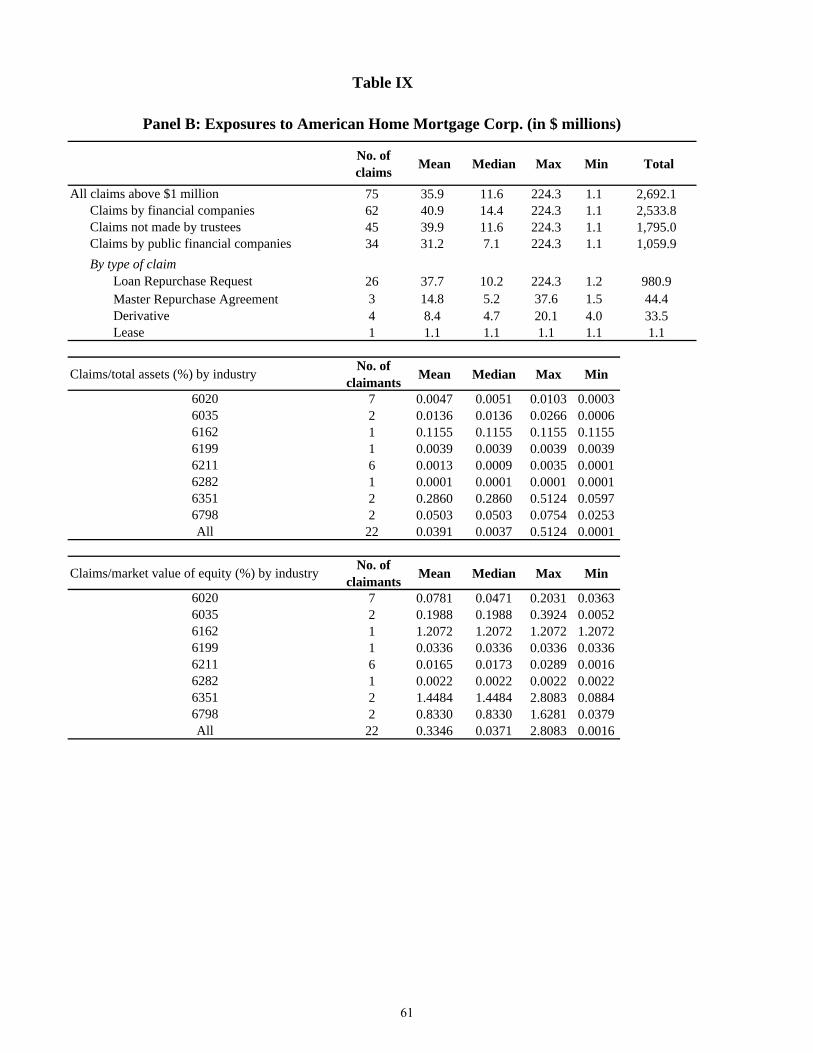
No. of claims
Mean Median Max Min Total
All claims above $1 million 75 35.9 11.6 224.3 1.1 2,692.1 Claims by financial companies 62 40.9 14.4 224.3 1.1 2,533.8 Claims not made by trustees 45 39.9 11.6 224.3 1.1 1,795.0 Claims by public financial companies 34 31.2 7.1 224.3 1.1 1,059.9
By type of claim Loan Repurchase Request 26 37.7 10.2 224.3 1.2 980.9 Master Repurchase Agreement 3 14.8 5.2 37.6 1.5 44.4 Derivative 4 8.4 4.7 20.1 4.0 33.5 Lease 1 1.1 1.1 1.1 1.1 1.1
Claims/total assets (%) by industryNo. of
claimantsMean Median Max Min
6020 7 0.0047 0.0051 0.0103 0.00036035 2 0.0136 0.0136 0.0266 0.00066162 1 0.1155 0.1155 0.1155 0.11556199 1 0.0039 0.0039 0.0039 0.00396211 6 0.0013 0.0009 0.0035 0.00016282 1 0.0001 0.0001 0.0001 0.00016351 2 0.2860 0.2860 0.5124 0.05976798 2 0.0503 0.0503 0.0754 0.0253All 22 0.0391 0.0037 0.5124 0.0001
Claims/market value of equity (%) by industryNo. of
claimantsMean Median Max Min
6020 7 0.0781 0.0471 0.2031 0.03636035 2 0.1988 0.1988 0.3924 0.00526162 1 1.2072 1.2072 1.2072 1.20726199 1 0.0336 0.0336 0.0336 0.03366211 6 0.0165 0.0173 0.0289 0.00166282 1 0.0022 0.0022 0.0022 0.00226351 2 1.4484 1.4484 2.8083 0.08846798 2 0.8330 0.8330 1.6281 0.0379All 22 0.3346 0.0371 2.8083 0.0016
Panel B: Exposures to American Home Mortgage Corp. (in $ millions)
Table IX
61
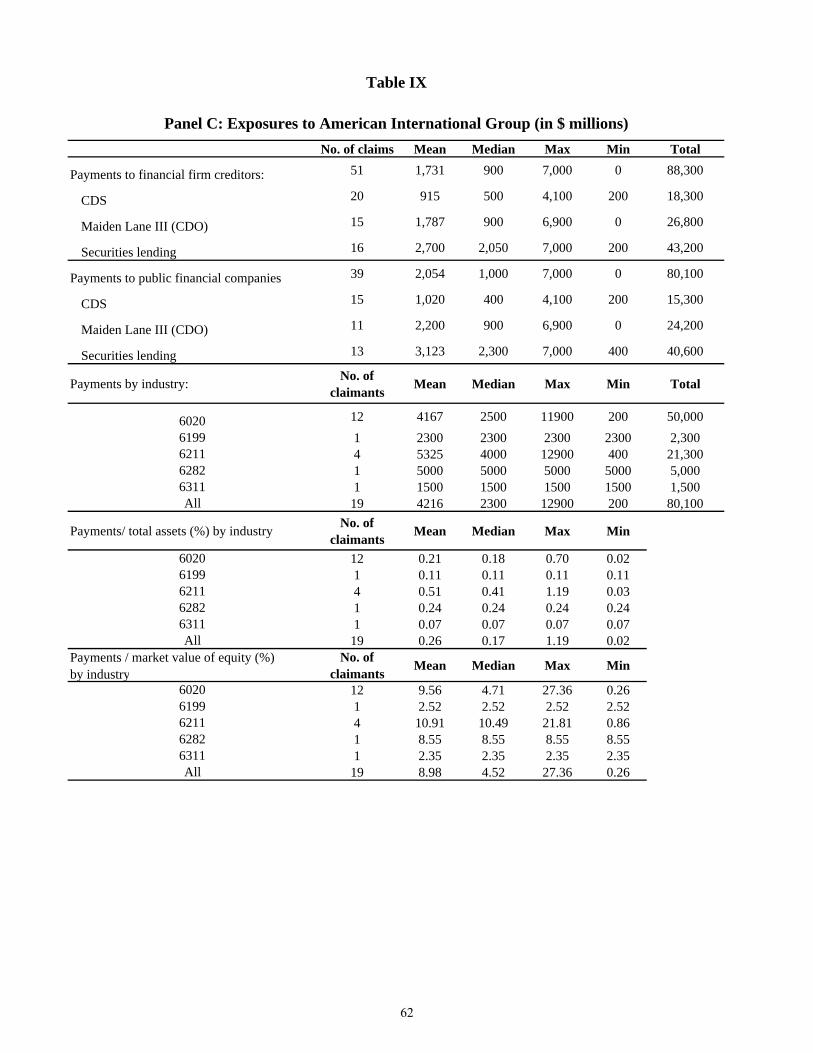
No. of claims Mean Median Max Min Total
Payments to financial firm creditors: 51 1,731 900 7,000 0 88,300
CDS 20 915 500 4,100 200 18,300
Maiden Lane III (CDO) 15 1,787 900 6,900 0 26,800
Securities lending 16 2,700 2,050 7,000 200 43,200
Payments to public financial companies 39 2,054 1,000 7,000 0 80,100
CDS 15 1,020 400 4,100 200 15,300
Maiden Lane III (CDO) 11 2,200 900 6,900 0 24,200
Securities lending 13 3,123 2,300 7,000 400 40,600
Payments by industry:No. of
claimantsMean Median Max Min Total
6020 12 4167 2500 11900 200 50,000
6199 1 2300 2300 2300 2300 2,300 6211 4 5325 4000 12900 400 21,300 6282 1 5000 5000 5000 5000 5,000 6311 1 1500 1500 1500 1500 1,500 All 19 4216 2300 12900 200 80,100
Payments/ total assets (%) by industryNo. of
claimantsMean Median Max Min
6020 12 0.21 0.18 0.70 0.026199 1 0.11 0.11 0.11 0.116211 4 0.51 0.41 1.19 0.036282 1 0.24 0.24 0.24 0.246311 1 0.07 0.07 0.07 0.07All 19 0.26 0.17 1.19 0.02
Payments / market value of equity (%) by industry
No. of claimants
Mean Median Max Min
6020 12 9.56 4.71 27.36 0.266199 1 2.52 2.52 2.52 2.526211 4 10.91 10.49 21.81 0.866282 1 8.55 8.55 8.55 8.556311 1 2.35 2.35 2.35 2.35All 19 8.98 4.52 27.36 0.26
Panel C: Exposures to American International Group (in $ millions)
Table IX
62
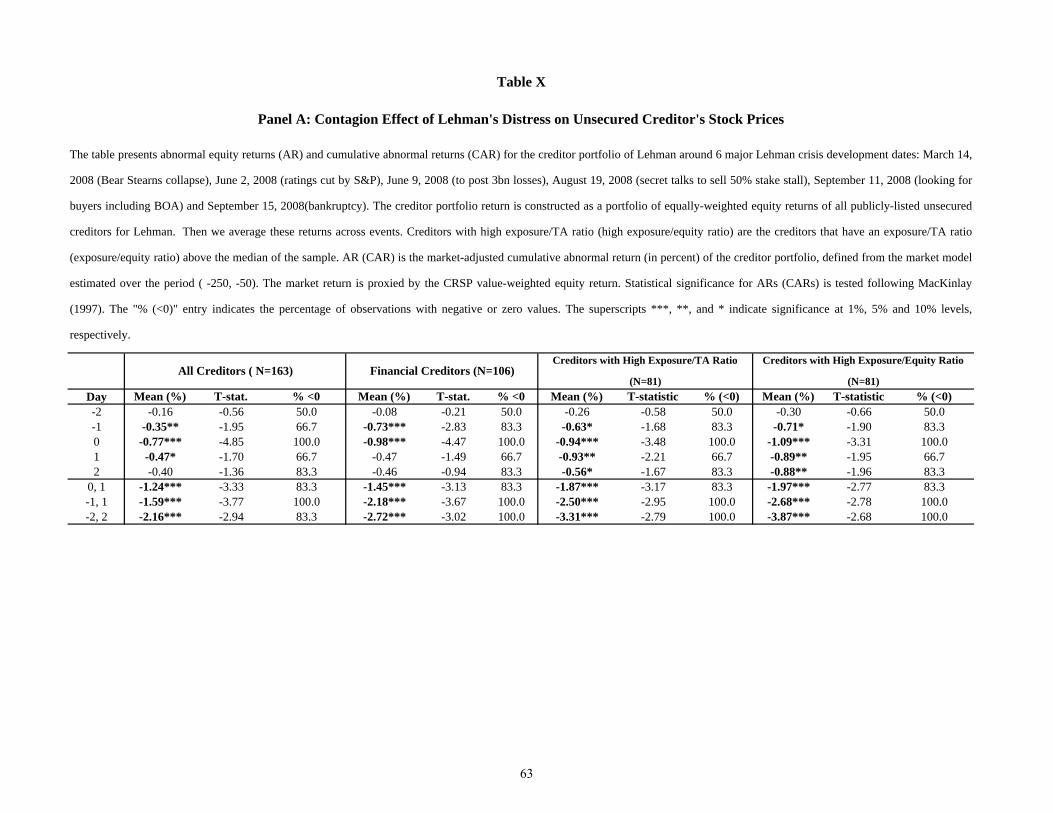
Day Mean (%) T-stat. % <0 Mean (%) T-stat. % <0 Mean (%) T-statistic % (<0) Mean (%) T-statistic % (<0)-2 -0.16 -0.56 50.0 -0.08 -0.21 50.0 -0.26 -0.58 50.0 -0.30 -0.66 50.0-1 -0.35** -1.95 66.7 -0.73*** -2.83 83.3 -0.63* -1.68 83.3 -0.71* -1.90 83.30 -0.77*** -4.85 100.0 -0.98*** -4.47 100.0 -0.94*** -3.48 100.0 -1.09*** -3.31 100.01 -0.47* -1.70 66.7 -0.47 -1.49 66.7 -0.93** -2.21 66.7 -0.89** -1.95 66.72 -0.40 -1.36 83.3 -0.46 -0.94 83.3 -0.56* -1.67 83.3 -0.88** -1.96 83.3
0, 1 -1.24*** -3.33 83.3 -1.45*** -3.13 83.3 -1.87*** -3.17 83.3 -1.97*** -2.77 83.3-1, 1 -1.59*** -3.77 100.0 -2.18*** -3.67 100.0 -2.50*** -2.95 100.0 -2.68*** -2.78 100.0-2, 2 -2.16*** -2.94 83.3 -2.72*** -3.02 100.0 -3.31*** -2.79 100.0 -3.87*** -2.68 100.0
Table X
Creditors with High Exposure/Equity Ratio
(N=81)
The table presents abnormal equity returns (AR) and cumulative abnormal returns (CAR) for the creditor portfolio of Lehman around 6 major Lehman crisis development dates: March 14,
2008 (Bear Stearns collapse), June 2, 2008 (ratings cut by S&P), June 9, 2008 (to post 3bn losses), August 19, 2008 (secret talks to sell 50% stake stall), September 11, 2008 (looking for
buyers including BOA) and September 15, 2008(bankruptcy). The creditor portfolio return is constructed as a portfolio of equally-weighted equity returns of all publicly-listed unsecured
creditors for Lehman. Then we average these returns across events. Creditors with high exposure/TA ratio (high exposure/equity ratio) are the creditors that have an exposure/TA ratio
(exposure/equity ratio) above the median of the sample. AR (CAR) is the market-adjusted cumulative abnormal return (in percent) of the creditor portfolio, defined from the market model
estimated over the period ( -250, -50). The market return is proxied by the CRSP value-weighted equity return. Statistical significance for ARs (CARs) is tested following MacKinlay
(1997). The "% (<0)" entry indicates the percentage of observations with negative or zero values. The superscripts ***, **, and * indicate significance at 1%, 5% and 10% levels,
respectively.
Panel A: Contagion Effect of Lehman's Distress on Unsecured Creditor's Stock Prices
All Creditors ( N=163) Financial Creditors (N=106)Creditors with High Exposure/TA Ratio
(N=81)
63
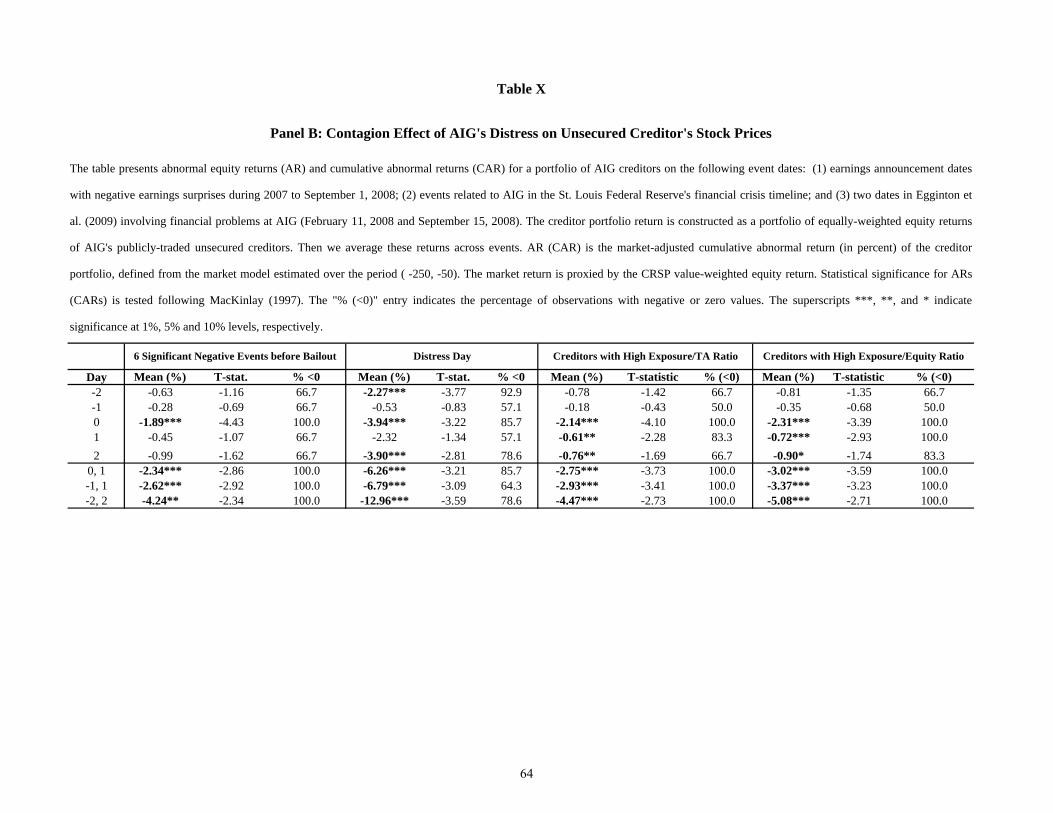
Day Mean (%) T-stat. % <0 Mean (%) T-stat. % <0 Mean (%) T-statistic % (<0) Mean (%) T-statistic % (<0)-2 -0.63 -1.16 66.7 -2.27*** -3.77 92.9 -0.78 -1.42 66.7 -0.81 -1.35 66.7-1 -0.28 -0.69 66.7 -0.53 -0.83 57.1 -0.18 -0.43 50.0 -0.35 -0.68 50.00 -1.89*** -4.43 100.0 -3.94*** -3.22 85.7 -2.14*** -4.10 100.0 -2.31*** -3.39 100.01 -0.45 -1.07 66.7 -2.32 -1.34 57.1 -0.61** -2.28 83.3 -0.72*** -2.93 100.0
2 -0.99 -1.62 66.7 -3.90*** -2.81 78.6 -0.76** -1.69 66.7 -0.90* -1.74 83.30, 1 -2.34*** -2.86 100.0 -6.26*** -3.21 85.7 -2.75*** -3.73 100.0 -3.02*** -3.59 100.0-1, 1 -2.62*** -2.92 100.0 -6.79*** -3.09 64.3 -2.93*** -3.41 100.0 -3.37*** -3.23 100.0-2, 2 -4.24** -2.34 100.0 -12.96*** -3.59 78.6 -4.47*** -2.73 100.0 -5.08*** -2.71 100.0
Table X
Panel B: Contagion Effect of AIG's Distress on Unsecured Creditor's Stock Prices
6 Significant Negative Events before Bailout Distress Day Creditors with High Exposure/TA Ratio Creditors with High Exposure/Equity Ratio
The table presents abnormal equity returns (AR) and cumulative abnormal returns (CAR) for a portfolio of AIG creditors on the following event dates: (1) earnings announcement dates
with negative earnings surprises during 2007 to September 1, 2008; (2) events related to AIG in the St. Louis Federal Reserve's financial crisis timeline; and (3) two dates in Egginton et
al. (2009) involving financial problems at AIG (February 11, 2008 and September 15, 2008). The creditor portfolio return is constructed as a portfolio of equally-weighted equity returns
of AIG's publicly-traded unsecured creditors. Then we average these returns across events. AR (CAR) is the market-adjusted cumulative abnormal return (in percent) of the creditor
portfolio, defined from the market model estimated over the period ( -250, -50). The market return is proxied by the CRSP value-weighted equity return. Statistical significance for ARs
(CARs) is tested following MacKinlay (1997). The "% (<0)" entry indicates the percentage of observations with negative or zero values. The superscripts ***, **, and * indicate
significance at 1%, 5% and 10% levels, respectively.
64