Embed Size (px)
Citation preview
Financial Highlights and Strategic OpportunitiesRick Carucci
CFO, YUM! Brands Inc.
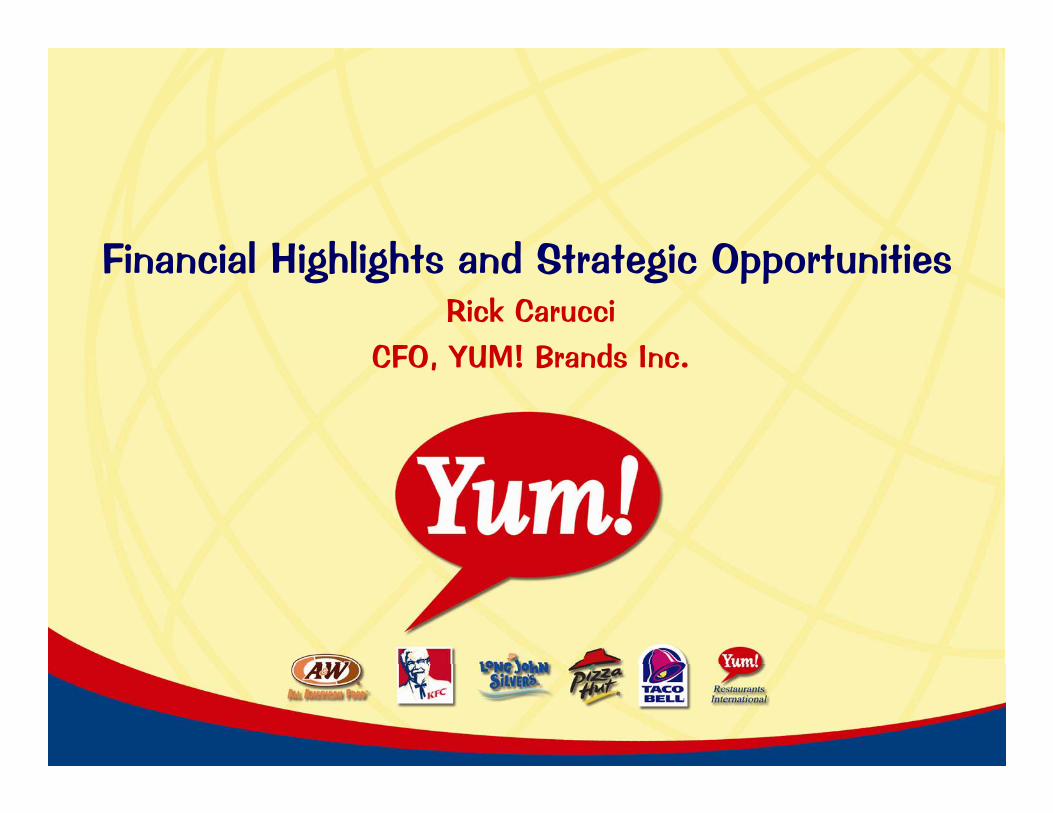
This announcement contains forward-looking statements within the meaning of Section 27A of the Securities Act of 1933, as amended, and Section 21E of the Securities Exchange Act of 1934, as amended. These statements include those identified by such words as may, will, expect, project, anticipate, believe, plan and other similar terminology. These “forward-looking”statements reflect management’s current expectations regarding future events and operating andfinancial performance and are based on currently available data. However, actual results are subject to future events and uncertainties, which could cause actual results to differ from those projected in this announcement. Factors that can cause actual results to differ materially include changes in global and local business, economic and political conditions in the countries and territories where Yum! Brands operates, including the effects of war and terrorist activities; changes in currency exchange and interest rates; changes in commodity, labor and other operating costs; changes in competition in the food industry, consumer preferences, spending patterns and demographic trends; the impact that any widespread illness or general health concern may have on our business and the economy of the countries in which we operate; the effectiveness of our operating initiatives and advertising and promotional efforts; new-product and concept development by Yum! Brands and other food-industry competitors; the success of our refranchising strategy; the ongoing business viability of our franchise and license operators; our ability to secure alternative distribution to our restaurants at competitive rates and to ensure adequate supplies of restaurant products and equipment in our stores; publicity that may impact our business and/or industry; severe weather conditions; effects and outcomes of legal claims involving the company; changes in effective tax rates; our actuarially determined casualty loss estimates; changes in legislation and governmental regulations; and changes in accounting policies and practices. Further information about factors that could affect Yum! Brands’ financial and other results are included in the company’s Forms 10-Q and 10-K, filed with the Securities and Exchange Commission.
Information herein is as of 4/21/05
3
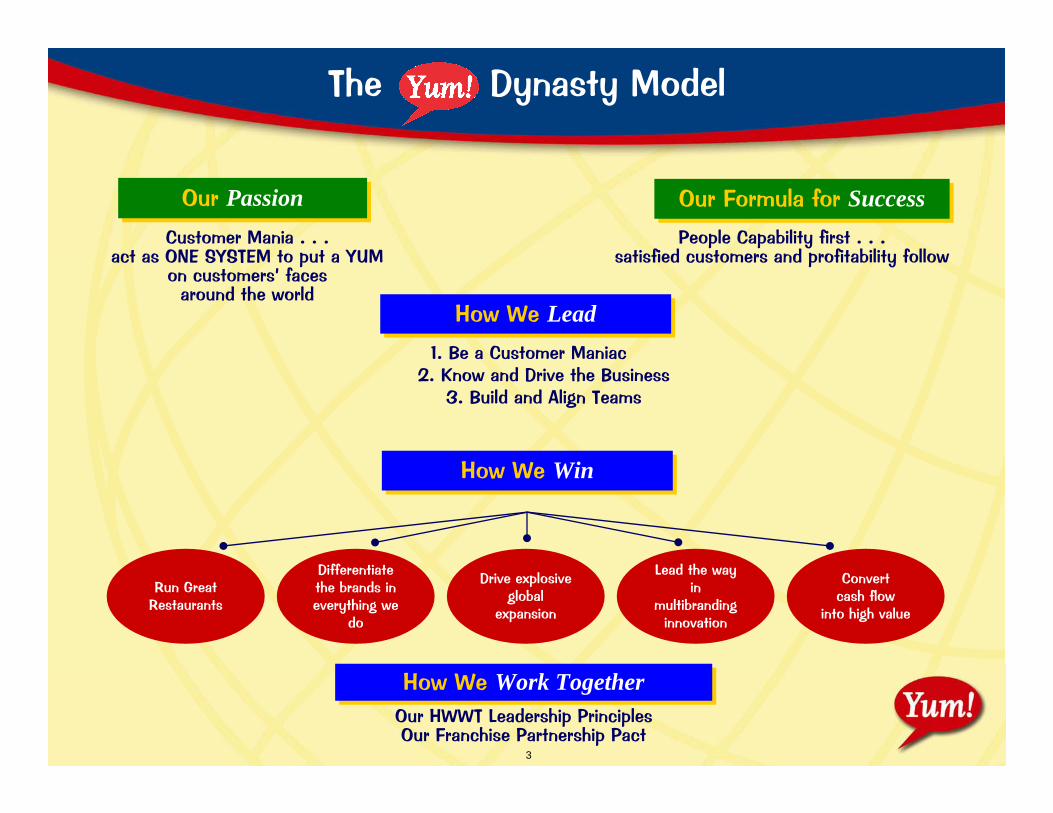
People Capability first . . .satisfied customers and profitability follow
Our PassionOur PassionCustomer Mania . . .
act as ONE SYSTEM to put a YUM on customers’ faces
around the world
How We WinHow We Win
How We Work TogetherHow We Work TogetherOur HWWT Leadership PrinciplesOur Franchise Partnership Pact
How We LeadHow We Lead1. Be a Customer Maniac
2. Know and Drive the Business3. Build and Align Teams
The Dynasty Model
Run Great Restaurants
Drive explosive global
expansion
Lead the wayin
multibrandinginnovation
Convert cash flow
into high value
Differentiatethe brands in everything we
do
Our Formula for SuccessOur Formula for Success
4
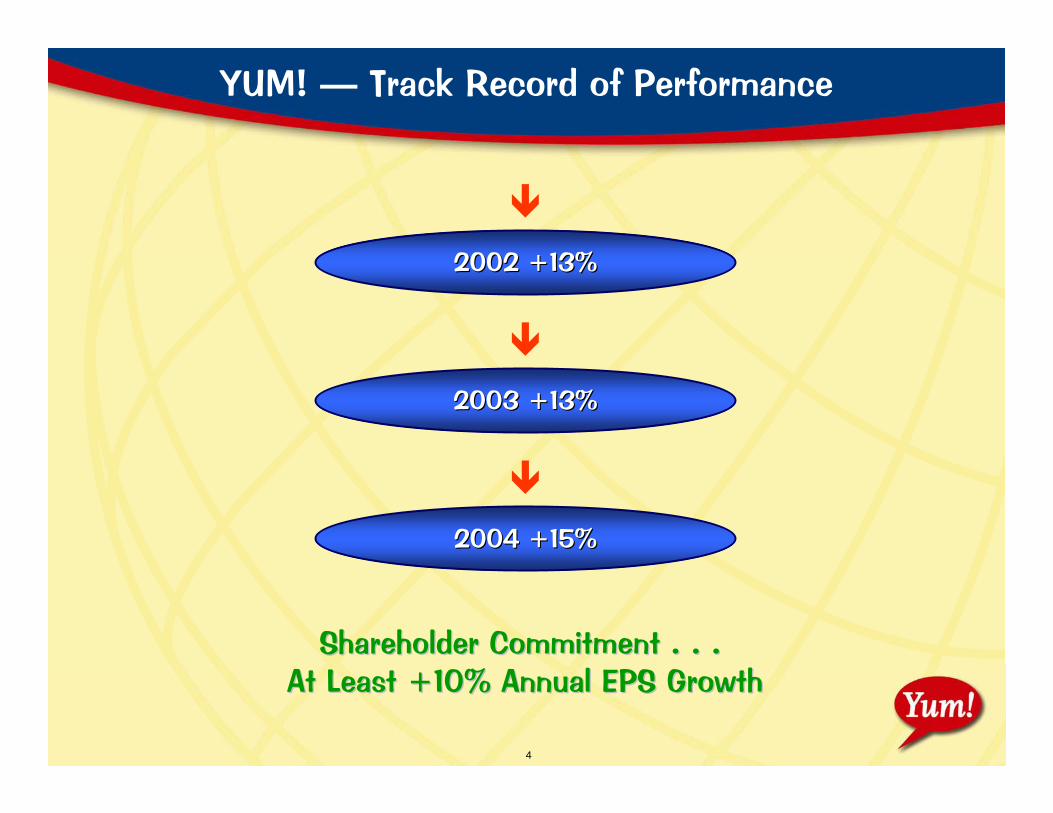
YUM! — Track Record of Performance
2002 +13%2002 +13%
2003 +13%2003 +13%
2004 +15%2004 +15%
Shareholder Commitment . . . Shareholder Commitment . . . At Least +10% Annual EPS GrowthAt Least +10% Annual EPS Growth
5
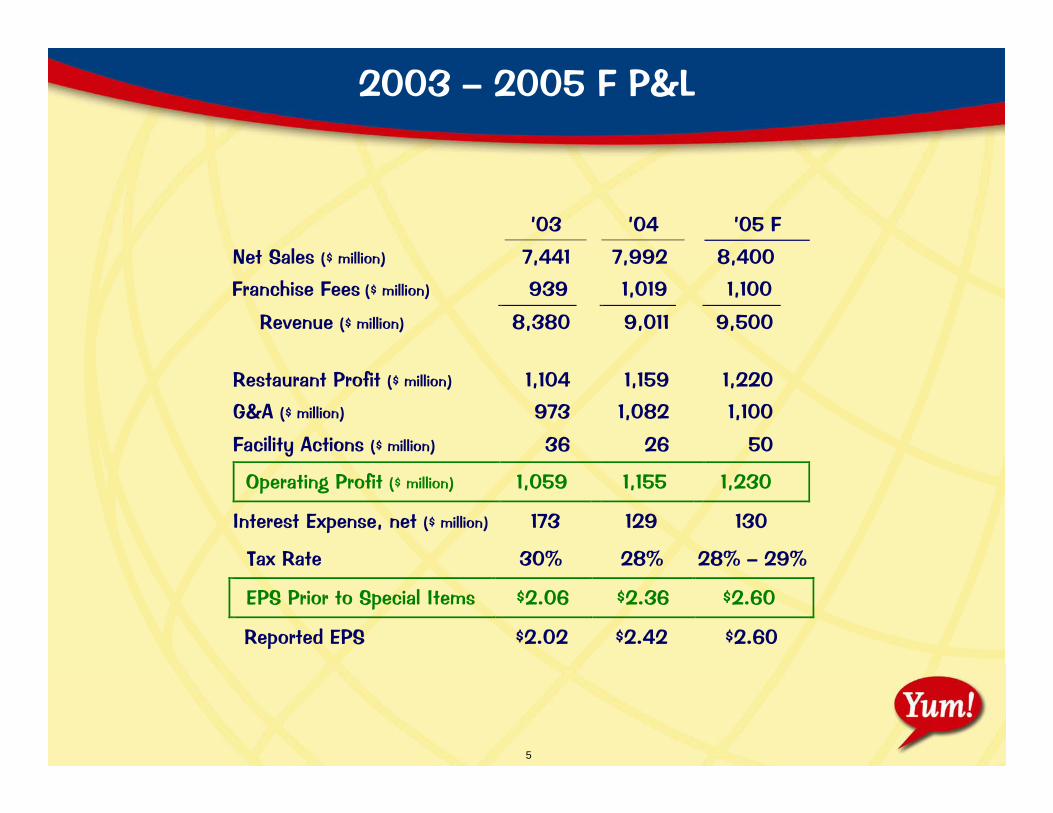
’03 ’04 ’05 F
Net Sales ($ million) 7,441 7,992 8,400
Franchise Fees ($ million) 939 1,019 1,100
Revenue ($ million) 8,380 9,011 9,500 Restaurant Profit ($ million) 1,104 1,159 1,220
G&A ($ million) 973 1,082 1,100
Facility Actions ($ million) 36 26 50
Operating Profit ($ million) 1,059 1,155 1,230
Interest Expense, net ($ million) 173 129 130
Tax Rate 30% 28% 28% – 29%
EPS Prior to Special Items $2.06 $2.36 $2.60
Reported EPS $2.02 $2.42 $2.60
2003 – 2005 F P&L
6
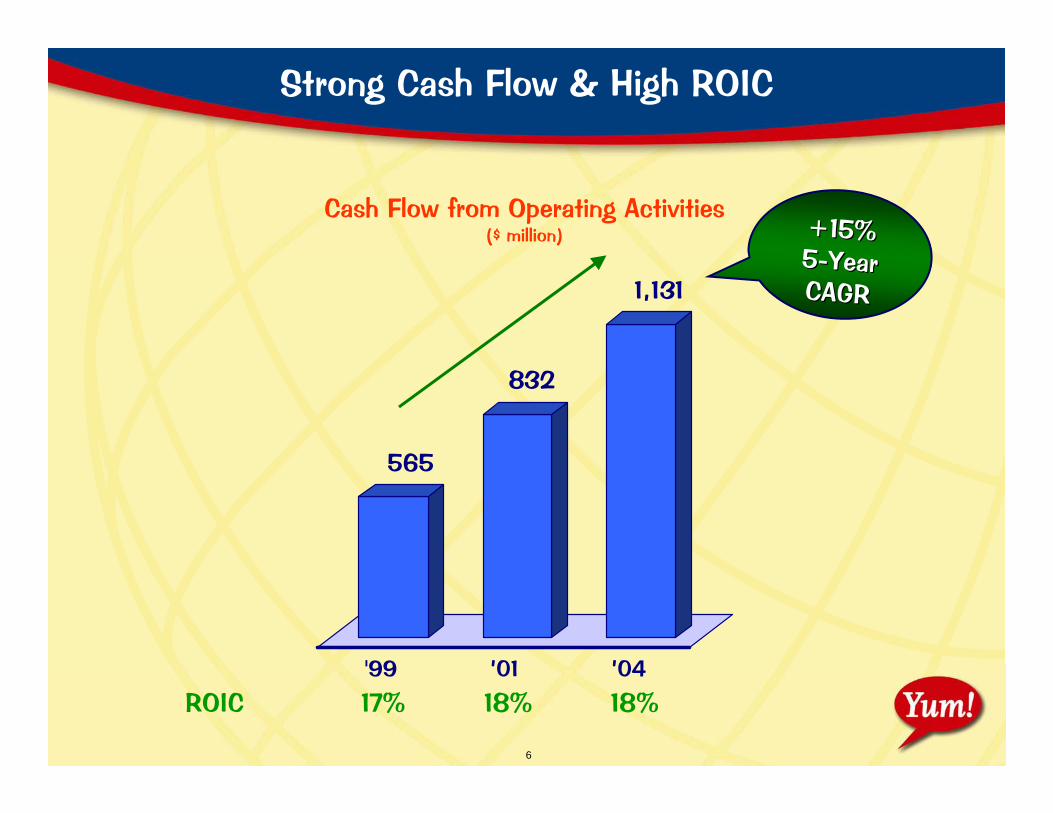
Strong Cash Flow & High ROIC
565
832
1,131
'99 ’01 ’04
Cash Flow from Operating Activities($ million)
ROIC 17% 18% 18%
+15% +15% 55--YearYearCAGRCAGR
7
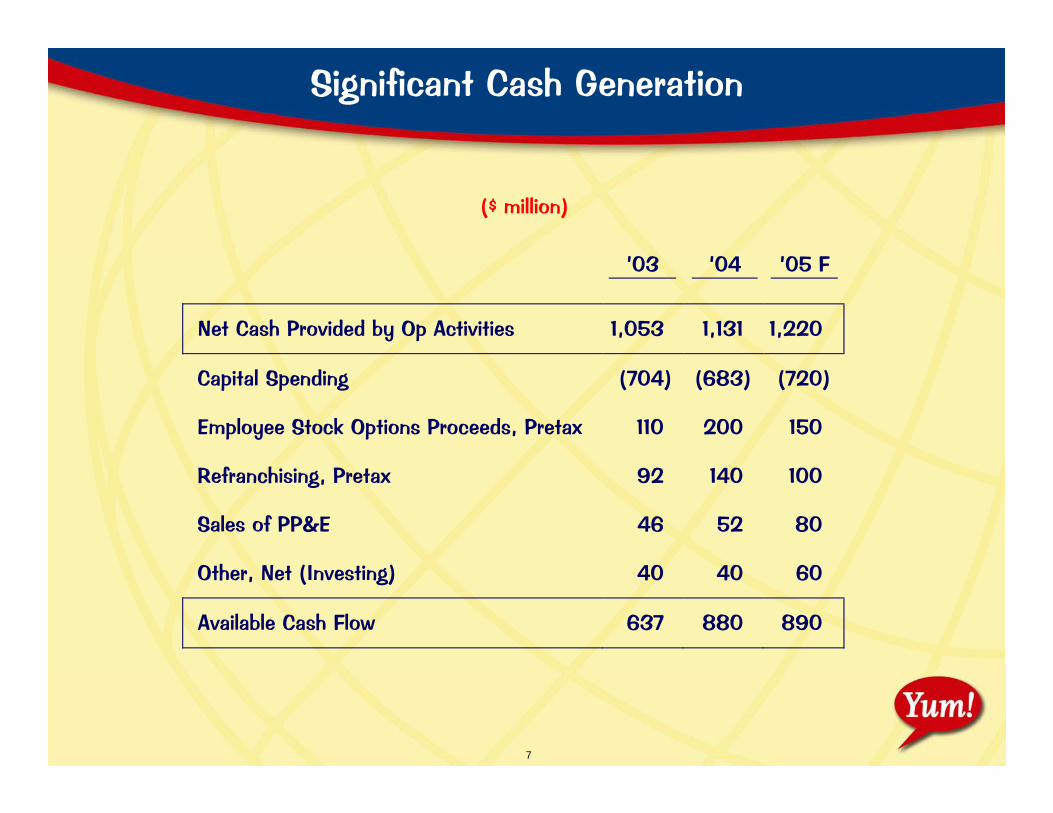
Significant Cash Generation
’03 ’04
’05 F
Net Cash Provided by Op Activities 1,053 1,131 1,220
Capital Spending (704) (683) (720)
Employee Stock Options Proceeds, Pretax 110 200 150
Refranchising, Pretax 92 140 100
Sales of PP&E 46 52 80
Other, Net (Investing) 40 40 60
Available Cash Flow 637 880 890
($ million)
8
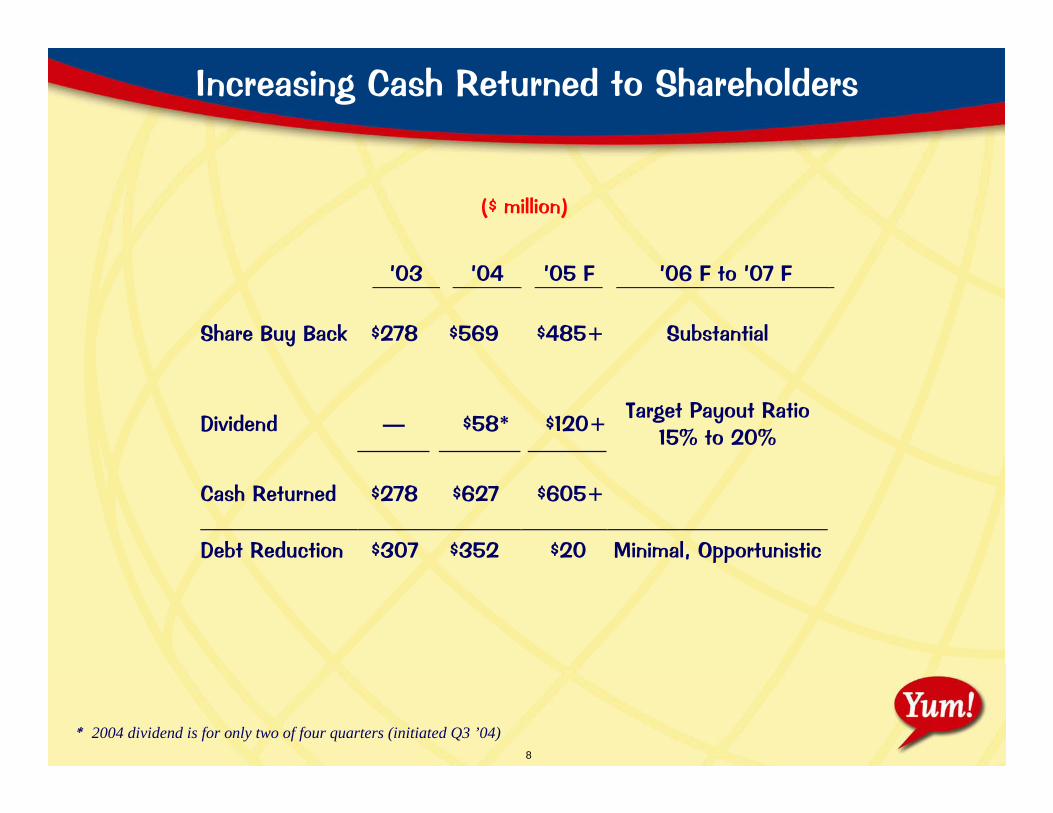
Increasing Cash Returned to Shareholders
’03 ’04 ’05 F ’06 F to ’07 F Share Buy Back $278 $569 $485+ Substantial
Dividend — $58* $120+ Target Payout Ratio 15% to 20%
Cash Returned $278 $627 $605+
Debt Reduction $307 $352 $20 Minimal, Opportunistic
* 2004 dividend is for only two of four quarters (initiated Q3 ’04)
($ million)
9
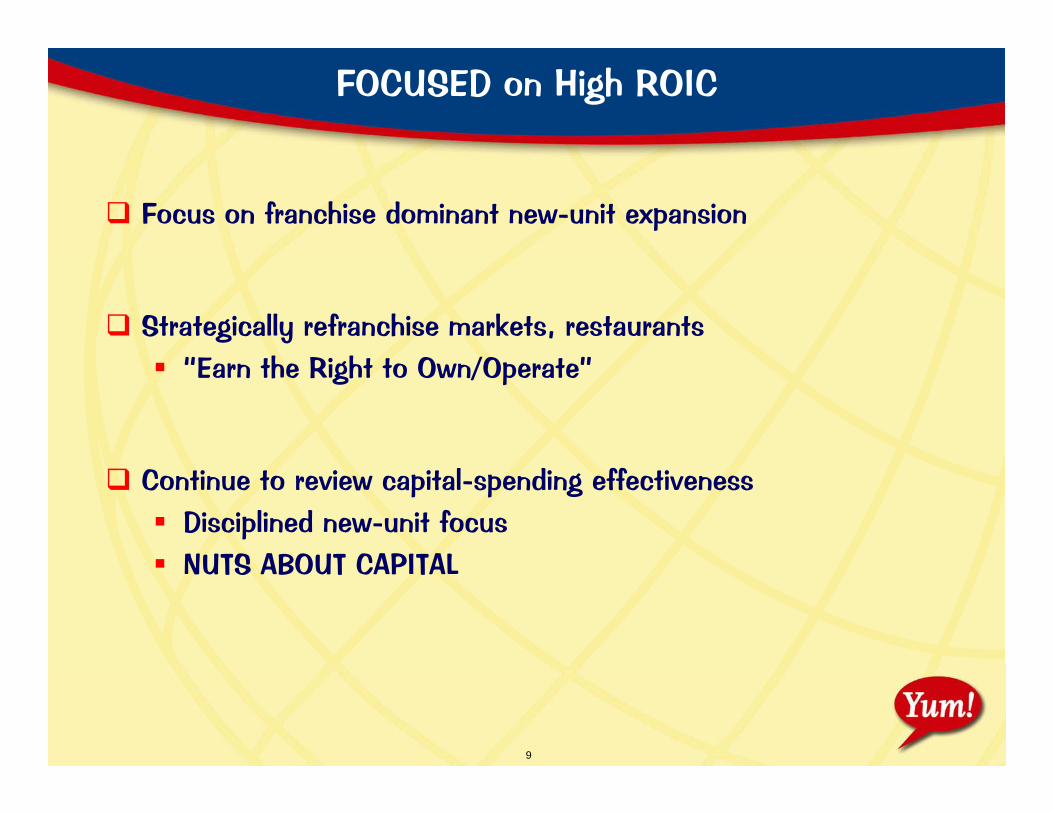
FOCUSED on High ROIC
Focus on franchise dominant new-unit expansion
Strategically refranchise markets, restaurants“Earn the Right to Own/Operate”
Continue to review capital-spending effectivenessDisciplined new-unit focusNUTS ABOUT CAPITAL
10
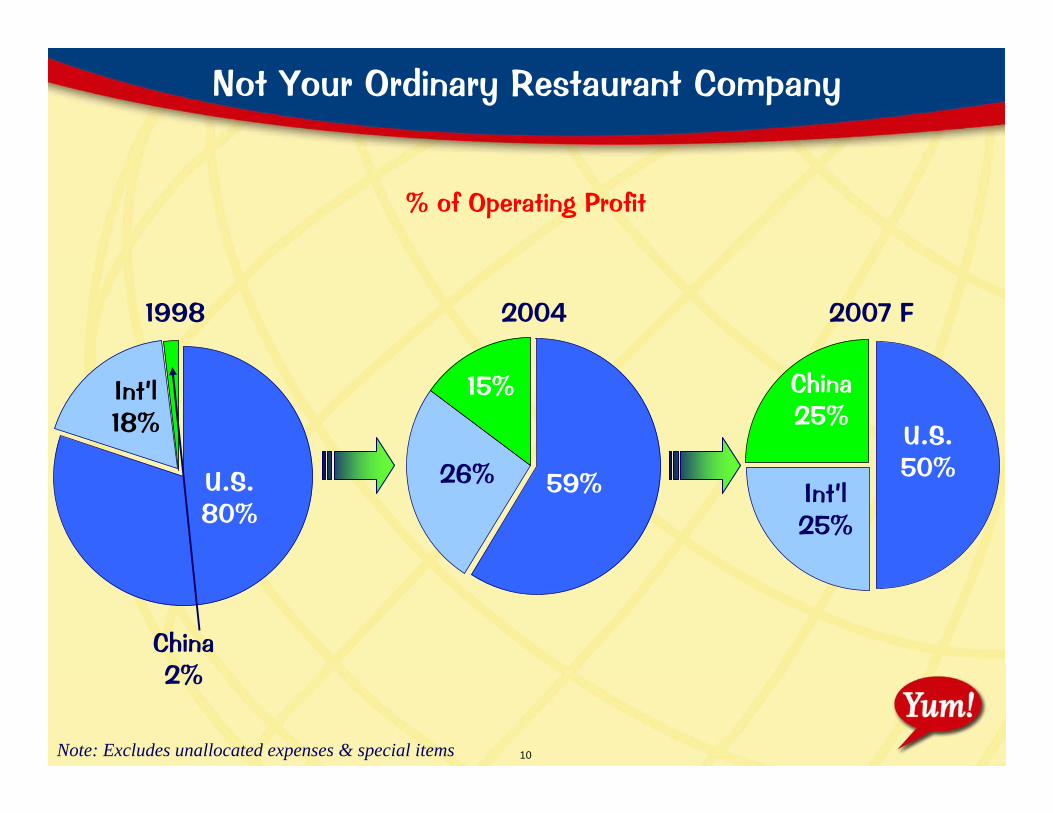
Not Your Ordinary Restaurant Company
1998 2004
Int’l18%
U.S.80%
26% 59%
% of Operating Profit
2007 F
Int’l25%
U.S.50%
China2%
15% China25%
Note: Excludes unallocated expenses & special items
11
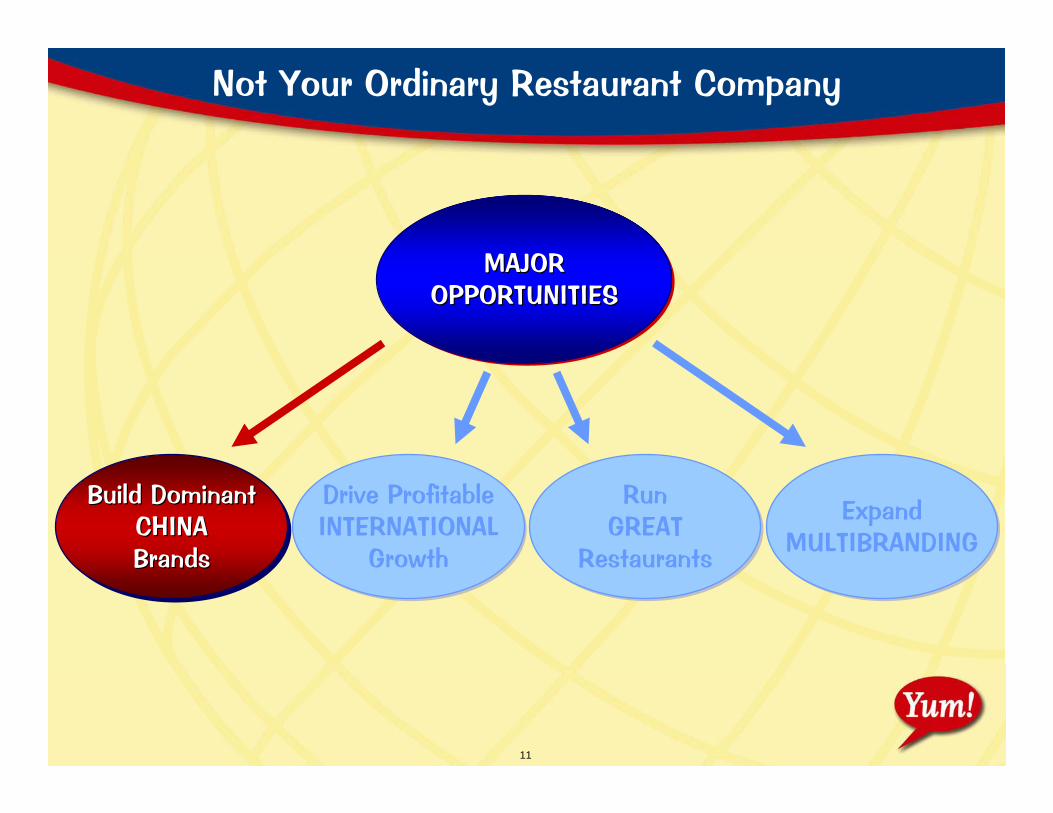
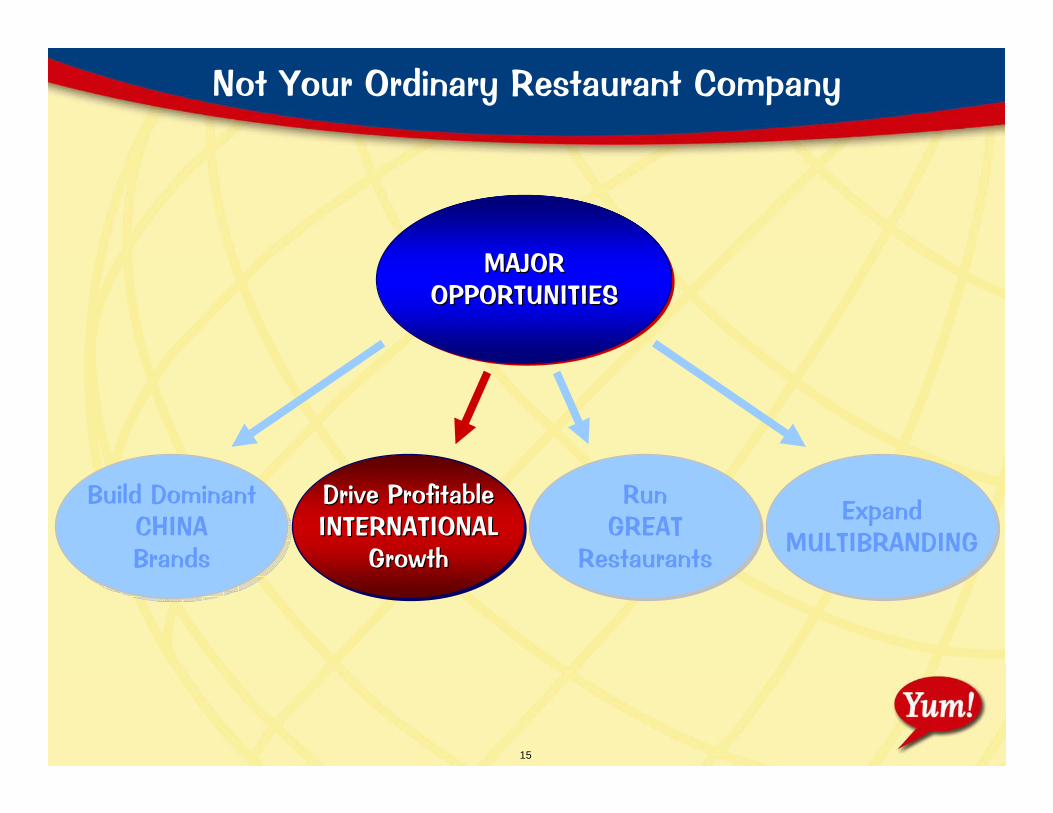
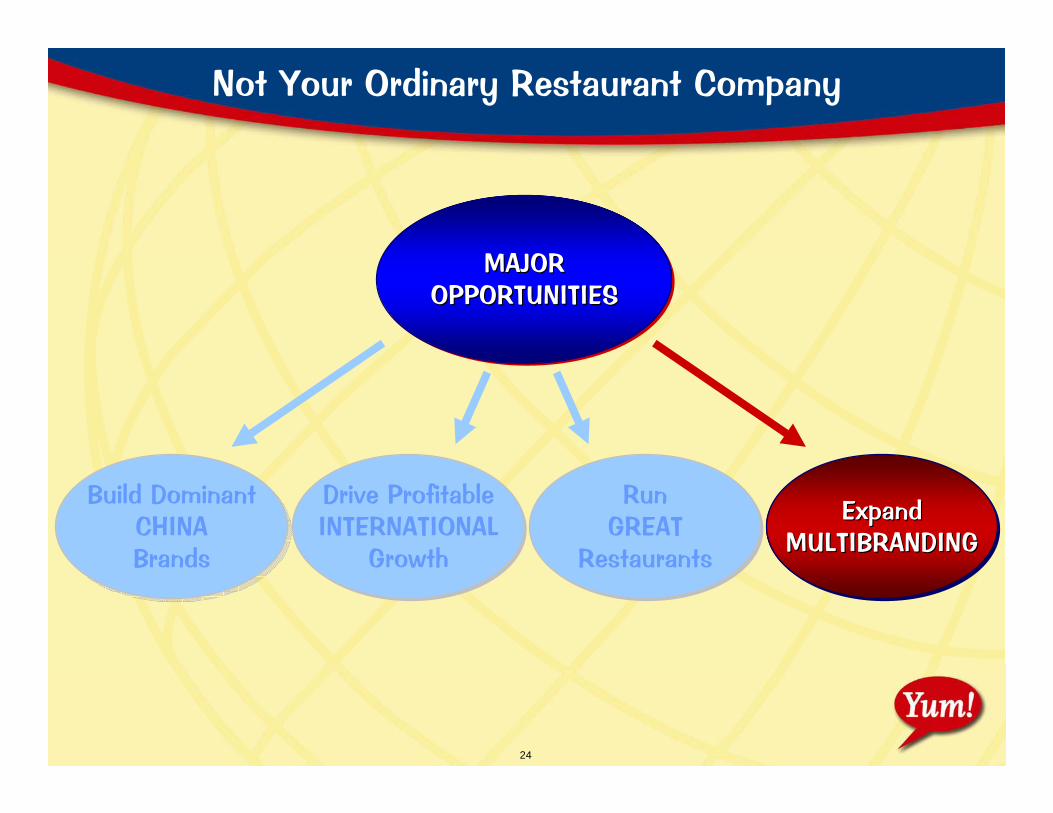
Not Your Ordinary Restaurant Company
ExpandMULTIBRANDING
ExpandMULTIBRANDING
RunGREAT
Restaurants
RunGREAT
Restaurants
Drive ProfitableINTERNATIONAL
Growth
Drive ProfitableINTERNATIONAL
Growth
Build DominantCHINABrands
Build DominantBuild DominantCHINACHINABrandsBrands
MAJOROPPORTUNITIES
MAJORMAJOROPPORTUNITIESOPPORTUNITIES
12
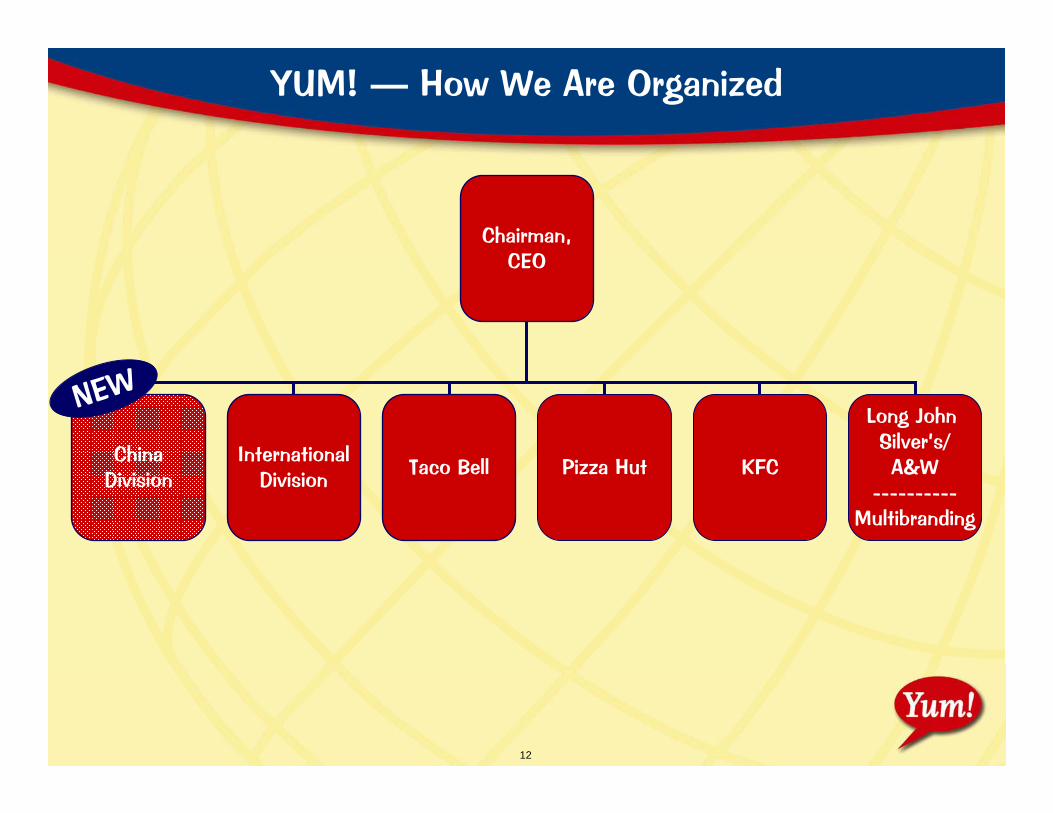
Chairman,CEO
ChinaDivision
InternationalDivision Taco Bell Pizza Hut KFC
Long John Silver’s/A&W
----------Multibranding
2004 F
YUM! — How We Are Organized
NEW
13
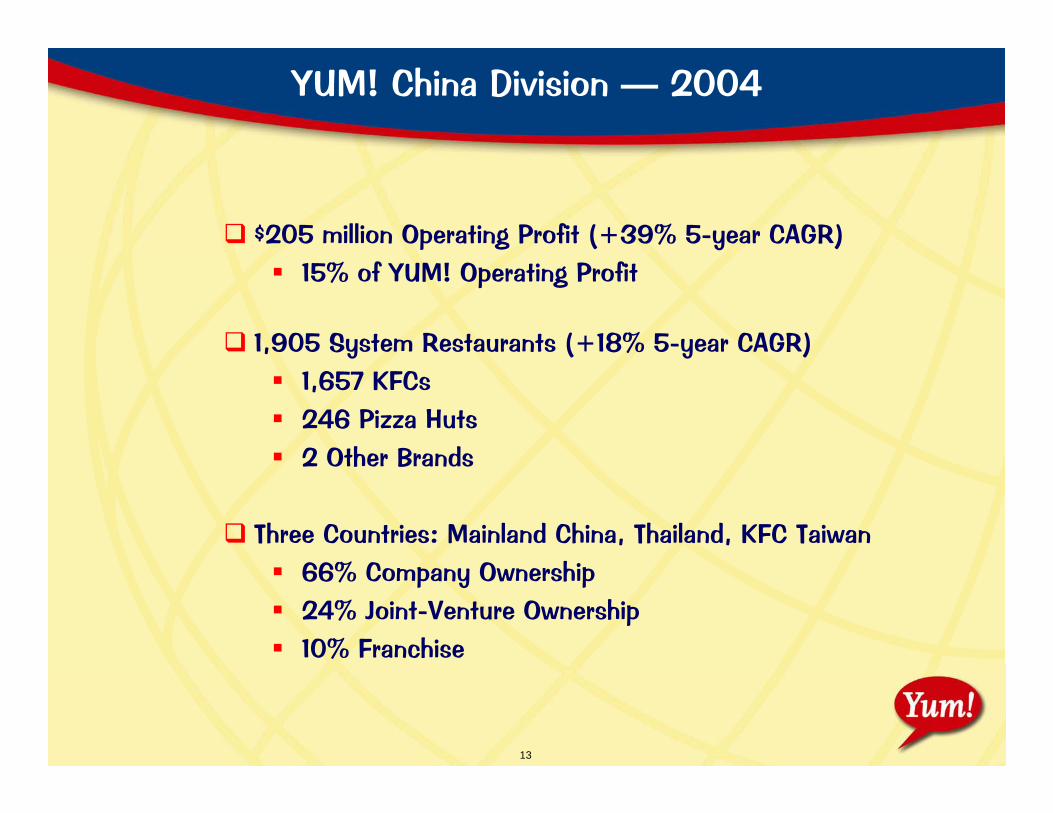
YUM! China Division — 2004
$205 million Operating Profit (+39% 5-year CAGR)15% of YUM! Operating Profit
1,905 System Restaurants (+18% 5-year CAGR)1,657 KFCs246 Pizza Huts2 Other Brands
Three Countries: Mainland China, Thailand, KFC Taiwan66% Company Ownership24% Joint-Venture Ownership10% Franchise
14
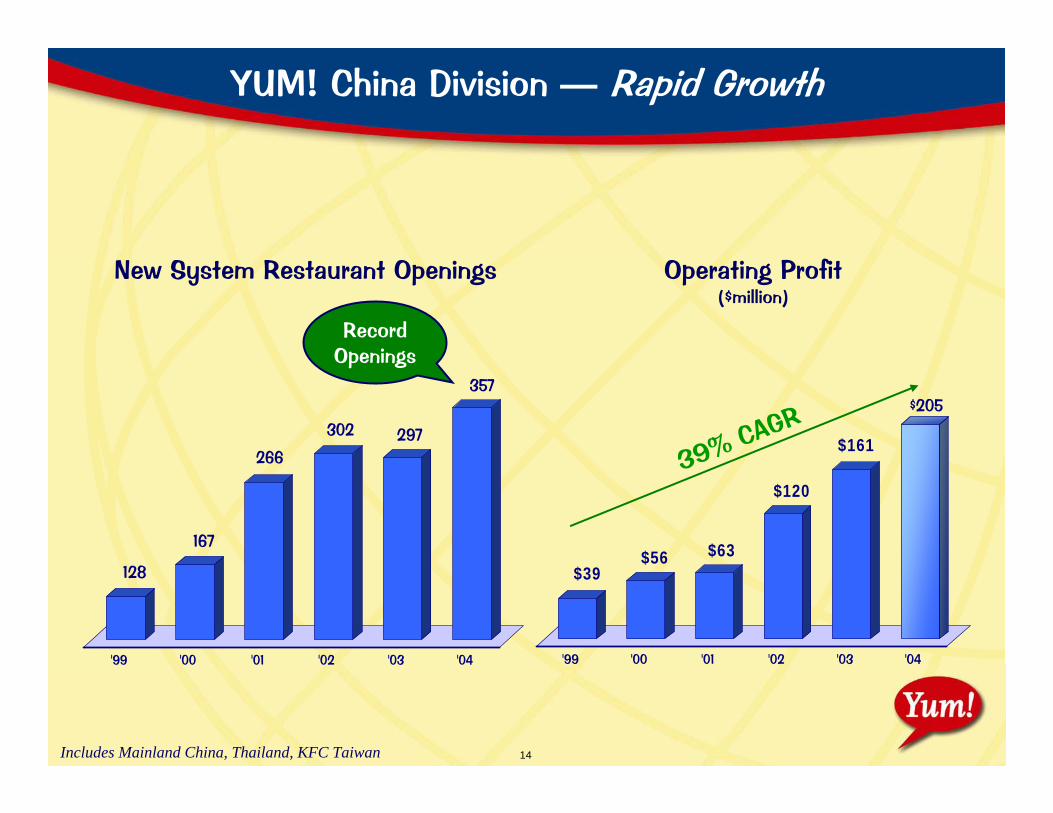
YUM! China Division — Rapid Growth
New System Restaurant Openings Operating Profit($million)
$39$56 $63
$120
$161
$205
'99 '00 '01 '02 '03 '04
128
167
266
302 297
357
'99 '00 '01 '02 '03 '04
39% CAGR
Includes Mainland China, Thailand, KFC Taiwan
Record Openings
15
Not Your Ordinary Restaurant Company
ExpandMULTIBRANDING
ExpandMULTIBRANDING
RunGREAT
Restaurants
RunGREAT
Restaurants
Drive ProfitableINTERNATIONAL
Growth
Drive ProfitableDrive ProfitableINTERNATIONALINTERNATIONAL
GrowthGrowth
Build DominantCHINABrands
Build DominantCHINABrands
MAJOROPPORTUNITIES
MAJORMAJOROPPORTUNITIESOPPORTUNITIES
16
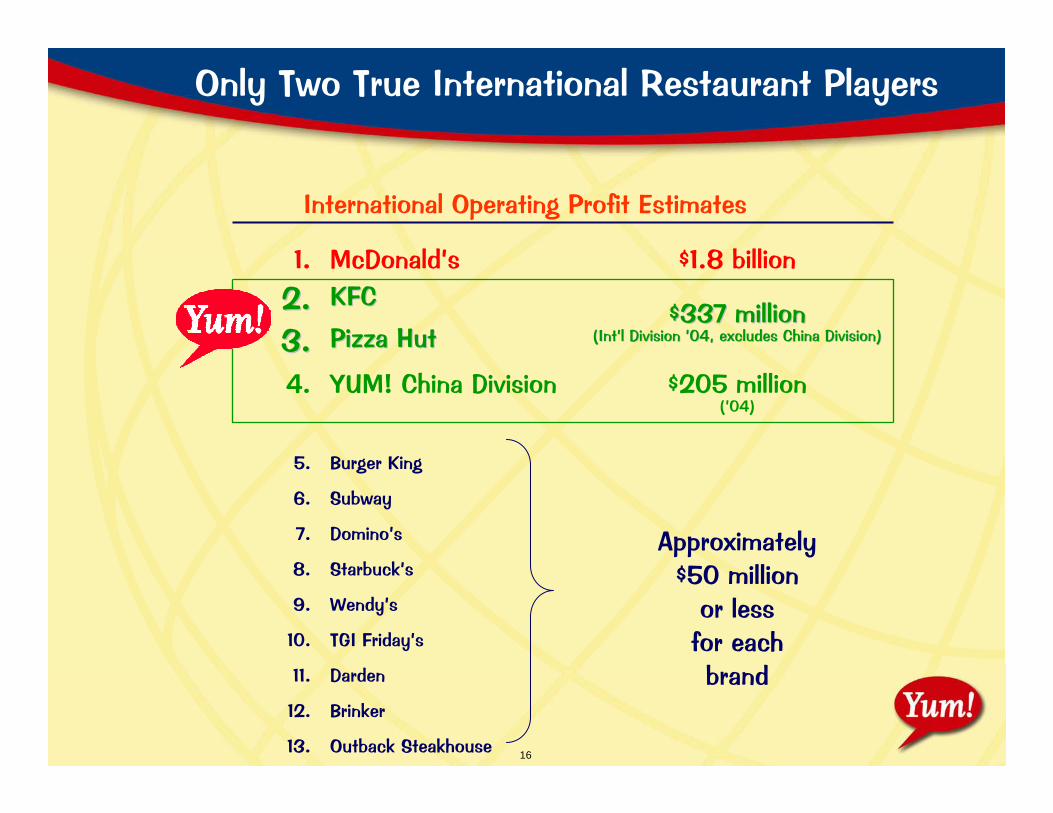
Only Two True International Restaurant Players
$205 million(’04)
YUM! China Division4.
Approximately$50 million
or lessfor each brand
Burger King5.
Outback Steakhouse13.
Brinker12.
Darden11.
TGI Friday’s10.
Wendy’s9.
Starbuck’s8.
Domino’s7.
Pizza HutPizza Hut3.3.
6.
2.2.1.
Subway
$337 million$337 million(Int(Int’’l Division l Division ’’04, excludes China Division)04, excludes China Division)
KFCKFC$1.8 billionMcDonald’s
International Operating Profit Estimates
17
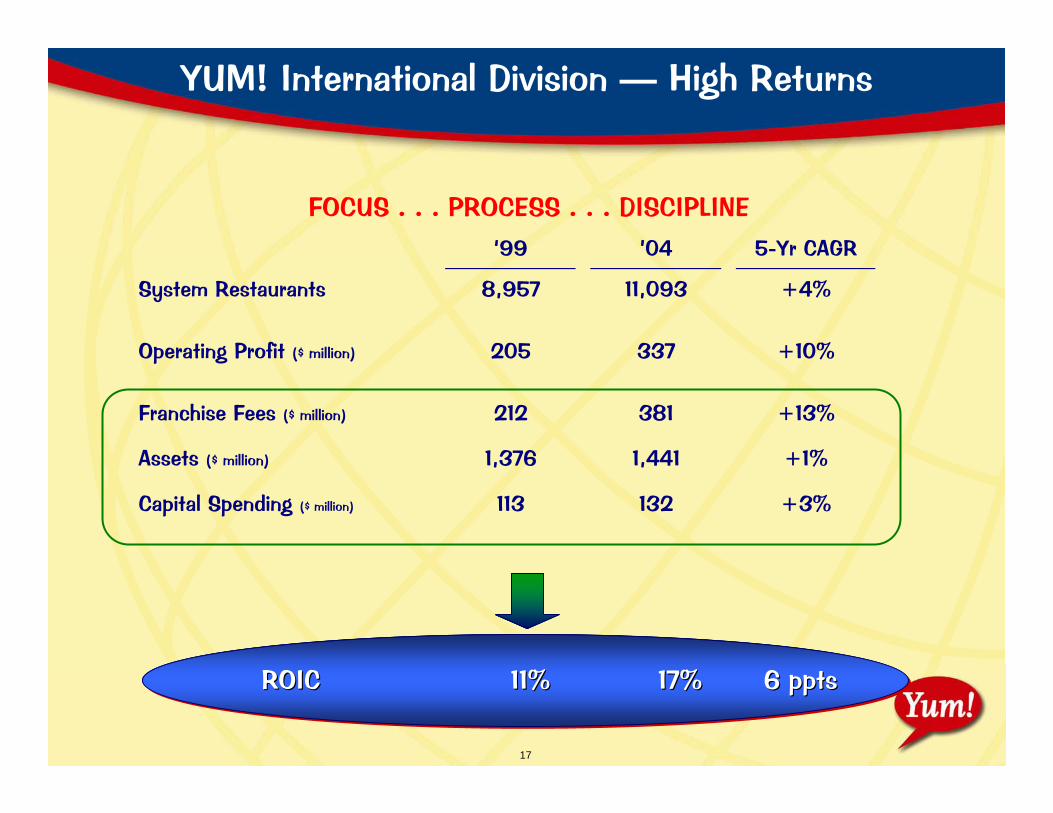
YUM! International Division — High Returns
‘99 ’04 5-Yr CAGR
System Restaurants 8,957 11,093 +4%
Operating Profit ($ million) 205 337 +10%
Franchise Fees ($ million) 212 381 +13%
Assets ($ million) 1,376 1,441 +1%
Capital Spending ($ million) 113 132 +3%
FOCUS . . . PROCESS . . . DISCIPLINE
ROIC 11% 17% 6 pptsROICROIC 11%11% 17%17% 6 6 pptsppts
18
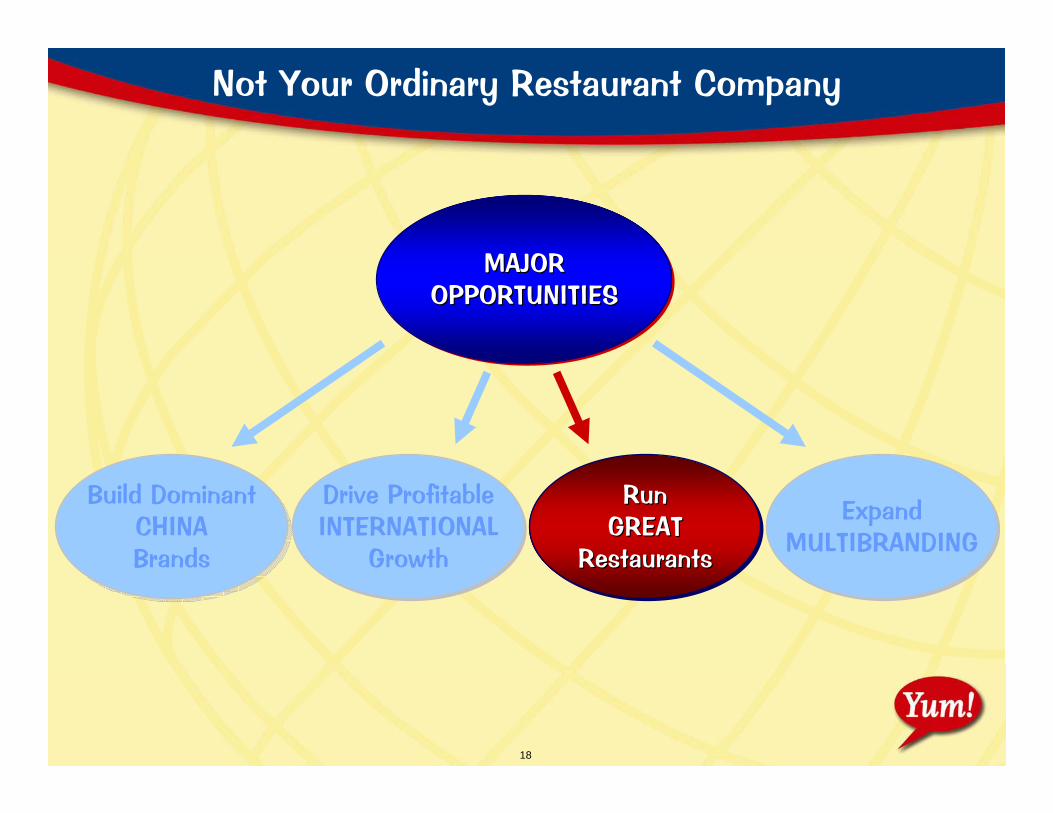
Not Your Ordinary Restaurant Company
ExpandMULTIBRANDING
ExpandMULTIBRANDING
RunGREAT
Restaurants
RunRunGREATGREAT
RestaurantsRestaurants
Drive ProfitableINTERNATIONAL
Growth
Drive ProfitableINTERNATIONAL
Growth
Build DominantCHINABrands
Build DominantCHINABrands
MAJOROPPORTUNITIES
MAJORMAJOROPPORTUNITIESOPPORTUNITIES
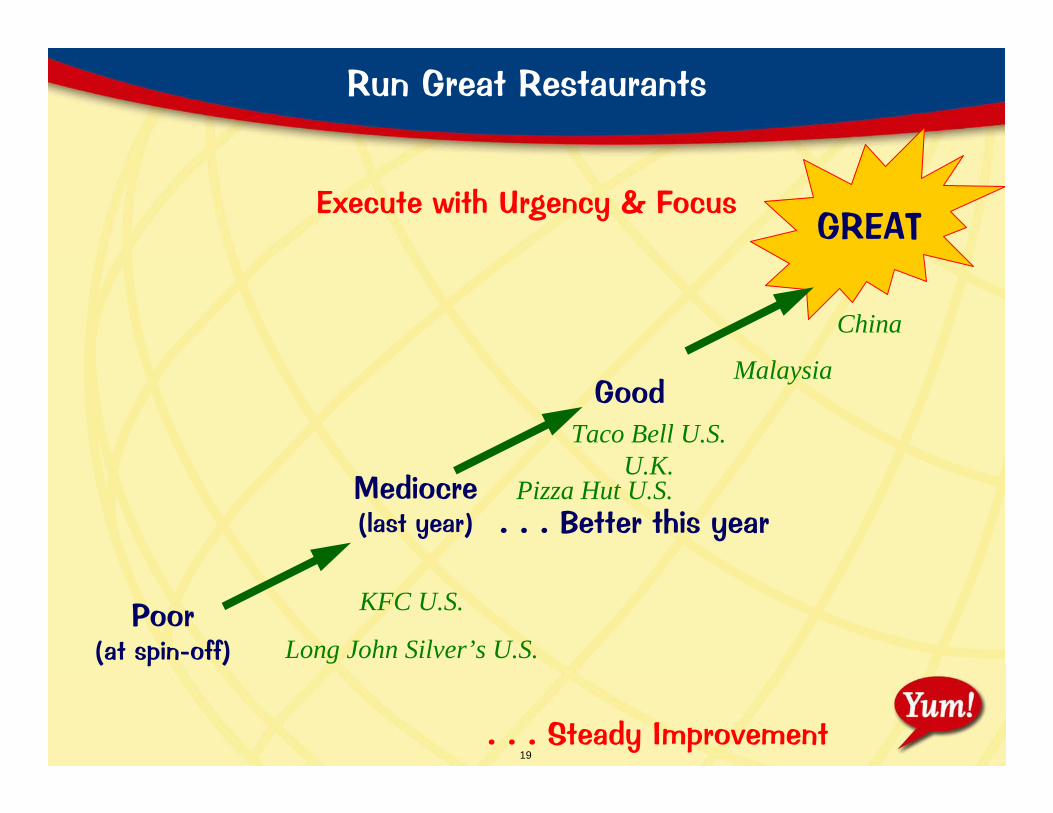
19
GREAT
Run Great Restaurants
Execute with Urgency & Focus
. . . Steady Improvement
. . . Better this year
Poor(at spin-off)
Mediocre(last year)
Good
China
Malaysia
Taco Bell U.S.U.K.
Pizza Hut U.S.
KFC U.S.
Long John Silver’s U.S.
20
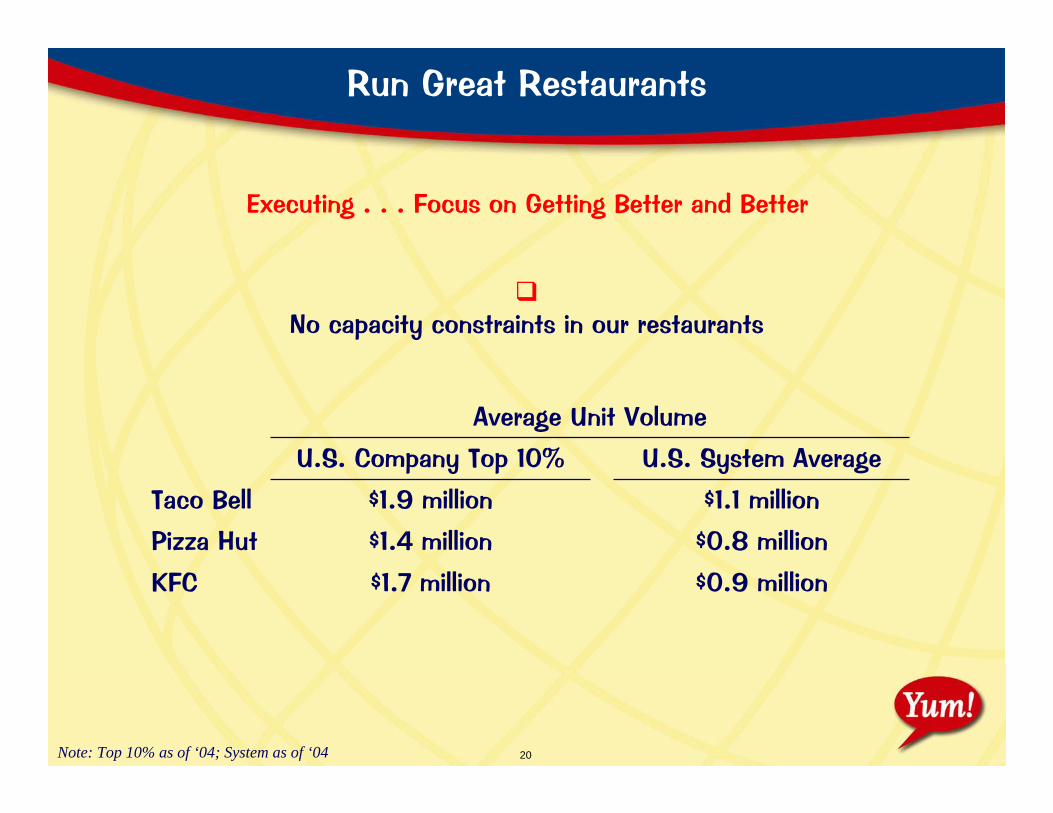
Run Great Restaurants
No capacity constraints in our restaurants
Average Unit Volume
$0.9 million$1.7 millionKFC
$0.8 million$1.4 millionPizza Hut
$1.1 million$1.9 millionTaco Bell
U.S. System AverageU.S. Company Top 10%
Executing . . . Focus on Getting Better and Better
Note: Top 10% as of ‘04; System as of ‘04
21
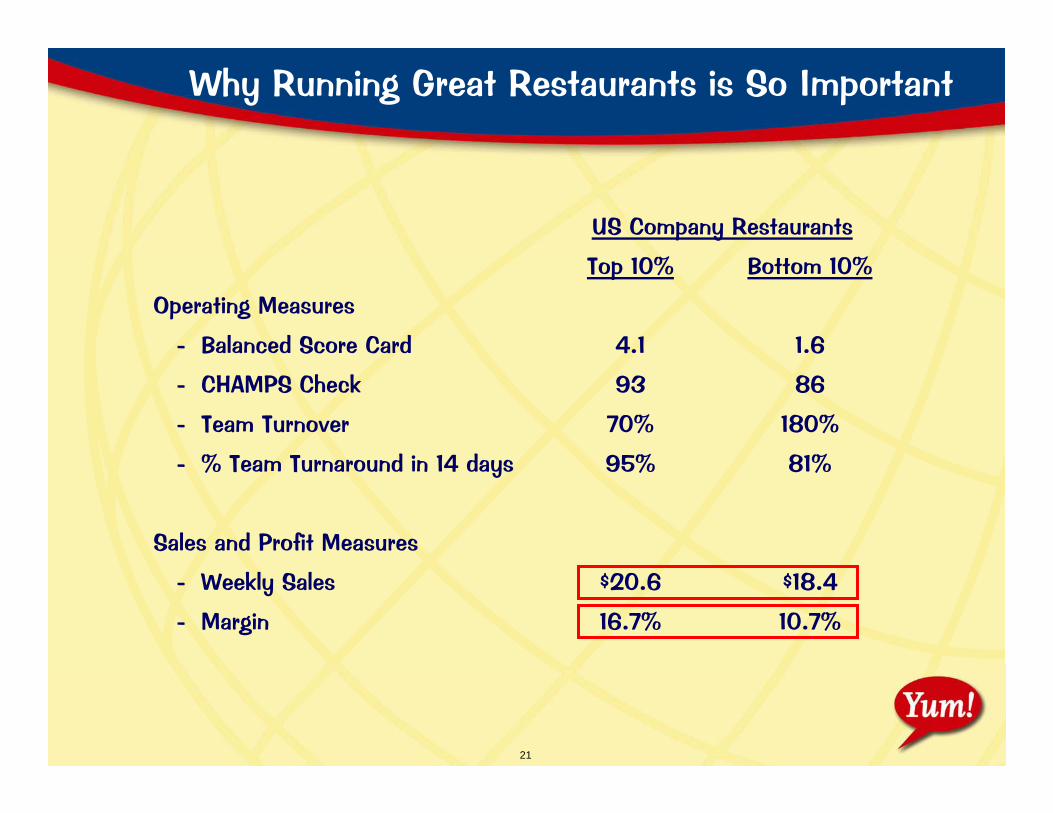
Why Running Great Restaurants is So Important
10.7%16.7%- Margin
$18.4$20.6- Weekly Sales
Sales and Profit Measures
81%95%- % Team Turnaround in 14 days
180%70%- Team Turnover
8693- CHAMPS Check
1.64.1- Balanced Score Card
Operating Measures
Bottom 10%Top 10%
US Company Restaurants
22
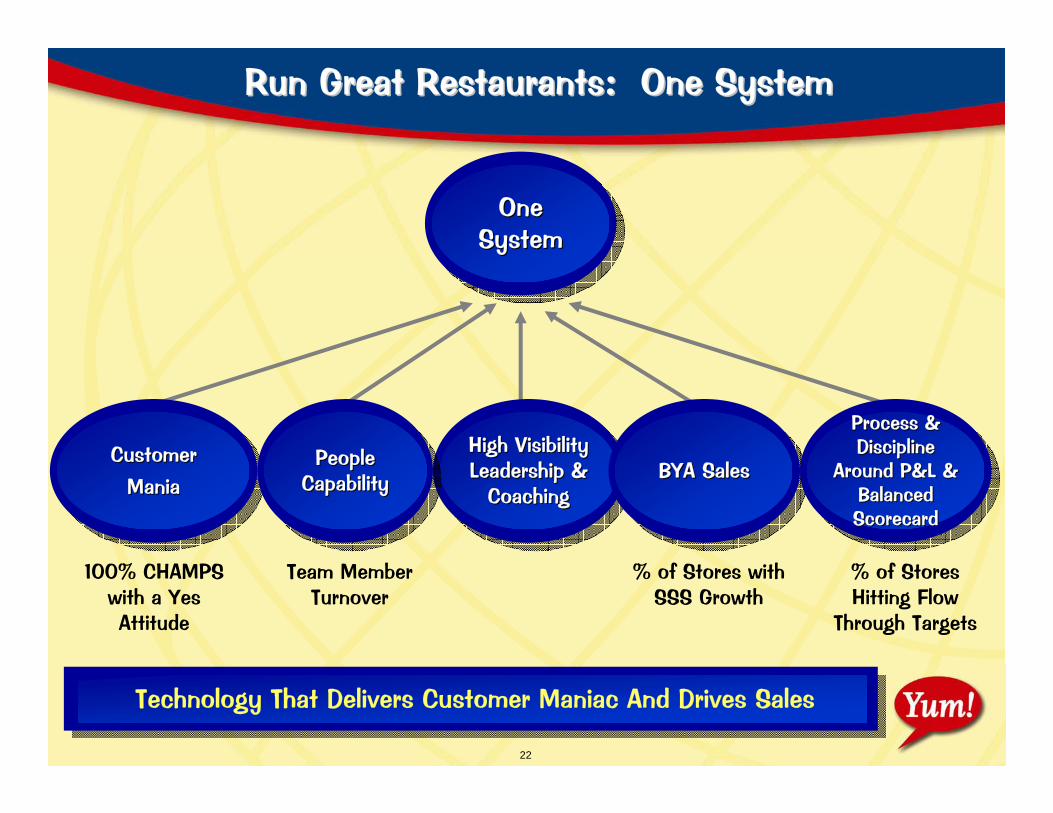
Technology That Delivers Customer Maniac And Drives Sales
Run Great Restaurants: One SystemRun Great Restaurants: One System
One One SystemSystem
Customer Customer Mania Mania
High Visibility High Visibility Leadership & Leadership &
CoachingCoachingBYA SalesBYA Sales
Process & Process & Discipline Discipline
Around P&L & Around P&L & Balanced Balanced ScorecardScorecard
People People CapabilityCapability
100% CHAMPS with a Yes Attitude
Team Member Turnover
% of Stores with SSS Growth
% of Stores Hitting Flow
Through Targets
23
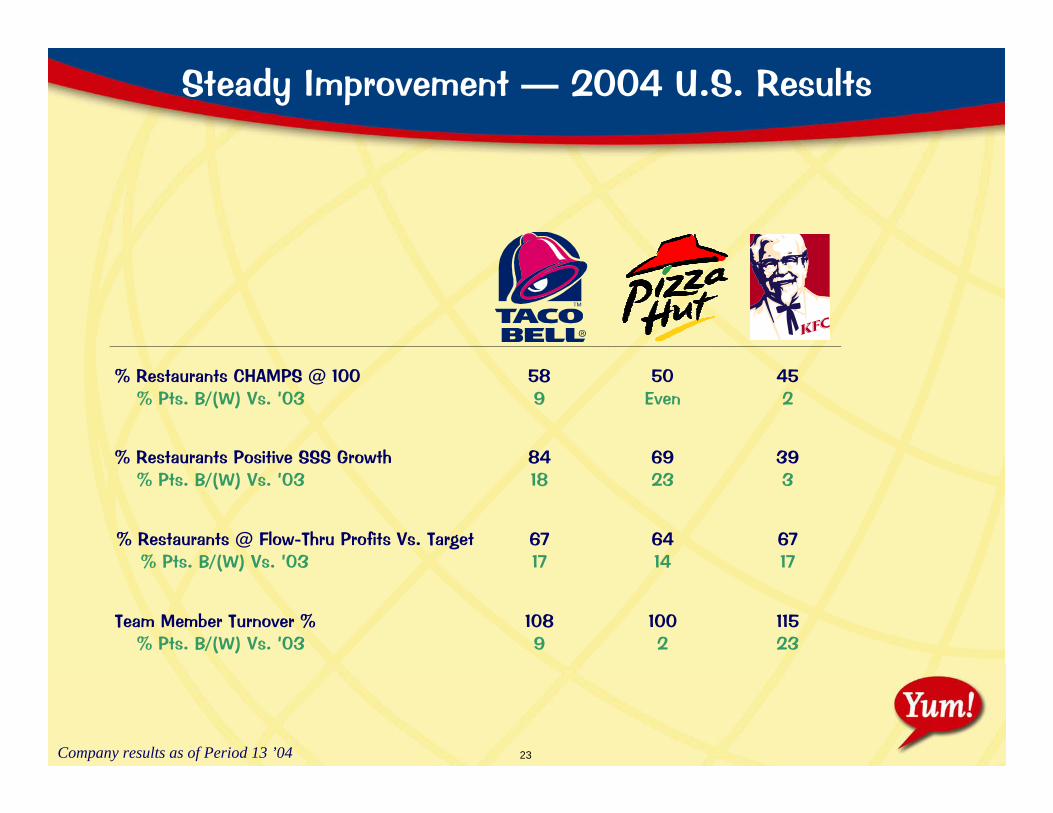
Steady Improvement — 2004 U.S. Results
% Restaurants CHAMPS @ 100 58 50 45 % Pts. B/(W) Vs. ’03 9
Even
2
% Restaurants Positive SSS Growth 84 69 39 % Pts. B/(W) Vs. ’03 18
23
3
% Restaurants @ Flow-Thru Profits Vs. Target 67 64 67 % Pts. B/(W) Vs. ’03 17
14
17
Team Member Turnover % 108 100 115 % Pts. B/(W) Vs. ’03 9
2
23
Company results as of Period 13 ’04
24
Not Your Ordinary Restaurant Company
ExpandMULTIBRANDING
ExpandExpandMULTIBRANDINGMULTIBRANDING
RunGREAT
Restaurants
RunGREAT
Restaurants
Drive ProfitableINTERNATIONAL
Growth
Drive ProfitableINTERNATIONAL
Growth
Build DominantCHINABrands
Build DominantCHINABrands
MAJOROPPORTUNITIES
MAJORMAJOROPPORTUNITIESOPPORTUNITIES
25
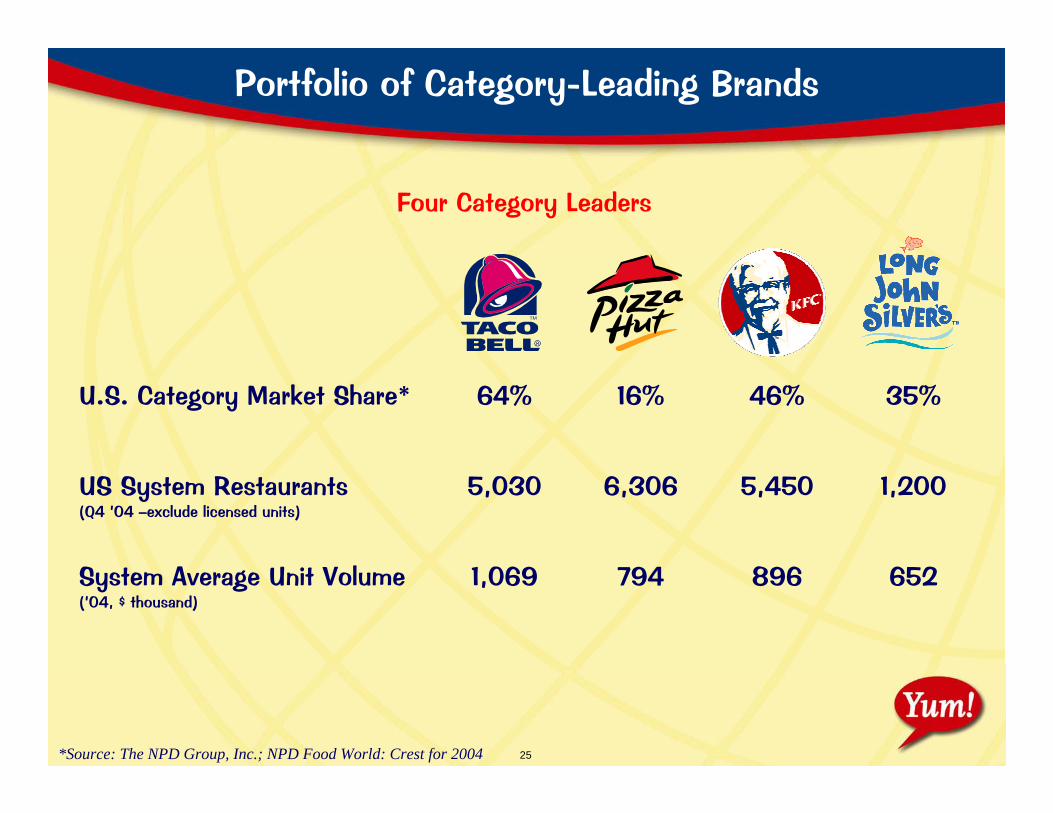
Portfolio of Category-Leading Brands
1,2005,4506,3065,030US System Restaurants (Q4 ’04 –exclude licensed units)
6528967941,069System Average Unit Volume(’04, $ thousand)
35%46%16%64%U.S. Category Market Share*
Four Category Leaders
*Source: The NPD Group, Inc.; NPD Food World: Crest for 2004
26
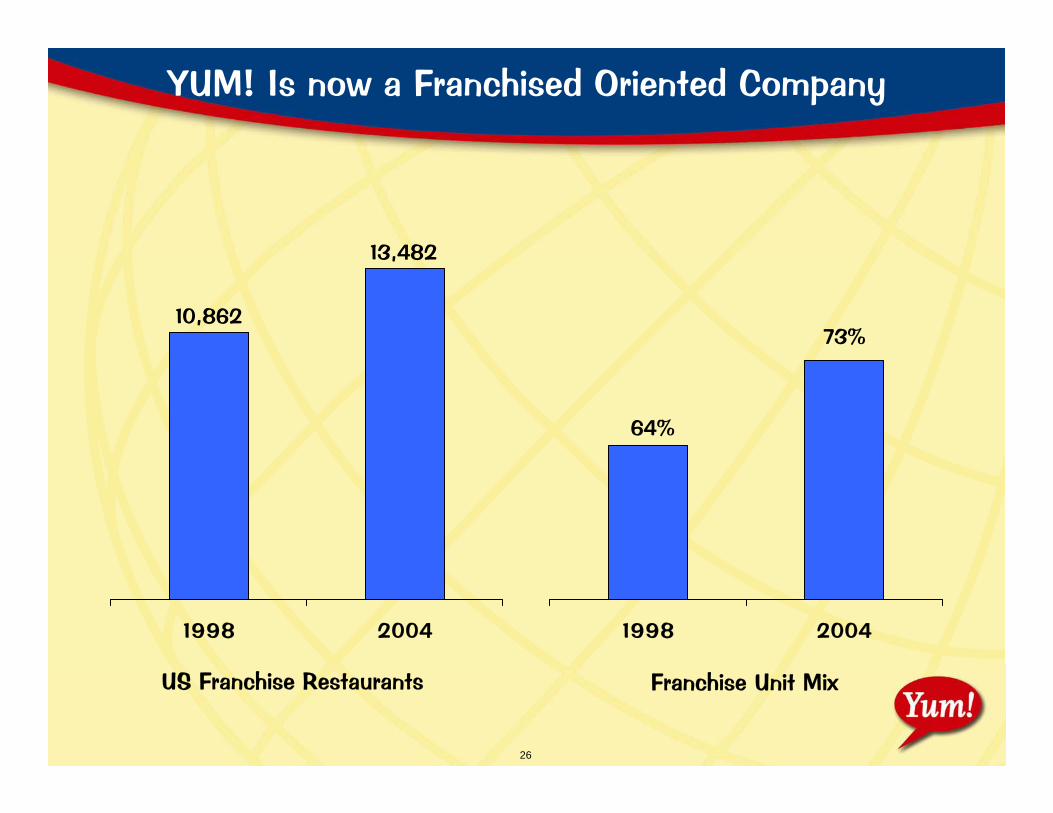
YUM! Is now a Franchised Oriented Company
1998 20041998 2004
Franchise Unit MixUS Franchise Restaurants
13,482
64%
73%10,862
27
Summary
Consistent Financial Results
Strong Cash Flow and Returns
Not Your Ordinary Restaurant CompanyChina, International, Run Great Restaurants, Multibranding
Embrace Franchise Development and Growth