Embed Size (px)
Citation preview

1
Financial Impact Analysis of the New RUG-IV on Post-Acute Medicare 1
Providers Using Monte Carlo Simulation
John (Jian) Gao, Barry Fogel and Cheryl Caswell
Research Department, PointRight Inc. Lexington, MA
ABSTRACT
CMS has proposed new reimbursement rate of RUG-IV groupers based on the STRIVE project. We have
conducted Monte Carlo simulation on the STRIVE project data to study the financial impact of new RUG-IV
reimbursement rate on service providers, especially with different concurrent therapy and group therapy time
rate, under the CMS final rule in FY 2011 and FY 2012. First, we have compared the difference between RUG-III
and RUG-IV on ADL(Activities of Daily living), Nursing and Therapy Index (Case Mix index) and concurrent
therapy time in STRIVE data. Then the simulation analysis is conducted under the assumption that the
concurrent and group therapy time in a service provider has the same shape parameter of Gamma distribution
function as that in the STRIVE project data. In the financial impact analysis from RUG-III to RUG-IV, the first step
is to estimate the reimbursement change of each RUG-III group under RUG-IV from STRIVE project data. Then
the simulation analysis for a given population with certain distribution of RUG-III groups can be derived based on
individual RUG-III simulation result and also conducted directly by using the same methodology as individual
RUG-III group simulation. The financial impact analysis has been conducted on the STRIVE project data and
PointRight’s MDS data in 2009 with the concurrent therapy time rate of 0%, 5%, …,50%.
1. INTRODUCTION
The reimbursement rate for Medicare residents by CMS (Centers for Medicare & Medicaid Services) [1] is based
on the CMI (case mix index) of RUG (Resource Utilization Groups) categories for Post-Acute Medicare Providers.
The RUGs are determined based on clinical data from the MDS (Minimum Data Set) collected during a resident
assessment. The existing RUG-III grouper logic was based on clinical data collected in 1990, 1995, and 1997.
Since then, industry practices have changed considerably thus impacting the resources required to treat higher
acuity patients. Also, Medicare expenses have increased significantly over the past several years. Therefore, the
Prospective Payment System (PPS) for Skilled Nursing Facilities (SNFs) needs to be updated and recalibrated to
ensure that payment rates reflect current practices and resource needs to reimburse fairly for all types of patients
currently residing in nursing homes.
CMS is proposing to implement a new set of RUG categories using the results of the nursing home staff time
measurement (STM) data collected during the Staff Time and Resource Intensity Verification (STRIVE) project [2],
and a new RUG-IV case-mix classification model based on the updated Minimum Data Set (MDS) 3.0 resident
assessment for case-mix classification (effective FY 2011). As part of the STRIVE study, 2006-2007 patient and
facility staff data were collected in order to update the case-mix classification system. The STRIVE data shows
significant changes in patient characteristics and facility practice patterns that need to be incorporated into the
case-mix methodology for more accurate SNF reimbursement.. The 2010 Final Rule 2010 included the change
from a 53 RUG-III group system to a 66 RUG-IV group system. Based on the STRIVE research, CMS has
proposed several modifications to the RUG-IV model, including changes in concurrent therapy time, ADL index
adjustment, criteria for ‘isolation’, and the ‘look-back’ period.
AHCA has developed a RUG-IV simulator [3] based on the crosswalk of RUG-III data to RUG-IV from the
STRIVE study. The STRIVE data are regarded as a random sample of population data, mainly used to estimate
the average behavior of the population. However, the residents’ behaviors in some facilities are far different from
the population average. For example, the residents in Post-Acute Care Facilities are mainly Short-Stay residents
admitted to the SNF after a hospital stay. Also, the rate of concurrent therapy time in MDS 2.0 can change from
facility to facility. If we use the crosswalk of RUG-III to RUG-IV from the STRIVE data for a facility with a lower rate
of concurrent therapy time, the result might over-estimate the impact of RUG-IV on the facility. Therefore, a new
1 Medicare is a national social insurance program, administered by the U.S. federal government since 1965, that guarantees
access to health insurance for Americans ages 65 and older and younger people with disabilities as well as people with end
stage renal disease.
2
approach must be developed to account for these issues.
To study the financial impact of the transition on Post-Acute Medicare Providers, we implemented the Monte Carlo
simulation method to estimate the change from RUG-III to RUG-IV, based on the MDS 2.0 clinical data and the
RUG-IV classifications in the CMS FY 2010 Final Rule. The Monte Carlo methods are a class of computational
algorithms that rely on repeated random sampling to compute their results, and which can be used for prediction
performance of complex systems involving more than two uncertain parameters. Because of their reliance on
repeated computation of random or pseudo-random numbers, these methods are most suited to calculation by a
computer and tend to be used when it is unfeasible or impossible to compute an exact result with a deterministic
algorithm. Recently, Monte Carlo methods have been widely used in financial systems, especially in the risk
management field. Here we have implemented the Monte Carlo simulation method to analyze the possible
change of reported therapy time from RUG-III to RUG-IV based on MDS 2.0 data. Then the new RUG-IV groupers
will be calculated based on the classification criteria in the Final Rule 2010. And then the financial impact of the
transition of RUG-III to RUG-IV on Post-Acute Medicare Providers will be studied based on the CMS case mix
index for RUG-IV.
2. MDS CLINICAL DATA
The reimbursement rate for Post-Acute Care residents is calculated from the CMI of the RUG with the geographic
adjustment (wage index). The CMI for RUG-III was calculated based upon the results of the STRIVE project.
The classification of the RUG categories are from MDS data, including ADL score, therapy time, disease
diagnoses, and other factors, such as isolation, infection, look-back period, etc.es. . The RUG-III is based upon
MDS 2.0 data, and the RUG-IV is based on data from MDS 3.0. The biggest change from RUG-III to RUG-IV
stems from the therapy time reported on the MDS form.
A. RATE of CONCURRNT THERAPY
Concurrent therapy is the practice of one professional therapist treating multiple patients at the same time while
the patients perform different activities. Group therapy is one professional therapist treating multiple patients at
the same time while the patients perform the same activities. In MDS 2.0, the total therapy minutes and days
have been regarded as individual therapy time and have been used for estimating the cost for therapy treatment.
The STRIVE study shows a significant shift in the provision of therapy from individual (one-on-one treatment) to
concurrent treatment over the last decade. Accordingly, CMS proposed that, effective with the introduction of
RUG-IV, concurrent therapy time provided in a Medicare Part A SNF setting would no longer be counted as
individual therapy time for each of the patients involved. CMS requires allocating concurrent and group therapy
minutes among the participating patients to their share of individual therapy minutes based on the time splice
method into equivalent individual therapy time . In fact, the sum of all equivalent individual therapy time received
by residents is equal to individual therapist’s working time. CMS believes that it is reasonable to get
reimbursement for SNF based on the utilization of therapists. For MDS 3.0, the reported therapy time will be the
sum of individual therapy minutes. The change in the reported therapy time for RUG classifications will have a
direct financial impact on SNFs. The key to estimating the financial impact is to estimate the portion of reported
therapy time that must be deducted under MDS 2.0 for the RUG-IV classification. It is impossible to allocate
total therapy time into concurrent, group and individual for all assessments in a facility without other detailed
information. However, with the distribution of the rates of concurrent, group and individual therapy time in a
facility, the Monte Carlo simulation method can be implemented to derive the distribution of individual, concurrent
and group therapy time for all assessments used for RUG-IV calculations based on the current reported total
therapy time.
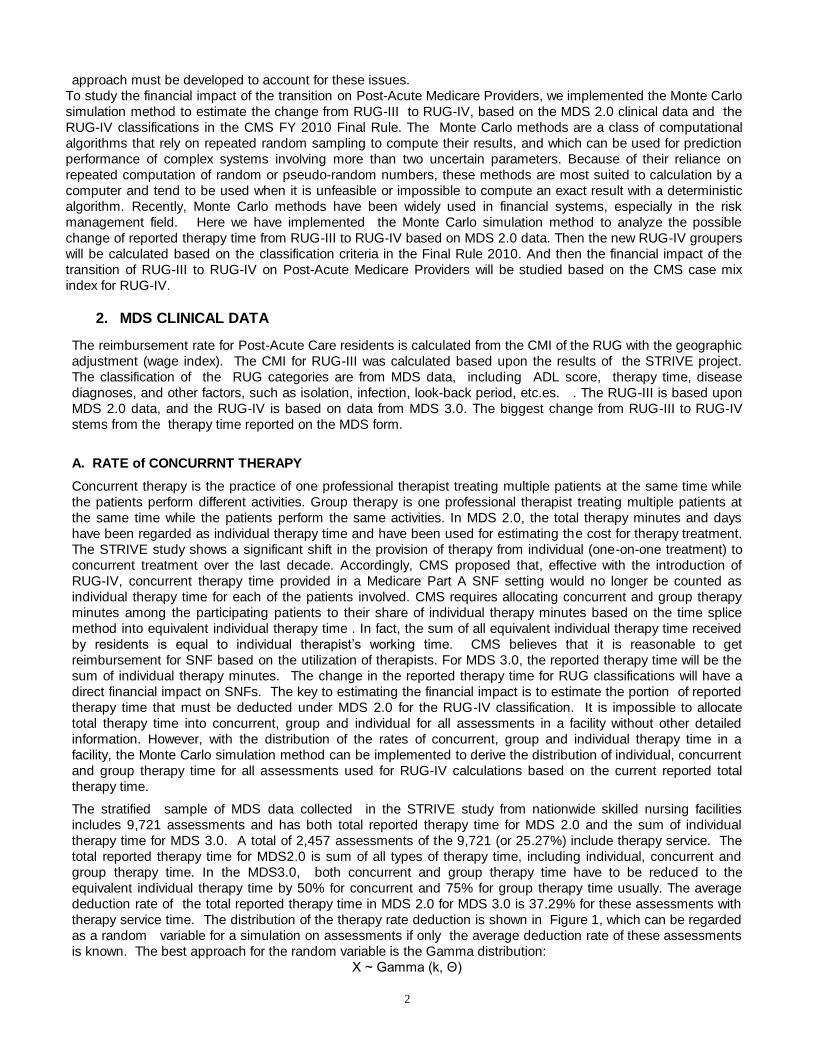
The stratified sample of MDS data collected in the STRIVE study from nationwide skilled nursing facilities
includes 9,721 assessments and has both total reported therapy time for MDS 2.0 and the sum of individual
therapy time for MDS 3.0. A total of 2,457 assessments of the 9,721 (or 25.27%) include therapy service. The
total reported therapy time for MDS2.0 is sum of all types of therapy time, including individual, concurrent and
group therapy time. In the MDS3.0, both concurrent and group therapy time have to be reduced to the
equivalent individual therapy time by 50% for concurrent and 75% for group therapy time usually. The average
deduction rate of the total reported therapy time in MDS 2.0 for MDS 3.0 is 37.29% for these assessments with
therapy service time. The distribution of the therapy rate deduction is shown in Figure 1, which can be regarded
as a random variable for a simulation on assessments if only the average deduction rate of these assessments
is known. The best approach for the random variable is the Gamma distribution:
X ~ Gamma (k, Θ)
3
The probability density function of a gamma-distributed random variable x is:
Here ‘k is the shape parameter and Θ is the scale parameter. The best approach for the distribution of the
concurrent therapy time deduction rate has a scale parameter of 0.183 and a shape parameter of 2.03. As
shown in Figure 1, it is noted that k۰Θ = mean.
Figure 1. Distribution of Therapy Time Deduction Rate From Concurrent and Group Therapy Time in
STRIVE Data
CMS has commented on the future practice of therapy treatment in SNFs under the FY 2010 Final Rule by
saying that providers should maintain the same therapy treatment as before and should not force "contract"
therapists to increase therapy time. In this situation, the case mix index of residents in the facility will be
significantly reduced, resulting in decreased reimbursement. However, CMS does not oppose increasing therapy
resources to perform additional therapy if residents need it, nor is increased individual therapy time opposed by
CMS.
Therefore, the Monte Carlo simulation from the reported therapy time in MDS2.0 for RUG-IV was conducted
under the assumption that concurrent and group therapy time usage was the same as before. Therefore, the
assumption is that the reported therapy time in MDS 2.0 will be reduced under MDS 3.0 for RUG-IV. The
deduction will be calculated based on the deduction rate distribution in the STRIVE sample data. In fact, there
are two methods for computing the deduction in the simulation. One is the empirical approach, in which the
deduction rate is directly obtained from the STRIVE sample data without any adjustment. The second is from the
estimated distribution from the STRIVE sample data. Here, the best estimated distribution is the Gamma
distribution. For this simulation, the deduction rate will be selected randomly from the Gamma distribution.
It is noted that the distributions of the deduction rate of therapy time due to concurrent and group therapy are
from a random sample of the population. The concurrent therapy time rate may change from one facility to
another. The distribution of the deduction rate in a facility is similar to the population’s or the STRIVE sample
data. Therefore, the average deduction rate in a facility cannot change the shape of the random variable
distribution in the population data. The deduction rate distribution for a facility can be assumed to be as
follows:
1) the shape parameter ‘k’ for a facility is the same as for the population; that is k=2.03.
2) the scale parameter can be derived from the average deduction rate in a facility and the population scale
parameter of 0.18.
For example, assume for a facility, the average deduction rate is 0.2. Therefore, the scale parameter Θ for the
facility will be equal to 0.2/2.03=0.2/(0.18*2.03 )*0.18 = 0.099. Therefore, we can write the following formula:
(average deduction rate in a facility/average deduction rate in STRIVE data)*scale parameter of STRIVE

4
= scale parameter in a facility
If we use the empirical distribution of the concurrent therapy time deduction rate from STRIVE project data with a
given average concurrent therapy deduction rate in a facility, the deduction rate for a given assessment of a
resident in a facility will be determined by randomly selecting a case in the STRIVE sample data and the ratio of
the average deduction rate in the facility with the average of STRIVE sample data.
EXAMPLE: The average deduction rate of concurrent therapy time is 0.2 in a facility. An assessment in the facility
depends on the randomly selected case from the STRIVE project data with a deduction rate of 0.5. Therefore,
the deduction rate for the assessment in the Monte Carlo simulation will be equal to 0.2/(2.03*0.18)*0.5 = 0.274.
B. ADL INDEX
CMS proposed revisions to the RUG-IV ADL index based on both clinical and statistical considerations from the
STRIVE study. The STRIVE study shows that the ADLs of eating Independent, bed mobility, transfers and
toileting are the strongest predictors of resource use, and thus are used for a new scale measuring activities of
daily living. The scale ranging from 4-18 in the MDS 2.0 ADL index has been changed to a 0-16 scale in the
new ADL index in order to increase the sensitivity of the ADL index scale.
The STRIVE project documentation shows that the STRIVE data file was used to estimate the new ADL index
in RUG-IV by using MDS 2.0 assessment information. Therefore, the cross-walk from the ADL index in RUG-III
to the new ADL index in RUG-IV shows that the change in the ADL index will result in a significant impact on
RUG-IV Groups, especially for the Special Care and the Clinically Complex.
Figure 2 ADL Index Change From RUGIII to RUG-IV in STRIVE Data
0%
2%
4%
6%
8%
10%
12%
14%
16%
18%
20%
0 1 2 3 4 5 6 7 8 9 10 11 12 13 14 15 16 17 18
ADL Index
RUG-IV Rug-III
C. OTHER CHANGES IN RUG-IV
Other changes in the RUG –IV model include isolation, infection and the look-back time period. In addition to
trachesotomy care and ventilator/respirator care, ‘isolation for active infectious disease’ while a SNF resident has
been added into consideration for the Rehab plus Extensive Services RUG categories. The STRIVE project data
designates the ‘isolation for active infectious disease’ as a binary field. However, neither the CMS FY 2010 Final
Rule nor the STRIVE project documentation provide more detailed information on this field. According to our
clinical understanding, the three primary fields in the MDS 2.0 that trigger as ‘isolation for active infectious
disease are: TB, antibiotic resistant infection and clostridium difficile.
The look-back time period in RUG-III is defined as ‘within the prior 14 days’ for those residents with ventilator
/respirator, tracheostomy, suctioning, IV medications, and transfusions. The STRIVE study shows that there is a
much lower utilization of staff resources for individuals who received certain treatments solely prior to the SNF
stay, compared to those who received these services while a resident of the SNF. Therefore, CMS determined
that the special treatments and procedures provided during the prior hospital stay are not applicable in MDS 3.0;
rather they are included only if provided by the SNF.
D. CMI iN RUG-IV
5
Daily payments to SNFs are determined by adjusting the base payment rates for geographic differences in labor
costs and the case mix index (or weight). The daily base rates are adjusted for case mix using the RUG
categories. Each RUG has an associated nursing and therapy index applied to the base payment rates. The
daily base rate in the CMS FY 2010 Final Rule is determined by the urban/rural geographic location, nursing,
therapy and other non-case mix adjustment components, which can be used for both RUG-III and RUG-IV.
Rate component Nursing Therapy (for re-
habilitation RUG)
Therapy* (for non-
rehabilitation RUG)
Non-case mix
component*
Urban rate $155.23 $116.93 $15.40 $79.22
Rural rate 148.31 134.83 16.45 80.69
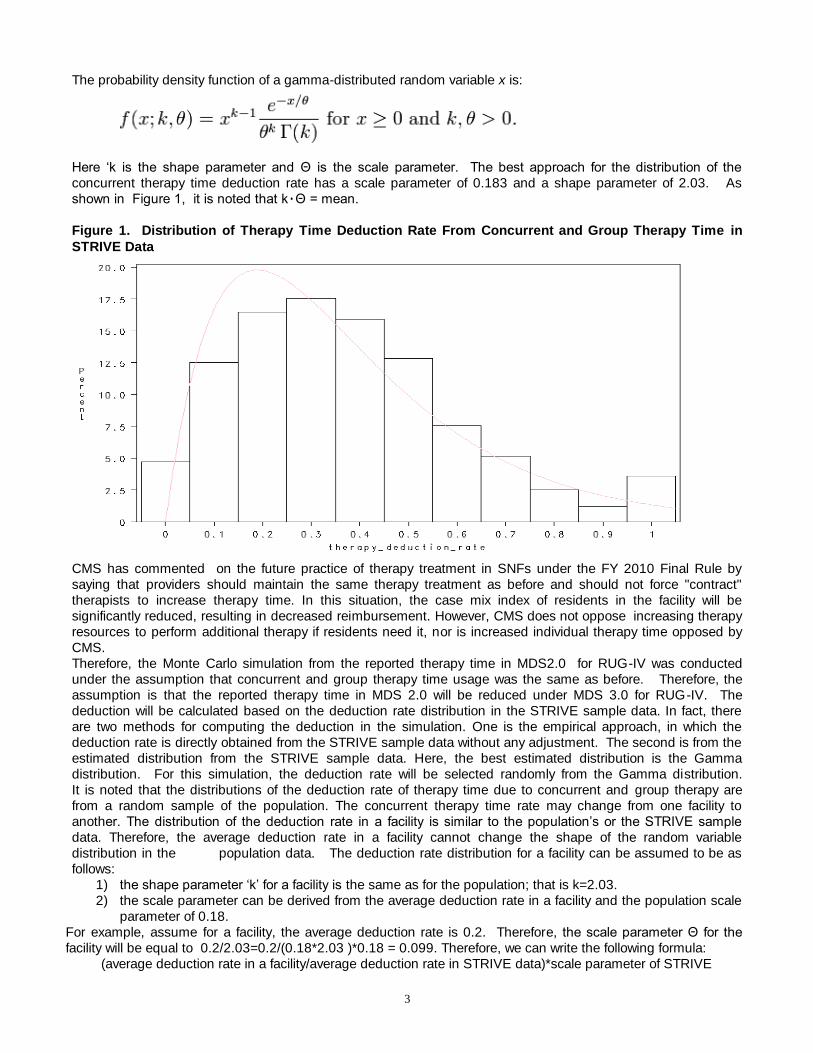
Both the nursing and the therapy index have significantly changed from RUG-III to RUG-IV under the CMS FY
2010 Final Rule because the changes incorporated the changes in concurrent therapy time, new ADLs and
others.
For the Nursing Index:
1) The comparison between the nursing index in the STRIVE study shows that actual nursing resource
utilization is higher than that suggested by the CMS FY 2010 Final Rule for Rehab RUG-III categories.
2) The proposed nursing index for Rehab Groups in RUG-IV were increased significantly based on the
STRIVE study.
3) In RUG-IV, the case mix weights for nursing care in the STRIVE project are consistent with the nursing
index suggested in the CMS FY 2010 Final Rule for the following RUG-IV categories: Rehab plus
Extensive Services, Rehab, Extensive Services and Special Care, Clinical Complex, Behavioral
Symptoms and Cognitive performance, reduced physical function and etc. It is noted that under the
CMS FY 2010 Final Rule, the proposed case mix nursing index of the following RUG-IV categories:
Clinically Complex, Reduced Physical Function, and Special Care-Low are higher than the current utili-
zation of nursing resources based on the STRIVE study.
Figure 3. Comparison of Nursing Index in RUG III Between STRIVE data with Final Rule 2010

6
Figure 4. Comparison of Nursing Index in RUG IV Between STRIVE data with Final Rule 2010
Table 1 shows the comparison of the nursing index for Rehab groups. It shows that there is a significant increase
in the nursing index in RUG-IV proposed in the CMS FY 2010 Final Rule. Note: Here * designates the weighted
average and ** designates a simple average. Using the same distribution of the RUG-III days in 2010 as in 2000,
the weighted average of the nursing index in 2010 is 1.1, also based on the data from the STRIVE study. The
table also shows the distribution of RUG days. The Rehab RUG days make up 78.75% of total RUG days in
2000. The increase in the nursing index means a higher payment rate for CMS. However, this will be offset by
the implementation of the deduction for concurrent and group therapy time resulting in a decrease in the
therapy index for all rehab RUG categories.
TABLE 1 Nursing Index Change from CMS STRIVE 2000 to Final Rule 2010
Urban Nursing Index of
RUG III in Final Rule FY
2010
Percent of RUG
Days in 2000 Nursing Index Nursing Index Nursing Index
Change % of RUG
III to RUG IV
RUX 0.24% 1.61 1.77 3.55 100.56%
RUL 0.71% 1.19 1.31 3.41 160.31%
RVX 0.64% 1.31 1.44 3.48 141.67%
RVL 2.73% 1.13 1.24 2.92 135.48%
RHX 5.37% 1.21 1.33 3.40 155.64%
RHL 4.27% 1.16 1.27 2.86 125.20%
RMX 1.97% 1.64 1.80 3.28 82.22%
RML 2.61% 1.43 1.57 2.92 85.99%
RLX 0.12% 1.11 1.22 3.01 146.72%
RUC 0.77% 1.09 1.20 2.08 73.33%
RUB 3.28% 0.84 0.92 2.08 126.09%
RUA 1.09% 0.71 0.78 1.32 69.23%
RVC 1.68% 1.04 1.14 2.00 75.44%
RVB 9.68% 0.92 1.01 1.48 46.53%
RVA 4.20% 0.70 0.77 1.47 90.91%
RHC 9.67% 1.03 1.13 1.92 69.91%
RHB 10.32% 0.94 1.03 1.59 54.37%
RHA 4.92% 0.80 0.88 1.22 38.64%
RMC 3.62% 0.98 1.07 1.81 69.16%
RMB 7.28% 0.92 1.01 1.62 60.40%
RMA 3.13% 0.88 0.97 1.12 15.46%
RLB 0.19% 0.97 1.06 1.99 87.74%
RLA 0.29% 0.72 0.79 0.94 18.99%
Total 78.75% 1.00* 1.16** 2.24** 93.10%
Rehab Group
2000 CMS Population Data
Nursing Index of RUG IV in Final
Rule FY 2010

7
For the therapy index, the STRIVE study shows that CMS overpaid for therapy service under RUG-III because
the comparison between the case mix weights of therapy service in CMS Final Rule FY 2010 is significantly
higher than the current utilization based on the STRIVE study results. It is noted that the calculation of case mix
weights of therapy service in RUG-III were based on MDS 2.0, in which the concurrent therapy time was
reported as individual therapy.
In the CMS Final Rule FY 2010, the proposed case mix index of therapy service in RUG-IV is lower than in
RUG-III even after the deduction of concurrent therapy time. Also, the comparison between the STRIVE study
and the proposed case mix index on the therapy service shows that the proposed case mix index of therapy
service is lower in RUG-IV.
Figure 5 Therapy Index Comparison between RUG-III and RUG-IV in Final Rule 2010
Figure 6 RUG III Therapy Index Comparison between STRIVE and Final Rule 2010

8
Figure 7 RUG IV Therapy Index Comparison between STRIVE and Final Rule 2010
The analysis shows that CMS will increase payment rate for the nursing service component of the RUG and
decrease it for the therapy service component.
3. FINANCIAL IMPACT of THE TRANSITION FROM RUG-III to RUG-IV USING THE MONTE
CARLO SIMULATION METHOD We suggest a new approach to predict the financial impact of the transition from RUG-III to RUG-IV on the future
reimbursement of Medicare residents using Monte Carlo Simulation method. First, the approach uses MDS 2.0
assessment information with adjustments recommended as a result of the STRIVE study, such as the new ADL
index, isolation infection, the deduction for concurrent therapy time. For the simulation, the deduction of
concurrent and group therapy time is based directly on the distribution from the STRIVE project sample data.
Second, the LOS is calculated from the admission date and discharge date variables and other assessment
information in MDS 2.0. Thirdly, the per diem payment rate for each RUG-IV group is based on the information
from CMS Final Rule FY 2010, including the wage index adjustment for geographic location on the per diem
rate. The following chart shows the steps in the calculation.
Under the simulation approach, the conversion of therapy time from MDS 2.0 to MDS 3.0 is calculated using the
following procedure:
1. Estimate the average rate of concurrent therapy time in a facility;
2. Calculate the scale parameter in the Gamma distribution with a shape parameter of 2.03 and the average
MDS 2.0 Assessment Data by Resident
New ADL
Calculation
New Diagnosis disease
variables Calculation
with ICD9 code
Resident days by
RUG -IV Groups
Isolation
Infection
Resident
Days
Daily Payment
Rate
Recalculate Therapy Time
Rate Based on Concurrent
Therapy Rate Assumption
Adjustment from Wage
index by geographic
location
Prediction of Reimbursement
from RUG-IV PPS

9
concurrent therapy time deduction rate;
3. The therapy time deduction rate in MDS 2.0 is the random number generated from the Gamma distribution;
4. The estimated change in therapy time from the MDS 2.0 reported therapy time to MDS 3.0 therapy time will
be equal to (1-concurrent therapy time deduction rate); * the MDS 2.0 reported therapy time. This will be
used for the classification of the RUG-IV categories.
The purpose of the simulation analysis is to estimate the financial impact of the change from RUG-III to RUG-IV
or from MDS 2.0 to MDS 3.0. The previous simulation chart has shown that the revenue in RUG-III is directly
calculated from the total length of stay, using the per diem rate for each of the RUG-III categories in a MDS2.0
data file. Thus, the total revenue in RUG-III is regarded as a ‘baseline’. And then the total revenue under
RUG-IV group of all assessment can be estimated by following the simulation steps. The revenue change ratio
from RUG-III to RUG-IV is calculated as follows:
Ratio = (revenue in RUG-IV-revenue in RUG-III)/revenue in RUG-III.
In order to study the impact of the transition from RUG-III (based on MDS 2.0 data) to RUG-IV (based on MDS
3.0 data, we have conducted two simulation analyses. The first analysis was based on the STRIVE data; the
second analysis was based on a random sample of MDS assessments in the PointRight MDS database.
A. Simulation from the STRIVE Data
The STRIVE data already contain the information on the ADL and disease diagnoses for RUG-IV, which are used
in the calculation of the nursing index. In this simulation, we mainly focus on the impact of the deduction for
concurrent and group therapy time in RUG-IV. Therefore, the simulation will be conducted under the following
assumptions:
1. The Medicare residents in a facility in the new FY 2011 have the same characteristics and health
status and receive same service at the facility. Therefore, the only change in the FY 2011 per diem rate is
as a result of the new RUG-IV evaluation system.
2. The analysis will predict the financial impact of the new RUG-IV payment system for a facility based
on the estimated RUG-IV for each resident; then the data for all residents are rolled up to the facility
level.
3. The STRIVE data can be regarded as a stratified random sample for the Rehab and non-rehab MDS
2.0 assessments.
4. The nursing index for each MDS assessment in the STRIVE data ( for both RUG-III and RUG-IV) will
not change in the simulation.
5. The deduction rate for concurrent therapy time will be based on the overall rate of concurrent therapy
time at the facility level and the distribution of the individual assessment within the facility. The deduction
rate for each individual resident will be decided randomly from the Gamma distribution for each facility's
rate of concurrent and group therapy time.
It is noted that there is a difference in the RUG distributions based on the STRIVE data and those reported by
providers. In order to obtain as accurate a result as possible, we first conducted the simulation on the STRIVE
data using different concurrent therapy time deduction rates with the Gamma distribution for each Rehab
assessment in the STRIVE data. We then repeated the simulation 1,000 times to obtain the distribution of
RUG-IV categories for each of the RUG-III categories from the STRIVE data. Then, based on the actual RUG-III
distribution of days in the MDS 2.0 data, we randomly selected the MDS assessment from the simulation analysis
described above in the first step of the process. It is noted that each assessment in the simulation generated from
the STRIVE data represents one resident day. The average per diem rate is calculated from the randomly-
selected assessments in the simulation data analysis:
a) We used two RUG-III distributions in the simulation. One is from the RUG-III distribution reported to CMS in
2000, calculated using the Nursing Index (see Appendix A), in which 78.75% of the RUG days were rehab
days. The second is from the PointRight MDS database, which is the RUG-III distribution in 2009, where
91.64% of the RUG days were rehab days. The simulations were conducted using the concurrent therapy
time deduction rates of 0%, 5%, 10%, 15%, 20%, 25%, 30%, 35%, 40%, 45% and 50%, respectively.
b) We also conducted another simulation using MDS data with the RUG-III distribution from the
PointRight MDS database based on the definition from RUG-IV. The sample used for the simulation analysis
was randomly selected from PointRight’s MDS database, which includes 7,000 Medicare assessments for
2009.

10
Figure 8 The Average PerDiem Change of RUG IV and RUG III from CMS Final Rule FY2010
-15%
-10%
-5%
0%
5%
10%
15%
0% 5% 10% 15% 20% 25% 30% 35% 40% 45% 50%
Deduction Rate of Concurrent Therapy Time For RUG-IV
Avera
ge P
erD
iem
Ch
an
ge
PointRight RUGIII Distribution (2009)
STRIVE RUGIII Distribution
PointRight MDS Data Simulation (2009)
Figure 9 The Average PerDiem Change of RUG-IV From CMS FY 2012 Final Rule and
RUG-III from CMS FY 2010 Final Rule
-25%
-20%
-15%
-10%
-5%
0%
5%
0% 5% 10% 15% 20% 25% 30% 35% 40% 45% 50%
Deduction Rate of Concurrent Therapy Time For RUG-IV
Avera
ge
PerD
iem
Ch
an
ge
PointRight RUGIII Distribution (2009)
STRIVE RUGIII Distribution

11
4. DISCUSSION of THE MONTE CARLO SIMULATION RESULT There are several interesting conclusions that can be made based on the results of the Monte Carlo
Simulation.
1) The SNF’s revenue will decrease if the concurrent therapy time deduction is increased because the per
diem rate is lower for the RUG categories with less therapy time. The required therapy time for the RL RUG
group is 45 minutes; 150 minutes for RM; 325 minutes for RH; 500 minutes for RV, and 720 minutes for
RU. The major change in the transition from RUG-III to RUG-IV is that the number of RU assessments
has significantly decreased in RUG-IV. However, CMS has increased the per diem rate for all Rehab
categories leading to an increase in revenue. However, this is not always the case, in reality. If the
deduction rate for concurrent therapy time is smaller than 22.5% from the Gamma distribution, the facility
will be benefit from the transition from RUG-III to RUG-IV because the revenue will increase. However,
those facilities with a deduction rate for concurrent therapy time that is >22.5% from the Gamma
distribution simulation, will experience a decrease in revenue due to the therapy time deduction.
Therefore, some facilities may benefit from the transition from RUG-III to RUG-IV; while others will
experience a significant drop in revenue as a result of the transition.
2) The two simulation approaches reflect two different business practices. The Gamma distribution
simulation shows the current practice going forward without any change in therapy service delivery. The
uniform distribution simulation shows that that a change in the business practice of therapy service will lead
to a difference in revenue even though the SNF provides the same number of therapy minutes, especially
in those instances where the concurrent therapy time deduction rate is > 30%.
3) The simulation result shows that a facility can significantly benefit from a revenue perspective by
reducing concurrent therapy time. However, the reduction of concurrent therapy time must be offset by
increasing the number of therapists in the facility and thereby increasing the amount spent on therapy
service. Therefore, each facility should conduct a profitability analysis based on the cost and feasibility of
hiring additional therapists in their geographic area, before replacing concurrent therapy minutes with
individual therapy minutes..
REFERENCES:
[1] 2009-10 Final Rule “DEPARTMENT OF HEALTH AND HUMAN SERVICES,
Centers for Medicare & Medicaid Services. [FR Doc. 2009-18662 Filed 07/31/2009 at 4:15 pm; Publication Date: 08/11/2009]
[2] STRIVE _Data_Release_Memo_042009.pdf; Centers for Medicare & Medicaid Services (CMS) April 20 2009
[3] RUG-IV Simulator American Health Care Association (AHCA) Nov 2009

12
APPENDIX A
RUG-III CMS FY 2001
Rug-III distribution in
PointRight MDS Database
(2009)
RUX 0.24% 9.85%
RUL 0.71% 14.62%
RVX 0.64% 5.08%
RVL 2.73% 6.22%
RHX 5.37% 0.00%
RHL 4.27% 0.00%
RMX 1.97% 8.34%
RML 2.61% 4.66%
RLX 0.12% 0.01%
RUC 0.77% 6.62%
RUB 3.28% 13.76%
RUA 1.09% 3.16%
RVC 1.68% 2.93%
RVB 9.68% 6.50%
RVA 4.20% 2.08%
RHC 9.67% 3.55%
RHB 10.32% 1.36%
RHA 4.92% 1.18%
RMC 3.62% 1.19%
RMB 7.28% 1.06%
RMA 3.13% 0.57%
RLB 0.19% 0.03%
RLA 0.29% 0.02%
SE3 2.65% 0.89%
SE2 4.05% 1.78%
SE1 0.19% 0.08%
SSC 1.41% 0.48%
SSB 2.09% 0.46%
SSA 3.11% 0.73%
CC2 0.17% 0.11%
CC1 0.60% 0.28%
CB2 0.51% 0.24%
CB1 1.95% 0.65%
CA2 0.56% 0.19%
CA1 2.17% 0.51%
IB2 0.04% 0.01%
IB1 0.24% 0.08%
IA2 0.01% 0.00%
IA1 0.15% 0.07%
BB2 0.00% 0.00%
BB1 0.02% 0.00%
BA2 0.00% 0.00%
BA1 0.03% 0.01%
PE2 0.03% 0.03%
PE1 0.22% 0.17%
PD2 0.10% 0.04%

13
PD1 0.51% 0.25%
PC2 0.01% 0.00%
PC1 0.08% 0.03%
PB2 0.01% 0.00%
PB1 0.11% 0.03%
PA2 0.01% 0.01%
PA1 0.23% 0.09%
CONTACT INFORMATION
Author Name: John (Jian) Gao, Barry Fogel and Cheryl Caswell Company: PointRight Inc
Address:
Lexington Office Park 420 Bedford Street Suite 210 Lexington, MA 02420
Main Phone: 781.457.5900
Email:[email protected]