Embed Size (px)
Citation preview

Financial Impacts of Net-Metered PV on Utilities and Ratepayers: A Scoping Study of Two Prototypical U.S. Utilities Primary authors Andrew Satchwell, Andrew Mills, Galen Barbose
Contributing authors Ryan Wiser, Peter Cappers, Naїm Darghouth
Environmental Energy Technologies Division
September 2014
This work was supported by the Office of Energy Efficiency and Renewable Energy (Solar Energy Technologies Office) of the U.S. Department of Energy under Contract No. DE-AC02-05CH11231.
ERNEST ORLANDO LAWRENCE BERKELEY NATIONAL LABORATORY
LBNL-6913E

Disclaimer
This document was prepared as an account of work sponsored by the United States Government. While this document is believed to contain correct information, neither the United States Government nor any agency thereof, nor The Regents of the University of California, nor any of their employees, makes any warranty, express or implied, or assumes any legal responsibility for the accuracy, completeness, or usefulness of any information, apparatus, product, or process disclosed, or represents that its use would not infringe privately owned rights. Reference herein to any specific commercial product, process, or service by its trade name, trademark, manufacturer, or otherwise, does not necessarily constitute or imply its endorsement, recommendation, or favoring by the United States Government or any agency thereof, or The Regents of the University of California. The views and opinions of authors expressed herein do not necessarily state or reflect those of the United States Government or any agency thereof, or The Regents of the University of California.
Ernest Orlando Lawrence Berkeley National Laboratory is an equal opportunity employer.

Financial Impacts of Net-Metered PV on Utilities and Ratepayers: A Scoping Study of Two Prototypical U.S. Utilities
Prepared for the Office of Energy Efficiency and Renewable Energy
Solar Energy Technologies Office U.S. Department of Energy
Primary Authors
Andrew Satchwell, Andrew Mills, Galen Barbose
Contributing Authors
Ryan Wiser, Peter Cappers, Naїm Darghouth
Ernest Orlando Lawrence Berkeley National Laboratory 1 Cyclotron Road, MS 90R4000
Berkeley CA 94720-8136
September 2014
This work was supported by the Office of Energy Efficiency and Renewable Energy (Solar Energy Technologies Office) of the U.S. Department of Energy under Contract No. DE-AC02-05CH11231.

ii
Acknowledgements
This work was supported by the Office of Energy Efficiency and Renewable Energy (Solar Energy Technologies Office) of the U.S. Department of Energy under Contract No. DE-AC02-05CH11231. We would particularly like to thank Elaine Ulrich, Kelly Knutsen, Christina Nichols, and Minh Le of the U.S. Department of Energy (US DOE) for their support of this project, and for supporting development of the financial model used in this study, we would like to thank Larry Mansueti (US DOE). For providing comments on a draft of the report, the authors would like to thank Susan Buller, Michael Bogyo, and Walter Campbell (Pacific Gas & Electric), Beth Chacon (Xcel Energy), Leland Snook (Arizona Public Service), Mike Taylor and Ted Davidovich (Solar Electric Power Association), Rick Gilliam (Vote Solar), Ron Binz (Public Policy Consulting), Ron Lehr (America’s Power Plan), Steve Kihm (Energy Center of Wisconsin), Carl Linvill (Regulatory Assistance Project), Tim Woolf and Jennifer Kallay (Synapse Energy Economics), Michele Chait (Energy and Environmental Economics), Sonia Aggarwal (Energy Innovation), Warren Leon (Clean Energy Group), Lisa Schwartz (Lawrence Berkeley National Laboratory), Aliza Wasserman (National Governors Association), Virginia Lacy (Rocky Mountain Institute), Wilson Rickerson (Meister Consultants Group), Joseph Wiedman (Keyes, Fox & Wiedman LLP), Rebecca Johnson (Western Interstate Energy Board), Ammar Qusaibaty and Daniel Boff (Mantech, contractor to the US DOE SunShot Program), and Cynthia Wilson (US DOE). Of course, any remaining omissions or inaccuracies are our own.
We would also like to thank and acknowledge members of the Project Advisory Group for their valuable feedback and input throughout the entire project:
Justin Baca Solar Energy Industry Association (SEIA) Lori Bird National Renewable Energy Laboratory (NREL) Nadav Enbar Electric Power Research Institute (EPRI) Miles Keogh National Association of Regulatory Utility Commissions (NARUC) Kelly Knutsen U.S. Department of Energy, SunShot Program Virginia Lacy Rocky Mountain Institute (RMI) Carl Linvill Regulatory Assistance Project (RAP) Eran Mahrer Solar Electric Power Institute (SEPA) Christina Nichols U.S. Department of Energy, SunShot Program Lindsey Rogers Electric Power Research Institute (EPRI) Richard Sedano Regulatory Assistance Project (RAP) Tom Stanton National Regulatory Research Institute (NRRI) Joseph Wiedman Keyes, Fox & Wiedman LLP

iii
Table of Contents
Acknowledgements ......................................................................................................................... ii
Table of Contents ........................................................................................................................... iii
List of Figures ..................................................................................................................................v
List of Tables ................................................................................................................................. vi
Acronyms ...................................................................................................................................... vii
Executive Summary ..................................................................................................................... viii
1. Introduction ................................................................................................................................1
2. Model Description .....................................................................................................................5
3. Prototypical Utilities without Customer-Sited PV .....................................................................83.1 Southwestern vertically integrated utility ....................................................................... 8 3.2 Northeastern wires-only utility and default service provider ....................................... 12
4. Base Case Results: How does customer-sited PV impact utility shareholders andratepayers? ...............................................................................................................................16 4.1 Customer-Sited PV Penetration Assumptions .............................................................. 16 4.2 Impacts on Retail Sales and Peak Demand ................................................................... 17 4.3 Impacts on Utility Costs................................................................................................ 18
4.3.1 Modeling the Impacts on Generation Costs ..................................................... 18 4.3.2 Modeling the Impacts on T&D Costs ............................................................... 20 4.3.3 Total Reduction in Utility Costs ....................................................................... 21 4.3.4 Implied Avoided Cost of PV ............................................................................ 22
4.4 Impacts of PV on Collected Revenues .......................................................................... 23 4.5 Impacts of PV on ROE ................................................................................................. 24 4.6 Impacts of PV on Earnings ........................................................................................... 26 4.7 Impacts of PV on Average Retail Rates ....................................................................... 28
5. Sensitivity Results: How do the impacts of PV depend on the utility operating andregulatory environment and other key assumptions? ...............................................................31 5.1 The direction of the impacts is generally consistent across the sensitivities considered,
though the magnitude varies considerably ................................................................... 32 5.2 The financial impacts of customer-sited PV are particularly sensitive to the capacity
value and avoided T&D costs of PV, with divergent implications for ratepayers vs. shareholders .................................................................................................................. 34
5.3 Low load growth exacerbates the impacts of customer-sited PV on rates and ROE .... 38 5.4 Shareholder impacts are more severe with retail rates that rely predominantly on
volumetric energy charges and less severe when rates have larger fixed charges ....... 40

iv
5.5 Greater lag between when a utility incurs costs and when those costs are reflected in new rates heightens the impacts of PV on utility shareholders, but mutes the impacts on ratepayers ................................................................................................................. 41
5.6 Shareholder and ratepayer impacts from PV vary modestly across the range of cost-related assumptions examined ...................................................................................... 43
6. Mitigation Results: To what extent can the impacts of PV be mitigated through regulatoryand ratemaking measures? .......................................................................................................45 6.1 Decoupling and LRAM can moderate the ROE impacts from PV, though their
effectiveness depends critically on design and utility characteristics .......................... 46 6.2 Shareholder incentive mechanisms may be used to create utility earnings opportunities
from customer-sited PV ................................................................................................ 49 6.3 Alternative ratesetting approaches may also significantly mitigate ROE impacts from
customer-sited PV ........................................................................................................ 51 6.4 Increased fixed customer charges and demand charges can moderate the impact of PV
on shareholder ROE, but in some cases may exacerbate those impacts ...................... 53 6.5 Utility ownership of customer-sited PV may offer sizable earnings opportunities,
potentially offsetting much of the earnings impacts from PV that otherwise occur .... 56 6.6 Automatically counting customer-sited PV towards RPS compliance can substantially
mitigate the rate impacts from PV ................................................................................ 58
7. Conclusion ...............................................................................................................................607.1 Policy Implications ....................................................................................................... 60 7.2 Future Research ............................................................................................................ 61
References ......................................................................................................................................63
Appendix A: Utility Characterization Key Inputs .........................................................................70
Appendix B. PV Characterization .................................................................................................72
Appendix C. Base Case Results ....................................................................................................75
Appendix D: Sensitivity Analysis Results ....................................................................................77
Appendix E: Mitigation Analysis Results .....................................................................................91
v
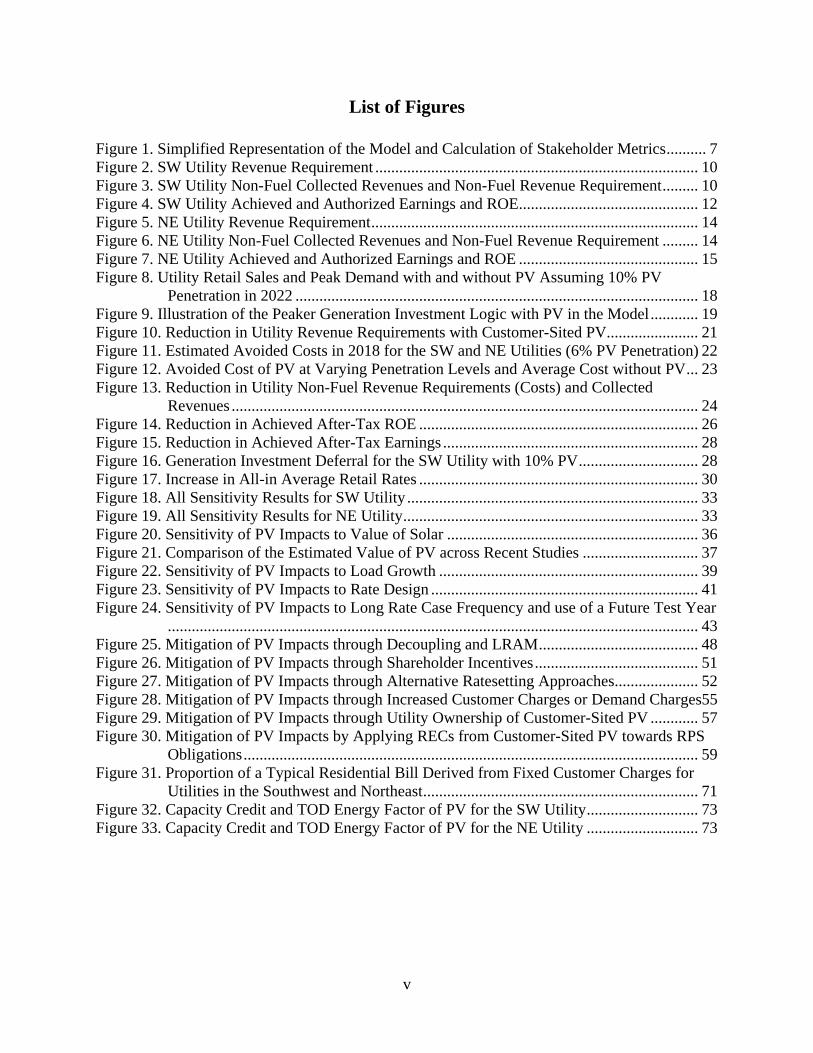
List of Figures
Figure 1. Simplified Representation of the Model and Calculation of Stakeholder Metrics .......... 7 Figure 2. SW Utility Revenue Requirement ................................................................................. 10 Figure 3. SW Utility Non-Fuel Collected Revenues and Non-Fuel Revenue Requirement ......... 10 Figure 4. SW Utility Achieved and Authorized Earnings and ROE ............................................. 12 Figure 5. NE Utility Revenue Requirement .................................................................................. 14 Figure 6. NE Utility Non-Fuel Collected Revenues and Non-Fuel Revenue Requirement ......... 14 Figure 7. NE Utility Achieved and Authorized Earnings and ROE ............................................. 15 Figure 8. Utility Retail Sales and Peak Demand with and without PV Assuming 10% PV
Penetration in 2022 ..................................................................................................... 18 Figure 9. Illustration of the Peaker Generation Investment Logic with PV in the Model ............ 19 Figure 10. Reduction in Utility Revenue Requirements with Customer-Sited PV ....................... 21 Figure 11. Estimated Avoided Costs in 2018 for the SW and NE Utilities (6% PV Penetration) 22 Figure 12. Avoided Cost of PV at Varying Penetration Levels and Average Cost without PV ... 23 Figure 13. Reduction in Utility Non-Fuel Revenue Requirements (Costs) and Collected
Revenues ..................................................................................................................... 24 Figure 14. Reduction in Achieved After-Tax ROE ...................................................................... 26 Figure 15. Reduction in Achieved After-Tax Earnings ................................................................ 28 Figure 16. Generation Investment Deferral for the SW Utility with 10% PV .............................. 28 Figure 17. Increase in All-in Average Retail Rates ...................................................................... 30 Figure 18. All Sensitivity Results for SW Utility ......................................................................... 33 Figure 19. All Sensitivity Results for NE Utility .......................................................................... 33 Figure 20. Sensitivity of PV Impacts to Value of Solar ............................................................... 36 Figure 21. Comparison of the Estimated Value of PV across Recent Studies ............................. 37 Figure 22. Sensitivity of PV Impacts to Load Growth ................................................................. 39 Figure 23. Sensitivity of PV Impacts to Rate Design ................................................................... 41 Figure 24. Sensitivity of PV Impacts to Long Rate Case Frequency and use of a Future Test Year
..................................................................................................................................... 43 Figure 25. Mitigation of PV Impacts through Decoupling and LRAM ........................................ 48 Figure 26. Mitigation of PV Impacts through Shareholder Incentives ......................................... 51 Figure 27. Mitigation of PV Impacts through Alternative Ratesetting Approaches ..................... 52 Figure 28. Mitigation of PV Impacts through Increased Customer Charges or Demand Charges55 Figure 29. Mitigation of PV Impacts through Utility Ownership of Customer-Sited PV ............ 57 Figure 30. Mitigation of PV Impacts by Applying RECs from Customer-Sited PV towards RPS
Obligations .................................................................................................................. 59 Figure 31. Proportion of a Typical Residential Bill Derived from Fixed Customer Charges for
Utilities in the Southwest and Northeast ..................................................................... 71 Figure 32. Capacity Credit and TOD Energy Factor of PV for the SW Utility ............................ 73 Figure 33. Capacity Credit and TOD Energy Factor of PV for the NE Utility ............................ 73

vi
List of Tables
Table 1. Prototypical Utility Characterization: Key Inputs ............................................................ 8 Table 2. Sources of Modeled Reductions in Utility Costs from Customer-Sited PV ................... 21 Table 3. Sensitivity Cases ............................................................................................................. 31 Table 4. Value of PV Sensitivity Case Assumptions .................................................................... 34 Table 5. Average Avoided Costs across Value of PV Sensitivity Cases (20-yr) ......................... 35 Table 6. Load Growth Assumptions in the Low and High Load Growth Sensitivities (CAGR) . 38 Table 7. Rate Design Sensitivity Cases (Percent of Total Utility Revenues, without PV) ........... 40 Table 8. Mitigation Cases and Targeted Intent ............................................................................. 45 Table 9. Rate Design Mitigation Cases (Percent of Total Utility Revenues) ............................... 54
vii
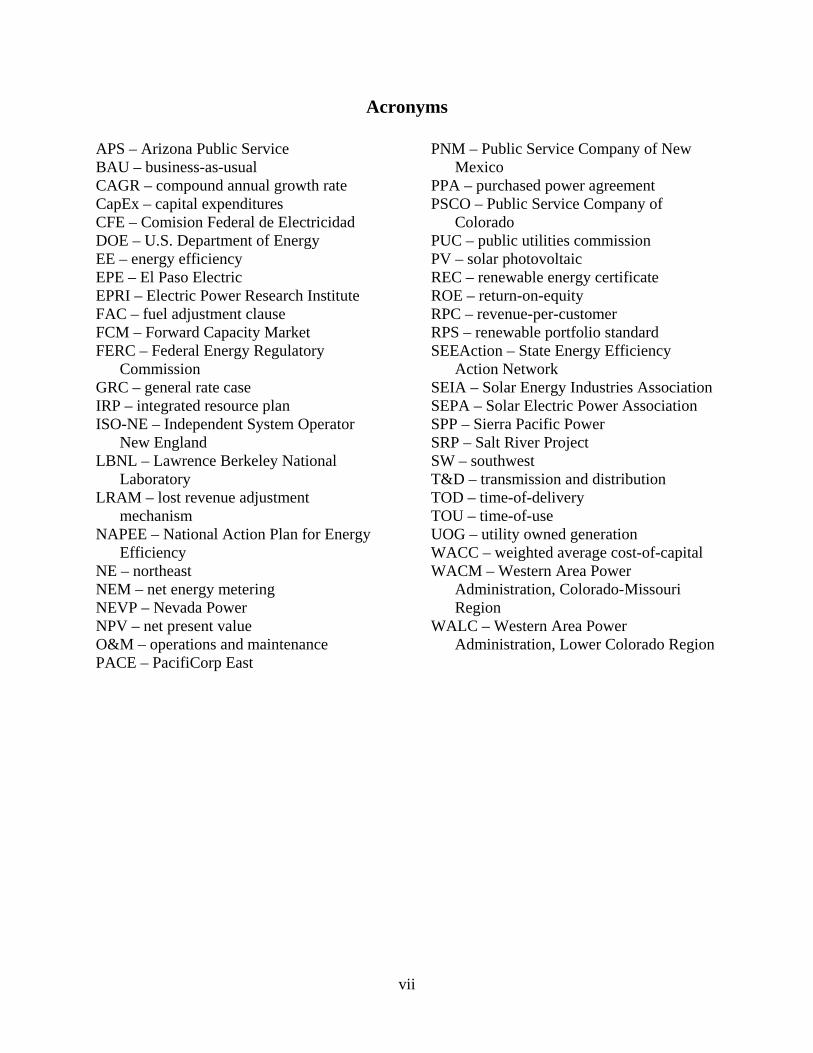
Acronyms
APS – Arizona Public Service BAU – business-as-usual CAGR – compound annual growth rate CapEx – capital expenditures CFE – Comision Federal de Electricidad DOE – U.S. Department of Energy EE – energy efficiency EPE – El Paso Electric EPRI – Electric Power Research Institute FAC – fuel adjustment clause FCM – Forward Capacity Market FERC – Federal Energy Regulatory
Commission GRC – general rate case IRP – integrated resource plan ISO-NE – Independent System Operator
New England LBNL – Lawrence Berkeley National
Laboratory LRAM – lost revenue adjustment
mechanism NAPEE – National Action Plan for Energy
Efficiency NE – northeast NEM – net energy metering NEVP – Nevada Power NPV – net present value O&M – operations and maintenance PACE – PacifiCorp East
PNM – Public Service Company of New Mexico
PPA – purchased power agreement PSCO – Public Service Company of
Colorado PUC – public utilities commission PV – solar photovoltaic REC – renewable energy certificate ROE – return-on-equity RPC – revenue-per-customer RPS – renewable portfolio standard SEEAction – State Energy Efficiency
Action Network SEIA – Solar Energy Industries Association SEPA – Solar Electric Power Association SPP – Sierra Pacific Power SRP – Salt River Project SW – southwest T&D – transmission and distribution TOD – time-of-delivery TOU – time-of-use UOG – utility owned generation WACC – weighted average cost-of-capital WACM – Western Area Power
Administration, Colorado-Missouri Region
WALC – Western Area Power Administration, Lower Colorado Region

viii
Executive Summary
Deployment of customer-sited photovoltaics (PV) in the United States has expanded rapidly in recent years, driven in part by public policies premised on a range of societal benefits that PV may provide. With the success of these efforts, heated debates have surfaced in a number of U.S. states about the impacts of customer-sited PV on utility shareholders and ratepayers, and such debates will likely become only more pronounced and widespread as solar costs continue to decline and deployment accelerates. To inform these discussions, we performed a scoping analysis to quantify the financial impacts of customer-sited PV on utility shareholders and ratepayers and to assess the potential efficacy of various options for mitigating those impacts.
The analysis relied on a pro-forma utility financial model that Lawrence Berkeley National Laboratory previously developed for the purpose of analyzing utility shareholder and ratepayer impacts of utility-sponsored energy efficiency programs. Using this model for the present study, we quantified the impacts of net-metered PV for two prototypical investor-owned utilities: a vertically integrated utility located in the southwest (SW) and a wires-only utility and default service supplier located in the northeast (NE). For each utility, we modeled the potential impacts of PV over a 20-year period, estimating changes to utility costs, revenues, average rates, and utility shareholder earnings and return-on-equity (ROE). The analysis is thus focused on utility shareholder and ratepayer impacts, and thus does not consider all relevant aspects of these debates. Other important boundaries of the study scope and methods (and potential sources of misinterpretation) are highlighted in Text Box 1 within the main body of the report.
The utility shareholder and ratepayer impacts of customer-sited PV were first assessed under a set of base-case assumptions related to each utility’s regulatory and operating environment, in order to establish a reference point against which sensitivities and potential mitigation strategies could be measured.1 The base-case analyses were performed with total penetration of customer-sited PV rising over time to stipulated levels ranging from 2.5% to 10% of total retail sales (compared to current penetration levels of 0.2% for the U.S. as a whole and of roughly 2% for utilities with the highest penetrations, excluding Hawaii).2 Each of these PV penetration cases were compared to a scenario with no customer-sited PV over the entire analysis period. Although the estimated impacts of customer-sited PV reflect an assumption of net metering, those impacts should not be attributed to net metering, per se, as some amount of customer-sited PV deployment could occur even in the absence of net metering.
Key findings from the base-case analysis are as follows:
• Utility Costs and Revenues. Customer-sited PV reduces both utility revenues and costs(i.e., revenue requirements). In the case of the SW Utility, the impacts on revenues and costsare roughly equivalent under the 2.5% PV penetration scenario. At higher PV penetration
1 See Sections 3 and 4 for a full description of base-case assumptions. Variations around these and other base-case assumptions are explored within the sensitivity analysis. 2 Specifically, penetration of customer-sited PV rises from zero in year-1 to levels ranging from 2.5% to 10% of retail sales in year-10, and then remains constant as a percentage of retail sales for the latter 10 years of the 20-year analysis period. This approach was taken in order to capture end-effects that occur after PV additions take place.

ix
levels, however, revenue reductions exceed cost reductions, in part because of a declining marginal value of PV. In the case of the NE Utility, revenue reductions exceed cost reductions across all of the future PV penetration levels considered, and the divergence is considerably wider than for the SW Utility. This occurs because the NE Utility has higher assumed growth in certain fixed costs that customer-sited PV does not reduce.
• Achieved ROE. Impacts on achieved shareholder ROE varied by utility and PV penetrationlevel (see Figure ES-1). Under the scenario with PV penetration rising to 2.5% of retail sales(roughly the same order of magnitude as the current largest state markets), average achievedshareholder ROE was reduced by 2 basis points (a 0.3% decline in shareholder returns) forthe SW utility and by 32 basis points (5%) for the NE Utility. Under the more aggressive10% PV penetration scenario, average ROE fell by 23 basis points (3%) for the SW Utilityand by 125 basis points (18%) for the NE Utility. These ROE reductions occur because ofthe proportionally larger effect of customer-sited PV on utility revenues than on utility costs,under our base-case assumptions. ROE impacts were larger for the wires-only NE utility,because of both its higher assumed growth in fixed costs and its proportionally smallerratebase (as it does not own generation and transmission).
• Achieved Earnings. The impact of customer-sited PV on shareholder earnings for the SWUtility was somewhat more pronounced than the ROE impacts, because of lost earningsopportunities associated with deferred capital expenditures that would otherwise generateearnings for shareholders. Under the 2.5% PV penetration scenario, average earnings for theSW Utility were reduced by 4% (compared to a 0.3% reduction in ROE). Because of thelumpy nature of capital investments and the way in which they change the timing of generalrate cases (GRCs) and setting of new rates, those earnings impacts do not necessarily scalewith the penetration of customer-sited PV; under the 10% PV penetration scenario, earningsfor the SW Utility were reduced by 8%. Because the NE Utility does not own generation ortransmission, the lost earnings opportunities from customer-sited PV are less severe, and thusimpacts on earnings are similar to impacts on ROE, ranging from a 4% reduction under thelow-end PV penetration scenario to a 15% reduction in earnings at the high-end PVpenetration scenario. 3
• Average Rates. The ratepayer impacts of customer-sited PV were relatively modestcompared to the impacts on shareholders. In the 2.5% PV penetration scenario, customer-sited PV led to a 0.1% increase in average rates for the SW Utility and a 0.2% increase forthe NE Utility. Under the more aggressive 10% PV penetration scenario, average rates roseby 2.5% and 2.7% for the SW and NE Utilities, respectively. These rate impacts reflect thenet impact of customer-sited PV on utility costs and sales, where reduced costs are spreadover a smaller sales base. Note, though, that these impacts represent the increases in averagerates across all customers, including those with and without PV, and thus do not measurecost-shifting, per se.
3 The prototypical NE Utility in our analysis may present a case where the ROE of future investments does not cover the cost of equity, in which case the deferral of future capital investments would benefit shareholders; however, a cost of equity test, which is beyond the scope of this study, would be required to make such a determination.

x
Figure ES-1. Impacts of Customer-Sited PV on Average Achieved ROE, Earnings, and All-in Retail Rates
One key objective of this scoping study was to illustrate the extent to which the potential impacts of customer-sited PV on utility shareholders and ratepayers depend on underlying conditions of the utility. To explore these inter-relationships, we compared the impacts from PV under a wide array of sensitivity cases, each with varying assumptions about the utilities’ operating or regulatory environment (see Table 3 in the main body for the full list of sensitivity cases). The sensitivity cases all focus specifically on impacts from customer-sited PV at a penetration level
SW Utility NE Utility R
OE
E
arni
ngs
Ret
ail R
ates
-2%
-1%
-0%
-3%
7.0% 7.5% 8.0% 8.5% 9.0%
10%
7.5%
5%
2.5%
0%
Achieved After-Tax ROE (Avg.; 10-yr)
Cust
omer
Dem
and
Met
With
PV
by 2
022
-14%
-9%
-5%
-18%
5.0% 5.5% 6.0% 6.5% 7.0%
10%
7.5%
5%
2.5%
0%
Achieved After-Tax ROE (Avg.; 10-yr)
Cust
omer
Dem
and
Met
With
PV
by 2
022
-8%
-8%
-4%
-4%
$5,500 $5,750 $6,000 $6,250 $6,500
10%
7.5%
5%
2.5%
0%
Achieved After-Tax Earnings ($M NPV; 20-yr)
Cust
omer
Dem
and
Met
With
PV
by 2
022
-15%
-12%
-9%
-4%
$500 $550 $600 $650 $700
10%
7.5%
5%
2.5%
0%
Achieved After-Tax Earnings ($M NPV; 20-yr)
Cust
omer
Dem
and
Met
With
PV
by 2
022
2.5%
1.3%
1.0%
0.0%
14.0 14.2 14.4 14.6 14.8
10%
7.5%
5%
2.5%
0%
All-in Average Retail Rates (cents/kWh; 20-yr)
Cust
omer
Dem
and
Met
With
PV
by 2
022
2.7%
1.5%
0.7%
0.2%
19.0 19.2 19.4 19.6 19.8
10%
7.5%
5%
2.5%
0%
All-in Average Retail Rates (cents/kWh; 20-yr)
Cust
omer
Dem
and
Met
With
PV
by 2
022

xi
of 10% of total retail sales. This is the highest penetration level examined within this study, and was used for the sensitivity cases in order to most clearly reveal the underlying relationships between the impacts of PV and the sensitivity variables (that is, to distinguish the signal from the noise). Were lower PV penetration levels assumed, the impacts of PV would be smaller and the ranges across sensitivity cases would be narrower, but the fundamental results would be qualitatively the same.
SW Utility NE Utility
Figure ES-2. Impacts of Customer-Sited PV across Sensitivity Cases
Key themes and relationships illustrated through the sensitivity analysis are as follows4:
• The magnitude of shareholder impacts varies considerably across the sensitivity cases, asillustrated in Figure ES-2. Specifically, achieved earnings were reduced by 5% to 13% forthe SW utility and by 6% to 41% for the NE utility, with similar ranges in the impacts onachieved ROE, illustrating the degree to which these impacts potentially depend on utility-specific conditions. By comparison, the ratepayer impacts were relatively stable acrosssensitivity cases, with increases in average rates ranging from 0% to 4% for the SW utilityand from 1% to 4% for the NE utility.
• The impacts to both prototypical utilities are particularly sensitive to the capacity value andavoided T&D costs from customer-sited PV. Important to note, however, is the divergent setof implications for ratepayers vs. shareholders. The greater the capacity value and avoidedT&D costs from PV, the greater the deferral of utility capital expenditures. This reduces theimpacts of customer-sited PV on retail rates. Indeed, under one set of assumptions for theSW Utility, customer-sited PV results in a slight decrease in average rates. For utilityshareholders, however, increased deferral of capital expenditures leads to greater erosion ofearnings.
4 The focus of our sensitivity analysis is on how the metrics vary between cases with and without PV and how the size of that difference varies depending upon underlying utility conditions, not on how the absolute level of the shareholder and ratepayer metrics varies between sensitivity cases.
-50%
-40%
-30%
-20%
-10%
0%
10%
ROE Earnings Rates
Chan
ge fr
om N
o-PV
to 1
0% P
V
Sensitivity RangeBase Case
-50%
-40%
-30%
-20%
-10%
0%
10%
ROE Earnings Rates

xii
• The impact of customer-sited PV on average retail rates also depends on underlying loadgrowth (prior to the effects of PV on load). With lower load growth, as may occur in thecase of a utility with aggressive energy efficiency programs, customer-sited PV results in alarger increase in average retail rates, because of the smaller base of retail sales over whichfixed costs must be recovered, and because of reduced opportunity for cost savings fromdeferred capital expenditures. Shareholder impacts from customer-sited PV can also besensitive to underlying load growth, though those relationships are complex and can beidiosyncratic depending upon details of the particular utility and the choice of metric used.
• The shareholder impacts of customer-sited PV tend to be more severe when retail rates relypredominantly on volumetric energy charges and also tend to be more severe when longerlags exist within the ratemaking process (e.g., longer periods between rate cases or use ofhistoric test years). The heightened shareholder impacts in these cases occur because ofgreater revenue erosion associated with PV.
• The shareholder and ratepayer impacts from customer-sited PV also depend, though often toa lesser extent, on the magnitude and growth rates of various utility cost elements; however,the degree and direction of those sensitivities depend on the type of cost and how it isrecovered. For example, the erosion of shareholder profitability from customer-sited PV isunaffected by fuel costs (assuming they are a pass-through), but may be highly sensitive tocapacity costs for utility-owned generation.
Finally, we analyzed a number of (though by no means all) options for mitigating the possible impacts of customer-sited PV on utility shareholders and ratepayers (see Table ES-1). As in the sensitivity analysis, we again focused on the impacts under the 10% PV penetration scenario, in order to most clearly reveal the effects of the mitigation measures considered. These mitigation scenarios borrow, to some degree, from the kinds of measures that have been implemented or suggested in connection with energy efficiency programs. Most target shareholder impacts associated with either revenue erosion or lost earnings opportunities from customer-sited PV, and in some cases may exacerbate the ratepayer impacts from customer-sited PV.
Table ES-1. Mitigation Measures Examined in This Study
Mitigation Measure Revenue Erosion
Lost Earnings Opportunities Increased Rates
Revenue-per-Customer (RPC) Decoupling ● ○ Lost Revenue Adjustment Mechanism (LRAM) ● ○ More Frequent Rate Cases ● ○ No Regulatory Lag ● ○ Current & Future Test Years ● ○ Increased Demand Charge & Fixed Charge ● ○ Shareholder Incentive ● ○ Utility Ownership of Customer-Sited PV ● ○ Customer-Sited PV Counted toward RPS ● ● Primary intended target of mitigation measure○ May exacerbate impacts of customer-sited PV

xiii
Key themes and findings from the analysis of mitigation options include the following:
• Decoupling and lost-revenue adjustment mechanisms may moderate revenue erosion fromcustomer-sited PV, and thereby mitigate its impacts on shareholder ROE and earnings;however, the size (and even direction) of impact varies greatly depending upon the design ofthese mechanisms and characteristics of the utility. Depending on the utility’s underlyingrate of cost growth, similar outcomes may also be achieved by transitioning to more-frequentrate cases, use of current or future test years, and reduced regulatory lag. However, to theextent that these various mitigation measures serve to restore shareholder ROE and earnings,they may entail some corresponding increase in average retail rates, exemplifying the kind oftradeoffs inherent in many potential mitigation measures.
• Increased fixed customer charges or demand charges may also moderate revenue erosion,and the associated impacts on shareholder ROE and earnings, from customer-sited PV.Importantly, though, the effectiveness of those measures depends critically on the underlyinggrowth in the number of customers or customer demand. For the prototypical NE utility inour analysis, a shift in revenue collection from volumetric energy charges towards largerfixed customer charges (when implemented for all customers, not just those with PV)actually exacerbates the erosion of shareholder ROE, due to the low rate of growth in thenumber of utility customers relative to growth in sales. Moreover, such shifts in rate designare not without other consequences, including that they dampen incentives for customers toinvest in energy efficiency and PV.
• Shareholder incentive mechanisms, similar to those often implemented in conjunction withutility-administered energy efficiency programs, as well as utility ownership or financing ofcustomer-sited PV, both offer the potential for substantial shareholder earning opportunities,though the associated policy and regulatory issues may be significant. The significance ofthe potential earnings boost is most pronounced for wires-only utilities with otherwiselimited investment opportunities: in the case of the NE Utility in our analysis, nearly all ofthe earnings erosion that would otherwise occur as a result of customer-sited PV is offset in ascenario where the utility owns just one-tenth of the customer-sited PV deployed in itsservice territory offsets.
• Allowing utilities to automatically apply all net-metered PV towards their RPS obligations,without providing any explicit payment to the customer, has the potential to substantiallymitigate the rate impacts from PV. However, such an approach is not without tradeoffs, as iteffectively entails transferring ownership of renewable energy certificates (RECs) as acondition of service under net metering, and it achieves cost savings by, in effect, reducingthe amount of incremental renewable generation required to comply with the RPS.
Policy Implications and Areas for Further Research
In summary, the findings from this scoping study point towards several high-level policy implications. First, even at 10% PV penetration levels, which are substantially higher than exist

xiv
today, the impact of customer-sited PV on average retail rates may be relatively modest (at least from the perspective of all ratepayers, in aggregate5). At a minimum, the magnitude of the rate impacts estimated within our analysis suggest that, in many cases, utilities and regulators may have sufficient time to address concerns about the rate impacts of PV in a measured and deliberate manner. Second and by comparison, the impacts of customer-sited PV on utility shareholder profitability are potentially much more pronounced, though they are highly dependent upon the specifics of the utility operating and regulatory environment, and therefore warrant utility-specific analysis. Finally, we find that the shareholder (and, to a lesser extent, ratepayer) impacts of customer-sited PV may be mitigated through various “incremental” changes to utility business or regulatory models, though the potential efficacy of those measures varies considerably depending upon both their design and upon the specific utility circumstances. Importantly, however, these mitigation strategies entail tradeoffs – either between ratepayers and shareholders or among competing policy objectives – which may ultimately necessitate resolution within the context of broader policy- and rate-making processes, rather than on a stand-alone basis.
As a scoping study, one final objective of this work is to highlight additional questions and issues worthy of further analysis, many of which will be addressed through follow-on work to this study and further refinements to LBNL’s utility financial model. Although by no means an exhaustive list, these areas for future research include examining: the relative impacts of customer-sited PV compared to other factors that may impact utility profitability and customer rates; the combined impacts of customer-sited PV, aggressive energy efficiency, and other demand-side measures; the rate impacts of customer-sited PV and various mitigation measures specifically on customers without PV and differences among customer classes; a broader range of mitigation options; potential strategies for maximizing the avoided costs of customer-sited PV; and continued efforts to improve the methods and data required to develop reliable and actionable estimates of the avoided costs of customer-sited PV.
5 We do not evaluate rate impacts for individual customer classes or rate classes, and the average rate impacts described within this report may not capture more substantial impacts that could occur within individual customer or rate classes.

1
1. Introduction
Electricity generation from customer-sited photovoltaic (PV) systems currently constitutes just 0.2% of total U.S. electricity consumption, though it has reached higher penetration levels in various states and utility service territories, and has grown at a rapid pace of roughly 50% per year over the past decade.6 This recent growth has been fueled by a combination of falling PV system prices, the advent of customer financing options, and various forms of policy support at the federal, state, and local levels that are premised on the range of societal benefits that PV may provide. One critical element in the value proposition has been net energy metering (NEM or simply “net metering”), a billing mechanism that allows customers to export electricity generated by their PV systems to the grid and apply that excess generation against electricity consumption at other times, in effect receiving credit for all PV generation at the prevailing retail electric rate.
Heated debates surrounding the financial impact of customer-sited PV and net metering on utility shareholders and ratepayers have surfaced in a number of states, and these will likely become more widespread as solar deployment expands, and as states approach statutory caps on the allowed amount of net-metered PV.7 Utility executives are often concerned about revenue erosion and reduced shareholder returns when customers with net-metered PV are able to avoid charges for fixed infrastructure costs, as well as potential cost-shifting between solar and non-solar customers. At the same time, net metering is viewed as essential by customers with PV to protect their investments, by the solar industry to grow their businesses, and by states and environmental advocates to achieve climate or other environmental policy goals. To date, however, progress on these issues has been hampered by a lack of evidence about the magnitude of the financial impacts on utility shareholders and ratepayers, the conditions under which those impacts may become more or less significant, and the efficacy of potential mitigation options.
Debates about net metering are taking place against the backdrop of a larger set of discussions about existing utility business and regulatory models. One dimension of those broader discussions has focused on the poor alignment between the traditional utility business model – whereby utility profits are closely tied to their volume of sales and capital investments – and recent advances in technology and public policy driving growth of demand-side resources, which tend to reduce sales and opportunities for capital investments (Kind 2013, Fox-Penner 2010). Arguably the greatest progress on those issues has occurred with respect to utility ratepayer-funded energy efficiency (EE) programs, where the unintended consequences of the “utility throughput incentive” to increase sales and add capital investments to the utility’s ratebase have been long-recognized and a variety of regulatory tools have been developed and deployed to better align utility financial interests with EE goals (Wiel 1989, Moskovitz et al. 1992, Eto et al.
6 The highest state-level penetration rates for customer-sited PV are in Hawaii (3.8% of retail electricity sales at year-end 2013), New Jersey (1.7%), and California (1.1%), while the highest penetration rates for individual investor-owned utilities are for the three largest Hawaii utilities (5.1%-6.0%), Pacific Gas & Electric (2.3%), San Diego Gas & Electric (2.0%), and Arizona Public Service (2.0%). These values are derived from data on customer-sited PV capacity installed through year-end 2013, as reported by GTM/SEIA (2014) and by SEPA (2014). 7 Recent challenges to existing net metering tariffs have been raised in regulatory proceedings in Arizona, California, Colorado, Georgia, Idaho, Louisiana, and Nevada (among others); and issues related to the potential rate impacts or cost-shifting from net metering have been prominently featured within energy policy forums (Borenstein 2013) and among major news outlets (Cardwell 2013, Tracy 2013).

2
1994, Harrington et al. 1994, Stoft et al. 1995, Kushler et al. 2006, NAPEE 2007). Among the goals of the present study is to leverage this base of experience and illustrate how some of the same regulatory and ratemaking strategies could also be applied in the context of distributed PV.
As the attention of policymakers and electric industry observers has turned towards customer-sited PV, studies representing a diversity of perspectives have highlighted potential misalignments between net metering and utility cost structures (Brown and Lund 2013, Cai et al. 2013, DOE 2007, Duthu et al. 2014, Graffy and Kihm 2014, SEPA-EPRI 2012, Wood and Borlick 2013). A number of those studies and several others (Bird et al. 2013, Blackburn et al. 2014, Linvill et al. 2013, Kihm and Kramer 2014, Shirley and Taylor 2009) identify regulatory and ratemaking options for mitigating adverse rate impacts from distributed PV, while many others (also) discuss possible broader changes to utility business and regulatory models that are compatible with, or that could facilitate the growth of, distributed PV (EPRI 2014, Hanelt 2013, Harvey and Aggarwal 2013, Lehr 2013, Moskovitz 2000, Newcomb et al. 2013, Nimmons and Taylor 2008, Richter 2013a, Richter 2013b, Rickerson et al. 2014, RMI 2012, RMI 2013, Wiedman and Beach 2013).
Quantitative analyses relating to the financial or economic impacts of customer-sited PV and net metering have thus far consisted mostly of cost-benefit studies performed from the perspective of utility ratepayers or society more broadly; see Hansen et al. (2013) for a meta-analysis of cost-benefit studies and E3 (2014) for a more recent example. The results of those studies hinge on the methods and assumptions used to estimate the value of distributed PV to the utility, and considerable disagreement exists around which particular sources of value to consider and how to quantify them (APPA 2014, Bradford and Hoskins 2013, Cliburn and Bourg 2013, Keyes and Rábago 2013, Stanton and Phelan 2013). Competing studies have thus often led to divergent results (E3 2013, Beach and McGuire 2013). By comparison, few analyses beyond several recent research notes by Wall Street analysts (Dumoulin-Smith et al. 2013, Goldman Sachs Global Investment Research 2013) and a limited base of theoretical work (Oliva and MacGill 2012) have sought to examine the financial implications of net metering for utility shareholders. Moreover, little if any published research has quantitatively compared possible options for mitigating any potential adverse impacts on either utility shareholders or ratepayers.
This report seeks to build upon, and address gaps within, the aforementioned body of research through a scoping analysis that quantifies the potential financial impacts of net-metered PV on utility shareholders and ratepayers. The analysis leverages a pro-forma utility financial model that Lawrence Berkeley National Laboratory (LBNL) developed for the purpose of analyzing the shareholder and ratepayer impacts of utility-sponsored EE programs (Cappers et al. 2009, Cappers and Goldman 2009a, Cappers et al. 2010, Satchwell et al. 2011). Using this model, we quantify the financial impacts of customer-sited PV for two prototypical investor-owned utilities: a vertically integrated utility located in the Southwest and wires-only utility and default service supplier located in the Northeast. For each utility and under a range of PV penetration levels, we model the impact of net-metered PV on utility costs, revenues, average rates, and utility shareholder earnings and return-on-equity (ROE). We examine the sensitivity of those impacts to various aspects of the utility operating and regulatory environment (e.g., load growth, cost growth, the frequency of general rate cases), as well as to alternate assumptions about the value of PV to the utility (i.e., avoided costs). Finally and importantly, we quantify the impact of a

3
number of possible mitigation approaches that might be used to reduce any negative impacts to shareholders and/or ratepayers from growing amounts of customer-sited PV. These mitigation measures include alternative rate designs, utility revenue decoupling, utility ownership of distributed PV, and various other strategies. Key boundaries to the study scope and methods (and potential sources of misinterpretation) are highlighted in Text Box 1. The remainder of the report is organized as follows. Section 2 provides an overview of the utility pro-forma financial model and describes its previous applications. Section 3 identifies key assumptions used to model the two prototypical utilities and presents base-case projections of their costs, revenues, retail rates, and profits without PV. Section 4 presents the corresponding base-case results for the two prototypical utilities under a range of PV penetration levels. Section 5 presents our sensitivity analyses, which illustrate how the utility shareholder and ratepayer impacts of PV are dependent upon various aspects of the utility operating and regulatory environment. Section 6 presents the results of the mitigation analyses, which examine the extent to which any negative financial impacts from distributed PV may be mitigated through a set of regulatory and ratemaking measures. Finally, Section 7 offers a number of policy implications and identifies areas for further research. Additional details about modeling assumptions and results are included in the appendices.

4
Text Box 1. Key Boundaries of the Study Scope and Methods Issues surrounding the impacts of customer-sited PV and net metering are complex, and discussions of these issues are invariably contentious. In the interest of ensuring that the findings from this analysis are interpreted and applied appropriately, we highlight a number of important boundaries of the study scope and methods.
• First, the study is not a detailed analysis of the value of PV. It relies on a financial
model, not a utility production cost or planning model. This financial model contains a relatively high level of detail in its representation of utility ratemaking and revenue collection processes, but less detail in its representation of the physical utility system. As a result, the impacts of distributed PV on utility cost-of-service are based on a coarser set of assumptions than what might be possible with utility operations or planning models. For this reason, we include sensitivity analyses to examine how the financial impacts of PV would vary with alternate assumptions related to avoided costs.
• Second, the model, as configured for this study, captures financial effects at the utility level, not at the customer-class level. As such, we do not directly quantify cost-shifting or cross-subsidization among customer classes, although the modeled impacts on average retail electricity rates may, under many of the scenarios, be considered a proxy for the impacts on non-PV customers. Future follow-up analyses may explore participant/non-participant impacts more explicitly and in greater depth.
• Third, the analysis is focused narrowly on the financial impacts of customer-sited PV on utility shareholders and ratepayers when compensated under net metering. It does not analyze costs and benefits for customers with PV systems, or for society-at-large, and therefore does not consider costs that PV customers incur for their systems nor any broader social benefits (e.g., reduced emissions, economic development, energy security). By limiting the scope of our analysis to net-metered PV, we do not address potential impacts to utility shareholders or ratepayers that may occur under other compensation schemes, nor do we address the impacts that might occur under complete “grid defection”, whereby customers with PV and distributed storage bypass utility service entirely (RMI 2014).
• Fourth, the estimated impacts of customer-sited PV are based on comparisons to scenarios with no customer-sited PV. Thus, even though these impacts reflect an assumption of net metering, they should not be attributed to net metering, per se, as some amount of customer-sited PV deployment could occur even in the absence of net metering.
• Finally, we seek to understand how PV may impact two prototypical utilities along the spectrum of electric utility operating and regulatory environments in the United States. Although our sensitivity analyses capture a broader range of assumptions about utility operating and regulatory environments, we have by no means exhausted all possible combinations of conditions that utilities may face, and thus some care must be taken in generalizing from the results.

5
2. Model Description For the present analysis, we used a pro forma financial model that calculates utility costs and revenues, based on specified assumptions about its physical, financial, operating, and regulatory characteristics (Figure 1). The model was adapted from a tool (the Benefits Calculator) initially constructed to support the National Action Plan on Energy Efficiency (NAPEE) and intended to analyze the financial impacts of EE programs on utility shareholders and ratepayers under alternative utility business models (NAPEE 2007). LBNL has since expanded and applied the enhanced model to evaluate the impact of aggressive EE programs on utilities in the U.S. (Cappers and Goldman, 2009a, 2009b; Cappers et al., 2010; Satchwell et al., 2011). Applications of the LBNL model and analysis of model outputs have been used as part of technical assistance to state public utility commissions (PUCs) considering aggressive EE goals and/or alternative utility business models (e.g., Arizona, Nevada, Massachusetts, and Kansas). The model has also been used to support the State and Local Energy Efficiency Action Network (SEEAction), which builds on the NAPEE effort, with analysis used in workshops and trainings. Through these various applications, the overall structure of the model has been reviewed and vetted by regulators, utility staff, and EE program administrators. We chose to use this model in order to connect the much more extensive analysis of the impacts of EE on utilities to the analysis of the impact of PV on utilities. Within the remainder of this section, we provide a brief overview of the financial model used for the present analysis, first discussing how the model calculates utility costs and revenues and then describing how changes in costs and revenues are used to evaluate the impact of PV on three stakeholder metrics. The three metrics include two utility shareholder metrics (achieved ROE and achieved earnings) and one ratepayer metric (average retail rates).8 The model quantifies the utility’s annual costs and revenues over a 20-year analysis period. Importantly, the model performs all calculations at the total utility level, and does not differentiate among rate classes or between PV participants and non-participants. Utility costs are based on model inputs that characterize current and projected utility costs over the analysis period. Some costs are projected using stipulated compound annual growth rates (CAGRs); other costs are based on schedules of specific investments (e.g., generation expansion plans). The costs cover several categories of the utility’s physical, financial, and operating environment, including fuel and purchased power, operations and maintenance, and capital investments in generation and non-generation assets (i.e., transmission and distribution investments). The model calculates the utility’s ratebase, which grows with additional capital investments and declines with depreciation of existing assets. The model also estimates interest payments for debt used to finance a portion of capital investments and includes taxes on earnings. The details of how we modeled our prototypical utilities’ costs are in Section 3. The utility’s collected revenues are based on retail rates that are set in periodic general rate cases (GRCs) throughout the analysis period (see Figure 1). By default, the model assumes that rate
8 Previous analysis with the same model included a second ratepayer metric: total customer utility bills. In this report, we report utility collected revenues, which is the same as total customer utility bills.

6
cases occur at some specified frequency, though the model also allows the utility to file a GRC when making capital investments of a certain amount or higher. GRCs are used to establish new rates based on the revenue requirement set in a test year (including an authorized ROE for capital investments), the test year billing determinants (i.e., retail sales, peak demand, and number of customers), and assumptions about how the test year revenue requirement is allocated among the billing determinants. The model allows for different types of test years (i.e., historical test years, current test years, and future test years).9 The particular rate design of the utility consists of a combination of a volumetric energy charge ($/kWh), volumetric demand charge ($/kW), and fixed customer charge ($/customer). Model inputs specify the relative size of those three rate components, and can be modified to represent different rate designs. The model used for this study did not have the capability to represent more complex rate designs, such as time-of-use (TOU) pricing or tiered (i.e., inclining or declining block) rates, though future versions of the model will possess that capability. The rates established in a GRC are then applied to the actual billing determinants in future years to calculate utility collected revenue in those years. The model accounts for a period of regulatory lag whereby rates established in a GRC do not go into effect until some specified number of years after the GRC. In between rate cases, certain costs are passed directly to customers through rate-riders (e.g., fuel-adjustment clause [FAC]). Our average all-in retail rate metric, a measure of impacts from the utility customer perspective, reflects the average revenue collected per unit of sales which accounts for periodic setting of new rates, rate-riders, and delays in implementing new rates. The financial performance of the utility is measured by the achieved after-tax earnings and achieved after-tax ROE, both of which are commonly used by utility managers and shareholders.10 We calculated the prototypical utilities’ achieved after-tax ROE in each year as the current year’s earnings divided by current year’s outstanding equity (i.e., the equity portion of the ratebase).11 Achieved after-tax ROE may – and often does – differ from the utility’s authorized ROE, which is established by regulators in a GRC and is used to determine the amount of return a utility can receive on its capital investments. This is because utility rates are set such that the test-year revenue requirement (based on the test year costs and billing determinants) would produce earnings that are sufficient to reach the authorized after-tax ROE. Actual utility revenues and costs may differ from those in the test year, leading to achieved earnings, and hence achieved ROE, that deviates from the authorized level. In general, achieved ROE will be less than authorized ROE if, between rate cases, utility costs grow faster than
9 Many states allow the utility to file an adjustment to its historical test-year costs during a GRC (i.e., pro-forma adjustment period) to update and correct them to better reflect expectations about normal cost levels. 10 ROE is considered to be a measure of how well a company is performing for its shareholders. While a high ROE typically indicates efficient use of shareholder’s money, it is not always the case that a high ROE indicates a stable and profitable business. ROE is dependent on several factors, including the ratio of debt to equity which may artificially inflate a company’s ROE if the company is making investments mostly with debt. ROE is also a useful metric when comparing companies within an industry, because the metric is normalized. 11 The model does not take into account cash flow and changes in financing costs that may result from under- or over-recovery of costs, which may impact ROE.

7
revenues. Conversely, achieved ROE will generally be greater than authorized ROE if, between rate cases, utility costs grow slower than revenues. We calculated the prototypical utilities’ achieved after-tax earnings as collected revenues minus costs in each year. Similar to achieved after-tax ROE, achieved after-tax earnings can be different than the utility’s authorized earnings, because the achieved earnings are based on actual profitability in a given year and the authorized earnings are set in the GRC revenue requirement, based on the authorized ROE.
Figure 1. Simplified Representation of the Model and Calculation of Stakeholder Metrics A key part of analyzing the impact of PV on utility profitability and customer rates is to capture how the addition of PV changes utility costs and billing determinants. In general, PV reduces fuel and purchased power costs, and it can also reduce utility costs related to ongoing and incremental capital expenditures (including return, depreciation, and taxes related to those capital expenditures). In terms of the impacts on billing determinants, PV reduces volumetric sales and customer peak demand, which reduces utility revenues collected on a volumetric basis through energy and demand charges. Changes to utility costs and billing determinants then flow through the model to calculate our key stakeholder metrics. We expand on our characterization of the impact of customer-sited PV on utility costs and billing determinants in Section 4. Aside from the traditional cost-of-service business model, alternative regulatory mechanisms can also be implemented in the model. The model includes the ability to represent decoupling mechanisms (i.e., sales based or revenue-per-customer), lost revenue adjustment mechanisms, and shareholder incentive mechanisms. The model can also analyze alternative ratemaking approaches (e.g., high fixed customer charge) by changing the way utility revenues are collected among different billing determinants. We describe the intent and design of each of these and other alternatives in more detail in Section 6, where they are considered as options to mitigate the impact of PV on utility profitability.

8
3. Prototypical Utilities without Customer-Sited PV Our analysis results are based on characterizations of two prototypical utilities: a vertically integrated utility in the southwest and a wires-only utility and default service supplier in the northeast (see Table 1). The choice of these two prototypical utilities was intended to capture both a broad spectrum of utility operating and regulatory environments, as well as two regions of the United States that have thus far seen the greatest levels of customer-sited PV deployment. In this section, we describe the key assumptions used to model these utilities (with further details included in Appendix A), and present 20-year projections of the utilities’ costs (i.e., revenue requirements), average retail rates, collected revenues, shareholder earnings, and return on equity without PV. These projections represent the base-case utility characterizations; alternate assumptions about various aspects of the utilities’ operating and regulatory environments are explored through the sensitivity analyses in Section 5. Table 1. Prototypical Utility Characterization: Key Inputs Key Input* Southwest Utility Northeast Utility Utility type Vertically integrated Wires-only Asset Ownership Generation, Transmission,
and Distribution Distribution only
2013 Retail Sales Level (CAGR) 30,460 GWh (2.1%) 21,957 GWh (1.4%) 2013 Peak Demand Level (CAGR) 6,531 MW (2.1%) 5,655 MW (1.5%) 2013 Retail Customer Count (CAGR) 1,094,658 (2.7%) 1,239,682 (0.3%) Average Fuel and Purchased Power Costs CAGR 5.6% 6.6% Non-fuel Operations & Maintenance (O&M) Costs CAGR
2.6% 3.4%
2013 Ratebase (net accumulated depreciation) $7.39B $2.03B RPS Compliance Strategy Build & Buy Buy 2013 All-in Retail Rate Level 11.34 ¢/kWh 12.82 ¢/kWh Frequency of General Rate Case (GRC) Filings Every 3 years** Every 3 years Regulatory Lag (i.e., period of time between filing of GRC and when new rates take effect)
1 year 1 year
Test Year Historic Historic Authorized ROE 10.00% 10.35% Debt and Equity Share (Ratio) 46%:54% (0.85) 57%:43% (1.32) Weighted Average Cost-of-Capital (WACC) 8.33% 7.86% * All monetary values and growth rates are expressed in nominal terms ** For the Southwest Utility, we assume that GRCs also occur after any capital investment exceeding $900M. 3.1 Southwestern vertically integrated utility We developed long-range (i.e., 2013-2032) cost and load forecasts for the prototypical Southwestern Utility (“SW Utility”) by starting with data originally provided by Arizona Public Service (APS) staff for a 2009 project (Satchwell et al. 2011) and then updated those forecasts based on information from the 2012 APS Integrated Resource Plan (IRP) and other recent regulatory filings. Various assumptions, like annual energy and peak demand growth, were then further modified in order to create a more generic prototypical southwestern utility. Thus, although data from APS were used to seed the initial utility characterization, the prototypical SW Utility used in this analysis is not intended to represent APS, specifically. When modifying
9
assumptions to reflect regionally representative data, we ensured that those changes were internally consistent with other input assumptions. The SW Utility’s costs and revenues are driven by, among other things, projected load growth, the utility’s capacity expansion plan, compliance with the renewables portfolio standard (RPS), and rate design.12 With respect to load growth, the SW Utility has retail sales of 30,460 GWh and a peak demand of 6,531 MW in 2013 (exclusive of any savings from PV), both of which are forecasted to grow at a compound annual rate of 2.1% per year over the 20-year time horizon. This load growth is representative of SW regional load forecasts (see Appendix A) and is lower than what APS forecasted in its 2012 IRP (i.e., 2.7% annual growth in energy and 2.7% annual growth in peak demand). The SW Utility has a 2013 installed capacity of 4,797 MW of conventional generation, including nuclear, coal, mid-merit gas, and peaking gas units. The SW Utility also has existing and owned renewable generating capacity of 206 MW. The SW Utility purchases capacity through short-term capacity contracts to make up for a shortfall between the installed capacity and the peak load plus a 14% planning reserve margin. The SW Utility follows a generation expansion plan based on the APS 2012 IRP, which assumes incremental capacity additions, periodically adding additional peaking plants and additional mid-merit plants. No utility-owned generation is retired during the analysis period in the base-case, though we examine early retirements of coal generation in one of the sensitivity cases discussed in Section 5. The SW Utility complies with a mandated RPS of 20% retail sales by 2025 through a combination of utility-owned renewable resources and renewable energy purchased power agreements (PPAs). We assumed an RPS requirement larger than the actual APS requirement to reflect more typical requirements of utilities in the southwest. Periodic investments in utility-owned renewable plants are assumed to each contribute 25 MW toward peak demand (e.g. firm capacity) and produce 219 GWh/year of renewable energy. Any remaining shortfall in the RPS requirement is met through signing new renewables PPAs at a contract price of $70/MWh. The amount of utility-scale solar added for the RPS (exclusive of customer-sited PV) varies from year to year, ultimately constituting roughly 6.5% of annual sales by 2022. Thus, the total penetration of solar from both utility-scale and customer-sited PV well exceeds the contribution from customer-sited PV alone.
The SW Utility revenue requirement allocation (i.e. the rate design) is based on typical APS customer bills from its 2011 rate case. The SW Utility collects revenues based on annual retail sales, peak demand, and number of customers. As noted previously, revenue requirements are allocated at the utility-level; we do not separately identify particular rate classes or revenue allocations thereof. Total non-fuel revenues are collected among billing determinants as follows: 16% from customer charges, 14% from demand charges, and 70% from energy charges. This percentage allocation holds constant throughout the analysis period. Total fuel and purchased power revenues are collected exclusively through energy charges, and the SW Utility is assumed to have a fuel adjustment charge (FAC) that allows all fuel and purchased power costs to be passed through to customers on an annual basis. 12 Appendix A describes all input assumptions for the SW Utility.
10
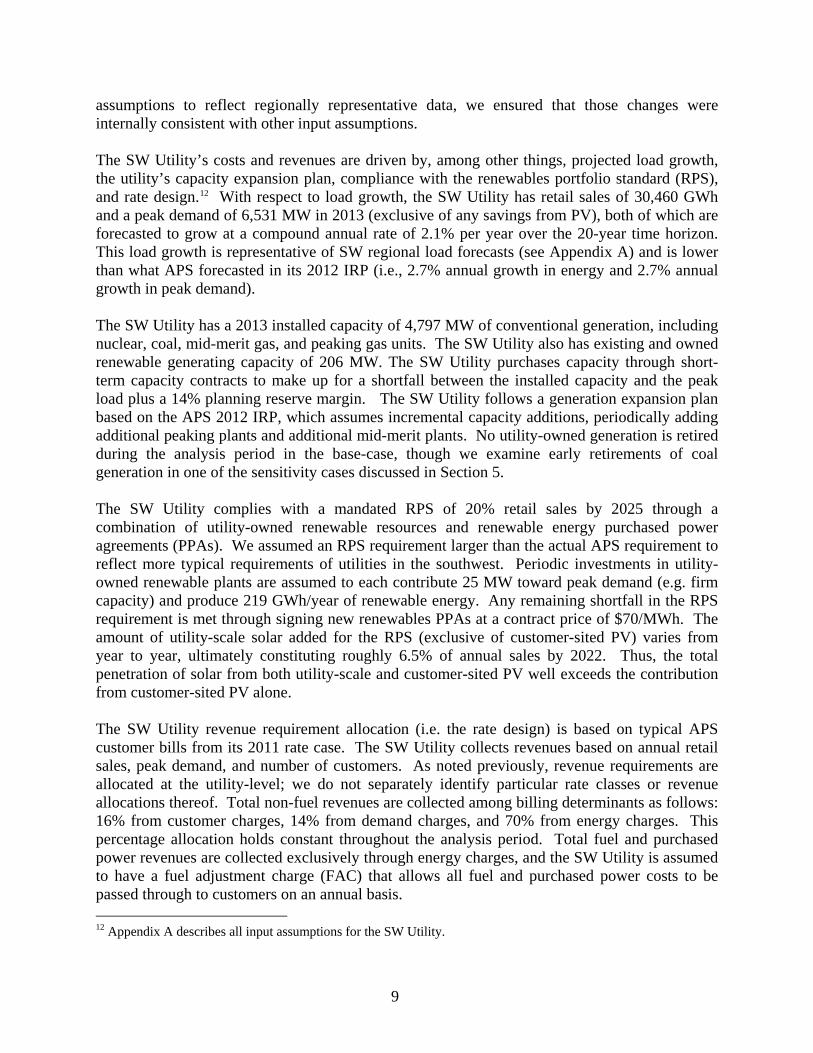
The resulting SW Utility revenue requirement is $3.6B in 2013 and grows at 4.3% per year through 2032 (see Figure 2). Operations and maintenance (O&M) costs (inclusive of non-fuel O&M expenses from incremental capital expenditures) are the largest non-fuel cost component of the revenue requirement and grow at 2.6% per year from 2013 to 2032. Fuel and purchased power costs are the single largest component of the revenue requirement and grow at 5.6% per year during the 20-year analysis period.
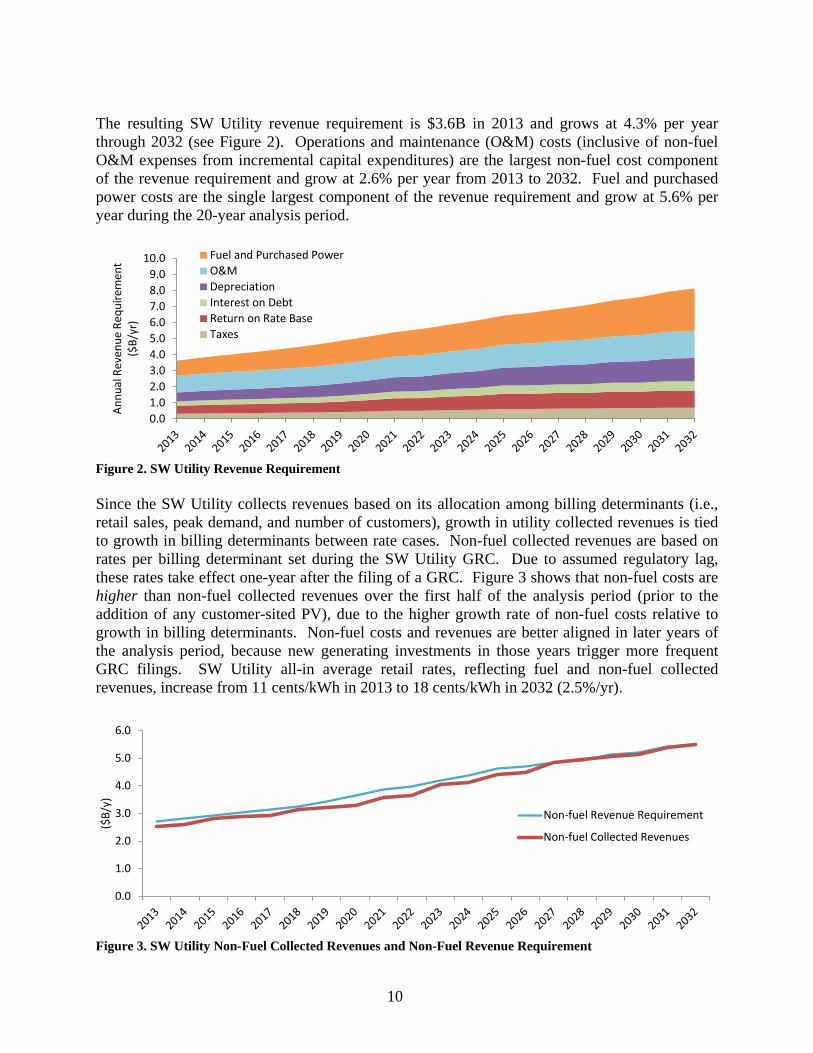
Figure 2. SW Utility Revenue Requirement Since the SW Utility collects revenues based on its allocation among billing determinants (i.e., retail sales, peak demand, and number of customers), growth in utility collected revenues is tied to growth in billing determinants between rate cases. Non-fuel collected revenues are based on rates per billing determinant set during the SW Utility GRC. Due to assumed regulatory lag, these rates take effect one-year after the filing of a GRC. Figure 3 shows that non-fuel costs are higher than non-fuel collected revenues over the first half of the analysis period (prior to the addition of any customer-sited PV), due to the higher growth rate of non-fuel costs relative to growth in billing determinants. Non-fuel costs and revenues are better aligned in later years of the analysis period, because new generating investments in those years trigger more frequent GRC filings. SW Utility all-in average retail rates, reflecting fuel and non-fuel collected revenues, increase from 11 cents/kWh in 2013 to 18 cents/kWh in 2032 (2.5%/yr).
Figure 3. SW Utility Non-Fuel Collected Revenues and Non-Fuel Revenue Requirement
0.01.02.03.04.05.06.07.08.09.0
10.0
Annu
al R
even
ue R
equi
rem
ent
($B/
yr)
Fuel and Purchased PowerO&MDepreciationInterest on DebtReturn on Rate BaseTaxes
0.0
1.0
2.0
3.0
4.0
5.0
6.0
($B/
y)
Non-fuel Revenue Requirement
Non-fuel Collected Revenues

11
Text Box 2. A Note on Terminology: Fuel Costs vs. Non-Fuel Costs Throughout this report, we distinguish between two broad categories of costs: fuel costs and non-fuel costs. When used within the context of this distinction, “fuel costs” refers to all costs that are fully passed through to customers, via annually adjusted FAC charges. These include (as applicable, depending upon the utility): fuel costs for utility-owned generation, all purchased power costs associated with long-term contracts and short-term purchases of energy and capacity, and transmission access costs. Within our analysis, utility shareholders are indifferent to fuel costs or any impact that customer-sited PV may have on these costs or the associated revenues. “Non-fuel costs” simply refers to all remaining utility costs, which include both fixed and variable costs. These costs are recovered through retail rates established in GRCs based on test-year costs and billing determinants. We refer to revenues from those GRC-established rates as “non-fuel revenues.” Growth in those revenues between rate cases is a function of growth in the utility’s billing determinants (which, in our analysis, consist of retail sales, peak demand, and number of customers). Given the periodic nature of GRCs and the temporal lags therein, non-fuel costs and non-fuel revenues may not align with each other, which in turn affects utility earnings and ROE (either positively or negatively, depending on the direction of the misalignment). As discussed further, customer-sited PV impacts the relative growth rates of non-fuel costs and non-fuel revenues, and this is one of the key drivers for its utility shareholder impacts. The utility achieves an average after-tax ROE of 8.0% from 2013-2022 and 8.4% from 2013-2032.13 The utility’s achieved after-tax ROE is less than its authorized ROE of 10% in most years. Achieved after-tax earnings are $3.4B from 2013-2022 and $6.5B from 2013-2032.14 Achieved after-tax earnings are also less than authorized earnings in most years of the analysis period (see Figure 4). “Under earning”, where levels of achieved earnings are less than authorized earnings, occurs because utility costs grow at a faster rate between rate cases than do billing determinants. The utility can increase earnings by either increasing sales or decreasing costs between rate cases. SW Utility earnings and ROE increase significantly in later years when the utility increases its ratebase equity through several generation investments. Those investments also trigger more frequent GRC filings, which in turn leads to more frequent rate increases, boosting revenue growth.
13 We calculate average ROE on a levelized basis, using a discount rate equal to the utility’s weighted average cost of capital (WACC). 14 We calculate earnings on a net present value (NPV) basis, using a discount rate equal to the utility’s WACC.

12
Figure 4. SW Utility Achieved and Authorized Earnings and ROE
3.2 Northeastern wires-only utility and default service provider The prototypical Northeastern Utility (“NE Utility”) is a “wires-only” utility in a restructured northeastern state, with substantially different asset ownership than the vertically integrated structure of the SW Utility. Specifically, the NE Utility owns and operates the distribution network, but does not own transmission or generation assets. The utility serves as the default supplier of generation service for customers within its distribution service territory, and all energy and generation capacity required to serve those customers is procured through market purchases. We developed long-range (i.e., 2013-2032) cost and load forecasts for the prototypical NE Utility by starting with data provided by the Massachusetts Department of Public Utilities (DPU) for a 2009 project (Cappers et al., 2010), which are generally consistent with the Massachusetts Electric Company (“Mass Electric”). We then updated those data based on publicly available information from a 2009 rate case and FERC Form 1 data, and updated assumptions about current and future energy, capacity, and renewables prices using the 2013 Synapse Avoided Energy Supply Costs in New England (AESC) report. Thus, although data from Mass Electric were used to seed the initial utility characterization, the prototypical NE Utility used in this analysis is not intended to represent Mass Electric, specifically. The NE Utility’s costs and revenues are driven by five key assumptions: the load forecast, growth in O&M costs, power supply costs, rate design, and compliance with an RPS.15 First, the NE Utility has 2013 retail sales of 21,957 GWh and 5,655 MW of peak demand, which grow at 1.4% and 1.5% per year, respectively (exclusive the effect of PV). The retail sales and peak demand growth rates are lower than our assumptions for the SW Utility and are consistent with expected load growth in the northeast. The ISO-New England (ISO-NE) 2013 Regional System Plan forecasts 1.1% per year retail sales growth and 1.4% per year peak demand growth for the entire region through 2022.16 15 Appendix A describes all input assumptions for the NE Utility 16 ISO-NE 2013 Regional System Plan (p. 7). http://www.iso-ne.org/trans/rsp/index.html
0.0%
2.0%
4.0%
6.0%
8.0%
10.0%
12.0%
0.0
0.2
0.4
0.6
0.8
1.0
1.2
ROE
(%/y
r)
Earn
ings
($B/
y)
Authorized After-Tax Earnings (left axis) Achieved After-Tax Earnings (left axis)Authorized After-Tax ROE (right axis) Achieved After-Tax ROE (right axis)

13
Second, the NE Utility experiences O&M cost growth (including O&M costs from incremental generating plants) of 3.4% per year for the entire analysis period. This is higher than the SW Utility, which is assumed to experience O&M cost growth of 2.6% per year. Third, we assume power supply costs (i.e., energy and capacity) and transmission access charges17 are a pass-through to customers recovered through a “tracker” or bill “rider”. The achieved revenues for these costs are therefore determined based on actual commodity costs each year, rather than on rates set during GRC. These power supply and transmission access costs are the largest component of the total NE Utility revenue requirement, ranging from 50% to 60% of total costs each year of the 20-year analysis period. Fourth, similar to the SW Utility, we assume a revenue requirement allocation (i.e., rate design) for the NE Utility that is based on typical Mass Electric customer bills. We used the company’s most recent cost-of-service and rate design studies to determine the percentages of total non-fuel revenues collected among energy, demand, and customer charges. Total non-fuel revenues are collected among billing determinants as follows: 23% from customer charges, 21% from demand charges, and 56% from energy charges, which are constant through the analysis period. All purchased power and transmission access charges are entirely collected from energy charges. Fifth, the NE Utility complies with a mandated RPS obligation that starts at 8% of annual retail sales in 2013 and increases by 1% of annual retail sales each year of the analysis period (reaching 27% by 2032). The RPS obligation is met through the purchase of renewable energy credits (RECs), at an average price of $35/MWh. The RPS is also assumed to include a solar carve-out, wherein a small portion of the RPS is met with solar RECs, assumed for our purposes to consist of utility-scale solar. This utility-scale solar (which rises to 1.7% of retail sales by 2022) is additional to the customer-sited PV, though it is a substantially lower penetration of utility-scale solar than in the SW Utility. The NE Utility revenue requirement is $2.2B in 2013 and grows at 5.7% per year through 2032. Default service customer supply costs and transmission access charges grow at 6.6% per year and are the largest component of the NE Utility revenue requirement. The revenue requirement does not include the power supply costs and transmission access costs associated with competitive suppliers who purchase power for non-default service customers (i.e., competitive supply customers), although those costs are included for reference in Figure 5.
17 While we assume the NE Utility does not own and earn a return on transmission assets, there are instances where a “wires-only” utility may be part of a holding company that also owns and operates a separate transmission company (Transco). The Transco may be making investments in transmission assets which create earnings for the holding company. While customer-sited PV may impact the earnings of Transcos, they are outside the scope of the present analysis, which focuses only on the financial impacts to the regulated distribution utility.

14
Figure 5. NE Utility Revenue Requirement Similar to the SW Utility, the NE Utility collects revenues based on allocation among billing determinants (i.e., retail sales, peak demand, and number of customers), which ties growth in utility collected revenues to growth in billing determinants between rate cases. Non-fuel collected revenues are based on rates per billing determinant set during the NE Utility general rate case (GRC) and take effect one-year after the filing of a GRC. Figure 6 shows that non-fuel costs are higher than non-fuel collected revenues in all years of the analysis period, which occurs because those costs grow at a faster rate between rate cases than growth in billing determinants. NE Utility all-in average retail rates (that include fuel and non-fuel collected revenues) increase from 13 cents/kWh in 2013 to 28 cents/kWh in 2032 (4.2% per year).
Figure 6. NE Utility Non-Fuel Collected Revenues and Non-Fuel Revenue Requirement The NE Utility’s achieved after-tax ROE and achieved after-tax earnings are below the authorized levels over the entirety of the analysis period (see Figure 7).18 Specifically, the utility achieves an average after-tax ROE of 6.9% from 2013-2022 and 6.5% from 2013-2032, compared to its authorized ROE of 10.35%. Total achieved after-tax earnings are $461M over
18 The “sawtooth” pattern of the annual achieved ROE and achieved earnings reflect the steady decline in both metrics during periods between each rate case, and then increases in both metrics in the year following each rate case, as rates are re-set to bring revenues and costs into closer accord.
0.01.02.03.04.05.06.07.08.09.0
10.0An
nual
Tot
al C
osts
($
B/yr
)
Competitive SupplyDefault SupplyTransmission AccessO&MDepreciationInterest on DebtReturn on Rate BaseTaxes
0.00.20.40.60.81.01.21.41.61.8
($B/
y)
Non-fuel Revenue Requirement
Non-fuel Collected Revenues

15
the 2013-2022 period and are $681M over the full 20-year period from 2013-2032. Achieved earnings are less than authorized earnings for reasons similar to those discussed with respect to the SW Utility, though the gap is greater in the NE utility because of the greater underlying difference between the growth rates of non-fuel costs and non-fuel revenues. It is also worth noting that the NE Utility’s earnings are 10-14% of the SW Utility’s earnings, because the NE Utility does not build, own, and earn a return on generating assets under cost-of-service regulation.
Figure 7. NE Utility Achieved and Authorized Earnings and ROE
0.0%
2.0%
4.0%
6.0%
8.0%
10.0%
12.0%
0.00
0.05
0.10
0.15
0.20
ROE
(%/y
r)
Earn
ings
($B/
y)
Authorized After-Tax Earnings (left axis) Achieved After-Tax Earnings (left axis)Authorized After-Tax ROE (right axis) Achieved After-Tax ROE (right axis)

16
4. Base Case Results: How does customer-sited PV impact utility shareholders and ratepayers?
This section characterizes the financial impacts of customer-sited PV on the two prototypical utilities, under our base case utility characterizations and at varying PV penetration levels. We begin by describing impacts of PV on the utilities’ retail sales and peak demand, utility costs (i.e., revenue requirements), and utility collected revenues. We then describe utility shareholder impacts in terms of changes to achieved after-tax average ROE and achieved after-tax earnings, and describe ratepayer impacts in terms of changes to customer all-in average retail rates. This approach to modeling the financial impacts of PV, and the metrics used to measure those impacts, are largely analogous to those used in previous studies of the shareholder and ratepayer impacts of customer EE programs (Cappers et al., 2009a, Cappers et al., 2009b, Cappers et al., 2010 and Satchwell et al., 2011). Importantly, the base case results should not be interpreted as representative of an “expected-case” scenario or as indicative of what any particular utility might experience. Rather, the purpose of the base case analysis is, first to provide a vehicle for explaining how changes in our modeled metrics (average retail rates and utility shareholder ROE and earnings) derive from the underlying impacts of customer-sited PV on utility revenues and costs, and how those impacts are related to the timing of GRCs. Second, the base case results serve as the reference point for the sensitivity analysis in Section 5 and the analysis of mitigation approaches in Section 6. Given these objectives, we primarily focus here on the direction of change in each metric; we largely defer discussion about the size of the impacts until the sensitivity analysis in Section 5, where the range in possible magnitude of the impacts can be appropriately framed within the context of utilities’ regulatory and operating environments (and potential variations therein). 4.1 Customer-Sited PV Penetration Assumptions Customer-sited PV adoption is a model input assumption. We specify annual capacity additions of customer-sited PV, such that the proportion of retail sales met by customer-sited PV grows linearly over the first 10 years of the analysis period (2013-2022). We examine four different PV penetration trajectories, which grow from 0% in 2012 to reach terminal penetration levels in 2022 equal to 2.5%, 5%, 7.5%, and 10% of customer sales.19 Although the analysis period extends over 20 years, customer-sited PV is added only during the first 10 years in order to capture “end effects” (i.e., impacts on utility costs and revenues that occur in years beyond those when PV is added). The assumed PV deployment rates, particularly in the case of 10% penetration, are aggressive compared to both current penetration levels and even to projected penetration levels over the next decade, at both state and national levels. As of year-end 2013, electricity generation from customer-sited PV in the United States was equivalent to 0.2% of total U.S. retail electricity
19 In addition to customer-sited PV, some amount of utility-scale PV is also assumed for both of the two prototypical utilities, as described in Section 3.

17
sales, and was as high as 4% of retail sales in Hawaii and 1-2% in the next two largest state solar markets (New Jersey and California). Current penetration rates for individual utilities, or for residential customer classes, may be higher. In Hawaii, penetration of customer-sited PV has reached 5.1% to 6.0% of retail sales among the three investor-owned utilities, and 10-15% for residential customer classes. Outside of Hawaii, the highest utility-level penetration rates are in California, where total customer-sited PV generation has reached 2.3% of total retail sales (and 3.0% of residential retail sales) in Pacific Gas & Electric’s service territory. Projecting future growth in customer-sited PV is a highly speculative exercise. If one were to simply extrapolate average growth rates from the past five years, customer-sited PV penetration in 10 years would reach 0.8% of total U.S. retail electricity sales, and 3-5% in the largest state markets (excluding Hawaii, which would reach 20%). Projections from EIA’s most recent Annual Energy Outlook anticipate lower growth in customer-sited PV, with total generation from end-use PV reaching roughly 0.6% of total U.S. retail electricity sales over 10 years (EIA 2014), while forecasts from GTM and SEIA project slightly faster growth, with residential and commercial PV penetration reaching almost 0.8% of U.S. retail sales in just four years, by 2017 (GTM/SEIA 2014). As a final point of comparison, customer adoption modeling conducted for the SunShot Vision study, which considered a 75% reduction in PV costs from 2010 to 2020, projected 3% penetration of customer-sited PV in the Northeast (or 1-8% among individual states in the region) and 7% penetration in the Southwest (with penetration levels of 3-11% among individual states) by 2030 (DOE 2012). 4.2 Impacts on Retail Sales and Peak Demand The utilities’ retail sales and peak demand with and without customer-sited PV are shown in Figure 8 for the SW and NE utilities, under the 10% PV penetration scenario. Throughout this analysis, we assume that all customer-sited PV is net-metered, with no binding limits on the amount of excess generation that can be carried over from billing period to the next. PV generation therefore reduces sales on a one-for-one basis; the difference between retail sales with and without PV thus grows proportionally with the linear growth in PV penetration over the first 10 years and then remains constant thereafter. PV generation does not, however, reduce peak demand on a one-for-one basis, but rather each kW of PV capacity reduces customer peak demand by less than one kW, because the timing of maximum PV output does not coincide perfectly with customer peak demand. Moreover, the marginal impact of PV on peak demand declines as PV penetration levels grow over the first 10 years, as the timing of the net system peak progressively shifts to early evening periods with lower solar power generation. For simplicity, we assume that the reduction in aggregate customer billing demand from PV is equivalent to the reduction in utility-wide peak demand.20 Further details of how we model the reduction in peak demand with deployment of PV are described in Appendix B.
20 In practice, customer peak demand used for billing of demand charges is often not the same as the customer’s coincident peak demand. However, given the complexity and variety of demand charge structures, and limitations of the model, we make the simplifying assumption that the change in aggregate billing demand is equal to the change in utility peak demand.

18
SW U
tility
NE
Util
ity
Figure 8. Utility Retail Sales and Peak Demand with and without PV Assuming 10% PV Penetration in 2022 4.3 Impacts on Utility Costs The impact of customer-sited PV on utility costs (i.e., the revenue requirement) is a function of the changes in retail sales and peak demand described above, as well as a variety of other assumptions. The manner in which those cost impacts are modeled differs somewhat between the two prototypical utilities. We provide a high level overview of how these cost impacts are modeled for the base case analysis and describe the resulting change in total utility costs here, with additional details provided in Appendix B. Alternate assumptions related to these cost impacts are explored through the sensitivity analyses in Section 5, which includes both “high value of PV” and “low value of PV” scenarios. The utility financial model calculates the utility revenue requirement as the sum of the six cost categories described previously (i.e., fuel and purchased power, O&M, depreciation, interest on debt, return on ratebase, and taxes). For the purpose of explaining how customer-sited PV affects revenue requirements, however, it is useful to describe the impacts in terms of the underlying changes to generation-related costs and transmission and distribution (T&D) costs. 4.3.1 Modeling the Impacts on Generation Costs For the vertically integrated SW Utility, reductions in generation costs due to customer-sited PV are associated with reductions in fuel costs and purchased power costs, as well as the deferral of generation investments (including O&M costs associated with those deferred generation
6,000
7,000
8,000
9,000
10,000
11,000
12,000
13,000
20
25
30
35
40
45
50
Peak
Cus
tom
er D
eman
d (M
W)
Reta
il Sa
les (
TWh/
yr)
Retail Sales - No PV (left axis) Retail Sales - 10% PV (left axis)Peak Demand - No PV (right axis) Peak Demand - 10% PV (right axis)
5,000
6,000
7,000
8,000
9,000
10,000
15
20
25
30
35
Peak
Cus
tom
er D
eman
d (M
W)
Reta
il Sa
les (
TWh/
yr)
Retail Sales - No PV (left axis) Retail Sales - 10% PV (left axis)Peak Demand - No PV (right axis) Peak Demand - 10% PV (right axis)

19
investments).21 Fuel and purchased power costs, and the change in those costs due to customer-sited PV, are based on simplified dispatch logic. Deferrals of peaking plants (e.g., combustion turbines) are based on the number of years it takes before the peak demand with PV reaches the level of peak demand without PV for the year when the decision to build the generator would otherwise occur (see Figure 9). Similarly, deferrals of plants built primarily to supply energy (e.g., combined cycle gas turbines) are based on the number of years it takes before the sales with PV reaches the level of sales without PV for the year when the decision to build the generator would otherwise occur. Deferral of generation investment leads to reductions in depreciation costs, interest expenses (i.e., cost of debt to finance the generating plant), utility shareholder returns on the capital investment, and taxes (assessed on the shareholder returns). We refer to utility earnings foregone as a result of deferral of capital investments as the “lost earnings opportunity” effects of PV. In addition to deferral of utility-owned generation, customer-sited PV also reduces market purchases of energy and capacity to meet residual load needs, as well as PPAs with renewable generators required to meet the utility’s RPS obligation.22 Those cost reductions are included within the model as purchased power costs. The reduction in RPS compliance costs occurs because customer-sited PV is reducing retail sales, not because it is being counted directly towards RPS obligations (though that possibility is considered within the mitigation measures evaluated within Section 6).
Figure 9. Illustration of the Peaker Generation Investment Logic with PV in the Model In contrast to the SW Utility, the NE Utility does not own generating assets and is assumed to purchase all of its energy and capacity needs through wholesale contracts. Thus, generation-related costs reduced by the addition of PV consist entirely of purchased power costs for energy
21 We do not include any explicit “integration costs” associated with short-term variability and uncertainty of PV, though we do account for a decline in its capacity credit and energy value with increased penetration. The costs of short-term variability and uncertainty have been reported to be less than 0.5 cents/kWh of renewable generation for APS (B&V 2012, Mills et al. 2013) and are therefore of secondary importance. Accounting for these integration costs would thus lead to a slight increase in estimated rate impacts of customer-sited PV, but no change to earnings and ROE, given that they consist of fuel costs that are passed through directly to customers in the FAC. 22 A portion of the SW Utility’s RPS obligation is assumed to be met with utility-owned renewable generation facilities; however, renewable PPAs are assumed to be the marginal RPS resource.

20
and capacity. For RPS compliance, the NE Utility purchases fewer renewable energy credits to meet the RPS with PV than without PV, based on the retail sales reduction. Note also that the impacts of PV on generation-related costs are based on reductions in sales and peak demand at the bulk power system level. Since customer-sited PV is located at the customer premises, reductions in sales and peak demand at the bulk power system level are greater than at the customer level due to avoided T&D losses. For the SW Utility, T&D losses are assumed to be 7% and 15% for retail sales and peak demand, respectively, and for the NE Utility, are assumed to be 4.1% and 8%, respectively.23 4.3.2 Modeling the Impacts on T&D Costs Here we describe the base-case assumptions related to the impacts of customer-sited PV on T&D costs, but note in advance that this is a topic of substantial uncertainty and disagreement, and for that reason it is one key element explored within the sensitivity analysis in Section 5. For the SW Utility, T&D capital costs are modeled as non-generation capital investments, and a fraction of those investments (20%) is assumed to be proportional to growth in peak demand on the T&D system. In the base-case, we assume that PV reduces peak demand at the T&D level by 20% of the reduction in peak demand at the bulk power level. The corresponding reductions in T&D peak demand growth thereby reduce growth-related non-generation capital investments, resulting in reductions in depreciation expenses, shareholder returns on those investments, interest expenses, and taxes. For the base-case analysis, we assume therefore that customer-sited PV leads to a net reduction in distribution system capital expenses. Within the sensitivity analyses, however, we consider a case in which distribution costs increase as a result of PV. For the NE Utility, the model treats transmission costs differently than distribution costs. The NE Utility does not own transmission facilities, but rather purchases transmission service from a regional transmission operator (ISO-NE) and passes those costs through to customers via a transmission access charge. Transmission charges are included in the model as a portion of purchased power costs and are calculated based on the average monthly peak demand of the utility. We assume that customer-sited PV reduces average monthly peak demand by 20% of the reduction in annual peak demand, leading to corresponding reductions in the portion of purchased power costs associated with transmission access charges. 24 In contrast, the NE Utility does own and operate distribution facilities, and distribution costs are therefore modeled as a capital investment, some portion of which is growth related (33%). Similar to the approach used to model T&D cost impacts for the SW Utility, the addition of PV reduces growth-related distribution system capital expenses for the NE Utility, leading to corresponding reductions in returns on ratebase, depreciation expenses, interest, and taxes.
23 Losses for peak demand are greater than average losses due to the non-linear relationship between load levels and losses (Lazar and Baldwin 2011). 24 The 20% assumption is based on an analysis of hourly load and PV generation in the Northeast over the span of one year.

21
4.3.3 Total Reduction in Utility Costs Given the modeled relationships described above, the total reductions in utility costs (i.e., revenue requirements) resulting from customer-sited PV in the base-case analysis are shown in Figure 10, with further details on the underlying source of cost reductions listed in Table 2. For the SW Utility, customer-sited PV reduces total utility costs over the 20-year analysis period by $0.7 B (1.3% of total utility costs) under 2.5% PV penetration and by $2.2B (4.0% of total utility costs) under 10% PV penetration, compared to a case without any customer-sited PV. Similarly, for the NE Utility, the cost reductions range from $0.8B (1.5% of total utility costs) at 2.5% PV penetration to $2.3B (4.5% of total utility costs) at 10% PV penetration. As shown in the figure, the composition of the cost reductions differs significantly between the two utilities due to differences in the two utilities’ physical and operating characteristics, with important implications for the shareholder and ratepayer impacts, as discussed below.
SW Utility NE Utility
Figure 10. Reduction in Utility Revenue Requirements with Customer-Sited PV Table 2. Sources of Modeled Reductions in Utility Costs from Customer-Sited PV Cost Category SW Utility NE Utility Fuel & Purchased Power
• Reduced fuel costs for utility-owned generation
• Reduced energy and capacity market purchases and PPAs
• Reduced RPS procurement costs • Reduced losses
• Reduced energy and capacity market purchases
• Reduced transmission access charges • Reduced RPS procurement costs • Reduced losses
O&M • Reduced O&M due to deferred utility-owned generation
• None
Depreciation • Deferred utility-owned generation • Reduced T&D CapEx
• Reduced distribution system CapEx Interest on Debt Return on Ratebase
Taxes • Deferred utility-owned generation • Reduced T&D CapEx • Reduced collected revenues
• Reduced distribution system CapEx • Reduced collected revenues
0%
1%
2%
3%
4%
5%
0.0
0.5
1.0
1.5
2.0
2.5
2.5% 5% 7.5% 10%Redu
ctio
n in
Rev
enue
Req
uire
men
t ($
B, 2
0-yr
NPV
@ W
ACC)
Customer Demand Met With PV by 2022
Fuel and Purchased PowerO&MDepreciationInterest on DebtReturn on Rate BaseTaxesPercent of Total Costs (right axis)
0%
1%
2%
3%
4%
5%
0.0
0.5
1.0
1.5
2.0
2.5
2.5% 5% 7.5% 10%
Redu
ctio
n as
Per
cent
of
Tot
al C
osts
Customer Demand Met With PV by 2022
Purchased PowerDepreciationInterest on DebtReturn on Rate BaseTaxesPercent of Total Costs (right axis)

22
4.3.4 Implied Avoided Cost of PV Discussions about the costs and benefits of customer-sited PV often rely on estimates or assumptions about the “avoided costs” from PV (often used interchangeably with the term “value of PV”), which is simply the reduction in costs resulting from customer-sited PV, per unit of customer-sited PV generation. Such avoided costs may be construed broadly at the societal level, or more narrowly by considering only reductions in costs for the utility, which would typically include the impact of PV on different utility cost components (e.g., energy, generation capacity, T&D capacity, losses). For the purpose of comparison between our results and other estimates of avoided costs from customer-sited PV, we map the cost reductions from customer-sited PV estimated within our analysis to the categories often used in avoided cost calculations (see Figure 11). The simple calculations used to parse avoided costs into these categories become much more difficult when accounting for the deferral of “lumpy” investments like new generation plants. For simplicity, we conduct these approximations for 2018, the latest year before PV begins to displace lumpy investments for the SW Utility. To be clear, these avoided cost values should be considered simply for benchmarking purposes; the financial model used for this analysis does not, itself, distinguish among the specific set of cost categories in Figure 11, and more generally, the model does not contain the level of granularity in modeling the physical impacts of customer-sited PV on utility systems to be considered a refined, independent estimate of avoided costs. Additional details describing the methods used to approximate the breakdown of the value of PV are provided in Appendix B.
Figure 11. Estimated Avoided Costs in 2018 for the SW and NE Utilities (6% PV Penetration) For the specific year shown, the total avoided cost value of PV is equal to 7.5 cents/kWh for the SW utility and 11.7 cents/kWh for the NE utility. For both utilities, avoided energy costs are the largest component, followed by avoided capacity costs and avoided distribution costs. These sources of avoided costs are augmented by: avoided transmission costs; reductions in the cost of planning reserves, which are based on a percentage of peak demand; avoided costs related to losses, which impact both the amount of energy purchased and the amount of generation capacity needed to meet peak demand and reserves; and avoided RPS procurement costs, resulting from the reduction in retail sales and corresponding reduction in RPS obligations (which are set as a percentage of sales).
0
2
4
6
8
10
12
14
SW Utility NE Utility
Avoi
ded
Cost
of P
V in
201
8(c
ents
/kW
h)
Avoided DistributionAvoided TransmissionAvoided RPSAvoided Losses - CapacityAvoided ReservesAvoided CapacityAvoided Losses - EnergyAvoided Energy

23
Avoided costs are higher for the NE Utility than the SW Utility, primarily due to differences in the value of avoided energy costs and the value of avoided capacity costs. Avoided energy costs are higher for the NE Utility due to higher expected energy prices in the Northeast (primarily from natural gas) relative to the fuel costs for the SW Utility (a mix of gas and coal). The capacity value is higher for the NE Utility due to two factors: (1) customer-sited PV contributes slightly more to meeting peak demand due to the lower overall PV penetration from both utility-scale and distributed PV, compared to the SW utility; and (2) PV in the Northeast generates less energy than in the Southwest, leading to a higher capacity value in $/kWh terms in the Northeast. As shown previously in Figure 10, reductions in utility costs from customer-sited PV do not scale in proportion to the PV penetration level, but rather exhibit diminishing returns. To more clearly illustrate this point, we plot the avoided cost per unit of PV energy, averaged over the full 20-year analysis period, for each PV penetration level considered (see Figure 12). For both the SW and NE utilities, the avoided cost of PV (per unit of PV energy) declines with increasing penetration levels. Specifically, the average value of PV for the SW Utility declines from 10.3 cents/kWh under the 2.5% penetration scenario to 8.5 cents/kWh under the 10% penetration scenario; for the NE Utility, it declines from 15.8 cents/kWh to 12.3 cents/kWh. The decline in avoided cost with increasing penetration is due to a decline in the contribution of PV to meeting peak demand (peak demand shifts into the early evening with higher PV penetration) and a decline in the cost of energy displaced by PV (PV begins to displace more efficient plants or plants with lower cost fuels). For reference, we also include the average cost of energy per unit of sales in the scenario without PV. This comparison shows that the reduction in utility costs from customer-sited PV is less than the average cost of generating and delivering electricity for both the SW and NE utility in this base-case analysis, and that this gap grows with PV penetration level.
SW Utility NE Utility
Figure 12. Avoided Cost of PV at Varying Penetration Levels and Average Cost without PV 4.4 Impacts of PV on Collected Revenues All customer-sited PV within our analysis is net-metered under the same retail rates applicable to other customers, and without any PV-specific charges (e.g., additional fixed charges or standby
02468
101214161820
2.5% 5.0% 7.5% 10.0%
(cen
ts/k
Wh
-Avg
.; 20
-yr)
Customer Demand Met With PV by 2022
Average Cost without PV
Avoided Cost of PV02468
101214161820
2.5% 5.0% 7.5% 10.0%
(cen
ts/k
Wh
-Avg
.; 20
-yr)
Customer Demand Met With PV by 2022
Average Cost without PV
Avoided Cost of PV

24
charges for PV customers). The impacts of customer-sited PV on total utility collected revenues are thus a function of changes in billing determinants and in the rates for each billing determinant caused by PV. The change in billing determinants is simply the reduction in retail sales and peak demand, as described in Section 4.2, while the change in rates reflects the net effect of customer-sited PV on test-year costs (i.e., revenue requirements) and billing determinants used within each GRC. Customer-sited PV reduces revenues related to both fuel costs and non-fuel costs (see Text Box 2 for explanation of this distinction). For the purpose of understanding how these revenue impacts ultimately translate to impacts on shareholder ROE and earnings, it is most useful, however, to focus specifically on impacts to non-fuel revenues. To illustrate, Figure 13 compares reductions in non-fuel revenues under each PV penetration scenario to the corresponding reductions in non-fuel costs. In the case of the SW Utility, the impacts on revenues and costs are roughly equivalent under the 2.5% PV penetration scenario. At higher PV penetration levels, however, reductions in non-fuel revenues exceed reductions in non-fuel costs. This occurs, in part, because of the declining marginal value of PV as penetration levels increase, as discussed in Sections 4.3.4. For the NE Utility, the divergence between reductions in non-fuel revenues and non-fuel costs is substantially wider. This is because of the greater assumed growth rate in non-fuel O&M costs for the NE Utility, as indicated previously in Table 1, and the assumption that those costs are not reduced as a result of customer-sited PV.
SW Utility NE Utility
Figure 13. Reduction in Utility Non-Fuel Revenue Requirements (Costs) and Collected Revenues 4.5 Impacts of PV on ROE Under our base-case assumptions, customer-sited PV leads to a reduction in the prototypical utilities’ achieved ROE. This occurs because, as discussed in the preceding section, PV reduces collected non-fuel revenues by a greater amount than non-fuel costs (i.e., “revenue erosion effect”), which in turn reduces earnings and thereby reduces ROE. Importantly, even without PV, the utilities’ achieved ROE is below their authorized ROE, because the utilities’ costs grow faster than their revenues, as described earlier in Section 3. The addition of customer-sited PV exacerbates those underlying conditions, leading to further erosion of ROE. As discussed later in Section 6, there are several mechanisms (e.g., revenue decoupling) designed to reduce and/or
-2.5%
-2.0%
-1.5%
-1.0%
-0.5%
0.0%2.5% 5.0% 7.5% 10.0%
Chan
ge in
Non
-Fue
l Cos
t and
Re
venu
e (1
0-yr
NPV
as p
erce
nt o
f N
o-PV
Cas
e)
Customer Demand Met With PV by 2022
Non-fuel CostNon-fuel Revenue
-2.5%
-2.0%
-1.5%
-1.0%
-0.5%
0.0%2.5% 5.0% 7.5% 10.0%
Chan
ge in
Non
-Fue
l Cos
t and
Re
venu
e (1
0-yr
NPV
as p
erce
nt o
f N
o-PV
Cas
e)
Customer Demand Met With PV by 2022
Non-fuel CostNon-fuel Revenue

25
remove the negative impact that reductions in sales growth, such as those caused by customer-sited PV, may have on shareholder ROE. For the SW Utility, achieved average ROE over the first 10 years of the analysis period is 2 basis points lower at 2.5% PV penetration and 23 basis points lower at 10% PV penetration than it is without PV (see Figure 14). These basis point reductions represent, in relative terms, a 0.3% to 2.9% reduction in average utility shareholder returns over the first 10 years. For the NE Utility, the ROE impacts are somewhat more substantial, with a 32 basis point (4.7%) reduction at 2.5% PV penetration and a 125 basis point (18.1%) reduction at 10% PV penetration, relative to the no-PV case. The larger ROE impacts for the NE Utility are due to two underlying factors. The first factor can be traced back to the greater assumed growth rate in non-fuel O&M costs for the NE Utility, which in turn leads to a greater divergence between the impact of customer-sited PV on non-fuel revenues and non-fuel costs (i.e., the dynamic discussed in relation to Figure 13). The other key factor underlying the difference in ROE impacts between the two utilities is the proportionally smaller ratebase (compared to retail sales) of the wires-only NE Utility, as that utility does not own generation assets. A given reduction in earnings will therefore have a proportionately larger ROE impact for the NE Utility, as ROE is equal to earnings divided by the ratebase equity. The ROE impacts over the full 20-year analysis period are, in the case of the NE Utility, slightly smaller than the average impacts over just the initial 10 years. This is to be expected, as ROE impacts from customer-sited PV are driven chiefly by its effects on the relative growth of non-fuel costs and non-fuel revenues, and that impact occurs primarily during the initial 10 years when PV penetration is growing. In the latter 10 years, the relative growth of fuel costs to non-fuel revenues reverts largely back to the relationship that would have existed in the absence of any customer-sited PV. In contrast, for the SW Utility, the 20-year ROE impacts are slightly larger, but more irregular, than the average impacts over the initial 10 years. This phenomenon is an artifact of the irregular timing of large, lumpy capital expenditures – and the GRCs triggered by those expenditures – over the course of the 20-year analysis period. Notwithstanding those complexities, largely confined to the SW Utility in our analysis, the impacts of PV on achieved annual ROE are, in general, concentrated primarily within the initial 10 years of the analysis period and are more readily interpretable for that timeframe. Thus, throughout the remainder of this report, our discussions of ROE impacts focus solely on the first 10 years of the analysis period (though we continue to discuss earnings and rate impacts over the full 20-year period).

26
SW Utility NE Utility 10
-Yea
r Im
pact
s
20-Y
ear
Impa
cts
Figure 14. Reduction in Achieved After-Tax ROE 4.6 Impacts of PV on Earnings Customer-sited PV may reduce shareholder earnings through two separate mechanisms. First, it can do so if it reduces utility revenues by a greater amount than it does costs (i.e., the “revenue erosion effect” that also drives the impacts on ROE). Second and separately, customer-sited PV may also diminish future earnings opportunities, by reducing or deferring capital investments that would otherwise contribute to the utility’s ratebase (which we term the “lost earnings opportunity effect”).25 As will be explored further in Section 6, a variety of potential mechanisms exist for mitigating earnings erosion, including a number mechanisms that specifically seek to provide the utility with additional earnings opportunities.
25 An increase in earnings is valuable to shareholders only if the return on future investments is greater than the cost of equity (see Koller et al., 2010), which presently would be the case for most utilities. The prototypical NE Utility in our analysis, however, may present a case in which the ROE of future investments may not cover the cost of equity, in which case the deferral of future capital investments would benefit shareholders. A cost of equity test is beyond the scope of this study. See Kihm et al. (2014) for the motivations of a utility to invest in capital in a future with increased EE and PV when returns on future investments are greater or less than the cost of equity.
-2%
-1%
-0%
-3%
7.0% 7.5% 8.0% 8.5% 9.0%
10%
7.5%
5%
2.5%
0%
Achieved After-Tax ROE (Avg.; 10-yr)
Cust
omer
Dem
and
Met
With
PV
by 2
022
-14%
-9%
-5%
-18%
5.0% 5.5% 6.0% 6.5% 7.0%
10%
7.5%
5%
2.5%
0%
Achieved After-Tax ROE (Avg.; 10-yr)
Cust
omer
Dem
and
Met
With
PV
by 2
022
-4%
-1%
-2%
-4%
7.0% 7.5% 8.0% 8.5% 9.0%
10%
7.5%
5%
2.5%
0%
Achieved After-Tax ROE (Avg.; 20-yr)
Cust
omer
Dem
and
Met
With
PV
by 2
022
-10%
-7%
-4%
-13%
5.0% 5.5% 6.0% 6.5% 7.0%
10%
7.5%
5%
2.5%
0%
Achieved After-Tax ROE (Avg.; 20-yr)
Cust
omer
Dem
and
Met
With
PV
by 2
022

27
Figure 15 shows the base-case earnings impacts for both utilities, across the range of PV penetration levels considered and over multiple timeframes. As to be expected, earnings impacts increase with PV penetration. For the SW Utility, achieved earnings over the first 10 years are $48M (1.4%) lower at 2.5% PV penetration, compared to the case with no PV, growing to $193M (5.7%) lower at 10% PV penetration. For the NE Utility, earnings over the first 10 years are reduced by $25M (5.5%) at 2.5% PV penetration and by $93M (20.2%) at 10% PV penetration. The earnings impacts are greater, on a percentage basis, than the impacts to ROE, given the additional effect of lost earnings opportunities.26 This is especially true for the SW Utility (e.g., 2.9% reduction in ROE vs. 5.7% reduction in earnings over the first 10 years), where the potential for deferral of utility-owned generation facilities leads to relatively large lost earnings opportunities. Additional earnings erosion occurs over the latter half of the 20-year analysis period, as deferral of capital investments continues beyond the initial 10-year period when customer-sited PV is installed. These “end-effects” are particularly pronounced in the case of the SW Utility, where PV results in deferral of generation plants in the latter 10 years (see Figure 16). Thus, at 10% PV penetration, achieved earnings over the full 20-year analysis period are $528M (8.1%) lower than with no PV, compared to the $193M (5.7%) reduction over the first 10 years, as noted above. For the NE Utility as well, additional earnings erosion occurs in years 11-20, though to a much more limited extent, given that the utility does not own generation and thus the only deferred capital expenditures are for distribution system investments. At 10% PV penetration, for example, achieved earnings by the NE Utility are reduced by 20.2% in the first ten-years, but only 15.4% over the full 20 years of the analysis period. As with the impact of PV on achieved ROE, we see that the impact of PV on earnings, in percentage terms, is larger for the NE Utility than for the SW Utility, though the difference between the two utilities is not as large. As noted, the impact of customer-sited PV on achieved earnings is the combined result of the “revenue-erosion effect” (associated with the disproportionately larger reduction in collected revenues than in utility costs) and the “lost earnings opportunity” effect (associated with the deferral of capital expenditures). The former effect is larger for the NE Utility than for the SW Utility; as discussed previously, this is due to the larger assumed growth in non-fuel O&M costs for the NE Utility and the assumption that customer-sited PV does not reduce those costs. In contrast, the latter “lost earnings opportunity” effect is larger for the SW Utility, given that the SW Utility owns generation plants that are deferred by customer-sited PV. On net, though, the difference between the two utilities is greater with respect to the revenue erosion effect, and thus the earnings impacts are slightly greater for the NE Utility.
26 The larger percentage impacts on earnings can also be explained mathematically: ROE equals earnings divided by the equity portion of the utility’s ratebase. Customer-sited PV reduces earnings (the numerator) as well as the ratebase (the denominator), and thus the percentage reduction in ROE must necessarily be smaller than the percentage reduction in earnings.

28
SW Utility NE Utility 10
-Yea
r Im
pact
s
20-Y
ear
Impa
cts
Figure 15. Reduction in Achieved After-Tax Earnings
Figure 16. Generation Investment Deferral for the SW Utility with 10% PV 4.7 Impacts of PV on Average Retail Rates Within the timeframe of our analysis, customer-sited PV impacts average, all-in retail rates in two, inter-related ways. First, it impacts the retail rates set within each GRC through the net result of reductions in the test-year utility costs and billing determinants used to establish rates.
-6%
-4%
-3%
-1%
$3,000 $3,100 $3,200 $3,300 $3,400 $3,500
10%
7.5%
5%
2.5%
0%
Achieved After-Tax Earnings ($M NPV; 10-yr)
Cust
omer
Dem
and
Met
With
PV
by 2
022
-20%
-16%
-11%
-5%
$350 $400 $450 $500
10%
7.5%
5%
2.5%
0%
Achieved After-Tax Earnings ($M NPV; 10-yr)
Cust
omer
Dem
and
Met
With
PV
by 2
022
-8%
-8%
-4%
-4%
$5,500 $5,750 $6,000 $6,250 $6,500
10%
7.5%
5%
2.5%
0%
Achieved After-Tax Earnings ($M NPV; 20-yr)
Cust
omer
Dem
and
Met
With
PV
by 2
022
-15%
-12%
-9%
-4%
$500 $550 $600 $650 $700
10%
7.5%
5%
2.5%
0%
Achieved After-Tax Earnings ($M NPV; 20-yr)
Cust
omer
Dem
and
Met
With
PV
by 2
022

29
As discussed in Section 4.3, under our base-case assumptions customer-sited PV generally reduces utility costs by less than it reduces retail sales. As a result, average retail rates established through each GRC increase with the addition of customer-sited PV. That particular dynamic is dependent on a variety of assumptions related to the ability of customer-sited PV to reduce utility cost, some of which are explored within the sensitivity analysis in Section 5. Second, customer-sited PV impacts average rates in the years between GRCs, though this effect is simply a mathematical artifact. Average rates are, by definition, equal to total collected revenues divided by total retail sales. Among customers with PV, the net-metered PV reduces both the revenues received from those customers (the numerator) and their retail sales (the denominator), but the reductions in revenues are necessarily smaller, given that some portion of revenues are derived from fixed customer charges (which are unaffected by PV) and demand charges (which are only marginally affected by PV). The base-case impacts of customer-sited PV on average all-in retail rates over the first 10 years of the analysis period are shown in Figure 17, for both utilities and across the range of PV penetration levels considered.27 For the SW Utility, the all-in average retail rate at 10% PV penetration is 0.23 cents/kWh (1.8%) higher over the first 10 years of the analysis period (i.e., 2013-2022) than it is without PV. The rate impacts for the NE Utility are similar, with an average rate that is 0.23 cents/kWh (1.5%) higher at 10% PV penetration than without PV. As to be expected, the rate impacts are smaller at lower PV penetration levels. Over the entire 20-year analysis period, the impacts on average rates are generally somewhat higher than over just the first 10-year period. This is due to the fact that PV penetration is ramping up over time, and thus the average penetration level during the initial 10 years is lower than over the full 20 years. At 10% PV penetration, for example, average retail rates for the SW utility are 0.35 cents/kWh (2.5%) higher than without PV, while average rates for the NE Utility are 0.52 cents/kWh (2.7%) higher.
27 We calculate the average all-in retail rate on a levelized basis using a customer discount rate of 5%.

30
SW Utility NE Utility 10
-Yea
r Im
pact
s
20-Y
ear
Impa
cts
Figure 17. Increase in All-in Average Retail Rates
1.8%
1.2%
0.7%
0.3%
12.6 12.8 13.0 13.2 13.4
10%
7.5%
5%
2.5%
0%
All-in Average Retail Rates (cents/kWh; 10-yr)
Cust
omer
Dem
and
Met
With
PV
by 2
022
1.5%
0.8%
0.4%
0.1%
16.0 16.2 16.4 16.6 16.8
10%
7.5%
5%
2.5%
0%
All-in Average Retail Rates (cents/kWh; 10-yr)
Cust
omer
Dem
and
Met
With
PV
by 2
022
2.5%
1.3%
1.0%
0.0%
14.0 14.2 14.4 14.6 14.8
10%
7.5%
5%
2.5%
0%
All-in Average Retail Rates (cents/kWh; 20-yr)
Cust
omer
Dem
and
Met
With
PV
by 2
022
2.7%
1.5%
0.7%
0.2%
19.0 19.2 19.4 19.6 19.8
10%
7.5%
5%
2.5%
0%
All-in Average Retail Rates (cents/kWh; 20-yr)
Cust
omer
Dem
and
Met
With
PV
by 2
022

31
5. Sensitivity Results: How do the impacts of PV depend on the utility operating and regulatory environment and other key assumptions?
The base case results presented in Section 4 reflect a variety of assumptions about the two prototypical utilities. Actual conditions faced by U.S. utilities, however, vary considerably and many of the assumptions employed within our base case analysis relate to future trends that are subject to significant uncertainty. In order to examine how the impacts of customer-sited PV on utility shareholders and ratepayers may depend on assumptions about our prototypical utilities’ operating and regulatory environments, we performed a series of sensitivity analyses (see Table 3, with further details provided in Appendix D). These alternate cases represent many of the most significant, though by no means all, potential sources of uncertainty and variation among utilities.28 Moreover, even in regard to some of the sensitivities examined, some utilities may exhibit even more extreme divergence from our base-case assumptions. As such, our purpose here is not to bound the potential range of impacts, but rather to illustrate a number of key themes and considerations relevant to gauging the possible magnitude of those impacts. Table 3. Sensitivity Cases
Sensitivities Description SW Utility
NE Utility
Util
ity O
pera
ting
Env
iron
men
t Value of PV Higher/lower PV capacity credit and ability of PV to offset non-generation capital expenditure (CapEx)
● ●
Load Growth Higher/lower load growth ● ● Fixed O&M Growth Higher/lower growth rate of fixed O&M costs ● ● Non-Generating CapEx Growth Higher/lower growth rate of non-generation CapEx ● ●
Fuel Cost Growth Higher/lower growth rate of fuel costs or wholesale energy market prices ● ●
Coal Retirement Early retirement of existing coal generation ● Utility-Owned Generation Share Higher share of utility-owned generation ● Utility-Owned Generation Cost Higher/lower cost of utility-owned generation ●
Forward Capacity Market Cost Higher/lower market clearing price in the ISO-NE forward capacity market ●
Util
ity R
egul
ator
y E
nvir
onm
ent
Rate Design Higher/lower fixed customer charges ● ● Rate Case Filing Period Shorter/longer period between general rate cases ● ●
Regulatory Lag Shorter/longer period from the filing of a general rate case to implementation of new rates ● ●
Test Year Use of current or future test year during general rate cases, instead of historical test year ● ●
PV Incentives $0.5/Watt rebate provided by the utility to customers with PV ● ●
Three important structural features of the sensitivity analysis must be noted. First, for each sensitivity case, we characterize the impacts of customer-sited PV under the 10% PV penetration trajectory (i.e., where customer-sited PV ramps up to 10% of total retail sales over 10 years), ignoring the lower penetration levels considered within the base case analysis. We focus on this 28 The set of sensitivities is partly constrained by the structure of the model. For example, as currently constructed, the model cannot explicitly represent time-differentiated or inclining block rates; the rate design sensitivities therefore consist only of varying combinations of flat volumetric, demand, and customer charges.

32
higher PV penetration in order to more clearly highlight and compare the relative degrees of sensitivity across the various cases examined, but acknowledge again that this is an arguably aggressive trajectory compared to current penetration levels and growth rates for most states and utilities. Were lower PV penetration levels assumed, the impacts of PV would be smaller and the ranges across sensitivity cases would be narrower, but the fundamental results would be qualitatively the same. Second, each sensitivity case varies a single assumption or small number of assumptions. In reality, however, a more complex set of interactions and interdependencies may exist among various modeling assumptions (e.g., between rate design and load growth). Third, variation in rate design and ratemaking assumptions are included in both the sensitivity analysis and the mitigation analysis in Section 6. The difference is that, for the sensitivity analysis, the alternate assumptions are applied both with and without customer-sited PV (to reflect the fact that such variations may exist independently of customer-sited PV), while in the mitigation analysis, the alternative assumptions are applied only in conjunction with PV and are defined somewhat differently. The significance of this distinction will be further discussed below. We begin with an overview of the results across the full set of sensitivity cases, in order to illustrate in general terms how the magnitude of impacts from customer-sited PV depends on assumptions about the utility operating and regulatory environment. We then proceed by discussing specific sensitivity cases and explain why the shareholder and ratepayer impacts are larger or smaller than what is observed in the base case. 5.1 The direction of the impacts is generally consistent across the sensitivities considered,
though the magnitude varies considerably The shareholder and ratepayer impacts from customer-sited PV are directionally consistent across the sensitivity cases (see Figure 18 and Figure 19). Namely, with one exception, customer-sited PV results in a decrease in achieved shareholder earnings and ROE and an increase in all-in average retail rates, regardless of assumptions about the utility operating and regulatory environment.29 The magnitude of those impacts, however, varies considerably across the cases, demonstrating that the financial impacts from customer-sited PV critically depend on the specific conditions of the utility. For the SW Utility, the reduction in achieved earnings from customer-sited PV ranges from roughly 5% to 13%, while the reduction in achieved ROE ranges from 1% to 9%, and the increase in average rates ranges from roughly 0% to 4%.30 The impacts for the NE Utility are even more varied, ranging from a 6% to 41% reduction in earnings, a 5% to 38% reduction in ROE, and a 1% to 4% increase in average rates. The greater sensitivity in ROE and earnings impacts for the NE Utility are due to the fact that its ratebase and earnings are much smaller, relative to its total revenue requirements, and thus variations in the absolute level of those metrics lead to relatively large percentage changes.
29 The exception to the otherwise consistent directional trends occurs for the SW Utility in the high Value of PV case, where PV results in a very slight decrease in average rates. 30 Throughout this section, we focus on the earnings and rate impacts over the full 20-year analysis period in order to capture any “end-effects” associated with reduced capital expenditures in the latter decade, but focus on ROE impacts over only the first 10 years, during which the impacts are most pronounced and interpretable. 30

33
Figure 18. All Sensitivity Results for SW Utility
Figure 19. All Sensitivity Results for NE Utility

34
5.2 The financial impacts of customer-sited PV are particularly sensitive to the capacity
value and avoided T&D costs of PV, with divergent implications for ratepayers vs. shareholders
As discussed throughout Section 4, the financial impacts of customer-sited PV on utility shareholders and ratepayers are driven, in part, by the associated impacts on utility costs (i.e., the avoided cost “value of PV”). Among the various sources of cost reductions, avoided generation capacity and T&D capacity costs are arguably the source of greatest uncertainty and disagreement (as evident when comparing the various studies summarized in Text Box 3). In the financial model used for the present analysis, the impacts of customer-sited PV on generation capacity and T&D capacity costs are driven by several parameters that define the “capacity credit” of customer-sited PV at the bulk power system level and on the distribution system. For the SW Utility, capacity credit assumptions affect the deferral of generation capacity investments as well as reductions in growth-related capital expenditures for T&D, while for the NE Utility, they affect the cost reductions associated with market purchases of generation and transmission capacity as well as reductions in growth-related capital expenditures for the distribution system. We developed a set of alternate sensitivity cases to better understand the sensitivity of shareholder and ratepayer impacts from customer-sited PV to assumptions related to its capacity value and avoided T&D costs. These sensitivity cases involved modifying a number of parameters in the model (see Table 4), based on ranges for several of these parameters that exist in the literature (Hoff et al. 2008). With respect to the capacity credit at the bulk power level, in the High Value of PV scenario we slow the rate of decline of the capacity credit with increasing PV penetration, such that later vintages of PV installations contribute to a greater extent to reducing peak demand, while in the Low Value of PV scenario we assume a lower capacity credit for even early vintages of customer-sited PV. The scenarios also involve varying assumptions about the percentage of the capacity credit at the bulk power level that is then applied at the T&D level, where in the Low Value of PV case we assume 0% capacity credit for the purpose of T&D deferrals. Finally, in the Low Value of PV scenario, we also increase the growth rate for non-generation capital investments in conjunction with PV, to represent the possibility that integration costs for customer-sited PV could result in a net increase in distribution system expenditures. Table 4. Value of PV Sensitivity Case Assumptions
Case
Capacity credit at 0% penetration (for generation
deferral)
Change in capacity credit per 1% increase in PV
penetration
Portion of generation capacity
credit applied at the T&D level
T&D cost escalation rate
(2013-2022)
SW Utility
High Value of PV 78% -1.0% 40% 1.9%/yr Base 78% -5.7% 20% 1.9%/yr Low Value of PV 19% -1.0% 0% 2.4%/yr
NE Utility
High Value of PV 68% -1.0% 100% 3.7%/yr Base 68% -4.6% 33% 3.7%/yr Low Value of PV 19% -1.0% 0% 4.7%/yr

35
Given these alternate underlying assumptions, the resulting ranges in the value of PV are as shown in Table 5.31 Roughly 60-75% of the difference in value of PV between the Low and High scenarios for each utility is associated with non-generation (i.e., T&D-related) capital expenditures, with the remainder associated primarily with some combination (depending on the utility) of generation capital expenditures and market purchases of generation and transmission capacity. As to be expected, the range of values in Table 5 span a narrower range than within the broader literature (Hansen et al. 2013) summarized in Text Box 3. Those latter estimates reflect variations across a much broader set of drivers for avoided costs (not just those associated with the capacity credit of customer-sited PV on the bulk power and T&D systems), as well as differences in the set of avoided cost categories included. Thus the value of PV sensitivity cases presented here should, by no means, be considered to represent the full possible range in the value of avoided costs to the utility or to society more broadly. Table 5. Average Avoided Costs across Value of PV Sensitivity Cases (20-yr) Low Base High SW Utility $0.04/kWh $0.09/kWh $0.13/kWh NE Utility $0.08/kWh $0.12/kWh $0.17/kWh Note: Values reported here are the avoided cost per unit of PV production (i.e. $/kWh-PV) As shown in Figure 20, the impacts of customer-sited PV on shareholder earnings vary widely under these different assumptions related to the value of PV. Under the high value of PV scenarios, customer-sited PV results in greater reductions in capital expenditures than in the base case and thus, as a result, there are greater lost future earnings opportunities for the utility, exacerbating the earnings impacts. Under the low value of PV scenarios, the earnings impacts are correspondingly more moderate, as fewer capital expenditures are deferred.32 The rate impacts from customer-sited PV are also quite sensitive to the value of PV, but move in the opposite direction: increasing under the low value of PV scenario (whereby customer-sited PV is less effective at reducing utility costs) and decreasing under the high value of PV scenario. Of some note, customer-sited PV leads to a slight reduction in average retail rates for the SW Utility under the high value of PV scenario. This occurs because the reduction in utility costs from PV exceeds the reduction in utility revenues. The high degree of sensitivity of shareholder and ratepayer impacts to the value of PV – and the divergent implications of that sensitivity for shareholders versus ratepayers – has several implications. First, it reinforces the importance of efforts aimed at improving the data and methods for estimating the value of PV. Better understanding of the capacity value and avoided T&D costs of PV improves estimates of the impact of PV on shareholders and ratepayers. Second, it shows that, even within the somewhat limited range of assumptions about the value of PV considered here, it is conceivable that customer-sited PV could result in virtually no increase
31 The value of PV is calculated as the difference in utility revenue requirements (on an NPV basis over 20 years) with and without PV, per unit of PV energy. 32 In contrast to the earnings impacts, ROE impacts are relatively insensitive to alternate assumptions about the underlying value of PV. As previously discussed, ROE impacts from customer-sited PV are driven by its differential effect on utility costs vs. revenues. An increase (decrease) in the value of PV leads to a corresponding decrease (increase) in cost growth. However, that change in costs is a relatively small fraction of total utility costs, leading to the modest degree of sensitivity for the ROE impacts.

36
or perhaps even a slight decrease in average retail rates. And third, the results are suggestive of the potential to mitigate the ratepayer impacts of customer-sited PV through deployment strategies that seek to maximize its capacity deferral value (e.g., by placing PV in locations or with orientations that maximize its capacity credit). Policymakers must recognize, however, that such strategies may run counter to the financial interests of utility shareholders, whose earnings would be further eroded by greater reductions in capital expenditures.
Figure 20. Sensitivity of PV Impacts to Value of Solar
-35%
-30%
-25%
-20%
-15%
-10%
-5%
0%
SW NE
Chan
ge fr
om N
o-PV
to 1
0% P
V
Low Value of PV Base Case High Value of PV
Earnings Impacts (20-yr NPV)
-40%
-35%
-30%
-25%
-20%
-15%
-10%
-5%
0%
SW NE
ROE Impacts (10-yr Avg.)
-1%
0%
1%
2%
3%
4%
5%
SW NE
Rate Impacts (20-yr Avg.)

37
Text Box 3. Estimates of the Value of Customer-Sited PV The model used in this analysis is not specifically designed to estimate the value of PV; however, the estimates used within this study can be compared to those in the literature, which have often been developed using more-tailored tools. One recent meta-analysis (Hansen et al. 2013) compared estimates of the value of PV from studies conducted over the past decade, and found widely varying results, ranging from 3.6 cents/kWh to over 34 cents/kWh. The range in estimates is due in part to differences in assumptions about future costs, differences in methodologies, and differences in scope (e.g., value of PV from a societal perspective or a ratepayer perspective). Across studies, the range of the energy value of PV is 2.5 to 10.5 cents/kWh (driven in part by different fuel costs), the range of capacity value is 1 to 11 cents/kWh (driven by differences in the contribution of PV to reducing peak demand and the need for new capacity), the range in T&D value is 0 to 8.5 cents/kWh (depending on the ability of PV to defer investments), and the range in the environmental value is 0 to 4 cents/kWh (depending on which environmental impacts are quantified). As described in Section 4, the value of PV in our Base Case declines from 10.3 to 8.5 cents/kWh for the SW Utility and from 15.8 to 12.3 cents/kWh for the NE Utility, when moving from the 2.5% to 10% penetration scenarios. The differences between the SW and NE Utilities are primarily due to differences in energy and capacity value. The value of PV estimated in our High and Low Value of PV sensitivities ranges from 4 to 17 cents/kWh across the utilities and scenarios at 10% PV penetration. These estimates of the value of PV all fall within the broad range reported in the literature. That said, a large portion of the change in value in our sensitivities is due to changes in non-generation capital expenditures.33 The range of the value of PV in the broader literature, however, is driven in part by differences in estimates of avoided T&D costs, but other factors like differences in avoided energy, capacity, and environmental impacts contribute just as much to variations in the estimates of the value of PV.
33 For example, the decrease in SW Utility non-generation capital expenditures from the High Value of PV case to the increase in the Low Value of PV case leads to a change in the value of PV of 7.3 cents/kWh. Similarly, the range due to differences in the non-generation capital expenditures in the High and Low Value of PV case for the NE Utility is 5.3 cents/kWh.
Source: Hansen et al. (2013) Figure 21. Comparison of the Estimated Value of PV across Recent Studies

38
5.3 Low load growth exacerbates the impacts of customer-sited PV on rates and ROE Load growth can vary substantially over time and among utilities, and is also subject to great uncertainty given the many underlying drivers at play (e.g., EE policies and programs, vehicle electrification, and macroeconomic trends). Within the context of the present analysis, load growth is important because of its relationship to the size and timing of utility capital expenditures (which also affects the timing of rate cases), the volume of retail sales over which fixed costs are spread, and the collection of utility revenues based on actual retail sales and peak demand levels. As discussed further below, however, these relationships are complex and, at times, somewhat idiosyncratic. In order to characterize how the shareholder and ratepayer impacts of customer-sited PV depend on underlying load growth, we developed Low and High Load Growth sensitivities where the compound annual growth rates (CAGR) for both sales and peak demand were adjusted by +/- 2% relative to the Base Case (see Table 6).34 The Low Load Growth cases thus entail roughly zero load growth for the SW Utility and slightly negative load growth for the NE Utility, while the High Load Growth cases entail growth rates on the order of roughly 3.5-4% per year. In conjunction with the load growth adjustments, we also adjusted the generation capacity expansion plan for the SW Utility and the amount of growth-related non-generation capital expenditure in order to maintain internal consistency across load growth scenarios.35 Table 6. Load Growth Assumptions in the Low and High Load Growth Sensitivities (CAGR)
Low Base High
SW Utility Sales 0.1% 2.1% 4.1% Peak Demand 0.1% 2.1% 4.1%
NE Utility Sales -0.6% 1.4% 3.4% Peak Demand -0.5% 1.5% 3.5%
As shown in Figure 22, the impact of customer-sited PV on achieved ROE varies with load growth, though the degree of sensitivity depends on whether ROE impacts are measured in absolute or relative terms. For both utilities, ROE impacts are less severe with higher underlying load growth and, conversely, more severe with lower underlying load growth. This occurs because higher load growth is associated with greater growth-related capital expenditures, which in turn creates greater opportunities for cost savings from PV through deferral of those expenditures, thereby muting the impacts of PV on achieved ROE. In addition, the increased 34 Load forecasts for several SW balancing authorities are presented in Appendix A. The EIA Annual Energy Outlook projects load growth of 0.3%/yr in New England, for the period 2012 to 2040, with a range in year-over-year growth of 0.1% to 0.6%/yr. For the Mountain region, EIA projects average growth of 1.3%/yr, with year-over-year growth ranging from 1.0% to 1.7%. EIA also reports that over the past thirty years the national average load growth (three-year moving average) ranged from -0.8% (in 2009) to 5.2% (in 1989). 35 More specifically, we adjusted assumptions related to non-generation capital expenditures to ensure that the amount of non-generation capital expenditures that are not related to growth was the same across all three scenarios. We further increased growth related capital expenditures in the High Load Growth case and decreases the growth related capital expenditures in the Low Load Growth case for both utilities. For the NE Utility, none of the non-generation capital expenditures are related to load growth in the Low Load Growth case (due to the decrease in load from year to year), and thus PV does not result in any reduction to those costs.

39
pace of capital expenditures under high load growth triggers more frequent GRCs (for the SW Utility), which further moderates the impacts of customer-sited PV on ROE, as the utility is able to set new rates more frequently and thereby achieve closer alignment between its revenues and costs. When ROE impacts are measured in terms of a percentage change from the no-PV case, the sensitivity is somewhat more acute than when measured in terms of absolute, basis-point changes. This is because higher (lower) load growth leads to higher (lower) absolute levels of ROE in cases without PV, for the reasons noted above.36 Thus, for basic arithmetic reasons, the basis-point changes caused by the introduction of customer-sited PV lead to larger swings when measured as a percentage of the ROE without PV.
Figure 22. Sensitivity of PV Impacts to Load Growth The sensitivity of the achieved earnings impacts from PV to load growth is somewhat more complex and involves several interrelated dynamics. The dependence of earnings impacts on underlying load growth partly are a function of the same dynamics described above in connection with ROE impacts (i.e., revenue growth between rate cases and frequency of rate cases). In addition, the underlying rate of load growth also affects the magnitude of capital expenditures, and thus the potential lost earnings opportunities associated with deferral of those expenditures. These various dynamics operate in opposing directions – for example, greater underlying load growth would tend to reduce earning erosion associated with lost revenues but increase earnings erosion associated with deferred capital expenditures – hence the irregular relationships exhibited in Figure 22. In the case of the NE Utility, these countervailing dynamics offset one another almost equally in both sensitivity cases, leading to effectively no change in absolute earnings impacts across cases. However, since the absolute earnings without PV are much smaller in the Low Load Growth case and much higher in the High Load Growth case, the earnings impacts on a percentage basis are highly sensitive to underlying load growth. The retail rate impacts from PV are also sensitive to load growth, with larger increases in average rates occurring in the case of low load growth and smaller rate increases occurring with 36 For the SW Utility, average ROE without PV was 7.4% in the Low Load Case and 8.6 % in the High Load Case, and for the NE Utility, it was 4.1% in the Low Load Case and 8.6% in the High Load Case.
-$700
-$600
-$500
-$400
-$300
-$200
-$100
$0
-40%
-35%
-30%
-25%
-20%
-15%
-10%
-5%
0%
SW NE
Chan
ge fr
om N
o-PV
to 1
0% P
V
Low Load Growth Base Case High Load Growth right-hand axis (basis points, $M, ¢/kWh)
Earnings Impacts (20-yr NPV)
-160
-140
-120
-100
-80
-60
-40
-20
0
-40%
-35%
-30%
-25%
-20%
-15%
-10%
-5%
0%
SW NE
ROE Impacts (10-yr Avg.)
0.0
0.2
0.4
0.6
0.8
1.0
0%
1%
2%
3%
4%
5%
SW NE
Rate Impacts (20-yr Avg.)

40
higher load growth. This occurs due to the same dynamic discussed in connection with the ROE impacts: higher load growth requires greater capital expenditures in the case without PV, and thus greater opportunities for deferral of capital expenditures and cost savings from PV. 5.4 Shareholder impacts are more severe with retail rates that rely predominantly on
volumetric energy charges and less severe when rates have larger fixed charges Utility rate designs often follow similar general principles (e.g., stability in revenues, avoidance of undue discrimination, and fairness in allocation of costs among customer classes) but, in practice, allocation of revenue collection to energy, demand, and fixed customer charges can vary significantly across utilities. In order to examine how the impacts of PV may depend upon prevailing rate design, we developed sensitivity cases that assume varying degrees of reliance on energy charges and fixed customer charges.37 Note that the sensitivity analysis here assumes these alternative rate designs both with and without PV, in recognition of the fact that a wide variety of rate designs are in use today for reasons unrelated to customer-sited PV. Within the mitigation analysis in Section 6, we instead explore the potential role of fixed customer charges and high demand charges as a strategy specifically for mitigating the financial impacts of customer-sited PV, in which case we consider a more extreme change in rate design that is implemented only in conjunction with the growth of PV. Table 7 shows the composition of total utility revenues (or customer bills) for the base case and two sensitivity cases. For the High Energy Charges case, we assume that the costs allocated in the base case to fixed customer charges are instead allocated to volumetric energy charges (and leave the allocation to demand charges unchanged). For the High Customer Charges case, we assume a larger proportion of non-fuel costs are allocated to customer charges and correspondingly smaller proportion allocated to volumetric energy charges, compared to the base case (and leave fuel costs fully allocated to energy charges and the demand charges unchanged). The proportion of non-fuel costs allocated to customer charges was chosen such that the portion of total customer bills comprised of fixed customer charges doubles from the base case (e.g., fixed customer charges increase from 12% in the base case to 24% in the high customer charge case for the SW Utility). Table 7. Rate Design Sensitivity Cases (Percent of Total Utility Revenues, without PV) High Energy Charges Base Case High Customer Charges SW Utility
Energy Charges 89% 77% 65% Demand Charges 11% 11% 11% Customer Charges 0% 12% 24%
NE Utility Energy Charges 92% 84% 76% Demand Charges 8% 8% 8% Customer Charges 0% 8% 16%
37 Other important variations in utility rate designs may affect the impact of PV on utility shareholders and ratepayers, which we do not explore here but highlight as potential areas for follow-on analysis. These include tiered rates, time-of-use rates, and alternative PV compensation mechanisms such as value of solar tariffs.

41
As shown in Figure 23, the impacts of customer-sited PV on achieved ROE and earnings are more severe under the High Energy Charges case and less severe under the High Customer Charges case. In general, the greater the reliance on volumetric energy charges, the greater the impact customer-sited PV will have on a utility’s collected revenue (given our assumption that the PV is net-metered and therefore offsets volumetric sales on a one-for-one basis) and the greater the resulting impact on shareholder ROE and earnings. Conversely, the greater the reliance on fixed customer charges or demand charges, the smaller the impact of PV on collected revenues and utility shareholder profitability. The rate impacts of customer-sited PV are relatively insensitive to changes in rate design, with modestly smaller impacts under rate designs that rely heavily on volumetric energy charges and slightly larger impacts with rate designs relying more heavily on customer charges. These results may appear counter-intuitive on first glance and must be interpreted carefully, in light of how the average rate metric is calculated and what it means. As explained in Section 4, average all-in retail rates represent total collected revenue divided by total retail sales, across all customers, including both PV and non-PV customers. With higher fixed charges, the utility collects more revenues from customers with PV, which in turn translates to higher average retail rates and thus a greater change in average rates between cases with PV and without PV. By the same logic, the impact of PV on average rates is smaller when retail rates have larger volumetric energy charges. Importantly, however, we cannot infer from these results how the rate impacts for customers without PV vary with these alternate rate designs.
Figure 23. Sensitivity of PV Impacts to Rate Design 5.5 Greater lag between when a utility incurs costs and when those costs are reflected in
new rates heightens the impacts of PV on utility shareholders, but mutes the impacts on ratepayers
Current ratemaking practices vary considerably across utilities and states, in terms of: rate case filing frequency, the period of time between the filing of a rate case and implementation of new rates (i.e., regulatory lag), and the type of test year. Accordingly, we developed a series of
-35%
-30%
-25%
-20%
-15%
-10%
-5%
0%
SW NE
Chan
ge fr
om N
o-PV
to 1
0% P
V
High Energy Base Case High Fixed Charge
Earnings Impacts (20-yr NPV)
-40%
-35%
-30%
-25%
-20%
-15%
-10%
-5%
0%
SW NE
ROE Impacts (10-yr Avg.)
0%
1%
2%
3%
4%
5%
SW NE
Rate Impacts (20-yr Avg.)

42
sensitivity cases to assess how the shareholder and ratepayer impacts of customer-sited PV may vary across differing ratesetting regimes. For the sensitivity cases, we consider longer (5-year) or shorter (2-year) periods between GRCs, longer (2-year) or shorter (0-year) periods of regulatory lag, and the use of current and future test years (i.e., where test year utility revenue requirement and billing determinants are based on the year of the GRC or on projections for the following year).38 This set of sensitivities is intended to reflect the range of practices used by utilities and regulators across the country. As in the case of the preceding rate design sensitivities, we apply the alternative-ratesetting-approaches to both the with-PV and without-PV cases, in order to assess how the shareholder and ratepayer impacts of PV may vary, given the range of ratesetting practices in place today. Later, in Section 6, we instead examine how these ratesetting practices might potentially serve as a strategy for mitigating the shareholder impacts of PV, if introduced in conjunction with the growth of customer-sited PV. For clarity the figures in this section present only the sensitivity cases where the impact of PV is the largest (longer periods between GRCs) or the smallest (future test years); the remaining results can be seen in Figure 18 and Figure 19 and Appendix D. In general, the greater the lag between when a utility incurs costs and when those costs are reflected in new rates, the greater the impact of customer-sited PV on collected revenues and thus on shareholder profitability. As such, we observe larger impacts on achieved ROE and earnings in cases involving longer filing frequencies (i.e., less frequent rate cases), greater regulatory lag, or reliance on historic test years. Of these cases, the largest impact was observed with longer filing frequencies (see Figure 24). Conversely, the impacts are smaller with cases involving more frequent rate cases, less regulatory lag, or current or future test years. The shareholder impacts from PV are more sensitive to variations in these ratemaking conditions in the case of the NE Utility, given the more significant underlying misalignment between growth in non-fuel costs and retail sales. The rate impacts exhibit the opposite set of relationships, though the degree of sensitivity is rather modest. The longer period of time between the setting of new rates results in a reduction in the impact of customer-sited PV on average retail rates. We therefore observe in Figure 24 that the increase in average all-in retail rates caused by PV is somewhat smaller in cases involving less frequent rate cases, greater regulatory lag, or reliance on historic test years (and is somewhat greater under the converse set of conditions).
38 For the base case, we assume that the utilities file GRCs every three years and, in the case of the SW Utility, after any capital investment exceeding $900 million. We also assume that the utilities use an historical test year for establishing revenue requirements and that new rates go into effect one year after the GRC is filed.

43
Figure 24. Sensitivity of PV Impacts to Long Rate Case Frequency and use of a Future Test Year 5.6 Shareholder and ratepayer impacts from PV vary modestly across the range of cost-
related assumptions examined We conducted a variety of other sensitivities that examine how shareholder and ratepayer impacts of PV depend on various cost-related elements of utility operating environments. These additional sensitivity cases included alternate assumptions about growth in fixed O&M costs, non-generation (i.e., T&D) capital expenditures, and fuel and purchased power costs; the capacity cost of utility-owned generation (SW Utility); ISO-NE FCM costs (NE Utility); the share of generation capacity consisting of utility-owned generation (SW Utility); early retirement of coal capacity with replacement by gas-fired generation (SW Utility); and ratepayer-funded rebates for customers to install PV. As shown previously in Figure 18 and Figure 19, the shareholder and ratepayer impacts of PV vary to only a limited extent across most of these sensitivity cases, with two principal exceptions. The first is the set of sensitivities related to UOG costs for the SW utility, where higher costs lead to higher shareholder earnings erosion from PV, and lower costs lead to lower earnings erosion. Because shareholders generate earnings from capital investments in utility-owned generation, the higher the cost of that generation, the greater the earnings, and thus the greater erosion of earnings if those capital expenditures are deferred. The other cost-related scenario exhibiting a significant degree of sensitivity is the case where the utility provides PV customers an up-front rebate (equal to $0.5/W), which results in a noticeable impact on average retail rates.39 The rebate is an additional utility cost that is ultimately collected from all ratepayers, and thus the incremental increase in average retail rates, beyond that occurring in the base case, is due to the cost of the rebate program.40 Although Figure 18
39 Such financial incentives have been common practice in the United States, though in recent years they have been phased out and/or supplanted by other kinds of financial incentives. 40 The model does not separate retail rate impacts of participants and non-participants, thus, we only represent rate impacts averaged across all customers.
-35%
-30%
-25%
-20%
-15%
-10%
-5%
0%
SW NE
Chan
ge fr
om N
o-PV
to 1
0% P
V
Long filing frequecy Base Case Future test year
Earnings Impacts (20-yr NPV)
-40%
-35%
-30%
-25%
-20%
-15%
-10%
-5%
0%
SW NE
ROE Impacts (10-yr Avg.)
0%
1%
2%
3%
4%
5%
SW NE
Rate Impacts (20-yr Avg.)

44
and Figure 19 focus on the rate impacts over the full 20-year analysis period, it is more instructive in the case of this sensitivity to consider the impacts over just the first 10 years, during which the rebates are disbursed. Over that timeframe, the rate impacts from PV are roughly doubled relative to the base case with only net metering but no rebate program (a 3.6% increase in average all-in retail rates for the SW Utility, compared to 1.8% in the base case, and a 3.3% rate increase for the NE Utility, compared to 1.5% in the base case). Note, though, that we have not assumed in this sensitivity that ownership of RECs generated by the customer-sited PV are transferred to the utility in exchange for the rebate; if such a transfer were to occur, the utility would be able to apply those RECs directly towards its RPS obligations, which would offset some or all of the rate impacts associated with the rebate program costs. In Section 6, we explore the potential rate impacts associated with transferring ownership of these RECs to the utility. Given these findings, the results for these cases illustrate several important relationships and themes. Of particular note, the sensitivity of shareholder impacts to underlying utility costs depends on the kind of cost and how it is recovered from ratepayers. Some costs are passed-through to customers through annual rate adjustments (e.g., fuel and purchased power costs).41 Because those costs are fully recovered from ratepayers both with and without customer-sited PV, the growth of customer-sited PV does not impact recovery of those costs, and therefore the shareholder impacts of PV are independent of the magnitude of those costs or their rate of growth. Other costs, however, affect the utility’s ratebase (e.g., non-generation capital expenditures and capacity costs for utility-owned generation). Utility shareholders earn a return on the equity of financing for those investments, and thus in general, the greater those underlying costs, the greater the impact of PV on shareholder earnings.
41 The ability for utilities to pass particular costs to rates without a general rate case depends on the regulatory environment. We assume that the SW and NE Utility have fuel-adjustment clauses (FAC) that allow rates to be adjusted in response to changes in fuel and purchased power costs. Not all utilities will have these sorts of clauses and may instead rely on rate cases to adjust fuel and purchased power related rates.

45
6. Mitigation Results: To what extent can the impacts of PV be mitigated through regulatory and ratemaking measures?
This section examines the effectiveness of various measures that could be implemented by utilities and regulators to mitigate the financial impacts of PV on shareholders and/or ratepayers (see Table 8). Though by no means exhaustive, this set of measures includes many of the regulatory and ratemaking strategies implemented or discussed in connection with EE programs, or analogues that might apply to PV.42 As suggested by Table 8, most of these measures specifically target the shareholder impacts from customer-sited PV (associated with either revenue erosion or lost earnings opportunities), and these measures may potentially exacerbate the ratepayer impacts from customer-sited PV, exemplifying one kind of tradeoff that can often arise. Table 8. Mitigation Cases and Targeted Intent Mitigation Measure Description Revenue
Erosion Lost Earnings Opportunities
Increased Rates
Revenue-per-Customer (RPC) Decoupling
Revenue decoupling is implemented by setting a revenue per-customer target in rate cases and adjusting rates annually between cases to collect revenues at the target level
● ○
Lost Revenue Adjustment Mechanism (LRAM)
Rates are adjusted annually to compensate the utility for the incremental loss of revenue occurring as a result of customer-sited PV
● ○
Shareholder Incentive
Utility shareholders receive additional earnings for the successful achievement of policy goals (in this case, related to customer-sited PV deployment)
● ○
Shorter Rate Case Filing Frequency The period between GRC filing is reduced ● ○
No Regulatory Lag
The lag between the filing of GRCs and implementation of new rates is eliminated ● ○
Current & Future Test Years
Current or future test years are used to set utility revenue requirement during GRCs ● ○
Increased Demand Charge & Fixed Charge
An increased share of non-fuel costs is allocated to demand or fixed customer charges ● ○
Utility Ownership of Customer-Sited PV
The utility owns customer-sited PV systems, leases the systems back to the host customers or to intermediaries, and earns a return on the assets
● ○
Customer-Sited PV Counted toward RPS
All net-metered PV counts toward the utility’s RPS compliance obligations ●
● Primary intended target of mitigation measure ○ May exacerbate impacts of customer-sited PV
42 For example, we do not consider value of solar tariffs, non-fuel cost trackers, formula rates, multi-year rate plans, or various other options identified in the literature (Bird et al. 2013, Lowry et al. 2013, Linvill et al. 2013, Kihm and Kramer 2014).

46
We examine each of the mitigation options in Table 8 in isolation, but note that several could be coupled with each other (or with other mitigation measures) as part of a more comprehensive solution (e.g., combining RPC decoupling with shareholder incentives). Potential solutions to mitigate the impacts of PV may be more viable if they address concerns of both ratepayers and shareholders; such “comprehensive business models” as they relate to utility-sponsored EE programs are discussed in more detail in Satchwell et al. (2011). As with the sensitivity analysis, the analysis of mitigation measures focuses on the 10% PV penetration scenario, in order to clearly reveal the effects of the mitigation measures considered. Were lower PV penetration levels assumed for this portion of the analysis, the results would be qualitatively similar but less discernible. Unlike the sensitivity analysis, however, the mitigation analysis involves changes from base case conditions that occur only in conjunction with PV. Thus we gauge the effectiveness of each mitigation measure in terms of the extent to which it restores shareholder earnings, shareholder ROE, and/or average rates to the levels that occur without PV under the base case utility conditions. We highlight key themes within this section that emerge from the analysis of mitigation measures. In doing so, we group functionally similar mitigation measures together and focus on the particular metric(s) and timeframe (either the first 10 years of the analysis period or the entire 20-year period) that are most relevant to the mitigation measure in question. For example, many of the mitigation measures serve principally to address the revenue erosion impacts from customer-sited PV, in which case our discussion of shareholder impacts focuses on achieved ROE over the first 10 years, along with any associated changes in average rates. Other measures may instead serve primarily to address lost earnings opportunities associated with PV, in which case our discussion of shareholder impacts focuses on earnings over the full 20-year analysis period. The full set of results for each mitigation case, including all three metrics both the 10- and 20-year analysis periods, are included for reference in Appendix E. As a final prefatory note, in the course of discussing the results of this analysis, we highlight how many of the mitigation measures considered may have divergent consequences for shareholders and ratepayers, or may entail tradeoffs with other policy or social objectives (e.g., increasing fixed customer charges may dampen the long-run price signal for energy conservation). Because of those issues and complexities, we stress that the following analysis represents neither an endorsement of any particular measure nor a complete examination of the broader set of implications associated with the measures considered. 6.1 Decoupling and LRAM can moderate the ROE impacts from PV, though their
effectiveness depends critically on design and utility characteristics The traditional electric utility business model in the United States provides a financial incentive for the utility to increase electricity sales between rate cases, commonly referred to as the “throughput incentive” (Eto et al., 1997, RAP 2011). A bias among utilities therefore exists against resources or policies, like EE or customer-sited PV, that decrease sales. Several regulatory tools have been used in the context of EE to mitigate this disincentive, including various forms of revenue decoupling as well as lost revenue adjustment mechanisms (LRAM), and we developed mitigation cases to explore their potential applicability for customer-sited PV.

47
Revenue decoupling is designed to address the misalignment of incentives towards EE and other demand-side resources by “decoupling” utility revenues from sales.43 Revenue-per-customer (RPC) decoupling is one form of decoupling that allows revenues to grow based on growth in the number of customers between rate cases, rather than on growth in retail sales.44 Another design element of decoupling is the application of a revenue growth factor, commonly called a “k-factor”. The k-factor allows the revenue (or revenue-per-customer) established in a GRC to grow between rate cases to better match growth in fixed costs between rate cases. This is particularly important for a utility facing the effects of high cost inflation and high fixed cost (e.g., labor costs, pension costs) growth. An LRAM, like decoupling, is also intended to address the “throughput incentive,” though it does so by reimbursing the utility specifically for lost revenues directly attributable to EE programs. Thus, unlike revenue decoupling, which fully severs the tie between sales and revenues, an LRAM is more narrowly focused on only sales reductions associated with EE programs (or, in our analysis, customer-sited PV).45 In practice, implementation of an LRAM can be contentious, as it requires estimation of the amount of energy saved as a result of the EE measure (Carter 2001). In this respect, LRAMs may be easier to implement for customer-sited PV than for EE, because PV production can be directly metered whereas the change in sales due to EE is more speculative. In order to illustrate their potential applicability to customer-sited PV, we developed mitigation scenarios involving two variants of RPC decoupling – one with a k-factor and one without a k-factor – and one mitigation case with an LRAM. For the mitigation case involving RPC decoupling without a k-factor, growth in collected revenues is set equal to growth in the number of customers between rate cases. For the mitigation case involving RPC decoupling with a k-factor, the k-factor is set at the value necessary to restore ROE to the level achieved in the base case without PV. Under the LRAM mitigation case, the utility collects additional revenue on an annual basis between rate cases, equal to the product of the energy produced by PV and the non-fuel volumetric energy rate. We assess the impact of these mitigation measures on achieved ROE and average retail rates by comparing the scenarios with 10% PV and the mitigation measure to scenarios with 10% PV and no mitigation measure (see Figure 25). As a point of reference, this figure and others throughout the remainder of this section also show the change in each metric between 0% and 10% PV under base-case conditions (i.e., with no mitigation measure), in order to illustrate the extent to which each mitigation measure either offsets or exacerbates the effect of PV. We focus our assessment of the effectiveness of RPC decoupling and LRAM on the change in achieved
43 Critics of decoupling contend that it removes the utility’s incentive to manage its costs between GRCs, among other things. 44 As of July 2013, 14 states had approved revenue decoupling mechanisms for at least one utility (IEE 2013). See RAP (2011) for a description of the different forms of decoupling. We model RPC decoupling because it is the most common. 45 As of July 2013, 18 states had approved lost-revenue adjustment mechanisms for at least one utility (IEE 2013).

48
average ROE, though the earnings impacts (which are included in Appendix E) are qualitatively similar. Achieved ROE Average Rates
SW U
tility
NE
Util
ity
Figure 25. Mitigation of PV Impacts through Decoupling and LRAM As shown in Figure 25, the various mitigation measures generally improve utility ROE, relative to cases with 10% PV and no mitigation measure, though to vastly varying degrees depending on the utility, the type of measure, and its design. With respect first to decoupling, implementing RPC decoupling without a k-factor leads to a 108 basis-point increase in achieved ROE for the SW Utility, resulting in an average ROE exceeding the level achieved without PV. This significant ROE improvement is due to the fact that growth in the number of customers is substantially higher than growth in non-fuel revenues in the base case with 10% PV,46 and thus the utility collects substantially greater revenues when those revenues are tied more closely to growth in the number of customers, as occurs with RPC decoupling. Conversely, customer growth is low for the NE Utility relative to growth in non-fuel revenues, thus RPC decoupling without a k-factor actually exacerbates ROE erosion. For both utilities, RPC decoupling with a k-factor restores ROE back to the level achieved without PV, under base case conditions. This outcome is by design, based on choice of the k-factor (which, in the case of our analysis, requires a negative k-factor for the SW Utility and a positive k-factor for the NE Utility). We see an improvement in achieved average ROE when we implement a LRAM in the case with 10% PV. A LRAM is designed to mitigate only the revenues lost due to the customer-sited PV savings (as opposed to the RPC decoupling mechanism that is designed to mitigate all lost revenues). To calculate the additional revenues to the utility from the LRAM, we multiplied the 46 Non-fuel revenues are the point of comparison because we assume the utility collects fuel revenues on an annual basis through an FAC, which perfectly matches fuel revenues with fuel and purchased power costs. Growth in non-fuel revenues is a function of growth in billing determinants (retail sales, peak demand, and number of customers).
8.0%-0.2%
+1.1%
+0.2%+0.2%
0% 2% 4% 6% 8% 10%
Base 0%Base 10%
RPC Decoupling - No kRPC Decoupling - with k
LRAM
Achieved After-Tax ROE (Avg.; 10-yr)
12.80
+0.23+0.34
+0.08 +0.07
0 5 10 15Average Rate (cents/kWh; 10-yr)
6.9%-1.2%-0.4%
+1.2%+0.4%
0% 2% 4% 6% 8% 10%
Base 0%Base 10%
RPC Decoupling - No kRPC Decoupling - with k
LRAM
Achieved After-Tax ROE (Avg.; 10-yr)
16.09
+0.23-0.02
+0.08+0.03
0 5 10 15 20Average Rate (cents/kWh; 10-yr)

49
energy savings from customer-sited PV by the non-fuel volumetric energy rate. In the SW Utility the LRAM virtually achieves ROE comparability, but in the NE Utility an LRAM is not enough to achieve ROE comparability. This is due primarily to the fact that the LRAM, as implemented in our analysis, only compensates the utility for lost non-fuel energy revenues and does not include utility revenues collected via a demand charge, which are also reduced by customer-sited PV. The NE Utility collects a larger proportion of non-fuel revenues from a demand charge than the SW Utility, and the LRAM, therefore, only compensates the NE Utility for a small proportion of lost revenues. To the extent that decoupling and LRAM mitigate the ROE impacts from customer-sited PV, they do so by increasing revenues, which necessarily increases average retail rates (given that average rates are simply total revenues divided by total retail sales).47 Thus, while these measures may mitigate the impact of PV on shareholders, tradeoffs exist in the form of increases in average retail rates (albeit fairly modest ones for the particular scenarios examined here), above and beyond any rate increases that occur as a result of customer-sited PV. In particular, excluding the case of RPC decoupling without a k-factor, the decoupling and LRAM cases result in additional rate increases of 0.07 to 0.08 cents/kWh (0.5 to 0.6%) for the SW Utility and 0.03 to 0.08 cents/kWh (0.2 to 0.5%) for the NE Utility. The fact that increase in rates needed to achieve ROE comparability is similar between the two utilities, even though ROE must increase to a greater degree for the NE Utility, reflects the relatively small ratebase of the NE Utility compared to the SW Utility. 6.2 Shareholder incentive mechanisms may be used to create utility earnings
opportunities from customer-sited PV While decoupling and LRAM mechanisms may mitigate the revenue erosion from demand-side resources such as PV and EE, they do not address the other fundamental disincentive that the traditional electric utility business model creates towards those resources. Namely, those resources, to the extent that they defer capital expenditures by the utility, also erode its opportunity to generate earnings from those capital investments. One solution to correcting that incentive misalignment is to allow the utility to collect additional revenues for successful implementation of EE programs or achievement of energy savings goals, thereby creating positive earnings opportunities from EE investments by the utility. Such so-called “shareholder incentive mechanisms” for EE have been used in many forms over the past two decades. Most commonly, shareholder incentives are based on a share of EE program costs or are calculated as a portion of the net benefits resulting from EE program implementation.48 Depending on their specific design, shareholder incentive mechanisms may
47 It may not always be the case that a decoupling mechanism results in increased customer bills. In particular, if a utility without decoupling collects more than its revenue requirement, the implementation of decoupling would result in a refund to customers. In addition, some jurisdictions (e.g., Colorado) have authorized “dead-bands” in conjunction with decoupling, in order to ensure that customer bills do not increase or decrease beyond a certain amount (e.g., 2%). 48 As of July 2013, 28 states had approved a shareholder incentive mechanism for at least one utility, broken out as: 8 states with incentives based on a percentage of EE program costs, 13 states with incentives based on shared net

50
encourage utilities to meet or exceed energy savings targets (e.g. performance targets or cost bonus mechanisms), to invest shareholder funds in EE programs (e.g. cost capitalization programs), or to pursue efficiency options that produce the greatest net benefit (e.g., shared net benefits) (Cappers and Goldman 2009). Because shareholder incentives for EE have generally been implemented in conjunction with utility-administered EE programs, we developed a mitigation case involving a shareholder incentive mechanism for customer-sited PV implemented in conjunction with a utility-administered PV rebate program.49 For the purpose of isolating the impact of the shareholder incentive, we also include this rebate program in the comparison case without the shareholder incentive. Specifically, we assume that the utility offers a $0.5/W rebate for customer-sited PV (i.e., the same program explored earlier within the sensitivity analysis), and that the shareholder incentive is equal to 10% of the rebate cost (i.e., $0.05/W of customer-sited PV capacity installed in each year), where these additional revenues go directly to utility earnings. This is similar to a “cost capitalization” shareholder incentive mechanism, as has been used for utility-administered EE programs. As shown in Figure 26, implementation of the modeled shareholder incentive mechanism increases both utilities’ average achieved earnings, relative to what occurs with 10% PV and no shareholder incentive.50 Under the specific shareholder incentive mechanism modeled here, earnings are not fully restored to the level achieved with no PV; naturally, the extent of earnings gains is a function of the design of the modeled shareholder incentive mechanism, where greater or lesser earnings gains could be achieved simply by increasing or decreasing the specified $0.05/W shareholder incentive. Important to note though is that shareholder incentives are generally not intended to achieve complete earnings comparability, but instead to compensate the utility only for the portion of earnings erosion associated with deferred/avoided capital expenditures (i.e., the lost earnings opportunity effect). As in the case of decoupling and LRAM, any increase in achieved earnings associated with a shareholder incentive mechanism is the direct result of increased utility revenues, which by definition implies an increase in average retail rates and thus a tradeoff between the impacts on shareholders and ratepayers. In the case of the specific shareholder incentive mechanism modeled here, the shareholder incentives increase average retail rates by 0.04 cents/kWh for the SW Utility and 0.05 cents/kWh for the NE Utility (in addition to the increases that occur as a result of customer-sited PV under base-case assumptions).
benefits, 4 states with incentives based on a percentage of avoided costs, and 3 states with incentive mechanisms approved but specifics yet to be determined (IEE 2013). 49 Even in cases where such programs are not offered, utilities may still be in a position to help or hinder the development of customer-sited PV through administrative practices related to net-metering and interconnection. A shareholder incentive may thus still be applicable in those cases by rewarding utilities for helping to reach policy goals related to the deployment of customer-sited PV. 50 We focus here on achieved earnings over the first 10 years, as that is the period over which shareholder incentives are provided (given that they are tied to administration of the PV rebate program, which is offered only over the initial 10 years). As discussed earlier (see Figure 15), additional earnings erosion from customer-sited PV occurs in the second 10-year period, due to deferral of capital expenditures in those years.

51
Achieved Earnings Average Rates SW
Util
ity
NE
Util
ity
Figure 26. Mitigation of PV Impacts through Shareholder Incentives 6.3 Alternative ratesetting approaches may also significantly mitigate ROE impacts from
customer-sited PV Similar to decoupling and LRAM, the mitigation measures in this section may also serve to mitigate the revenue erosion from customer-sited PV and the associated impacts on shareholder ROE. However, while decoupling and LRAM achieve that outcome by potentially increasing revenue collection through rate adjustments in between rate cases, the mitigation measures considered in this section do so by reducing the amount of time between when utilities incur costs and when those costs are reflected in rates. These options, herein referred to as “alternative ratesetting approaches”, include: more-frequent filing of rate cases, use of current or future test years in rate cases, and reduced regulatory lag between filing of rate cases and implementation of new rates. These measures boost utility revenues and shareholder ROE specifically in situations where utility costs are growing faster than its billing determinants, as is the case for both of the prototypical utilities under base-case conditions with 10% PV. Alternative ratesetting approaches such as these have been discussed in the literature as a mitigation measure to address the disincentive for utilities to pursue EE, and might similarly be considered in the context of customer-sited PV (e.g., Carter 2001, Lowry et al. 2013). In Section 5, we found that utilities with more contemporaneous ratesetting approaches are less sensitive to the addition of customer-sited PV, while here we consider the adoption of alternative ratesetting approaches specifically as means to mitigating the financial impacts of PV on utility shareholders (i.e., where these ratesetting approaches are adopted in conjunction with PV). To be sure, these ratesetting approaches entail a variety of important tradeoffs. More frequent filing of rate cases can reduce the incentives for utilities to minimize costs between rate cases and could potentially lead to perpetual rate cases (Carter 2001), which are costly and time
3,372
-193
+50
0 1,000 2,000 3,000 4,000
Base 0%
Base 10%
Shareholder Incentive
Achieved Earnings ($M NPV; 10-yr)
12.80
+0.23
+0.04
0 5 10 15Average Rate (cents/kWh; 10-yr)
461
-93
+47
0 200 400 600
Base 0%
Base 10%
Shareholder Incentive
Achieved Earnings ($M NPV; 10-yr)
16.09
+0.23
+0.05
0 5 10 15 20Average Rate (cents/kWh; 10-yr)

52
consuming for regulatory staff and intervenors. Future test years require the use of sophisticated cost forecasts for establishing revenue requirements and billing determinants, which can be contentious (Costello 2013). And administrative process requirements can limit the potential for reducing regulatory lag between when new rates are adopted and when they go into effect. Notwithstanding these important tradeoffs and limits, our analysis shows that these alternative ratesetting approaches may mitigate the impact of PV on achieved ROE. In fact, for the particular utilities and mitigation cases examined here, in most cases these measures more-than-offset the erosion in shareholder ROE caused by PV under base-case utility conditions, in which case they may be deemed as going “too far” in attempting to mitigate the effects of PV. As shown in Figure 27, the increase in ROE is most pronounced when switching from an historical test year to a future test year, resulting in an average ROE for both utilities that substantially exceeds the levels achieved under base case conditions without PV. Switching from an historical test year to a current test year or reducing regulatory lag by one year (which are functionally equivalent within the financial model used for this analysis) also increase achieved ROE to levels above the base-case ROE with no PV. Shortening the rate case filing frequency from three years to two years also mitigates the ROE impacts, though to a lesser extent than the other measures, and in the case of the NE Utility, only partially restoring achieved ROE back to the level achieved in the base case without PV. Achieved ROE Average Rates
SW U
tility
NE
Util
ity
Figure 27. Mitigation of PV Impacts through Alternative Ratesetting Approaches As with decoupling and LRAM, improved shareholder ROE under the mitigation measures considered here occurs as a result of increased revenue collection, which by definition entails an increase in average retail rates (beyond that which occurs in the base case with no PV). As noted above, however, in the case of these alternative ratesetting approaches, the increased revenues and thus the associated increase in average retail rates occurs specifically in cases where the
8.0%-0.2%
+0.3%+0.7%+0.7%+1.6%
0% 2% 4% 6% 8% 10%
Base 0%Base 10%
Short Filing FrequencyNo Regulatory LagCurrent Test YearFuture Test Year
Achieved After-Tax ROE (Avg.; 10-yr)
12.80 +0.23+0.09+0.21+0.21+0.48
0 5 10 15Average Rate (cents/kWh; 10-yr)
6.9%-1.2%
+0.7%+1.4%+1.4%+3.2%
0% 2% 4% 6% 8% 10%
Base 0%Base 10%
Short Filing FrequencyNo Regulatory LagCurrent Test YearFuture Test Year
Achieved After-Tax ROE (Avg.; 10-yr)
16.09 +0.23+0.05+0.09+0.09+0.21
0 5 10 15 20Average Rate (cents/kWh; 10-yr)

53
utility’s costs are increasing faster than its billing determinants. Under these particular conditions, more-contemporaneous ratesetting approaches improve the ability of the utility to reflect those cost increases in its retail rates, thereby potentially mitigating the impacts of customer-sited PV on shareholder ROE while exacerbating its impacts on average rates. 6.4 Increased fixed customer charges and demand charges can moderate the impact of
PV on shareholder ROE, but in some cases may exacerbate those impacts We assess the effectiveness of changes in rate design as a mitigation measure where the utility increases the share of revenue collected through demand or fixed customer charges in response to increased deployment of customer-sited PV. Because a large proportion of the utility’s total costs are fixed in the short run (i.e., do not vary between rate cases with changes in consumption), collection of revenue based on a fixed charge may better match revenues to costs between rate cases, especially in an environment with low load growth. Similarly, an increase in revenue collected from demand charges may reduce the impact to utility collected revenues from declines in retail energy sales, because EE and PV do not reduce demand by as much as they reduce energy sales. Such changes to rate designs have often been proposed on occasion in order to mitigate the revenue erosion impacts of EE, and have been discussed more broadly as a strategy for better aligning utility revenues and costs (RAP 2011, EEI 2013, Hledik 2014).51 Important policy tradeoffs, however, arise in connection to increased fixed customer charges or demand charges, and corresponding decreases in volumetric energy charges. The first is that higher fixed charges reduce the incentive for customers to conserve energy and to invest in PV. Alternatively, high fixed charges might motivate customers to invest in onsite generation with storage, and to bypass the utility altogether – which would further exacerbate the problems that the change in rate design was intended to address in the first place. These potential dynamics highlight one important difference between high fixed customer charges and RPC decoupling: although both measures similarly tie utility revenues more closely to the number of customers (and growth therein), RPC decoupling does so in a manner that maintains the same volumetric charges for customers, and thus does not diminish customers’ incentive for EE and distributed generation (or provide an increased incentive for grid defection). A separate but related policy tradeoff is that, in general, increased fixed customer charges limit customers’ ability to manage their total utility bill, which may raise concerns related specifically with respect to low- and fixed- income customers. Increased demand charges may entail less severe tradeoffs than occur with high fixed customer charges, but many utilities do not have the meter capabilities to record and bill demand for residential customers, and thus a greater reliance upon demand charges for residential customers would require deployment of the necessary metering and billing systems.
51 In particular, a form of rate design called straight-fixed variable (SFV) , where by fixed utility costs are recovered primarily through fixed customer charges, has been implemented in three states for electric utilities and 9 states for gas utilities (EEI 2013). Similarly some utilities are implementing fixed charges that are applied only to customers with PV (e.g., APS in Arizona, Dominion Virginia Power in Virginia). The motivation for targeted fixed charges is to ensure that customers with PV still contribute to covering a portion of the fixed costs of the utility system needed to serve customers with PV. Challenges in making these decisions include: determining what portion of costs are truly fixed in the long-run, determining how much of a cross-subsidy between participants and non-participants is acceptable, and balancing market transformation goals with considerations of equity, among others. We do not model targeted fixed customer charges, but note the importance of this issue for future analyses.

54
Although we do not examine these various policy tradeoffs within the context of the present analysis, we highlight their potential importance for decision-makers and for future studies. For the purpose of our mitigation analysis, we specified two scenarios involving alternative rate designs – a high demand charge case and a high fixed customer charge case – applied to all customers. Both entail shifting all non-fuel costs that were recovered through volumetric charges in the base case to either demand charges (in the high demand charge case) or fixed customer charges (in the high fixed customer charge case). The resulting share of revenue collected through volumetric, demand, and fixed charges is shown in Table 9. Note that the high fixed customer charge case in this mitigation analysis is more heavily weighted towards customer charges than the high fixed customer charge case in the sensitivity analysis in Section 5. Note also that the shift in revenue allocation, from one scenario to another, is more severe for the SW Utility than for the NE Utility, because the NE Utility relies on energy market purchases to meet its entire retail sales obligation, and those costs are collected through volumetric energy charges in all cases. Finally, it is important to reiterate that these rates are applied to all customers (i.e., both those with PV and without PV) and to all rate classes, though we acknowledge that many of the rate design discussions surrounding PV involve changes to rate design just for customers with PV.52 Table 9. Rate Design Mitigation Cases (Percent of Total Utility Revenues)
Base Case High Demand Charges High Customer Charges SW Utility
Volumetric Charges 77% 24% 24% Demand Charges 11% 63% 11% Customer Charges 12% 12% 65%
NE Utility Volumetric Charges 84% 64% 64% Demand Charges 8% 28% 8% Customer Charges 8% 8% 28%
In general, the results of these mitigation scenarios show that shifting revenue collection from volumetric energy charges to demand charges or fixed customers charges can mitigate shareholder impacts from customer-sited PV, though the degree of mitigation – and, indeed whether or not the shareholder impacts from PV are mitigated or exacerbated – depends critically on the specific circumstances of the utility. In describing the shareholder impacts of these mitigation measures, we focus here on the impacts to ROE, as rate design measures principally serve principally to address issues associated with revenue erosion, rather than lost earnings opportunities; however the impacts of each mitigation measure on achieved earnings are included for reference in Appendix D. As shown in Figure 28, moving to a rate design with high fixed customer charges has dramatically different impacts on the SW Utility and NE Utility. In particular, the SW Utility sees a significant improvement in achieved average ROE with a high fixed customer charge, 52 The financial model used for this analysis does not distinguish between participants and non-participants, or among customer classes, but future editions of the model and future research will explore differential rate designs for customers with and without PV, and for different rate classes.

55
with the increase in ROE more than offsetting the erosion in ROE that occurs under the 10% PV scenario with base case rate design assumptions. In contrast, the NE Utility sees a further erosion of shareholder ROE under the high fixed customer charge case. The differing results for the two utilities reflect underlying differences in the relative growth rate for the number of customers compared to growth rate for retail sales. The SW Utility has customer growth of 2.7% per year compared to 1.7% annual growth in retail sales with 10% PV, while the NE Utility has customer growth of 0.3% per year compared to 1.0% annual growth in retail sales with 10% PV (from 2013 to 2032). As a result, tying growth in revenues more closely to growth in the number of customers increases revenue collection by the SW Utility, better aligning revenues and costs between rate cases, while the opposite occurs for the NE Utility. These divergent results for the two utilities mirror those that occur under the mitigation scenario involving RPC decoupling without a k-factor, for the same underlying reasons. Achieved ROE Average Rates
SW U
tility
NE
Util
ity
Figure 28. Mitigation of PV Impacts through Increased Customer Charges or Demand Charges Moving to a rate design with high demand charges has a much more modest impact, compared to the high fixed charge scenario, resulting in a small increase in achieved ROE (relative to the base case at 10% PV penetration) for both utilities. These increases in achieved ROE reflect the fact that, for both prototypical utilities, growth in peak demand is greater than growth in retail sales with 10% PV. Tying non-fuel revenues to peak demand therefore allows the utility to collect greater revenues between rate cases than under the base case rate design. Any increase in achieved ROE due to a shift towards higher fixed customer charges or demand charge is the direct result of an increase in total utility revenue collection. As with all of the other mitigation measures discussed thus far that also serve to increase revenues, some increase in average retail rates also occurs (beyond the increase that occurs in the base case with PV). As such, Figure 28 shows that average rates increase under the high fixed charge scenario for the
8.0%
-0.2%
+0.2%
+0.9%
0% 2% 4% 6% 8% 10%
Base 0%
Base 10%
High Demand Charge
High Fixed Charge
Achieved After-Tax ROE (Avg.; 10-yr)
12.80
+0.23
+0.07
+0.29
0 5 10 15Average Rate (cents/kWh; 10-yr)
6.9%
-1.2%
+0.1%
-0.2%
0% 2% 4% 6% 8% 10%
Base 0%
Base 10%
High Demand Charge
High Fixed Charge
Achieved After-Tax ROE (Avg.; 10-yr)
16.09
+0.23
+0.01
-0.02
0 5 10 15 20Average Rate (cents/kWh; 10-yr)

56
SW Utility and under the high demand charge scenario for both utilities. Important to note, however, is that such an increase in rates represents the average increase across all customers, and the impacts may differ substantially between customers with and without PV. Therefore one cannot conclude from this analysis how a move towards these particular rate design scenarios would impact customers without PV, and whether or not it would mitigate any increase in those customers’ rates that otherwise occur as a result of customer-sited PV.53 6.5 Utility ownership of customer-sited PV may offer sizable earnings opportunities,
potentially offsetting much of the earnings impacts from PV that otherwise occur As with EE, customer-sited PV can erode shareholder earnings as a result of deferred or avoided capital expenditures, in addition to the earnings erosion associated with any mismatch in its effect on utility costs and revenues. In order to mitigate the shareholder impacts of lost earnings opportunities resulting from EE, utilities in some jurisdictions have been allowed to finance customer EE measures and earn an authorized return on those investments. Similarly, the lost earnings opportunities resulting from customer-sited PV could be mitigated by allowing customer-sited PV to become a regulated investment opportunity for utilities (SEPA 2008, SEPA 2009). This might involve full utility ownership of customer-sited PV assets, as proposed by APS and Tucson Electric Power (TEP), or may consist of utility financing of customer investments, similar to Public Service Electric and Gas (PSE&G)’s Solar Loan Program.54 To be sure, utility ownership or financing of customer-sited PV may raise a variety of significant policy and regulatory questions, not the least of which being whether a regulated utility should be allowed to provide a service similar to that provided by unregulated, competitive companies (including, in some cases, unregulated affiliates of the utility). In the case of a regulated utility, ratepayers would generally bear some portion of the risk of such investments. Furthermore, some states no longer allow regulated utilities to own generation (as in our NE Utility), in which case utility ownership of customer-sited generation may be prohibited or would require special authorization.55 Putting aside those important policy questions, we assume for the purpose of our analysis that the regulated utility is allowed to own customer-sited PV56 and earn its authorized rate of return on those assets. We consider two scenarios: one bookend scenario in which the utilities own 100% 53 As noted elsewhere in this report, LBNL expects to conduct follow-up analyses to examine the differential impacts of changes in rate design on customers with and without PV. 54 The APS and TEP proposals differ in important ways, but both would involve utility ownership of PV systems installed on customer rooftops. Under the PSE&G Solar Loan program, the regulated utility provides loans to residential and commercial customers to purchase PV systems (which are net-metered), and the utility is allowed to add the cost of the program to its ratebase. 55 See Wiser et al. (2010) for examples of utility ownership of customer-sited PV, including the Massachusetts Green Communities Act of 2008, which allows the state’s regulated electric distribution companies to construct, own, and operate up to 50 MW of solar generation each. 56 We assume that customer-sited PV costs $5.5/Wdc in 2010 and declines linearly to $2.1/Wdc in 2020, which corresponds to the mid-point cost reduction case from DOE’s SunShot Vision Study (DOE 2012). We also assume that the utility is able to take advantage of the 30% investment tax credit (ITC) for installations prior to the end of 2016 and a 10% ITC for installations after 2016 (as would be the case for systems owned by any commercial entity, including a regulated utility).
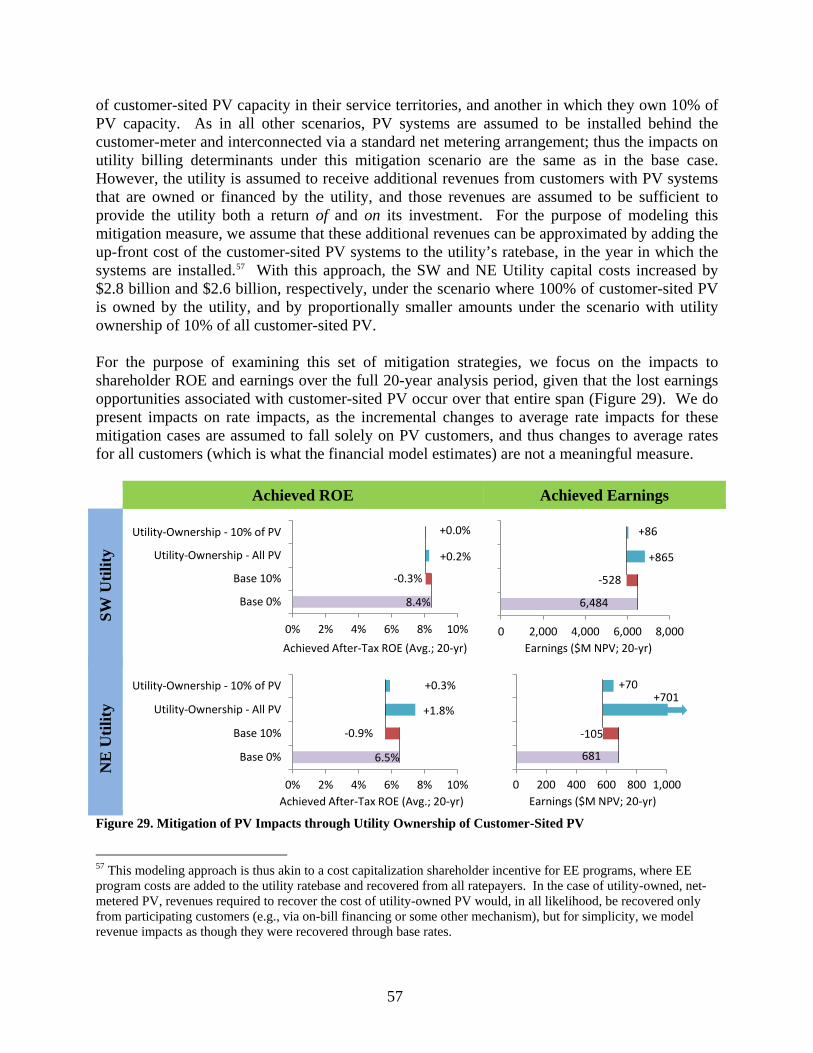
57
of customer-sited PV capacity in their service territories, and another in which they own 10% of PV capacity. As in all other scenarios, PV systems are assumed to be installed behind the customer-meter and interconnected via a standard net metering arrangement; thus the impacts on utility billing determinants under this mitigation scenario are the same as in the base case. However, the utility is assumed to receive additional revenues from customers with PV systems that are owned or financed by the utility, and those revenues are assumed to be sufficient to provide the utility both a return of and on its investment. For the purpose of modeling this mitigation measure, we assume that these additional revenues can be approximated by adding the up-front cost of the customer-sited PV systems to the utility’s ratebase, in the year in which the systems are installed.57 With this approach, the SW and NE Utility capital costs increased by $2.8 billion and $2.6 billion, respectively, under the scenario where 100% of customer-sited PV is owned by the utility, and by proportionally smaller amounts under the scenario with utility ownership of 10% of all customer-sited PV. For the purpose of examining this set of mitigation strategies, we focus on the impacts to shareholder ROE and earnings over the full 20-year analysis period, given that the lost earnings opportunities associated with customer-sited PV occur over that entire span (Figure 29). We do present impacts on rate impacts, as the incremental changes to average rate impacts for these mitigation cases are assumed to fall solely on PV customers, and thus changes to average rates for all customers (which is what the financial model estimates) are not a meaningful measure. Achieved ROE Achieved Earnings
SW U
tility
NE
Util
ity
Figure 29. Mitigation of PV Impacts through Utility Ownership of Customer-Sited PV
57 This modeling approach is thus akin to a cost capitalization shareholder incentive for EE programs, where EE program costs are added to the utility ratebase and recovered from all ratepayers. In the case of utility-owned, net-metered PV, revenues required to recover the cost of utility-owned PV would, in all likelihood, be recovered only from participating customers (e.g., via on-bill financing or some other mechanism), but for simplicity, we model revenue impacts as though they were recovered through base rates.
8.4%
-0.3%
+0.2%
+0.0%
0% 2% 4% 6% 8% 10%
Base 0%
Base 10%
Utility-Ownership - All PV
Utility-Ownership - 10% of PV
Achieved After-Tax ROE (Avg.; 20-yr)
6,484
-528
+865
+86
0 2,000 4,000 6,000 8,000Earnings ($M NPV; 20-yr)
6.5%
-0.9%
+1.8%
+0.3%
0% 2% 4% 6% 8% 10%
Base 0%
Base 10%
Utility-Ownership - All PV
Utility-Ownership - 10% of PV
Achieved After-Tax ROE (Avg.; 20-yr)
681
-105
+701+70
0 200 400 600 800 1,000Earnings ($M NPV; 20-yr)

58
Under the scenarios in which the utilities own all customer-sited PV, achieved earnings and ROE rise significantly. In fact, for the NE Utility, where the only other utility investments are in the distribution system, allowing all PV to be owned by the utility leads to a doubling of achieved earnings over the 20-year analysis period. The SW Utility has a much larger ratebase prior to the addition of customer-sited PV, so the impact of utility ownership of PV is less dramatic, though the increase in earnings nevertheless more-than-offsets the decline in earnings that occurs under the base case with 10% PV. Under the arguably more realistic scenario in which the utilities own 10% of customer-sited PV, the increase in achieved earnings is only 10% of what occurs when the utilities own 100%. Thus, although achieved earnings and ROE increase for both utilities, those increases do not restore profitability back to the levels that occur under the base case without PV. 6.6 Automatically counting customer-sited PV towards RPS compliance can substantially
mitigate the rate impacts from PV The preceding mitigation measures all focused on addressing impacts of customer-sited PV on utility shareholders, and in most cases involved some corresponding increase in average rates. In contrast, one option for potentially mitigating the impacts on utility ratepayers is to automatically count all customer-sited PV directly toward the utility’s RPS compliance obligation (without requiring any explicit payment by the utility).58 This differs from the base case, where customer-sited PV indirectly reduces RPS compliance obligations by virtue of reducing retail sales, but RECs generated by customer-sited PV systems are assumed to remain the property of the system owner and are not automatically applied towards RPS compliance. In effect, this mitigation approach entails transferring ownership of RECs as a condition of receiving service under net-metering, thereby reducing the number of RECs that the utility would otherwise be required to procure in order to meet its RPS obligations.59 As do all other mitigation options, this one also involves a variety of tradeoffs. First is that it tantamount to reducing existing RPS requirements, as it reduces the amount of renewables that the utility would otherwise procure (without leading to any increase in customer-sited PV). Second, to the degree that customers’ decisions to add PV is driven by their desire to retain or sell RECs from their PV system, automatically transferring REC ownership to the utility may degrade the value of PV to the customer and reduce deployment (as well as raise concerns about unlawful taking of private property). For these reasons and others, such transfers of REC ownership have often been controversial (Holt et al. 2007).
58 Although not considered here, multipliers that are applied to RECs from customer-sited PV for purposes of RPS compliance would similarly serve to mitigate the rate impacts from customer-sited PV by reducing RPS compliance costs. 59 In general, customer-sited PV is allowed by regulators to be counted towards utility RPS compliance; however, in most cases, ownership of the associated RECs remains with the owner of the system, unless the utility provides some kind of direct payment or explicit financial incentive. Recently, however, APS proposed an approach, termed “track and record”, whereby all distributed solar in its service territory would be applied towards its RPS requirements, regardless of whether or not the systems received any direct financial incentive from the utility.

59
As shown in Figure 30, applying RECs generated by customer-sited PV toward the utilities’ RPS compliance obligations without requiring any explicit utility payment offsets a substantial portion of the increases in average retail rates that otherwise occur in conjunction with customer-sited PV. In the case of the SW Utility, the rate impacts are reduced by roughly half, relative to the base case with 10% PV, while for the NE Utility, the rate impacts are offset almost in entirety. The degree of mitigation depends, among other factors, on the cost of avoided RECs, which in turn reflects the cost of renewable energy relative to non-renewable generation: when RECs are expensive, allowing customer-sited PV to count toward the RPS leads to a greater reduction in utility costs and thus a greater reduction in average rates. Thus, the mitigation is larger for the NE Utility, where assumed REC prices are higher ($35/MWh) than for the SW Utility (with an “effective” price of RECs of $23/MWh).60 By the same logic, the results shown in Figure 30 would differ if other assumptions were made about the underlying cost of RECs (or, more generally, about the cost of renewable energy relative to the cost of non-renewable energy that RPS procurement displaces). Applying customer-sited PV toward utility RPS obligations does not impact utility ROE or earnings, as we assume that the avoided RPS compliance costs are an annual pass-through to customers.61
SW Utility NE Utility
Figure 30. Mitigation of PV Impacts by Applying RECs from Customer-Sited PV towards RPS Obligations
60 For simplicity of modeling, we apply this REC price for all RPS obligations of the NE Utility; had we assumed higher REC prices, such as those typical of solar set-aside markets, the mitigation of rate impacts would be even greater. The SW Utility is assumed to purchase RECs and energy as a bundled product, and thus the effective REC price is simply the difference between the cost of power purchase agreements (PPAs) for renewables and for conventional generation. 61 We assume that the SW Utility meets its RPS obligation through a combination of utility-owned renewable generation and PPAs, but that PPAs are the marginal resource and are treated as pass-through costs.
12.80
+0.23
-0.14
0 5 10 15
Base 0%
Base 10%
Count toward RPS
Average Rate (cents/kWh; 10-yr)
16.09
+0.23
-0.19
0 5 10 15 20Average Rate (cents/kWh; 10-yr)

60
7. Conclusion This analysis relied upon a pro-forma financial model to quantify the potential impacts of customer-sited PV on two prototypical investor-owned utilities: a vertically integrated utility located in the southwest and wires-only utility located in the northeast. For each utility, we modeled the impacts of customer-sited PV over a 20-year period, estimating changes in utility costs, revenues, average rates, and utility shareholder earnings and return-on-equity. These impacts were evaluated under a base-case set of assumptions for each utility, as well as under a wide range of sensitivity cases that considered alternate assumptions about the utilities’ operating and regulatory environments. Finally, we analyze a number of possible options for mitigating the impacts of customer-sited PV on utility shareholders and ratepayers. 7.1 Policy Implications The findings from this analysis suggest several policy implications. First, even at penetration levels substantially higher than exist today, the impact of customer-sited PV on average retail rates may be relatively modest. We consider customer-sited PV penetration levels that ramp up to 10% of retail sales in 2022, compared to current rates of 1-2% in high-penetration states and a U.S. average of 0.2%. For the two prototypical utilities considered within our analysis, this PV deployment trajectory leads to roughly a 3% increase in average, all-in retail rates under our base-case set of assumptions, and to a 0% to 4% rate increase across the various sensitivity cases tested. These results should, of course, be considered in light of the nature and scope of our analysis – for example, that they are modeled results based on certain assumptions about the prototypical utilities and about how distributed PV impacts costs and revenues, and that the analysis considers the impact of distributed PV in isolation from other factors that may simultaneously place downward pressure on sales and/or upward pressure on rates. Nevertheless, our analysis suggests that distributed PV is unlikely, on its own, to lead to rate impacts of such a magnitude as to dramatically alter the customer-economics of PV, and to thereby result in a “death spiral” of departing load and concomitant rate increases. To the extent that efforts to mitigate the rate impacts of customer-sited PV are still warranted, utilities, policymakers, and solar stakeholders likely have sufficient time to address these concerns in a measured and deliberate manner. Compared to the impacts on ratepayers, the impacts of customer-sited PV on utility shareholders are potentially much more pronounced. In the case of the two prototypical utilities in our analysis, for example, shareholder earnings fell by 8% for the SW utility and by 15% for the NE utility under the base-case assumptions and at 10% PV penetration, but fell by as much as 13% and 41% (for the SW utility and NE utility, respectively) under certain other conditions. The potential magnitude of these impacts – especially among wires-only utilities or other utilities with a relatively small ratebase – may create more immediate pressure on utilities to address shareholders concerns about the erosion of profits caused by customer-sited PV. However, as shown in the analysis, these impacts are highly dependent upon the specifics of the utility operating and regulatory environment, and it will therefore be important for policymakers and others to consider the particular conditions of any individual utility when assessing the possible impacts of customer-sited PV on the utility’s shareholders.

61
Finally, our analysis shows that a variety of measures that constitute arguably “incremental” changes to utility business or regulatory models (as opposed to wholesale paradigm shifts) could be deployed to mitigate the impacts of customer-sited PV on utility ratepayers and shareholders. As shown, however, the potential efficacy of these measures may vary considerably depending upon both their design and upon the specific utility circumstances. For example, within our analysis, when revenue-per-customer (RPC) decoupling is implemented in conjunction with customer-sited PV, the result can range from a worsening of utility profitability to a dramatic improvement in profitability beyond the level achieved without PV, depending on the utility and the choice of design elements (e.g., a “k-factor”). Moreover, many potential mitigation strategies entail substantive tradeoffs. These tradeoffs may exist between ratepayers and shareholders; for example, decoupling and other mitigation measures that involve changes to the way the utility collects revenue may lead to increases in average retail rates. Important tradeoffs may also exist among competing policy and regulatory objectives – for example, among the various principles of ratemaking, or between policy objectives associated with ratepayer equity and environmental goals. Given the complex set of issues involved in implementing many of the possible mitigation measures, regulators may wish to address concerns about the ratepayer and shareholder impacts of customer-sited PV within the context of broader policy- and rate-making processes. 7.2 Future Research As a scoping study, one key objective of the present research is to help identify additional questions and issues worthy of further analysis. Although by no means an exhaustive list, these areas for future research include the following, many of which will be addressed through follow-on work to the present study and refinements to LBNL’s utility financial model: • Benchmark the impacts of customer-sited PV against other factors affecting utility
profitability and customer rates. Utility shareholder returns and earnings, as well as retail electricity rates, are impacted by many factors, and various forms of cross-subsidy exist within utility ratemaking. Understanding how the impacts of PV measure up against these other issues may help utilities and policymakers gauge the severity and importance of the impacts associated with customer-sited PV, and budget their resources accordingly.
• Examine the combined impacts from customer-sited PV, aggressive energy efficiency, and other demand-side measures. This report examined the impacts of customer-sited PV in isolation. In reality, however, the growth of customer-sited PV is often occurring in tandem with aggressive energy efficiency programs and other changes to electricity consumption patterns and end-uses, and adoption of distributed storage technologies could potentially expand greatly in the future. Understanding how the impacts from these trends may compound and interact will enable more informed judgments about the severity of, and options for holistically addressing, any possible impacts on utility shareholders and ratepayers.
• Examine differential impacts among customer groups. The present analysis considered the impacts on utility ratepayers as a whole, but did not differentiate between the impacts among separate customer classes (e.g., residential vs. commercial) or between customers with and

62
without PV. These distinctions are important both because of differences in underlying rate design among customer classes, and because certain mitigation measures are aimed at increasing revenue collection from solar customers, specifically.
• Examine a broader range of mitigation options and combinations thereof. For reasons of
tractability, the present study considered only a subset of possible measures for mitigating the utility and ratepayer impacts from PV, and considered only individual mitigation options in isolation. A wide variety of other measures have also been suggested and are worthy of further analysis, including (among others): stand-by rates, time-based pricing, two-way rates such as value-of-solar tariffs or feed-in tariffs, bi-directional distribution rates, non-fuel cost trackers, formula rates, multi-year rate plans, separate customer classes for PV customers, unbundled pricing of utility services, and performance-based ratemaking (e.g., see Bird et al. 2013, Lowry et al. 2013, Linvill et al. 2013, Kihm and Kramer 2014). Analyzing varying combinations of such measures may allow for identification of comprehensive utility business and regulatory models to address issues related to customer-sited PV.
• Continue improving methods for estimating the avoided costs from customer-sited PV. As our analysis has shown, the impacts of customer-sited PV on utility shareholders and ratepayers are highly sensitive to the value of avoided costs. However, those avoided costs are complex and are often highly specific to the particular utility (or even to a localized region within the utility’s service territory). Continued refinements to the methods and data used to estimate avoided costs – especially those related to avoided generation, transmission, and distribution capacity costs – will be critical to enabling reliable and utility-specific analyses of the shareholder and ratepayer impacts of customer-sited PV.
• Identify strategies for maximizing the avoided costs of customer-sited PV. In addition to
the kinds of ratemaking and regulatory measures mentioned above, utilities and regulators may also be able to mitigate the rate impacts of customer-sited PV by directing or incentivizing its deployment in such a manner to maximize the avoided costs (e.g., through integrated distribution system planning, geographically targeted incentive structures, etc.).

63
References American Public Power Association (APPA). 2014. Solar Photovoltaic Power: Assessing the Benefits & Costs. Washington, D.C.: American Public Power Association. Beach, T., and McGuire, P. 2013. Evaluating the Benefits and Costs of Net Energy Metering in California. Prepared for Vote Solar. Berkeley, CA: Crossborder Energy. Bird, L, J. McLaren, J. Heeter, C. Linvill, J. Shenot, R. Sedano, and J. Migden-Ostrander. 2013. Regulatory Considerations Associated with the Expanded Adoption of Distributed Solar. NREL/TP-6A20-60613. Golden, CO: National Renewable Energy Laboratory. Blackburn, G., C. Magee, and V. Rai. 2014. “Solar Valuation and the Modern Utility’s Expansion into Distributed Generation.” The Electricity Journal 27 (1): 18-32. Black & Veatch (B&V). 2012. Solar Photovoltaic Integration Cost Study, November. http://www.solarfuturearizona.com/B&VSolarPVIntegrationCostStudy.pdf Borenstein, S. 2013. Rate design wars are the sound of utilities taking residential PV seriously. Berkeley, CA: University of California Haas School of Business, Energy Economics Exchange. http://energyathaas.wordpress.com/2013/11/12/rate-design-wars-are-the-sound-of-utilities-taking-residential-pv-seriously/ Bradford, T. and A. Hoskins. 2013. Valuing Distributed Energy: Economic and Regulatory Challenges. Working paper for Princeton Roundtable. Princeton University. Brown, A., and L. Lund. 2013. “Distributed Generation: How Green? How Efficient? How Well-Priced?” The Electricity Journal 26 (3). Cai, D., S. Adlakha, S. Low, P. DeMartini, and K. Chandy. 2013. “Impact of Residential PV Adoption on Retail Electricity Rates.” Energy Policy 62 (2013): 830–843. Cappers, P., C. Goldman, M. Chait, G. Edgar, J. Schlegel, and W. Shirley. 2009. Financial Analysis of Incentive Mechanisms to Promote Energy Efficiency: Case Study of a Prototypical Southwest Utility. LBNL-1598E. Berkeley, CA: Lawrence Berkeley National Laboratory. http://emp.lbl.gov/publications/financial-analysis-incentive-mechanisms-promote-energy-efficiency-case-study-prototypic Cappers, P., and C. Goldman. 2009a. Empirical Assessment of Shareholder Incentive Mechanisms Designs under Aggressive Savings Goals: Case Study of a Kansas “Super-Utility.” LBNL-2492E. Berkeley, CA: Lawrence Berkeley National Laboratory. http://emp.lbl.gov/publications/empirical-assessment-shareholder-incentive-mechanisms-designs-under-aggressive-savings- Cappers, P., and C. Goldman. 2009b. Financial Impact of Energy Efficiency under a Federal Renewable Electricity Standard: Case Study of a Kansas “Super-Utility”. LBNL-2924E.

64
Berkeley, CA: Lawrence Berkeley National Laboratory. http://emp.lbl.gov/publications/financial-impact-energy-efficiency-under-federal-renewable-electricity-standard-case-st Cappers, P., A. Satchwell, C. Goldman, and J. Schlegel. 2010. Benefits and Costs of Aggressive Energy Efficiency Programs and the Impacts of Alternative Sources of Funding: Case Study of Massachusetts. LBNL-3833E. Berkeley, CA: Lawrence Berkeley National Laboratory. http://emp.lbl.gov/publications/benefits-and-costs-aggressive-energy-efficiency-programs-and-impacts-alternative-source Cappers, P., and C. Goldman. 2010. “Financial Impact of Energy Efficiency under a Federal Combined Efficiency and Renewable Electricity Standard: Case Study of a Kansas ‘Super-Utility.’” Energy Policy 38 (8): 3998–4010. doi:10.1016/j.enpol.2010.03.024. Cardwell, D. July 26, 2013. “On Rooftops, a Rival for Utilities.” The New York Times. Carter, S. 2001. “Breaking The Consumption Habit: Ratemaking for Efficient Resource Decisions.” The Electricity Journal 14 (10): 66–74. doi:10.1016/S1040-6190(01)00255-X. Cliburn, J.K. and J. Bourg. 2013. Ratemaking, Solar Value and Solar Net Energy Metering—A Primer. Washington, D.C.: Solar Electric Power Association. Costello, K. 2013. “Future Test Years: Are They in the Public Interest?” The Electricity Journal 26 (9): 69-81. Downs, A., A. Chittum, S. Hayes, M. Neubauer, S. Nowak, S. Vaidyanathan, and C. Cui. 2013. The 2013 State Energy Efficiency Scorecard. Report No. E13K. Washington, D.C.: American Council for an Energy-Efficient Economy. Dumoulin-Smith, J., M. Sanghavi, and S. Chin. 2013. “The Thousand Distributed Cuts Coming.” Research Note: UBS Investment Research, U.S. Utilities & Renewables. September 20, 2013. Duthu, R., D. Zimmerle, T. Bradley, and M. Callahan. 2014. “Evaluation of Existing Customer-owned, On-site Distributed Generation Business Models.” The Electricity Journal 27 (1): 42-52. Energy + Environmental Economics (E3). 2013. California Net Energy Metering (NEM) Cost Effectiveness Evaluation. San Francisco, CA: Energy + Environmental Economics. Energy + Environmental Economics (E3). 2013. Nevada Net Energy Metering Impacts Evaluation. San Francisco, CA: Energy + Environmental Economics. Edison Electric Institute (EEI). 2013. Alternative Regulation for Evolving Utility Challenges: An Updated Survey. Washington, D.C.: Edison Electric Institute. Energy Information Administration (EIA). 2014. Annual Energy Outlook 2014. DOE/EIA-0383(2014). Washington, D.C.: U.S. Energy Information Administration.

65
Electric Power Research Institute (EPRI). 2014. The Integrated Grid: Realizing the Full Value of Central and Distributed Energy Resources. Palo Alto, CA: Electric Power Research Institute.
Eto, J., S. Stoft, and T. Belden. 1994. The Theory and Practice of Decoupling. LBNL-34555/UC-350. Berkeley, CA: Lawrence Berkeley National Laboratory. http://emp.lbl.gov/publications/theory-and-practice-decoupling
Fox-Penner, P. 2010. Smart Power: Climate Change, the Smart Grid, and the Future of Electric Utilities. Island Press.
Graffy, E., and S. Kihm. 2014. “Does Disruptive Competition Mean a Death Spiral for Electric Utilities?” Energy Law Journal 35 (1): 1-43.
Goldman Sachs Global Investment Research. 2013. A near-term decision on net metering in Arizona and what it means for Solar and Utilities.
Greentech Media (GTM) Research and Solar Energy Industries Association (SEIA). 2014. U.S. Solar Market Insight Report: 2013 Year-In-Review. GTM Research and Solar Energy Industries Association.
Hanelt, K. 2013. “Making Friends with Solar DG.” Public Utilities Fortnightly. September 2013.
Hansen, L., V. Lacy, and D. Glick. 2013. A Review of Solar PV Benefit and Cost Studies. Boulder, CO: Rocky Mountain Institute. http://www.rmi.org/Knowledge-Center%2FLibrary%2F2013-13_eLabDERCostValue
Harrington, C., D. Moskovitz, T. Austin, C. Weinberg, and E. Holt. 1994. Regulatory Reform: Removing the Disincentives. Montpelier, VT: The Regulatory Assistance Project.
Harvey, H. and S. Aggarwal. 2013. Rethinking Policy to Deliver a Clean Energy Future. America’s Power Plan. http://americaspowerplan.com/site/wp-content/uploads/2013/09/APP-OVERVIEW-PAPER.pdf
Hledik, R. 2014. “Rediscovering Residential Demand Charges.” Electricity Journal, 27 (7): 1-15.
Hoff, T., R. Perez, JP Ross, and M. Taylor. Photovoltaic Capacity Valuation Methods. Washington D.C.: Solar Electric Power Association, May 2008. http://www.solarelectricpower.org/media/8181/sepa-pv-capacity.pdf
Holt, E., R. Wiser, and M. Bolinger. 2006. Who Owns Renewable Energy Certificates? An Exploration of Policy Options and Practice. LBNL-59965. Berkeley, CA: Lawrence Berkeley National Laboratory. http://emp.lbl.gov/publications/who-owns-renewable-energy-certificates-exploration-policy-options-and-practice

66
Innovation Electricity Efficiency (IEE). 2013. State Electric Efficiency Regulatory Frameworks. Washington, D.C.: Innovation Electricity Efficiency (IEE), an Institute of the Edison Foundation. National Action Plan for Energy Efficiency (NAPEE). 2007. Aligning Utility Incentives with Investment in Energy Efficiency. Prepared by V. Jensen, ICF International. Keyes, J., and K. Rabago. 2013. A Regulator’s Guidebook: Calculating the Benefits and Costs of Distributed Solar Generation. Latham, NY: Interstate Renewable Energy Council, Inc. Kihm, S. 2009. “When Revenue Decoupling Will Work … And When It Won’t.” The Electricity Journal. 22 (9): 19-28. Kihm, S., J. Barrett, and C. Bell. 2014. Designing a New Utility Business Model? Better Understand the Traditional One First. Washington, D.C.: American Council for an Energy-Efficient Economy (ACEEE) Summer Study. Kihm, S., and J. Kramer. 2014. Third Party Distributed Generation: Issues and Challenges for Policymakers. ECW Report No. 273-1. Madison, WI: Energy Center of Wisconsin. Kind, P. (2013). Disruptive Challenges: Financial Implications and Strategic Responses to a Changing Retail Electric Business. Washington, DC: Edison Electric Institute. http://www.eei.org/ourissues/finance/Documents/disruptivechallenges.pdf Koller, T., M. Goedhart, and D. Wessels. 2010. Valuation: Measuring and Managing the Value of Companies. McKinsey and Company, Inc. Kushler, M., D. York, and P. Witte. 2006. Aligning Utility Interests with Energy Efficiency Objectives: A Review of Recent Efforts at Decoupling and Performance Incentives. Report No. U061. Washington, D.C.: American Council for an Energy-Efficient Economy (ACEEE). Lazar, J., and X. Baldwin. 2011. Valuing the Contribution of Energy Efficiency to Avoided Marginal Line Losses and Reserve Requirements. Montpelier, VT: Regulatory Assistance Project. Lehr, R. 2013. New Utility Business Models: Utility and Regulatory Models for the Modern Era. America’s Power Plan. http://americaspowerplan.com/site/wp-content/uploads/2013/10/APP-UTILITIES.pdf Linvill, C., J. Shenot, and J. Lazar. 2013. Designing Distributed Generation Tariffs Well: Fair Compensation in a Time of Transition. Montpelier, VT: The Regulatory Assistance Project. Lowry, M., M. Makos, and G. Waschbusch. 2013. Alternative Regulation for Evolving Utility Challenges: An Updated Survey. Washington D.C.: Edison Electric Institute. http://www.eei.org/issuesandpolicy/stateregulation/Documents/innovative_regulation_survey.pdf

67
Malkin, D., and P. Centollela. 2013. Results-Based Regulation: A Modern Approach to Modernize the Grid. General Electric (GE) Digital Energy and Analysis Group, Inc. Mills, A., A. Botterud, J. Wu, Z. Zhou, B. M. Hodge, and M. Heaney. 2013. Integrating Solar PV in Utility System Operations. Argonne, IL: Argonne National Laboratory, October. http://www.osti.gov/scitech/biblio/1107495. Moskovitz, D., Harrington, C., and Austin, T. 1992. Decoupling vs. Lost Revenues: Regulatory Considerations. Montpelier, VT: The Regulatory Assistance Project. Moskovitz, D. 2000. Profits and Progress through Distributed Resources. Montpelier, VT: The Regulatory Assistance Project. Newcomb J., V. Lacy, L. Hansen, and M. Bell. 2013. Distributed Energy Resources: Policy Implications of Decentralization. America’s Power Plan. http://americaspowerplan.com/site/wp-content/uploads/2013/09/APP-DER-PAPER.pdf Nimmons, J., and M. Taylor. 2008. Utility Solar Business Models: Emerging Utility Strategies & Innovation. SEPA Report No. 03-08. Washington, D.C.: Solar Electric Power Association. Oliva, S., and I. MacGill. 2012. “Assessing the Impact of Household PV Systems on the Profits of All Electricity Industry Participants.” Proceedings of the Institute of Electrical and Electronics Engineers (IEEE) Power and Energy Society General Meeting. San Diego, CA. July 26-27, 2012. Regulatory Assistance Project (RAP). 2011. Revenue Regulation and Decoupling: A Guide to Theory and Application. Montpelier, VT: The Regulatory Assistance Project. Richter, M. 2013a. “Business model innovation for sustainable energy: German utilities and renewable energy.” Energy Policy 62 (2013): 1226–1237. Richter, M. 2013b. “German utilities and distributed PV: How to overcome barriers to business model innovation.” Renewable Energy 55 (2013): 456-466. Rickerson, W., T. Couture, G. Barbose, D. Jacobs, G. Parkinson, E. Chessin, A. Belden, H. Wilson, and H. Barrett. 2014. Residential Prosumers: Drivers and Policy Options (Re-Prosumers). Paris, France: International Energy Agency (IEA) Renewable Energy Technology Deployment (RETD). Rocky Mountain Institute (RMI). 2012. Net Energy Metering, Zero Net Energy and the Distributed Energy Resource Future: Adapting Electric Utility Business Models for the 21st Century. Snowmass, CO: Rocky Mountain Institute. Rocky Mountain Institute (RMI). New Business Models for the Distribution Edge: The Transition from Value Chain to Value Constellation. Snowmass, CO: Rocky Mountain Institute.

68
Satchwell, A., P. Cappers, and C. Goldman. 2011. Carrots and Sticks: A Comprehensive Business Model for the Successful Achievement of Energy Efficiency Resource Standards. LBNL-4399E. Berkeley, CA: Lawrence Berkeley National Laboratory. http://emp.lbl.gov/publications/carrots-and-sticks-comprehensive-business-model-successful-achievement-energy-efficienc
Shirley, W. and M. Taylor. 2009. Decoupling Utility Profits from Sales: Issues for the Photovoltaic Industry. SEPA Report No. 03-09. Washington, D.C.: Solar Electric Power Association.
Solar Electric Power Association (SEPA). 2008. Utility Solar Business Models: Emerging Utility Strategies & Innovation. Washington D.C.: Solar Electric Power Association. http://www.solarlectricpower.org/media/84333/sepa%20usbm%201.pdf.
Solar Electric Power Association (SEPA). 2009. Distributed Photovoltaic Generation for Regulated Utilities. SEPA Report No. 04-09. Washington D.C.: Solar Electric Power Association. http://www.solarelectricpower.org/media/84622/sepa%20pv%20dg.pdf.
Solar Electric Power Association (SEPA). 2014. Utility Solar Market Snapshot: Solar Market Comes of Age in 2013. Washington D.C.: Solar Electric Power Association. http://www.solarelectricpower.org/utility-solar-market-snapshotstar.aspx.
Solar Electric Power Association (SEPA) and Electric Power Research Institute (EPRI). 2012. “Utility Options for Addressing Solar Net Metering Revenue Loss and Ratepayer Equity.” Utility Solar Business Models Bulletin.
Stanton, T., and D. Phelan. 2013. State and Utility Solar Energy Programs: Recommended Approaches for Growing Markets. Report No. 13-07. Silver Spring, MD: National Regulatory Research Institute.
Stoft, S., J. Eto, and S. Kito. 1995. DSM Shareholder Incentives: Current Design and Economic Theory. LBNL-36580/UC-1322. Berkeley, CA: Lawrence Berkeley National Laboratory. http://eetd.lbl.gov/node/49010
Tracy, R. May 2, 2013. “Solar-Regulation Tiffs Flare Across States: Fight Brewing in Lousiana Between Entergy, NRG Over Payments Could Lead to Less Investment in Renewables.” Wall Street Journal.
United States Department of Energy (DOE). 2007. The Potential Benefits of Distributed Generation and Rate-Related Issues That May Impede Their Expansion: A Study Pursuant to Section 1817 of the Energy Policy Act of 2005. Washington, D.C.: United States Department of Energy.
United States Department of Energy (DOE). 2012. SunShot Vision Study. DOE/GO-102012-3037. Washington D.C.: United States Department of Energy. http://www1.eere.energy.gov/solar/sunshot/vision_study.html.

69
Wiedman, J. and T. Beach. 2013. Policy for Distributed Generation: Supporting Generation on Both Sides of the Meter. America’s Power Plan. http://americaspowerplan.com/site/wp-content/uploads/2013/09/APP-DG-PAPER.pdf Wiel, S. 1989. “Making Electric Efficiency Profitable.” Public Utilities Fortnightly. July 1989. Wiser, R., G. Barbose, and E. Holt. 2010. Supporting Solar Power in Renewables Portfolio Standards: Experience from the United States. LBNL-3984E. Berkeley, CA: Lawrence Berkeley National Laboratory. http://emp.lbl.gov/publications/supporting-solar-power-renewables-portfolio-standards-experience-united-states Wood, L. and R. Borlick. 2013. Value of the Grid to DG Customers. Washington, D.C.: Innovation Electricity Efficiency (IEE), an Institute of the Edison Foundation.

70
Appendix A: Utility Characterization Key Inputs The impact of PV on utility shareholders and ratepayers depends on the underlying characteristics of the utility. Further details on key aspects of the two prototypical utilities are provided below. Southwest Regional Load Forecasts For the SW Utility energy and peak demand growth, we adjusted the load forecasts in the APS 2012 IRP to values that were representative of the southwest (i.e., 2.1% annual growth in energy and peak demand). We used load growth values from the Western Interconnection’s most recent transmission expansion study.
Balancing Authority Load Growth (CAGR, 2010-2021) Annual Energy Peak Demand
APS 2.7% 2.7% CFE 2.9% 4.0% EPE 2.6% 2.8%
NEVP 0.8% 0.9% PACE 1.6% 3.0% PNM 1.1% 0.9% PSCO 1.0% 0.3% SPP 1.0% 0.8% SRP 1.3% 1.1% TEP 0.3% 0.0%
WACM 2.2% 2.2% WALC 1.0% 1.0%
Source: WECC ten-year plan Southwest Utility Line-Item Capital Investments Since the SW Utility is vertically integrated, we model periodic investments in new utility-owned generation. The generators include natural gas-fired peaker plants (combustion turbines), natural-gas fired mid-merit plants (combined cycle gas turbines), and utility-scale PV plants. The utility-scale PV plants contribute to meeting the utility’s RPS obligation. Year Investment Type Nameplate
Capacity (MW) Capital Cost
($M) Annual O&M Cost
($M) 2013 Utility-scale PV 100 200.0 2.50 2014 Utility-scale PV 100 200.0 2.50 2017 Utility-scale PV 100 200.0 2.50 2019 Utility-scale PV 200 400.0 5.00 2019 Natural gas peaker 103 123.8 0.63 2020 Natural gas peaker 103 126.9 0.65 2020 Natural gas mid-merit 672 719.6 4.05 2021 Utility-scale PV 100 200.0 2.50 2021 Natural gas peaker 616 780.1 3.96 2023 Utility-scale PV 100 200.0 2.50 2023 Natural gas peaker 615 806.3 4.14

71
2024 Natural gas peaker 308 420.1 2.12 2025 Utility-scale PV 200 400.0 5.00 2025 Natural gas mid-merit 672 841.1 4.55 2027 Utility-scale PV 100 200.0 2.50 2027 Natural gas peaker 205 301.6 1.52 2029 Natural gas peaker 615 904.8 4.77 2031 Natural gas peaker 615 904.8 5.00 Validation of Range of Fixed Customer Charges In the sensitivity analysis (Section 5) we consider a range of potential fixed customer charges and volumetric charges. For the High Customer Charges case, we assume a larger proportion of non-fuel costs that were allocated to volumetric charges in the Base Case are instead allocated to customer charges (and leave the fuel costs fully allocated to volumetric charges and the demand charges unchanged). The specific proportion of non-fuel costs allocated to customer charges was chosen such that the fixed customer charge portion of customer bills doubles from the base case. We verified the reasonableness of this range by estimating the fraction of a typical residential customer bill that is based on fixed customer charges at a sample of utilities in the Southwest and Northeast (see Figure 31). In the Southwest, 1% to 19% of typical residential bills are made up of fixed customer charges (with actual charges ranging from $1.6 to $18.5/month). In the Northeast, 4% to 14% of typical residential bills are made up of fixed customer charges (with actual charges ranging from $4 to $16.4/month). In each case we estimated typical bills based on the average residential customer consumption for the state (based on EIA Form 861 for 2012), the volumetric rate for residential customers, and the fixed customer charges for residential customers at each of the utilities.
Figure 31. Proportion of a Typical Residential Bill Derived from Fixed Customer Charges for Utilities in the Southwest and Northeast
$0
$5
$10
$15
$20
0%
5%
10%
15%
20%
25%
CA: S
CE
CA: P
G&E
CA: S
DG&
E
UT:
Pac
ifiCo
rp
NM
: PN
M
AZ: A
PS
NV:
NV
Ener
gy
CO: P
SCo
AZ: T
usco
n
CA: L
ADW
P
AZ: S
RP
CA: S
MU
D
MA:
Nat
iona
l Grid
RI: N
atio
nal G
rid
NH:
Uni
til
NY:
Con
Ed
ME:
CM
P
VT: G
MP
CT: C
LP
SW NE
Mon
thly
Cus
otm
er C
harg
e
Perc
ent o
f Bill
Percent of bill (left axis)$/month (right axis)

72
Appendix B. PV Characterization Modeling the impact of PV on retail sales and peak demand We assume that all customer-sited PV is on a net-metering rate that is otherwise the same as the rates for all other customers. PV generation therefore reduces sales on a one for one basis: one kWh of PV energy reduces the customer’s sales billing determinant by one kWh. On the other hand, PV generation does not reduce the demand billing determinant on a one for one basis: one kW of PV reduces customer demand by less than one kW. For the purpose of calculating the impacts of customer-sited PV on demand charge revenues, we use estimates of the capacity credit of PV (Hoff et al 2008) to estimate the reduction in peak demand from PV. At low penetration of PV, the contribution of PV to reducing peak demand is relatively high due to the correlation of PV production and peak demand. We also account for the decline in the capacity contribution of PV as PV penetration increases and peak net-load shifts into the early evening. For the SW utility, we use a relationship between the capacity credit of PV and PV penetration derived from NV Energy. For the NE Utility we use a relationship from Rochester Gas and Electric. We base the capacity credit of each increment of PV on the overall system level penetration of PV, which includes the assumed level of deployment of utility-scale PV. Modeling of impact of PV on costs The capacity credit of PV also dictates the ability of customer-sited PV to defer generation investments for the SW Utility and the ability of PV to reduce capacity purchases from the FCM for the NE Utility. We further assume that only a fraction of the capacity credit at the system level applies to reducing utility investments in non-generation capital expenditures at the local level. In the High Value of PV scenario we slow the rate of decline of the capacity credit with increasing PV penetration, such that later vintages of PV installations still contribute to reducing peak demand.62 We also assume that a greater fraction of the capacity credit at the system level can reduce non-generation capital investments. In the Low Value of PV sensitivity we assume a lower capacity credit for even early vintages of customer-sited PV63 and we further assume that non-generation capital investments need to increase during the period when PV is being added. Solar PV at low penetration levels tends to displace more expensive fuels due to its correlation with times of high demand. We define the time-of-delivery (TOD) energy factor as the ratio of the average fuel cost displaced by PV to the time-average marginal fuel cost over a year. The TOD energy factor of PV is greater than 100% at low penetration levels (indicating fuels displaced by PV are more expensive than the average marginal fuel). We also account for the decline in the TOD energy factor with increasing penetration of PV as PV begins to displace lower and lower cost fuels. We base the relationship of the TOD energy factor with penetration 62 In particular we use the low rate of decline of the capacity credit of PV estimated for Portland General Electric in Hoff et al., 2008, but we still start with a high capacity credit at low penetration for our prototypical utilities. 63 We use the low capacity credit and corresponding rate of decline of PV estimated for Portland General Electric in Hoff et al., 2008.

73
on merit-order dispatch analysis of generators in Arizona and ISO-NE for the SW and NE Utility, respectively. The TOD energy factor and marginal capacity credit of PV as PV penetration increases between 2013 and 2022 are shown for the SW Utility in Figure 32 and NE Utility in Figure 33.
Figure 32. Capacity Credit and TOD Energy Factor of PV for the SW Utility
Figure 33. Capacity Credit and TOD Energy Factor of PV for the NE Utility Key Input Southwest Utility Northeast Utility PV capacity credit at 0% PV penetration 78% 68% Decline in incremental capacity credit per 1% increase in PV penetration
-5.7% -4.6%
TOD Energy Factor at 0% PV penetration 108% 111% Decline in TOD Energy Factor per 1% increase in PV penetration
-2.3% -3.1%
0%
5%
10%
15%
20%
25%
30%
0%
20%
40%
60%
80%
100%
120%
2012 2013 2014 2015 2016 2017 2018 2019 2020 2021 2022
PV P
enet
ratio
n
(% a
nnua
l ene
rgy)
Capa
city
Cre
dit a
ndTO
D En
ergy
Fac
tor
System-wide PV Pen.Customer-sited PV Pen.Capacity CreditTOD Energy Factor
0%
5%
10%
15%
20%
25%
30%
0%
20%
40%
60%
80%
100%
120%
2012 2013 2014 2015 2016 2017 2018 2019 2020 2021 2022
PV P
enet
ratio
n
(%
ann
ual e
nerg
y)
Capa
city
Cre
dit a
ndTO
D En
ergy
Fac
tor
System-wide PV Pen.Customer-sited PV Pen.Capacity CreditTOD Energy Factor

74
Methods to approximate breakdown of value of PV The model used to estimate the revenue requirement of the SW and NE Utility with and without PV involves many complex calculations. We benchmarked the avoided cost estimated by the model (see Figure 11) against a set of “back-of-the-envelope” calculations for the different value components of PV. We used values from 2018 as this year was the last year before PV began to defer lumpy conventional generation units in the SW Utility, which greatly complicates estimates of the change in the revenue requirement. The table below includes the method used to estimate each value component of PV, followed by the numerical parameters used in the model for the year 2018 for each of the utilities, and the resulting calculated value (as shown in Figure 11). In some cases, where a simple back-of-the envelope estimate was not available, we simply used a stipulated value for that component. PV Value Component
Method to Estimate Value Southwest Utility Northeast Utility
Avoided Energy
Average energy cost * TOD Energy Factor
$33/MWh * 98% = $32.4/MWh
$72/MWh * 89% = $63.8/MWh
Avoided Losses – Energy
Avoided Energy * Energy losses $32.4/MWh * 7% = $2.3/MWh $63.8/MWh * 4.1% = $2.6/MWh
Avoided Capacity
Capacity market price * Nameplate capacity of PV * PV capacity credit / Energy from PV
$88.6/kW-yr * 1008 MW * 41%/ 2030 GWh/yr = $17.9/MWh
$88.5/kW-yr * 945 MW * 47%/ 1408 GWh/yr = $27.9/MWh
Avoided Losses- Capacity
Avoided Capacity * Capacity Losses
$17.9/MWh * 15% = $2.7/MWh
$27.9/MWh * 8% = $2.2/MWh
Avoided Reserves
(Avoided Capacity + Avoided Losses-Capacity) * Reserve Margin
($17.9/MWh + $2.7/MWh) * 14% = $2.9/MWh
($27.9/MWh + $2.2/MWh) * 17.2% = $5.2/MWh
Avoided RPS REC price * RPS Requirement $23/MWh * 14% = $3.2/MWh $35/MWh * 20% = $7/MWh
Avoided Transmission
SW: Assumption NE: Transmission access charge * Percent of PV capacity credit that offsets transmission * Nameplate of PV * PV capacity credit / Energy from PV
Assumption = $5/MWh $76.8/kW-yr * 20% * 945 MW * 47% / 1408 GWh/yr = $4.8/MWh
Avoided Distribution
Assumption Assumption = $10/MWh Assumption = $10/MWh

75
Appendix C. Base Case Results We report the Base Case achieved earnings, return on equity, and all-in average retail rates with and without PV for the Southwest and Northeast Utility. In cases with PV we also report the percent change in the metric relative to the Base Case without PV. Southwest Utility Achieved After-Tax Earnings
(% change from 0% PV Penetration)
PV Penetration
0% 2.5% 5% 7.5% 10%
2013-2022 (10-year NPV @ WACC)
$3.37B $3.32B (-1.4%) $3.27B (-2.9%) $3.23B (-4.2%) $3.18B (-5.7%)
2013-2032 (20-year NPV @ WACC)
$6.48B $6.23B (-3.9%) $6.25B (-3.6%) $5.97B (-7.9%) $5.96B (-8.1%)
Achieved After-Tax ROE
(% change from 0% PV Penetration)
PV Penetration
0% 2.5% 5% 7.5% 10%
2013-2022 (10-year Avg. @ WACC)
7.99% 7.97% (-0.3%) 7.90% (-1.1%) 7.84% (-1.8%) 7.76% (-2.9%)
2013-2032 (20-year Avg. @ WACC)
8.40% 8.22% (-2.1%) 8.30% (-1.1%) 8.07% (-3.9%) 8.07% (-3.9%)
Average All-in Retail Rate
(% change from 0% PV Penetration)
PV Penetration
0% 2.5% 5% 7.5% 10%
2013-2022 (10-year Avg. @ 5%)
12.8 ¢/kWh 12.8 ¢/kWh (0.3%)
12.9 ¢/kWh (0.7%)
13.0 ¢/kWh (1.2%)
13.0 ¢/kWh (1.8%)
2013-2032 (20-year Avg. @ 5%)
14.2 ¢/kWh 14.2 ¢/kWh (0.0%)
14.4 ¢/kWh (1.0%)
14.4 ¢/kWh (1.3%)
14.6 ¢/kWh (2.5%)

76
Northeast Utility Achieved After-Tax Earnings
(% change from 0% PV Penetration) PV Penetration
0% 2.5% 5% 7.5% 10%
2013-2022 (10-year NPV @ WACC)
$461M $436M (-5.5%) $412M (-10.7%) $390M (-15.5%) $368M (-20.2%)
2013-2032 (20-year NPV @ WACC)
$681M $651M (-4.5%) $623M (-8.6%) $598M (-12.2%) $576M (-15.4%)
Achieved After-Tax ROE
(% change from 0% PV Penetration) PV Penetration
0% 2.5% 5% 7.5% 10%
2013-2022 (10-year Avg. @ WACC)
6.88% 6.56% (-4.7%) 6.24% (-9.3%) 5.94% (-13.7%) 5.64% (-18.1%)
2013-2032 (20-year Avg. @ WACC)
6.47% 6.24% (-3.6%) 6.01% (-7.1%) 5.80% (-10.4%) 5.60% (-13.5%)
Average All-in Retail Rate
(% change from 0% PV Penetration) PV Penetration
0% 2.5% 5% 7.5% 10%
2013-2022 (10-year Avg. @ 5%)
16.1 ¢/kWh 16.1 ¢/kWh (0.1%)
16.2 ¢/kWh (0.4%)
16.2 ¢/kWh (0.8%)
16.3 ¢/kWh (1.5%)
2013-2032 (20-year Avg. @ 5%)
19.2 ¢/kWh 19.2 ¢/kWh (0.2%)
19.3 ¢/kWh (0.7%)
19.5 ¢/kWh (1.5%)
19.7 ¢/kWh (2.7%)

77
Appendix D: Sensitivity Analysis Results
We examine the sensitivity of the impact of PV to differences in the utility operating environment and regulatory environment from that modeled in the Base Case. This appendix includes a detailed description of the assumptions used in the sensitivity cases followed by tables with detailed results of the sensitivity cases for both the initial 10-year period (2013-2022) and the full 20-year analysis period (2013-2032). The sensitivity results show the earnings, ROE, and retail rates with and without PV, the difference in the metric, and the percent change in the metric with PV.

78
Sensitivity Case Definitions Sensitivity Case Definition
Util
ity O
pera
ting
Env
iron
men
t
High Value of PV Incremental capacity credit of PV decreases at much slower rate with penetration. Increase offset of growth-related CapEx to 100% of PV capacity credit.
Low Value of PV Incremental capacity credit of PV at low penetration is only about 20%, and decreases at a slow rate with penetration. Decrease offset of Growth-related CapEx to 0% of PV capacity credit and increase capital expenditure growth rate by +1%/yr in years with new customer PV.
High Load Growth Load growth rate increased by +2%/yr and line item CapEx plan is shifted into earlier years (for SW Utility)
Low Load Growth Load growth rate decreased by -2%/yr and line item CapEx plan is shifted into later years (for SW Utility)
High Fixed O&M Cost Growth Fixed O&M cost growth rate increased by +2%/yr Low Fixed O&M Cost Growth Fixed O&M cost growth rate decreased by -2%/yr High Non-Generating CapEx Growth CapEx cost growth rate is increased by +1%/yr Low Non-Generating CapEx Growth CapEx cost growth rate is decreased by -1%/yr High Fuel/Purchased Power Cost Growth
Fuel/purchased power cost growth rate is increased by +2%/yr
Low Fuel/Purchased Power Cost Growth
Fuel/purchased power cost growth rate is decreased by -2%/yr
Coal Retirement 1200 MW of existing coal capacity is retired in 2018 and replaced with new natural gas-fired combined cycle plants (CCGT)
High Utility-Owned Generation Share Additional CCGT capacity (600 MW) is built in 2015 and 2018 to decrease the amount of short-term capacity purchased by the SW utility
High Utility-Owned Generation Cost Cost of building new utility-owned generation (UOG) is increased by +20%
Low Utility-Owned Generation Cost Cost of building new utility-owned generation (UOG) is decreased by -20%
High FCM Cost Growth Cost of purchasing capacity in the forward capacity market (FCM) is increased by +20%
Low FCM Cost Growth Cost of purchasing capacity in the FCM is decreased by -20%
Util
ity R
egul
ator
y E
nvir
onm
ent
Rate Design: High Fixed Customer Charge
Share of costs recovered through fixed customer charges is doubled and non-fuel costs recovered through volumetric energy charges is reduced
Rate Design: High Volumetric Rates Share of non-fuel costs recovered through volumetric energy rates is increased and fixed customer charges are eliminated
Long Rate Case Filing Period Filing period of general rate cases (GRCs) is increased by two years
Short Rate Case Filing Period Filing period of GRCs is decreased by one year Long Period of Regulatory Lag Regulatory lag is increased by one year Short Period of Regulatory Lag Regulatory lag is decreased by one year Current Test Year Test year is changed from historic to current Future Test Year Test year is changed from historic to future PV Incentives Provide a $0.5/Watt incentive from the utility to customers with
PV

79
Southwest Utility – 10-year Sensitivity Results (2013 to 2022) Sensitivity Case After-Tax
Achieved Earnings ($M NPV@WACC)
After-Tax Achieved ROE (% Avg.@WACC)
All-in Average Retail Rates (cents/kWh Avg.@WACC)
Base 0% PV 3,372 7.99% 12.80 10% PV 3,179 7.76% 13.03 Difference -193 -0.23% 0.23 % Change -5.7% -2.9% 1.8%
High Value of PV 0% PV 3,372 7.99% 12.80 10% PV 3,127 7.81% 12.82 Difference -245 -0.18% 0.02 % Change -7.3% -2.2% 0.1%
Low Value of PV 0% PV 3,372 7.99% 12.80 10% PV 3,192 7.57% 13.17 Difference -180 -0.42% 0.37 % Change -5.3% -5.3% 2.9%
High Load Growth 0% PV 4,276 8.55% 12.65 10% PV 4,012 8.36% 12.81 Difference -263 -0.19% 0.16 % Change -6.2% -2.3% 1.3%
Low Load Growth 0% PV 2,662 7.37% 13.04 10% PV 2,406 6.70% 13.25 Difference -256 -0.67% 0.21 % Change -9.6% -9.1% 1.6%
High Fixed O&M Growth 0% PV 3,219 7.62% 12.98 10% PV 3,021 7.37% 13.22 Difference -198 -0.26% 0.24 % Change -6.2% -3.3% 1.8%
Low Fixed O&M Growth 0% PV 3,509 8.32% 12.63 10% PV 3,321 8.10% 12.85 Difference -188 -0.21% 0.22 % Change -5.4% -2.5% 1.7%
High Non-Generating CapEx Growth
0% PV 3,412 7.61% 12.97 10% PV 3,213 7.36% 13.20 Difference -199 -0.25% 0.24 % Change -5.8% -3.3% 1.8%
Low Non-Generating CapEx Growth
0% PV 3,332 8.35% 12.65 10% PV 3,145 8.13% 12.87 Difference -187 -0.21% 0.22 % Change -5.6% -2.5% 1.8%
High Fuel Cost Growth 0% PV 3,372 7.99% 13.32

80
10% PV 3,179 7.76% 13.50 Difference -193 -0.23% 0.19 % Change -5.7% -2.9% 1.4%
Low Fuel Cost Growth 0% PV 3,372 7.99% 12.35 10% PV 3,179 7.76% 12.62 Difference -193 -0.23% 0.27 % Change -5.7% -2.9% 2.2%
Coal Retirement 0% PV 3,389 7.72% 13.01 10% PV 3,168 7.56% 13.01 Difference -221 -0.17% 0.01 % Change -6.5% -2.1% 0.0%
High Utility-Owned Generation Share
0% PV 3,407 7.63% 12.85 10% PV 3,180 7.40% 13.03 Difference -228 -0.23% 0.18 % Change -6.7% -3.0% 1.4%
High Utility-Owned Generation Cost
0% PV 3,421 7.96% 12.87 10% PV 3,187 7.69% 13.06 Difference -233 -0.27% 0.19 % Change -6.8% -3.4% 1.5%
Low Utility-Owned Generation Cost
0% PV 3,377 8.11% 12.77 10% PV 3,171 7.82% 13.00 Difference -206 -0.29% 0.23 % Change -6.1% -3.6% 1.8%
High Fixed Customer Charge
0% PV 3,408 8.07% 12.83 10% PV 3,268 7.97% 13.10 Difference -140 -0.10% 0.27 % Change -4.1% -1.3% 2.1%
High Volumetric Rates 0% PV 3,336 7.90% 12.77 10% PV 3,091 7.54% 12.96 Difference -246 -0.36% 0.19 % Change -7.4% -4.6% 1.5%
Long Rate Case Filing Period
0% PV 3,177 7.51% 12.66 10% PV 2,905 7.10% 12.82 Difference -271 -0.42% 0.16 % Change -8.5% -5.5% 1.3%
Short Rate Case Filing Period
0% PV 3,495 8.28% 12.89 10% PV 3,293 8.04% 13.11 Difference -203 -0.24% 0.23 % Change -5.8% -2.9% 1.8%
Long Regulatory Lag 0% PV 3,157 7.49% 12.65 10% PV 2,914 7.12% 12.83 Difference -243 -0.37% 0.18 % Change -7.7% -4.9% 1.4%
Short Regulatory Lag 0% PV 3,694 8.71% 13.03

81
10% PV 3,460 8.45% 13.24 Difference -234 -0.26% 0.21 % Change -6.3% -3.0% 1.6%
Current Test Year 0% PV 3,694 8.71% 13.03 10% PV 3,460 8.45% 13.24 Difference -234 -0.26% 0.21 % Change -6.3% -3.0% 1.6%
Future Test Year 0% PV 4,031 9.50% 13.27 10% PV 3,813 9.33% 13.51 Difference -218 -0.17% 0.23 % Change -5.4% -1.8% 1.8%
PV Incentives 0% PV 3,372 7.99% 12.80 10% PV 3,179 7.76% 13.26 Difference -193 -0.23% 0.46 % Change -5.7% -2.9% 3.6%

82
Southwest Utility – 20-year Sensitivity Results (2013 to 2032) Sensitivity Case After-Tax
Achieved Earnings ($M NPV@WACC)
After-Tax Achieved ROE (% Avg.@WACC)
All-in Average Retail Rates (cents/kWh Avg.@WACC)
Base 0% PV 6,484 8.40% 14.24 10% PV 5,956 8.07% 14.59 Difference -528 -0.33% 0.35 % Change -8.1% -3.9% 2.5%
High Value of PV 0% PV 6,484 8.40% 14.24 10% PV 5,630 8.12% 14.20 Difference -854 -0.27% -0.04 % Change -13.2% -3.2% -0.3%
Low Value of PV 0% PV 6,484 8.40% 14.24 10% PV 6,145 7.92% 14.85 Difference -339 -0.48% 0.61 % Change -5.2% -5.7% 4.3%
High Load Growth 0% PV 8,929 8.99% 13.93 10% PV 8,502 8.81% 14.24 Difference -427 -0.18% 0.31 % Change -4.8% -2.0% 2.2%
Low Load Growth 0% PV 4,434 7.62% 14.61 10% PV 4,147 7.13% 15.18 Difference -288 -0.49% 0.57 % Change -6.5% -6.4% 3.9%
High Fixed O&M Growth 0% PV 6,235 8.06% 14.57 10% PV 5,691 7.70% 14.94 Difference -544 -0.36% 0.37 % Change -8.7% -4.5% 2.5%
Low Fixed O&M Growth 0% PV 6,691 8.69% 13.94 10% PV 6,176 8.39% 14.27 Difference -516 -0.30% 0.33 % Change -7.7% -3.4% 2.4%
High Non-Generating CapEx Growth
0% PV 6,908 7.96% 14.73 10% PV 6,372 7.61% 15.13 Difference -535 -0.35% 0.40 % Change -7.7% -4.4% 2.7%
Low Non-Generating CapEx Growth
0% PV 6,131 8.81% 13.84 10% PV 5,616 8.52% 14.15 Difference -515 -0.28% 0.31 % Change -8.4% -3.2% 2.2%
High Fuel Cost Growth 0% PV 6,484 8.40% 15.25 10% PV 5,956 8.07% 15.53

83
Difference -528 -0.33% 0.29 % Change -8.1% -3.9% 1.9%
Low Fuel Cost Growth 0% PV 6,484 8.40% 13.47 10% PV 5,956 8.07% 13.88 Difference -528 -0.33% 0.41 % Change -8.1% -3.9% 3.0%
Coal Retirement 0% PV 6,713 8.28% 14.63 10% PV 6,178 8.01% 14.87 Difference -535 -0.27% 0.25 % Change -8.0% -3.2% 1.7%
High Utility-Owned Generation Share
0% PV 6,708 8.21% 14.44 10% PV 6,133 7.87% 14.70 Difference -575 -0.34% 0.25 % Change -8.6% -4.1% 1.7%
High Utility-Owned Generation Cost
0% PV 6,678 8.36% 14.41 10% PV 6,042 7.98% 14.70 Difference -637 -0.38% 0.29 % Change -9.5% -4.5% 2.0%
Low Utility-Owned Generation Cost
0% PV 6,176 8.32% 14.02 10% PV 5,864 8.16% 14.48 Difference -312 -0.16% 0.46 % Change -5.1% -1.9% 3.3%
High Fixed Customer Charge
0% PV 6,544 8.48% 14.27 10% PV 6,067 8.24% 14.64 Difference -477 -0.24% 0.38 % Change -7.3% -2.8% 2.6%
High Volumetric Rates 0% PV 6,424 8.32% 14.21 10% PV 5,844 7.90% 14.54 Difference -580 -0.41% 0.32 % Change -9.0% -5.0% 2.3%
Long Rate Case Filing Period
0% PV 6,289 8.08% 14.15 10% PV 5,517 7.46% 14.38 Difference -772 -0.62% 0.23 % Change -12.3% -7.6% 1.6%
Short Rate Case Filing Period
0% PV 6,618 8.60% 14.30 10% PV 6,091 8.29% 14.65 Difference -527 -0.31% 0.35 % Change -8.0% -3.7% 2.5%
Long Regulatory Lag 0% PV 6,068 7.86% 14.06 10% PV 5,506 7.45% 14.37 Difference -562 -0.40% 0.32 % Change -9.3% -5.1% 2.3%
Short Regulatory Lag 0% PV 6,929 9.00% 14.44 10% PV 6,430 8.75% 14.81

84
Difference -499 -0.25% 0.38 % Change -7.2% -2.8% 2.6%
Current Test Year 0% PV 6,929 9.00% 14.44 10% PV 6,430 8.75% 14.81 Difference -499 -0.25% 0.38 % Change -7.2% -2.8% 2.6%
Future Test Year 0% PV 7,397 9.67% 14.64 10% PV 6,937 9.50% 15.06 Difference -459 -0.16% 0.41 % Change -6.2% -1.7% 2.8%
PV Incentives 0% PV 6,484 8.40% 14.24 10% PV 5,956 8.07% 14.73 Difference -528 -0.33% 0.49 % Change -8.1% -3.9% 3.4%

85
Northeast Utility – 10-year Sensitivity Results (2013 to 2022) Sensitivity Case After-Tax
Achieved Earnings ($M NPV@WACC)
After-Tax Achieved ROE (% Avg.@WACC)
All-in Average Retail Rates (cents/kWh Avg.@WACC)
Base 0% PV 461 6.88% 16.09 10% PV 368 5.64% 16.33 Difference -93 -1.25% 0.23 % Change -20.2% -18.1% 1.5%
High Value of PV 0% PV 461 6.88% 16.09 10% PV 349 5.72% 16.10 Difference -112 -1.16% 0.01 % Change -24.3% -16.8% 0.1%
Low Value of PV 0% PV 461 6.88% 16.09 10% PV 386 5.64% 16.54 Difference -75 -1.24% 0.44 % Change -16.3% -18.1% 2.8%
High Load Growth 0% PV 731 8.55% 15.83 10% PV 633 7.61% 16.05 Difference -98 -0.94% 0.21 % Change -13.4% -11.0% 1.3%
Low Load Growth 0% PV 241 4.13% 16.51 10% PV 150 2.56% 16.79 Difference -91 -1.57% 0.29 % Change -37.6% -38.0% 1.7%
High Fixed O&M Growth
0% PV 358 5.34% 16.24 10% PV 262 4.01% 16.48 Difference -96 -1.33% 0.24 % Change -26.9% -25.0% 1.5%
Low Fixed O&M Growth 0% PV 554 8.26% 15.96 10% PV 464 7.10% 16.19 Difference -90 -1.16% 0.23 % Change -16.2% -14.1% 1.4%
High Non-Generating CapEx Growth
0% PV 460 6.53% 16.13 10% PV 366 5.35% 16.36 Difference -94 -1.18% 0.23 % Change -20.4% -18.0% 1.5%
Low Non-Generating CapEx Growth
0% PV 462 7.22% 16.06 10% PV 370 5.90% 16.30 Difference -92 -1.31% 0.23 % Change -20.0% -18.2% 1.5%
High Fuel Cost Growth 0% PV 461 6.88% 17.16

86
10% PV 368 5.64% 17.41 Difference -93 -1.25% 0.26 % Change -20.2% -18.1% 1.5%
Low Fuel Cost Growth 0% PV 461 6.88% 15.19 10% PV 368 5.64% 15.41 Difference -93 -1.25% 0.22 % Change -20.2% -18.1% 1.4%
High Forward Capacity Market Cost
0% PV 461 6.88% 16.60 10% PV 368 5.64% 16.83 Difference -93 -1.25% 0.23 % Change -20.2% -18.1% 1.4%
Low Forward Capacity Market Cost
0% PV 461 6.88% 15.59 10% PV 368 5.64% 15.83 Difference -93 -1.25% 0.24 % Change -20.2% -18.1% 1.5%
High Fixed Customer Charge
0% PV 428 6.38% 16.06 10% PV 362 5.54% 16.32 Difference -66 -0.84% 0.26 % Change -15.4% -13.2% 1.6%
High Volumetric Rates 0% PV 495 7.38% 16.13 10% PV 375 5.73% 16.34 Difference -120 -1.65% 0.21 % Change -24.3% -22.3% 1.3%
Long Rate Case Filing Period
0% PV 390 5.82% 16.03 10% PV 282 4.32% 16.24 Difference -107 -1.49% 0.22 % Change -27.6% -25.7% 1.3%
Short Rate Case Filing Period
0% PV 499 7.44% 16.13 10% PV 413 6.32% 16.37 Difference -86 -1.12% 0.24 % Change -17.2% -15.0% 1.5%
Long Regulatory Lag 0% PV 396 5.91% 16.03 10% PV 285 4.37% 16.24 Difference -111 -1.55% 0.21 % Change -28.1% -26.2% 1.3%
Short Regulatory Lag 0% PV 530 7.91% 16.16 10% PV 457 6.99% 16.42 Difference -73 -0.92% 0.26 % Change -13.8% -11.6% 1.6%
Current Test Year 0% PV 530 7.91% 16.16 10% PV 457 6.99% 16.42 Difference -73 -0.92% 0.26 % Change -13.8% -11.6% 1.6%
Future Test Year 0% PV 624 9.30% 16.25

87
10% PV 579 8.85% 16.54 Difference -45 -0.45% 0.29 % Change -7.1% -4.8% 1.8%
PV Incentives 0% PV 461 6.88% 16.09 10% PV 368 5.64% 16.63 Difference -93 -1.25% 0.54 % Change -20.2% -18.1% 3.3%
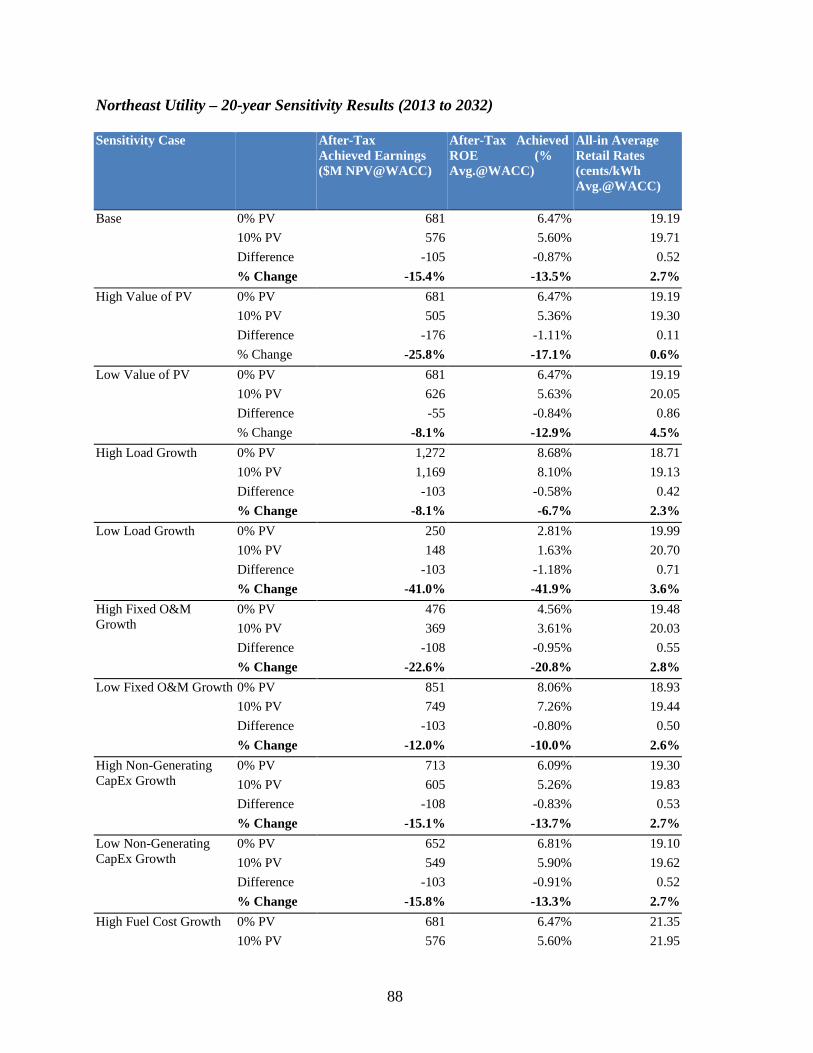
88
Northeast Utility – 20-year Sensitivity Results (2013 to 2032)
Sensitivity Case After-Tax Achieved Earnings ($M NPV@WACC)
After-Tax Achieved ROE (% Avg.@WACC)
All-in Average Retail Rates (cents/kWh Avg.@WACC)
Base 0% PV 681 6.47% 19.19 10% PV 576 5.60% 19.71 Difference -105 -0.87% 0.52 % Change -15.4% -13.5% 2.7%
High Value of PV 0% PV 681 6.47% 19.19 10% PV 505 5.36% 19.30 Difference -176 -1.11% 0.11 % Change -25.8% -17.1% 0.6%
Low Value of PV 0% PV 681 6.47% 19.19 10% PV 626 5.63% 20.05 Difference -55 -0.84% 0.86 % Change -8.1% -12.9% 4.5%
High Load Growth 0% PV 1,272 8.68% 18.71 10% PV 1,169 8.10% 19.13 Difference -103 -0.58% 0.42 % Change -8.1% -6.7% 2.3%
Low Load Growth 0% PV 250 2.81% 19.99 10% PV 148 1.63% 20.70 Difference -103 -1.18% 0.71 % Change -41.0% -41.9% 3.6%
High Fixed O&M Growth
0% PV 476 4.56% 19.48 10% PV 369 3.61% 20.03 Difference -108 -0.95% 0.55 % Change -22.6% -20.8% 2.8%
Low Fixed O&M Growth 0% PV 851 8.06% 18.93 10% PV 749 7.26% 19.44 Difference -103 -0.80% 0.50 % Change -12.0% -10.0% 2.6%
High Non-Generating CapEx Growth
0% PV 713 6.09% 19.30 10% PV 605 5.26% 19.83 Difference -108 -0.83% 0.53 % Change -15.1% -13.7% 2.7%
Low Non-Generating CapEx Growth
0% PV 652 6.81% 19.10 10% PV 549 5.90% 19.62 Difference -103 -0.91% 0.52 % Change -15.8% -13.3% 2.7%
High Fuel Cost Growth 0% PV 681 6.47% 21.35 10% PV 576 5.60% 21.95

89
Difference -105 -0.87% 0.60 % Change -15.4% -13.5% 2.8%
Low Fuel Cost Growth 0% PV 681 6.47% 17.56 10% PV 576 5.60% 18.03 Difference -105 -0.87% 0.47 % Change -15.4% -13.5% 2.7%
High Forward Capacity Market Cost
0% PV 681 6.47% 19.89 10% PV 576 5.60% 20.41 Difference -105 -0.87% 0.52 % Change -15.4% -13.5% 2.6%
Low Forward Capacity Market Cost
0% PV 681 6.47% 18.49 10% PV 576 5.60% 19.02 Difference -105 -0.87% 0.53 % Change -15.4% -13.5% 2.8%
High Fixed Customer Charge
0% PV 624 5.93% 19.16 10% PV 546 5.31% 19.69 Difference -78 -0.61% 0.54 % Change -12.5% -10.4% 2.8%
High Volumetric Rates 0% PV 739 7.01% 19.23 10% PV 607 5.88% 19.73 Difference -132 -1.13% 0.51 % Change -17.9% -16.1% 2.6%
Long Rate Case Filing Period
0% PV 560 5.33% 19.12 10% PV 431 4.19% 19.62 Difference -130 -1.14% 0.50 % Change -23.1% -21.4% 2.6%
Short Rate Case Filing Period
0% PV 752 7.13% 19.23 10% PV 655 6.36% 19.77 Difference -96 -0.77% 0.53 % Change -12.8% -10.8% 2.8%
Long Regulatory Lag 0% PV 565 5.38% 19.12 10% PV 436 4.24% 19.62 Difference -129 -1.14% 0.50 % Change -22.8% -21.1% 2.6%
Short Regulatory Lag 0% PV 819 7.76% 19.27 10% PV 739 7.17% 19.82 Difference -80 -0.59% 0.55 % Change -9.8% -7.6% 2.8%
Current Test Year 0% PV 819 7.76% 19.27 10% PV 739 7.17% 19.82 Difference -80 -0.59% 0.55 % Change -9.8% -7.6% 2.8%
Future Test Year 0% PV 964 9.13% 19.36 10% PV 911 8.84% 19.93

90
Difference -53 -0.29% 0.57 % Change -5.5% -3.1% 2.9%
PV Incentives 0% PV 681 6.47% 19.19 10% PV 576 5.60% 19.90 Difference -105 -0.87% 0.71 % Change -15.4% -13.5% 3.7%

91
Appendix E: Mitigation Analysis Results We examine the effectiveness of different mitigation measures to lessen the impacts of PV modeled in the Base Case. This appendix includes detailed results of the mitigation cases for both the initial 10-year period (2013-2022) and the full 20-year analysis period (2013-2032). The mitigation results show the earnings, ROE, and retail rates at 10% PV compared to the Base Case at 10% PV without the mitigation measure. Southwest Utility – 10-year Mitigation Results (2013 to 2022) Mitigation Case After-Tax
Achieved Earnings ($M NPV@WACC)
After-Tax Achieved ROE (% Avg.@WACC)
All-in Average Retail Rates (cents/kWh Avg.@WACC)
Base 0% PV 3,372 7.99% 12.80 10% PV 3,179 7.76% 13.03 Difference -193 -0.23% 0.23
RPC Decoupling: No k-factor
10% PV 3,625 8.84% 13.37 Difference from Base 10% 446 1.08% 0.34
RPC Decoupling: with k-factor
10% PV 3,283 8.00% 13.11 Difference from Base 10% 104 0.24% 0.08
Lost Revenue Adjustment Mechanism
10% PV 3,277 7.99% 13.10 Difference from Base 10% 98 0.23% 0.07
Shareholder Incentive 10% PV 3,229 7.88% 13.30 Difference from Base 10% 50 0.12% 0.27
High Demand Charge 10% PV 3,269 7.94% 13.10 Difference from Base 10% 90 0.19% 0.07
High Fixed Customer Charge
10% PV 3,566 8.69% 13.32 Difference from Base 10% 387 0.93% 0.29
Short Rate Case Filing Frequency
10% PV 3,293 8.04% 13.11 Difference from Base 10% 113 0.28% 0.09
No Regulatory Lag 10% PV 3,460 8.45% 13.24 Difference from Base 10% 280 0.69% 0.21
Current Test Year 10% PV 3,460 8.45% 13.24 Difference from Base 10% 280 0.69% 0.21
Future Test Year 10% PV 3,813 9.33% 13.51 Difference from Base 10% 634 1.57% 0.48
Utility Ownership of PV - All PV
10% PV 3,751 8.01% N/A Difference from Base 10% 571 0.25% N/A
Utility Ownership of PV - 10% of PV
10% PV 3,236 7.78% N/A Difference from Base 10% 57 0.03% N/A
Customer-Sited PV Counted toward RPS
10% PV 3,179 7.76% 12.89 Difference from Base 10% 0 0.00% -0.14

92
Southwest Utility – 20-year Mitigation Results (2013 to 2032) Mitigation Case After-Tax
Achieved Earnings ($M NPV@WACC)
After-Tax Achieved ROE (% Avg.@WACC)
All-in Average Retail Rates (cents/kWh Avg.@WACC)
Base 0% PV 6,484 8.40% 14.24 10% PV 5,956 8.07% 14.59 Difference -528 -0.33% 0.35
RPC Decoupling: No k-factor
10% PV 6,520 8.92% 14.86 Difference from Base 10% 564 0.85% 0.27
RPC Decoupling: with k-factor
10% PV 5,947 8.13% 14.58 Difference from Base 10% -8 0.06% -0.01
Lost Revenue Adjustment Mechanism
10% PV 6,053 8.23% 14.64 Difference from Base 10% 98 0.15% 0.05
Shareholder Incentive 10% PV 6,006 8.15% 14.75 Difference from Base 10% 50 0.08% 0.17
High Demand Charge 10% PV 6,059 8.22% 14.64 Difference from Base 10% 103 0.15% 0.05
High Fixed Customer Charge
10% PV 6,443 8.81% 14.82 Difference from Base 10% 487 0.74% 0.23
Short Rate Case Filing Frequency
10% PV 6,091 8.29% 14.65 Difference from Base 10% 136 0.22% 0.06
No Regulatory Lag 10% PV 6,430 8.75% 14.81 Difference from Base 10% 474 0.68% 0.23
Current Test Year 10% PV 6,430 8.75% 14.81 Difference from Base 10% 474 0.68% 0.23
Future Test Year 10% PV 6,937 9.50% 15.06 Difference from Base 10% 982 1.43% 0.47
Utility Ownership of PV - All PV
10% PV 6,821 8.29% N/A Difference from Base 10% 865 0.21% N/A
Utility Ownership of PV - 10% of PV
10% PV 6,042 8.09% N/A Difference from Base 10% 86 0.02% N/A
Customer-Sited PV Counted toward RPS
10% PV 5,956 8.07% 14.45 Difference from Base 10% 0 0.00% -0.14
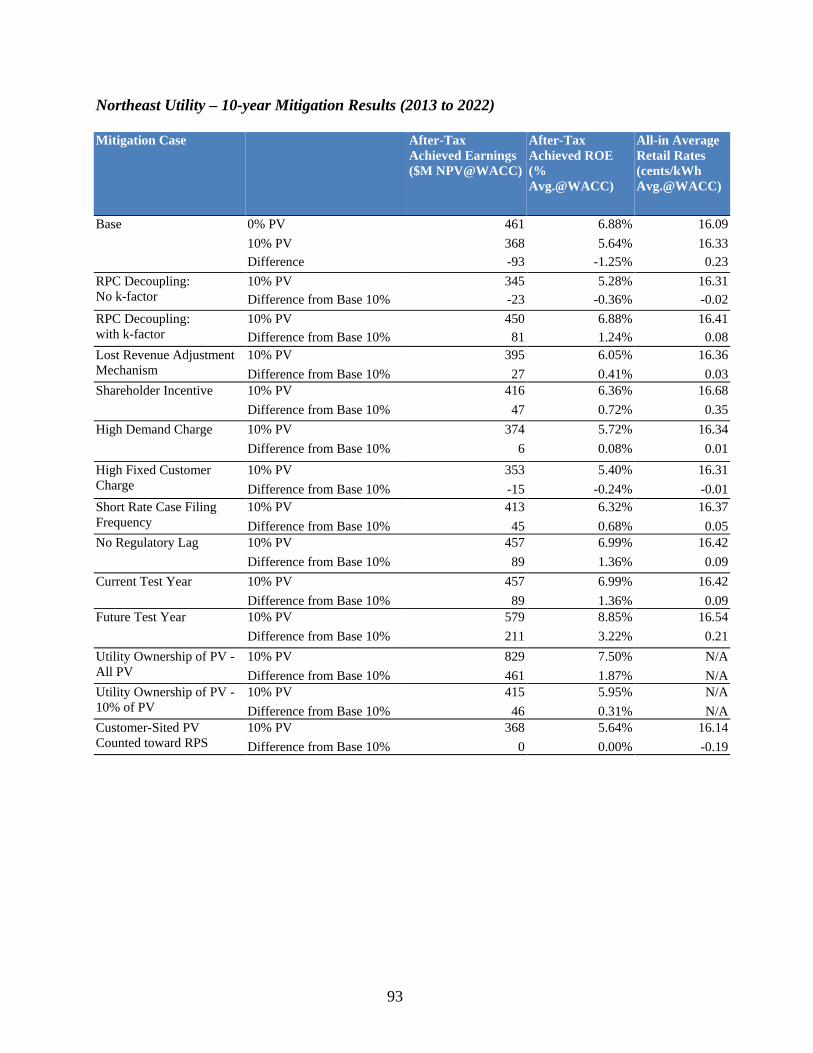
93
Northeast Utility – 10-year Mitigation Results (2013 to 2022) Mitigation Case After-Tax
Achieved Earnings ($M NPV@WACC)
After-Tax Achieved ROE (% Avg.@WACC)
All-in Average Retail Rates (cents/kWh Avg.@WACC)
Base 0% PV 461 6.88% 16.09 10% PV 368 5.64% 16.33 Difference -93 -1.25% 0.23
RPC Decoupling: No k-factor
10% PV 345 5.28% 16.31 Difference from Base 10% -23 -0.36% -0.02
RPC Decoupling: with k-factor
10% PV 450 6.88% 16.41 Difference from Base 10% 81 1.24% 0.08
Lost Revenue Adjustment Mechanism
10% PV 395 6.05% 16.36 Difference from Base 10% 27 0.41% 0.03
Shareholder Incentive 10% PV 416 6.36% 16.68 Difference from Base 10% 47 0.72% 0.35
High Demand Charge 10% PV 374 5.72% 16.34 Difference from Base 10% 6 0.08% 0.01
High Fixed Customer Charge
10% PV 353 5.40% 16.31 Difference from Base 10% -15 -0.24% -0.01
Short Rate Case Filing Frequency
10% PV 413 6.32% 16.37 Difference from Base 10% 45 0.68% 0.05
No Regulatory Lag 10% PV 457 6.99% 16.42 Difference from Base 10% 89 1.36% 0.09
Current Test Year 10% PV 457 6.99% 16.42 Difference from Base 10% 89 1.36% 0.09
Future Test Year 10% PV 579 8.85% 16.54 Difference from Base 10% 211 3.22% 0.21
Utility Ownership of PV - All PV
10% PV 829 7.50% N/A Difference from Base 10% 461 1.87% N/A
Utility Ownership of PV - 10% of PV
10% PV 415 5.95% N/A Difference from Base 10% 46 0.31% N/A
Customer-Sited PV Counted toward RPS
10% PV 368 5.64% 16.14 Difference from Base 10% 0 0.00% -0.19
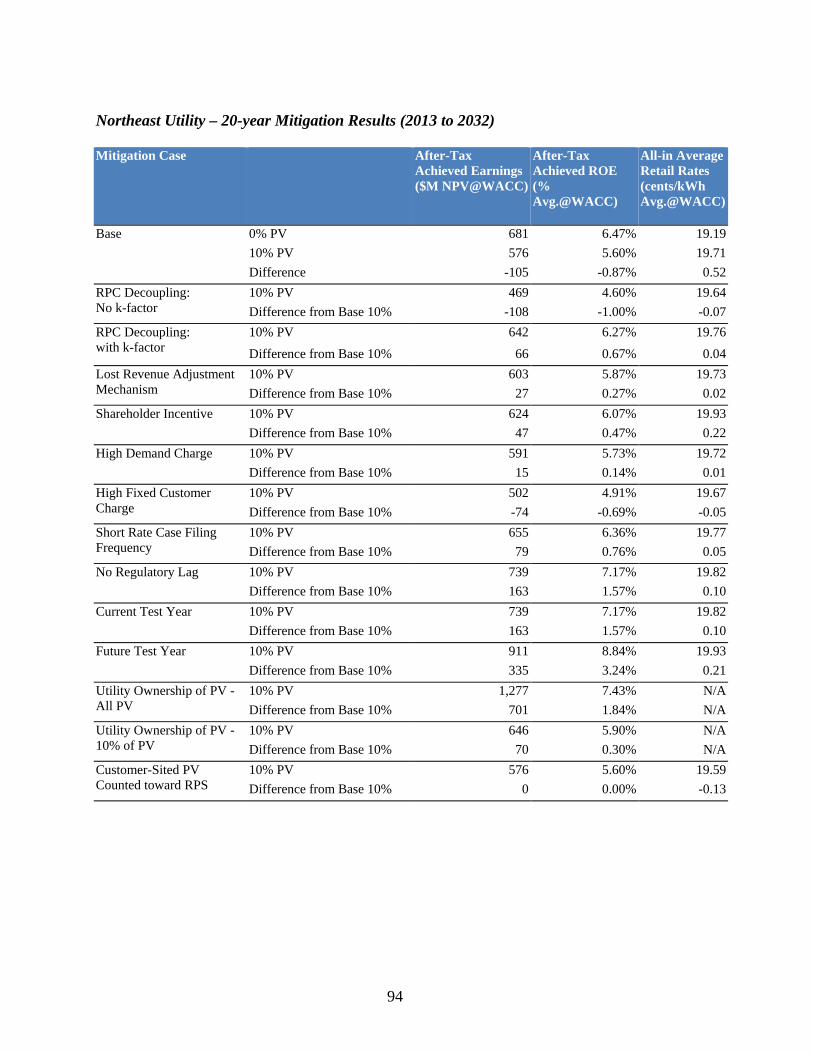
94
Northeast Utility – 20-year Mitigation Results (2013 to 2032)
Mitigation Case After-Tax Achieved Earnings ($M NPV@WACC)
After-Tax Achieved ROE (% Avg.@WACC)
All-in Average Retail Rates (cents/kWh Avg.@WACC)
Base 0% PV 681 6.47% 19.19 10% PV 576 5.60% 19.71 Difference -105 -0.87% 0.52
RPC Decoupling: No k-factor
10% PV 469 4.60% 19.64 Difference from Base 10% -108 -1.00% -0.07
RPC Decoupling: with k-factor
10% PV 642 6.27% 19.76 Difference from Base 10% 66 0.67% 0.04
Lost Revenue Adjustment Mechanism
10% PV 603 5.87% 19.73 Difference from Base 10% 27 0.27% 0.02
Shareholder Incentive 10% PV 624 6.07% 19.93 Difference from Base 10% 47 0.47% 0.22
High Demand Charge 10% PV 591 5.73% 19.72 Difference from Base 10% 15 0.14% 0.01
High Fixed Customer Charge
10% PV 502 4.91% 19.67 Difference from Base 10% -74 -0.69% -0.05
Short Rate Case Filing Frequency
10% PV 655 6.36% 19.77 Difference from Base 10% 79 0.76% 0.05
No Regulatory Lag 10% PV 739 7.17% 19.82 Difference from Base 10% 163 1.57% 0.10
Current Test Year 10% PV 739 7.17% 19.82 Difference from Base 10% 163 1.57% 0.10
Future Test Year 10% PV 911 8.84% 19.93 Difference from Base 10% 335 3.24% 0.21
Utility Ownership of PV - All PV
10% PV 1,277 7.43% N/A Difference from Base 10% 701 1.84% N/A
Utility Ownership of PV - 10% of PV
10% PV 646 5.90% N/A Difference from Base 10% 70 0.30% N/A
Customer-Sited PV Counted toward RPS
10% PV 576 5.60% 19.59 Difference from Base 10% 0 0.00% -0.13