Embed Size (px)
Citation preview

Electronic copy available at: http://ssrn.com/abstract=2337669
1
Financial Inclusion in India: its Prospects, Scopes and Challenges
Sujoy Kumar Dhar.
Faculty Member
IBS Business School, Kolkata.
Abstract
The major focus of the Union Budget for the financial year 2011-12, 2012-13 and 2013-14 was
to achieve the larger aim of the financial inclusion. It focuses on the poor who do not enjoy the
formal financial institutional support and get them out of the clutches of local money lenders.
The objective of the study is to identify the difficulties that Government of India is facing to
implement the concept of financial inclusion. Simultaneously, this research work will focus on
developing the marketing strategies of the financial instruments to the rural population where a
signification portion of the population are suffering from poverty, inequality, unemployment,
illiteracy and superstition. Another dimension of the study is to develop the investor awareness
programs in suburban area and remote villages by which maximum retail participation in capital
market can be ensured. Since socio-economically rural residents are the most vulnerable portion
of the society, it is the ethical, moral and social responsibility for the Government to ensure that
the downtrodden common mass of the country receive protection from the risk of mis-selling by
the unscrupulous financial intermediaries.
The methodology used for the proposed study is based on secondary information available from
several research articles prevalent in the different reputed national and international journals in
the sphere of financial inclusion. Similarly the data has been collected from the RBI database,
the annual reports of SEBI and IRDA as well as from the different published reports. The dream
of real financial inclusion will be materialized only when the entire population of the nation will
be able to become the beneficiary from the different financial reforms made by the different
regulatory apex bodies of the country such as RBI, SEBI and IRDA.
Keywords: budget, inclusion, growth marketing, mutual funds, rural India, RBI, SEBI, IRDA.
Electronic copy available at: http://ssrn.com/abstract=2337669
2
Introduction: The theme of the financial inclusion has become the central focal point for the
Government of India as well as its different policy making bodies for a long period of time. The
major focus of the Union Budgets, for the last four financial years 2010-11, 2011-12, 2012-13 as
well as 2013-14 were to achieve the larger aim of the financial inclusion. As per the Union
budget of 2010-11, it was recommended that both the Government and RBI would work together
to provide appropriate banking facilities to areas having population in excess of 2000 by March,
2012 (Dhar, 2010). A major thrust had been given to the financial inclusion in the budget placed
for the year 2011-2012 as 27% higher target was set for direct agricultural loans. The proposal of
3% interest subvention for timely loan repayments (lesser interest burden helpful for asset
qualification) channelized the greater funding in the segment (Dhar, 2011). The concept of
financial inclusion is focusing on the distributive justice. Rawls was the proponent of “Justice as
fairness”. According to his difference principle, a productive society can incorporate inequality
but the maximum benefit should be provided to the most vulnerable section of the society
(Velasquez, 2007).
Background Story: It is very difficult to reach at a consensus on the topic ‘what should be the
ideal role of the Government of a nation’. The different schools of Thought are holding different
views and each of them have some logic as well as counter logic to substantiate their
perspectives. European nations used to follow the ‘Welfare State’ model over several decades. It
is a social model where Government finds its prime responsibility for welfare of its citizen by
implementing public housing, public health, pension, unemployment compensation, health
insurance, accident insurance as well as disability insurance. The Government of the European
nations used to follow the comprehensive social security program where safety net was created
for those citizen who are unable to maintain their own standard of livings due to lack of financial
resources. The factor market is really rigid in different nations such as German, France etc. The
French labour market in the post 1945 era was characterized by permanent employment
contracts, employment protection laws which penalized business enterprises for firing
employees, long paid vacations up to five weeks a year, limited work week hours and bonuses
twice a year etc. (Gupta, 2006 ). The same can be scrutinized easily by analyzing the corporate
governance structure of the German where 50% board of directors are appointed by shareholders
and rest 50% are being appointed by the worker and trade unions. But providing the

3
unemployment incentive became boomerang for the nations as it created an excessive stress in
the exchequer of the Government, simultaneously it retarded the growth rate of the nations.
Critics are saying that the welfare state model was one of the contributors for the Euro Zone
crisis where the Government of the different nations such as Greece, France, Germany, Spain,
Italy and Austria started suffering from liquidity crisis.
During the phase of the globalization, liberalization and privatization which initiated in post
1991 scenario, gradually the Government of India is withdrawing itself phase by phase manner
from the business, paving the way for the private and foreign players to participate in almost all
the sectors barring few strategic sectors such as Arms and ammunition, Atomic Energy, Railway
Transport, Coal and lignite, Mining of iron, manganese, chrome, gypsum, sulphur, gold,
diamonds, copper, zinc etc. 100% FDI in single brand retail, telecom sector as well as in
pharmaceutical sector, 74% FDI in television, Direct to Home, cable networks, teleports, Asset
reconstruction Companies and in credit bureaus, 51% FDI in multi brand retail, 49% FDI in
Power Exchanges, domestic airlines and in insurance sector, 26% FDI in defense sector can be
viewed as the part of game plan of the Government. The Government has deregulated the price
of petrol and diesel and capped 9 LPG per household per annum which will be offered at
subsidized rate to promote the market economy. In spite of all these, spending in different social
sector projects such as hundred days work, Mid day meal, creating a provision for spending in
Food Security Bill and introducing Land Acquisition, Rehabilitation and Resettlement Bill, the
Government of India has proved that it is trying hard to strike a balance between the reformist as
well as socialist activities.
Divergence between the economic efficiency and the social welfare optimum makes the role of
the Government crucial. Economic efficiency or the Pareto optimality ensures all the resources
of the nations are fully utilized in such a way that welfare of one individual cannot be increased
without decreasing the welfare of another individual and output of commodity cannot be
increased without reducing output of another product. Market economy and free competition
ensures the achievement of Pareto Optimality though the invisible hand of the market. The social
optimality implies the situation where apart from efficient allocation of resources, the consequent
income distribution is regarded as equitable by the society. Thus it can be stated that Pareto
Optimality is a necessary but not a sufficient condition to achieve the optimal social welfare as in

4
order to achieve the social bliss point, efficient allocation and utilization of the resources should
be accompanied by the distributive justice. In a democratic setup, role of the Government
becomes very much import as Government is expected to ensure the distributive justice (Due,
1994). The Keynesian approach is propagating the concept of pump priming where Government
has to incur expenditure in different employment generating projects which will ultimately boost
the aggregate demand of the economy. Therefore the Government of India cannot escape from
the responsibility of inclusive development. Inclusive development is only possible when basic
financial services can be made available to every section of the society. In order to ensure the
effective financial inclusion, the Government needs to address or identify first and foremost the
problem of social exclusion. According to Byrne, social exclusion should be considered as ‘a
necessary and inherent characteristic of unequal post-industrial capitalism founded around a
flexible labour market’. He opined that the socially excluded are a reserve army of labour in the
Marxist sense, continually changing places (Byrne, 1999).
The sustained rise in per capita income is no doubt a necessary condition for enhancing GDP
growth of the nation but it is not sufficient to ensure the inclusive development. The
development can be interpreted as the sustained increase in standard of living of the nation. The
Human Development Index is a composite statistics of life expectancy, education and income
indices used to rank the nations. Life expectancy Index is used to measure the life expectancy at
birth. Education index incorporates mean years of schooling and expected years of schooling.
The mean years of schooling implies years that a 25 years old person has spent in school. The
expected years of schooling implies that a 5 years old child is expected to spend with the
institutionalized education. The Income index is measured by the per capita Gross National
Income. In a nutshell, it can be said that the Human Development Index is the cube root of the
product of Life Expectancy Index, Education Index and Income Index (Haq, 1990)
Therefore the higher growth rate will not be automatically translated to the development unless
and until successful implementation of Financial inclusion is properly taking place. Reaching
into the simplistic assumption that the crisis of the financial exclusion is restricted only to the
rural area will be a great mistake, as the poorer section of the urban population is also victim of
same deprivation. Taking into account these harsh realities into consideration, the Government of
India is now continuously harping on the prerogative of inclusive growth. In the sphere of the

5
financial inclusion, Indian PSU banks are much ahead than its private peers in terms of their
contribution. The PSU banks are offering banking services which is 62.2% of the total banked
rural population in India and it is followed by the Regional Rural Banks as they are offering
33.84% services. Private players are offering service which is restricted to only 4.62% of the
aggregate banked rural population and foreign players are almost nonexistent in the rural market
as they are serving 0.02% of the rural population which is availing basic banking service
(Annexure-I), (Dhar, 2013).
Research Gap: Several scholarly articles have been authored on Rural Banking (Moschini
Giancarlo, 2008; Dongre, 2010; Jackson V. P, 2011; Whitelaw, 2011). Similarly numerous
intellectual outputs are available in the domain of financial inclusion (Jones, 2006; Michael,
2009; Bihari, 2011; Kumar, 2011). Confining the scope of the financial inclusion only in terms
of banking services indirectly interprets the fact that it is the baby of RBI which by default
restricts the inclusive agenda into a narrow perspective. The real financial inclusion will be
possible if all the financial regulatory bodies of India can jointly campaign and take the
necessary steps to implement the propaganda of the financial inclusion. This area has been
neglected for a long period of time as hardly any research publication was made in this context.
Objectives: The main objectives of the research paper can be explained as follows
Define the scope, direction, potentiality and the International benchmarks of the financial
inclusion plans.
Critically scrutinize the extent of achievement of the Government of India after 65 years
of independence in pursuing the goal of the financial inclusion.
Explore the opportunities to create the awareness about the utilities of the several
instruments of money market, capital market, insurance sector and pension fund in the
mind of downtrodden section of the society.
Methodology: The research paper is based on collection and analysis of the secondary data. The
secondary data is composed of the literature available in different scholarly research articles
belonging to several national and international journals prevalent in Ebscohost and Emerald.
Secondary data is collected and analyzed from the Annual report of Reserve Bank of India,
6
Security Exchange Board of India, Insurance Regulatory Development Authority of India and
National Bank for Agriculture and Rural Development as well as different published reports
which are available in the public domain.
Literature Survey: The Regional Rural banks or the Grameen Banks(GB) are playing a crucial
role to combat against the financial exclusion .The most conventional banks grant credit based
on collateral assets, GB give loans without any kind of collateral. GB has been successful in
overcoming the problems of informational asymmetry often found in rural financial markets.
This bank replaces collateral by peer pressure and social sanctions. The extremely poor can get
small loans at GB if they form groups of five people. Each member of the group receives an
individual loan; however, they are mutually responsible for all five credits. The bulk of GB’s
borrowers are women who constitute the weakest social group among the rural poor. Lending
money to women has largely enhanced recoverability for GB’s loans (Hassan, 1997). It is often
argued that the financial sector in low-income countries has failed to serve the poor. The failure
of the formal and informal financial sectors to provide affordable credit to the most
disadvantaged portion of the society is often viewed as one of the main factors that reinforce the
vicious circle of economic, social and demographic structures that ultimately cause poverty
(Chowdhury, 2005).
The successful application and implementation of the financial inclusion strategies can only
break this downward vicious circle. “The roles and status of persons in rural environment differs
substantially from those in urban India. Individuals such as Sarpanchs, caste leaders, medical
practitioners, retired military personnel and priests enjoy a higher status and their purchase
decisions seem to have a significant influence on others.” (Kashyap,2009). The conventional
meaning of the financial inclusion is to bring more and more people under the umbrella of the
banking services. But the stepping stone of the inclusive growth is the awareness generation
about the services offered by the banks and financial institutions among the non banked
population. Therefore the major challenge the banks are facing during the time period of ice
breaking exercise when they have to make their products and services familiar in the mind of the
poor villagers. The critical success factor for the banks lies in their ability to market their
products, services, vision, mission and policies in front of the layman villagers who have hardly
any idea about the banking framework or institutionalized credit.

7
Rural marketing is trickier as well as challenging in comparison to marketing in urban areas. The
target customers are highly qualified, adequately informed about the product and much exposed
to both the print as well as electronic media in urban marketing. In majority of the cases, the
marketers need not face many challenges to convince the customer about their products,
provided marketers are knowledgeable enough to demonstrate the key features as well as the
core competitive advantage of their products. “Rural marketers have to skillfully communicate
with a much larger but scattered audience characterized by variations in language, culture and
life styles. Their poor message comprehension and low media exposure only add to the problem
of communication through mass media.” (Krishnamacharyulu, 2006). The promotion of
products, services, processes or concepts are not easy because to attract the attention of rural
customers, customization is required to a significant extent. Often companies are targeting urban
market in order to play safe. According to Ajith Paninchukunnath, “when a marketing firm sees
only the urban market to participate, in a country where rural markets are dominantly present is
called Urban Myopia (UM). The intensity of UM is so high that in spite of facing acute problems
in urban markets like low market share, brand polygamy by consumers, competition from private
labels, declining margins, companies still refuse to look beyond urban markets”
(Paninchukunnath ,2010). “Adoption of a long-term perspective which focuses on developing the
economic base of consumption and distribution, building demand for the products and services
offered by marketers, as well as enhancing consumers’ ability to afford them are the major key
factors for success in financial inclusion. It requires fostering entrepreneurial skills to establish
the networks to promote and distribute the products to consumers in outlying areas” (Craig,
2011). Thus, the efficient supply chain management is also required for successful rural
marketing. The infrastructure should be supportive enough which will reduce the distribution
bottlenecks, a major threat for both the rural target customer and marketer.
International Benchmark of Financial Inclusion: According to the World Bank, a financial
inclusion strategy can be characterized by six components: i) Stock-taking: data and diagnostics,
ii) Targets and objectives, iii) Strategy building or revision, iv) Public sector actions: policies,
regulation, and financial infrastructure, v) Private sector actions and vi) Progress monitoring.
Each country context varies, including in terms of availability of data and diagnostics,
institutional capacity to implement reforms, financial market structure, level of financial
8
infrastructure and political priorities. Financial inclusion strategies are interlinked with financial
stability, financial integrity, market conduct, the financial capability of consumers. The policy
framework should be prepared with reference to analysis as well as objectives for those areas,
irrespective of whether the financial inclusion strategy is a standalone document or a component
of a broader financial sector development strategy. (Pearce, 2012 )
In recognition of the need for better data to support the financial inclusion agenda, the World
Bank’s Development Research Group has derived the Global Financial Inclusion Index (Global
Findex) with a 10-year grant from the Bill & Melinda Gates Foundation. The goal of the
Global Findex is to enable policymakers and researchers to construct and evaluate policies based
on a sound understanding of the behaviors and constraints that characterize individuals’ use of
financial products. The few core indicators are used to prepare the index such as usage of bank
accounts, borrowing, payment and insurances. (Demirguc-Kunt, 2011 )
Performance of India in financial Inclusion, a Comparative Analysis: The South Asian
Association for Regional Cooperation (SAARC) provides a level playing field for South Asian
Countries to work together in a cooperative manner towards accomplishing certain common
goals which can help to accelerate the economic and social development in the region. Financial
inclusion is one such important common objective for the SAARC countries. (Kumar, 2011 )
The contribution by the selected SAARC countries in the field of financial inclusion has been
scrutinized (Annexure –II).
The Automated Tailor Machine (ATM) plays a major role to eradicate the curse of financial
exclusion as it offers 24x7 banking services. The number of ATM can be considered one of the
key success variables in the field of financial inclusion. India is lagging far behind than the world
average benchmark with respect to providing the ATM facilities to the citizens of its nation. In
India, per one lakh population, the number of ATMs is 8.9 which are abysmally low in respect to
the world average 33.9 (Annexure- III).
The mobile banking transactions have increased at a rapid space in India which can be viewed as
another critical success factor for the financial inclusion. (Annexure- IV).

9
Initiatives by RBI: The branchless banking is an innovative concept where account can be
opened and operated without actually going to any bank branch. This can be done with the help
of banks’ business representatives in the area of an individual. These representatives are local
people who are authorized by the banks to act on their behalf. The profiles of Business
Facilitator and Business Correspondents are created so that they can work as the agent of banks
who are directly dealing with poor villagers. Business Facilitator helps the laymen villagers in
opening the bank account, explaining the norm of saving, loans etc to customers, repayment of
bank loan, understanding how to avail all other services of bank. Business Correspondents can
do everything what BF can do, moreover they can handle cash transactions on behalf of bank.
Transactions are secured as the figure print/signature is recorded by the bank during the opening
of an account. The BC will verify your finger print on a scanner machine before handing over the
withdrawn amount (Dhar, 2010).
Concept of Micro Finance: The concept of the Microfinance is the brainchild of Muhammad
Yunus, Professor of Economics at Bangladesh University. At the outset, he started with
individual finance model; the approach of Micro Finance changed its dimension quickly to
“group approach”. There are generally two types of groups covered under micro finance. They
are (1) Self Help Group (SHG) and (2) Joint Liability Group (JLG). When the self help groups
are able to successfully operate for more than 3 years span of time, they get the status of NGO.
Swarnajayanti Gram Swarojgar Yojana is an employment programme designed to stimulate self-
employment activities and it ensures that every assisted Below Poverty Line (BPL) family –
swarojgari - is able to earn a minimum monthly income of Rs 2,000 within three years. It aims to
achieve this objective by encouraging these families to engage in income-generating activities
and by providing assistance through a combination of wages, technical capacity building and a
package of financial assistance that includes institutional credit and subsidy. In 1999, SGSY was
formed from a merger and restructuring of the Integrated Rural Development Programme (IRDP)
and allied skills generation programmes, namely Training for Rural Youth for Self Employment
(TRYSEM), Development of Women and Children in Rural Areas (DWCRA), Supply of
Toolkits in Rural Areas (SITRA), Ganga Kalyan Yojana (GKY) and Million Wells Scheme
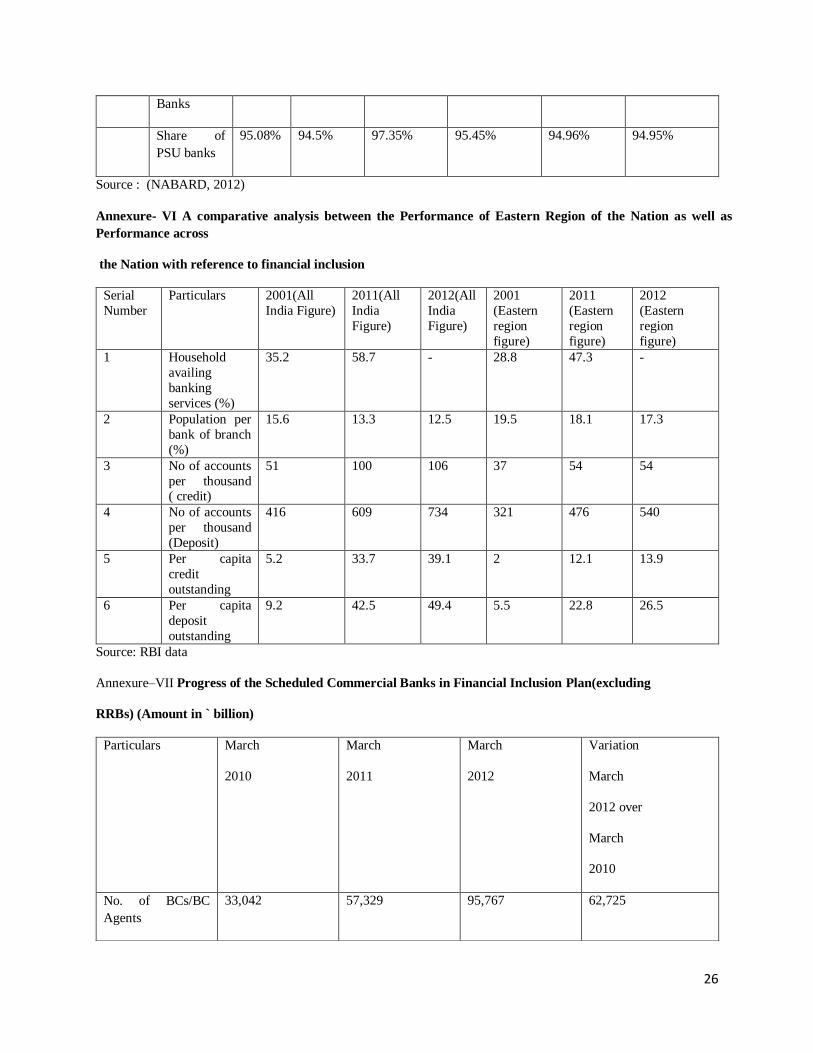
(MWS), (Shekhar, 2010-11). In microfinance activities, PSU banks are almost enjoying
monopoly power in respect of insignificant private players. As per the data of March 2012,

10
94.5% loans had been disbursed by the PSU banks for microfinance schemes where only 5.5%
loans was disbursed by the private sector banks (Annexure-V).
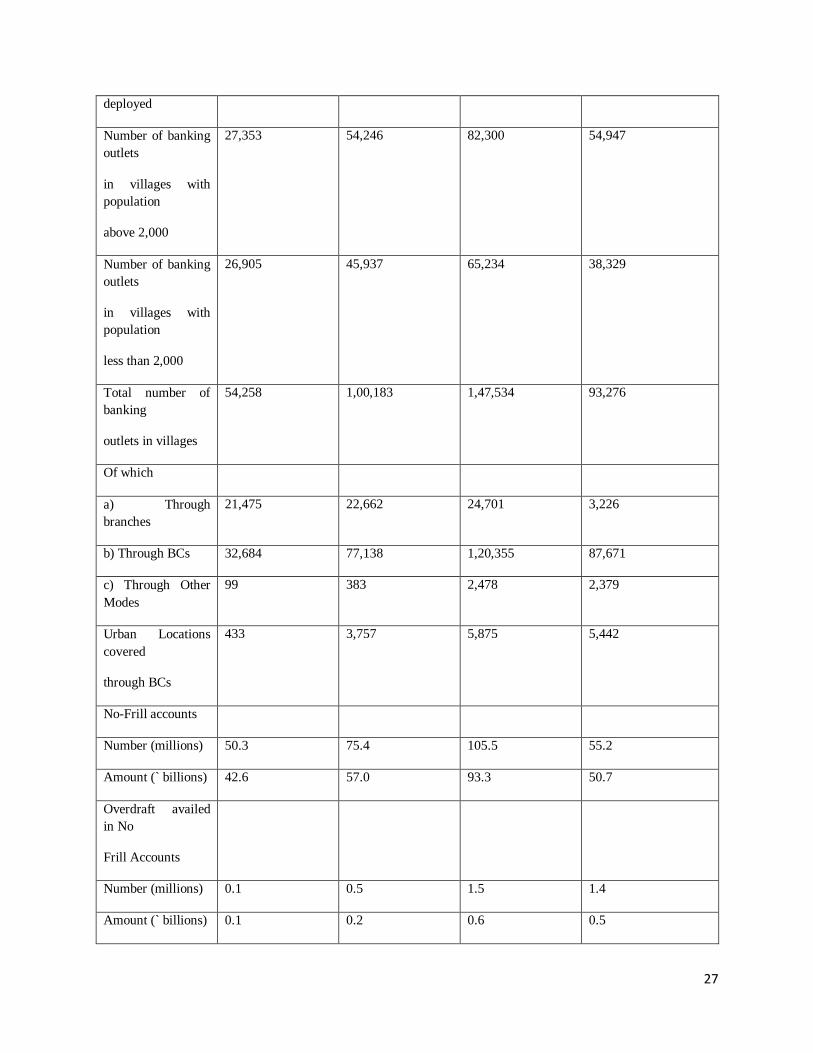
Interregional Disparity in India: The eastern region of India is lagging behind with respect to
the rest of the nation in terms of performance in financial inclusion (Annexure-VI).
The Index of financial inclusion (IFI) for India is as low as 0.2 (range of values of IFI lie
between 0 and 1, 0 indicating complete financial exclusion and 1 complete inclusion). IFI is a
measure of inclusiveness of the financial system of an economy measured along three
dimensions: banking penetration; availability of banking services; and usage of banking system.
North-east region is one of the most secluded terrains of India with low levels of financial
inclusion and high poverty. The level of financial inclusion for Assam and Meghalaya is very
poor with extremely low IFI values of 0.13 and 0.21 respectively (Bhanot, 2012).
The Banking Reform Bill 2012: The new Banking bill 2012, was passed in the Indian
Parliament in December, 2012 by the incumbent UPAII Government to accelerate the pace of
financial inclusion. According to this bill, nonbanking business players are also eligible to get the
banking license from the RBI. The bill has created the provision for RBI to supersede the board
of directors of the bank to check the books of account of the bank, its subsidiaries as well as its
all associated companies. The PSU banks can raise the fund from the public by right issue. The
new banking bill, 2012 can be viewed as a deliberate effort by the Central Government to
eradicate the financial exclusion. 26 applications were received by RBI from PSU, Private
players as well as NBFCs which includes the L&T Finance, the Tata Group, Reliance Capital,
Aditya Birla Nuvo, Bajaj Finserv, Videocon, IDFC, Muthoot Finance, India Bulls, Bandhan,
Bangalore based Janalakshmi Microfinance, Noida based little known Smart Global Ventures,
Gurgaon based advisory services firm INMACS Management, UAE Exchange of India: a
remittance and foreign exchange service firm, India Infoline, LIC Housing Finance, Religare,
Edelweiss, Magma Finance, SREI Infrastructure Finance Corporation, IFCI, The Department of
Post (Government of India), Tourism Finance Corporation of India, Suryamani Financing( part
of Kolkata based Pawan Kumar Ruia Group), JM Financial, Shriram Finance. The new banking
bill, 2012 can be viewed as a masterstroke by the Central Government to eradicate the curse of
the financial exclusion in India (Buisness Standard, 2013).

11
RBI on August 27 has suggested that after years of single-track approach to bank licensing, it
could consider different types of licenses, but did not elaborate. If this approach comes into force
some of the rules such as mandatory holding of 23% of deposits in government bonds, and four
percent of the deposits with the central bank may be waived. According to RBI as a consequence
of broadening and deepening of financial sector, some banks will be motivated to serve the niche
segment. This has certain obvious advantages in terms of managing business and risk
management. Some countries have a differentiated bank licensing regime where differentiated
licenses are issued specifically outlining the activities that the licensed entity can undertake. The
idea comes from Singapore which has five different kinds of licenses and Hong Kong has a three
tier structure. Indonesia recently moved to based on the "capital condition" of banks, and only
those institutions with hearty capital reserves will be eligible for the multiple licenses permitting
multiple activities (Sinha, 2013 ).
Hurdles faced by the Indian Banks: Indian banking sector is highly regulated. The major
challenges faced by the Indian banks are emerging threats from the shadow banking players. The
institutions such as the Non Banking Financial Companies (NBFCs), chit fund players, Nidhi
companies, local money lenders and indigenous banks are coming under the purview of shadow
banking as these institutions are functioning almost like the banks but they are not banks by
nature. The shadow banking sector is lightly regulated as a result often they are able to provide
higher return to the depositors than the bank. It is true that for successful implementation of the
financial inclusion, RBI has decided to distribute the new banking licenses. But in order to
conform to the International Standard of Basel III norms, huge amount of capital is required.
Assuming an annual credit growth rate from financial year 2012- financial year 2021 at 20
percent and the annual risk weighted asset growth rate at 22 percent, tier I capital requirement for
the public sector banks for the same period will be Rs 9,60000 crores. Due to the high fiscal
deficit of the nation, it is almost impossible for the Government of India to infuse the equivalent
amount of capital in public sector banks. Simultaneously the Government is not at all willing to
dilute its stake less than 51% strategically (Dasgupta, 2013).
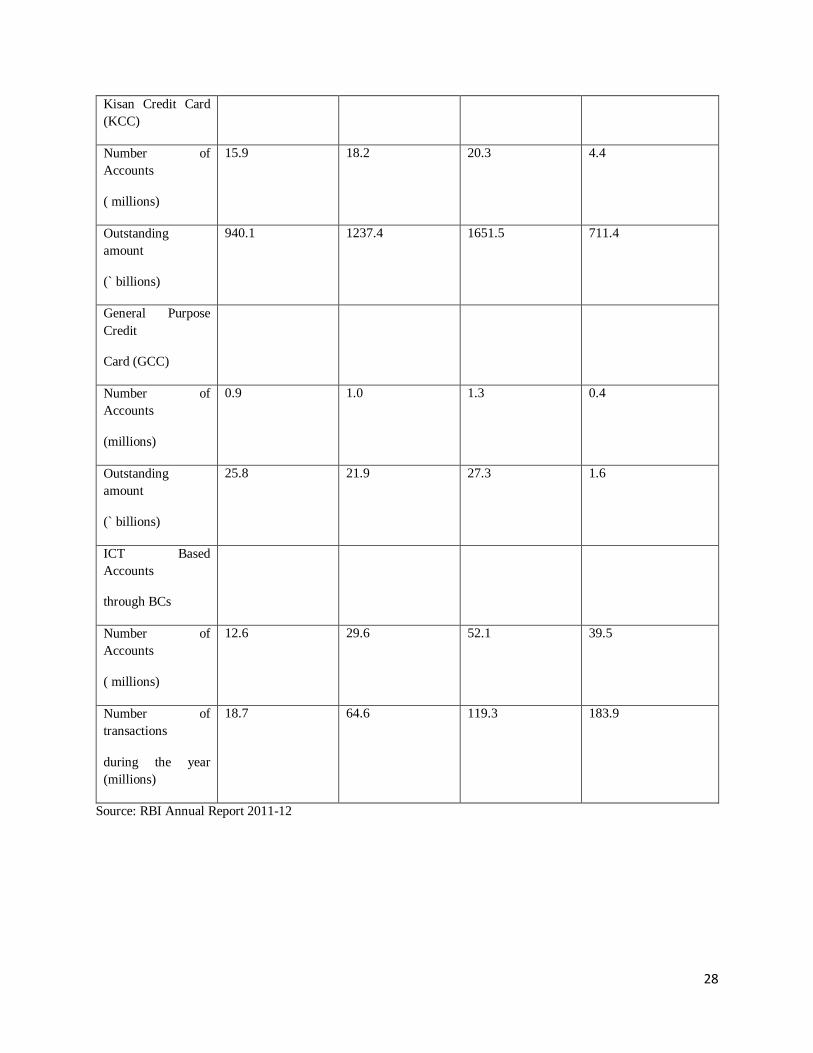
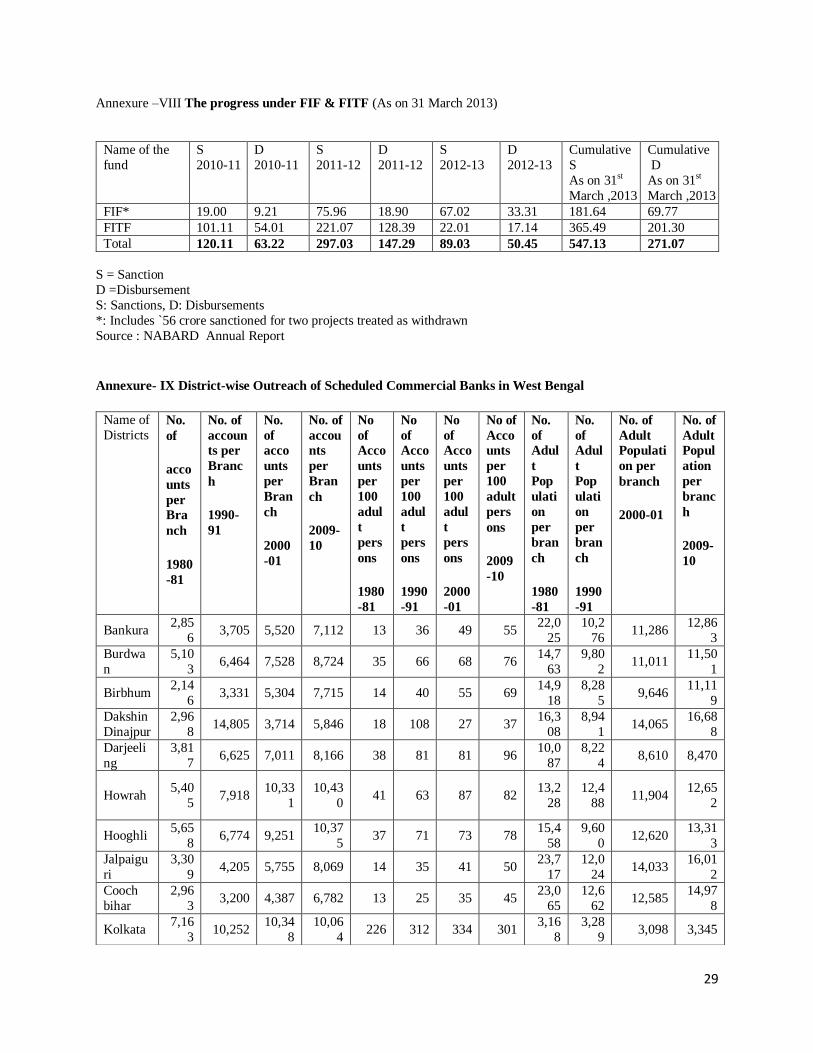
In spite of the odds and hurdles, The Scheduled Commercial banks have contributed to a
significant extent in the sphere of financial inclusion (Annexure- VII).

12
Role of NABARD in financial Inclusion: NABARD continued to manage two dedicated funds
i.e., Financial Inclusion Fund (FIF) for meeting the cost of developmental and promotional
interventions and Financial Inclusion Technology Fund (FITF) for meeting the cost of
technology adoption for financial inclusion. These Funds were instituted in NABARD by GOI in
2007- 08 as per the recommendations of Dr. Ranagarajan Committee. With effect from 01 April
2012, the relative margin (interest differentials) available to NABARD in excess of 0.5 per cent
in respect of deposits placed by banks under Rural Infrastructure Development Fund (RIDF) and
Short Term Cooperative Rural Credit (STCRC) is being credited to FIF. The Advisory Board
with representation from GOI, RBI, National Association of Software and Services Companies
(NASSCOM), Insurance Regulatory and Development Authority (IRDA) and Institute for
Development and Research in Banking Technology (IDRBT), under the chairmanship of
NABARD, guides and renders policy advice in respect of management of these Funds. As on 31
March 2013, the cumulative sanctions under FIF and FITF were 181.64 crores and 365.49 crores,
respectively, against which, disbursements were 69.77 crores and 201.30 crores respectively,
(Annual report of NABARD for 2012-13, Annexure- VIII).
Role of Small Banks: The small banks play a very important role in the supply of credit to small
business units, small farmers and other unorganized sector entities. The need and the relevance
of small banks have been debated in India from time to time and accordingly various initiatives
were put in place to promote small banks geared towards small borrowers. As on March 31, 2013
there were 64 RRBs (consolidated from 196 RRBs originally set up), 1606 urban co-operative
banks (UCBs), 31 State Co-operative Banks (StCBs), 371 District Central Co-operative Banks
(DCCBs), 20 State Cooperative Agriculture and Rural Development Banks (SCARDBs) and 697
Primary Cooperative Agriculture and Rural Development Banks (PCARDBs).
(Source: RBI Discussion Paper, 2013).
Financial Inclusion in West Bengal: District wise banking reach in West Bengal is analyzed
taking into account three different dimensions such as number of accounts per branch, number of
account per 100 adult person and number of adult population per branch. (Annexure-IX)
(Chattopadhyay,2011). State Level Bankers’ Committee (SLBC) in West Bengal is an inter-
institutional forum for coordination and joint implementation of development programmes and
policies by all the financial institutions operating in a State. Although SLBC is envisaged as a
13
bankers’ forum, Government Officials are also included (SLBC, 2013). The extent of success in
District wise banking penetration is determined by the time series data of credit deposit ratio
(Annexure-X).
Apart from these, SLBC has adopted several strategies to promote the financial inclusion agenda
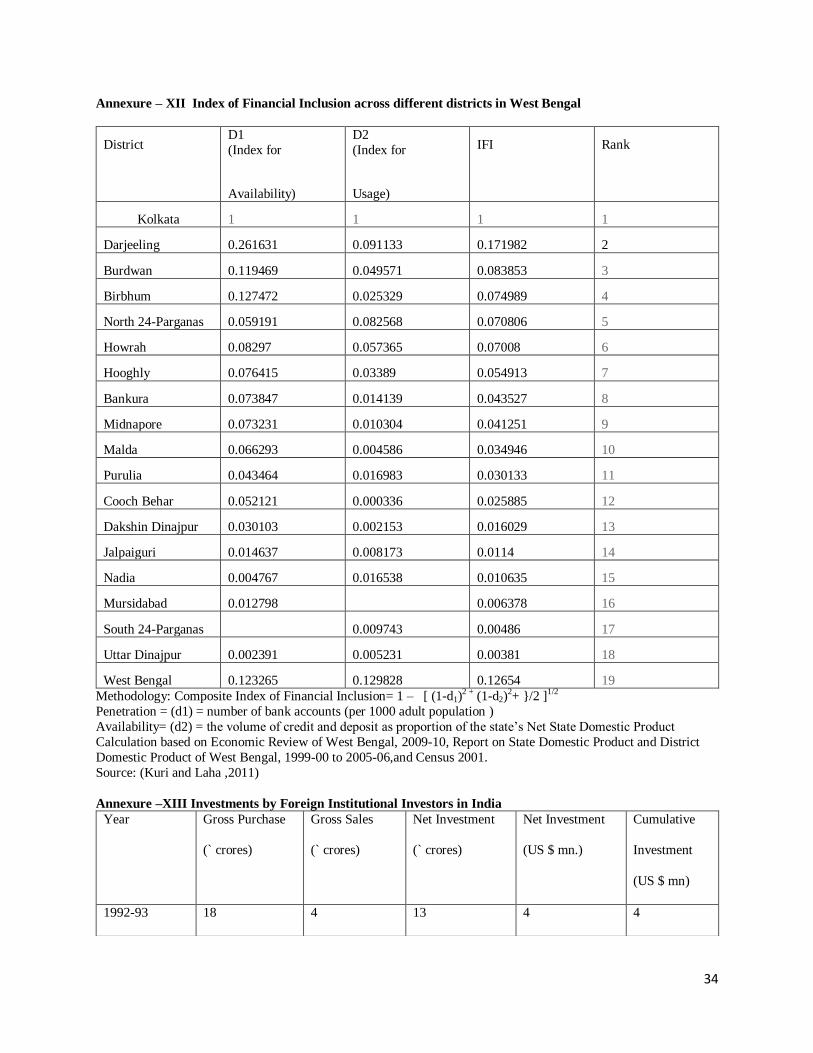
in West Bengal (Annexure-XI). Dr. Pravat Kumar Kuri and Dr. Arindam Laha identified two
dimensions of financial inclusion namely availability and usage of banking services to measure
the index of Financial inclusion as well as to scrutinize inter district disparity of West Bengal in
terms of inclusive growth (Kuri and Laha ,2011), (Annexure-XII).
.
Role of Capital Market in Financial Inclusion; a New Dimension: The apex body of capital
Market, Security Exchange Board of India is willing to enhance retail participation in the market
on a continuous basis. The supernormal performance of Indian capital market is reflected glory
because the upward movement is not due to strong fundamental of the domestic companies. The
logic of superb performance of Sensex was due to huge inflow of funds by the Foreign
Institutional Investors to appropriate profit generated by the interest rate arbitrage (Annexure –
XIII). It requires no explanation that depending too much on external fund is very risky because
Foreign Institutional Investors are investing in India to appropriate the interest arbitrage
opportunity. Once recession takes place in the global economy, they immediately start to
liquidate their position to protect their home turf which creates a knee jerking effect for the
nation. If the domestic capital market can be made as self sustainable, the all on a sudden crash
in the capital market can be prevented to a large extent. The only solution is to reduce the
overdependence on Foreign Funds. This can be possible only if SEBI can win the trust and
confidence of the common people. As a regulatory body of the Indian capital market, SEBI has
to ensure effective and efficient corporate governance framework, easy accessibility of
information and better redressal of grievances of the investors. As per the recommendation of
Kumar Mangalam Birla Committee, SEBI clause 49 has been created by which SEBI can
maintain a close supervision and strict vigilance over the corporate governance practices of all
listed companies in the Indian Capital market. After the dematerialization of shares, individual
can buy or sell any number of shares and shares can be stored in the electronic format with the
help of International Securities Identification Numbers (ISIN). Thanks to the demat account,
denomination required to invest in the share of a company has become very less. This has

14
created an opportunity for the low income group people to participate in the domestic capital
market (Dhar, 2013).
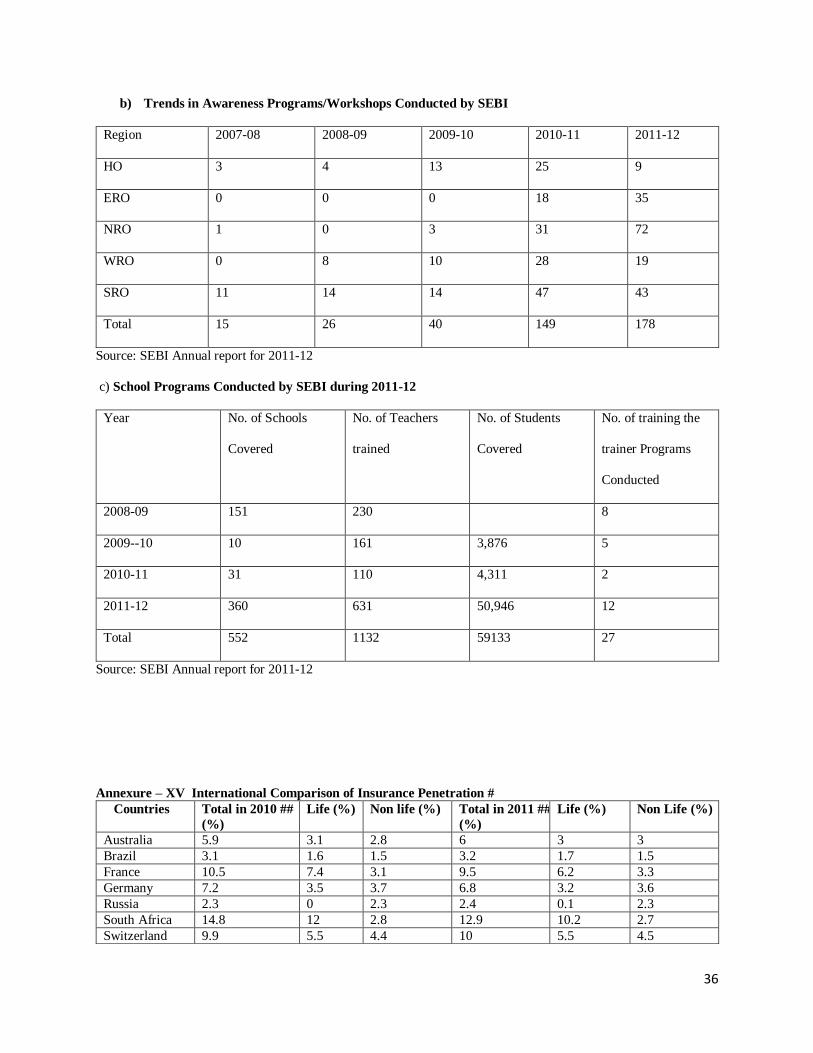
SEBI has already started its investor empowerment program which can be broadly classified into
two categories- Investor education and financial education. SEBI has designed an investor
friendly website (http://investor.sebi.gov.in) which can be seen as part of its effort for promoting
its campaigns. Simultaneously SEBI is conducting different workshops and seminars with the
collaboration of brokerage firms and mass media (Annexure –XIV).
Contribution of Insurance Sector in financial inclusion: After 66 years of Independence, the
penetration of insurance sector in Indian market is not up to the mark. In India, ratio of insurance
premium paid with respect to GDP is 4.1% with respect to the world average 6.6% (Annexure-
XV). Indian insurance sector is considered to be the sunrise sector. The huge demographic
dividend makes Indian market more attractive for the insurance players. It is true that Insurance
business is slowly and steadily growing up for last couple of years. In terms of penetration, the
total premium as a percentage of GDP, the Indian insurance market, hovering in the range of 4-
5% continues to be underpenetrated (Annexure-XVI). One of major reasons for such under
performance that insurance players continued to focus on tried and tested customer segment and
geographies. This has debarred the sector from expanding to the untapped areas. It can be stated
without any ambiguity that there remains a strong potential for exponential growth in these
untapped as well as untested market. Given the under penetration, the potential for insurance in
the rural markets can be anywhere between Rs 27500 to Rs 30000 crores over the next 5-7 years
resulting in a 10% growth bump. Critical elements such as relevant products, flexible distribution
channels and marketing initiatives centered on customer education are required to be
implemented to achieve this growth (Bali, 2013 ). Permitting 49% FDI in the insurance sector,
the Government of India showed its desperateness to create a sound inclusive insurance market.
Scope of general insurance can be viewed in different spheres which consists business
interruption coverage, property coverage, Intellectual property coverage, crime insurance for
employed covering the dishonesty and fraud, Director’s and Senior Executive’s liability
insurance, E-commerce Insurance policy as well as terrorism policy apart from mediclaim and
motor insurance policy. The sector has been converted from product centric to customer centric
15
by emphasizing on Customer Relationship Management, widening the existing customers’ base
and launching the software for integrated Grievance Redressal system. Bancassurance is cheaper
model where insurance companies are tying up with the banks to market their products through
banking channels. Simultaneously it is evident that private banks are selling insurance as a para
banking product by creating a subsidiary and PSU banks are selling insurance products by
creating a vertical division. Banks should develop their own technology taking into account the
insurance product so that insurance can be sold as a packaged product or integrated product.
IRDA has already adopted several strategies to promote, preach, profess and propagate the
agenda of financial inclusion (Annexure – XVII).
Pension Fund Regulatory and Development Authority Bill 2011: The Parliament of India
passed the Pension Fund Regulatory and Development Authority Bill 2011 on 4th
September,
2013 which aims to create a regulator for the pension sector and extend the coverage of pension
benefits to more people. The Pension Fund Regulatory and Development Authority Bill 2011
will give statutory powers Pension Fund Regulatory and Development Authority (PFRDA)
which was established in August 2003 as a regulator for the pension sector. At present most of
the pure pension products available in the market are linked with insurance coverage. The
passage of the bill could see pure pension products coming into the market (NDTV, 2013 ).
Conclusion: The recent Sarada group financial scam added a new dimension where after
investigation it was discovered that on 31st December, 2012, Rs 1.8crores was deposited in the
Dakshin Barasat branch of the Saradha group (Dutta, 2013). The fallout of Saradha group is
directly pinpointing to the factual premise that in spite of having huge potentiality of deposit
mobilization in suburban and rural area, the banking sector of India failed to utilize and
appropriate it to the greater interest of the country. The citizens of the nation had to pay a huge
penalty for the inefficiencies of the banking players. If this amount of fund could have been
brought into Indian banking system, it would enhance GDP of the nation to a significant extent.
The real truth is that alone banking sector cannot solve the total problem of financial exclusion.
It is true that SEBI has already taken a series of steps to market the capital market products such
as equity shares, mutual fund, bond and debentures in the rural areas. Like no frill account, SEBI
should provide the direction to the brokerage houses to open a Demat account for the poorer
section of the population at free of cost. The rural residents should not maintain a minimum cash

16
balance in their savings accounts. The brokerage houses should be advised to charge a lower rate
of brokerage from the poor villagers. This loss of revenue can be compensated by charging
higher brokerage from urban and wealthy investors. The price discrimination is ethical if it
follows the distributive, retributive and compensatory justice. The expectations will be both
unrealistic as well as irrational if it is assumed that all the rural villagers will start to subscribe
and trade in equity shares even if all the above-mentioned conditions are fulfilled. Initial ice
breaking exercise can be done through mutual fund.
The mutual fund is a safer option than equity as mutual fund is subject to the market risk only.
Mutual fund is a suitable option for the rural residents since no premium is charged in New Fund
Offer (NFO) and it is issued at par. In case of IPO of equity shares, issue price includes huge
share premium which the downtrodden section of the society cannot afford. The Systematic
Investment Plan (SIP) Scheme has come as blessings in disguise for retail investors. Certain
amount of money is deducted in every month from the savings account of the investor if the
investor opts for SIP. Investing in SIP is preferable option than investing in traditional mutual
fund scheme as in the former case investor is getting the opportunity to hedge the risk of market
volatility over a certain period of time (Dhar, 2013).
In the current scenario, insurance players should concentrate in four major areas such as
flexibility of the product, Personalization (Relationship with customer in life Insurance),
Experimentation (exploring new channels) and communication (via mobile and print media).
Microfinance activity cannot ensure the social welfare of the downtrodden poor mass to the
fullest extent unless and until Microfinance is accompanied by micro insurance. The micro
insurance scheme should take into account the power of sustainability, customer power,
information power, global investor power, power of simplicity, power of organization, power of
reciprocation and interdependence. For rural customer acquisition and retention, insurance
players should create trust and relevance through an ecosystem of stakeholders, define unique
selling proposition for rural customers, adopt the right set of influencer(Self Help Group or head
of the Gram Panchayat), devise low cost model for after sale support (partial disbursal of claim
amount towards meeting the funeral expenses of the life insured), derive micro insurance
products,develop innovative products such as crop and cattle insurance, invest in community
development and offering integrated product approach or bundling of products for better
coverage. Entrepreneurs and Finance Customer Association of India (EFCAI) urged Reserve

17
Bank of India (RBI) to allow the post offices to function as Banks on 19th August 2011. In a
memorandum submitted to RBI deputy governor, EFCAI pointed out that India has the world's
largest postal network in India with over 1.55 lakhs post offices, out of which 1.40 lakhs are in
the rural areas. If the RBI allows Indian Posts to start their own banking operations it will have
the potential to emerge as one of the biggest banks in the country and also ensure inclusive
growth. (Patnaik, 2011) The time has come for RBI to rethink about the proposal.
The different financial regulatory bodies such as RBI, SEBI, IRDA, Pension Regulatory Funds
are required to keep the long term vision in order to build the nation with sound economic
growth and sustainable development. The dream of real financial inclusion will be materialized
only when the entire population of the nation will be able to become beneficiary from the
different financial reforms made by the several regulatory bodies of the country. Despite all the
odds, obstacles and resistances it can be concluded unambiguously that the goal of the effective
financial inclusion of the Government of India will be achieved to a significant extent if all these
dimensions, suggestions and recommendations are taken into consideration.
18
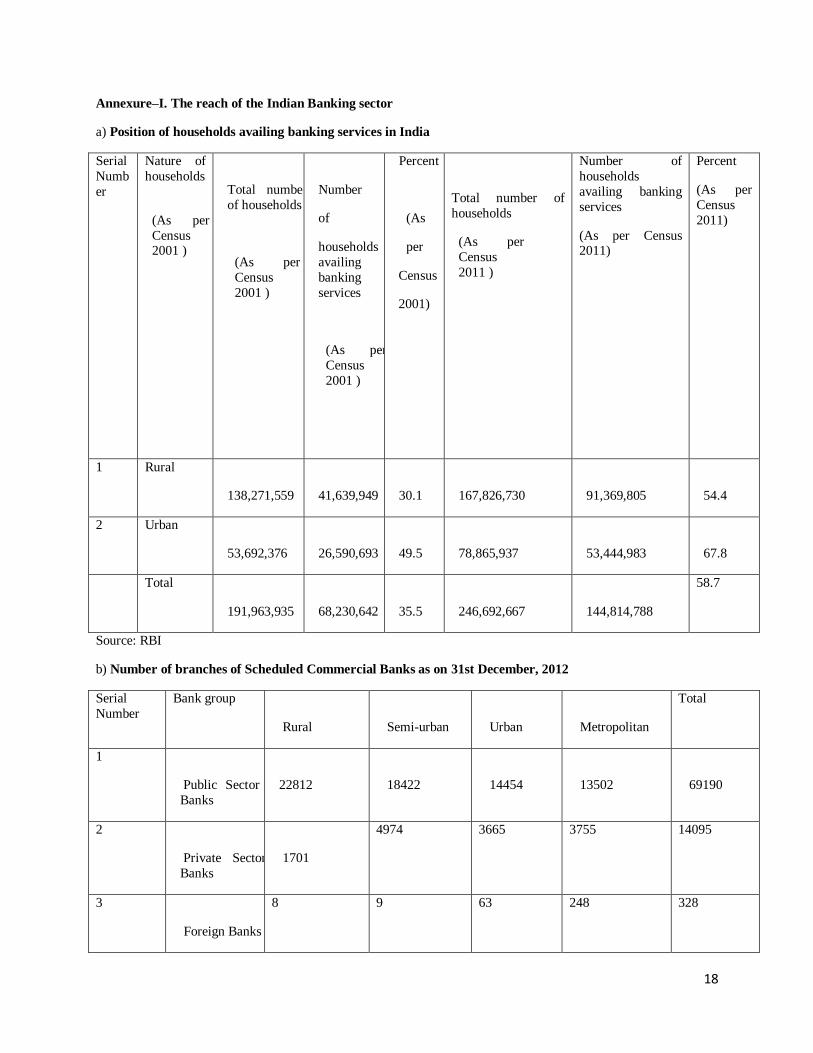
Annexure–I. The reach of the Indian Banking sector
a) Position of households availing banking services in India
Serial
Numb
er
Nature of
households
(As per
Census 2001 )
Total number
of households
(As per
Census
2001 )
Number
of
households
availing
banking
services
(As per
Census
2001 )
Percent
(As
per
Census
2001)
Total number of
households
(As per
Census
2011 )
Number of
households
availing banking
services
(As per Census 2011)
Percent
(As per
Census
2011)
1 Rural
138,271,559
41,639,949
30.1
167,826,730
91,369,805
54.4
2 Urban
53,692,376
26,590,693
49.5
78,865,937
53,444,983
67.8
Total
191,963,935
68,230,642
35.5
246,692,667
144,814,788
58.7
Source: RBI
b) Number of branches of Scheduled Commercial Banks as on 31st December, 2012
Serial
Number
Bank group
Rural
Semi-urban
Urban
Metropolitan
Total
1
Public Sector
Banks
22812
18422
14454
13502
69190
2
Private Sector
Banks
1701
4974 3665 3755 14095
3
Foreign Banks
8 9 63 248 328
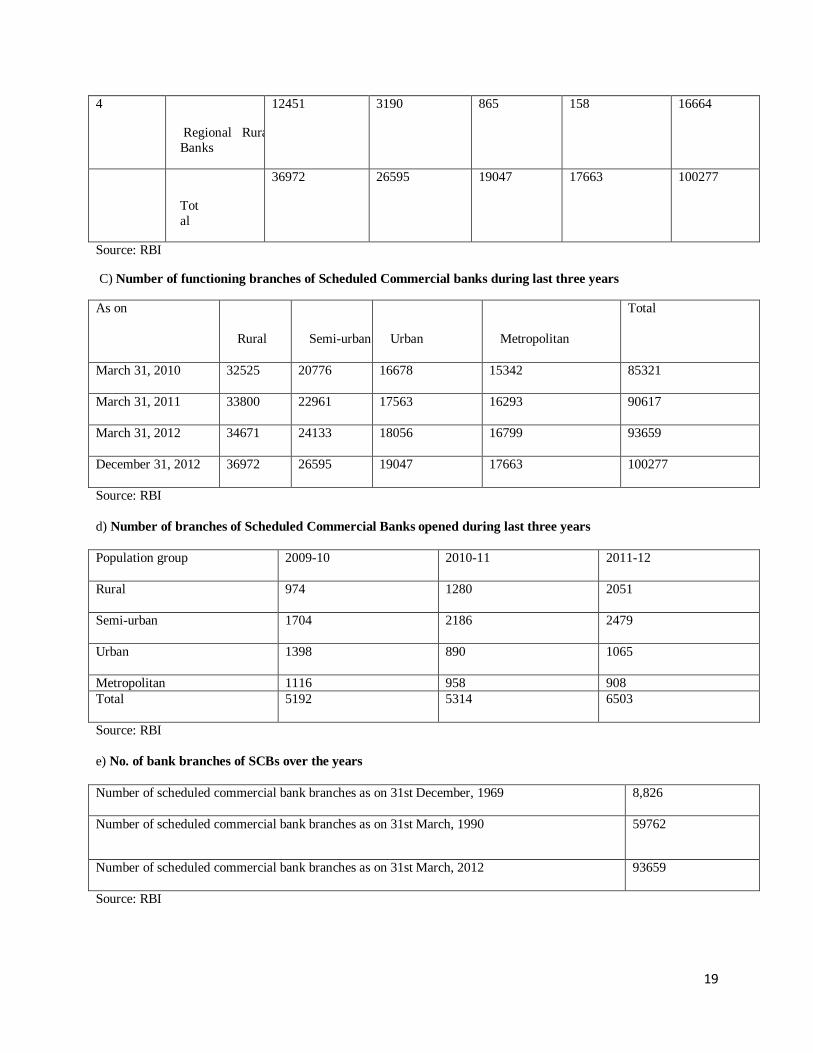
19
4
Regional Rural
Banks
12451 3190 865 158 16664
Tot
al
36972 26595 19047 17663 100277
Source: RBI
C) Number of functioning branches of Scheduled Commercial banks during last three years
As on
Rural
Semi-urban
Urban
Metropolitan
Total
March 31, 2010
32525
20776
16678 15342 85321
March 31, 2011
33800
22961 17563 16293
90617
March 31, 2012
34671 24133 18056 16799 93659
December 31, 2012
36972 26595 19047 17663 100277
Source: RBI
d) Number of branches of Scheduled Commercial Banks opened during last three years
Population group
2009-10 2010-11 2011-12
Rural 974
1280
2051
Semi-urban 1704
2186
2479
Urban
1398
890
1065
Metropolitan 1116 958 908
Total 5192
5314 6503
Source: RBI
e) No. of bank branches of SCBs over the years
Number of scheduled commercial bank branches as on 31st December, 1969
8,826
Number of scheduled commercial bank branches as on 31st March, 1990
59762
Number of scheduled commercial bank branches as on 31st March, 2012
93659
Source: RBI

20
f) Access to banking services in Major States of India
Serial
number
Name of the States Access to the banking services in percentage
1 HP 89.1
2 Uttrakhand 80.7
3 Kerala 74.2
4 UP 72
5 JK 72
6 Maharashtra 68.9
7 Rajasthan 68
8 Punjab 65.2
9 Karnataka 61.1
12 All India 58.7
13 Gujarat 57.9
14 Jharkhand 54
15 AP 53.1
16 TN 52.5
17 Chattisgarh 48.8
18 WB 48.5
19 MP 46.6
20 Odisha 45
21 Bihar 44.5
22 Assam 44.1
Source: Department of Financial Services, Ministry of Finance, Government of India as in September 2012

21
Annexure –II Indicators of outreach of financial services in selected SAARC member countries
Serial
Number Variable Afghanistan India Bangladesh Pakistan Nepal Sri Lanka
1 Bank branches
per 100,000
population
2 10.11 5.16 8.68 4.19 9.05
2 Bank branches per 1000 Km2
0.49 26.46 43.14 11.73 5.26 21.38
3 Loan account
per 1000 adults
3.32 89.03 54.73 21.93 - -
4 Deposit
account per
1000
adults
83.85 467.40 228.75 119.84 229.49 1891.74
5 ATM per
100000
population
0.39 7.29 - 4.06 1.81 12.29
6 ATM per 1000
Km2 0.09 19.08 - 5.49 2.27 29.03
7 Financial
Access Index
Rank
(Arora-60
countries)* (WEF-57
countries)**
-
-
29
49
44
35
48
55
57
-
34
-
Source: Compiled from Financial Access 2010, www.cgap.org/financialindicators Arora Rashmi Umesh, (2010),
Measuring Financial Access, Griffith University, Australia, June;**World Economic Forum, 2010,
www.weforum.org
Annexure –III
a) Comparative Analysis between the Different Nations on the Basis of ATM Penetration
Serial Number Name of the nation Number of ATM per 1 lakh
population ( in the year of 2011)
1 Australia 166.92
2 Brazil 119.63
3 France 109.8
4 Russia 152.9
5 Mexico 45.77
6 India 8.9
7 World Average 33.9
Source: RBI
b) Share of Indian population group in increment of ATMs in financial year 2012
Serial number Nature of population Percentage
1 Metropolitan 38
2 Urban 33
3 Semi Urban 22
4 Rural 7
Source: RBI

22
c) Number of ATMs in the country as on 30th September, 2012
Bank group
Rural
Semi-urban
Urban
Metropolitan
Total
Public Sector Banks 6926
15638
20075
17934
60573
Old Private Sector Banks
615 2356
2046
1489
6506
New Private Sector
Banks
1739 6146 10703 14718
33306
Foreign Banks
33 22 254
1052 1361
9,313
24,162
33,078
35,193
101,746
Source: RBI data
Annexure-IV Mobile banking transactions for banks in India (2012)
Serial number Month Number of mobile banking
transaction for banks
1 April 3178405
2 May 3346743
3 June 3437074
4 July 3705690
5 August 3968226
6 September 38797614
7 October 4437205
8 November 4720871
9 December 5221007
Source: RBI Data
Annexure- V
a) All India Position of different Public Sector Commercial Banks in Microfinance Activities in March,
2012.
Serial
Numbe
r
Name of the
banks
No. of
SHGs
Total
Loans
Disbursed
No. of SHGs
under
Swarnajayant
i Gram
Swarojgar
Yojana
Total Loans
Disbursed
under
Swarnajayanti
Gram
Swarojgar
Yojana
No. of
SHGs
Exclusively
for women
Total Loans
Disbursed
To Women
SHGs
(Amount `
Rs lakh)
1 Allahabad
Bank
8479 12191.56 6573 8174.13 6299 7560.30

23
2 Andhra
Bank
76504 173765.00 583 717.20 76504 173765.00
3 Bank of
Baroda
21293 22173.40 4802 5811.08 13742 14590.75
4 Bank of
India
22080 19958.93 10948 6623.99 19305 15066.09
5 Bank of
Maharashtra
8276 9555.71 8167 9468.54 7474 8426.04
6 Canara Bank 37121 57521.41 6805 9676.29 30853 47895.53
7 Central
Bank of
India
35868 20705.64 9016 9358.03 28380 15311.88
8 Corporation
Bank
13029 22558.45 836 807.03 12816 22133.97
9 Dena Bank 4712 3369.66 0 0 0 0
10 IDBI Bank 3209 9411.69 412 7115.85 3127 9324.95
11 Indian Bank 12321 11283.86 2302 5424.86 12199 11172.65
12 Indian
Overseas
Bank
33469 71393.00 7082 7632.00 31316 49924.00
13 Oriental
Bank of
Commerce
735 826.02 390 419.22 529 569.28
14 Punjab
National
Bank
15371 25793.00 10557 15073.23 13374 20226.00
15 Punjab &
Sind Bank
593 621.03 305 264.21 426 442.37
16 State Bank
of Bikaner
&
Jaipur
659 2191.00 414 1242.00 414 1244.00
17 State Bank
of
Hyderabad
40812 68890.00 944 1053.00 40812 68890.00

24
18 State Bank
of India
151415 274965.0 7564 15941.00 130310 232439.00
19 State Bank
of Mysore
7365 34292.65 220 1028.64 6640 30893.95
20 State Bank
of Patiala
548 899.60 275 465.40 260 302.25
21 State Bank
of
Travancore
5505 11338.67 1228 1914.31 5114 10544.02
22 Syndicate
Bank
16053 35935.38 957 1756.41 15372 33629.58
23 UCO Bank 11399 11418.37 6014 5172.21 8587 9409.24
24 Union Bank
of India
20819 12783.46 938 1079.38 17974 11074.54
25 United Bank
of India
16653 10294.95 12596 7820.76 16027 9897.30
26 Vijaya Bank 6962 15389.03 1186 2167.00 6665 13050.52
Total 571250 939526.46 101114 126205.78 504519 817783.21
Source : (NABARD, 2012)
b) All India Position of different Private Sector Commercial Banks in Microfinance Activities in March,
2012
Serial
Numb
er
Name of the
banks
No. of
SHGs
Total
Loans
Disbursed
No. of
SHGs under
Swarnajayan
ti Gram
Swarojgar
Yojana
Total Loans
Disbursed
under
Swarnajayanti
Gram
Swarojgar
Yojana
No. of SHGs
Exclusively
for women
Total Loans
Disbursed
To Women
SHGs
(Amount ` Rs
lakh)
1 AXIS Bank 15 18.24 15.00 18.24 14 18.04
2 Capital
Local Area
Bank
0 0 0 0 0 0
3 City Union
Bank
963 1541.52 226.00 231.90 0 0
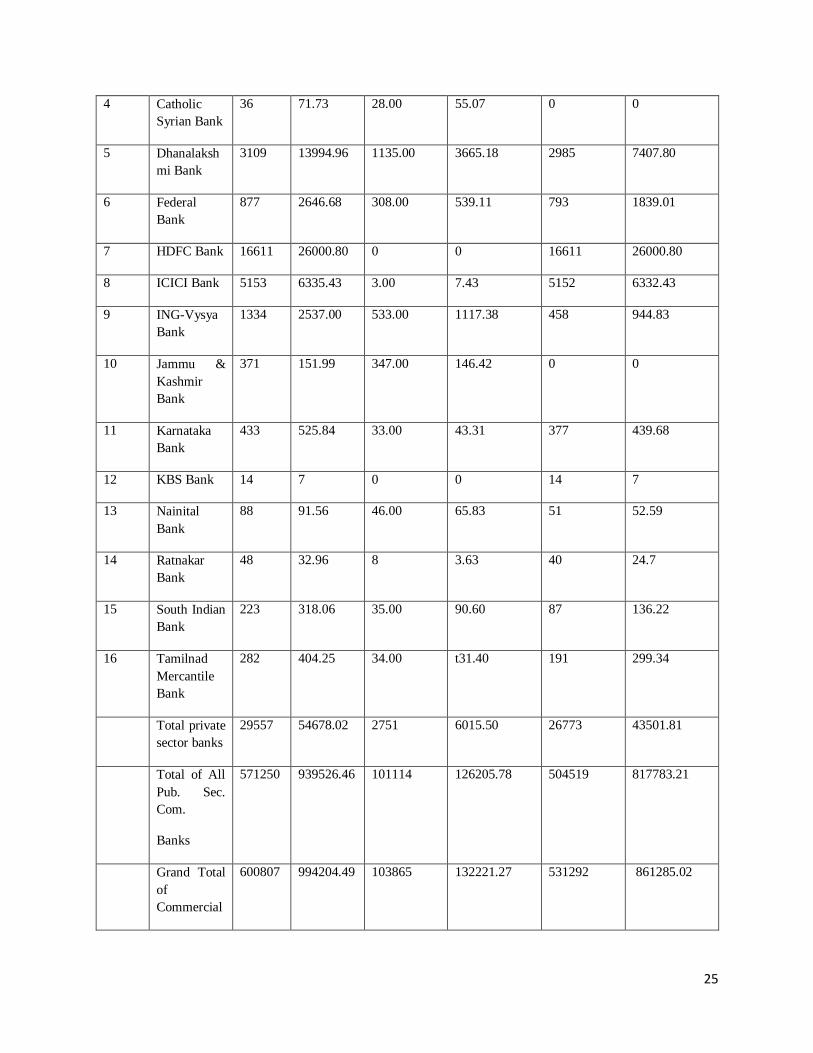
25
4 Catholic
Syrian Bank
36 71.73 28.00 55.07 0 0
5 Dhanalaksh
mi Bank
3109 13994.96 1135.00 3665.18 2985 7407.80
6 Federal
Bank
877 2646.68 308.00 539.11 793 1839.01
7 HDFC Bank 16611 26000.80 0 0 16611 26000.80
8 ICICI Bank 5153 6335.43 3.00 7.43 5152 6332.43
9 ING-Vysya
Bank
1334 2537.00 533.00 1117.38 458 944.83
10 Jammu &
Kashmir
Bank
371 151.99 347.00 146.42 0 0
11 Karnataka
Bank
433 525.84 33.00 43.31 377 439.68
12 KBS Bank 14 7 0 0 14 7
13 Nainital
Bank
88 91.56 46.00 65.83 51 52.59
14 Ratnakar
Bank
48 32.96 8 3.63 40 24.7
15 South Indian
Bank
223 318.06 35.00 90.60 87 136.22
16 Tamilnad
Mercantile
Bank
282 404.25 34.00 t31.40 191 299.34
Total private
sector banks
29557 54678.02 2751 6015.50 26773 43501.81
Total of All
Pub. Sec.
Com.
Banks
571250 939526.46 101114 126205.78 504519 817783.21
Grand Total
of
Commercial
600807 994204.49 103865 132221.27 531292 861285.02
26
Banks
Share of
PSU banks
95.08% 94.5% 97.35% 95.45% 94.96% 94.95%
Source : (NABARD, 2012)
Annexure- VI A comparative analysis between the Performance of Eastern Region of the Nation as well as
Performance across
the Nation with reference to financial inclusion
Serial
Number
Particulars 2001(All
India Figure)
2011(All
India
Figure)
2012(All
India
Figure)
2001
(Eastern
region
figure)
2011
(Eastern
region
figure)
2012
(Eastern
region
figure)
1 Household
availing
banking
services (%)
35.2 58.7 - 28.8 47.3 -
2 Population per
bank of branch
(%)
15.6 13.3 12.5 19.5 18.1 17.3
3 No of accounts
per thousand ( credit)
51 100 106 37 54 54
4 No of accounts
per thousand
(Deposit)
416 609 734 321 476 540
5 Per capita
credit
outstanding
5.2 33.7 39.1 2 12.1 13.9
6 Per capita
deposit
outstanding
9.2 42.5 49.4 5.5 22.8 26.5
Source: RBI data
Annexure–VII Progress of the Scheduled Commercial Banks in Financial Inclusion Plan(excluding
RRBs) (Amount in ` billion)
Particulars March
2010
March
2011
March
2012
Variation
March
2012 over
March
2010
No. of BCs/BC
Agents
33,042 57,329 95,767 62,725
27
deployed
Number of banking
outlets
in villages with
population
above 2,000
27,353 54,246 82,300 54,947
Number of banking
outlets
in villages with
population
less than 2,000
26,905 45,937 65,234 38,329
Total number of
banking
outlets in villages
54,258 1,00,183 1,47,534 93,276
Of which
a) Through
branches
21,475 22,662 24,701 3,226
b) Through BCs 32,684 77,138 1,20,355 87,671
c) Through Other
Modes
99 383 2,478 2,379
Urban Locations
covered
through BCs
433 3,757 5,875 5,442
No-Frill accounts
Number (millions) 50.3 75.4 105.5 55.2
Amount (` billions) 42.6 57.0 93.3 50.7
Overdraft availed
in No
Frill Accounts
Number (millions) 0.1 0.5 1.5 1.4
Amount (` billions) 0.1 0.2 0.6 0.5
28
Kisan Credit Card
(KCC)
Number of
Accounts
( millions)
15.9 18.2 20.3 4.4
Outstanding
amount
(` billions)
940.1 1237.4 1651.5 711.4
General Purpose
Credit
Card (GCC)
Number of
Accounts
(millions)
0.9 1.0 1.3 0.4
Outstanding
amount
(` billions)
25.8 21.9 27.3 1.6
ICT Based
Accounts
through BCs
Number of
Accounts
( millions)
12.6 29.6 52.1 39.5
Number of
transactions
during the year
(millions)
18.7 64.6 119.3 183.9
Source: RBI Annual Report 2011-12
29
Annexure –VIII The progress under FIF & FITF (As on 31 March 2013)
Name of the
fund
S
2010-11
D
2010-11
S
2011-12
D
2011-12
S
2012-13
D
2012-13
Cumulative
S
As on 31st
March ,2013
Cumulative
D
As on 31st
March ,2013
FIF* 19.00 9.21 75.96 18.90 67.02 33.31 181.64 69.77
FITF 101.11 54.01 221.07 128.39 22.01 17.14 365.49 201.30
Total 120.11 63.22 297.03 147.29 89.03 50.45 547.13 271.07
S = Sanction
D =Disbursement
S: Sanctions, D: Disbursements
*: Includes `56 crore sanctioned for two projects treated as withdrawn
Source : NABARD Annual Report
Annexure- IX District-wise Outreach of Scheduled Commercial Banks in West Bengal
Name of
Districts No.
of
acco
unts
per
Bra
nch
1980
-81
No. of
accoun
ts per
Branc
h
1990-
91
No.
of
acco
unts
per
Bran
ch
2000
-01
No. of
accou
nts
per
Bran
ch
2009-
10
No
of
Acco
unts
per
100
adul
t
pers
ons
1980
-81
No
of
Acco
unts
per
100
adul
t
pers
ons
1990
-91
No
of
Acco
unts
per
100
adul
t
pers
ons
2000
-01
No of
Acco
unts
per
100
adult
pers
ons
2009
-10
No.
of
Adul
t
Pop
ulati
on
per
bran
ch
1980
-81
No.
of
Adul
t
Pop
ulati
on
per
bran
ch
1990
-91
No. of
Adult
Populati
on per
branch
2000-01
No. of
Adult
Popul
ation
per
branc
h
2009-
10
Bankura 2,85
6 3,705 5,520 7,112 13 36 49 55
22,0
25
10,2
76 11,286
12,86
3
Burdwa
n
5,10
3 6,464 7,528 8,724 35 66 68 76
14,7
63
9,80
2 11,011
11,50
1
Birbhum 2,14
6 3,331 5,304 7,715 14 40 55 69
14,9
18
8,28
5 9,646
11,11
9
Dakshin
Dinajpur
2,96
8 14,805 3,714 5,846 18 108 27 37
16,3
08
8,94
1 14,065
16,68
8
Darjeeli
ng
3,81
7 6,625 7,011 8,166 38 81 81 96
10,0
87
8,22
4 8,610 8,470
Howrah 5,40
5 7,918
10,33
1
10,43
0 41 63 87 82
13,2
28
12,4
88 11,904
12,65
2
Hooghli 5,65
8 6,774 9,251
10,37
5 37 71 73 78
15,4
58
9,60
0 12,620
13,31
3
Jalpaigu
ri
3,30
9 4,205 5,755 8,069 14 35 41 50
23,7
17
12,0
24 14,033
16,01
2
Cooch
bihar
2,96
3 3,200 4,387 6,782 13 25 35 45
23,0
65
12,6
62 12,585
14,97
8
Kolkata 7,16
3 10,252
10,34
8
10,06
4 226 312 334 301
3,16
8
3,28
9 3,098 3,345

30
Maldah 2,64
0 3,092 4,540 7,042 10 28 39 51
25,5
95
10,9
81 11,559
13,75
1
Murshid
abad
3,15
4 3,847 5,641 8,247 41 33 41 28
7,68
4
11,8
23 13,715
28,96
5
Nadia 4,46
2 5,225 7,509 9,174 22 43 50 53
19,9
73
12,2
53 15,150
17,41
8
North 24
Parganas
6,14
6 8,465
11,37
3
11,66
2 68 84 90 48
10,3
44
13,4
92 15,546
14,82
5
Medinip
ur
2,85
6 3,705 5,520 7,112 13 36 49 55
22,0
25
10,2
76 11,286
12,86
3
Purulia 5,10
3 6,464 7,528 8,724 35 66 68 76
14,7
63
9,80
2 11,011
11,50
1
South 24 Parganas
2,146
3,331 5,304 7,715 14 40 55 69 14,9
18 8,28
5 9,646
11,119
Uttar
Dinajpur
2,96
8 14,805 3,714 5,846 18 108 27 37
16,3
08
8,94
1 14,065
16,68
8
West
Bengal
3,81
7 6,625 7,011 8,166 38 81 81 96
10,0
87
8,22
4 8,610 8,470
Source : Working Paper Series, DEPARTMENT OF ECONOMIC AND POLICY RESEARCH : 8 / 2011, Reserve
Bank of India
Annexure –X District-wise CD Ratio
Sl.
No
Name of
District
Lead
Bank
Depo
sit
MAR
CH
2012
Adva
nce
MAR
CH
2012
CD
Ratio
MAR
CH
2012
Depo
sit
SEPT
2012
Adva
nce
SEPT
2012
CD
Ratio
SEPT
2012
Depos
it
MAR
CH
2013
Adva
nce
MAR
CH
2013
CD
Ratio
MAR
CH
2013
1 Burdwan
*
UCO
Bank
2364
1.66
7705.
28 33
28344
.33
8819.
8 31
30419
.94
11505
.05 38
2 Bankura* UBI 5267.
38 1732.
12 33
5874.77
1825.03
31 6294.
52 2296.
64 36
3 Birbhum* UCO
Bank
5392.
7
1984.
22 37
6142.
92
2175.
02 35
6484.
41
2551.
36 39
4 Cooch
Behar CBI
2441.
12
1423.
33 58
2886.
8
1643.
66 57
3116.
94
1822.
09 58
5 Darjeelin
g CBI
5784.
1
3357.
09 58
7291.
7
3435.
75 47
7374.
42
3525.
95 48
6 Malda UBI 4036.
15
1815.
43 45
4789.
11
2043.
52 43
4741.
39
2115.
16 45
7 Uttar
Dinajpur UBI
2271.
00
1225.
94 54
2647.
25
1341.
45 51
2793.
54
1457.
56 52
8 Dakshin
Dinajpur UBI
1490.
92
906.0
4 61
1800.
43
1019.
29 57
1931.
3
1080.
6 56
9 Howrah UCO
Bank
1172
8.55
5913.
22 50
12337
.15
6360.
74 52
12797
.00
6910.
00 54
10 Hooghly* UCO
Bank
1515
1.16
3564.
12 24
17717
.35
3490.
66 20
19002
.50
4778.
75 25
11 Jalpaiguri CBI 4488.
86
1911.
58 43
5498.
30
2655.
95 48
5894.
35
2865.
69 49
12 Purba Medinipu
r
UBI 7381.
54 3364.
87 46
8586.57
4041.15
47 9412.
67 4774.
51 51
13 Paschim UBI 1042 4376. 42 10757 4259. 40 10334 4666. 45

31
Medinipu
r*
9.86 07 .39 31 .89 81
14 Murshida
bad* UBI
6361.
5
2352.
28 37
7625.
62
2771.
03 36
8223.
84
3162.
71 38
15 Nadia* UBI 7088.
10
2017.
05 28
9871.
71
2659.
32 27
10098
.29
3531.
20 35
16 Purulia* UBI 3722.
55
936.7
8 25
4082.
97
917.3
2 22
4419.
87
1818.
82 41
17
24-
Parganas
(North)*
Allahabad
Bk
3703
5.83
7071.
32 19
42518
.28
8581.
59 20
47815
.28
11240
.29 24
18 24-Parganas
(South)*
UBI 9628.
11
3866.
47 40
11258
.56
4594.
15 41
13232
.84
6031.
90 46
* Indicates 10 identified districts for increasing CD Ratio by 5% over the position as on September 2012
Source : State Level Bankers’ Committee of West Bengal
Annexure –XI Several Strategies adopted by SLBC of West Bengal
a) Financing the Minority Community and backward classes:
The under noted twelve districts of the State have been identified as Minority concentrated districts:
i) Howrah ii) Kolkata iii) Burdwan iv) Nadia v) 24 Parganas (N) vi) 24 Parganas (S) vii) Malda viii)
Murshidabad ix) Uttar Dinajpur x) Dakshin Dinajpur xi) Coochbehar and xii) Birbhum.
Position of outstanding credit to Minorities during last five years in West Bengal
Item
March
2009
Amt
in Rs.
crore
March 2010
Amt in Rs.
crore
March
2011
Amt in
Rs. crore
March
2012
Amt in
Rs.
crore
Mar
ch
2013
Amt
in
Rs.
cror
e
Rise
in %
during
2009-
10
Rise
in
%
during
2010-
11
Rise
in
%
during
2011-12.
Rise
in
%
During
2012-13
Outstandin
g Priority
Sector
credit to Minority
Communit
y
7486 8864 10620 12621 1557
0
18.40 19.81 18.84 23.36
32
Total
priority
sector
credit in
the State
51560 60048 72625 80374 9168
7
16.46 20.94 10.67 14.08
% to total
Priority
sector credit
14.51 14.76 14.62 15.70 16.9
8
0.25 (-) 0.14 1.08 1.28
Source : State Level Bankers’ Committee of West Bengal
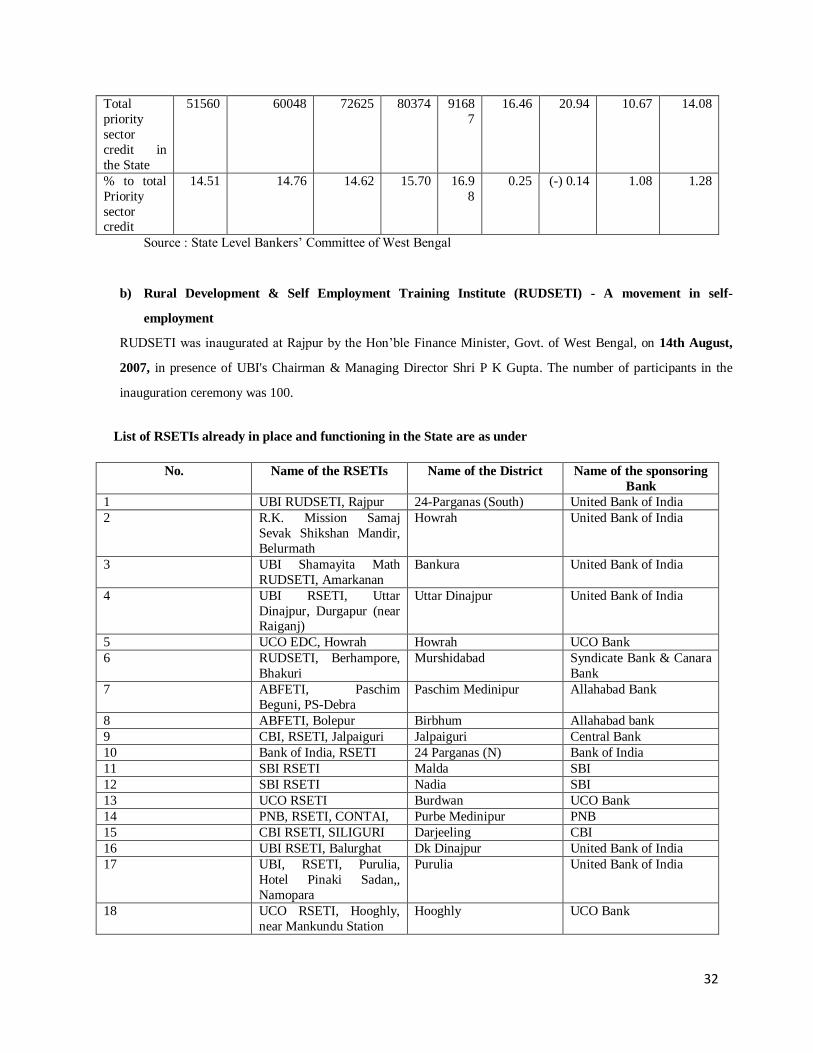
b) Rural Development & Self Employment Training Institute (RUDSETI) - A movement in self-
employment
RUDSETI was inaugurated at Rajpur by the Hon’ble Finance Minister, Govt. of West Bengal, on 14th August,
2007, in presence of UBI's Chairman & Managing Director Shri P K Gupta. The number of participants in the
inauguration ceremony was 100.
List of RSETIs already in place and functioning in the State are as under
No. Name of the RSETIs Name of the District Name of the sponsoring
Bank
1 UBI RUDSETI, Rajpur 24-Parganas (South) United Bank of India
2 R.K. Mission Samaj
Sevak Shikshan Mandir,
Belurmath
Howrah United Bank of India
3 UBI Shamayita Math
RUDSETI, Amarkanan
Bankura United Bank of India
4 UBI RSETI, Uttar
Dinajpur, Durgapur (near Raiganj)
Uttar Dinajpur United Bank of India
5 UCO EDC, Howrah Howrah UCO Bank
6 RUDSETI, Berhampore,
Bhakuri
Murshidabad Syndicate Bank & Canara
Bank
7 ABFETI, Paschim
Beguni, PS-Debra
Paschim Medinipur Allahabad Bank
8 ABFETI, Bolepur Birbhum Allahabad bank
9 CBI, RSETI, Jalpaiguri Jalpaiguri Central Bank
10 Bank of India, RSETI 24 Parganas (N) Bank of India
11 SBI RSETI Malda SBI
12 SBI RSETI Nadia SBI
13 UCO RSETI Burdwan UCO Bank
14 PNB, RSETI, CONTAI, Purbe Medinipur PNB
15 CBI RSETI, SILIGURI Darjeeling CBI
16 UBI RSETI, Balurghat Dk Dinajpur United Bank of India
17 UBI, RSETI, Purulia,
Hotel Pinaki Sadan,,
Namopara
Purulia United Bank of India
18 UCO RSETI, Hooghly,
near Mankundu Station
Hooghly UCO Bank

33
RSETI= Rural Self Employment Training Institute
ABFETI= Association of Bank Financial Education Technology Institute
Source : State Level Bankers’ Committee of West Bengal
C) Financial Literacy cum Credit Counseling Centers (FLCCs)
The meeting of the Subcommittee of SLBC on FLC was last held on 13th February, 2013, proceedings of which with
action points emerging is annexed. Some of the salient points are:
FLCs can also be established in other areas by non lead banks / lead banks.
The FLCs and rural branches of the banks would also conduct outdoor Financial Literacy Camps with focus
on financially excluded people at least once in a month.
At present the following 27 FLCCs are functioning in the State. List of FLCCs are mentioned below-
Sl no. Name of the center District Sponsoring Bank Lead Bank
1 Rajpur 24 Pgs (S) UBI UBI
2 Tollygunj Kolkata Allahabad Bank -
3 Suri Birbhum UCO Bank UCO Bank
4 Chinsura Hooghly UCO Bank UCO Bank
5 Barasat 24 Pgs (N) BOI Allahabad Bank
6 Raiganj Uttar Dinajpur UBI UBI
7 Balurghat Dk Dinajpur UBI UBI
8 Belurmath Howrah UBI UCO Bank
9 Howrah GT Road
(S)
Howrah UCO Bank UCO Bank
10 Lalgola Murshidabad CBI UBI
11 Barasat 24 Pgs (N) Allahabad Bank Allahabad Bank
12 Krishnanagar Nadia UBI UBI
13 Bankura Bankura UBI UBI
14 Jalpaiguri Jalpaiguri CBI CBI
15 Kalna Road,
Burdwan
Burdwan UCO Bank UCO Bank
16 LDM Office Uttar Dinajpur UBI UBI
17 LDM Office Purulia UBI UBI
18 LDM Office Malda UBI UBI
19 LDM Office Purba Medinipur UBI UBI
20 LDM Office Paschim Medinipur UBI UBI
21 LDM Office 24-Parganas (South) UBI UBI
22 LDM Office Murshidabad UBI UBI
23 LDM Office Cooch Behar CBI CBI
24 LDM Office Hooghly UCO Bank UCO Bank
25 LDM Office Birbhum UCO bank UCO Bank
26 LDM Office 24-Parganas (North) Allahabad bank Allahabad bank
27 LDM Office Dakshin Dinajpur UBI UBI
LDM= Lead District Manager’s Office
Source : State Level Bankers’ Committee of West Bengal
34
Annexure – XII Index of Financial Inclusion across different districts in West Bengal
District D1
(Index for
Availability)
D2
(Index for
Usage)
IFI Rank
Kolkata 1 1 1 1
Darjeeling 0.261631 0.091133 0.171982 2
Burdwan 0.119469 0.049571 0.083853 3
Birbhum 0.127472 0.025329 0.074989 4
North 24-Parganas 0.059191 0.082568 0.070806 5
Howrah 0.08297 0.057365 0.07008 6
Hooghly 0.076415 0.03389 0.054913 7
Bankura 0.073847 0.014139 0.043527 8
Midnapore 0.073231 0.010304 0.041251 9
Malda 0.066293 0.004586 0.034946 10
Purulia 0.043464 0.016983 0.030133 11
Cooch Behar 0.052121 0.000336 0.025885 12
Dakshin Dinajpur 0.030103 0.002153 0.016029 13
Jalpaiguri 0.014637 0.008173 0.0114 14
Nadia 0.004767 0.016538 0.010635 15
Mursidabad 0.012798 0.006378 16
South 24-Parganas 0.009743 0.00486 17
Uttar Dinajpur 0.002391 0.005231 0.00381 18
West Bengal 0.123265 0.129828 0.12654 19
Methodology: Composite Index of Financial Inclusion= 1 – [ (1-d1)2 + (1-d2)
2+ }/2 ]1/2
Penetration = (d1) = number of bank accounts (per 1000 adult population )
Availability= (d2) = the volume of credit and deposit as proportion of the state’s Net State Domestic Product
Calculation based on Economic Review of West Bengal, 2009-10, Report on State Domestic Product and District
Domestic Product of West Bengal, 1999-00 to 2005-06,and Census 2001.
Source: (Kuri and Laha ,2011)
Annexure –XIII Investments by Foreign Institutional Investors in India
Year Gross Purchase
(` crores)
Gross Sales
(` crores)
Net Investment
(` crores)
Net Investment
(US $ mn.)
Cumulative
Investment
(US $ mn)
1992-93 18 4 13 4 4

35
1993-94 5,593 467 5,127 1,634 1,638
1994-95 7,631 2,835 4,796 1,528 3,167
1995-96 9,694 2,752 6,942 2,036 5,202
1996-97 15,554 6,980 8,575 2,432 7,635
1997-98 18,695 12,737 5,958 1,650 9,285
1998-99 16,116 17,699 -1,584 -386 8,899
1999-00 56,857 46,735 10,122 2,474 11,373
2000-01 74,051 64,118 9,933 2,160 13,532
2001-02 50,071 41,308 8,763 1,839 15,372
2002-03 47,062 44,372 2,689 566 15,937
2003-04 1,44,855 99,091 45,764 10,005 25,943
2004-05 2,16,951 1,71,071 45,880 10,352 36,294
2005-06 3,46,976 3,05,509 41,467 9,363 45,657
2006-07 5,20,506 4,89,665 30,841 6,820 52,477
2007-08 9,48,018 8,81,839 66,179 16,442 68,919
2008-09 6,14,576 6,60,386 -45,811 -9,837 59,081
2009-10 8,46,438 7,03,780 1,42,658 30,251 89,333
2010-11 9,92,599 8,46,161 1,46,438 32,226 1,21,559
2011-12 9,21,285 8,27,562 93,725 18,923 1,40,482
Source: SEBI Annual Report for 2011-12
Annexure – XIV Initiatives by SEBI to attract the retail investors
a) Regional Seminars Conducted by SEBI during 2011-12
Region Head office
HO 20
ERO 9
NRO 8
WRO 2
SRO 6
Total 45
Source: SEBI Annual report for 2011-12
36
b) Trends in Awareness Programs/Workshops Conducted by SEBI
Region 2007-08 2008-09 2009-10 2010-11 2011-12
HO 3 4 13 25 9
ERO 0 0 0 18 35
NRO 1 0 3 31 72
WRO 0 8 10 28 19
SRO 11 14 14 47 43
Total 15 26 40 149 178
Source: SEBI Annual report for 2011-12
c) School Programs Conducted by SEBI during 2011-12
Year No. of Schools
Covered
No. of Teachers
trained
No. of Students
Covered
No. of training the
trainer Programs
Conducted
2008-09 151 230 8
2009--10 10 161 3,876 5
2010-11 31 110 4,311 2
2011-12 360 631 50,946 12
Total 552 1132 59133 27
Source: SEBI Annual report for 2011-12
Annexure – XV International Comparison of Insurance Penetration #
Countries Total in 2010 ##
(%)
Life (%) Non life (%) Total in 2011 ##
(%)
Life (%) Non Life (%)
Australia 5.9 3.1 2.8 6 3 3
Brazil 3.1 1.6 1.5 3.2 1.7 1.5
France 10.5 7.4 3.1 9.5 6.2 3.3
Germany 7.2 3.5 3.7 6.8 3.2 3.6
Russia 2.3 0 2.3 2.4 0.1 2.3
South Africa 14.8 12 2.8 12.9 10.2 2.7
Switzerland 9.9 5.5 4.4 10 5.5 4.5

37
United Kingdoms 12.4 9.5 2.9 11.1 8.7 3.1
United States 8 3.5 4.5 8.1 3.6 4.5
Bangladesh 0.9 0.7 0.2 0.9 0.7 0.2
Honkong 11.4 10.1 1.3 11.4 10.1 1.3
India * 5.1 4.4 0.7 4.1 3.4 0.7
Japan 10.1 8 2.1 11 8.8 2.2
Malaysia 4.8 3.6 1.2 5.1 3.3 1.8
Pakistan 0.6 0.3 0.3 0.7 0.4 0.3
PR China 3.8 2.5 1.3 3 1.8 1.2
Singapore 6.1 4.6 1.6 5.9 4.3 1.5
South Korea 11. 2 7 4.2 11.6 7 4.6
Sri Lanka 1.5 0.6 0.9 1.2 0.6 0.6
Taiwan 18.4 15.4 3 17 13.9 3.1
Thailand 4.3 2.6 1.7 4.4 2.7 1.7
World 6.9 4 2.9 6.6 3.8 2.8
Source- IRDA annual report for the period of 2011-12
# Insurance penetration is measured as the ratio of premium in US dollars to GDP in US dollars.
## Data pertains to calendar year 2010 and 2011
*Data relates to financial year 2011-12 and 2012-13.
Annexure –XVI Insurance penetration in India ( premium in dollar/GDP in percentage)
Year Life Non Life
FY 2002 2.15 0.56
FY 2003 2.59 0.67
FY 2004 2.26 0.62
FY 2005 2.53 0.64
FY 2006 2.53 0.61
FY 2007 4.1 0.6
FY 2008 4.00 0.6
FY 2009 4.00 0.6
FY 2010 4.6 0.6
FY 2011 4.4 0.71
FY 2012 3.4 0.7
Source : IRDA , Accenture Analysis

38
Annexure – XVII Contributory role played by IRDA in Financial inclusion
Gist of IRDA Guidelines/Circulars/Notifications from 16th to 20th July 2012
Date
S.No & Reference
Contents / Abstract
16.7.12
1.
National Strategy for Financial Education The IRDA today released on its website the draft National Strategy for
Financial Education. The National Strategy recognizes that financial literacy and financial education play a vital role in financial inclusion and inclusive
growth and envisages ways towards creating awareness and educating
consumers on access to financial services, availability of various types of
products and their features; changing attitudes to translate knowledge into
responsible financial behaviour; and making consumers of financial services
understand their rights and obligations.
17.7.12
2
IRDA/Life
/Misc/Cir/
154/07/
2012
Modified Guidelines on Advertisements Modified guidelines are issued by the Authority on reviewing various
advertisements filed with the objective of offering a more facilitative
approach to all insurers.
19.7.12
3.
Online application to compare Non Life Insurance products The Authority has introduced an online application that enables the user to
compare coverages, exclusions etc. under non life insurance products currently
being sold by different insurers in the market.
Source: IRDA
39
Bibliography
Bali, S. a. (2013 ). Opportunities in Indian Insurance- New Places ,Faces, Spaces . Kolkata : Accenture .
Bengal, G. O. (2013 , September 20). State Level Bankers' Committee , West Bengal . Financial Inclusion Details.
Kolkata , West Bengal , India : United Bank of India . Retrieved from State Level Banker's Committtee .
Bhanot, D. ,. (2012). Studying financial inclusion in North East India. International Journal of Bank Marketing , 30
(6), 465-484.
Bihari, S. C. (2011). "Growth Through Financial Inclusion in India". Journal of International Business Ethics , 4
(1), 28-41.
Byrne, D. (1999). Social Exclusion. Buckingham: Open University Press.
Chattopadhyay, Sadhan Kumar. Financial Inclusion in India: A case-study of West Bengal . 1 August 2011 . 30
September 2013 <http://www.rbi.org.in/scripts/PublicationsView.aspx?id=13517>.
Chowdhury, M. J. (2005). 'The impact of micro-credit on poverty:evidence from Bangladesh'. Progress in
Development Studies , 5 (4), 298–309.
Dasgupta, A. a. (2013 ). Indian Banking -the Engine for Sustaining India's Growth Agenda . Kolkata : KPMG.
Demirguc-Kunt, A. a. (2011 ). Measuring Financial Inclusion ,The Global Financial Inclusion Index (Global
Findex) . The World Bank Development Research Group and Bill & Melinda Gates Foundation .
(DEPR), Department of Banking Operations and Development (DBOD) and Department of Economic Policy and
Research. "Discussion Paper." Banking Structure in India - The Way Forward. Mumbai : Reserve Bank of India ,
August 2013 .
Dhar, S. K. (2013). 4th International Conference on Technical and Managerial Innovation in Computing and
Communications in Industry and Academia. Financial Inclusion Plan in India and its Braoder Perspectives (pp.
294-310). Kolkata: Institution of Engineering and Management in Collboration with IEEE Calcutta Chapter.
Dhar, S. K. (2010). Financial Inclusion, Call of the Day. Prism India , 7 (3), 21-24.
Dhar, S. K. (2011). " Union Budget of India for 2011-12: Its Scope and Direction". Prism India , VIII (II), 11-14.
Dhar, S. K. (2013). Marketing the Financial Services to the Unbanked Population. Deutschland : LAMBERT
Academic Publishing.
Dhar, S. K. (2013, May). Working Paper. “Marketing and Providing the Banking Services to the Unbanked
Population- is it Necessary and Sufficient Condition for Financial Inclusion?” . Kolkata, West Bengal, India: Social
Science Research Network.
Dongre, Y. a. (2010). "Building Access to Healthcare in Rural India: Possibility and Feasibility of Low-Cost
Medicine". International Journal of Pharmaceutical and Healthcare Marketing , 4 (4), 396-407.
Due, J. F. (1994). Efficiency ,Optimality and the Allocation of Resources . In J. F. Due, Government Finance (pp. 9-
25). New Delhi : A.I.T.B.S Publishers and Distributors .
Dutta, S. (2013 , April 27 ). ‘Cheat’ fund: The inside story of Sudipto Sen & Saradha group . Retrieved June 8, 2013
, from Zeenews.com : http://zeenews.india.com/blog/cheat-fund-the-inside-story-of-sudipto-sen-and-saradha-
group_6281.html

40
Gupta, V. a. (2006 ). Case Study . 'Labour Market Reforms in France and the Job Law CPE - a Lost Opportunity'?
Hyderabad, Andhra Pradesh , India : ICMR Center for Management Research
.Haq, M. U. (1990). Human Development Index. Retrieved August 3, 2013 , from HDI :
http://en.wikipedia.org/wiki/Human_Development_Index
Hassan, M. K.-G. (1997). The experience of the Grameen Bank of Bangladesh in community development.
International Journal of Social Economics , 24 (12), 1488 - 1523.
Jackson, M. J. (2011). Quality as a gap analysis of college students’ expectations. Quality Assurance in Education ,
19 (4), 392-412.
JONES, P. A. (2006). Giving Credit where it’s Due:Promoting Financial Inclusion through Quality Credit Unions.
Local Economy , 21 (1), 36-48.
Kashyap, P. a. (2009). The Rural Marketing Book. New Delhi: Biztantra
Krishnamacharyulu, C. a. (2006). Rural Marketing Text and Cases. New Delhi: Dorling Kindersley.
Kumar, B. a. (2011 ). Financial Inclusion and Inclusive Develoment in SAARC Countries with Special Reference to
India. Vilakshan, XIMB Journal of Management , 13-22 .
Kuri, Dr. Pravat Kumar and Dr. Arindam Laha. DETERMINANTS OF FINANCIAL INCLUSION: A STUDY OF
SOME SELECTED DISTRICTS OF WEST BENGAL, INDIA. Indian Council of Social Scinece Research Major
Project. Burdwan.: Department of Economics, The University of Burdwan, 2011 .
Michael, C. a. (2009). Financial Inclusion, Poverty Reduction and the Millennium Development Goals. European Journal of Development Research , 21 (2), 213-230.
MOSCHINI GIANCARLO, L. M. (2008). Geographical Indications and the Competitive Provision of Quality in
Agricultural Markets. American Agricultural Economics Association , 90 (3), 794-812.
NDTV. (2013 , September 4). Lok Sabha passes Pension Bill: 10 key facts. Retrieved September 11, 2013 , from
NDTV : http://profit.ndtv.com/news/cheat-sheet/article-lok-sabha-passes-pension-bill-10-key-facts-326741
Paninchukunnath, A. (2010). "3P Framework: Rural Marketing in India". SCMS Journal of Indian Management ,
54-67.
Patnaik, N. (2011, August 19). EFCAI urges RBI to allow post offices function as banks. Retrieved September 14,
2013, from The Economic Times : http://articles.economictimes.indiatimes.com/2011-08-
19/news/29905335_1_post-offices-banking-operations-banking-system
Pearce, D. a. (2012 ). Financial Inclusion Strategies Reference Framework . Washington: World Bank .
Shekhar, S. (2010-11). SWARNAJAYANTI GRAM SWAROJGAR YOJANA. Delhi: IFMR Foundation.
Sinha, S. (2013 , September 3). Differentiated licensing talk gives banking aspirants hope. Retrieved September 11,
2013 , from The Economic Times : http://articles.economictimes.indiatimes.com/2013-09-
03/news/41726891_1_banking-licence-banking-license-bandhan-financial-services
Velasquez, M. G. (2007). "Business Ethics:Concepts and Cases " (6 ed.). New Delhi: Prentice Hall of India Private
Limited.
Whitelaw, S. E. (2011). "Developing Social Marketing Capacity to Address Health Issues". Health Education , 111
(4), 396-407.

41