Embed Size (px)
Citation preview

‘Financial Inclusion in India: Why Not Happened’
September 2013

- 2 -
‘Financial Inclusion in India: Why Not
Happened’ (A Project Report Submitted to Indian Institute of Banking & Finance under the Macro
Research Award 2012-13)
Duration: March to September 2013 (Six Months)
Dr. Debashis Acharya, Associate Professor
School of Economics, University of Hyderabad, Central University
Post, Gachobowli, Hyderabad 500046
Shri Tapas Kumar Parida, Economist
Economic Research Department, State Bank of India,
Corporate Centre, Mumbai 400021
For
Indian Institute of Banking & Finance (IIBF),
Mumbai

- 3 -
Contents
~~~~~~~~~~~~~~~~~~~~~~~~~~~~~~~~~~~~~~~~~~~~~~~~~~~~~~~~~~~~~~~~
Sl No Chapter Title Page No
~~~~~~~~~~~~~~~~~~~~~~~~~~~~~~~~~~~~~~~~~~~~~~~~~~~~~~~~~~~~~~~~
Acknowledgements ………………………………….........................04
I. Introduction, Objectives and Scope of the Study………………..06-08
II. Financial Inclusion in India: ………………………….................09-57
A Critical Review of Policy Initiatives and Outcomes
III. Financial Inclusion in India: …………………………………….58-66
An Empirical Assessment 2007-08 to 2011-12
IV. Financial Inclusion and Supply Side Constraints………..............67-83
: Some Issues and Evidence
V. Summary, Conclusion and Policy Suggestions… …………........84-88
References……………………………………………….............89-93
Appendix ………………………………………………………..94-95
~~~~~~~~~~~~~~~~~~~~~~~~~~~~~~~~~~~~~~~~~~~~~~~~~~~~~~~~~~~~~~~~
~~~~~~~~~~~~~~~~~~~~~~~~~~~~~~~~~~~~~~~~~~~~~~~~~~~~~~~~~~~~~~~~

- 4 -
Acknowledgements
It is a matter of great pleasure for us in submitting the project report on ‘Financial Inclusion in India: Why
Not Happened?’ to Indian Institute of Banking and Finance (IIBF), Mumbai under the Macro-Research
Awards for the year 2012-13. The comments of the mid- term report has been very helpful in shaping up
the report. We sincerely thank the Chief Executive Officer , Deputy Chief Executive Officer and all the
Advisory Committee Members, IIBF, for their valuable comments and suggestions in different stages of this
work. Our heartfelt thanks to the Director of Academic Affairs, IIBF for the support extended during this
project. The effective and timely communication by Ms Rohini of IIBF has helped us in taking our work
forward.
Words seem to be inadequate to express my sincere thanks to the Branch Managers, who were kind
enough to spend their valuable time to answer my questions during the interviews.
We would also like to thank Shri Babu Rao Gona, in supporting primary survey and Shri Sumit Jain,
Economist, SBI, for research help.
I express my sincere thanks to State Bank of India for giving us all the facilities and support in preparing
this report. My thanks are due to the Dean, School of Economics, and the office staff of the School of
Economics for their continuous support throughout the project.
Debashis Acharya &Tapas Kumar Parida
Date: 30 September 2013
- 5 -
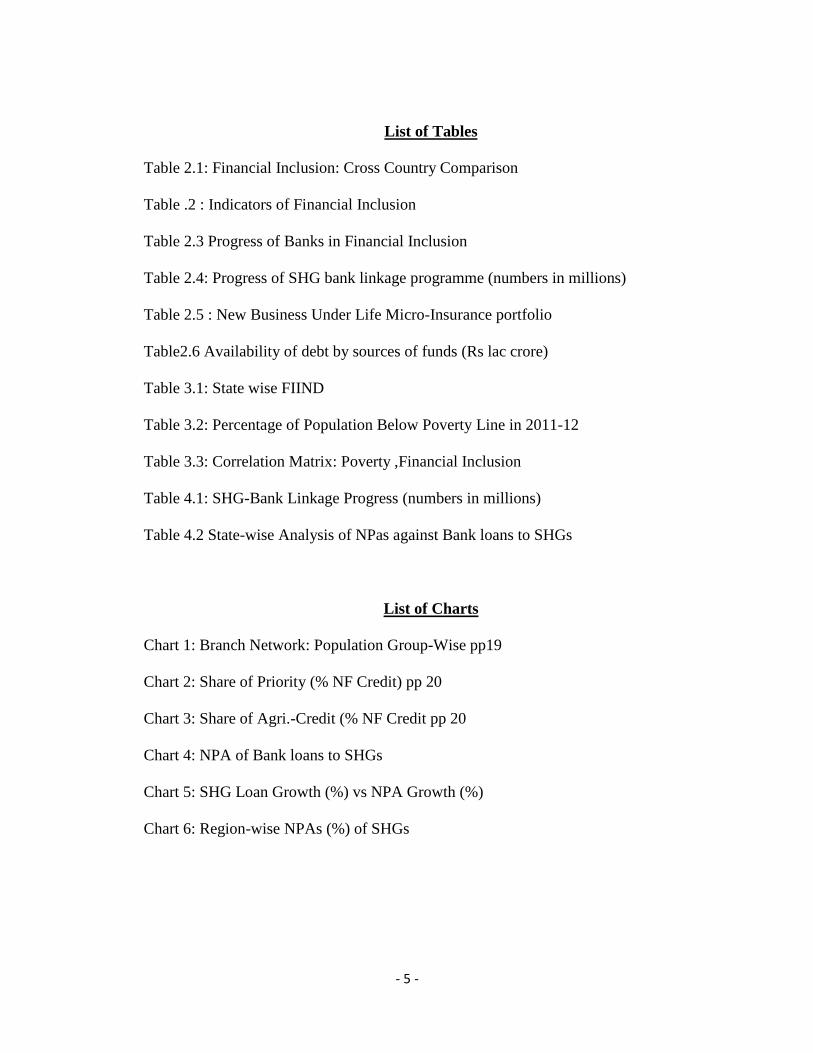
List of Tables
Table 2.1: Financial Inclusion: Cross Country Comparison
Table .2 : Indicators of Financial Inclusion
Table 2.3 Progress of Banks in Financial Inclusion
Table 2.4: Progress of SHG bank linkage programme (numbers in millions)
Table 2.5 : New Business Under Life Micro-Insurance portfolio
Table2.6 Availability of debt by sources of funds (Rs lac crore)
Table 3.1: State wise FIIND
Table 3.2: Percentage of Population Below Poverty Line in 2011-12
Table 3.3: Correlation Matrix: Poverty ,Financial Inclusion
Table 4.1: SHG-Bank Linkage Progress (numbers in millions)
Table 4.2 State-wise Analysis of NPas against Bank loans to SHGs
List of Charts
Chart 1: Branch Network: Population Group-Wise pp19
Chart 2: Share of Priority (% NF Credit) pp 20
Chart 3: Share of Agri.-Credit (% NF Credit pp 20
Chart 4: NPA of Bank loans to SHGs
Chart 5: SHG Loan Growth (%) vs NPA Growth (%)
Chart 6: Region-wise NPAs (%) of SHGs
- 6 -
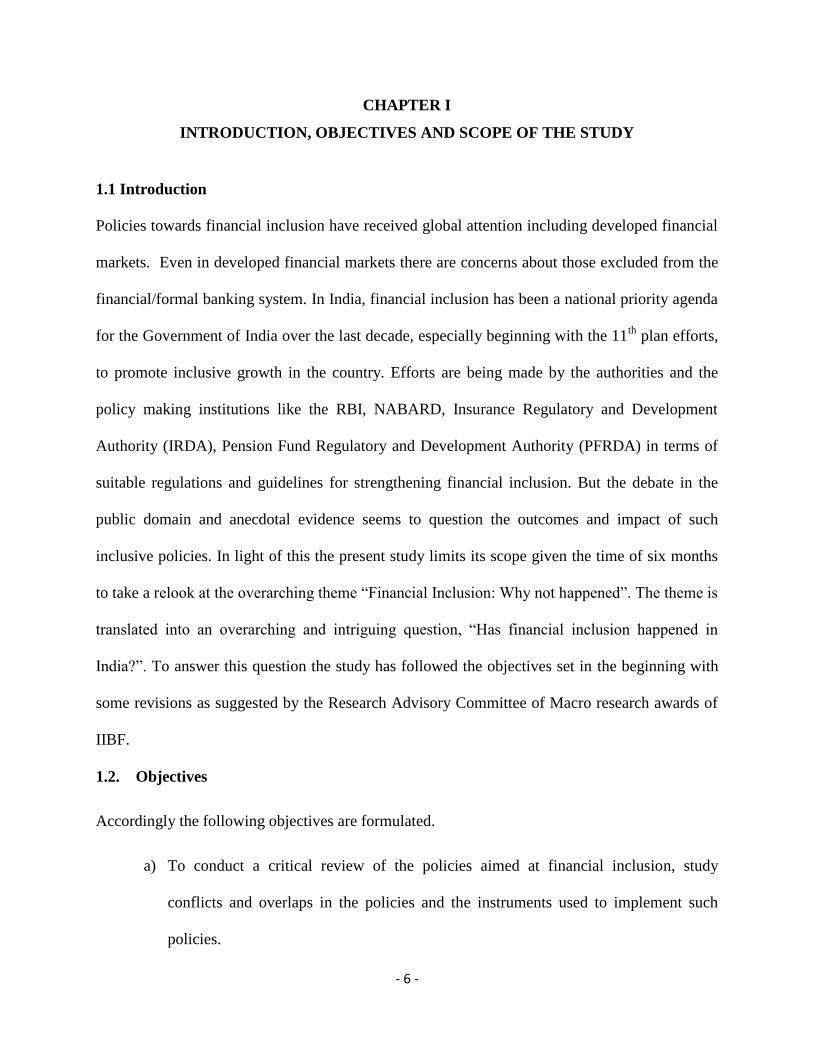
CHAPTER I
INTRODUCTION, OBJECTIVES AND SCOPE OF THE STUDY
1.1 Introduction
Policies towards financial inclusion have received global attention including developed financial
markets. Even in developed financial markets there are concerns about those excluded from the
financial/formal banking system. In India, financial inclusion has been a national priority agenda
for the Government of India over the last decade, especially beginning with the 11th
plan efforts,
to promote inclusive growth in the country. Efforts are being made by the authorities and the
policy making institutions like the RBI, NABARD, Insurance Regulatory and Development
Authority (IRDA), Pension Fund Regulatory and Development Authority (PFRDA) in terms of
suitable regulations and guidelines for strengthening financial inclusion. But the debate in the
public domain and anecdotal evidence seems to question the outcomes and impact of such
inclusive policies. In light of this the present study limits its scope given the time of six months
to take a relook at the overarching theme “Financial Inclusion: Why not happened”. The theme is
translated into an overarching and intriguing question, “Has financial inclusion happened in
India?”. To answer this question the study has followed the objectives set in the beginning with
some revisions as suggested by the Research Advisory Committee of Macro research awards of
IIBF.
1.2. Objectives
Accordingly the following objectives are formulated.
a) To conduct a critical review of the policies aimed at financial inclusion, study
conflicts and overlaps in the policies and the instruments used to implement such
policies.

- 7 -
b) To empirically assess the state of financial inclusion by constructing financial
inclusion indices for thirty Indian states using data on self help group bank linkage
programme and micro finance institutions.
c) To examine the supply side constraints in achieving the goal of financial inclusion.
1.3. Data and Method
The study is conducted mostly based on the secondary data available from the various
sources at the national (RBI, NABARD, various committee reports, Ministry of Finance &
MOSPI) and international level (World Bank, DFID, UNDP). Relevant data on different
inclusion parameters are collected from the Handbook of Statistics on Indian Economy, 2013,
annual reports of the National Bank for Agriculture and Rural Development, (NABARD) state of
the sector reports on Microfinance, and the Bharat Microfinance report quick data 2012. An
annual data set for major Indian states on the SHG Bank Linkage programme and Micro finance
institutions are utilized for constructing a Financial Inclusion Index (FIIND) following
Sarma(2012). Data on number of SHGs having savings accounts, number of SHGs with loan
disbursements, SHG savings, SHG loans, number of MFIs and MFI loan outstanding are used for
available number of years i.e. 2007-08 to 2009-10, and 2011-12.
1.4. Organization of the Report
The rest of the report is divided into four chapters. In chapter II, a critical review of the
policy initiatives of Government, and other apex bodies and regulators such as: RBI, NABARD,
PFRDA & IRDA are presented. In Chapter III, a financial inclusion index (FIIND) is being
constructed on the basis of available secondary data for the period 2007-08 to 2011-12. To

- 8 -
address the supply side constraints, in Chapter IV, we have analyzed the supply side constraints
based on the SHG-Bank linkage programme and the fluctuating non-performing assets (NPA) of
the banks from the SHG portfolio. In this chapter, results of two case studies relating to mobile
based money remittances and preference of individuals for informal sources of borrowing are
also presented to understand the supply side issues towards financial inclusion.
*****

- 9 -
CHAPTER II
FINANCIAL INCLUSION IN INDIA:
A CRITICAL REVIEW OF POLICY INITIATIVES & OUTCOMES
2.1 Introduction
In this chapter an attempt is made to review the spectrum of policy initiatives aimed at financial
inclusion and their outcomes. The review covers: (i) conceptual framework of financial
inclusion, (ii) extent of financial inclusion in India and a comparison with the global scenario,
(iii) approaches to financial inclusion - some international/national initiatives, (iv) initiatives
taken by Government and other regulators for inclusion, and (v) outcomes on the process of
inclusion.
2.2 Importance of Financial Inclusion
Poverty and exclusion continue to dominate socio-economic and political discourse in India as
they have done over the last six decades in the post-independence period. Poverty reduction has
been an important goal of development policy since the inception of planning in India. Various
anti-poverty, employment generation and basic services programmes have been in operation for
decades in India. The on-going reforms also attach a great importance to removal of poverty and
to addressing the wide variations across states and the rural-urban divide. Though the Indian
economy recorded impressive growth of 8.0% (average) in the last decade but its impact has
sadly not fully percolated to the lowest deciles. Despite being one of the ten fastest growing
economies of the world, India is still home to one-third of the world’s poor. So, in this context,
Financial Inclusion can help the society and the economy.

- 10 -
Financial Inclusion has the ability to generate positive externalities: it leads to increase in
savings, investment and thereby, spurs the processes of economic growth. It also provides a
platform for inculcating the habit of saving money, especially amongst the lower income
category that has been living under the constant shadow of financial duress, mainly because of
absence of savings, which makes them a vulnerable lot. Increase in the saving habits of the
households, enhance agricultural productivity by the way of formal credit and increase the living
standard of the people, which will promote inclusive growth in the country. This formal financial
network could unleash their creative capacities besides augmenting domestic demand on a
sustainable basis driven by income and consumption growth from such sectors.
These efforts do have multiplier effect on the economy as a whole through higher savings pooled
from the vast segment of the bottom of the pyramid (BoP) population by providing access to
formal savings arrangement resulting in expansion in credit and investment by banks. Deeper
engagements of the BoP/under-banked population in the economy through the formal financial
system could lead to improvement of their financial conditions and living standards, enabling
them to create financial assets, generate income and build resilience in terms of financial risk
protection to meet macro-economic and livelihood shocks. Government also immensely benefits
by way of efficient and leakage-proof transfer of vast amounts of welfare benefits to the targeted,
disadvantaged groups of population.
As we all know, Financial Inclusion has now been viewed as a remedy to plug gaps and leaks in
distribution of government benefits and subsidies through direct benefit transfers (DBT) to
beneficiaries’ bank accounts rather than through subsidizing products and making cash
payments. Thus, on the whole, Financial Inclusion has the potential to bring in the unbanked
- 11 -
masses into the formal banking system, channelize their savings, stoke their entrepreneurial
ambitions by making available credit and thus give a fillip to the economy.
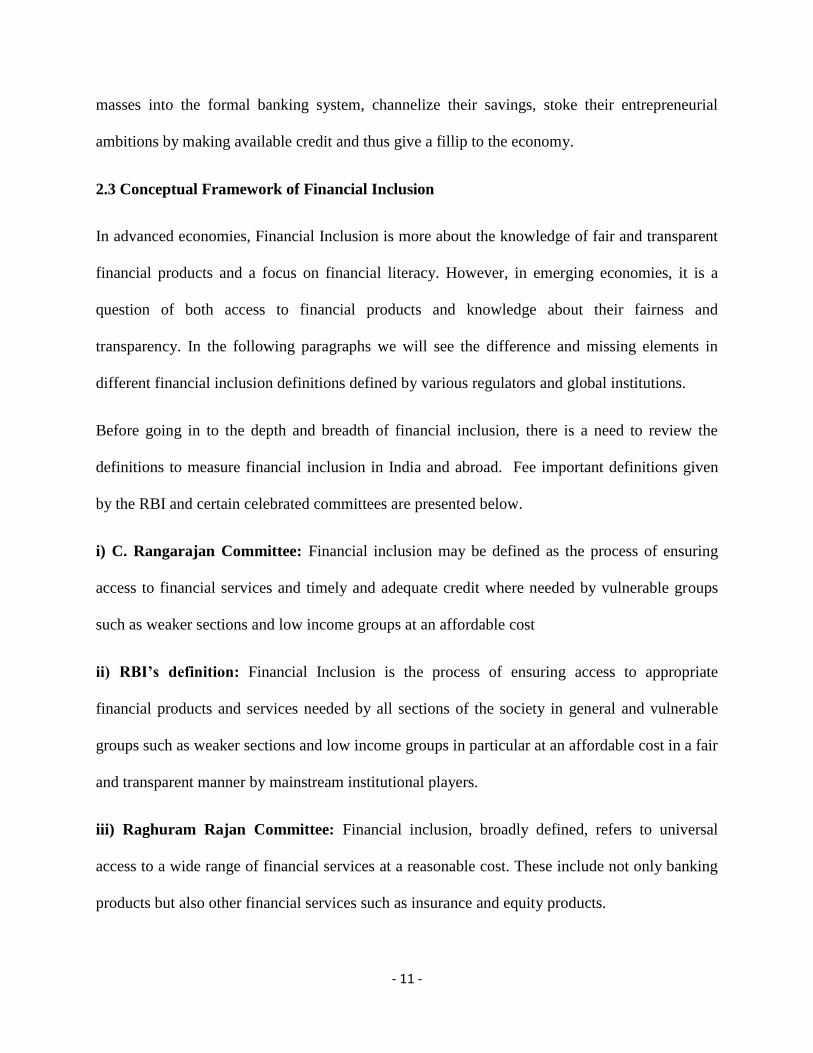
2.3 Conceptual Framework of Financial Inclusion
In advanced economies, Financial Inclusion is more about the knowledge of fair and transparent
financial products and a focus on financial literacy. However, in emerging economies, it is a
question of both access to financial products and knowledge about their fairness and
transparency. In the following paragraphs we will see the difference and missing elements in
different financial inclusion definitions defined by various regulators and global institutions.
Before going in to the depth and breadth of financial inclusion, there is a need to review the
definitions to measure financial inclusion in India and abroad. Fee important definitions given
by the RBI and certain celebrated committees are presented below.
i) C. Rangarajan Committee: Financial inclusion may be defined as the process of ensuring
access to financial services and timely and adequate credit where needed by vulnerable groups
such as weaker sections and low income groups at an affordable cost
ii) RBI’s definition: Financial Inclusion is the process of ensuring access to appropriate
financial products and services needed by all sections of the society in general and vulnerable
groups such as weaker sections and low income groups in particular at an affordable cost in a fair
and transparent manner by mainstream institutional players.
iii) Raghuram Rajan Committee: Financial inclusion, broadly defined, refers to universal
access to a wide range of financial services at a reasonable cost. These include not only banking
products but also other financial services such as insurance and equity products.
- 12 -
iv) CGAP: Financial Inclusion may be defined as the process of ensuring access to financial
services and adequate credit when needed by vulnerable group such as weaker section and low
income group at an affordable cost
v) G20: Financial Inclusion refers to a state in which all working age adults have effective access
to credit, savings, payment, and insurance from formal service providers. “Effective access”
involves convenient and responsible service delivery, at a cost affordable to the customer and
sustainable for the provider, with the result that financially excluded customers use formal
financial services rather than existing informal options
The above definitions mainly focused on: i) Access to an array of financial products and services
- credit, savings, insurance, payments, and remittances by all sections of society in general and
low income segments in particular, ii) provided by formal institutions and iv) in an affordable,
convenient and transparent manner. Though the definitions prima facie seem to have an
access/input focus, the outcomes can be judged from both supply and demand side factors. For
example the convenience and flexibility in availing of financial services by the underprivileged
relate to demand side issues and the ease of implementation of the inclusive policies by the
formal financial institutions relate to the supply side factors. The supply side factors often are
interfered with the service seeking behavior of the underprivileged/ vulnerable.
2.4 Financial inclusion - International Experiences
The importance of an inclusive financial system is widely recognized in the policy circles, not
only in India, but has become a policy priority in many countries. Several countries across the
globe now look at financial inclusion as the means of a more comprehensive growth, wherein

- 13 -
each citizen of the country is able to use their earning as a financial resource that they can put to
work to improve their future financial status, adding to the nation’s progress.
In advanced markets, it is mostly a demand side issue. Initiatives for financial inclusion have
come from the financial regulators, the governments and the banking industry. The banking
sector has taken a lead role in promoting financial inclusion. Legislative measures have been
initiated in some countries. For example, in the United States, the Community Reinvestment Act
(1997) requires banks to offer credit throughout their entire area of operation and prohibits them
from targeting only the rich neighborhood. In France, the law on exclusion (1998) emphasizes an
individual’s right to have a bank account. The German Bankers’ Association introduced a
voluntary code in 1996 providing for an “everyman” current banking account that facilitates
basic banking transactions. In South Africa, a low cost bank account called “Mzansi” was
launched for financially excluded people in 2004 by the South African Banking Association. In
the United Kingdom, a “Financial Inclusion Task Force” was constituted by the government in
2005 in order to monitor the development of financial inclusion. The “Principles for Innovative
Financial Inclusion” serve as a guide for policy and regulatory approaches with the objectives of
fostering safe and sound adoption of innovative, adequate, low-cost financial delivery models,
helping provide conditions for fair competition and a framework of incentives for the various
banks, insurance, and non-bank actors involved and delivery of the full range of affordable and
quality financial services. The extent of financial exclusion in India is found to be higher as
compared with many developed and some of the major emerging economies. The wide extent of
financial exclusion in India is visible in the form of high population per bank branch and low
proportion of the population having access to basic financial services like savings accounts,
credit facilities, credit and debit cards.

- 14 -
Financial Inclusion Initiatives in Different Countries
Country Legislation instrument /
Policy Scheme
Objectives
United
Kingdom
Social Exclusion Unit
(SEU), 1997
To reduce social exclusion of which financial
inclusion is an integral part.
Policy Action
Teams (PATs)
To look in an integrated way at the problems of
poor Neighbourhoods.
Financial Inclusion
Task Force
Access to banking, access to affordable credit.
Access to face-to-face money advice.
Financial Inclusion
Fund
Access to banking services.
Access to affordable credit.
Access to money advice.
USA The Community
Reinvestment Act,
1977
Prohibits discrimination by banks against low and
moderate income neighbourhoods.
To make mortgage loans to lower-income
households.
Banks are rated every three years on their efforts
in meeting community credit needs.
Matched Savings
Scheme (MSS) 1997
Prohibits discrimination by banks against low and
moderate income neighbourhoods.
Matching money has to be spent on one of a range
of
Prescribed uses such as education, business or
home purchase.
France Banking Act, 1984 Any person with French nationality has the right
to open an account with any bank.
If refused the aggrieved person can apply to the
Banque de France to designate a bank that should
open an account.
French Banker’s
Association (Basic
Banking Service
Charter of 1992)
Committed to providing; Affordable account,
Cash Card, Free access to a cash machine,
Distance payment facilities, Bank Statement and
Negotiable number of cheques.
Australia
Australian Bankers
Association (ABA)
Code of Practice,
1995
Generic Account was introduced in 2002.
Staff to give information about suitable accounts
to low income Customers.
Face-to-face banking services even after branch
closure through alternative means such as
franchising.
Three months written notice to customers before
closing any Branch.

- 15 -
Source: World Bank (2009)
Rural Transformation
Centre Programme
(RTCP)
To provide banking and other transaction services
to communities without banking facilities.
Using existing stores and post offices or stand-
alone centres.
Install Electric Point of Sale (EPOS) equipment in
post offices.
Belgium Charter of Basic
Banking Services, 1996
Provide a basic bank account with no minimum
balance and without overdraft facilities.
Credit transfers, direct debits, and deposit and
withdrawal Facilities.
If refused, customer must be informed the reasons,
i.e., laundering, bad credit history, etc.
Basic Banking Act,
2003
Sanctions if principles of Charter on Basic
Banking Services, 1996 are not applied.
Canada Access to Basic
Banking Services
Regulations, 2003
Personal bank accounts to all Canadians
regardless of employment or credit history and
with minimum identification requirements.
Banks/FIs to encash government cheques at no
charge.
Table 2.1: Financial Inclusion: Cross Country Comparison
Country
Number of
Branches
Number of
ATMs Bank credit Bank deposits
(per 0.1 million adults) (as per cent of GDP)
India 10.64 8.90 51.75 68.43
Austria 29.61 166.92 128.75 107.10
Brazil 46.15 119.63 40.28 53.26
France 41.58 109.8 42.85 34.77
Mexico 14.86 45.77 18.81 22.65
United States 35.43 … 46.83 57.78
Korea 18.80 … 90.65 80.82
Philippines 8.07 17.70 21.39 41.93
Afghanistan 2.25 0.5 11.95 21.4
Source: World Bank, Financial Access Survey
- 16 -
These statistics, staggering as they are, do not convey the true extent of financial exclusion. Even
where bank accounts are claimed to have been opened, verification has shown that these
accounts are dormant. Few conduct any banking transactions and even fewer receive any credit.
Millions of people across the country are thereby denied the opportunity to harness their earning
capacity and entrepreneurial talent, and are subjected to marginalization and poverty.
2.5 Extent of Financial Exclusion in India
In India, we don’t have any single measure of inclusion as of today. However, a number of
committees, some institutions and some individual researchers have estimated the inclusion level
in different ways including some indices. Though, the recommendations of these committees are
not unified but they throw some light on financial inclusion in India. In the following, we will
broadly summarize some of the findings such as:
The Rangarajan Committee (2008) had estimated that around 41% of the population in the
country are unbanked, 61% in rural areas and 40% in urban areas. Out of the 6 lakh villages in
the country, only about 10% have a commercial bank branch. The proportion of people having
any kind of life insurance cover was is as low as 10% and proportion having non-life insurance is
an abysmally low 0.6%. People having debit cards comprise only 13% and those having credit
cards only 2%.
NSSO data reveal that 45.9 million farmer households in the country (51.4%), out of a total of
89.3 million households do not have access to credit, either from institutional or non-institutional
sources. Further, despite the vast network of bank branches, only 27% of total farm households
are indebted to formal sources (of which one-third also borrow from informal sources). Farm
households not accessing credit from formal sources as a proportion of total farm households is

- 17 -
especially high at 95.91%, 81.26% and 77.59% in the North Eastern, Eastern and Central
Regions respectively. Thus, apart from the fact that exclusion in general is large, it also varies
widely across regions, social groups and asset holdings. The poorer the group, the greater is the
exclusion.
According to the financial inclusion survey (2003), there are a large number of households (145
million) excluded from banking system and around 50% of the population do not have bank
account. Only 34% of the population are engaged in formal banking. Out of the 6 lakh villages
only, 30,000 villages have commercial bank branch. Insurance penetration is also at a low level
as 10% have life insurance cover and just 9.6% have any non-life insurance.
The recent census of India (2011) stated that financial inclusion in a country like ours with large
population and geographical spread is, indeed, challenging. The data released indicates that only
58.7% of households in India avail of banking services with the figure being 54.4% for rural
areas and 67.8% for urban areas.
The extent of financial exclusion in India is found to be higher as compared with many
developed and some of the major emerging economies. The wide extent of financial exclusion in
India is visible in the form of high population per bank branch and low proportion of the
population having access to basic financial services like savings accounts, credit facilities, credit
and debit cards. In the following table, the widely quoted indicators of financial inclusion are
presented to see the time-series progress of inclusion in the country over time.

- 18 -
In the last ten years, due to different financial inclusion drive by banks and opening of branches
in large number of unbanked places, the population per bank branch improved from 14,000 in
2009-10 to 12,000 in 2012-13, while population per ATM from 19,700 to 11,003 during the
same period, showing significant improvement in access to banking services. However, banking
has still not reached a large section of the population despite a strong and wide branch network
of 1,00,000 plus bank branches spread across the length and breadth of the country.
1969 1980 1991 2000 2010 2011 2012 2013
No of Commercial Banks 89 154 272 298 169 169 173 157
No of Bank Offices (include admin offices) 8262 34594 60570 67868 88203 94019 101261 104647
of which Rural & Semi-Urban bank offices 5172 23227 46550 47693 53551 57167 62061 66273
Number of Branches 8,262 32419 60,220 65412 88441 93799 99,884 -
Number of ATMs - - - - 60,153 74,505 95,686 -
Population per Branch 63800 19137 14054 15515 14,000 13,466 12,921 12,000
Population per ATM - - - - 19,700 16,243 11,236 -
People having Deposit Accounts (%) - - - - 55.80 61.20 74.6 -
People having Credit Accounts (%) - - - - 9.30 9.90 10.8 -
People having Credit Cards (%) - - - - 1.53 1.49 1.5 -
People having Debit Cards (%) - - - - 15.20 18.80 22.9 -
Credit-GDP Ratio (%) 8.6 17.6 20.4 22.3 50.2 51.4 52.1 52.4
Credit-Deposit (%) 78.3 67.8 60.4 53.6 72.2 75.7 78.0 78.1
Deposits (% of National Income) 16 36 48 54 69 67 66 67
Per capita Deposits (Rs.) 88 738 2368 8542 38062 43034 48732 55780
Per capita Credit (Rs.) 68 457 1434 4555 27489 32574 38033 43468
Priority Sector Advances (%) 15 37 39 35 35.6 34.5 32.9 31.6
Branches per 1000 Square km -- -- -- 21.9 25.49 26 30.4 -
Insurance Coverage (%) -- 0.8 0.9 2.3 5.2 5.1 4.1 -
Pension Coverage (%) 12 13 ---
Table 2.2: Indicators Financial Inclusion
Source: Reserve Bank of India

- 19 -
Chart 1: Branch Network: Population Group-Wise
Source: RBI
2.5.1 Priority Sector Lending
The priority sector comprises a vast section of the population in sectors such as agriculture,
micro and small enterprises (MSEs), education and housing. RBI has mandated a target for
priority sector advances at 40% of the Adjusted Net Bank Credit (ANBC) or credit equivalent of
off-balance sheet exposure (OBE), whichever is higher. But, if you will go by figure, banks are
not able to achieve the set target over the years. There are a number of reasons, may be due to
higher risk of deteriorating asset quality, higher cost of deploying funds.
As on March 31, 2013 domestic banks (both public and private) were below the target of priority
sector lending. During this period, 16 of the 26 public sector banks, 10 of the 20 private sector
banks and 2 of the 41 foreign banks could not achieve the target of overall priority sector
lending.
- 20 -
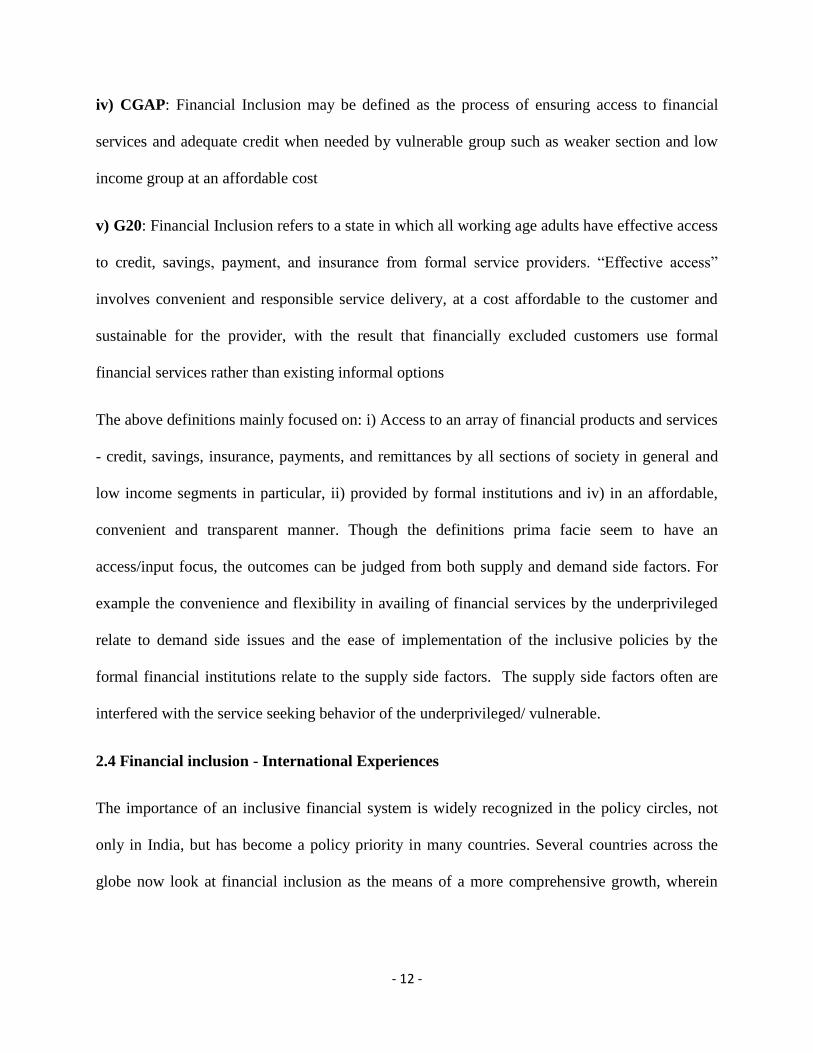
Chart 2: Share of Priority (% NF Credit)
Source: RBI Data Base
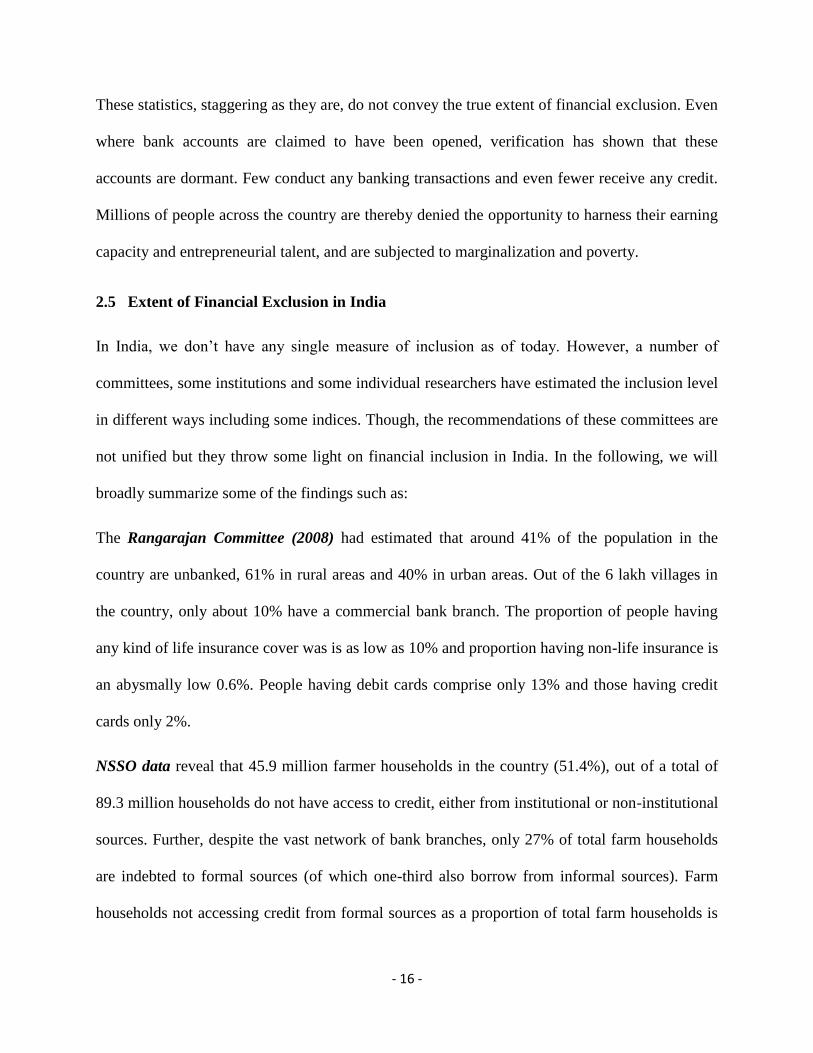
2.5.2 Flow of credit to the Agriculture Sector
Over the years, the share of agricultural credit in total non-food credit is declining. In 1989-90, it
was 20.9% but afterwards declined to 12.1% in March 2013. The following chart depicts the
share of agricultural credit (both direct & indirect) in total non-food credit over the years.
Chart 3: Share of Agri.-Credit (% NF Credit)
Source: RBI Data Base

- 21 -
A target of Rs. 5,750 billion for agriculture credit during the year 2012-13 was fixed by the
Government. Against this target, banks, including co-operative banks and RRBs, disbursed Rs
6,073.75 billion, which formed 105.6% of the target as at the end of March 2013.
2.6 Importance of Financial literacy and Financial Education
There are a number of reasons for exclusion. In remote, hilly and sparsely populated areas with
poor infrastructure, physical access hinders inclusion efforts. From the demand side, lack of
awareness, low incomes/assets, social exclusion, and illiteracy mainly stand as barriers. Among
the supply side factors distance from branch, branch timings, complicated documentation and
procedures, unsuitable products, language, staff attitudes are common reasons for exclusion. All
these result in higher transaction cost apart from procedural hassles. On the other hand, the ease
of availability of informal credit sources drive people away from formal institutions. The
requirements of independent documentary proof of identity and address can be a very important
barrier in having a bank account especially for migrants and slum dwellers.
Problem of Access to Formal Institutions
Distance continues to be a major issue, though BCs have started to provide succor in
certain regions.
Navigating the Procedures remains a challenge;
Lack of knowledge (institutional as well as user level);
Insufficient infrastructure leading to long hours of waiting, if banks are accessible;
Lack of customized products and services. In contrast informal and quasi-legal entities
win on this count.
Human resources of formal financial institutions unequipped to deal with challenges of
FI.

- 22 -
There are may be a number of solutions to this problem but literacy and awareness is vital one
among the all. Financial Inclusion and Financial Literacy are twin pillars: i) Financial Literacy
stimulates more of the demand side , making people aware of what they can demand and ii)
financial Inclusion acts more from supply side providing the required financial market/services
Issues in Financial Literacy in India
A large population of alphabetically illiterate population - requiring basic financial
knowledge
A large section of financially excluded population- need to be told of benefits of
financial inclusion and also to be provided
A large growing segment of educated middle class-requiring financial education
A growing capital market with increasing retail participation-requiring financial
education and consumer protection
A growing insurance market with participation of private players - need consumer
protection and financial education
A large section of workers having no pension
A move from Defined Benefit Pension Schemes to Defined Contribution Pension
Schemes
Hence, a large workforce need to be told about riskiness of various investment
portfolios
- 23 -
OECD defines Financial Literacy as a combination of financial awareness, knowledge, skills,
attitude and behaviour necessary to make sound financial decisions and ultimately achieve
individual financial well being. Financial literacy can be achieved through a process of financial
education. Financial education is defined by OECD as “the process by which
financial consumers/investors improve their understanding of financial products, concepts and
risks and, through information, instruction and/or objective advice, develop the skills and
confidence to become more aware of financial risks and opportunities, to make informed
choices, to know where to go for help, and to take other effective actions to improve their
financial well-being”.
The Reserve Bank of India defines financial literacy or financial education as “providing
familiarity with and understanding of financial market products, especially rewards and risks, in
order to make informed choices. Viewed from this standpoint, financial education primarily
relates to personal finance to enable individuals to take effective action to improve overall well-
being and avoid distress in matters that are financial”. To increase the literacy and awareness
level, the RBI and the Government have taken a number of initiatives and the effects may
materialize in the long run. Some of the initiatives are as the following:
RBI has undertaken a project titled ‘Project Financial Literacy’ with the objective of
disseminating information regarding the central bank and general banking concepts to
various target groups including school and college going children, women, rural and urban
poor, defence personnel and senior citizens.
A multilingual website in 13 Indian languages on all matters concerning banking and the
common person has been launched by RBI. Illustrated books have been prepared for the
different target groups and are widely distributed in regional languages.

- 24 -
Financial literacy programmes are being launched in each State with the active involvement
of the State Government and the State Level Bankers Committees. These programmes
include skits, road shows, exhibitions, workshops, seminars, and dissemination through radio
and television.
Financial education stresses on capacity building measures to enable small and marginal
borrowers to avail of the entire suite of financial products and services i.e., savings,
remittance, insurance and pension from the banking sector, in addition to credit. In view of
the utility of these centers banks have been asked to set up Financial Literacy and Credit
Counseling Centers (FLCCs) in all districts. So far, over 658 FLCCs have been set up in
various States in the country.
There are other specific initiatives by numerous financial service providers in the micro
segment. The State level rural livelihood missions have prepared modules on financial
literacy in vernacular languages. For example the Sanchayan society Delhi is working on a
complete financial literacy programme where financial literacy is defined as “the ability to
understand finance and financial services. Financial literacy is a life-long process of learning
and knowledge enhancement”. The society works on literacy relating to saving, credit,
remittance, pension, and personal financial management.
2.7 Process of Financial Inclusion in India
The origins of the present financial inclusion can be traced to the United Nations initiatives,
which broadly described the main goals of inclusive finance as access to a range of financial
services including savings, credit, insurance, remittance and other banking / payment services to
all ‘bankable’ households and enterprises at a reasonable cost. The Report of the Centre for

- 25 -
Global Development (CGD) Task Force on Access to Financial Services (October, 2009) has
laid down the broad policy principles for expanding financial access, including institutional
mechanisms, with particular emphasis on the need for ensuring data collection, monitoring and
evaluation. The G20 Toronto Summit (June, 2010) had outlined the “Principles for Innovative
Financial Inclusion”, which serves as a guide for policy and regulatory approaches aimed at
fostering safe and sound adoption of innovative, adequate, low-cost financial delivery models,
helping provide conditions for fair competition and a framework of incentives for the various
bank, insurance, and non-bank actors involved in the delivery of a full range of affordable and
quality financial services.
In India also, financial inclusion has been a national priority agenda for the Government of India
over the last decade. The Committee on Financial Inclusion headed by Dr C Rangrajan (2008)
has observed that financial inclusion must be taken up in a mission mode and suggested a
National Mission on Financial Inclusion (NMFI) comprising representation of all stakeholders
for suggesting the overall policy changes required, and supporting stakeholders in the domain of
public, private and NGO sectors in undertaking promotional initiatives. The eleventh Five Year
Plan (2007-12) envisioned inclusive growth as a key objective. Achieving inclusive growth in
India is the biggest challenge as it is very difficult to bring 600 million people living in rural
India into the mainstream.
Efforts are being made by the authorities and the policy making institutions like Government of
India, RBI, IRDA (micro-insurance), PFRDA (for micro-pensions), have developed regulations
and guidelines for strengthening financial inclusion but these are yet to have a substantial impact
on outreach to the excluded population. Measuring insurance, remittances and pension inclusions
as part financial inclusion still remains as an issue to be attempted and resolved. It appears that

- 26 -
while some effort has been made to develop a facilitating regulatory framework, it has not yet
gone far enough to overcome the substantial cost implications of an outreach to large number of
people, often in dispersed locations, with small value accounts. As a result, the institutions
responsible for providing financial services do not yet perceive the financial inclusion business
as really sustainable.
In India, we have adopted a bank-led model for financial inclusion, but have permitted non-bank
entities to partner banks in their FI initiatives.
2.8 Financial Inclusion: National Initiatives
The history of financial inclusion in India is actually much older than the formal adoption of the
objective as outlined above. The RBI and government play an important role in promoting
financial inclusion for economic growth to increase the banking penetration in the country.
Before the 1990s several initiatives were undertaken which included creation of State Bank of
India in 1955; nationalization of commercial banks in 1969 and 1980. Initiating the Lead Bank
Scheme in 1970 was a big step to expand financial inclusion. Among other steps one finds
priority sector lending norms, branch licensing norms with focus on rural and semi urban
branches. The National Bank for Agriculture and Rural Development (NABARD) was set up in
1982 mainly to provide refinance to the banks extending credit to agriculture. Establishment of
regional rural banks (RRBs) in 1975 was also one of the major steps for encouraging branch
expansion in rural areas.
Incorporation of Regional Rural banks (RRBs), Service Area Approach and formation of Self-
Help Groups - all these were major initiatives taken by the Government of India that aimed at
taking banking services to the masses. The nexus between economic growth, financial deepening

- 27 -
and financial inclusion has been well recognized in India’s development strategy, particularly
since the reforms from the early 1990’s, when the financial and economic reforms processes
were initiated.
However, a more focused and structured approach towards financial inclusion has been, in effect,
followed since the year 2005, when the RBI decided to implement policies to promote financial
inclusion and urged the banking system to focus on this goal. The 11th Five Year Plan (2007-12)
of the Government of India has further emphasized the initiatives on financial inclusion with its
greater focus in ‘inclusive growth’. Recent policy initiatives to drive financial inclusion,
including formulation of a board approved Financial Inclusion Policy (FIP) by the banks thereby
attempting to strike a balance between the requirements of financial inclusion and that of
soundness of financial institutions and stability of the financial system (RBI, 2012). These
initiatives have paid off in terms of a network of branches across the country. The brick and
mortar infrastructure expanded; the number of bank branches multiplied ten-fold – from 8,000+
in 1969, when the first set of banks were nationalized, to 100,000+ today. Despite this wide
network of bank branches spread across the length and breadth of the country, banking has still
not reached a large section of the population.
2.8.1 RBI's Policy Initiatives to foster Financial Inclusion
In India, RBI has initiated several measures to achieve greater financial inclusions, such as
facilitating no-frills accounts and General Credit Cards (GCC) for small deposits and credit.
Some of the supporting policy initiatives are:

- 28 -
I) REACH
a) Branch Expansion in Rural Areas: Branch authorization has been relaxed to the extent that
banks do not require prior permission to open branches in centres with population less than 1
lakh, which is subject to reporting. To further step up the opening of branches in rural areas,
banks have been mandated to open at least 25% of their new branches in unbanked rural
centres. Of the total 6,317 new branches opened during 2012-13, almost 65% were located in
rural and semi-urban areas. Banking connectivity has been extended to 268,454 villages up to
March 2013 from 67,694 villages in March 2010. A total of 7407 rural branches have been
opened during the period 2010 to 2013.
In the Annual Policy Statement for 2013-14, banks have been advised to consider
frontloading (prioritizing) the opening of branches in unbanked rural centres over a three
year cycle co-terminus with their FIPs. This is expected to facilitate the branch expansion in
unbanked rural centres.
b) Agent Banking - Business Correspondent/ Business Facilitator Model: In January 2006,
the Reserve Bank permitted banks to utilize the services of intermediaries in providing
banking services through the use of business facilitators and business correspondents. The
BC model allows banks to do ‘cash in - cash out’ transactions at a location much closer to the
rural population, thus addressing the last mile problem.
In January, 2006, RBI permitted banks to engage business facilitators (BFs) and BCs as
intermediaries for providing financial and banking services. The BC model allows banks
to provide doorstep delivery of services, especially cash in-cash out transactions, thus
addressing the last-mile problem.

- 29 -
To ensure increased banking penetration and control over operations of BCs, banks have
been advised to establish low cost branches in the form of intermediate brick and mortar
structures in rural centres between the present base branch and BC locations, so as to
provide support to a cluster of BCs (about 8-10 BCs) at a reasonable distance of about 3-
4 kilometers.
II) ACCESS
a) Relaxed KYC norms: KYC requirements for opening bank accounts were relaxed for small
accounts in August, 2005; and thereby simplifying procedures by stipulating that introduction
by an account holder who has been subjected to the full KYC drill would suffice for opening
such accounts.
RBI has allowed ‘Aadhaar’ to be used as one of the eligible documents for meeting the KYC
requirement for opening a bank account.
b) Roadmap for Banking Services in Unbanked Villages
In 1st phase, banks were advised to draw up a roadmap for providing banking services in
every village having a population of over 2,000 by March 2010. Banks have successfully met
this target (74,144 villages) and have covered 74398 unbanked villages. (99.7%
achievement)
In 2nd
phase, Roadmap has been prepared for covering remaining unbanked villages i.e. with
population less than 2000 in a time bound manner. About 4,90,000 unbanked villages with
less than 2000 population across the country have been identified and allotted to various
banks. The idea behind allocating villages to banks was to ensure availability of at least one
banking outlet in each village.

- 30 -
Further, Dr. Raghuram Rajan, Governor, RBI gave more stress on financial inclusion on his
statement on 04 September 2013. He asked Dr Nachiket Mor to head a committee on
financial inclusion, to review the approach and suggest the way forward to the development
mission of the RBI.
III. PRODUCT
a) Bouquet of Financial services: In order to ensure that all the financial needs of the
customers are met, RBI have advised banks to offer a minimum of four basic products, on as
Basic Banking Account (previously known as no-frill account): i) a savings cum overdraft
account, ii) a pure savings account, ideally a recurring or variable recurring deposit, iii) a
remittance product to facilitate EBT and other remittances, and iv) entrepreneurial credit
products like a General Purpose Credit Card (GCC) or a Kisan Credit Card (KCC)
IV. TRANSACTIONS
Use of Technology: Recognizing that technology has the potential to address the issues of
outreach and credit delivery in rural and remote areas in a viable manner, banks have been
advised to make effective use of information and communication technology (ICT), to
provide doorstep banking services through the Business Communication (BC) model where
the accounts can be operated by even illiterate customers by using biometrics, thus ensuring
the security of transactions and enhancing confidence in the banking system.
Direct Benefit Transfer (DBT): The recent introduction of direct benefit transfer,
leveraging the Aadhaar platform, will help facilitate delivery of social welfare benefits by
direct credit to the bank accounts of beneficiaries. The government, in future, has plans to
route all social security payments through the banking network, using the Aadhaar based
platform as a unique identifier of beneficiaries. In order to ensure smooth roll out of the
- 31 -
Government’s Direct Benefit Transfer (DBT) initiative, banks have been advised to: i) open
accounts of all eligible individuals in camp mode with the support of local Government
authorities, ii) seed the existing and new accounts with Aadhaar numbers and iii) put in place
an effective mechanism to monitor and review the progress in implementation of DBT.
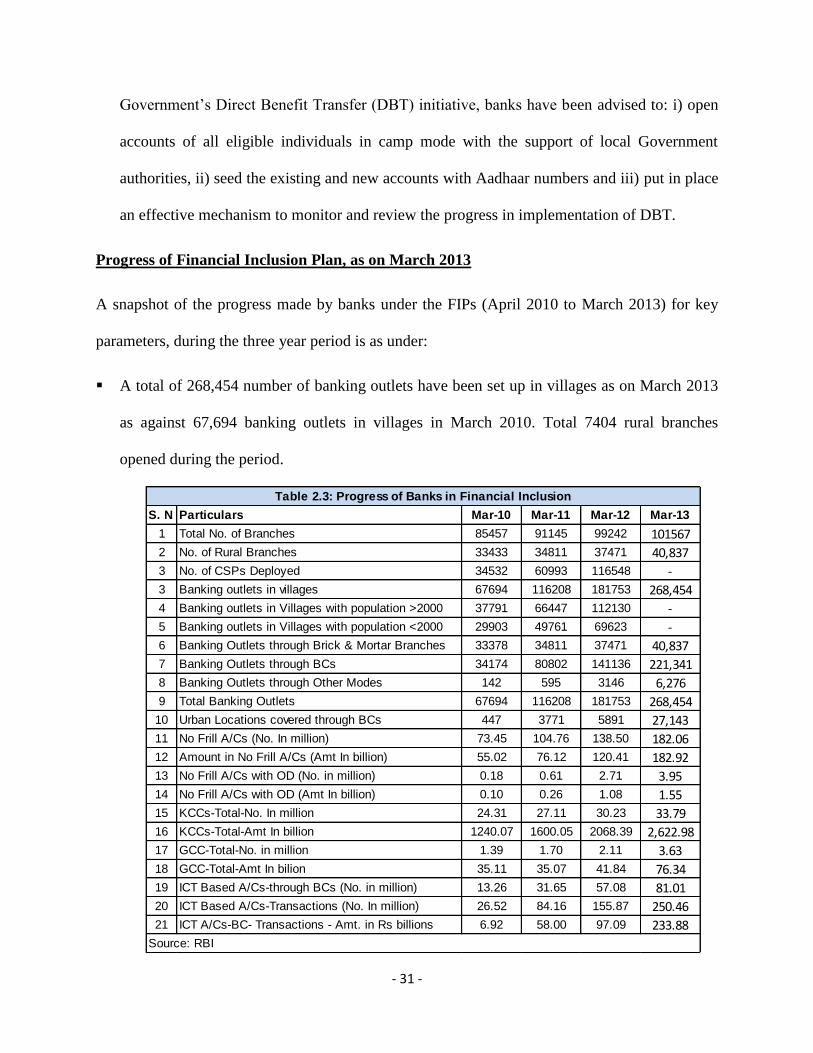
Progress of Financial Inclusion Plan, as on March 2013
A snapshot of the progress made by banks under the FIPs (April 2010 to March 2013) for key
parameters, during the three year period is as under:
A total of 268,454 number of banking outlets have been set up in villages as on March 2013
as against 67,694 banking outlets in villages in March 2010. Total 7404 rural branches
opened during the period.
S. N Particulars Mar-10 Mar-11 Mar-12 Mar-13
1 Total No. of Branches 85457 91145 99242 101567
2 No. of Rural Branches 33433 34811 37471 40,837
3 No. of CSPs Deployed 34532 60993 116548 -
3 Banking outlets in villages 67694 116208 181753 268,454
4 Banking outlets in Villages with population >2000 37791 66447 112130 -
5 Banking outlets in Villages with population <2000 29903 49761 69623 -
6 Banking Outlets through Brick & Mortar Branches 33378 34811 37471 40,837
7 Banking Outlets through BCs 34174 80802 141136 221,341
8 Banking Outlets through Other Modes 142 595 3146 6,276
9 Total Banking Outlets 67694 116208 181753 268,454
10 Urban Locations covered through BCs 447 3771 5891 27,143
11 No Frill A/Cs (No. In million) 73.45 104.76 138.50 182.06
12 Amount in No Frill A/Cs (Amt In billion) 55.02 76.12 120.41 182.92
13 No Frill A/Cs with OD (No. in million) 0.18 0.61 2.71 3.95
14 No Frill A/Cs with OD (Amt In billion) 0.10 0.26 1.08 1.55
15 KCCs-Total-No. In million 24.31 27.11 30.23 33.79
16 KCCs-Total-Amt In billion 1240.07 1600.05 2068.39 2,622.98
17 GCC-Total-No. in million 1.39 1.70 2.11 3.63
18 GCC-Total-Amt In bilion 35.11 35.07 41.84 76.34
19 ICT Based A/Cs-through BCs (No. in million) 13.26 31.65 57.08 81.01
20 ICT Based A/Cs-Transactions (No. In million) 26.52 84.16 155.87 250.46
21 ICT A/Cs-BC- Transactions - Amt. in Rs billions 6.92 58.00 97.09 233.88
Table 2.3: Progress of Banks in Financial Inclusion
Source: RBI

- 32 -
Nearly 109 million Basic Savings Bank Deposit Accounts (BSBDAs) have been added,
taking the total no. of BSBDAs to 182 million. Share of ICT based accounts have increased
substantially, percentage of ICT accounts to total BSBDAs has increased from 25% in March
2010 to 45% in March 2013.
Banks provide small over drafts (ODs) in such accounts. Up to June 2012, banks had
provided 9.34 lakh ODs amounting to Rs.37.42 crore against 1.31 lakh and Rs 8.34 crore
respectively in March 2012.
Banks have also introduced a General Purpose Credit Card (GCC) facility up to Rs. 25,000/-
at their rural and semi-urban braches. The credit facility is in the nature of revolving credit
entitling the holder to withdraw up to the limit sanctioned. Based on assessment of household
cash flows, the limits are sanctioned without insistence on security. Interest rate on the
facility is completely deregulated. As on March 2013, banks had provided credit aggregating
Rs. 76 billion to 3 million GCC accounts.
Kisan Credit Cards to small farmers have been issued by banks. As on March 2013, the total
number of KCCs issued was as 33 million with total amount outstanding to the tune of 2633
billion.
It is important to analyze this progress against the some disturbing trends that were noticed in the
run up to the structured Financial Inclusion initiatives that the banks launched since 2010
onwards. First, the number of banked centres in the country between 1991 and 2007 had actually
come down from 35,236 to 34,471. Second, the number of rural branches during the same period
had also declined significantly from 35206 to 30409 (refer chart 1). Against this backdrop, the
progress made during 2010-13 is certainly remarkable in figures.

- 33 -
2.8.2 Initiation of Financial Inclusion by NABARD
After the 1990s some important steps have been taken for the financially excluded people as
launching Self-help groups linkage programmes in 1992 by NABARD. Simplifications of Know
your customer (KYC) norms is another milestone. In 1998, Kisan Credit Card has been launched
and on the suggestion of NABARD in 2005 General credit card has been launched which facility
up to Rs 25000. In January 2006 NGOs, SHGs, and Microfinance Institutions were permitted by
RBI. Now MFIs currently cover 8.3 million borrowers. MFIs, Self-help groups (SHGs) also meet
the financial service requirements of the poorer segments.
The SHG-Bank Linkage Programme and other Microfinance initiatives by NABARD has
contributed a lot towards financial inclusion process in India. The SHG-Bank Linkage
Programme and Microfinance Institutions (MFI)-Bank Linkage Programme have been accepted
as effective tools to inclusive growth for extending various financial services to hitherto
excluded categories of poor and rural households. As on March 31, 2012, there were more than
7.96 million savings linked SHG and more than 1.15 million credit linked SHG with covering
with savings amount of RS 65.5 billion. The phenomenal outreach of the programme has enabled
Table 2.4: Progress of SHG bank linkage programme (numbers in millions)
Particulars 2009-10 2010-11 2011-12
Total number of SHGs savings linked with banks 6.95 7.46 7.96
Total savings amount of SHGs with banks (Rs bn) 61.98 70.16 65.51
Total number of SHG credit linked during the year 1.58 1.19 1.15
Total amount of loans disbursed to SHGs during the year 144.53 145.47 165.34
Total number of SHGs having loans outstanding 4.85 4.78 4.35
Total amount of loans outstanding against SHGs 280.38 312.21 363.40
Estimated number of families covered 97.00 97.00 103.00
Source: Status of Micro Finance in India, NABARD

- 34 -
an estimated 103 million families to gain access to microfinance from the formal banking system
as may be seen in the following table.
NABARD has revised the guidelines, for SHG model, popularly known as SHG2 (version 2),
which addressed some of the shortcoming of the earlier version. The major features of SHG2
area) more focus on voluntary savings, b) cash credit system of lending over three to five years
cycle to minimize the problem of inadequate finance and non-availability of repeat loans, c)
enabling creation of Joint Liability Groups (JLGs) within SHGs to scale up economic activities
by more entrepreneurial members of the group, d) improving risk mitigation systems by bringing
in third party audit, e) building second tier institutions, f) strengthening the self-monitoring
mechanism) meeting the training/capacity building requirements of the SHGs.
ITC’s e-Choupal infrastructure, with a mission to strength the Farm Sector Development through
Public-Private partnership, enables even small and marginal farmers, who have no access to the
formal market, to receive relevant knowledge and agricultural extension services. This enables
real-time price discovery and improvement in farm productivity and quality, making them more
competitive in the national and global market. Presently, ITC has 6,500 e-Choupals covering
40,000 villages and over 4 million farmers. By 2013, the e-Choupal network is expected to cover
over 100,000 villages, representing one-sixth of rural India, and create more than 10 million e-
farmers. On the other hand, the farmers Club programme promoted by NABARD and
implemented by banks, aims to organize farmers to facilitate accessing of credit, extension
services, farm technology and markets. While ITC is planning to upscale the e-Choupal
initiative, the possibility of collaborating with ITC to provide such infrastructure to about 77,000
Farmers Clubs, could be explored. The synergy from such collaboration could result in
sustainable financial inclusion (Chkrabarthy, 2012a).

- 35 -
2.8.3 Micro insurance, IRDA and Financial Inclusion
In India, insurance penetration is at very low level, 4.1% for life and 0.7 for non-life, which is
not comparable to any developed or developing countries like US, UK, China and Brazil. It is
estimated that about 290 million people who are in proximity to the BPL mark are totally devoid
of any insurance. So, India needs to travel a long way for better insurance inclusion.
In order to provide a hedge against these unforeseen risks, micro insurance is widely accepted as
one of the essential ingredients of financial inclusion packages. Micro-insurance is usually
understood to be the provision of an array of insurance services for low-income households with
low premium and low sum assured. Churchill (2006) is of the view that micro-insurance
operates by risk-pooling, financed through regular premiums and is tailored to the poor who
would otherwise not be able to buy insurance. A recent study by the CGAP (2009) estimates the
Indian micro insurance market to have some 14 million adults covered by life micro-insurance in
India. In a country with some 120 million families living on less than $2 a day, this is a very
small proportion of the potential micro-insurance market. A major share of this market belongs
to compulsory credit linked insurance distributed by Micro finance institutions (MFIs), rural
banks, and cooperative banks. India being the second most populated country in the world has a
large chunk of population living on more than $1 but less than $2 a day. Micro-insurance
regulations issued by IRDA have provided a fillip in propagating micro insurance as a
conceptual issue. The micro insurance regulations have been made effective from 2005. These
regulations are in addition to the obligations for rural and social sector business to be done by all
insurers on an annual basis.
In the life micro-insurance segments, there are 16 insurers doing business, out of which 15 are
private insurers and LIC, is the only company from public sector. But, LIC plays a vital role in
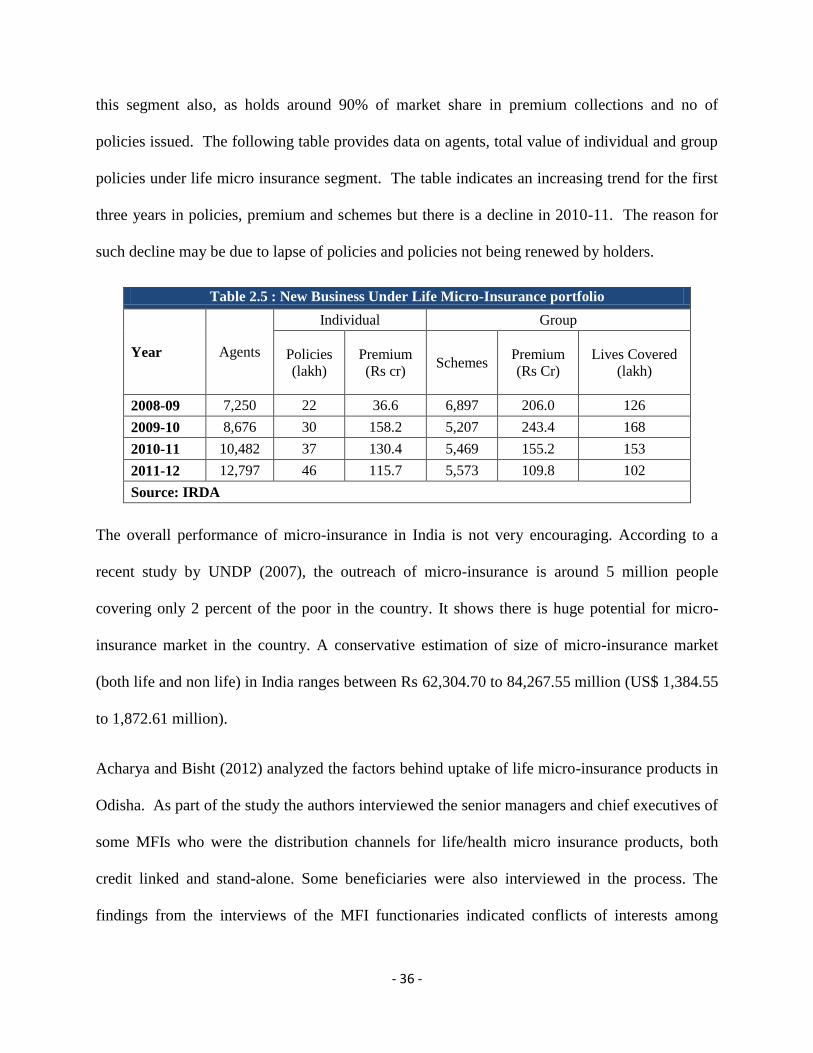
- 36 -
this segment also, as holds around 90% of market share in premium collections and no of
policies issued. The following table provides data on agents, total value of individual and group
policies under life micro insurance segment. The table indicates an increasing trend for the first
three years in policies, premium and schemes but there is a decline in 2010-11. The reason for
such decline may be due to lapse of policies and policies not being renewed by holders.
Table 2.5 : New Business Under Life Micro-Insurance portfolio
Year Agents
Individual Group
Policies
(lakh)
Premium
(Rs cr) Schemes
Premium
(Rs Cr)
Lives Covered
(lakh)
2008-09 7,250 22 36.6 6,897 206.0 126
2009-10 8,676 30 158.2 5,207 243.4 168
2010-11 10,482 37 130.4 5,469 155.2 153
2011-12 12,797 46 115.7 5,573 109.8 102
Source: IRDA
The overall performance of micro-insurance in India is not very encouraging. According to a
recent study by UNDP (2007), the outreach of micro-insurance is around 5 million people
covering only 2 percent of the poor in the country. It shows there is huge potential for micro-
insurance market in the country. A conservative estimation of size of micro-insurance market
(both life and non life) in India ranges between Rs 62,304.70 to 84,267.55 million (US$ 1,384.55
to 1,872.61 million).
Acharya and Bisht (2012) analyzed the factors behind uptake of life micro-insurance products in
Odisha. As part of the study the authors interviewed the senior managers and chief executives of
some MFIs who were the distribution channels for life/health micro insurance products, both
credit linked and stand-alone. Some beneficiaries were also interviewed in the process. The
findings from the interviews of the MFI functionaries indicated conflicts of interests among

- 37 -
different stakeholders. First, risk carriers/insurance companies do not develop products keeping
the poor in mind rather they float products with exclusion clauses to minimize claims in general.
The kind of products they develop therefore is not socially sustainable. In the business of micro
insurance it’s only the insurance companies that reap profits not the MFIs or NGO-MFIs. The
poor don’t benefit since they are forced to buy products that they don’t require as such. For
instance, they are forced to buy a personal accident policy whereas they need a health insurance
policy or a maternity policy. The insurer is not ready to customize a product in health since he
sees loss in that and profit in personal accident policy. The MFI is not taken into confidence
while underwriting policies in which case the poor’s interests are not addressed. Thirdly, the
insurers/risk carriers are in the micro insurance business primarily to fulfill the social obligation
clause stipulated by IRDA. Finally, the beneficiary is at loss as to the benefits of micro insurance
especially when there is a plethora of schemes available without proper awareness on the
schemes/products. The study also found that the beneficiaries have negligible knowledge on
insurance in general and the policies bought by them in particular (mostly bundled with
microcredit). Having analyzed the potential factors that drive the perceptions and therefore the
demand a vector of four factors i.e., usefulness, image, individual perceptions, and time emerged
as the final factor structure.
2.8.4 Role of PFRDA in promoting Financial Inclusion: As part of the Government’s initiative
towards ‘financial inclusion’, the finance ministry has announced a new scheme in 2010 called
‘Swavalamban’ to encourage the people from the unorganized sector to voluntarily save for their
retirement and to lower the cost of operations of the New Pension Scheme (NPS) for such
subscribers. Under this scheme, the Government will contribute Rs. 1000 per year to each NPS
account. ‘Swavalamban’ will be available for persons who join NPS, with a minimum
- 38 -
contribution of Rs. 1000 and a maximum contribution of Rs. 12000 per annum during a financial
year.
Although the NPS is perhaps one of the cheapest financial products available in the country, in
order to make it affordable for the economically disadvantaged, the government in September
2010 introduced a lower cost version, known as Swavalamban Scheme, which enables groups of
people to join the NPS at a substantially reduced cost. As per existing scheme under NPS,
Swavalamban could be availed either in unorganized sector or in NPS Lite. NPS Lite is a model
specifically designed to bring NPS within easy reach of the economically disadvantaged sections
of the society. NPS Lite is extremely affordable and viable due to its optimized functionalities
available at reduced charges. Under the Swavalamban scheme, the government provides subsidy
to each NPS account holder and the scheme has been extended until 2016-17. A customized
version of the core NPS model, known as the NPS Corporate Sector Model was also introduced
from December 2011 to enable organized-sector entities to move their existing and prospective
employees to the NPS under its Corporate Model. All the PSBs have been asked to provide a link
on their website to enable individual subscribers to open online NPS Accounts.
Micro Pension Model: A pilot project by NABARD involving an assistance of Rs 2.26
crore was sanctioned to ‘Invest India Micro Pension Services (IIMPS) - Micro Pension
Model’, for propagating and enrolling members for micro pension scheme developed by it in
association with UTI AMC.
Invest India Micro Pension Services (IIMPS) provides economically active but financially
excluded urban and rural poor with convenient and secure access to an integrated pension,
savings and insurance product solution using a unique, scalable and sustainable technology-
led Micro Pension model. IIMPS is the only global firm that is committed exclusively to

- 39 -
educating, encouraging and enabling the working poor to accumulate micro-savings for their
old age in a secure, affordable and well regulated environment. In the IIMPS model, low
income individuals save on average Rs.200 per month towards their old age while they are
young. These monthly savings are distributed between the government's NPS-Lite
Swavalamban that is regulated by the PFRDA and a mutual fund scheme called UTI
Retirement Benefit Pension Fund. NPS Lite comes with a lock-in till 55 years of age or 20
years whichever comes first and the mutual fund scheme dissuades early withdrawals
through an exit load of 5% in the first year coming down to 1% from the third year onwards
till 58 years of age. NPS Lite invests up to 15% in equities and the mutual fund scheme can
invest up to 40% in equities. For this, IIMPS charges a fee of Rs.100 in the first year and
Rs.80 going forward every year.
The scheme is implemented in eight districts of four States (Odisha, Uttar Pradesh, Bihar and
Tamil Nadu) and aims at covering 40,000 persons under old age pension. An amount of Rs
2.03 crore was disbursed by the end of March 2013. Over 20,000 low income rural workers,
mainly SHG members, farmers and daily wagers were enrolled under the project and were
saving Rs 100-200 per month for their old age.
Issues in NPS-Lite of IIMPS
For investors with a decent flow of income, comfortable level of disposable income and a
buffer of emergency fund, a product such as NPS works very well because it calls for
targeted investments and locks in your money for that purpose; even a mutual fund works
very well for this segment. But when the investors are in the low-income bracket subject to
erratic income and expenditure, and debt traps, reaching out with market-linked products

- 40 -
with lock-ins and exit loads as the first set of financial products do seem like good financial
planning.
For them, saving for the old age is not paramount, but insuring their health, lives and
managing short-term money shocks are. Given the need, the first tranche of products to touch
their money should be health insurance, pure life insurance, bank and post office deposits and
subsequently Public Provident Fund for long-term savings. These products are needed to
build a sound and guaranteed base before any money is put in market-linked products.
It is well known that, in the long term, equities do outperform other asset classes, but then
there is a risk attached. Given this and in the absence of a guaranteed products base, should
equity exposure be bundled into the first financial product they buy? And should they be
made to lock in their money when they haven’t even provisioned for a rainy day? There isn’t
one product that fulfills all the financial needs and therefore institutions that work in the field
of financial inclusion need to adopt a holistic approach. Even banks need to go beyond the
mindset of meeting their enrolment targets and they need to reach out to customers with
need-based financial products.
2.8.5 Linking of livelihood initiatives with financial inclusion
The Ministry of Rural development, Government of India, has launched a National Rural
Livelihood Misson (NRLM) by restructuring the Swarnajayanti Gram Swarozgar Yojna (SGSY)
replacing the existing SGSY schemes since April 2013, though the programme was introduced
on a piolot basis in June 2010. The main aim of the programme is to reduce poverty numbers
through building strong institutions of the poor, particularly women, and enabling these
institutions to access a range of financial services and livelihoods services.

- 41 -
NRLM is promoting a major shift from purely ‘allocation based’ strategy to a ‘demand driven’
strategy wherein states have the flexibility to develop their own plans for capacity building of
women SHGs and Federations, infrastructure and marketing, and policy for financial assistance
for the SHGs. NRLM will provide continuous support to SHGs, and their federations. This was
missing in SGSY. Thus, basically, NRLM talks about rural livelihoods through Self Help Groups
(SHG). The conceptual framework of NRLM is as under:
Chart 5: Conceptual Framework of NRLM
Source: Programme implementation plan, NRLM, Ministry of Rural Development, GoI.
As discussed in the Chapter 2, financial inclusion (access to finance at an affordable cost) is
critical for poverty reduction. In this context, NRLM strategy for financial inclusion aims to
make the poor as the preferred clients and banks feel it as a profitable business model. The
strategy options for the NRLM are proposed around a simple triad reflecting interplay of three
forces viz., incomes, costs and risks, affecting the livelihoods of the poor households.

- 42 -
This programme (NRLM) will be in continuation with the SHG-Bank linkage model of
NABARD. It will be implemented in federal structure (district, State & Centre). In the state,
State Rural Livelihood Mission (SRLM) would do the advocacy with the banks to promote SHG
credit linkage. In continuation with the RBI’s financial inclusion drive, State Level Bankers’
Committee (SLBC) to constitute an exclusive sub-committee for SHG bank linkage and financial
inclusion and the functions of the sub-committee would be planning, coordination, monitoring
and review of financial inclusion and credit linkages. Finally, at the state, SRLM) will be the sole
responsible agency to drive this programme.
Issues in NRLM Implementation
NRLM promises a lot with regard to creation and strengthening of rural livelihoods but it suffers
some serious shortcomings, which if not addressed are likely to see it move in the same path as
the IRDP, SGSY and/or other programs. So, herewith, we are presenting critical issues that raise
the risk of failure with regard to implementation of the NRLM:
Though, SHGs have contributed to financial inclusion, relying solely on SHGs might be a
limitation for the implementation of the programme. As not everyone in rural area is a
member of an SHG and not everyone may desire to become a member of a SHG. Given the
changing nature of our society, the choices and information available before individuals the
sustainability of such programmes in the medium and long term will be determined by
sustained activities of SHGs. Since NRLM is trying to build on the existing SHG network
it’s important to activate the inert SHGs, bring in quality work to SHGs that are income
generating.
- 43 -
Since the membership in SHGs keep changing and new SHGs come up over emphasis of
NRLM on SHGs could result in exclusion (rather than inclusion) of the rural poor. In the
process people who are not inclined and/or unable to participate through SHGs may be
excluded. The question raised here is “Can NRLM d focus on the household as the primary
target of the program?”.
Thirdly, NRLM may also focus on rural MSMEs, which, as the experiences of many
countries suggest, can play a major role in enabling and sustaining inclusive growth in rural
areas. MSMEs are the growth engines in emerging and developing economies and they need
to have targeted interventions. One of the key areas that NRLM could focus upon is the
creation of a stronger and vibrant ecosystem for agro MSMEs in various value chains.
Fourthly, the strategy of NRLM is too broad. Rather than attempting to do a whole lot of
things across the board, it may be better if the NRLM learns from its past experiences (such
as the IRDP or SJSY) and focuses on areas that could impact livelihoods of large number of
rural people so as to generate quick wins for the program as well as get the initial thrust and
momentum, so critical for medium and long term success.
Even after 64 years of independence, we are still riddled with problems of basic services
pertaining to rural livelihoods and financial inclusion. A serious introspection of the reasons
behind the current state is called for. Is it a problem of design or implementation? Both success
and failure with respect to design and implementation might help in solutions. There seems to be
a plethora of schemes and provisions by different players including the government.

- 44 -
2.9 Urban Financial Inclusion in India
In India the financial inclusion efforts of the Government and other regulators such as, RBI,
IRDA, PFRDA etc, is largely remained focus towards the rural poor, as a greater number of
populations are still remain unbanked in the village areas. But in urban areas, we feels that the
reach of banking network is quite high, as around 36% of the total branch network is located in
urban & metro areas, which are offering their products and services to only 30% of the total
population in the country. However, the ground realities are quite shocking, as problem of
exclusion is widespread even in urban areas, especially, for the disadvantaged and low-income
groups, despite there being no dearth of bank branches.
In the last 3-years (FY10 to FY13), banks have opened 26,696 BC outlets in urban areas, as part
of the financial inclusion drive. But, the achievement is far from what was hoped for. Many of
the urban poor still have no access to formal financial products and services like savings, credit,
remittance and insurance, forcing them to depend on informal sources to meet their personal,
health, and livelihood-related needs. Not surprisingly, they struggle to repay such borrowings,
which further impede their ability to escape the vicious circle of poverty.
2.9.1 Reasons & Possible Solutions to Urban Exclusion
Presently, urban population of our country is growing much faster than the growth of total
population. The most important reason may be the migrant workers. Every year, a large number
of people migrate from villages to cities in search of a better life for themselves and their
families. They take up non-contractual and non-permanent jobs of vendors, porters, hawkers,
construction workers, domestic workers, rickshaw pullers, etc. Among the urban poor, the
migrant workers’ group is being affected most due to the problem of financial exclusion in urban
areas. These workers in urban areas mostly comprise people from low-income households who

- 45 -
generally leave their village homes in search of better income and employment opportunities.
Many of these people work and live at their work sites and are paid daily wages. They need a
secure place to keep their savings and the facility to remit small amounts of money at frequent
intervals. In most of the migration corridors, the migrants have outstanding loans at their origin
points (rural home), mainly from informal sources, and the remittances are the major source of
loan repayment.
By 2030, it is estimated that around 40% of Indians will be living in cities and towns compared
to the current proportion of 30%, which would also lead to an increase in the number of urban
poor, currently pegged at 80 million by NSSO. This large section of the population lacks access
to even the most basic banking services like deposits and remittances. However, in view of the
non-permanent nature of their occupations, they frequently shift base within city or even across
cities. Bankers are generally found to be shy in providing them banking services, for obvious
reasons. The main reasons for the exclusion in urban areas may be due to the following reasons,
such as: (i) inability to produce adequate documentation, (ii) guarantor or introducer, (iii) lack of
knowledge and (iv) due to their temporary earnings. If some of them holds account, they don’t
know about the remittance facilities offered by banks, so, do not use them effectively. As a result
of lack of financial literacy and general apathy, even those who have money continue to keep
their savings either at home or prefer to participate in informal savings schemes like chit fund.
In our primary survey, we have also observed that the urban poor’s don’t have accounts with any
bank; most of them are going once in a month to their village to give money to their dependants.
In their needy time, they borrow from family, friends, local money lenders, mainly because of
speed (24x7x365) and ease to get money, even at exorbitant interest rates of 5-8 per cent per
month as the lender understand their financial situation and constraints. Besides, the indifference

- 46 -
of the urban poor to the formal sources of finance, despite these being less costly, is also
attributable to the attitude and mindset of the service providers, which needs to be facilitating
and supportive Experience suggests that the financially excluded population is more comfortable
tapping the informal sources to finance their needs, which are much more ‘flexible’ and
‘convenient’.
2.9.2 Solutions to Urban Exclusion
Therefore, there is an urgent need for the financial institutions to study the informal systems
strong points and that need to be incorporated into the practices of the formal service providers to
the extent possible. Another solution may be the product innovation in financial services,
keeping in view the life cycle needs of the urban poor. Banks should innovate to create demand-
oriented savings, credit and remittance products that are customized to the lifestyle patterns and
income streams of the urban poor. Offering micro-saving products, per se, to meet the savings
needs of these groups, might not be enough. Innovative financial products offering possible
investment opportunities, besides catering to the savings needs, have to be thought of for
bringing the urban poor into the banking system. Insurance offers protection to assets created
under credit programmes and protects savings from being wiped out by shocks arising out of
sickness, death, accidents or asset loss caused by fire, drought, floods and riots. The section of
the urban poor, who are determined to save regularly, even with their low earnings, should be
provided an investment option that fetches reasonable rate of return on their savings, without
exposing them to significant risks. Mutual funds and pension schemes for the unorganized
sector, customized to the financial needs of the poor, have to be developed, which will give a
fixed return as they don’t understand the market complexities.

- 47 -
In appropriate, customized delivery channel is equally crucial in urban areas. South Africa's E-
Bank Plan demonstrates how a commercial bank can bundle services for low-income clients. Its
uniqueness lies in its focus on sensitivity to the needs of the basic banking customer, which led
to creation of a new product providing a cost efficient delivery mechanism. The idea was to offer
an integrated combination of product and delivery features, including user friendly, conveniently
located branches, by leveraging on technology. E-banks are conveniently located in high-traffic
areas in colourful, well-designed, user-friendly kiosks. Instead of relying on traditional
advertising methods, E-Bank has used market presence, life insurance and prizes to generate
word-of-mouth advertising. The approach is providing product and delivery features that are
valuable enough to make the low-income clients willing to pay ATM transaction fees slightly
above the market norm and high enough to cover banking costs.
Bringing the urban poor into the mainstream of the financial system can act as an important
gateway for financial inclusion. Rolling out of an innovative financial product, delivered through
a user friendly channel, is central to achieving financial inclusion. This has to be seamlessly
integrated with a strategy to improve the financial literacy of the targeted groups. Only then will
we be able to avoid the problem of low level of transactions in the newly opened accounts, which
we are currently facing in our financial inclusion efforts in the rural areas.
Most importantly, society has to radically change its attitude towards labour and the people
providing us manual services. Every task has its dignity and we must respect the efforts put in by
these groups of people and their contribution in making our lives comfortable and hassle-free.
2.10 Recent Policy Initiatives and Passed Bills to induce Inclusion
2.10.1 New Bank Licensing in Private Sector: The Finance Minister in his Budget speech
2010-11 had indicated that new bank licenses would be issued for rapid expansion of banking for

- 48 -
financial inclusion. Accordingly, RBI has come out with final guidelines for New Bank
Licences, allowing business houses, state-run enterprises and non-banking finance companies to
set up banks, in a bid to extend banking services to half of the population that is excluded from
them. Highlights of the guidelines are: (i) Promoters should bring a minimum paid-up capital of
Rs.500 crore, (ii) Promoters to hold minimum 40% of paid-up capital locked for five years, (iii)
The bank shall open at least 25% of its branches in unbanked rural centers (population up to
9,999 as per the latest census), (iv) The bank shall comply with the priority sector lending targets
and sub-targets as applicable to the existing domestic banks, and (v) Bank should maintain a
minimum CAR of 13% for a minimum of 3 years. Further, RBI has empowered itself to reject
those whose ‘business model’ and ‘culture’ are not in line with banking. Further, the Banking
Laws (Amendment) Act 2012 strengthens the regulatory powers of the RBI and paves the way
for grant of new bank licences by the RBI.
RBI's decision to allow new players in the banking sector has received big thumbs up from
Indian industry. The drive has resulted in 26 companies, including Tata Sons, Aditya Birla,
Reliance Capital, Bajaj Finserv, L&T Financial Holdings, IFCI and India Post, applied for
banking licences. RBI is in the process of constituting an external committee headed by Dr.
Bimal Jalan and the committee will be composed of individuals with impeccable reputation. This
committee will screen licence applicants after an initial compilation of applications by the RBI
staff. The external committee will make recommendations to the RBI governor and deputy
governors, and will propose the final slate to the Committee of the RBI Central Board. The final
licence is likely to be issued before January 2014.
New banks are required to increase banking access, reach and penetration, while expanding
geographic coverage. The financial inclusion programme, which seeks to bring every Indian

- 49 -
household under the organized banking arm, would mean more banks have to come in the fray.
That’s because RBI has mandated that all the new players must open one branch in rural areas
for every four they set in urban areas. Besides, increased participation from the private sector
will mean more competition, which will ultimately benefit customers.
If new banks do more of what the existing banks are doing the inclusion will be widened. RBI
has insisted that the new banks need a thrust on financial inclusion. The final guidelines do not
make inclusion a central point of discussion. The first set of licences offered to the private sector
in 1993 brought in fundamental changes, state-of-the art technology, a better customer interface,
professionalism and data-driven decision making. It had a positive effect on the banking sector
and can be termed as game changing.
It’s difficult to speculate the likely impact on financial inclusion of these new banks. Will any of
the new players come out with a business plan that will appeal to RBI on this initiative? RBI has
made it clear that the new banks would induct new processes and technology, improve
efficiency, enlarge the capital base to meet the credit needs of the economy and generate huge
employment opportunities in the country. But the question still remains on the ability of these
new banks in accomplishing the desired branch expansion and inclusive growth when the
performances of the existing private sector banks are not encouraging.
2.10.2 Microfinance Bill & Andhra Pradesh Crisis
The expansion of MFIs in India was more in Andhra Pradesh and Tamil Nadu by the year 2010
with a major share of borrowers and loans. Most of the MFIs belonged to the profit making
types. A bad coincidence of around 200 suicides in a particular year in AP alone was related to
multiple MFI loans and defaults by borrowers. Arunachalam (2011) pointed these suicides as an

- 50 -
effect of multiple causes including that of multiple lending and borrowing which the MFI sector
both profit making and non-profit making encouraged. There was no credit bureau functioning at
that time to check these multiple lending and borrowing. Easy availability of loans made
households borrow from different MFIs for different purposes including consumption
smoothening. This credit led growth collapsed when MFIs found the credit sub-prime in nature.
The Andhra Pradesh state government and other activists blamed the MFIs for fuelling such
unhealthy expansion in the sector that resulted in suicides. The Govt. of A.P. then brought in
regulations to control MFI activities in general and prevented forcible recovery of loans from
poor borrowers. MFIs faced defaults and could not further expand their base which affected their
growth. Banks and other funders stopped lending to MFIs which choked the flow of resources to
MFIs. The Govt. of A.P. passed the Andhra Pradesh Microfinance Ordinance 2010, which
included a number of measures that greatly restricted microfinance institutions’ operations in the
state. Following the AP Microfinance Ordinance, the Reserve Bank of India (RBI) created a
committee, the Malegam Committee, to make recommendations for the regulation of the MFI
sector. This committee aimed to address the antecedents that led to the crisis, including coercive
collection practices, usurious interest rates, and selling practices that resulted in over-
indebtedness. The Malegam Committee recommendations saw the light in January 2011. These
recommendations were “broadly accepted” by the RBI in May 2011, though specific guidelines
were only released regarding which microfinance institutions qualify for priority sector lending
at this time. Priority sector lending is a government initiative which requires banks to allocate a
40 percentage of net bank credit to investment in specified priority sectors at a reduced interest
rate. The A.P. crisis had a contagious effect on other states too wherein it was difficult for MFIs
to mobilize resources for lending to their clients. This situation was also exploited by new MFI

- 51 -
entrants by way of encroaching in to exiting clientele of the old MFIs. In view of this a study
was conducted and compiled by Deepti K C, Acharya D and Others in 2011 on behalf of the
Centre for Microfinance, IFMR. This study covered seven states and thirty two MFIs. The study
mainly focused on: 1) MFIs’ view towards Malegam Committee recommendations and RBI
regulations 2) MFIs’ responses to RBI guidelines on clients choice of payment, loan usage and
annual household income of clients 3) MFIs’ responses to RBI’s caps on interest rate and margin
4) Current funding scenario among the MFIs. The MFIs’ concerns were that the Malegam
committee recommendations created confusion among the bankers because of which the funding
scenario dried up. The Malegam Committee’s proposal that companies require a minimum net
worth of Rs. 15 crore to register under suggested new category of Non Banking Finance
Company (NBFC) would affect medium and small sized MFIs. As per data provided by Micro
Credit Ratings International Ltd, only 26 MFIs have net worth of more than Rs. 15 crore and
together these 26 firms have a market share of 85% of the total loan portfolio. The question now
is what would happen to the remaining for-profit MFIs, which have net worth of less than Rs. 15
crore.
MFI Bill & It’s Impact
After this crisis, to regulate this growing sector, Government passed a bill, namely Microfinance
Institutions (Regulation & Development), on 22 May 2012. The bill empowers RBI to regulate
the micro-finance industry and fix interest rate ceiling on loans. Further the expression "micro
finance services" is defined in the Bill as providing micro credit, collection of thrift, remittance
of funds, insurance and pension services. It also provides for regulation of activities like micro-
credit, thrift, pension or insurance services and remittances of funds by microfinance institutions
(MFIs). MFIs must have a minimum net-owned fund of Rs 5 lakh and be registered with RBI.
- 52 -
This bill supersedes all State-level legislation, including the controversial October 2010 Andhra
Pradesh law that threw the industry into a crisis. In addition, a Micro-Finance Development
Council will be set up to advice the Government on formulation of policies, schemes and other
measures required in the interest of orderly growth and development of the sector with a view to
promote financial inclusion.
This Bill will provide a respite to the microfinance industry and is expected to help ease the fund
flow to the sector. Since, the bill will provide a constitutional framework for the microfinance
industry and also gives greater powers to RBI. Though RBI has already started regulating MFIs
registered as non-banking financial companies (NBFCs), the others are also likely to come under
its purview after the passing of the legislation.
It’s clear from the above that the key players in financial inclusion activities have been subject to
policy uncertainty primarily due to the way the different sectors have evolved over a period of
time and due to some unforeseen consequences of activities in the sector and set of govt. policies
being implemented from time to time.
2.10.3 Pension Fund Regulatory and Development Authority (PFRDA) Bill
The Parliament on 04 September 2013 passed the Pension Fund Regulatory and Development
Authority Bill (PFRDA Bill), thereby making PFRDA a statutory authority. The main objective
of the bill is to provide a structure to plan for old age income security through its New Pension
Scheme (NPS). NPS is a defined contribution scheme and is based on the principle that ‘you
save while you earn’ especially for retirement. With increasing life expectancy and changing
fabric of traditional family structure, the Bill is expected to deepen pensions and annuity market
for ensuring old age financial security.

- 53 -
As of now, NPS is mandatory for all Central Government employees (except armed forces)
entering service with effect from 01 April 2004. Twenty six States have already notified NPS for
their employees (except West Bengal and Tripura). NPS has been launched for all citizens of the
country including unorganized sector workers, on voluntary basis, with effect from 1 May 2009.
Further, to encourage the people from the unorganized sector to voluntarily save for their
retirement, the Government launched the co-contributory pension scheme titled “Swavalamban
Scheme” in the Budget of 2010-11.
The passage of the pension bill will be positive for financing the fund requirements for the
infrastructure sector. Pension funds by design are vehicles to create financial claims on future
output. Hence, when pension funds are channelized in infrastructure, it creates a bi-
directional positive feedback loop where supply infrastructure boosts further GDP growth.
The total investment in infrastructure sectors in the Twelfth Plan (2013-17) is estimated to be
Rs 55.7 lakh crore (debt plus equity), and the pension funds are expected to contribute at
least Rs 1.5 lakh crores in debt component.
This estimated contribution by pension funds towards infrastructure is on the lower side
given the potential for developing pension market in India. However, as on 14 August, 2013,
the number of subscribers under NPS was 52.83 Lakh with a corpus of only Rs 34, 965 crore.
Table2.6 Availability of debt by sources of funds (Rs lac crore)
Commercial banks 11.65 51%
NBFC 6.19 27%
Pension and/ life insurance 1.50 7%
ECB 3.31 15%
Total 22.65 100%
Source: Planning Commission
- 54 -
Hence, convincing pension funds to invest in infrastructure as an asset class will be a
challenge. There is need for a separate policy to address this aspect of risk perception.
2.9 Challenges to Financial Inclusion
The current policy objective of inclusive growth with financial stability cannot be achieved
without ensuring universal financial inclusion. Financial Inclusion of the unbanked masses is
expected to unleash the hugely untapped potential of the sections of the society that constitute
the bottom of the pyramid. However, in pursuing the FI mission, the normal banking model has
been found wanting in terms of cost, scalability, convenience, reliability, flexibility and
continuity. To ensure that the banks give adequate attention to financial inclusion, they must
view this as a viable business proposition rather than as a corporate social responsibility or a
regulatory obligation. For the business to remain viable it would be important to focus on
increasing usage of existing banking infrastructure which would happen only if the banks can
offer an entire bouquet of products and services to the holders of the large number of basic bank
accounts opened during the last three years as also to the new customers that the banks acquire.
If the dream of universal and a meaningful financial inclusion has to be turned into reality, then
going forward, we would need to focus on the following issues:
Strategy for further financial inclusion
Leadership: Cultivate a broad-based government commitment to financial inclusion to help
alleviate poverty.
Diversity: Implement policy approaches that promote competition and provide market-based
incentives for delivery of sustainable financial access and usage of a broad range of

- 55 -
affordable services (savings, credit, payments and transfers, insurance), as well as a diversity
of service providers.
Innovation: Promote technological and institutional innovation as means to expand financial
system access and usage, including addressing infrastructure weaknesses.
Protection: Encourage a comprehensive approach to consumer protection that recognizes the
roles of government, providers and consumers.
Empowerment: Develop financial literacy and financial capability.
Cooperation: Create an institutional environment with clear lines of accountability and
coordination within government, and also encourage partnerships and direct consultation
across government, business and other stakeholders.
Knowledge: Utilize improved data to make evidence-based policy, measure progress, and
consider an incremental “test and learn” approach acceptable to both regulator and service
provider.
Proportionality: Build a policy and regulatory framework that is proportionate with the risks
and benefits involved in such innovative products and services and is based on an
understanding of the gaps and barriers in existing regulation.
Framework: Consider the following in the regulatory framework, reflecting international
standards, national circumstances and support for a competitive landscape: an appropriate,
flexible, risk based AML/CFT regime; conditions for the use of agents as a customer
interface; a clear regulatory regime for electronically stored value; and market-based
incentives to achieve the long-term goal of broad interoperability and interconnection.
Innovative product lines & processes: Banks have to look at their policies and procedures
to develop new product lines rather than merely adopting the complex products of urban

- 56 -
India in the rural milieu. Providing simple and basic banking services in the form of deposit
account with remittance services and small credit facility would ideally suffice for bringing
the unbanked into the folds of banking system.
2.11. Summing up
The financial inclusion initiatives have made substantial progress in the last few years. However,
given the diversity and size of our country much more needs to be done. It’s evident from the
above discussion that policy initiates started with a focus of enrolment into banking followed by
savings mobilization and credit to needy and underprivileged. Apart of direct credit by govt.
supported schemes and SHG bank linkage programmes there was a catalytic role played by the
Govt. in supporting the MFI structure. The focus of services has also been diversified into
insurance, pension, remittances by mobile phones, and literacy/education. The progress has
largely been in deposit and credit activities. The other services have a still a long way to go
despite efforts by different stakeholders.
For instance based on the experience of countries like Kenya, and the massive growth and
expansion of mobile phone in the country, there is need for scaling up the existing models of
mobile-led banking for financial inclusion like the services rendered by EKO and SBI TINY
practiced in some parts India. Banks have a social responsibility and in this context, financial
inclusion to extend the access of credit to weaker sections is important. Inclusive growth and
financial inclusion has assumed a prime place in the public policy for achieving sustainable high
growth in India. If the country has to record double digit growth on a sustainable basis for the
next 10 or 15 years, it is imperative that poor, underprivileged and low income groups should
have access to banking and financial services. Availability of easy and cost-effective banking

- 57 -
services for savings, investment and credit enables people to break out of poverty by using the
credit for various productive and consumption purposes.
The strategic shift to sustainable financial inclusion, viewing it as a viable business proposition
has been made possible by the availability of Information and Communication Technology
which has facilitated penetration into widespread unbanked areas in a cost effective way. In the
following chapters an empirical attempt is made to verify the extent of financial inclusion, and
critically examine supply side issues using secondary data on financial services and qualitative
case studies.
*****
- 58 -
CHAPTER III
FINANCIAL INCLUSION IN INDIA:
AN EMPIRICAL ASSESSMENT - 2007-08 TO 2011-12
3.1. Introduction
In this chapter an attempt is made to assess the progress on financial inclusion drawing heavily
upon the definitions mentioned in Chapter II. Therefore, an annual data set for major Indian
states on the SHG Bank Linkage programme and Micro Finance Institutions are utilized for
constructing a Financial Inclusion Index (FIIND). Data on number of SHGs having savings
accounts, number of SHGs with loan disbursements, SHG savings, SHG loans, number of MFIs
and MFI loan outstanding are collected for available number of years i.e. 2007-08, 2008-09,
2009-10 and 2011-12. The data on SHG related variables are collected from annual reports of
NABARD. Data on MFIs are collected from the state of the sector reports on Micro finance in
India published by Sage India and The Bharat Microfinance report-quick data 2012.
3.2. Indices on Financial Inclusion: Some Previous Studies
There have been different attempts by different authors and some institutions to measure the
depth of financial inclusion using aggregate data on banking indicators. The most recent index
on financial inclusion is the CRISIL-Inclusix 2013. CRISIL Inclusix is India’s first
comprehensive measure of financial inclusion in the form of an index. To quote the report, “It is
a relative index that has a scale of 0 to 100, and combines three very critical parameters of basic
banking services - branch penetration (BP), deposit penetration (DP), and credit penetration (CP)
- together into one single metric. For each of these parameters, CRISIL evaluates financial
inclusion at the national/ regional/ state/ district level vis-à-vis a defined ideal. A CRISIL
Inclusix score of 100 indicates the ideal state for each of the three parameters”. The all-India
- 59 -
CRISIL Inclusix score of 40.1 (on a scale of 100) is relatively low as per the report which
implies under-penetration of formal banking facilities in most parts of the country as claimed by
the report.
In another study Sarma (2012) computed a multidimensional index of financial inclusion using
data on banking penetration, availability of services, and usage for 62 countries for the period
2004-2010. The findings indicate different levels of inclusion for different countries the
commonality being an improvement over time during 2004-2010. The study finds that barring
few exceptions high income countries tend to be high on financial inclusion.
Chattopadhyay (2011) developed an index of financial inclusion (IFI) using data on three
dimensions of financial inclusion with an objective to monitor the progress of policy initiatives
for financial inclusion in a country/state over a period of time. The results indicated that in the
group of 18 districts in West Bengal for which a 3-dimensional IFI was estimated by using data
on 3 dimensions of financial inclusion, Kolkata yielded the highest value of IFI followed by
Darjeeling district. Only one district, viz., Kolkata had higher IFI with IFI of 1.0. All other
districts had low IFI values, varying between 0.0 and 0.3.
A study by ICRIER (2009) placed India at a low 29th
rank (out of 55 countries) on an Index of
financial inclusion with a value of 0.2. The index used information on three comparable
dimensions across the countries covered - (i) accessibility (measured by penetration of the
banking system, number of bank accounts per 1,000 people), (ii) availability (number of bank
branches/ATMs per 100,000 people) and (iii) use of banking services (volume of credit plus
deposits relative to GDP). The study also highlighted the correlation between human
development and financial inclusion. With low financial inclusion the author concluded that it
was not surprising that the human development index of India, ranked 119 (UNDP, 2009) out of
- 60 -
169. Hence, it becomes clear that improving the nation’s financial inclusion status will require a
concerted effort from all stakeholders - the government, regulators, banks and others.
3.3. Financial Inclusion Index (FIIND)
In this section FIINDs have been estimated employing the same methodology as in Sarma (2012)
for major Indian states for four different years. To assess the supply side strength in promoting
financial inclusion the focus has been on variables specific to the low income or under
privileged. As widely claimed in the literature the SHG bank linkage programme and the Micro
Finance Institutions (MFIs) have been trying to reach the vulnerable by providing credit and
savings. Therefore the data on number of SHGs having savings accounts, number of SHGs with
loan disbursements, SHG savings, SHG loans, number of MFIs and MFI loan outstanding are
used as different dimensions to calculate FIIND.
3.3.1. Methodology
Inclusion can be measured from different dimensions. We have estimated here with the multi
dimensional approach discussed in Sarma (2012). These dimensions may be number of SHGs,
total number of branches and total amount of savings and loan portfolio in a year. To derive the
state wise financial inclusion index (FIIND), first we have estimated each dimension index
followed by the final inclusiveness index.

- 61 -
The dimension index (Di) has been calculated using the following formula, which measures the
states ith
dimension inclusion index.
Where,
wi is the weight assigned to the dimension i, indicating the relative importance of the
dimension i in quantifying the inclusiveness. 0≤ wi≤1. For simplification, we have taken
wi as 1.
Ai = Actual value of dimension i
mi = lower limit on the value of dimension i
Mi = upper limit on the value of dimension i.
The formula ensures that the value of Di will be in the range 0≤Di ≤ wi. The higher the value of
Di means the higher the state’s achievement in dimension i. If n dimensional financial inclusion
case is considered then a state’s achievement in these dimensions will be represented by a point
X = (D1, D2,....Dn). To compute the final FIIND, the following formulae are employed:
FIIND = [ X1 + X2]

- 62 -
FIIND is a simple average of X1 and X2, thus incorporating distances from both the worst point
and the ideal point. Since, wi is 1 then the IFI would be:
Thus FIIND is being calculated using seven dimensions (D1 to D7) of an inclusion, such as, no
of SHGs and amount of deposits in saving accounts, no of SHGs and amount of loan disbursed,
No of MFI clients and total MFI loan outstanding and number of commercial branch offices. The
study is focused on state-wise progress in financial inclusion based on the above parameters, for
the period 2007-08 to 2009-10 and 2011-12. Due to the data unavailability in some indicators,
we are not able to derive the inclusion index for the year 2010-11. We have included 30 states
and union territories for computation of the index and compare the indices for the sates over a
period of time.
3.3.2. Results and Discussion
The final inclusion index is being reported in the following table, which presents a state-wise
index of 30 states for the period of four years, i.e., 2007-08, 2008-09, 2009-10 and 2011-12. The
index of inclusion lays in the range of 0 to 1, higher the index value, better is inclusion. The
ranks are being assigned on the basis of index value.
The results shows that Andhra Pradesh is placed at the no 1 position in all the years but the
level of inclusion is being increased over the year from FY08 to FY12. The states like Tamil
Nadu, West Bengal, Maharashtra, Karnataka and Odisha have consistently performed well
during the study period, though there is a little variation in ranks among the states.

- 63 -
The north-eastern states are under performed as the index is at a very low level. The data also
substantiates such finding since the level of banking facilities have not penetrated well in
these regions. There are few SHGs in these states.
Table 3.1: State wise FIIND
Index of Inclusion for Various States
States 2007-08 2008-09 2009-10 2011-12
FIIND Rank FIIND RANK FIIND RANK FIIND Rank
Andaman and Nicobar 0.027 20 0.002 29 0.002 29 0.003 29
Andhra Pradesh 0.640 1 0.818 1 0.893 1 0.915 1
Arunachal Pradesh 0.003 28 0.046 19 0.058 19 0.004 28
Assam 0.057 14 0.037 20 0.049 20 0.138 13
Bihar 0.098 11 0.115 12 0.138 11 0.189 8
Chhattisgarh 0.053 15 0.065 15 0.066 16 0.071 18
Goa 0.019 23 0.015 23 0.015 23 0.013 23
Gujarat 0.145 9 0.121 11 0.153 9 0.160 10
Haryana 0.047 17 0.054 16 0.065 17 0.073 17
Himachal Pradesh 0.026 21 0.028 21 0.030 21 0.034 21
Jammu & Kashmir 0.067 13 0.071 14 0.077 14 0.026 22
Jharkhand 0.048 16 0.052 17 0.067 15 0.075 16
Karnataka 0.307 3 0.408 3 0.424 4 0.532 2
Kerala 0.160 8 0.164 8 0.185 8 0.242 6
Madhya Pradesh 0.106 10 0.127 9 0.152 10 0.160 9
Maharashtra 0.204 7 0.341 5 0.429 3 0.413 4
Manipur 0.004 27 0.004 27 0.004 26 0.005 25
Meghalaya 0.007 25 0.011 24 0.014 24 0.009 24
Mizoram 0.004 26 0.006 26 0.004 27 0.004 27
Nagaland 0.003 29 0.003 28 0.003 28 0.005 26
New Delhi 0.046 18 0.052 18 0.063 18 0.077 15
Orissa 0.211 6 0.220 7 0.264 6 0.237 7
Punjab 0.025 22 0.028 22 0.029 22 0.096 14
Rajasthan 0.098 12 0.125 10 0.138 12 0.149 12
Tamil Nadu & Pondicherry
0.339 2 0.432 2 0.599 2 0.159 11
Tripura 0.010 24 0.009 25 0.013 25 0.034 20
Uttar Pradesh 0.240 5 0.235 6 0.256 7 0.347 5
Uttarakhand 0.033 19 0.108 13 0.122 13 0.045 19
West Bengal 0.252 4 0.407 4 0.418 5 0.437 3
Note: States are ranked based on the FIIND values
- 64 -
In all most all states, the FIIND values have increased over the period, which might imply
that the banks and other financial institutions are doing very well in implementing the
inclusion initiatives of the states and central Government.
The FIIND of Tamil Nadu and Pondicherry is indicating a downward movement. We hope
Tamil Nadu is performing well but due to Pondicherry the index is low. Due to data
unavailability, these two have been clubbed and treated as one state.
Andhra Pradesh, Karnataka, West Bengal, and Uttar Pradesh are the top performers in the
year 2011-12 and the worst performers are Nagaland, Mizoram, Arunachal Pradesh, and
Andaman-Nicober.
Goa has a lower value of FIIND probably because the SHG and Micro finance activity as
indicated by the chosen parameters are lower than that of the other states. It may also be due
to higher urbanization and the inclusion index that captures urban activities might show
higher inclusion status. For instance the CRISIL Inclusix(2013) finds Goa to be one of the
top five performers. Goa’s score is 72 for 2011. The index in this study considers only SHG
and MFI parameters and therefore Goa shows a lower score.
3.4. Financial Inclusion (FIIND) and Reduction in Rural Poverty
Financial inclusion is important for growth and reducing inequality and poverty. In a report on
‘Financial Inclusion Plays vital Role in Reduction of Poverty, Inequality and Stimulation of Job
Creation’, by the World Bank it has been said that the transformative power of financial
inclusion in South Africa should not be underestimated. Improved access to finance by poor
households and micro enterprises can unlock income earning opportunities and self-reliance for
many’.

- 65 -
In this study, we made an attempt to see the correlation between financial inclusion and poverty
reduction. . The state-wise poverty numbers i.e. percentage of population below poverty line are
being taken from RBI Data base for the year 2011-12 and inclusion index is being taken from
our FIIND state-wise index (refer table 5). As FIIND inclusion index is based on SHGs, which
are mostly located in rural areas, we have used the rural poverty numbers in percentage terms.
Table 3.2: Percentage of Population Below Poverty Line in 2011-12
States Rural Urban Combined
Andaman and Nicobar 1.57 0.00 1.00
Andhra Pradesh 10.96 5.81 9.20
Arunachal Pradesh 38.93 20.33 34.67
Assam 33.89 20.49 31.98
Bihar 34.06 31.23 33.74
Chattisgarh 44.61 24.75 39.93
Goa 6.81 4.09 5.09
Gujarat 21.54 10.14 16.63
Haryana 11.64 10.28 11.16
Himachal Pradesh 8.48 4.33 8.06
Jammu & Kashmir 11.54 7.20 10.35
Jharkhand 40.84 24.83 36.96
Karnataka 24.53 15.25 20.91
Kerala 9.14 4.97 7.05
Madhya Pradesh 35.74 21.00 31.65
Maharashtra 24.22 9.12 17.35
Manipur 38.80 32.59 36.89
Meghalaya 12.53 9.26 11.87
Mizoram 35.43 6.36 20.40
Nagaland 19.93 16.48 18.88
New Delhi 12.92 9.84 9.91
Orissa 35.69 17.29 32.59
Punjab 7.66 9.24 8.26
Rajasthan 16.05 10.69 14.71
Tripura 16.53 7.42 14.05
Uttar Pradesh 30.40 26.06 29.43
Uttarakhand 11.62 10.48 11.26
West Bengal 22.52 14.66 19.98
Source: RBI

- 66 -
In our view, a better inclusion in a year may not being results in poverty reduction in the same
year. Here, we have computed the correlation between the poverty numbers for the year 2012
with the FIIND index numbers for the year 2007-08, 2008-09 and 2009-10. The correlation
Matrix is:
Table 3.3: Correlation Matrix: Poverty ,Financial Inclusion
FIIND08 FIIND09 FIIND10 FIIND12
P12 -0.04 -0.04 -0.03 -0.02
Note: P12: Rural Poverty for 2011-12 and FIIND: Financial Inclusion Index for
respective years
The result indicates that there is a negative correlation between the rural poverty numbers and
the financial inclusion, which implies better the inclusion, lower the poverty in the states.
3.5. Concluding Remarks
To sum up in this chapter an attempt has been made to construct a financial inclusion
index(FIIND) for thirty states employing parameters relating to SHG Bank linkage programme
and Micro Finance Institutions for four recent years. The choice of the years is largely driven by
availability of consistent data on chosen parameters. The states like Tamil Nadu, West Bengal,
Maharashtra, Karnataka and Odisha have consistently performed well during the study period,
though there is a little variation in ranks among the states. In all most all states, the FIIND
values have increased over the period barring few exceptions which might imply that the SHG
bank linkage programme along with the Micro Finance institutions have performed well in
financial inclusion initiatives with respect to deposit and credit.
*****

- 67 -
CHAPTER IV
FINANCIAL INCLUSION AND SUPPLY SIDE CONSTRAINTS
: SOME ISSUES AND EVIDENCE
4.1 Introduction
In this chapter the supply side constraints to financial inclusion are discussed in terms of few
cases. To begin with the data on non performing assets(NPA) due to SHG portfolio of banks are
analyzed. Then a case study of interviews of some branch managers of rural public sector
branches is presented to understand the possible bottlenecks from the supply side. A case study
of mobile banking initiative by the State Bank of India called SBITINY is also presented.
Finally, the reasons behind individuals choosing informal sources of borrowing rather than
formal sources are analyzed by conducting a case study of hundred households belonging to low
income groups in two villages of Rangareddy district of Andhra Pradesh.
4.2 SHG-Bank Linkage Programme and Financial Inclusion
In the last two decades, the major institutional innovation in India for improving financial access
and usage for the poor and marginalized sections of the population has been the SHG-Bank
Linkage Programme (SBLP). This was an outcome of pilot projects during the 1980s for
improving access of rural poor to formal institutional financial services. For the banks, it was a
way of reducing their transaction costs by dealing with groups of people rather than individuals,
reducing the credit risks through peer pressure and making people save. Subsequently in the year
1992, the National Bank for Agriculture and Rural Development (NABARD) started a pilot
project of linking SHGs with branches of banks across the country. The project provided a cost-
effective SBLP model for providing financial services to the underserved poor. Being a ‘savings-
first, credit later’ model, credit discipline became a norm for SHGs and ‘social collateral’ made

- 68 -
them bankable. The model was also successful in providing solution to the twin problems faced
by banks, i.e., low recovery of loans in rural areas and high transaction costs in dealing with
small borrowers at frequent intervals. One of the major positive impacts of the SBLP was social
and economic empowerment of the membership.
Table 4.1: SHG-Bank Linkage Progress (numbers in millions)
Particulars FY10 FY11 FY12
Total number of SHGs savings linked with banks 6.95 7.46 7.96
Total savings amount of SHGs with banks (Rs bn) 61.98 70.16 65.51
Total number of SHG credit linked during the year 1.58 1.19 1.15
Total amount of loans disbursed to SHGs during the
year 144.53 145.47 165.34
Total number of SHGs having loans outstanding 4.85 4.78 4.35
Total amount of loans outstanding against SHGs 280.38 312.21 363.40
Estimated number of families covered 97.00 97.00 103.00
Source: Status of Micro Finance in India, NABARD
Despite the noteworthy accomplishments of SHGs (refer table 1), certain issues, such as,
inadequate outreach in many regions, delays in opening of SHG accounts and disbursement of
loans, impounding of savings by banks as collateral, non-approval of repeat loans by banks even
when the first loan was repaid promptly, multiple membership, borrowings by SHG members
within and outside SHGs, adverse consequences of unhealthy competition between NGO
promoted SHGs and Government promoted/subsidy oriented SHGs and limited banker interface
and monitoring continued to affect the programme in many areas. While the basic tenets of the
SHGs being savings led credit product remain true even today, recent developments have given
rise to the need for crucial changes in the approach and design of SBLP to make it more flexible
and client friendly.

- 69 -
423
626
823
1474
2213
2.9 2.92.9
4.7
6.1
0
1
2
3
4
5
6
7
300
600
900
1200
1500
1800
2100
FY08 FY09 FY10 FY11 FY12
in %Rs cr Chart 1: NPA of Bank Loans to SHGs
NPA (Rs cr) NPA (%) {RHS}
The revised NABARD guidelines, popularly known as SHG2 (version 2), have sought to address
some of the shortcomings of the earlier version. The major features of SHG2 are : (a) more focus
on voluntary savings; (b) cash credit system of lending over three to five years cycle to minimize
the problem of inadequate finance and non-availability of repeat loans; (c) enabling creation of
Joint Liability Groups (JLGs) within SHGs to scale up economic activities by more
entrepreneurial members of the group; (d) improving risk mitigation systems by bringing in third
party audit; (e) building second tier institutions; (f) strengthening the self-monitoring mechanism
and (g) meeting the training/capacity building requirements of the SHGs.
4.3. Rising Non-Performing Assets (NPAs) of Bank Loans to SHGs
In the past, a number
of studies quantified
the excellent
repayment
performance of above
90%, which was one
of the driving factors
that influenced banks to actively participate in the programme. However, with fast expansion in
terms of numbers and geographies, delinquencies are creeping into SBLP. As per NABARD data
the Non-Performing Assets of banks against loans to SHGs has gone up from Rs 422.93 crore
(2.9% of NPA to O/S SHG loans) in 2007-08 (1st time banks reported to NABARD) to Rs 1474
crore (4.7% of NPA) in 2010-11 and further deteriorated to Rs 2,213 crore (6.1% of NPA) in
2011-12.
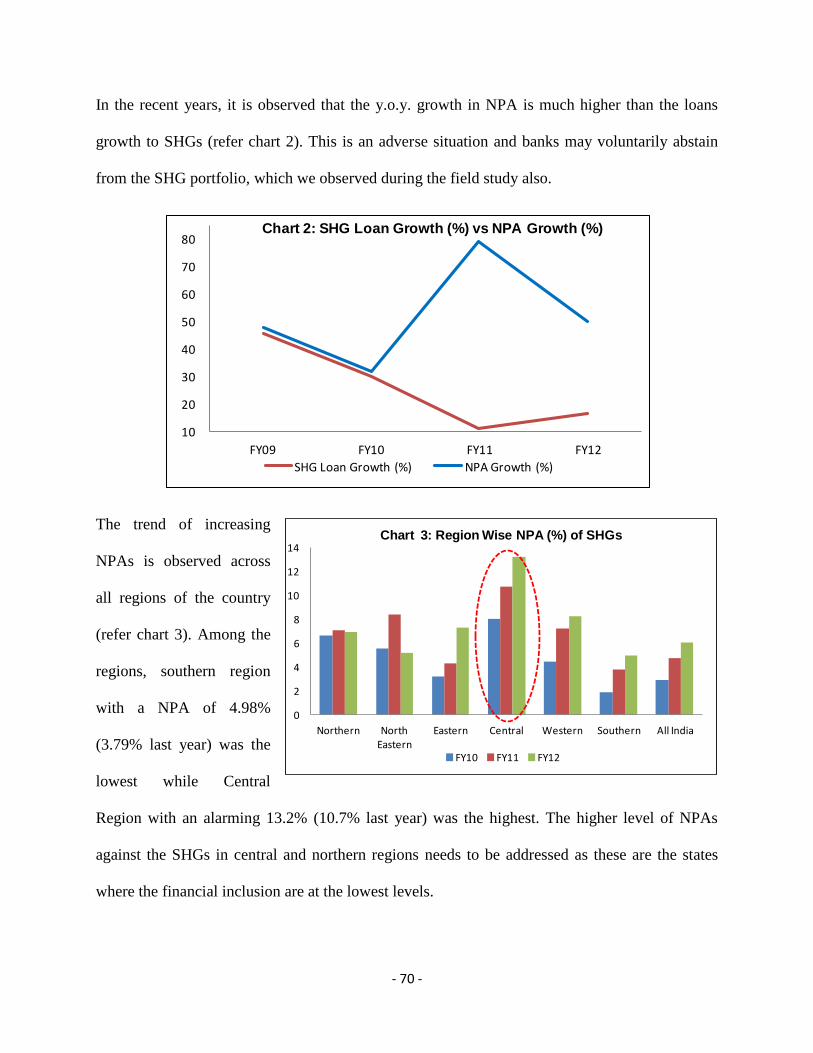
- 70 -
0
2
4
6
8
10
12
14
Northern North Eastern
Eastern Central Western Southern All India
Chart 3: Region Wise NPA (%) of SHGs
FY10 FY11 FY12
In the recent years, it is observed that the y.o.y. growth in NPA is much higher than the loans
growth to SHGs (refer chart 2). This is an adverse situation and banks may voluntarily abstain
from the SHG portfolio, which we observed during the field study also.
The trend of increasing
NPAs is observed across
all regions of the country
(refer chart 3). Among the
regions, southern region
with a NPA of 4.98%
(3.79% last year) was the
lowest while Central
Region with an alarming 13.2% (10.7% last year) was the highest. The higher level of NPAs
against the SHGs in central and northern regions needs to be addressed as these are the states
where the financial inclusion are at the lowest levels.
10
20
30
40
50
60
70
80
FY09 FY10 FY11 FY12
Chart 2: SHG Loan Growth (%) vs NPA Growth (%)
SHG Loan Growth (%) NPA Growth (%)

- 71 -
There is an urgent need to probe the causes for delinquencies in SHG lending for redesigning the
strategies of the SHG movement. Otherwise, the continuously increasing NPAs in this
programme may force bankers to go slow on SHG lending, which in turn may affect the financial
inclusion drive as SBLP is one of the important tools for financial inclusion.
4.3 State Level Analysis on Supply Side Constraints
In the following table the NPA in percentage terms are presented for all states with their ranks
for five years i.e. 2008-2012. The ranking is done in terms of lowest NPA to highest NPA.
STATES FY12 RFY12 FY11 RFY11 FY10 RFY10 FY09 RFY09 FY08 RFY08
Andaman & Nicobar 4.84 9 0.00 1 0.23 1 0 1 11.80 14
Andhra Pradesh 3.46 5 2.02 2 1.29 5 0.5 2 8.01 7
Arunachal Pradesh 16.24 26 6.51 16 3.99 14 5.3 16 122.94 27
Assam 4.59 7 8.31 19 5.29 20 9.8 25 11.40 12
Bihar 6.18 13 4.07 8 5.27 19 7.2 20 8.43 8
Chhattisgarh 5.19 11 9.53 23 6.26 22 8.6 21 2.55 4
Goa 1.13 1 3.59 6 0.84 3 3.1 9 0.10 1
Gujarat 4.80 8 4.60 10 3.19 10 2.5 6 13.45 16
Haryana 6.28 14 3.95 7 5.06 17 4.1 13 17.93 21
Himachal Pradesh 10.38 21 7.31 17 5.12 18 5.9 19 1.67 3
Jammu & Kashmir 3.73 6 4.27 9 5.54 21 2.5 7 1228.20 28
Jharkhand 7.66 17 4.94 11 5.05 16 5.5 17 11.68 13
Karnataka 3.35 4 2.98 5 2.01 6 0.8 3 8.59 9
Kerala 9.04 19 8.61 22 2.52 8 3.5 10 4.84 5
Madhya Pradesh 22.45 28 11.28 25 8.2 24 8.6 22 44.55 26
Maharashtra 8.89 18 7.81 18 4.68 15 5.8 18 14.87 18
Manipur 20.72 27 17.40 27 12.99 28 11.7 27 16.10 20
Meghalaya 33.08 29 8.45 20 10.16 26 18.1 28 40.53 25
Mizoram 5.12 10 52.06 28 16.09 29 0.0 29 6.50 6
Nagaland 12.28 23 14.26 26 12.49 27 11.3 26 25.93 24
New Delhi 16.12 25 5.76 14 0.45 2 4 12 0.20 2
Odisha 11.86 22 6.24 15 3 9 4.2 14 9.20 11
Punjab 5.50 12 5.30 12 3.74 12 2.6 8 2880.50 29
Rajasthan 6.49 15 8.49 21 8.1 23 8.6 23 15.17 19
Tamil Nadu & Pondichery 9.58 20 1193.00 29 3.95 13 3.5 11 13.65 17
Tripura 2.79 2 2.16 3 1.01 4 1.7 4 8.80 10
Uttar Pradesh 12.51 24 11.08 24 8.79 25 9.4 24 21.54 22
Uttarakhand 7.08 16 5.61 13 3.26 11 4.7 15 21.83 23
West Bengal 3.11 3 2.28 4 2.19 7 2.0 5 12.41 15
State Wise Analysis of NPAs against Bank Loans to SHGs
Note: Rank: 1 is good (low NPA %) & Rank: 29 is Bad (high %)

- 72 -
The figures for 2012 show Goa, Tripura, West Bengal, Kerala, Andhra Pradesh and Jammu
Kashmir to be the top five states having lower NPAs with ranks one to five. States having higher
NPAs with ranks 25 to 29 are New Delhi, Manipur, Madhya Pradesh, Meghalaya, and Arunachal
Pradesh. The ranks have fluctuated for the states during the five years of our analysis. It’s a bit
puzzling to see rising NPAs of the SHG portfolio of banks which raises several questions on
sustainability of SHGs towards inclusion efforts. In view of this we conducted a case study of
rural bank branches by having in depth interviews with rural public sector bank branch managers
to understand the reasons behind rising NPAs and other supply side constraints. The following
section presents some of these findings.
4.4. Supply side difficulties: Some Primary Evidence from Bank Branches
The focus of the study being supply side constraints one needs to assess comparatively the
reasons behind success/failure of policy implementation which further provides some insights to
delve into possible improvements in the approach of policy makers towards financial inclusion.
With this objective at hand a case study has been planned wherein branch managers of some
rural branches of public sector banks of Andhra Pradesh and Odisha are being interviewed with
a semi structured questionnaire (given in Appendix-I) to understand the implementation
difficulties of different inclusive policies. The choice of states is driven by different FIIND
values i.e. 1 for Andhra and 7 for Odisha. The NPA ranking has been stable for Andhra Pradesh
varying between 2 to 7. But the NPA ranking for Odisha has declined and it has varied between
3 to 22. The fluctuation in ranks for different years for Odisha calls for further investigation.
Therefore few rural bank branches are chosen in Odisha given the duration of the project i.e. six
months. The choices of districts are driven by relatively low credit deposit ratio with regard to all
commercial banks.
In all interviews are conducted with seven bank branch managers of rural branches of SBI in
Jagatsinghpur and Cuttack districts of Odisha. With conditions of anonymity and with
- 73 -
managers’ consent interviews are conducted to understand the difficulties faced in implementing
inclusion programmes so that supply side constraints can be generalized. It is observed that the
main credit portfolio of these branches is agriculture. However, some branches do have other
business segments like home loan etc., but its share is very negligible. The other portfolios like
pension, insurance is non-existent but branches are selling insurance guarantees to house loan
customers as a combo product. The total credit portfolio of these branches is very low compared
to the deposits. The main reasons of low credit off-take are lack of good quality loan proposal,
and low repayment capacity of the customer. Most of the loans demanded by customers are only
for consumption purposes. The NPA level is very high and is the biggest concern for the officers
in operations.
In SHG linkage programme performance, the branches seem to be doing a great job but due to
shortage of staff they are not able to counsel more people to scale up. In all branches, there is no
specialized officer for agricultural loan. Some executives are concerned about profitability and
transaction cost in such accounts. They are worried about the repayment capacity of the SHG
groups as most of these fall in NPA category due course. Few SHG accounts approach for
second loan to the bank. The NPA seems to be rising because the loans sanctioned are not used
for productive purposes. Branches also fail to monitor proper use of loans due to human resource
constraints. Eventually the NPAs of the current year and fresh loans sanctioned the next year
become the March end phenomenon or target achieving phenomenon. The loans are sanctioned
every year to meet targets like following typical incremental approach. The same takes place on
recovery front too wherein minimal recovery takes place before March end of every financial
year. The branch wise data as reported by the branches are reported which are to be analyzed
with caution. The effective inclusion doesn’t take place because the promotional role is missing

- 74 -
out here in nurturing the SHGs and their loans. The dropout rate of existing SHGs in seeking
fresh loans seems to be high. To sum up one finds the branches trying hard to implement
policies flowing from the top without a resilient mechanism developed to handle the realities.
The problem also gets aggravated due to wrong loan seeking attitudes on part of SHGs and
interference of local political and social institutions.
The managers are of the view that KYC requirements for no-frill accounts are not problematic
but the human resource is a constraint. As per the statistics, the progress of no-frill account is
very low, as Bank now removes the minimum balance for all accounts to zero. In rural branches
the KYC norms also liberalized, so, there is no need for a separate account termed as no frill,
which should not exceed deposits of Rs 50,000 and credit of Rs 100,000 in a year. However, as
per RBI and Govt. regulations the Bank is opening some accounts in these schemes.
The technological initiatives made by Government and RBI to include more persons into the
banking channels is not successful in these areas, due to low knowledge of technology and also
BALIKUDA 4061 492 260 7.76 38.16 51 19.55 2.16 11.05 324 2.27 490 598.34 814 600.6
BHITAR ANDHARI 1698 945 532 45.4 428.95 170 124.98 30.32 24.26 71 0 2805 964.08 2876 964.08
ERSAMA 2405 357 136 3.26 11.63 8 4.56 0 0 0 0 320 287.41 320 287.41
KUJANGA 3002 400 131 12.31 49.24 45 13.54 2.06 15.21 1 0.8 65 120.55 66 121.34
MANDASAHI 2273 770 348 61.12 470.71 106 49.84 31.86 63.92 0 0 147 166.63 147 166.63
RAGHUNATHPUR 3240 730 357 22.6 165.04 71 33.74 10.58 31.36 380 3.06 213 352.19 593 355.25
RAHAMA 5146 1846 596 51.18 944.88 181 90.77 58.96 64.96 0 0 6 4.29 6 4.29
SAMPUR SAB 2074 874 348 36.34 317.63 229 94.33 42.7 45.27 522 516.32 990 447.25 1512 963.57
TOTAL
No Amt No Amt No Amt
No of
Acs
Amt of
loan
NPA
Amt
NPA
%
BC BRANCH
Branch Wise Data of Jagatsingpur District of Odisha : March 2013 (Rs lakh)
Branch Name Total
Deposits
Total
Advances
Agri.
Loan
Total Branch NPAs SHG Loan NO FRILL A/C ( amt in thousands)
%age Outstanding
ADIBATLA 1818 2119 1677 3.08 65.33 812 1119.45 6.57 0.59 0 0.00 3 1.38 3 1.38
DABILPUR 1459 2147 1404 7.49 160.87 296 604.96 4.29 0.71 1055 32.24 63 99.08 1118 131.32
IBRAHIMPATNAM 1560 589 481 2.43 14.31 0 0.00 13 6.25 13 6.25
KOMPALLE 4538 56796 0 0.01 16.74 7 0.48 2 0.50 9 0.98
NAGARAM 2977 1121 30.00 0.00 0.00 0 0.00 1 0.17 1 0.17
TURKAYAMJAL 1113 1008 285 0.54 5.49 1371 251.54 11 5.6 1382 257.14
NA
TOTAL
No Amt No Amt No Amt
No of
Acs
Amt of
loan
NPA
amoutNPA %
BC BRANCH
Branch Wise Data of Rangareddy District of Andhra Pradesh : March 2013 (Rs lakh)
Branch Name Total
Deposits
Total
Advances
Agri.
Loan
Total Branch SHG Loan NO FRILL A/C ( amt in thousands)
%ageOutsta
nding
- 75 -
lack of ATMs. BC model is also not so successful due to low incentives and better position of
branches to the villages. In mobile banking and IMPS channel, the progress is also negligible.
The customers and the branch level executives do not seem to have an idea of Interbank Mobile
Payment Service (IMPS) developed and operated by National Payment Corporation of India
(NPCI).
As evident in the questionnaire the primary survey of branch level executives focuses on supply
side constraints with regard to technology bottleneck, top-down approach in policy making
resulting in implementation issues on ground, process/procedure related bottlenecks, and
promotional activities by branches to ensure proper utilization of the service rendered especially
those of loans.
4.5 Cost Effectiveness of Banking Channels for Financial Inclusion
Five alternate channels for transactions ATM, internet, mobile, call centre and POS, have all
reached critical mass in the Indian market and are poised for rapid development in terms of depth
of penetration and quality of service. We have estimated (SBI Research Report) estimated that
mobile phones will lead the way in the future. India has 900 million plus mobile subscribers, but
only 240 million individuals with bank accounts. For a population of 1.2 billion, this translates
into 75% having a mobile phone and only 20% having a bank account. Hence, financial
inclusion using mobile phones is a key focus area.
Innovation in mobile phone technology is taking place at a rapid pace. It is conceivable that
within next few years we will have cheap phones with Near Field Communication (NFC)
technology built in to facilitate Peer-to-Peer (P2P) money transfer almost instantaneously. At this
stage it is also conceivable that most of the payers at POS will be using mobile phones instead of
cards to make payments. Many small daily P2P transactions like payments to sundry vendors

- 76 -
will move from cash to mobile phone. Given that mobile transactions cost a fraction of ATM or
branch transaction, the enormous productivity enhancement that will accrue to banking system
can hardly be overemphasized. The advent of 3G in mobile telephony in India can open many
avenues for richer service delivery. Priority customers, who are otherwise not viable for a
dedicated relationship manager, can get “face to face” financial planning advice on their mobile
devices from a set of centrally located advisors. According to the Report, Internet and mobile
banking channels of banking delivery are the most cost effective (< 0.5 paisa) mode for the
banks, while branch services provide the most qualitative services and are instrumental in getting
the customers. But branch banking is high-cost as banks are incurring around Rs 40-60 for each
transaction. The most efficient mode of delivery is ‘online BC, ICT led models’, which shows
high quality customer experiences and low cost for banks, as shown below:
A report by the BCG report, internet and mobile banking are most cost effective (<50 paisa per
transaction) while branch services are instrumental in getting customers. But branch banking is
high-cost as banks incur around Rs 40-60 for each transaction. The most efficient mode of
delivery is ‘online BC, ICT led models’, which offers high quality of customer services also.
Source: Source: Being Five Star in Productivity, BCG, FICCI and IBA Report, August 2012

- 77 -
4.6. Mobile Banking: A Case Study of SBI TINY
In this section a case of SBI TINY, a mobile based money remittance service is presented to
highlight a positive aspect of supply side towards inclusion and also to see how specific factors
like role of an agent/individual play an important role in taking inclusion forward. The behaviour
of the users of this service is compared with a group of users of any other cash management
service to know the differences. The case study is supplemented with funding from a project
carried out by Acharya et al (2012) on “Financial Literacy, Technological Acceptance, and
Financial Inclusion: A study of Urban Users in Hyderabad”. Of late mobile banking has drawn
attention of all players all over the world. The following box presents some of the successful
stories across countries.
Mobile Banking: Examples
South Africa Philippines Kenya Zambia
Name of the
service (brand)
Wizzit, MTN Mobile Money SMART Money,
G-Cash
M-Pesa Celpay
Starting Year 2005 2000, 2004 2005 2002
Model Driver JV of Bank and Third Party
(Wizzit); Bank and Telecom
Company (MTN)
Telecom
Company
Telecom
Company
Third Party
Who Can Use Unbanked (Wizzit);
Banked/Unbanked (MTN)
Unbanked Unbanked Banked
Cash Access
Mode
Bank and/or third party
(Wizzit); Bank (MTN)
Bank Bank and
Telecom
Company
Network
Telecom
Company
Network
Deposit
Ownership
Bank Bank Bank Telecom
Company
Documentation
Needed
Valid ID (Wizzit); No ID for
Unbanked and Valid ID and
Address Proof for Banked
(MTN)
Valid ID
(SMART
Money, G-cash)
Valid ID Valid ID
Primary Area
Served
Wizzit: Rural and Semi-
Urban
MTN: Urban
G-Cash: Rural
SMART money:
Rural and Urban
Both Rural
and Urban
Urban

- 78 -
Fee Structure
(deposit)
Wizzit: 1 % of the amount
MTN: bank dependent
1 % of the
amount
Nil Not Free
(details N/A)
Fee Structure
(withdraw)
Wizzit: Fixed Charges
MTN: bank dependent
SMART: fixed
ATM charges,
G-Cash (1% of
the amount)
Based on the
amount
Not Free
(details N/A)
Money sending
to non-users
Wizzit: Yes
MTN: partial (select
agents/subscribers)
No Yes No
Money
receiving from
non-users
Wizzit: Yes
MTN: partial (select banks in
select countries)
SMART: Yes,
G-Cash: No
No No
Account
Opening Fee
Wizzit: Fixed amount
MTN: bank dependent
Nil Nil Nil
Source: Adapted from Mishra Vishal and SS Bisht(2013), “Mobile Banking in a Developing Economy: A Customer
Centric Model for Policy Forumation”, Telecommunications Policy, 37, 503-514.
Brief on the SBI TINY Services
The State Bank of India, with its 16,000+ branches in rural and urban India, and ‘A Little World’
(ALW) have launched a mini banking system called ‘SBI Tiny’ reaching beneficiaries at their
door step. The SBI Tiny card provides easy banking services for underprivileged
communities. For this programme the SBI ties up with NGOs that play the role of ‘Customer
Service Providers’ (CSP) or rather work like a local branch. The aim of this scheme is to cover
as many of the poor unbanked population in the country as possible. The SBI Tiny account does
not require `KYC` (or Know Your Client) documents and can be opened with zero balance. In
this account one can deposit or withdraw between Rs.10/- to Rs.10,000/- the upper limit for this
account is Rs.50,000/-. The SBI Tiny card provides more accessibility and customer trust,
making it easier to build relations with its customers. This card which functions like a normal
savings bank account, helps to encourage and further savings habits. It also offers easy “Money
Transfer Service” to anywhere in India. ZERO-Mass a NGO is playing the role of a Business
Correspondent, with an aggregator account at SBI. ZERO –Mass also coordinates the Local

- 79 -
level programs with local NGOs and District Administration. It also coordinates activities
relating to aggregation of Customer Service Points, Cash Management Service and MIS tools to
CSPs, Help Desk in local languages for Customer Service Points, Hands-on Operator Field
Training for, Enrollment of customers, Financial Inclusion Transactions, Non-Banking
Transactions etc. A Little World is the technology partner which is responsible for Front-end
and back-end technology, 24x7 operations and system maintenance, Enrollment and
Personalization system for issuance of cards, MIS and Reporting., Technology support to
Business Correspondents with a focus on Increasing the viability and sustainability of the
project.

- 80 -
THE DATA AND RESPONDENTS
The unit of analysis in this case study is the end user of SBI TIMY money remittance
service in Hyderabad urban. The samples of 300 mobile based remittance users are drawn from
the users1 of this new initiative from the urban dwellers of Hyderabad who are residing in the
areas where the SBI TINY services are introduced. Another 300 users are treated as the base for
the study as those who do not use any of these services but might use any other cash
management service.
The respondents for the study are identified by the investigators and they are interviewed at their
residences or points of service use. Informed consent is obtained in each case.
1 New for the consumer. It is important to note that the service might have been in existence but the respondent has
not used it for himself.

- 81 -
Measures and Statistical analysis
A set of simple questions are developed to measure literacy focusing on numeracy part of
the literacy. Other items are used to operationalize the constructs mainly adapted from previous
research. These items relate to financial and social empowerment and service specific quality of
life. Scores for financial literacy are generated by filtering the right and wrong answers to the
questions asked in these sections of the questionnaire. Other constructs are measured using
multiple items and on a five-point scale (e.g. 1=strongly disagree; 5= strongly agree).
In our sample we have interviewed 300 users of SBI TINY money remittance services and 300
users of other cash management services from different areas of urban Hyderabad.
Results: Mean Scores
Control group SBI Tiny
Financial Literacy 5.99 6.10
Empowerment 6.16 6.25
Service specific quality of life 97.26 97.43
As evident in the box above users of SBI TINY possess higher scores in financial literacy,
empowerment, and service specific quality of life compared to the control group that doesn’t use
this particular service. This preliminary evidence is in favour of transformation in quality of life
when appropriate financial service is introduced like SBI TINY which includes more people. The
interactions with the users also reveals that remitting money through this mobile enabled
technology saves time and transaction cost. The specific factor that is observed in the field is
due to the individual with a commitment to take this service to as many as possible. This is
observed in the Balanagar branch of SBI TINY and with the agent Mr Satyanarayana.
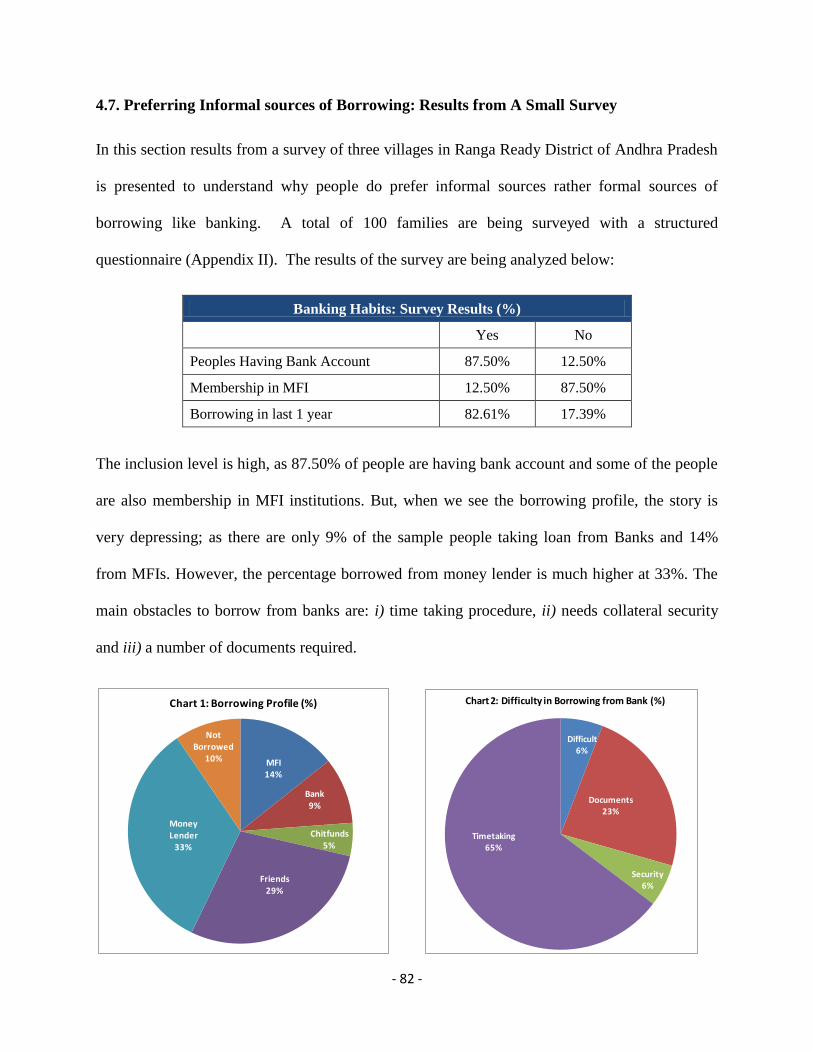
- 82 -
4.7. Preferring Informal sources of Borrowing: Results from A Small Survey
In this section results from a survey of three villages in Ranga Ready District of Andhra Pradesh
is presented to understand why people do prefer informal sources rather formal sources of
borrowing like banking. A total of 100 families are being surveyed with a structured
questionnaire (Appendix II). The results of the survey are being analyzed below:
Banking Habits: Survey Results (%)
Yes No
Peoples Having Bank Account 87.50% 12.50%
Membership in MFI 12.50% 87.50%
Borrowing in last 1 year 82.61% 17.39%
The inclusion level is high, as 87.50% of people are having bank account and some of the people
are also membership in MFI institutions. But, when we see the borrowing profile, the story is
very depressing; as there are only 9% of the sample people taking loan from Banks and 14%
from MFIs. However, the percentage borrowed from money lender is much higher at 33%. The
main obstacles to borrow from banks are: i) time taking procedure, ii) needs collateral security
and iii) a number of documents required.
MFI14%
Bank9%
Chitfunds5%
Friends29%
Money Lender
33%
Not Borrowed
10%
Chart 1: Borrowing Profile (%)
Difficult6%
Documents23%
Security6%
Timetaking65%
Chart 2: Difficulty in Borrowing from Bank (%)

- 83 -
Easy12% No-risk
6%
No-security
6%
Timely76%
Chart 3: Why prefer informal Source (%)The survey found that people are
borrowing from informal sources mainly
due to timely and easy availability of
money at their rainy day. The people are
not much bothered about the interest rate
offered by the informal sources, though it
is higher than formal channels. Easy,
timely and collateral free loans are
preferred to bank loans by the borrowers
even in these surveyed areas that are not
far from bank branches. This small survey
might go against the macro figures arrived
in earlier chapters but it speaks volume of
efforts warranted further towards financial inclusion.
4.8. Concluding Remarks
This chapter attempted a discussion on supply side constraints focusing on three issues. First,
rising NPAs on SHG portfolio of banks was traced for four different years for thirty states. The
fluctuating NPA for different states was substantiated by the field observations and interviews of
rural bank branch managers. Secondly, the case study of SBI TINY mobile remittances sketched
a positive picture of inclusion. Lastly, the preference for informal sources by borrowers from
villages and the factors behind the same was discussed based on a primary survey of 100
households from 2 villages of Rangareddy district of Andhra Pradesh.
*****

- 84 -
CHAPTER V
SUMMARY, CONCLUSION & POLICY SUGGESTIONS
5.1. Introduction
Of late the debate on financial inclusion has gained momentum all over the world. India has
been no exception to the debate. There has been an explosion of efforts towards financial
inclusion by all the stakeholders including the Govt., and non-government. Given the vast need
for financial inclusion in this populous country intellectual efforts to understand the problems
from both demand and supply sides have also been undertaken in different forms including
research. The present study is small step in this direction which is more of an introspection to
delve into critical issues relating to financial inclusion in India. Given the time of about six
months the study uses both secondary data and some primary evidence to answer an overarching
question i.e., “Has financial inclusion happened in India?”.
5.2. Findings of the Study
The Indian financial sector is primarily dominated by the banking industry, as they hold around
75% of the financial assets of the system. So, banks play a critical role in promoting the financial
inclusion in the country, as we have followed the bank-led model to financial inclusion. In this
report, we made an attempt to address both the demand side and supply side issues relating to
financial inclusion. In chapter II, a critical review of all the efforts made by Government, RBI,
IRDA, NABARD and PFRDA is being made. A summary of the financial inclusion plan (FIP) of
banks in the last 5-years is also attempted. The numbers show that the efforts to financial
inclusion are achieved to some extent in general and in savings and credit in particular.
To analyze the inclusion at the state level, we have constructed a Financial Inclusion Index
(FIIND) state-wise by taking the annual data set of 30 Indian states on the SHG Bank Linkage

- 85 -
programme and Micro Finance Institutions (MFIs). Data on number of SHGs having savings
accounts, number of SHGs with loan disbursements, SHG savings, SHG loans, number of MFIs
and MFI loan outstanding are collected for available number of years i.e. 2007-08, 2008-09,
2009-10 and 2011-12. The data on SHG related variables are collected from annual reports of
NABARD. Data on MFIs are collected from the state of the sector reports on Micro finance in
India published by Sage India and The Bharat Microfinance report-quick data 2012. To construct
the index, we have estimated here with the multi dimensional approach discussed in Sarma
(2012). The index of inclusion in the range of 0 to 1 implies, higher the index value, better is
inclusion. The results shows that Andhra Pradesh is placed at the No 1 position in all the years
but the level of inclusion is being increased over the year from FY08 to FY12. The states like
Tamil Nadu, West Bengal, Maharashtra, Karnataka and Odisha have consistently performed well
during the study period, though there is a little variation in ranks among the states. The north-
eastern states are under performed as the index is at a very low level. The data also substantiates
such finding since the level of banking facilities have not penetrated well. There is very little
number of SHGs in these states. In all most all states, the FIIND values have increased over the
period, which might imply that the banks and other financial institutions are doing very well in
implementing the inclusion initiatives of the states and central Government. However, the FIIND
of Tamil Nadu and Pondicherry is indicating a downward movement. We hope Tamil Nadu is
performing well but due to Pondicherry the index is low. Due to data unavailability, these two
have been clubbed and treated as one state.
Further, to see the real impact of financial inclusion on the rural poor people, we looked the rural
poverty numbers for the year 2011-12 (data available). It shows an improvement in the last five
years. To analyze this empirically, we computed the correlation between the estimated Financial

- 86 -
Inclusion Index (FIIND) with the rural poverty with a lag. The result indicates that there is a
negative correlation between the rural poverty numbers and the financial inclusion index. So,
better inclusion may lead to lower poverty numbers.
The focus of the study being supply side constraints one needs to assess comparatively the
reasons behind success/failure of policy implementation which further provides some insights to
delve into possible improvements in the approach of policy makers towards financial inclusion.
With this objective at hand a case study is done wherein branch managers of some rural branches
of public sector banks of Andhra Pradesh and Odisha are being interviewed with a semi
structured questionnaire to understand the implementation difficulties of different inclusive
policies. The choice of states is driven by different FIIND values i.e. 1 for Andhra and 7 for
Odisha. The choices of districts in these two states are driven by relatively low credit deposit
ratio with regard to all commercial banks.
In our visit to the rural branches of different banks in Jagatsinghpur district of Odisha, it is
observed that the main credit portfolio of these branches is agriculture. However, some branches
do have other business segments like home loan etc. but its share is very negligible. The other
portfolios like pension, insurance is non-existent but branches are selling insurance guarantees to
house loan customers as a combo product. The total credit portfolio of these branches is very low
compared to the deposits. The main reasons of low credit off-take are lack of good quality loan
proposal, and low repayment capacity of the customer. Most of the loans demanded by
customers are only for consumption purposes. The NPA level is very high and is biggest concern
for the officers in operations.
The case study of SBI TINY mobile remittances sketched a positive picture of inclusion which
showed higher financial literacy, service specific quality of life and empowerment for users of
- 87 -
this service compared to a control group having similar demographic profile using any other cash
management service. Lastly, the preference for informal sources by borrowers from villages and
the factors behind the same was discussed based on a primary survey of 100 households from 2
villages of Rangareddy district of Andhra Pradesh. It was found that the rural population still
prefers informal sources due to easy and timely available of credit.
5.3 Policy Suggestions
The following policy recommendations are made without any tall claims on findings from the
current study. Having analyzed the secondary data and some primary evidence one finds that,
a) Credit is still inadequate as delivered by currently available formal sources and credit is on
rigid terms that have affected the credit seeking behavior from formal sources.
b) Demand exists for services that require minimum documentation and provide for specific
needs in terms of amount, repayment flexibility and timeliness of availability.
c) The ability to build formal credit history is an important factor and there should be a way to
link this with efforts made to bring the excluded into the mainstream.
d) The field observations are also due to trust winning ability of informal sources even with
existence of formal sources. The informal sources have been able to attract potential
borrowers by luring them with easy, collateral free and timely credit.
e) An acceptable technology with low transaction cost like mobile based financial services seem
to be transforming lives as evidenced in our SBI TINY case study. Hence attempts should be
made to introduce technology that are less expensive for the user but socially and culturally
acceptable.
f) Creating awareness about products that individuals think they do not need currently or are
not demanding because of the lack of awareness about their benefits can play an important

- 88 -
role in impacting demand patterns for certain products such as pension and micro insurance
products. Accordingly, the weightage of these products would change with change in demand
affected by the increased levels of awareness. This change in demand may be a more suitable
variable to measure than the current level of awareness, which is hard to quantify using
household surveys.
g) There is a need to understand if usage can be linked with demand at all instances. For
example, an urban slum client who is extremely individualistic might, only out of
compulsion or lack of any other available product design, end up using the product that
requires group collateral. The amount of the loan remains fixed and does not change with
changing needs of the customer, leading to inadequate credit. Thus, exiting from the money
lender option becomes even harder. This has implications for the existing product design
processes.
h) Understanding individuals’ hierarchy of credit needs is also important to find out what
weightage would they give to various products and services.
To sum up the answer to the question “Has financial inclusion happened in India?” the study’s
answer would be “Yes to some extent” but lot more to be achieved in terms of correcting both
formal and informal institutions and institutional practices. The experiments by both the
Government and Non-government. have left a lot to build further, innovate and include the under
privileged.

- 89 -
References
Acharya Debashis and Shailendra Singh Bisht(2012), ‘Factors affecting Uptake of Micro
insurance in Odisha: Evidence from a field Survey’, paper presented in International Workshop
on Inclusive Finance, XLRI, Jamshedpur, March 1-3, 2012.
Acharya Debashis, K Ramulu, and B Kamaiah(2013), ‘Financial Literacy, Technological
Acceptance and Financial Inclusion: A Study of Urban Users in Hyderabad’, paper presented in
International Workshop on Inclusive Finance, XLRI, Jamshedpur, Sept,13-15, 2013.
Alam Asad (2013): ‘Financial Inclusion Plays vital Role in Reduction of Poverty, Inequality and
Stimulation of Job Creation’, World Bank
Ananth Bindu, C. Gregory, and R Stephen (2012): ‘The Pursuit of Complete Financial Inclusion:
The KGFS Model in India’ PP 1-20, CGAP.
Arunachalam M S (2011), ‘The Journey of Indian Microfinance: Lessons for the future’,
Chennai: Aapti Publications’
Assibey O. (2009): ‘Financial Exclusion: What Drives Supply and Demand for Basic Financial
Services In Ghana?’, Saving and Development Journal, pp 207-238, Vol. 33, No 3, 2009.
Beck, T., Demirguc-Kunt A. and Martinez Peria, M. S. (2007): ‘Reaching out: Access to and use
of banking services across countries’, Journal of Financial Economics, vol. 85, PP 234-266.
Bhatia Navin and Chatterjee Arnav (2010): ‘Financial Inclusion in the Slums of Mumbai’
Economic & Political Weekly, 23-26, vol xlv no 42.
Chakrabarty K. C. (2011): ‘Convergence of Mobile Banking, Financial Inclusion and Consumer
Protection-Trend’, Reserve Bank of India, remarks at the FINCONET meeting at Headquarters,
Paris.
Chakrabarty K C (2011): ‘Financial Inclusion and Banks: Issues and Perspectives’, Reserve
Bank of India, Speech delivered at FICCI-UNDP Seminar on “Financial Inclusion: Partnership
between Banks, MFIs and Communities” at New Delhi on October 14 2011.
Chakrabarty K C (2012): ‘Financial Inclusion - Issues in Measurement and Analysis’, Reserve
Bank of India, Speech delivered at the BIS-BNM Workshop on Financial Inclusion Indicators at
Kuala Lumpur on November 5, 2012.

- 90 -
Chakrabarty K C (2012): ‘Revving up the Growth Engine through Financial Inclusion’, Reserve
Bank of India, Speech delivered at the 32nd SKOCH Summit held at Mumbai on June 6, 2013.
Chakrabarty K. C. (2011): ‘Financial Inclusion and Banks: Issues and Perspectives’, Reserve
Bank of India, addressed at UNDP Seminar, New Delhi.
Chakrabarty K.C (2009): ‘Furthering Financial Inclusion through Financial Literacy and Credit
Counseling’, Reserve Bank of India, Speech delivered at the launch of Federal Ashwas Trust on
November 30, 2009 in Kochi, Kerala.
Chakrabarty K.C (2009): ‘Technology, Financial Inclusion and Role of Urban Cooperative
Banks’, Reserve Bank of India, Speech delivered at the Foundation Day and Inauguration of the
‘Core Banking Solution Project’ of the A.P.Mahesh Co-op Urban Bank Ltd. on August 9th, 2009
at Hyderabad.
Chakrabarty K.C (2010): ’Financial Deepening by putting Financial Inclusion Campaign into
Mission Mode’, Reserve Bank of India, Speech delivered at the 23rd Skoch Summit on 17 June
2010 in Mumbai.
Chakrabarty K.C (2011): ‘Convergence of Mobile Banking, Financial Inclusion and Consumer
Protection-Trend,’ Reserve Bank of India, Speech delivered at the Financial Consumer
Protection Network (FINCONET) meeting‐OECD Headquarter, Paris on November 09,2011.
Chakrabarty K.C (2011): ‘Financial Inclusion and Banks: Issues and Perspectives,’ Reserve
Bank of India, Speech delivered at the FICCI-UNDP Seminar on “Financial Inclusion:
Partnership between Banks, MFIs and Communities” at New Delhi on October 14 2011.
Chakrabarty K.C (2012): ‘Financial Inclusion – Issues in Measurement and Analysis,’ Reserve
Bank of India, Speech delivered at the BIS-BNM Workshop on Financial Inclusion Indicators at
Kuala Lumpur on November 5, 2012.
Chakrabarty K.C (2012): ‘ICT Based Financial Inclusion - Carving a New path through
Innovation,’ Reserve Bank of India, Speech delivered at the Inaugural Plenary session of the 7th
Banking TECH Summit 2012 on June 28, 2012 at Mumbai.
- 91 -
Chakrabarty K.C (2012): ‘Social Banking and Finance - Opportunities in Inclusion,’ Reserve
Bank of India, Speech delivered at the 2nd FT‐YES Bank International Banking Summit at
Mumbai on October 15, 2012.
Chakrabarty K.C (2012): ‘The First Mile Walk into Financial Inclusion - Thinking Differently,’
Reserve Bank of India, Speech delivered at the Inaugural Session of the Financial Inclusion
Conference 2012 “The First Mile Walk into the Financial System” organized by FICCI and
Sa‐Dhan at New Delhi on August 7, 2012.
Chakrabarty KC (2009): ‘Financial Deepening by Putting Financial Inclusion Campaign into
Mission Mode’, Reserve Bank of India, Keynote address at 20th SKOTCH Summit, Mumbai.
Chakravarty R. Satya, and Pal Rupayan (2010): ‘Measuring Financial Inclusion: An Axiomatic
Approach’, IGIDR, 1-36.
Chattopadhyay S (2011): ‘Financial Inclusion in India: A Case Study of West Bengal’, RBI
Working Paper Series, 8/2011.
CRISIL (2013): ‘Crisil Inclusix - An index to measure India’s progress on Financial Inclusion’,
CRISIL Inclusix, 2013, pp 9-95
Deepti K C , Amita, Debashis Acharya, Indrani R.C., Lakshmi K., Susmita M. and
Veerashekarappa (2012): ‘Effect of Reserve Bank of India (RBI) Regulations on Public Sector
Lending for Micro Finance Institutions (MFIs)’, Centre for Microfinance, IFMR.
Deepti K.C. (2012): ‘Financial Inclusion - Government promoted initiatives’, Center for Micro
Finance, IFMR Research.
Dittus P. and Klein M (2011): ‘On Harnessing the potential of financial inclusion’, Monetary and
Economic Department, pp 1-25.
Gokarn Subir (2010): ‘Financial Inclusion: A Consumer Centric View,’ Reserve Bank of India,
Speech delivered at Narayanan Memorial Lecture, Sastra University, Kumbakonam on March
21, 2010
Handoo J (2012): ‘Beyond Hoopla: Simply Financial Inclusion’, The Journal of Indian Institute
of Banking & Finance 2012.

- 92 -
Kamath Rajalaxmi (2007): ‘Financial Inclusion vis-a-vis Social Banking’ Economic & Political
Weekly, 1334-1335.
Kanther P. and Nagabhushan S. (2012): ‘Workshop on Measuring Financial Inclusion from the
Demand Side’ CAFRAL, PP 1-12.
Khan H R (2011): ‘Financial Inclusion and Financial Stability: Are they two sides of the same
coin?’ Reserve Bank of India, speech delivered at BANCON 2011.
Khan Harun R. (2012): ‘Financial Inclusion & Payment Systems: Recent Trends, Current
Challenges and Emerging Issues’, Reserve Bank of India, Speech delivered at BANCON 2012
organized by the Bank of Maharashtra & the Indian Banks’ Association on November 25, 2012
at Pune.
Khan Harun R. (2012): ‘Issues and Challenges in Financial Inclusion: Policies, Partnerships,
Processes & Products,’ Reserve Bank of India, Speech delivered at the symposium on “Financial
inclusion in Indian Economy” organized by the Indian Institute of Public Administration,
Bhubaneswar on June 30, 2012.
Mahadeva M (2009): ‘Understanding Financial abandoning from a micro perspective : policy
responses to promote inclusion in India’ ISEC, 405-430.
Majumdar C. and Gupta G (2013): ‘Financial Inclusion in Hooghly’ Economic & Political
Weekly, 55-60, Vol XLVIII no 21.
Mishra Vishal and S S Bisht(2013), “Mobile Banking in a Developing Economy: A Customer
Centric Model for Policy Forumation”, Telecommunications Policy, Vol37, 503-514.
National Bank for Agriculture and Rural Development (NABARD): ‘Status of Micro Finance in
India, 2007-08, 2008-09, 2009-10, 2010-11, 1011-12
Pal Rama and Pal Rupayan (2012): ‘Income Related Inequality in Financial Inclusion and Role
of Banks: Evidence on Financial Exclusion in India’ IGIDR, 1-44.
Pokhriyal A.K. (2011): ‘A Critical Analysis of SHG-Bank Linkage Program in India’,
International Journal of Economics and Finance, 255-262, Vol. 3, No. 2
Pradhan C. Narayan., (2013): ‘Persistence of Informal Credit in Rural India: Evidence from ‘All-
India Debt and Investment Survey’ and Beyond’ RBI Working Paper Series, 1-21.
- 93 -
Puhazhendhi V. (2012): ‘Microfinance India State of the Sector Report 2012, PP 1-208.
Rangarajan C. (2008): ‘A Hundred Small Steps: Report of the Committee on Financial Sector
Reforms’, Planning Commission, Government of India, New Delhi.
Rangarajan Committee (2008): ‘Report of the Committee on Financial Inclusion’, Government
of India.
Reserve Bank of India (2013): ‘Annual Report 2012-13, Reserve Bank of India, July 2013.
Reserve Bank of India (2013): ‘Basic Statistical Returns of Scheduled Commercial Banks in
India’, Vol 39, Reserve Bank of India, Mumbai, March 2013.
Reserve Bank of India (2013): ‘Quarterly Statistics on Deposits and Credit of Scheduled
Commercial Banks’, Reserve Bank of India, Mumbai, September 2013.
Sarma Mandira (2012): ‘Index of Financial Inclusion Conceptual Issues’ Working Paper, Centre
for International Trade and Development, Jawaharlal Nehru University, New Delhi.
Srinivasan N. (2009, 2010 & 2011): ‘Microfinance in India: State of the Sector Report’. Sage
Publications India Pvt Ltd, New Delhi.
Subbarao D. (2009): ‘Financial Inclusion: Challenges and Opportunities’, Reserve Bank of India,
Speech delivered at the Bankers’ Club in Kolkata on December 9, 2009.
Thorat Usha (2008): ‘Financial Inclusion and Information Technology’, Reserve Bank of India,
Speech delivered at ‘Vision 2020 - Indian Financial Services Sector’ hosted by NDTV at
Mumbai on 12.09.2008

- 94 -
Appendix-I
Financial Inclusion: Why Not Happened
Research project funded by Indian Institute of Banking and Finance
Principal Investigator: Debashis Acharya, Associate Professor, School of Economics
Co-Investigators: Tapas Kumar Parida, Economist, Corporate Group, SBI, Mumbai.
Respondent’s Consent
Consent: We are doing a research survey on supply side constraints faced by senior/middle level
managers on their efforts towards financial inclusion initiatives. We would like to ask you some
questions to understand the supply side problems.
Your participation is entirely voluntary and this form will take about 1 hour. You can choose not to
answer a question or stop the interview at any time. The information you share with us will be kept
fully confidential and will be part of the report we will be submitting to IIBF. All interview
recordings will be stored in a secure work space until 1 year after that date.
Will you answer our questions?
Yes……………….1 No………………..2 TERMINATE
1. What are the different financial inclusion initiatives implemented by your branch.
Names of the schemes:
2. What is the total amount of credit disbursed under these schemes (with scheme wise
break up)?
3. As per RBI data your branch falls under those having low credit deposit ratio and low
disbursement branches. What is the reason behind this? What are the hindrances to
mobilize deposits? What are the hindrances to advance credit in general and to low
income groups in particular?
4. How many no frill accounts you have created as of today?
5. How many SHGs are financed by your branch?

- 95 -
6. How many SHGs have been advanced second or third loans? How is their repayment
habit/performance? Do you follow fixed / flexible repayment schedule for them? Do you
monitor their activities for which loan are sanctioned?
7. Have you approached SHGs to finance from your side but failed to advance loans under
different schemes?
8. If so (yes to 7) what might be the reason? High interest rates/lack of ideas to utilize the
loan/any other reason?
9. Do you have relationship officers to facilitate such loans like banks have sales team in
urban areas for retail loans?
10. Have you taken up counseling potential customers for such activities? If no why?
11. Are there any other players in this area attracting such customers by providing credit?
12. Have you been asked to implement the Malegam committee recommendations? Has it
been helpful in your FI initiative? Or it has created problems for you?
13. Do you think technology has a greater role in FI efforts?
14. Is current echnology not enough/appropriate for you at this moment for FI initiatives?
15. Do you think you are lagging because others are appropriating customers because of
better technology?
16. Do you think the products floated from the head office aiming at FI are appropriate for
the customers you face?
17. Do you think the compliance norms floated by the head office are simple to be
implemented in all FI initiatives? Like complex documentation/collaterals/credit history
etc.
18. Are you able to bundle other financial services like insurance/remittances along with your
existing saving/loan products? If no what are the difficulties?
19. Is access a problem like distance from villages or fixed working hours to further FI
initiatives?
20. Any other difficulties/observations you would like to share with us?
*****