Embed Size (px)
Citation preview

University of Pennsylvania University of Pennsylvania
ScholarlyCommons ScholarlyCommons
Wharton Pension Research Council Working Papers Wharton Pension Research Council
11-14-2018
Financial Knowledge and Portfolio Complexity in Singapore Financial Knowledge and Portfolio Complexity in Singapore
Benedict S. K Koh Singapore Management University, [email protected]
Olivia S. Mitchell The Wharton School of the University of Pennsylvania, [email protected]
Susann Rohwedder RAND Center for the Study of Aging, [email protected]
Follow this and additional works at: https://repository.upenn.edu/prc_papers
Part of the Economics Commons
Koh, Benedict S. K; Mitchell, Olivia S.; and Rohwedder, Susann, "Financial Knowledge and Portfolio Complexity in Singapore" (2018). Wharton Pension Research Council Working Papers. 21. https://repository.upenn.edu/prc_papers/21
The research was supported by the Singapore Ministry of Education (MOE) Academic Research Fund Tier 3 grant with the MOE’s official grant number MOE2013-T3-1-009, the Singapore Management University, and the Pension Research Council/Boettner Center at The Wharton School of the University of Pennsylvania.
This paper is posted at ScholarlyCommons. https://repository.upenn.edu/prc_papers/21 For more information, please contact [email protected].

Financial Knowledge and Portfolio Complexity in Singapore Financial Knowledge and Portfolio Complexity in Singapore
Abstract Abstract Financial literacy in Singapore has not been analyzed in much detail, despite the fact that this is one of the world’s most rapidly aging nations. Using the Singapore Life Panel®, we explore older Singaporeans’ levels of financial knowledge and compare them to those observed in the United States. We assess portfolio complexity for these older households, to examine how financial literacy is related to outcomes of interest. We show that older Singaporeans’ levels of financial literacy are comparable overall to those in the United States, even though older Singaporeans score slightly lower on some dimensions (knowledge of interest and inflation), and slightly higher on their knowledge of risk diversification. We document that women are less informed than men about stock diversification, and educated people tend to be more financially knowledgeable than their less educated counterparts. We also find that financial literacy is positively associated with respondents having both more wealth and more diversified and complex portfolios.
Keywords Keywords financial literacy, investment, portfolio diversification, pension, Central Provident Fund, retirement, saving
Disciplines Disciplines Economics
Comments Comments The research was supported by the Singapore Ministry of Education (MOE) Academic Research Fund Tier 3 grant with the MOE’s official grant number MOE2013-T3-1-009, the Singapore Management University, and the Pension Research Council/Boettner Center at The Wharton School of the University of Pennsylvania.
This working paper is available at ScholarlyCommons: https://repository.upenn.edu/prc_papers/21

Financial Knowledge and Portfolio Complexity in Singapore
Benedict Koh, Olivia S. Mitchell, and Susann Rohwedder
November 14, 2018
PRC WP2018-2 Pension Research Council Working Paper
Pension Research Council The Wharton School, University of Pennsylvania
3620 Locust Walk, 3000 SH-DH Philadelphia, PA 19104-6302
Tel.: 215.898.7620 Fax: 215.573.3418 Email: [email protected]
http://www.pensionresearchcouncil.org The authors acknowledge excellent programming assistance from Yong Yu and the Singapore Life Panel (SLP®) team at Singapore Management University, as well as the RAND SLP® team. The research was supported by the Singapore Ministry of Education (MOE) Academic Research Fund Tier 3 grant with the MOE’s official grant number MOE2013-T3-1-009, the Singapore Management University, and the Pension Research Council/Boettner Center at The Wharton School of the University of Pennsylvania. All opinions are solely those of the authors. © 2018 Koh, Mitchell, and Rohwedder. All rights reserved.

1
Financial Knowledge and Portfolio Complexity in Singapore
Benedict Koh, Olivia S. Mitchell, and Susann Rohwedder
Abstract
Financial literacy in Singapore has not been analyzed in much detail, despite the fact that this is one of the world’s most rapidly aging nations. Using the Singapore Life Panel®, we explore older Singaporeans’ levels of financial knowledge and compare them to those observed in the United States. We assess portfolio complexity for these older households, to examine how financial literacy is related to outcomes of interest. We show that older Singaporeans’ levels of financial literacy are comparable overall to those in the United States, even though older Singaporeans score slightly lower on some dimensions (knowledge of interest and inflation), and slightly higher on their knowledge of risk diversification. We document that women are less informed than men about stock diversification, and educated people tend to be more financially knowledgeable than their less educated counterparts. We also find that financial literacy is positively associated with respondents having both more wealth and more diversified and complex portfolios. Keywords: financial literacy, investment, portfolio diversification, pension, Central Provident Fund, retirement, saving JEL Codes: D14, E21, G11, J32 Benedict S. K. Koh Professor of Finance Singapore Management University 50 Stamford Road, #04-01; Singapore 178899 T: +65-6828-0716 F: 65-6828-0777 Email: [email protected] Olivia S. Mitchell International Professor of Employee Benefit Plans Professor of Insurance/Risk Management and Business Economics/Policy Director, Pension Research Council and Boettner Center for Pensions & Retirement Research The Wharton School, 3620 Locust Walk, St 3000 SHDH, Philadelphia, PA 19104-6320 T: +1-215-898-0424 F: 215-898-0310 Email: [email protected] Susann Rohwedder Senior Economist and Associate Director, RAND Center for the Study of Aging Professor, Pardee RAND Graduate School 1776 Main Street, P.O. Box 2138 Santa Monica, CA 90407-2138, U.S.A. T: +1-310-393-0411 Email: [email protected]
2
1. Introduction Around the world, higher levels of financial literacy have been shown to be associated with
more financial planning and saving, better investment behavior, and a better understanding of how
to manage retirement drawdowns (Lusardi and Mitchell, 2014). This is particularly important in
view of peoples’ increased responsibility to effectively plan for and manage their own retirement
savings and decumulation in the context of defined contribution plans. Nevertheless, several
studies have also found that financial knowledge is low among older adults, even in nations with
highly developed financial systems such as the UK and the US, as well as countries with less
sophisticated financial markets such as Russia (Lusardi and Mitchell, 2011a, b).
Until recently, Singapore was a country where financial literacy had been little analyzed,
notwithstanding the reality that it is one of the world’s most rapidly aging nations (Chan, 2001).
Moreover, Singaporeans must make a number of key financial decisions in connection with their
contributions to, investments in, and decumulation from their nation’s mandatory pension scheme
known as the Central Provident Fund (CPF). On the one hand, one might anticipate that older
Singaporeans would be quite financially literate, having benefited from the country’s globally-
renowned educational system, top-ranked since the 1960s (OECD 2012). On the other hand, the
government has, since 1955, required participation in the CPF. Participants who expected that their
CPF accounts would provide financial security in retirement may have devoted less effort to self-
management and investing in financial knowledge. Moreover, the diversity of backgrounds,
languages, and relatively lower levels of education among the older Singaporean population versus
today’s prime-age population could imply lower levels of financial knowledge for this group
(OECD 2016).
This paper reports the first analysis of older Singaporeans’ financial literacy using a unique
new dataset, the Singapore Life Panel (SLP®). Using this nationally representative survey, we

3
address three important questions. First, we assess older Singaporeans’ levels of financial
knowledge and compare their results to findings from the US. Second, we examine the empirical
linkages between financial literacy and retirement preparedness in Singapore. Third, we evaluate
the extent to which financial knowledge in Singapore is associated with financial portfolio
complexity and asset diversification among the older population.
To preview our findings, we show that overall financial literacy among older adults in
Singapore is comparable, but nevertheless slightly lower than in the United States. Somewhat
unexpectedly, financial literacy in Singapore is higher for the 55-70 age group versus the age 50-
54 reference category. Better-educated people are more financially knowledgeable, while women
are less financially informed. These results are similar to those from other countries. We also show
that close to half of older Singaporeans anticipate that they will struggle in retirement (46%), and
fewer than half say they are well prepared financially for retirement (43%). Overall, the most
financially literate are least worried about retirement finances. Finally, we evaluate the correlates
of complex portfolio holdings and asset diversification among older Singaporeans. We show that
financial knowledge is associated with higher household net worth, higher net financial wealth,
and more net non-housing wealth, and the financially savvy hold more diversified and riskier
portfolios. This is true even after controlling for education, indicating that financial literacy plays
a role in peoples’ portfolio decisions, independent of schooling. These findings represent
empirical associations between financial literacy and peoples’ financial decisionmaking since our
research design does not support a causal interpretation. As such, this paper is a first step in a larger
research plan on retirement saving in Singapore.
In what follows, we first provide a brief background on the Singaporean retirement system.
Next we describe the dataset and then outline the empirical methodology we use to answer our

4
three questions. Subsequently we present results, and we conclude with a discussion of issues
deserving of further research attention.
2. A Brief Background on the Singaporean Retirement System Singapore has a national mandatory defined contribution (DC) pension system
administered by the Central Provident Fund (CPF), a government statutory board. All workers
must contribute to three accounts (Ordinary, Special, and Medisave). The CPF contribution rates
and allocation into the three accounts are not uniform, but instead vary with age. Those age 55
and below must contribute 20% of their monthly wages, and their employers 17%, to the CPF
Board. Of the total 37% contribution, 23% is deposited into the Ordinary Account, 6% into the
Special Account, and 8% into the Medisave Account for those age 35 and younger. For older age
brackets (above 35 to 45; above 45 to 50; and above 50 to 55) the allocation rates into the Special
Account and Medisave Account rise gradually, while total contributions remain constant at 37%.
The objective is to ensure CPF members save for retirement and medical expenses. Beyond age
55, total contributions decline rapidly. At the other end of the age spectrum, contributions from
workers over age 65 and their employers decline to 5% and 7.5% respectively; the allocations into
Ordinary, Special, and Medisave accounts are 1%, 1%, and 10.5%, respectively. These
contribution rates apply to wages up to an income ceiling of S$6,000 per month.1
The Ordinary Account (OA) savings can be withdrawn to purchase homes, service
mortgage payments, finance premiums for insurance protection, pay for children’s tertiary
education, and to invest in financial products to grow savings. The Special Account (SA) holds
savings primarily for retirement and these cannot be withdrawn before the age of 55. Members
1As of this writing (November 2018), the Singaporean dollar is valued at about US$0.73.

5
can deposit them with the CPF Board to earn interest, or they can invest in a smaller set of non-
CPF financial products (known as the Investment Saving or IS accounts). The Medisave account
holds savings for members to pay inpatient hospital bills, selected outpatient treatments, and
premiums for insurance against catastrophic illness and disabilities. All working adults have these
three accounts until age 55 when savings earmarked for retirement are deposited into the
Retirement Account (RA). Currently, CPF savings in the Ordinary Account (OA) and Special
Account (SA) are paid a government-set annual interest rate of 2.5% and 4%, respectively.
As of age 55, CPF members must set aside a ‘basic retirement sum’ of $85,500 in their
Retirement Accounts (in 2018) provided they pledge their property to the CPF Board. Those who
do not pledge their property have to set aside the full retirement sum equivalent to twice the basic
retirement sum. These amounts are deemed by the government sufficient to support a subsistence
level of living in old age, and the value rises with inflation. Since 2013, all CPF members must
annuitize the basic retirement sum so as to provide an income stream (known as CPF Life) from
age 65 to death.
3. The Singapore Life Panel The Singapore Life Panel (SLP®) is an ongoing high-frequency survey fielded by the
Centre for Research on the Economics of Ageing (CREA) at the Singapore Management
University.2 Since August 2015, it has been collecting monthly interviews to track longitudinally
individual and household circumstances and behavior in a representative cohort of Singaporean
citizens and permanent residents age 50-70 when recruited in 2015.3
2 For additional information on the SLP®, see Vaithianathan et al. (2017). 3 All data are anonymized so no personal identification of individuals or households is feasible.

6
Designed with input from the creators of the US Health and Retirement Study (HRS),
several of the international sister studies of the HRS, the American Life Panel (ALP) at RAND,
and the Chilean Encuesta de Protección Social (EPS), the survey includes many state-of-the-art
and globally harmonized questions on a large range of topics eliciting information on respondents’
individual circumstances (e.g., their health and labor force status, their expectations and
preferences, government program participation, etc.), as well as information on household-level
variables (such as monthly information on household expenditures across 44 categories, or an
annual complete inventory of household wealth and household income and their respective
detailed components). The frequency at which survey items are elicited is adjusted to the frequency
of change in the underlying variable, combined with considerations about the importance of
observing the exact timing of a change. For example, labor force, health status, and several items
of subjective well-being are asked every month along with several other high-frequency spending
variables, to allow the detailed month-by-month tracking of the effect of a change in health or
labor force status on earnings or on measures of well-being. In practice, the varying frequency is
achieved by fielding some questions every month, others quarterly or annually, and some content
at lower frequencies. As a result, shorter monthly surveys (15-20 minutes) alternate with longer
quarterly surveys (20-30 minutes). Panel members are compensated for each survey they complete
in the form of a grocery store voucher (values range between $10 and $25 depending on the
expected length of the survey).
The SLP® is conducted primarily over the internet. Respondents who need assistance can
call the helpdesk and complete the survey over the telephone, or they can ask for personal
assistance by arranging an in-person meeting with a student assistant at a local library or at the

7
survey headquarters.4 The initial recruitment effort resulted in a panel of 15,000 individuals from
11,500 distinct households who completed a baseline survey in May-July 2015. Analysis of the panel
along several dimensions has shown that it is closely representative of the population, and attrition
rates are low.5
Two SLP survey modules are central to the present study. First, we fielded a module in the
December 2015 survey on financial literacy, asking the Big Three questions developed by Lusardi and
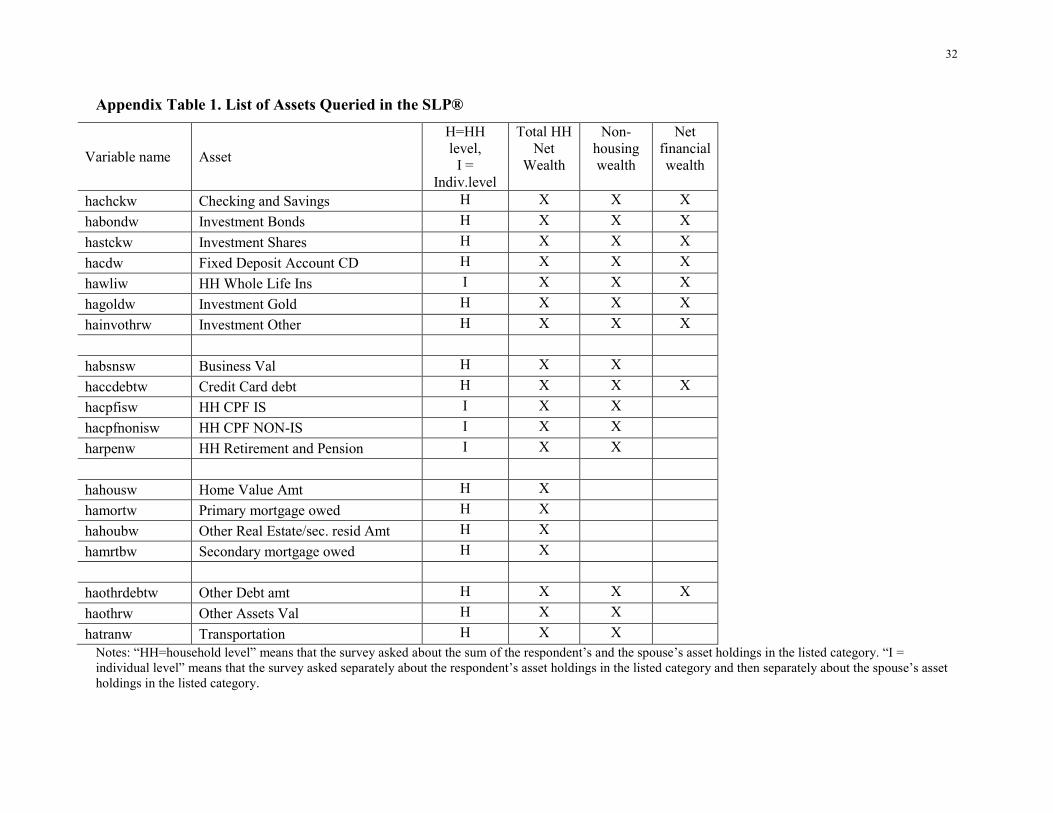
Mitchell (2014). Second, the SLP elicits a complete inventory of the asset holdings of each
respondent’s household (asset components are listed in Appendix Table 1). Respondents complete the
asset and income module in the January survey.6 Some assets are individually owned, such as CPF
balances. For these, respondents are asked to report on their own CPF accounts first, and then they are
asked to report on their spouse’s CPF accounts (if any).7 In some households, the respondent’s spouse
is also a study participant, so both are asked to provide their financial information. In that case, we use
both observations in our analyses, adjusting standard errors to account for clustering at the household
level.
Our analytic sample for this study consists of 6,686 persons who were age 50-70 in
December 2015 when SLP Wave 5 was fielded, who answered the asset and income module in
January or February of 2017 (SLP Waves 18 or 19), and who answered the Financial Literacy
module, explained in more detail below.8
4 About 3% of interviews are completed over the telephone every month, and about 1% use in-person assistance. 5 For additional information on the survey, see https://crea.smu.edu.sg/singapore-monthly-panel. 6 Respondents who missed the January survey were asked to complete the asset and income module in February to maximize the number of respondents with non-missing asset and income information. 7 Because spouses of married study participants are not systematically included as respondents in their own right, it is important to obtain the complete inventory of household assets and income from each respondent. 8 We use the 2017 asset measure rather than the 2016 measure because the 2017 survey instrument added questions on the detailed allocation of assets within peoples’ CPF accounts.

8
4. Methodology Our empirical analysis of portfolio complexity and financial literacy in the SLP® focuses
on three key factors. First, we describe our financial knowledge module, which allows us to
evaluate older Singaporeans’ financial knowledge and compare it to that of similar-aged
individuals in the United States. In addition, we relate financial knowledge to respondent
attributes, to adduce systematic patterns. Second, we relate respondents’ self-assessed financial
preparation for retirement to their measured financial literacy. Third, we examine the relationship
between financial literacy and respondents’ wealth and portfolio complexity.
4.1 Measures of Financial Knowledge
To create the financial knowledge variables of interest, we posit that three key concepts lie at the
root of economic saving and investment decisions: (i) numeracy and capacity to do calculations
related to interest rates; (ii) understanding of inflation; and (iii) understanding of risk
diversification. These “Big Three” questions have been implemented in numerous surveys in the
United States and elsewhere,9 and the specific wording in the Singapore Life Panel® is as follows
(correct answers in bold):
• Suppose you had $100 in a savings account and the interest rate was 2% per year. After 5 years, how much do you think you would have in the account if you left the money to grow: [more than $102, exactly $102, less than $102? Don’t know.] • Imagine that the interest rate on your savings account was 1% per year and inflation was 2% per year. After 1 year, would you be able to buy: [more than, exactly the same as, or less than today with the money in this account? Don’t know.] • Do you think that the following statement is true or false? “Buying a single company stock usually provides a safer return than a Unit Trust. [True, False, Don’t know.]
9 Lusardi and Mitchell (2014) have added the same questions to several other US surveys, including the 2007–2008 National Longitudinal Survey of Youth (NLSY) for young respondents (ages 23–28); the RAND American Life Panel (ALP) covering all ages; and the 2009 and 2012 National Financial Capability Study. The questions are also now included in the international PISA test to assess high school students’ financial knowledge in more than a dozen countries to date; see Lusardi and Mitchell (2008, 2011a, b).

9
The goal of the first question is to measure respondents’ understanding of a simple interest rate
calculation. The second assesses peoples’ understanding of inflation in the context of a simple
financial decision. The third is a joint test of knowledge of risk diversification and unit trusts or
mutual funds. Naturally the answer to this question requires knowledge of both what a stock is,
and that a unit trust (mutual fund) is comprised of many stocks.
5. Results 5.1. Descriptive Statistics and Correlates of Financial Literacy
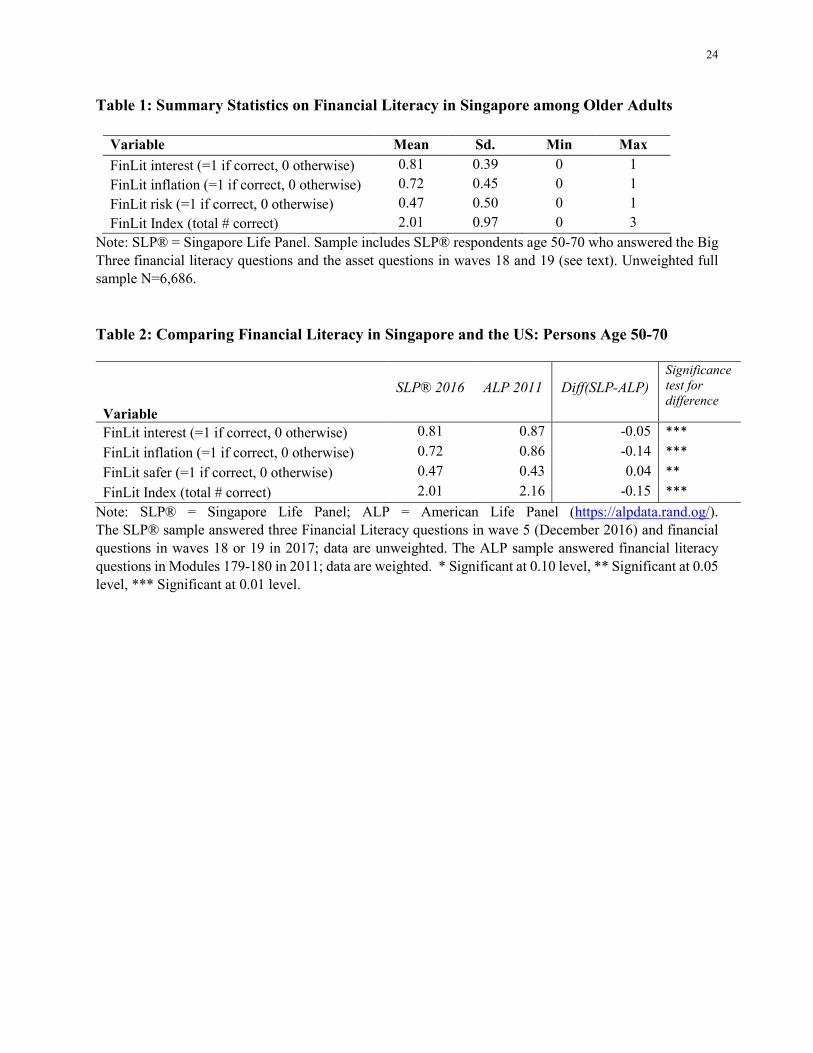
Table 1 provides summary statistics on SLP® responses to the Big Three financial literacy
questions. In the first three rows, a correct answer takes the value of 1, and any other answer
(incorrect or don’t know) is assigned a value of zero. Our tabulations indicate that in the full
sample, 81% of older Singaporeans answered the interest rate question correctly, 72% answered
the inflation question correctly, and 47% responded to the risk diversification question correctly.
For the FinLit index, which is the total number of questions each person answered correctly,
Singaporeans averaged around two of three correct answers (2.01). It is worth noting that many
respondents (46%) answered “Don’t know” to the last question on risk diversification.
Table 1 here
Table 2 compares SLP® responses to the Big Three questions with those of similar aged
adults from the American Life Panel (ALP),10 a sister survey of the SLP® in the United States also
using internet-based interviews, which fielded the Big Three questions in 2011. This comparison
is of interest because in both countries the provision for retirement relies substantially on defined
contribution and individual retirement accounts with only modest levels of annuitization.
10 The RAND American Life Panel surveys the US population age 18 and older. For comparisons with the SLP® we restricted the age range in the ALP to match that of the SLP®.
10
Consequently, older individuals in Singapore and in the US bear considerable responsibility to
manage their finances and associated risks all the while the social safety net is less generous than
in other developed economies. The SLP® respondents scored 6 percentage points lower on the
interest rate question than the ALP respondents (81% versus 87%), and 14 percentage points lower
on the inflation question (72% vs 86%). Interestingly, on the risk diversification question, both
SLP® and ALP respondents performed worse on average than on the other two questions (only
47% and 43% scored correctly, respectively) and the Singaporeans did slightly better than their
U.S. counterparts. The Singaporean mean correct score on the overall FinLit index (2.01 correct
of 3 questions) was slightly below the average (2.16) for ALP respondents in the US survey. All
differences are statistically significant at 5% or higher.
Table 2 here
Next we report results of a multivariate analysis of the Big Three questions in Table 3,
regressed on control variables that include the respondent’s age, sex, education, marital status,
health and other factors commonly used in this context.11 Based on previous studies conducted in
non-Singaporean settings, we expect that age will exhibit an ambiguous relationship with financial
literacy, in that older people have more financial experience and exposure, but older people are
also more likely to suffer from cognitive decline (Lusardi, Mitchell, and Oggero, 2017). Women
have also been found in numerous studies around the globe to be less financially savvy than men
(Lusardi and Mitchell, 2014). Better-educated individuals are more likely to score better on
financial literacy questions, though education is by no means a perfect predictor (Behrman,
Mitchell, Soo and Bravo, 2012). The literature also suggests that nonmarried persons are more
11 Descriptive statistics are provided in Appendix Tables 2 and 3. In addition, we control on but do not report coefficients for whether respondents indicate being employed, if they are homeowners, and whether they manage the finances in their households (e.g., the respondent alone, the respondent along with another, usually the spouse, or the spouse alone), as well as ethnicity. Additional results are available on request.

11
financially frail and less financially literate than their married counterparts, in part due to
selectivity in marriage markets (Becker 1973). Respondents in better health tend to be more
financially literate. Investing in financial knowledge is also more attractive to those likely to live
longer, inasmuch they have a longer remaining lifetime over which to reap the rewards of this
investment (Kim, Maurer, and Mitchell 2016; James, Boyle, Bennett, and Bennett, 2012).
To investigate how financial literacy varies by demographic characteristics in the SLP®,
we first estimate a separate model for each of the financial knowledge questions. The dependent
variable here takes the value 1 if the respondent gave the correct answer, and 0 otherwise (includes
wrong answers and “don’t know” responses); estimation is by Probit and marginal effects are
reported in Table 3.
Table 3 here
A first point worth noting in Table 3 is that older (age 60+) Singaporeans are significantly
better informed about interest rates than their younger counterparts. Moreover, persons age 55+
are better informed about inflation than the 50-54 reference group, and those age 65-70 even more
so. We have no direct explanation for this interesting difference.
Coefficients on other correlates are also of interest: for instance, women score slightly
worse on the risk diversification question, consistent with findings from other countries (Lusardi
and Mitchell 2007). Marital status is never a significant discriminator, while unsurprisingly, the
better-educated are more financially literate than the reference group (those with less than a
secondary education). These patterns are similar to those discovered in the US and other contexts.
Those in fair or poor health are less informed about interest rates, perhaps indicating that less-
healthy individuals find the cost of investment needed to learn about financial matters too great,

12
or it may provide a lower return given possibly shorter life expectancy. Results also show that
homeowners are better informed about financial matters than are renters.12
Table 4 reports estimation results for the FinLit index that counts respondents’ total number
of correct answers to the financial knowledge questions. The dependent variable, denoted FinLit
score, ranges from 0 to 3; accordingly, estimation uses Ordered Probit analysis and the same vector
of control variables is used as in Table 3. Echoing the prior results, older respondents, men, the
better educated, and homeowners have a higher probability of answering all financial knowledge
questions correctly (statistically significant at 5- or 1-percent level). Differences in the FinLitScore
by self-rated health status are small and not statistically significant.
Table 4 here
5.2 Linking Financial Literacy and Key Outcome Measures
Ideally, one would like to know whether financial knowledge facilitates greater wealth
accumulation, possibly through more sophisticated investment strategies, and whether it helps
individuals or households achieve greater financial security. We lack the data to establish such
causal relationships. We therefore examine a wide variety of descriptive patterns to verify whether
those could be consistent with such interpretations. Specifically, we relate the financial literacy
index, FinLit score, to several different measures of household wealth, respondents’ self-assessed
12 In results not reported here in detail, we also analyzed which respondents say “don’t know” versus giving a wrong answer. Multivariate analysis of the factors most strongly associated with people responding “don’t know” are relative youth (older people are better informed about interest rates and risk diversification); being less educated (better educated respondents are more likely to be correct and less likely not to know correct answers to all three questions); and owning a home (those who own homes are less likely to say “don’t know).” Similar to other cross-national comparative studies, women are more likely to say they “don’t know” than men, particularly about stock market diversification (Lusardi and Mitchell 2014). This could imply that women might be more open to financial education efforts, as they are less confident in their knowledge.

13
financial preparation for retirement, household investment portfolio complexity and portfolio
diversification.
5.2.1 Household Wealth, Retirement Preparedness, and Financial Literacy
The SLP® collects the details of the complete inventory of households’ assets by asking about
ownership and the respective values of many different types of asset. This allows constructing
various wealth measures, three of which we link to our financial literacy index. The most
comprehensive measure is total household net wealth; this includes total household wealth
including pension assets, financial wealth, life insurance face values, business, vehicles, primary
(and any secondary) residences, net of debt. Inasmuch as housing wealth is a particularly important
form of wealth in Singapore, accounting for about 53% of total household net worth among 50-70
year olds, we believe it crucial to include it in the analysis.13 The second measure we call total
non-housing wealth, which excludes from the previous measure all housing assets and debt. The
third measure, net financial wealth, excludes pension assets and the value of transportation,
business and “other assets” from the previous measure (see also Appendix Table 1). Descriptive
statistics on the three wealth variables in Table 5 show that our older Singaporean households
report mean total net wealth of $S1,143,300 (median: S$652,800); mean non-housing net wealth
of S$484,800 (median: S$238,000); and mean net financial wealth of S$191,300 (median:
13 Singaporeans can purchase two types of public housing units: BTO flats and resale flats. The first category (BTO) refers to new housing units supplied by a government statutory board in the primary market. Buyers of such housing units are restricted from selling in the first five years of ownership. Beyond five years, they are allowed to sell their homes to unlock home equity. The second category refers to resale public housing units which buyers can purchase and sell in the secondary market without restrictions. Public housing apartments have registered five times appreciation since 1990 or an annual 8.2% over the last 23 years. The sharp appreciation in the value of homes allows home-owners the option of cashing out their properties if the remaining period of the leasehold is sufficiently long. Note that public housing units are sold on 99-year leaseholds in Singapore. The value of such housing units may depreciate when the leasehold period approaches its maturity date and the housing unit is returned to the government. This will not affect the cohort of current older households, however, because their remaining leasehold periods are still sufficiently long. There are various tiers of public housing so that owners of a larger home can downgrade to a smaller home with sizeable capital unlocked in the process. For private properties, the price appreciation has been 16 times since 1975 or an annual 7.8% in the past 38 years. Owners of private properties have the option of downgrading to homes in suburban areas or public housing units, if they wish to extract equity to finance retirement.

14
S$38,000). It should be noted that each value represents the sum of all assets of the household, that
is, for couples, it is the sum of both respondent’s and spouse’s assets.
Table 5 here
The survey also gathers two important measures of self-assessed retirement readiness,
based on questions that encourage respondents to take into account their own needs and potential
financial risks, as follows:14
Most people face uncertainty about financial needs during retirement (such as large home repairs, out-of-pocket medical expenditures or the need to hire help or pay for a nursing home). On a scale from 0 to 100, where 0 means no chance and 100 means absolutely certain: What do you think are the chances you will experience financial distress sometime during your retirement? ______% or � Not applicable/I don’t think I will ever retire
And Now thinking of your financial situation in retirement: Considering all your financial and other assets, including your CPF account, how would you rate your financial preparation for retirement?
1 Excellent; 2 Very good; 3 Good; 4 Fair; 5 Poor
Answers to these two and the other measures of retirement preparedness appear in Table 5.
As before, control variables include respondents’ FinLit score, age, sex, marital status, education,
self-reported health, and other factors.15 Results confirm the economically meaningful and
statistically significant relationship between financial knowledge and household wealth (expressed
in S$100,000). For instance, holding all else constant, one additional correct answer to the FinLit
questions is associated with S$166,800 additional total net wealth; S$97,700 more nonhousing net
wealth; and S$52,600 higher net financial wealth. Versus the mean, this would be worth about
15% more total net wealth, 20% more nonhousing wealth, and 27% more net financial wealth.
14 To examine the validity of these self-assessed measures of economic preparation for retirement we regressed them on a set of covariates. We find that the coefficients on wealth and education are strongly significant and show the expected patterns, i.e. wealthier, higher educated, and healthier individuals report better preparation for retirement and lower chances of financial distress during retirement (results available upon request). 15 In sensitivity analysis not detailed here, we also controlled on respondent self-assessed confidence regarding financial knowledge, an indicator of the respondent’s planning horizon, and indicators of the respondent’s risk preferences (one regarding general risk and another regarding financial risk). Results are qualitatively similar.

15
Overall, we confirm that, in the SLP®, greater financial knowledge is associated with substantially
higher household wealth, regardless of whether we focus on the broadest measure available or look
instead at narrower measures such as non-housing and financial wealth.
The last two columns of Table 5 report the results from multivariate analyses of the self-
assessed retirement preparedness questions, relating them to the same covariates as the household
wealth measures. The average reported chance of struggling financially in retirement is 46%, while
43% of respondents rate their own financial preparedness for retirement as good or better on a
five-point scale. We used OLS estimation when the dependent variable is the percentage chance
of struggling financially in retirement and Probit when the dependent variable is “good or better”
financial preparation for retirement (=1, 0 otherwise).
Not surprisingly, respondents who are more financially informed deem themselves less
likely to experience financial distress in retirement, and they are more likely to indicate they are
financially well prepared for retirement. It is also interesting to note that respondents age 60-70
are more financially confident than their younger counterparts, perhaps due to the recently-
introduced Silver Support program targeted at the elderly poor in Singapore.16 Better-educated
respondents are substantially more optimistic about their retirement prospects, and women are also
relatively less concerned about financial distress in retirement. Those expressing most concern are
those in fair/poor health, who are much less optimistic on both metrics.
Besides the FinLit coefficients, other controls behave as expected. For instance, older
people, better-educated, and married persons are better off than their counterparts. Those reporting
themselves in fair or poor health have significantly less wealth, according to all three measures.
16 See for instance Chen and Tan (2017). Nevertheless, it is worth noting that this supplement targets only the bottom 20% of the older population and therefore may only lead to marginal improvements of financial security in old age among those eligible.
16
Homeowners also report more wealth than renters, though they do not differ in terms of net
financial wealth. We also find the expected systematic variation by wealth, education, and health,
controlling for other demographic characteristics as well (see Appendix Table 3 for list of control
variables).
5.2.2 Portfolio Complexity
Next we examine two broad categories of portfolio holdings: assets held outside respondents’ CPF
(retirement) accounts, and assets held inside their CPF accounts.17 Most Singaporean households
indicate they own a primary residence (83%) and checking/saving accounts (80%); only 8% hold
a secondary property. Fewer than a quarter (24%) hold whole life insurance and fixed term deposits
(23%), and only 26% reported holding shares outside their CPF accounts. Very few have gold/gold
funds (2%), mutual funds or managed accounts (5%), bonds or bond funds (4%), or own businesses
(5%). Within their CPF accounts, only a small minority of respondents indicate they have
investments through their CPF Investment Scheme (IS) accounts: 9% hold shares, 6% have
investment-linked insurance products, and each of the products we asked about amount to 4% or
less (endowment insurance, government or corporate bonds, collective investments, or gold).
To evaluate these patterns more succinctly, we tally the total number of complex asset
holdings, defined as the sum of the total number of complex assets held outside and inside
respondents’ CPF accounts. We also distinguish people’s allocations to what we term to be
noncomplex versus complex holdings in each of the two asset locations. For nonpension wealth,
17 For non-CPF assets, we sum each age-eligible respondent’s holdings plus those of the spouse, if any, to obtain household non-CPF assets; for some assets we cannot disentangle ownership, notably those that tend to be jointly held by spouses of a couple, like homes. For CPF assets, the respondent reports own CPF balances and—in separate survey questions—the CPF balances of the spouse (if any). The respondent was also asked to provide the details of his or her own CPF investment allocations. However, with respect to the spouse’s CPF investment allocations the respondent was only asked to provide the fraction of the CPF balance held in shares. Accordingly, our variable measuring household CPF total complex holdings sums the respondent’s complex investments and the spouse’s share CPF investments.

17
we define noncomplex investments as including an owner-occupied home, a checking/saving bank
account, a vehicle, any fixed-term deposits, bonds, and whole life insurance. Complex nonpension
assets include own businesses, investment property, shares/stock funds, gold/gold funds, managed
accounts, and mutual funds/unit trusts. We categorize pension holdings according to whether
people left their CPF retirement funds in their default accounts to be invested by the government,
or whether they moved their money to “permitted” assets managed by non-government entities via
the CPF Investment Scheme (CPFIS). Koh et al. (2008a and b, 2010) previously reported that
many CPF participants left their retirement assets to be managed by the CPF since their net-of-
expense returns were perceived to be safer than and often exceeded returns from investing in
relatively expensive and riskier non-CPF products.18 Nevertheless, several options available under
the CPF IS may be attractive to savers willing to take additional risk including gold ETFs and gold
certificates, investment-linked insurance products, annuities, government-guaranteed and statutory
board bonds, unit trusts, and property funds.19 For this analysis, we classify as noncomplex CPF
assets money managed by the CPF, and as complex CPF assets those held in CPF-Investment
Scheme (IS) accounts.
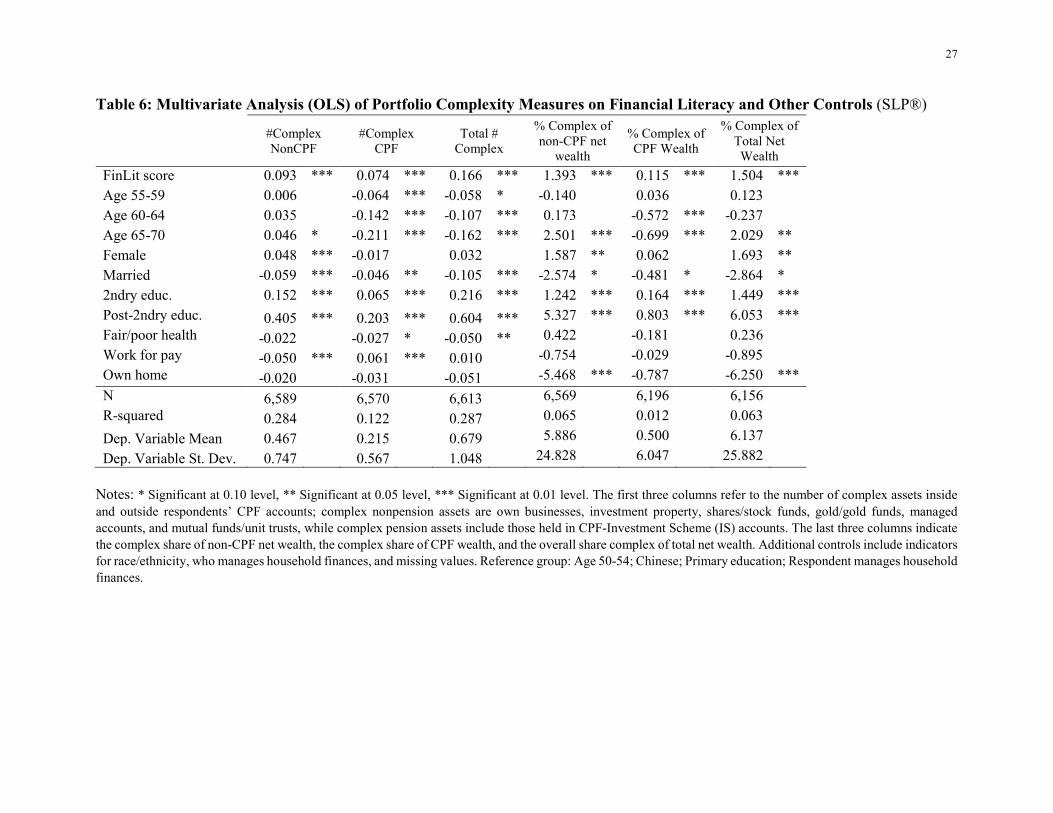
The first three columns of Table 6 report coefficient estimates from multiple regression
analyses of the number of complex assets held inside/outside respondent CPF accounts as well as
overall. The next three columns report results for the share of complex assets in peoples’ portfolios,
again inside versus outside the CPF holdings, and overall. It should be noted that the portfolio
18 This was confirmed in a recent CPF Advisory Panel report showing that the funds permitted under the investment scheme remain expensive by international standards; see https://services.mom.gov.sg/cpfpanel/media/recommendations/part2/Chapter%205_Simpler%20Investment%20Choices%20for%20CPF%20Savings.pdf . 19 These are available only to persons having at least $20,000 in their Old-Age account, or at least $40,000 in their Special Account. For additional detail see https://www.cpf.gov.sg/Assets/members/Documents/CPFISInvestmentProducts.pdf

18
holdings are drawn from survey responses, so they represent what people report and presumably
believe they own.
Table 6 here
From the base of the table, we see that older Singaporeans hold relatively few complex
assets overall, namely an average of 0.7 complex assets per respondent. Nevertheless, there is
important variation inside and outside the CPF accounts, since respondents average 0.5 complex
nonpension assets but only 0.2 inside their pension accounts. These results confirm prior
suggestions that older respondents tend to keep their pension money in what they consider to be a
safe government-invested account. Consistent with expectations, estimated coefficients on the
FinLit index in Table 6 show that the more financially knowledgeable have a statistically
significantly higher number of complex assets.20 Being able to answer one additional financial
question correctly is associated with 0.17 more complex assets overall (a difference of almost
25%). We also see that older Singaporeans (age 60-70) hold fewer complex assets in their pension
accounts than do the younger reference group, while in their non-CPF accounts they hold slightly
more complex assets than their younger counterparts (though these estimates are not statistically
different at the 5-percent level). Across the board, better-educated individuals have more complex
assets, and the association is quantitatively large and statistically significant. Persons in poor health
hold fewer complex assets, while married persons are less diversified in their CPF accounts.
A similar result obtains in the next three columns of Table 6, where the dependent variables
focus on the share of each wealth type held in complex assets. Here again, the FinLit score is
consistently statistically significant and positive, confirming that those with more financial
knowledge hold larger shares of their net wealth in complex assets. Overall, answering one more
20 This accords with US data from Clark et al. (2015).
19
FinLit question correctly is associated with a 1.5 percent higher share held in complex assets, a
quantitatively large (25%) result compared to the mean (6.1). As above, the older age groups (60-
70) has a smaller share of complex assets in their pension accounts but not outside their pensions,
and better-educated respondents have much higher complex wealth shares.
5.2.3 Portfolio Diversification
The dataset also allows us to create three variables providing insights into how older Singaporeans
diversify their pension and nonpension investments. The first variable indicates whether a
respondent is diversified, which we take to mean that his overall portfolio includes at least some
equity/stocks, fixed-income/bonds, and cash. The second variable is an indicator of whether the
respondent’s equity share of financial assets falls within +/-10% of the fraction conventionally
recommended by financial advisors, namely 100 minus his age. This variable, which we call
EquityAsPerAge, is a rule of thumb widely used by financial practitioners to proxy for rising risk
aversion with age (e.g. Arshanapalli and Nelson, 2012; Bodie and Crane, 1997; Mayer, Zick, and
Glaittli, 2011; and Lankford, 2005). It is also consistent with theoretical work by Bodie, Merton,
and Samuelson (1992) showing that, due to declining labor flexibility as one ages, it is sensible to
reduce the financial risk of one’s portfolio to maintain a constant overall risk exposure.
Accordingly, we use this as one way to evaluate respondents’ risky share by age. A third measure
of diversification compares the respondent’s risky share to that commonly used in Target Date
Funds (TDFs) which recommend that young people invest more in equity and older people follow
a glide path to less risky holdings. For instance, the Vanguard family of TDFs has an equity
fraction of 90% as of age 20, declining by 1.5% per year to age 40; the fraction then declines by
2% per year to 60% at age 60; then it declines by 2.9% per year of age to 50% at age 65; to 40%

20
at age 72; and to 30% after age 72.21 Again, we measure whether each respondent’s equity share
of financial assets falls within +/-10% of the TDF glide path. Results are provided in Table 7.
Table 7 here
At the base of Column 1 in Table 7, we see that around one-third (33.3%) of SLP®
respondents hold cash, stocks, and bonds; hence this group is diversified in this very basic way.
Only around 8% of the full sample holds a risky share of financial assets that approximately meets
the 100-Age rule of thumb (column 2), and only 5% of the portfolio is consistent with a
conventional TDF glidepath (column 3). In general, then, we conclude that older Singaporeans
are less financially diversified than might have been anticipated, lending support to the
government’s stated intention to include Target Date-style funds in its CPF investment portfolio
in the near future.22
Nevertheless, under all three diversification definitions, more financially literate
individuals are better diversified. For instance, the coefficient in the first row and column of
Table 7 indicates that people who answered one additional FinLit question correctly were 8
percentage points more likely to be diversified, or 25% above the mean; they were also 2
percentage points more likely to have an equity share consistent with the 100-age rule (column 2).
The effect is also positive though marginally significant for the final column. It is also worth noting
that these effects remain strong and statistically significant even when controlling for education
(which is also positive and statistically significant). While few financially savvy Singaporeans
appear to follow a Target Date profile when allocating their asset portfolios, older and better-
educated respondents’ investments are better diversified.
21 Of course, different firms’ TDF glidepaths differ somewhat, though the glidepath is always less risky at older ages (Antonelli, 2018). 22 See CPF Advisory Board (2016). Hong Kong has already adopted TDFs in its Mandatory Provident Fund default portfolio from 2017 (Willis Towers Watson 2017).

21
In sum, our analysis underscores the result that financial literacy tends to be related to
higher levels of net wealth, better self-assessed financial preparation for retirement, and more
diversified and more complex asset holdings at older ages. We have no direct evidence in this
dataset as to how these patterns translate into net investment returns, as this would require links to
administrative records (which at present we lack). We do know from our previous work that many
people who purchased CPF IS investments earn less after fees than they would if they had left their
money under CPF administration (Koh et al., 2008a, Koh et al. 2008b). While that research did
not discuss any links between financial literacy and investment earnings, in the US context, Clark
et al. (2015) found a strong positive relationship between higher financial literacy scores and
investment returns.
6. Implications and Conclusions This paper reports the first results from an analysis of older Singaporeans’ financial literacy
using a unique new dataset, the Singapore Life Panel®. With this new and nationally representative
survey of the population age 50 to 70, we addressed three important questions. First, we explored
how financially knowledgeable Singaporeans are, and how their results compared to a similar
internet-based US study, the American Life Panel. Second, we examined the relationship of
financial literacy and wealth and self-assessed financial security, issues of key interest in a wide
range of policy circles. Third, we examined whether greater financial knowledge in Singapore is
associated with more complex portfolios.
We showed that older adults’ level of financial literacy in Singapore is comparable to,
albeit a bit lower than, that for similar-aged respondents in the US American Life Panel. Older
women in Singapore tend to be less informed about stock diversification, while educated and

22
wealthier people are more financially knowledgeable. Moreover, financial literacy is positively
associated with having more wealth, greater financial security, and better-diversified portfolios
both inside and outside CPF pensions. We also showed that financial literacy was positively and
significantly associated with most of our portfolio complexity measures, holding other factors
constant. Additionally, better-educated and healthier respondents exhibited more portfolio
diversification.
Throughout the discussion, we have framed our findings in terms of associations rather
than causal relationships. This is because we recognize that investing in financial knowledge can
be endogenous: that is, people may decide whether to devote time, effort and money to learn about
financial products and the working of the capital market (Kim, Maurer, and Mitchell, 2016), in
which case investment in financial knowledge will depend on the costs of acquiring financial
knowledge and the benefits to the decision-makers. In our other work, we have shown that some
people – particularly the least educated and lowest-paid – optimally invest little in financial literacy
due to the time and money costs of doing so (Delavande et al. 2008, Lusardi et al. 2017). It is
beyond the scope of the present paper to simultaneously model financial knowledge, wealth, and
portfolio diversification, though other analysts have employed instrumental variable econometric
techniques and experimental analysis that support the conclusion that financial knowledge drives
more saving, better retirement planning, better investment outcomes, and more informed decisions
about retirement payouts.23
As Singapore, and indeed the entire Asian region, continues to age, there will be pressure
to facilitate and encourage more saving, and especially more productive saving, among key
23 A meta-analysis of 168 papers by Fernandes et al. (2014) suggested that many financial literacy interventions have had relatively weak impacts. Nevertheless, numerous other studies including Skimmyhorn (2016) and a wide range of research overviewed by Lusardi and Mitchell (2014) reported more powerful effects in proper experimental settings.

23
segments of the population. To the extent that financial literacy can help people do a better job of
saving inside and outside their pension accounts, as well as diversify their assets, it is a promising
avenue for further research.
24
Table 1: Summary Statistics on Financial Literacy in Singapore among Older Adults
Variable Mean Sd. Min Max FinLit interest (=1 if correct, 0 otherwise) 0.81 0.39 0 1 FinLit inflation (=1 if correct, 0 otherwise) 0.72 0.45 0 1 FinLit risk (=1 if correct, 0 otherwise) 0.47 0.50 0 1 FinLit Index (total # correct) 2.01 0.97 0 3
Note: SLP® = Singapore Life Panel. Sample includes SLP® respondents age 50-70 who answered the Big Three financial literacy questions and the asset questions in waves 18 and 19 (see text). Unweighted full sample N=6,686. Table 2: Comparing Financial Literacy in Singapore and the US: Persons Age 50-70
Variable
SLP® 2016
ALP 2011
Diff(SLP-ALP)
Significance test for difference
FinLit interest (=1 if correct, 0 otherwise) 0.81 0.87 -0.05 *** FinLit inflation (=1 if correct, 0 otherwise) 0.72 0.86 -0.14 *** FinLit safer (=1 if correct, 0 otherwise) 0.47 0.43 0.04 ** FinLit Index (total # correct) 2.01 2.16 -0.15 ***
Note: SLP® = Singapore Life Panel; ALP = American Life Panel (https://alpdata.rand.og/). The SLP® sample answered three Financial Literacy questions in wave 5 (December 2016) and financial questions in waves 18 or 19 in 2017; data are unweighted. The ALP sample answered financial literacy questions in Modules 179-180 in 2011; data are weighted. * Significant at 0.10 level, ** Significant at 0.05 level, *** Significant at 0.01 level.

25
Table 3: Probit Multivariate Analysis of Three Financial Literacy Questions on Controls (SLP®)
Interest rate Inflation Risk Age 55-59 0.010
0.030 ** 0.024
Age 60-64 0.027 ** 0.040 ** 0.032 * Age 65-70 0.037 ** 0.071 *** -0.009
Female 0.009
-0.009
-0.051 *** Married 0.001
-0.020
-0.001
2ndry educ. 0.043 *** 0.092 *** 0.080 *** Post-2ndry educ. 0.156 *** 0.288 *** 0.259 *** Fair/poor health -0.021 ** 0.009 -0.023 * Work for pay -0.002 -0.025 ** -0.001 Self-employed 0.028 * 0.021 0.018 Own home 0.072 *** 0.137 *** 0.090 *** N 6,686 6,686 6,686 R-squared 0.047 0.107 0.050 Dep. Var. Mean 0.813 0.723 0.472 Dep. Var. St. Dev. 0.390 0.448 0.499
Note: * Significant at 0.10 level, ** Significant at 0.05 level, *** Significant at 0.01 level. Dependent variable in columns 1-3 = 1 if answer correct; 0 otherwise. Probit marginal effects reported. Additional controls include indicators for race/ethnicity, who manages household finances, and missing values. Reference group: Age 50-54; Chinese; Primary education; Respondent manages household finances. Table 4. Ordered Probit Multivariate Analysis of FinLit Score on Controls (SLP®) FinLit score=0 FinLit score=1 FinLit score=2 FinLit score=3 Age 55-59 -0.011 ** -0.013 ** -0.005 * 0.029 ** Age 60-64 -0.017 ** -0.02 ** -0.008 ** 0.044 ** Age 65-70 -0.015 ** -0.018 ** -0.007 ** 0.040 ** Female 0.010 ** 0.012 ** 0.004 ** -0.026 ** Married 0.003
0.004
0.001
-0.008
2ndry educ. -0.036 *** -0.042 *** -0.016 *** 0.095 *** Post-2ndry educ. -0.113 *** -0.137 *** -0.074 *** 0.324 *** Fair/poor health 0.007 0.007 0.002 -0.016 Work for pay 0.005 0.006 0.002 -0.013 Self-employed -0.009 -0.011 -0.004 0.025 Own home -0.057 *** -0.055 *** -0.006 ** 0.117 *** Dep. Var. Mean 2.009 Dep. Var. St. Dev. 0.974
Note: * Significant at 0.10 level, ** Significant at 0.05 level, *** Significant at 0.01 level. Dependent variable: FinLit score which counts the number of correct answers to the three financial knowledge questions. Marginal effects from an Ordered Probit model reported. Additional controls include indicators for race/ethnicity, who manages household finances, and missing values. Reference group: Age 50-54; Chinese; Primary education; Respondent manages household finances.

26
Table 5. Multivariate Analysis of Retirement Preparedness on Financial Literacy and Other Controls (SLP®; OLS coefficients provided unless noted)
HH total net wealth
(S$100k)
HH non-housing wealth
(S$100k)
HH net financial wealth
(S$100k)
Chances (%) of struggling
financially in retirement
Good financial prep. for retirement
(Probit)
FinLit score 1.668 *** 0.977 *** 0.526 *** -1.383 *** 0.034 *** Age 55-59 1.048 0.602 ** 0.466 *** -1.211
0.030 *
Age 60-64 2.370 *** 0.657 ** 0.482 *** -4.249 *** 0.074 *** Age 65-70 1.843 ** 0.133
0.606 *** -6.514 *** 0.089 ***
Female 1.301 *** 0.598 *** 0.336 *** -2.043 *** 0.022 * Married 4.217 *** 1.565 *** 0.479 *** -0.494
0.025
2ndry educ. 2.078 *** 1.359 *** 0.433 *** -2.095 ** 0.054 *** Post-2ndry educ. 10.235 *** 4.936 *** 2.370 *** -7.571 *** 0.157 *** Fair/poor health -1.661 *** -0.656 *** -0.300 *** 7.762 *** -0.255 *** Work for pay -0.506 0.793 *** -0.018 0.120
0.021
Own home 2.920 *** 0.535 ** 0.136 -2.235 * 0.025
N 6,686 6,686 6,686 5,391 6,670 R-squared 0.107 0.181 0.138 0.065 0.101 Dep. Var. Mean 11.433 4.848 1.913 45.594 0.430 Dep. Var. St. Dev. 20.493 7.830 4.523 26.163 0.495 Dep. Var. Median 6.528 2.380 0.380 50.000 0.000
Notes: * Significant at 0.10 level, ** Significant at 0.05 level, *** Significant at 0.01 level. Column 1 dependent variable is total household net wealth (including pension assets, financial wealth, life insurance face values, business, vehicles, residences, minus debt). Column 2 uses total non-housing wealth which excludes from the previous measure housing assets. Column 3, net financial wealth, excludes pension assets and the value of transportation, business and “other assets” from the previous measure. If wealth < $1,000, we dropped the observation; thus 287 observations were omitted for total wealth, 1,672 for financial wealth, and 421 for nonhousing wealth. All amounts are expressed in January/February-2017 Singapore Dollars. Column 4 reports self-reported chances of struggling financially in retirement, and the dependent variable in Column 5 =1 if preparation for retirement excellent/very good/good and =0 otherwise. Specifically, the “Chance of struggling financially in retirement” variable is based on the following SLP question, asked in the baseline survey:
Most people face uncertainty about financial needs during retirement (such as large home repairs, out-of-pocket medical expenditures or the need to hire help or pay for a nursing home). On a scale from 0 to 100, where 0 means no chance and 100 means absolutely certain: What do you think are the chances you will experience financial distress sometime during your retirement? ______% or � Not applicable/I don’t think I will ever retire
And “Self-assessed financial preparation for retirement” draws on the following SLP question, asked in the baseline survey:
Now, thinking of your financial situation in retirement: Considering all your financial and other assets, including your CPF account, how would you rate your financial preparation for retirement?
1 Excellent, 2 Very good, 3 Good, 4 Fair, 5 Poor Probit marginal effects reported. Additional controls: indicators for missing values, race/ethnicity, who manages household finances. Reference group: Age 50-54; Chinese; Primary education; Respondent manages household finances.
27
Table 6: Multivariate Analysis (OLS) of Portfolio Complexity Measures on Financial Literacy and Other Controls (SLP®)
#Complex NonCPF
#Complex CPF
Total # Complex
% Complex of non-CPF net
wealth
% Complex of CPF Wealth
% Complex of Total Net Wealth
FinLit score 0.093 *** 0.074 *** 0.166 *** 1.393 *** 0.115 *** 1.504 *** Age 55-59 0.006
-0.064 *** -0.058 * -0.140
0.036
0.123
Age 60-64 0.035
-0.142 *** -0.107 *** 0.173
-0.572 *** -0.237
Age 65-70 0.046 * -0.211 *** -0.162 *** 2.501 *** -0.699 *** 2.029 ** Female 0.048 *** -0.017
0.032
1.587 ** 0.062
1.693 **
Married -0.059 *** -0.046 ** -0.105 *** -2.574 * -0.481 * -2.864 * 2ndry educ. 0.152 *** 0.065 *** 0.216 *** 1.242 *** 0.164 *** 1.449 *** Post-2ndry educ. 0.405 *** 0.203 *** 0.604 *** 5.327 *** 0.803 *** 6.053 *** Fair/poor health -0.022 -0.027 * -0.050 ** 0.422
-0.181
0.236
Work for pay -0.050 *** 0.061 *** 0.010 -0.754
-0.029
-0.895
Own home -0.020 -0.031 -0.051 -5.468 *** -0.787 -6.250 *** N 6,589 6,570 6,613 6,569 6,196 6,156 R-squared 0.284 0.122 0.287 0.065
0.012
0.063
Dep. Variable Mean 0.467 0.215 0.679 5.886
0.500
6.137
Dep. Variable St. Dev. 0.747 0.567 1.048 24.828 6.047 25.882
Notes: * Significant at 0.10 level, ** Significant at 0.05 level, *** Significant at 0.01 level. The first three columns refer to the number of complex assets inside and outside respondents’ CPF accounts; complex nonpension assets are own businesses, investment property, shares/stock funds, gold/gold funds, managed accounts, and mutual funds/unit trusts, while complex pension assets include those held in CPF-Investment Scheme (IS) accounts. The last three columns indicate the complex share of non-CPF net wealth, the complex share of CPF wealth, and the overall share complex of total net wealth. Additional controls include indicators for race/ethnicity, who manages household finances, and missing values. Reference group: Age 50-54; Chinese; Primary education; Respondent manages household finances.

28
Table 7: Probit Multivariate Analysis of Portfolio Diversification on Financial Literacy and Other Controls (SLP®) Diversified asset allocation (1/0) EquityAsPerAge (1/0) EquityAsPerTDF (1/0) FinLit score 0.082 *** 0.018 *** 0.007 * Age 55-59 -0.047 *** 0.001
0.026 **
Age 60-64 -0.092 *** 0.022 * 0.051 *** Age 65-70 -0.127 *** 0.040 *** 0.074 *** Female 0.022 * 0.010
0.005
Married -0.024
-0.009
-0.009
Secondary education 0.092 *** 0.040 *** 0.034 *** Post-secondary education 0.263 *** 0.096 *** 0.054 *** Fair/poor health -0.038 *** 0.001
-0.007
Work for pay 0.066 *** -0.002
-0.004
Own home 0.156 *** -0.011 -0.003 N 6,606
5,014
5,022
Pseudo R-squared 0.147
0.074
0.063
Mean of dep. Variable 0.333
0.078
0.052
Std.dev. of dep. Variable 0.471 0.268 0.223 Notes: * Significant at 0.10 level, ** Significant at 0.05 level, *** Significant at 0.01 level. Dependent variable in first column = 1 if respondent held cash, stocks, and bond; =0 otherwise. Second column dependent variable =1 if respondent’s equity share of financial wealth conforms within 10% of the (100-age) glide path; =0 otherwise. Third column dependent variable respondent’s share of equity in financial wealth. Probit marginal effects reported. Additional controls: indicators for missing values, race/ethnicity, who manages household finances. Reference group: Age 50-54; Chinese; Primary education; Respondent manages household finances.

29
References Antonelli, Angela M. (2018). The Evolution of Target Date Funds. Georgetown University Center
for Retirement Initiatives Policy Report. Washington, D.C. Arenas de Mesa, Alberto, David Bravo, Jere R. Behrman, Olivia S. Mitchell, and Petra E. Todd.
With assistance from Andres Otero, Jeremy Skog, Javiera Vasquez, and Viviana Velez-Grajales. (2008). The Chilean Pension Reform Turns 25: Lessons from the Social Protection Survey. In Lessons from Pension Reform in the Americas. Stephen Kay and Tapen Sinha, Eds. Oxford: Oxford University Press, pp. 23-58.
Arshanapalli, Bala, and W. Nelson. (2012). Asset Allocation Options for Wealth Accumulation. The Journal of Wealth Management. 14(4): 22-27.
Becker, Gary S. (1973). A Theory of Marriage: Part I. Journal of Political Economy. 81 (4): 813–46.
Behrman, Jere, Olivia S. Mitchell, Cindy Soo, and David Bravo. (2012). Financial Literacy, Schooling, and Wealth Accumulation. American Economic Review P&P. 102 (3): 300–304.
Brown, Jeffrey R., Arie Kapteyn, and Olivia S. Mitchell. (2016). Framing and Claiming: How Information-Framing Affects Expected Social Security Claiming Behavior. Journal of Risk and Insurance. 83(1): 139–162.
Brown, Jeffrey R., Arie Kapteyn, Erzo Luttmer, and Olivia S. Mitchell. (2017). Cognitive Constraints on Valuing Annuities. Journal of the European Economic Association. 15(2): 429-462.
Bodie, Zvi, and Dwight B. Crane. (1997). Personal investing: Advice, Theory, and Evidence. Financial Analysts Journal. 53(6):13-23.
Bodie, Zvi, Robert C. Merton, and William Samuelson. (1992). Labor Supply Flexibility and Portfolio Choice in a Life-Cycle Model. Journal of Economic Dynamics & Control. 16(3-4): 427–449.
Chan, Angelique. (2001) Singapore’s Changing Structure and the Policy Implications for Financial Security, Employment, Living Arrangements and Health Care. Working Paper, Asian Metacentre for Population and Sustainable Development Analysis. National University of Singapore.
Chen, Yanying and Yi Jin Tan. (2017). Income and Subjective Well-Being: Evidence from Singapore's First National Non-Contributory Pension. CREA Working Paper, Singapore Management University.
Clark, Robert L., Annamaria Lusardi, and Olivia S. Mitchell. (2015). Financial Knowledge and 401(k) Investment Performance. Journal of Pension Economics and Finance. November: 1–24.
CPF Advisory Board. (2016). Executive Summary of Part II of CPF Advisory Panel’s Recommendations. Central Provident Fund, Singapore. https://www.cpf.gov.sg/Members/News/news-categories-info/cpf-changes/2322

30
Delavande, Adeline, Susann Rohwedder, and Robert Willis. (2008). “Preparation for Retirement, Financial Literacy and Cognitive Resources. Michigan Retirement Research Center Working Paper 2008-190, www.mrrc.isr.umich.edu/publications/papers/pdf/wp190.pdf
Fernandes, Daniel, John G. Lynch Jr., and Richard G. Netemeyer. (2014) Financial Literacy, Financial Education, and Downstream Financial Behaviors. Management Science 60(8): 1861-1883.
James, Bryan D., Patricia A. Boyle, Jarred S. Bennett, and David A. Bennett. (2012). The Impact of Health and Financial Literacy on Decision Making in Community-Based Older Adults. Gerontology 58(6): 531-539.
Kim, Hugh Hoikwang, Raimond Maurer, and Olivia S. Mitchell. (2016). Time is Money: Rational Life Cycle Inertia and the Delegation of Investment Management. Journal of Financial Economics. 121(2): 231-448.
Koh, Benedict and Olivia S. Mitchell. (2010). What’s on the Menu? Included versus Excluded Investment Funds for Singapore’s Central Provident Fund Investors. Pensions: An International Journal.
Koh, Benedict S. K., Olivia S. Mitchell and Joelle H.Y. Fong. (2008a). Cost Structures in Defined Contribution Systems: The Case of Singapore’s Central Provident Fund. Pensions: An International Journal. 13 (1-2): 7-14.
Koh, Benedict, Olivia S. Mitchell, Toto Tanuwidjaja, and Joelle Fong. (2008b). Investment Patterns in Singapore’s CPF Central Provident Fund. Journal of Pension Economics and Finance. 7(1): 1-29.
Lankford, K. (2005). Rating the Rules of Thumb. Kiplinger's Personal Finance. 59: 81-84. Lewis, N. D., and J. Okunev. (2009). Using Value at Risk to Enhance Asset Allocation in Life-
cycle Investment Funds. Journal of Investing. 18(1): 87-91. Lusardi, Annamaria, Pierre-Carl Michaud, and Olivia S. Mitchell. (2017). Optimal Financial
Literacy and Wealth Inequality. Journal of Political Economy. 125(2): 431-477. Lusardi, Annamaria and Olivia S. Mitchell. (2014). The Economic Importance of Financial
Literacy: Theory and Evidence. Journal of Economic Literature. 52(1): 5-44. Lusardi, Annamaria and Olivia S. Mitchell. (2011a). Financial Literacy and Retirement Planning
in the United States. Journal of Pension Economics and Finance, October: 509-525. Lusardi, Annamaria and Olivia S. Mitchell. (2011b). Financial Literacy around the World: An
Overview. Journal of Pension Economics and Finance, October: 497-508. Lusardi, Annamaria and Olivia S. Mitchell. (2008). Planning and Financial Literacy: How Do
Women Fare? American Economic Review 98:2, 413–417 Lusardi, Annamaria and Olivia S. Mitchell. (2007). Baby Boomer Retirement Security: The Roles
of Planning, Financial Literacy, and Housing Wealth. Journal of Monetary Economics. 54(1) January: 205-224.
Lusardi, Annamaria, Olivia S. Mitchell, and Noemi Oggero. (2017). Debt and Financial Vulnerability on the Verge of Retirement. NBER Working Paper 23664.
31
Mayer, R. N., C.D. Zick, and M. Glaittli. (2011). Public Awareness of Retirement Planning Rules of Thumb. Journal of Personal Finance. 10(1): 12-35.
OECD (2012). PISA 2012 Results: Creative Problem Solving. www.oecd.org/countries/singapore/Skills-Matter-Singapore.pdf
OECD (2016). Singapore: Skills Matter. http://www.oecd.org/countries/singapore/Skills-Matter.pdf.
Skimmyhorn, William L. 2016. “Assessing Financial Education: Evidence From Boot Camp.” American Economic Journal: Economic Policy. 8(2): 322-343
Vaithianathan, Rhema, Bryce Hool, Michael D. Hurd, and Susann Rohwedder. (2018). High-Frequency Internet Survey of a Probability Sample of Older Singaporeans: The Singapore Life Panel®. The Singapore Economic Review, Special Edition on Economic Issues of Population Aging in Asia. https://doi.org/10.1142/S0217590818420043.
Willis Towers Watson. (2017). Hong Kong: Employers/Employees Face New Risks, Costs with MPF Default Investment Strategy Launch. March 29 https://www.towerswatson.com/en/Insights/Newsletters/Global/global-news-briefs/2017/03/hong-kong-employers-employees-face-new-risks-costs-with-mpf-default-investment-strategy-launch
32
Appendix Table 1. List of Assets Queried in the SLP®
Variable name Asset
H=HH level,
I = Indiv.level
Total HH Net
Wealth
Non-housing wealth
Net financial wealth
hachckw Checking and Savings H X X X habondw Investment Bonds H X X X hastckw Investment Shares H X X X hacdw Fixed Deposit Account CD H X X X hawliw HH Whole Life Ins I X X X hagoldw Investment Gold H X X X hainvothrw Investment Other H X X X habsnsw Business Val H X X haccdebtw Credit Card debt H X X X hacpfisw HH CPF IS I X X hacpfnonisw HH CPF NON-IS I X X harpenw HH Retirement and Pension I X X hahousw Home Value Amt H X hamortw Primary mortgage owed H X hahoubw Other Real Estate/sec. resid Amt H X hamrtbw Secondary mortgage owed H X haothrdebtw Other Debt amt H X X X haothrw Other Assets Val H X X hatranw Transportation H X X
Notes: “HH=household level” means that the survey asked about the sum of the respondent’s and the spouse’s asset holdings in the listed category. “I = individual level” means that the survey asked separately about the respondent’s asset holdings in the listed category and then separately about the spouse’s asset holdings in the listed category.
33
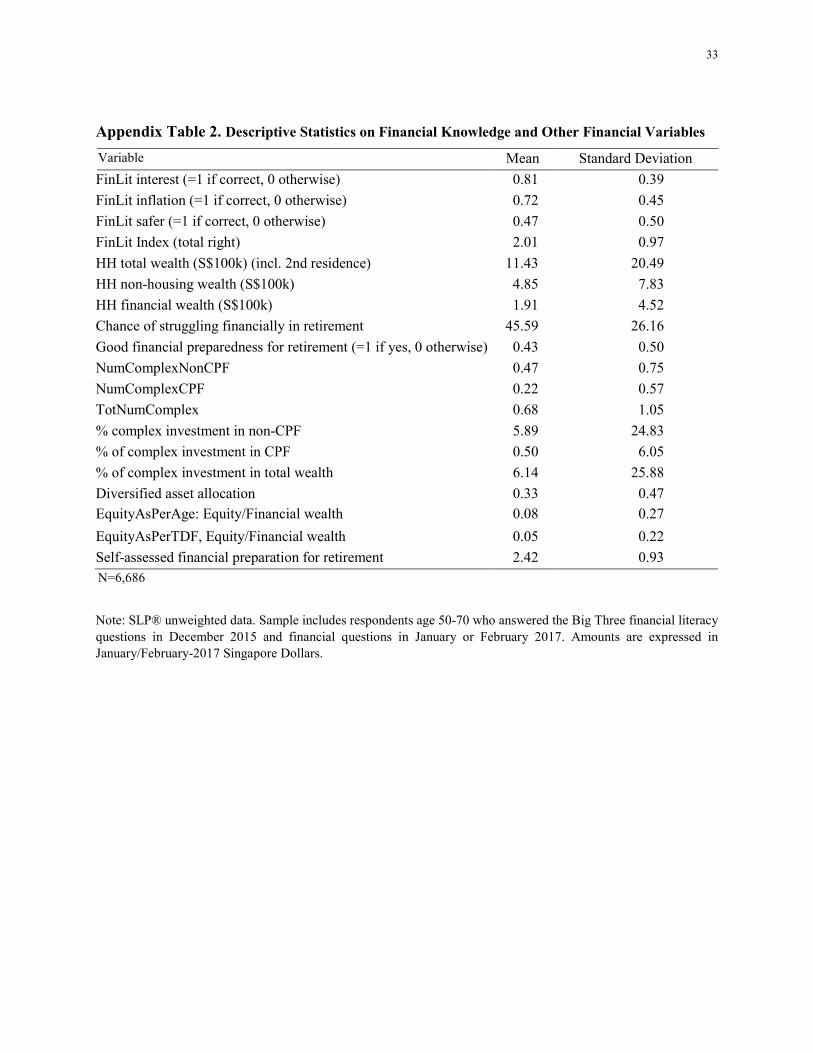
Appendix Table 2. Descriptive Statistics on Financial Knowledge and Other Financial Variables
Variable Mean Standard Deviation FinLit interest (=1 if correct, 0 otherwise) 0.81 0.39 FinLit inflation (=1 if correct, 0 otherwise) 0.72 0.45 FinLit safer (=1 if correct, 0 otherwise) 0.47 0.50 FinLit Index (total right) 2.01 0.97 HH total wealth (S$100k) (incl. 2nd residence) 11.43 20.49 HH non-housing wealth (S$100k) 4.85 7.83 HH financial wealth (S$100k) 1.91 4.52 Chance of struggling financially in retirement 45.59 26.16 Good financial preparedness for retirement (=1 if yes, 0 otherwise) 0.43 0.50 NumComplexNonCPF 0.47 0.75 NumComplexCPF 0.22 0.57 TotNumComplex 0.68 1.05 % complex investment in non-CPF 5.89 24.83 % of complex investment in CPF 0.50 6.05 % of complex investment in total wealth 6.14 25.88 Diversified asset allocation 0.33 0.47 EquityAsPerAge: Equity/Financial wealth 0.08 0.27 EquityAsPerTDF, Equity/Financial wealth 0.05 0.22 Self-assessed financial preparation for retirement 2.42 0.93 N=6,686
Note: SLP® unweighted data. Sample includes respondents age 50-70 who answered the Big Three financial literacy questions in December 2015 and financial questions in January or February 2017. Amounts are expressed in January/February-2017 Singapore Dollars.

34
Appendix Table 3. Descriptive Statistics on Other Control Variables
Variable Mean Standard Deviation
Age 50-54 0.27 0.45 Age 55-59 0.30 0.46 Age 60-64 0.23 0.42 Age 65-70 0.20 0.40 Female 0.52 0.50 Married 0.81 0.39 Education, primary 0.21 0.41 Education, secondary 0.41 0.49 Education, post-secondary 0.37 0.48 Fair/poor health 0.34 0.48 Work for pay 0.52 0.50 Self-employed 0.10 0.30 Home owner 0.84 0.36 Respondent manages finances 0.38 0.49 Respondent + other manage finances 0.46 0.50 Other manages finances 0.16 0.36 Household total wealth (S$100k) 11.43 20.49 Confident about knowledge of HH finances 0.78 0.41 Financial planning long horizon (>=5 years) 0.42 0.49 General risk preference 0.15 0.36 Financial risk preference 0.15 0.36 N=6,686
Note: SLP® unweighted data. Sample includes respondents age 50-70 who answered the Big Three financial literacy questions in December 2015 and financial questions in January or February 2017. Amounts are expressed in January/February-2017 Singapore Dollars.


![The Parameterized Complexity of Cascading Portfolio Schedulingpapers.nips.cc/paper/8983-the-parameterized... · Parameterized Complexity. In parameterized algorithmics [6, 4, 3, 9]](https://img.pdfslide.net/doc/110x75/5fa9b75fd3f3e97ad8547d86/the-parameterized-complexity-of-cascading-portfolio-parameterized-complexity-in.jpg)