Embed Size (px)
Citation preview
Financial literacy and long-term care insurance coverage
Katerina Gousia
Working Paper Series 26-2016
1
Financial literacy and long-term care insurance coverage
Katerina Gousia1
Personal Social Services Research Unit (PSSRU) and Centre for Health Services Studies (CHSS),
University of Kent
Abstract
Long-term care (LTC) is one of the biggest yet largely uninsured financial risks facing the
elderly. In a context of increasing individual responsibility over this risk we expect financial
literacy to be an important determinant of the insurance decision as is the case in other financial
domains. This paper empirically investigates the effect of financial literacy on the probability of
holding a private insurance contract using data from a European survey of the elderly which
contains information on these key variables. We find that financial literacy helps explain the
small size of the insurance market as more financially sophisticated respondents are more likely
to have an insurance contract controlling for a number of covariates and potential endogeneity.
This effect is large and distinct from other factors such as risk factors, risk tolerance and time
discounting.
1 Address: University of Kent, Canterbury, Kent CT2 7NF, United Kingdom. Tel: +4401227 816021. Email: [email protected]
2
1 Introduction
Population ageing and the decline of informal care supply in recent years have given rise to a
new type of financial risk in old age: that of costly formal long-term care (LTC). These trends
are projected to persist in the future putting upward pressure on such expenditures (Colombo and
Mercier 2012). So far people have mainly relied on public support, self-insurance or informal
support from family members to face LTC needs (Costa-Font and Courbage 2012). The role of
private insurance on the other hand has been limited even in countries such as the US (Colombo,
Llena-Nozal et al. 2011). This finding is puzzling. First, insurance would be optimal for a
rational and risk-averse individual in the context of LTC where expenditures are large, uncertain
and potentially catastrophic. 2 Second, with reduced availability of informal care and tight
government budgets one would expect an expansion of financing arrangements. Although LTC
risk is increasingly becoming individuals’ responsibility, insurance coverage has not yet
developed in a complementary nor a substitutive way to the traditional financing options.
A growing body of research has developed for the study of this puzzle and several
explanations have been put forward. Market imperfections on the supply side such as adverse
selection or moral hazard and dynamic contracting problems are partly to be blamed for the high
loads and market contraction although not enough to explain the puzzle without also considering
demand-side constraints (Brown and Finkelstein 2009). Among the most common ones, shown
to mitigate the development of the market, are crowding out by home equity, public coverage
programs and substitution from informal care (Davidoff 2010, Pauly 1990, Brown and
Finkelstein 2008, Costa-Font 2010). The decreasing availability of formal and informal 2 The estimated probability of a 65 year old person entering a nursing home is over 40% and stays can last for as long as over 5 years for about 15-20% of newcomers (Kemper and Murtaough (1991), Murtaough, Kemper et al. (1997)). To get a sense of the associated costs, the median cost for a private room in a nursing home in 2014 in the US was $240/day (Genworth 2014).
3
substitutes however, suggests that other aspects of the demand side could be at play. In particular
the role of behavioural and information biases remains largely unexplored in the context of LTC
decision making. A few studies have highlighted the role risk perceptions, knowledge and
myopic denial play in the development of the market (Zhou-Richter, Browne et al. 2010, Costa-
Font and Font 2009, Coe, Skira et al. 2015) but evidence on the role of consumer knowledge and
rationality remains scant.
This paper contributes in that direction by examining the effect of financial literacy on LTC
insurance demand. Financial literacy, by which we mean the skill to process economic
information in making informed financial decisions, is likely to influence insurance demand for a
number of reasons. First, in recent years it is recognised as a core skill, essential for all key
financial decisions (OECD 2016). More financially sophisticated individuals are shown to be
better prepared for retirement, participate in financial markets and accumulate more wealth and
less debt to name a few (Lusardi and Mitchell 2014). It is conceivable that the effect of financial
literacy extends to LTC, a complex decision that would require one to understand survival
probabilities and estimate highly uncertain future medical expenditures in order to make a sound
financial decision. This effect is likely to matter more for the elderly, among whom financial
illiteracy is widespread and whose skills start to decline at this phase of the life cycle (Agarwal,
Driscoll et al. 2009, Banks 2010). Second, a substantial part of the market, where it has
developed, is characterised by individual as opposed to group contracts.3 This suggests that, in
the absence of employers’ potential agency role, individual rationality is likely to play a greater
3 In 2009 individual contracts represented 55% of the market in France, 58% of new contracts sold and 67% of policies in force in the United States (Colombo, Llena-Nozal et al. 2011, Brown and Finkelstein 2011).
4
role in the decision making process and LTC becomes an ideal framework for disentangling the
financial literacy effect.
To the best of our knowledge, there is no prior empirical research on the effect of financial
literacy on LTC insurance demand. Furthermore, whilst evidence usually comes from the US this
analysis focuses on Europe whose LTC insurance market is not yet well understood due to its
small size. To this end we use individual level data from a European survey of elderly people
which is unique in that it includes data on both insurance and financial literacy status.
We find evidence that financial literacy and insurance coverage are low among Europe’s
elderly. Higher financial literacy is associated with a higher probability of holding private LTC
insurance. The effect is sizeable and statistically significant even after we control for a number of
characteristics and account for the endogeneity of financial literacy, across a number of
specifications.
This paper is organised as follows. Section 2 provides some background on LTC financing in
Europe with a particular emphasis on private insurance. Section 3 discusses how financial
literacy can affect LTC insurance demand. Section 4 describes the data and econometric
approach. Section 5 reports the empirical evidence and section 6 concludes.
2 Private insurance and LTC in Europe
The market for insurance for LTC is markedly underdeveloped. Except for the United States
and Japan, France, Germany and Israel are the countries where this market is most present
(Colombo, Llena-Nozal et al. 2011). In most European countries the market is practically non-
existent with private insurance financing less than 2% of total LTC expenditure (Colombo and
Mercier 2012). The scope for expansion of private insurance in those countries has been
5
traditionally shaped by the combination of public insurance and informal care which vary across
Europe (Costa-Font and Courbage 2012). Where the market has been present in Europe, two
types of contracts have developed: partial reimbursement and indemnity policies (Colombo,
Llena-Nozal et al. 2011).
France is the largest LTC insurance market in Europe with about 5.5 million policyholders in
2010 (about 15% of population aged over 40) (OECD 2011, FFSA 2010). Indemnity policies are
the dominant model. Individuals typically pay an annual premium in exchange of a fixed future
stream of income in the form of monthly cash benefits (Colombo, Llena-Nozal et al. 2011),
(Courbage and Roudaut 2008). LTC insurance contracts can be individual or collective with the
group market in France representing about 45 percent of the market in 2009 (OECD 2011).
In Israel there are three types of private LTC insurance: commercial individual LTC
insurance, commercial collective LTC insurance and collective LTC insurance through the health
plans. Over 4 million people (60% of the entire population including children) have some form
of private LTC insurance policy. The majority of policy holders (88%) have collective insurance,
mainly through their health plan, but also commercial, purchased together with other
supplemental insurances. Approximately 18% have either form of commercial LTC insurance
(Brammli-Greenberg, Waitzberg et al. 2012).
Germany’s private insurance market consists of two types. A compulsory (reimbursement
policy) one for individuals who have opted out of the social health insurance (approximately 9%
of the population) and a voluntary one (indemnity policies) which insures eligible expenses not
covered by the LTC insurance programme (approximately 3.5% of the population) (Colombo,
Llena-Nozal et al. 2011).
6
In other European countries the private insurance market remains stagnant (e.g. the UK), with
some growing trends observed in countries such as Spain and Italy based on indemnity policies
(Colombo, Llena-Nozal et al. 2011).
Contrary to the private market, public support for LTC is more extended in Europe. Most
European countries have developed some public system to finance LTC expenditure although
there is great variation across countries in terms of coverage arrangements. Several countries
have universal coverage within a single program, either as part of a tax-funded social care system
(e.g. Nordic countries), through dedicated social insurance schemes (e.g. Germany, the
Netherlands) or by arranging for LTC coverage mostly within the health system (e.g. Belgium).
Other countries have more mixed systems comprising of different benefits and schemes with
different degrees of coverage depending on target groups, specific LTC cost components and in
some cases jurisdiction (e.g. Austria, France, Italy, the Czech Republic) (Colombo and Mercier
2012).
3 Financial literacy and LTC insurance
In the context of private LTC insurance we discuss two potential frameworks financial
literacy could impact through: limited information and reference-dependence preferences.
Standard economic theory assumes that individuals are perfectly rational agents who maximise
expected utility fully utilising all available information and based on stable preferences; when
new information is acquired expectations are updated typically assumed in a Bayesian manner.
In practice, it is likely that people do not have full information with respect to the risks and costs
associated with LTC and insurance. In other domains of catastrophic insurance, people tend to
have difficulties understanding low-probability high-loss events and under-insure even when
7
premiums are close to actuarially fair levels levels (Johnson, Hershey et al. 1993, Kahneman and
Tversky 2000). Kunreuther and Pauly (2004) propose a model of bounded rationality according
to which when the event probability is sufficiently small, the search costs associated with
collecting information about the loss probability outweigh the expected benefits from insurance
to the extent that people find it optimal not to purchase insurance. Limited understanding of fees,
costs and benefits of different financial products also seems prevalent in other markets especially
among the least financially sophisticated population groups (Baicker, Congdon et al. 2012,
Benartzi, Previtero et al. 2011, Lusardi and Mitchell 2014, Dominitz, Hung et al. 2008). In the
presence of such information gaps, financial literacy could help reduce information search costs
and improve understanding of the financial implications of the insurance decision.
Another concept likely relevant in the context of LTC insurance is that of reference-dependent
preferences by which value is perceived in relative rather than in absolute terms (Kahneman and
Tversky 1979). This can manifest as loss aversion with people weighting negative utility from
losses more than positive utility from gains (Tversky and Kahneman 1992) suggesting less
‘shopping around’ and greater sensitivity to framing. For example when insurance is framed as a
loss of premiums traded for an uncertain gain from coverage, take-up is discouraged (Slovic,
Fischhoff et al. 1997) while annuities are viewed as less attractive when presented in an
investment as opposed to a consumption framework (Brown, Kling et al. 2008). Gottlieb and
Mitchell (2015) further found that LTC insurance coverage was lower among ‘narrow framers’,
i.e. people taking decisions in isolation. Status quo bias can be another manifestation. People
preferring the default option of non-purchase is observed in other markets especially when they
are faced with difficult calculations (Kahneman, Knetsch et al. 1991). The extent of these biases
is likely to be associated with financial literacy (Mitchell and Lusardi 2011).
8
It is difficult to identify the mechanisms through which financial literacy impacts on decision
making with the available data. We expect the information channel to be the most relevant one
but we cannot exclude or disentangle potential effects arising from changes on behavioural
biases and heuristics outlined above as SHARE does not record such information.
4 Data and empirical strategy
4.1 Data
We use data from Wave 5 (release 5-0-0) of the Survey of Health, Ageing and Retirement in
Europe (SHARE), a multidisciplinary cross-national survey of micro data on health, socio-
economic status and social and family networks of individuals aged 50 and over and their
spouses independent of age (Börsch-Supan, A. 2015).4 Wave 5 collects 2013 data from a number
of European countries. 5 Except for the wealth of information on numerous individual
characteristics, this dataset is uniquely suited for the purposes of this study as it contains
measures of the two main variables of interest, LTC insurance coverage and financial literacy.
Data on these variables either separately or in combination is scarce, particularly for Europe.
Furthermore, Wave 5 includes a mini childhood module which complements the retrospective
SHARELIFE interview of Wave 3 and contains information on respondents’ early life such as
living and health conditions, school performance and financial situation in childhood. This
information is used in the context of the instrumental variables empirical strategy which we
discuss in a subsequent section. Information for the longitudinal sample on steady characteristics
(such as education, gender, year of birth etc.) and childhood life was merged in the dataset from
previous waves. Imputed variables were used for variables with a substantive number of missing 4 For more information on SHARE data see Börsch-Supan, A. et al. (2013). 5 Wave 5 countries include: Austria, Germany, Sweden, Netherlands, Spain, Italy, France, Denmark, Switzerland, Belgium, Israel, Czech Republic, Luxembourg, Slovenia and Estonia
9
values such as wealth. Finally, we dropped extreme age values restricting the sample above 30
and below 100 years old.
4.2 Measures
4.2.1 Dependent variable
In Wave 5 a new question was introduced in the SHARE questionnaire as part of the health
care module:6 “Do you have any of the following public or private LTC insurances?”. The
choices were: “1. Public; 2. Private mandatory; 3. Private voluntary/supplementary; 96. None”.
Respondents could select as many answers as they wanted. An indicator variable for whether
individuals have private voluntary or supplementary LTC insurance is the measure of insurance
coverage.
A few things are worth noting regarding this data. First, the question was not asked in
Germany, Belgium, Slovenia and Estonia (Bucher-Koenen, Schütz et al. 2015).7 Second, there
are country-specific differences in the way questions are phrased across countries to account for
the different care arrangements but we don’t expect this to affect the measure of insurance
coverage.8 One exception to this is the Swedish questionnaire that asked respondents if they have
a public of private ‘hälsovårdsförsäkring’ which translates as private health care insurance and
therefore doesn’t cover accurately the subject-matter of interest.
6 SHARE has a similar question on long-term care insurance in Wave 1. However in that wave LTC insurance was imperfectly defined while self-reported data did not match other sources of evidence on long-term care insurance coverage. We opted for the Wave 5 question in this analysis as this question measures more accurately and reliably the variable of interest. 7 In the case of Belgium more specifically the question was only asked in the French speaking part but not in the Flemish speaking part. 8 For example, in Austria, Switzerland and Sweden respondents were asked whether they owned any private long-term care insurance and could opt for ‘yes’ or ‘no’. The Danish survey does not distinguish between private mandatory and private voluntary long-term care insurance but only offers the category ‘private’ insurance. Given the universal system for long-term care in Denmark we expect this question to capture accurately those with private voluntary insurance.
10
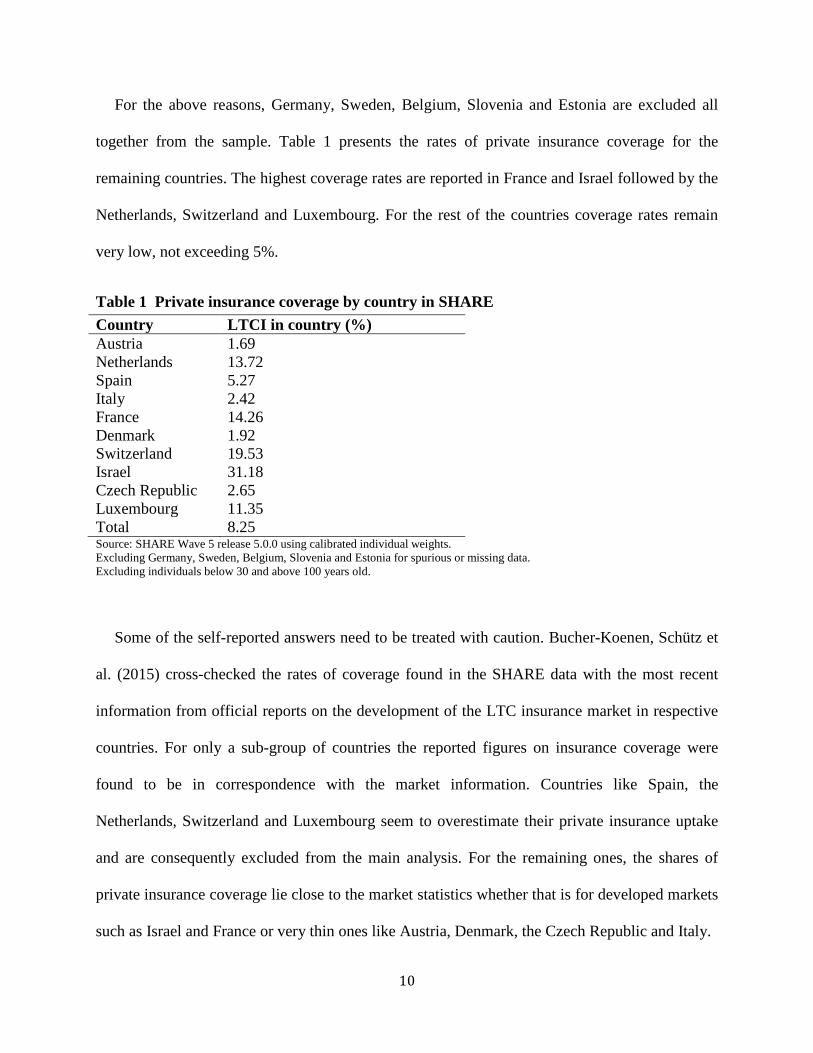
For the above reasons, Germany, Sweden, Belgium, Slovenia and Estonia are excluded all
together from the sample. Table 1 presents the rates of private insurance coverage for the
remaining countries. The highest coverage rates are reported in France and Israel followed by the
Netherlands, Switzerland and Luxembourg. For the rest of the countries coverage rates remain
very low, not exceeding 5%.
Table 1 Private insurance coverage by country in SHARE Country LTCI in country (%) Austria 1.69 Netherlands 13.72 Spain 5.27 Italy 2.42 France 14.26 Denmark 1.92 Switzerland 19.53 Israel 31.18 Czech Republic 2.65 Luxembourg 11.35 Total 8.25 Source: SHARE Wave 5 release 5.0.0 using calibrated individual weights. Excluding Germany, Sweden, Belgium, Slovenia and Estonia for spurious or missing data. Excluding individuals below 30 and above 100 years old.
Some of the self-reported answers need to be treated with caution. Bucher-Koenen, Schütz et
al. (2015) cross-checked the rates of coverage found in the SHARE data with the most recent
information from official reports on the development of the LTC insurance market in respective
countries. For only a sub-group of countries the reported figures on insurance coverage were
found to be in correspondence with the market information. Countries like Spain, the
Netherlands, Switzerland and Luxembourg seem to overestimate their private insurance uptake
and are consequently excluded from the main analysis. For the remaining ones, the shares of
private insurance coverage lie close to the market statistics whether that is for developed markets
such as Israel and France or very thin ones like Austria, Denmark, the Czech Republic and Italy.
11
We end up therefore with a subgroup of six core countries whose data on insurance coverage
are more reliable. Further in the analysis we repeat the estimation including the other countries as
well as a robustness test.
4.2.2 Explanatory variable
A measure of financial literacy is taken from the set of numerical and financial questions
asked in SHARE. There are four questions asking people to sequentially calculate a percentage,
the price of a good after discounting, the original price of a good sold at a fraction of its cost and
interest rate compounding. Especially knowledge of interest rate compounding has been widely
used and is considered a good proxy for financial literacy (Atkinson and Messy 2012, Lusardi
and Mitchell 2007, Lusardi, Mitchell et al. 2010). Depending on whether the first question was
answered correctly or not respondents are then directed to questions three and four or two
respectively. SHARE combines these questions into a single summary index which we interpret
as the measure of current financial literacy; higher values indicate higher financial sophistication.
Overall, this index is a measure of basic knowledge and skills with financial matters. The exact
wording of the questions and details on how the financial literacy index was constructed are set
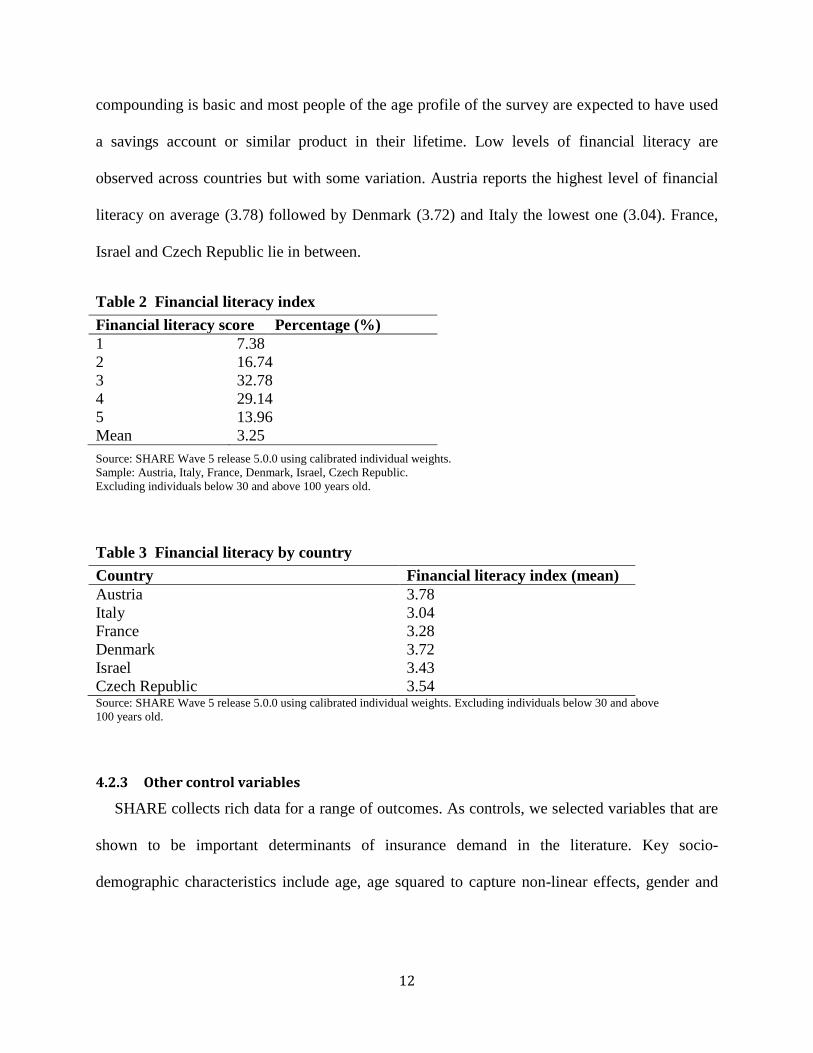
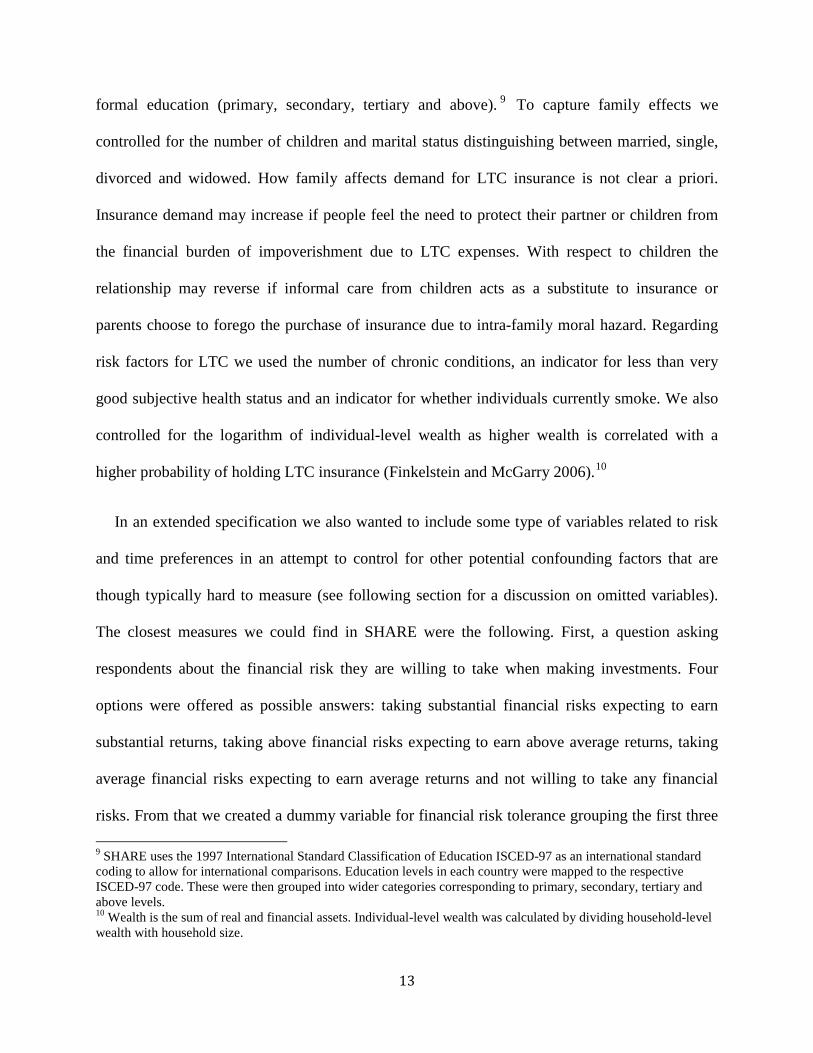
out in the Appendix. Table 2 presents the distribution of the financial literacy index overall and
Table 3 across countries for the restricted sample of six countries. The financial literacy score
ranges from 1 to 5 corresponding to the lowest and highest possible literacy levels respectively.
The mean of the distribution lies around 3 which is indicative of low financial literacy levels in
the sample. Close to 57% of the respondents have got no or only one question right (scores 1 to
3) while approximately 30% have answered two questions correctly (score 4). Only 14% of
respondents reached the highest score which corresponds to three correct answers including the
interest rate compounding question one. This is particularly interesting as the question on
12
compounding is basic and most people of the age profile of the survey are expected to have used
a savings account or similar product in their lifetime. Low levels of financial literacy are
observed across countries but with some variation. Austria reports the highest level of financial
literacy on average (3.78) followed by Denmark (3.72) and Italy the lowest one (3.04). France,
Israel and Czech Republic lie in between.
Table 2 Financial literacy index
Source: SHARE Wave 5 release 5.0.0 using calibrated individual weights. Sample: Austria, Italy, France, Denmark, Israel, Czech Republic. Excluding individuals below 30 and above 100 years old.
Table 3 Financial literacy by country Country Financial literacy index (mean) Austria 3.78 Italy 3.04 France 3.28 Denmark 3.72 Israel 3.43 Czech Republic 3.54 Source: SHARE Wave 5 release 5.0.0 using calibrated individual weights. Excluding individuals below 30 and above 100 years old.
4.2.3 Other control variables
SHARE collects rich data for a range of outcomes. As controls, we selected variables that are
shown to be important determinants of insurance demand in the literature. Key socio-
demographic characteristics include age, age squared to capture non-linear effects, gender and
Financial literacy score Percentage (%) 1 7.38 2 16.74 3 32.78 4 29.14 5 13.96 Mean 3.25
13
formal education (primary, secondary, tertiary and above). 9 To capture family effects we
controlled for the number of children and marital status distinguishing between married, single,
divorced and widowed. How family affects demand for LTC insurance is not clear a priori.
Insurance demand may increase if people feel the need to protect their partner or children from
the financial burden of impoverishment due to LTC expenses. With respect to children the
relationship may reverse if informal care from children acts as a substitute to insurance or
parents choose to forego the purchase of insurance due to intra-family moral hazard. Regarding
risk factors for LTC we used the number of chronic conditions, an indicator for less than very
good subjective health status and an indicator for whether individuals currently smoke. We also
controlled for the logarithm of individual-level wealth as higher wealth is correlated with a
higher probability of holding LTC insurance (Finkelstein and McGarry 2006).10
In an extended specification we also wanted to include some type of variables related to risk
and time preferences in an attempt to control for other potential confounding factors that are
though typically hard to measure (see following section for a discussion on omitted variables).
The closest measures we could find in SHARE were the following. First, a question asking
respondents about the financial risk they are willing to take when making investments. Four
options were offered as possible answers: taking substantial financial risks expecting to earn
substantial returns, taking above financial risks expecting to earn above average returns, taking
average financial risks expecting to earn average returns and not willing to take any financial
risks. From that we created a dummy variable for financial risk tolerance grouping the first three 9 SHARE uses the 1997 International Standard Classification of Education ISCED-97 as an international standard coding to allow for international comparisons. Education levels in each country were mapped to the respective ISCED-97 code. These were then grouped into wider categories corresponding to primary, secondary, tertiary and above levels. 10 Wealth is the sum of real and financial assets. Individual-level wealth was calculated by dividing household-level wealth with household size.
14
categories together and having those individuals not willing to take any financial risks as the
reference group. Second, SHARE also asks individuals to choose what better describes their
saving and spending planning horizon given the following options: next few months; next year;
next few years; next 5-10 years and longer than 10 years. An indicator for short-term planning
horizon was generated by grouping the ‘next few months’ and ‘next year’ answers together while
the remaining categories capture together the reference group of long-term planning.
Lastly, in all specifications, we include country-level fixed effects to account for institutional,
supply and cultural differences regarding LTC and insurance across countries.
4.3 Empirical strategy
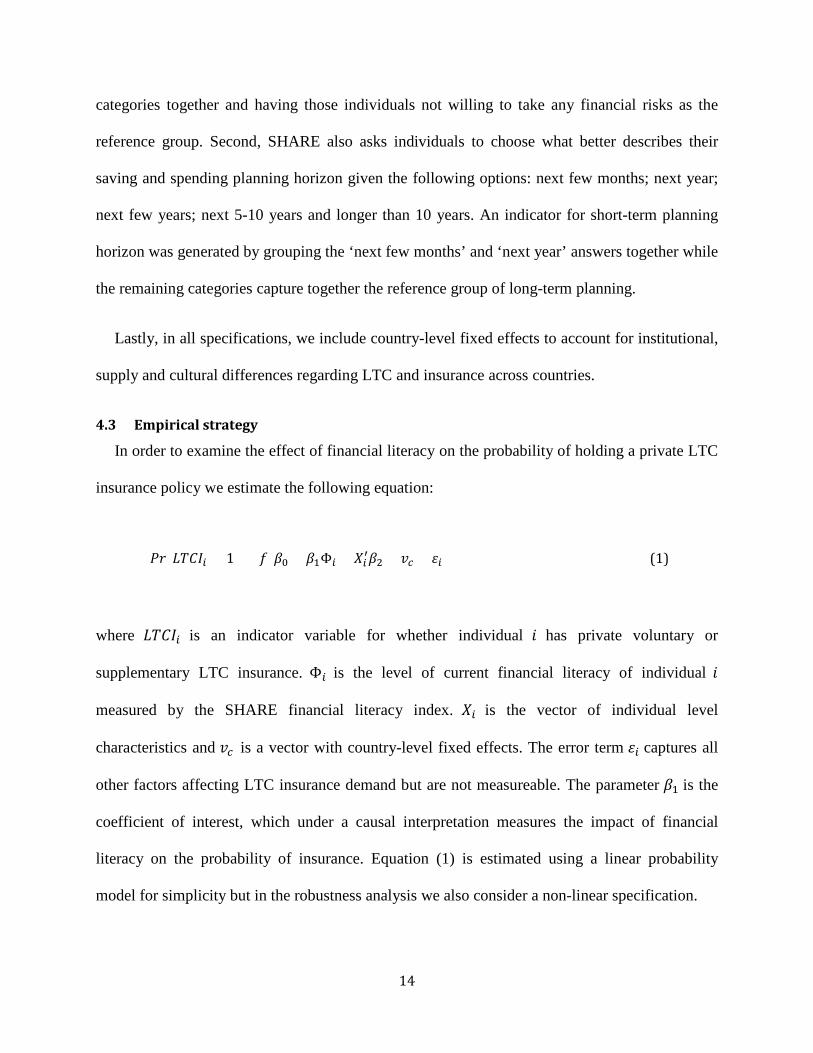
In order to examine the effect of financial literacy on the probability of holding a private LTC
insurance policy we estimate the following equation:
𝑃𝑃(𝐿𝐿𝐿𝐿𝑖 = 1) = 𝑓(𝛽0 + 𝛽1Φ𝑖 + 𝑋𝑖′𝛽2 + 𝑣𝑐 + 𝜀𝑖) (1)
where 𝐿𝐿𝐿𝐿𝑖 is an indicator variable for whether individual 𝑖 has private voluntary or
supplementary LTC insurance. Φ𝑖 is the level of current financial literacy of individual 𝑖
measured by the SHARE financial literacy index. 𝑋𝑖 is the vector of individual level
characteristics and 𝑣𝑐 is a vector with country-level fixed effects. The error term 𝜀𝑖 captures all
other factors affecting LTC insurance demand but are not measureable. The parameter 𝛽1 is the
coefficient of interest, which under a causal interpretation measures the impact of financial
literacy on the probability of insurance. Equation (1) is estimated using a linear probability
model for simplicity but in the robustness analysis we also consider a non-linear specification.
15
The estimates from this model are unlikely to be consistent if financial literacy is endogenous.
Financial literacy has been typically treated as a type of human capital, endogenously determined
with respect to saving decisions in the literature (Jappelli and Padula 2013, Lusardi and Mitchell
2014). In the context of LTC insurance endogeneity may arise as a result of reverse causality,
whereby those with experience in having insurance develop a better understanding of financial
matters, or as a result of omitted variables that we don’t fully control for. Such variables may
include unobserved risk factors and preference-based variables such as time preferences, risk
preferences, cautiousness or taste for financial issues. These variables are usually not measured
accurately (for example (Finkelstein and McGarry 2006) found evidence of residual private
information about risk factors even after controlling for a wide range of risk factors) and are
expected to affect both decisions to buy LTC insurance and invest in acquiring financial literacy
(Jappelli 2010, Bradford and Burgess 2010, Meier and Sprenger 2013, de Meza and Webb 2001,
Cox, Brounen et al. 2015, Bajo, Barbi et al. 2015). The direction of the effect of these
unobserved factors is not clear a priori and thus the sign of the bias is ambiguous.
As a first step in the identification strategy, we try to control for as many variables as possible
including measures of the potentially omitted ones. However we don’t expect to capture
everything affecting insurance demand even in the more extended specification as SHARE does
not include measures on all possible unobserved determinants. To deal with the remaining
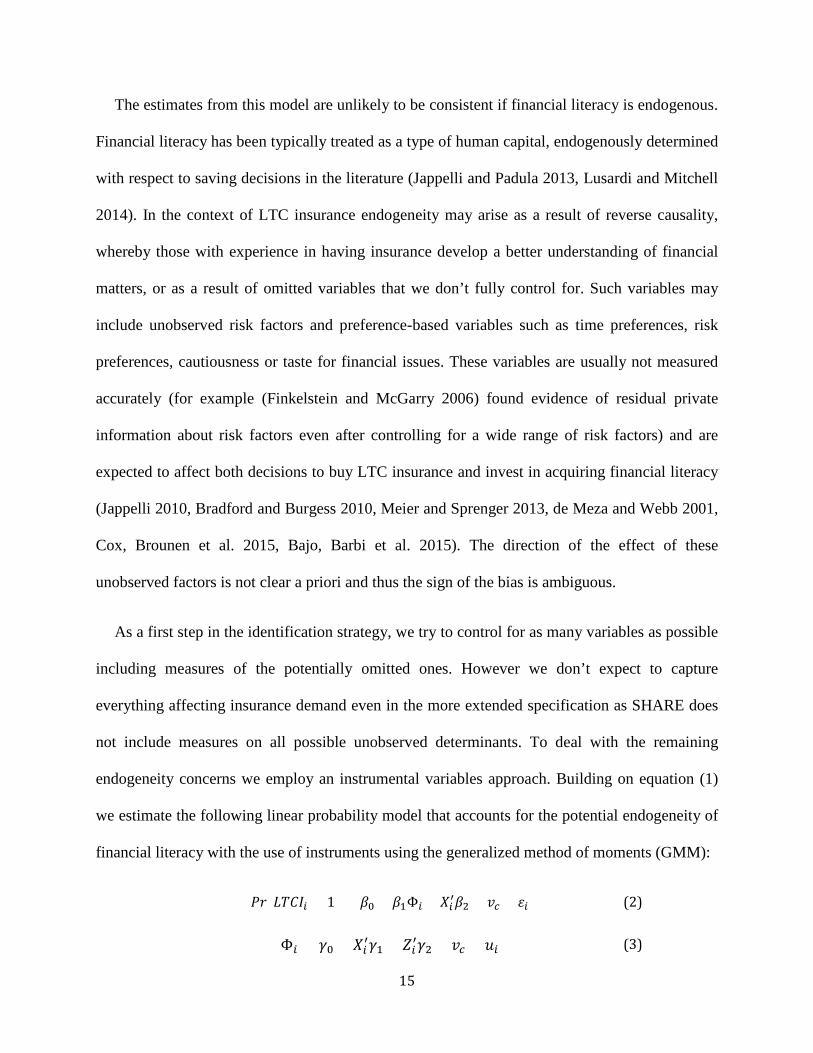
endogeneity concerns we employ an instrumental variables approach. Building on equation (1)
we estimate the following linear probability model that accounts for the potential endogeneity of
financial literacy with the use of instruments using the generalized method of moments (GMM):
𝑃𝑃(𝐿𝐿𝐿𝐿𝑖 = 1) = 𝛽0 + 𝛽1Φ𝑖 + 𝑋𝑖′𝛽2 + 𝑣𝑐 + 𝜀𝑖 (2) Φ𝑖 = 𝛾0 + 𝑋𝑖′𝛾1 + 𝑍𝑖′𝛾2 + 𝑣𝑐 + 𝑢𝑖 (3)
16
where 𝑋𝑖′ is the vector of control variables as in (1) and 𝑍𝑖′ is a vector of instruments for financial
literacy.
As a candidate instrument for financial literacy, we propose a measure that relates to the cost
or efficiency of acquiring financial knowledge, namely early life ability as measured by school
performance. Early life skills are likely to be highly correlated with the current level of financial
literacy by reducing the cost or increasing the efficiency of acquiring financial knowledge,
exogenous to unobserved factors affecting LTC insurance demand in later life and have no direct
effect on the LTC insurance choice other than through later life financial literacy. To the extent
that our measure captures an exogenous early life endowment then these assumptions are likely
to be satisfied. Under these assumptions the IV estimates will be consistent estimates of the
effect of financial literacy on LTC insurance coverage. In particular the measure used from
SHARE is a question from the childhood module asking respondents about their relative
performance in language at school at the age of ten.11 According to Havari and Mazzonna (2011)
the childhood information found in the SHARE retrospective studies shows a good level of
internal and external validity. This finding mitigates potential concerns about recall bias in the
answers and makes us more confident about using this data.
5 Results
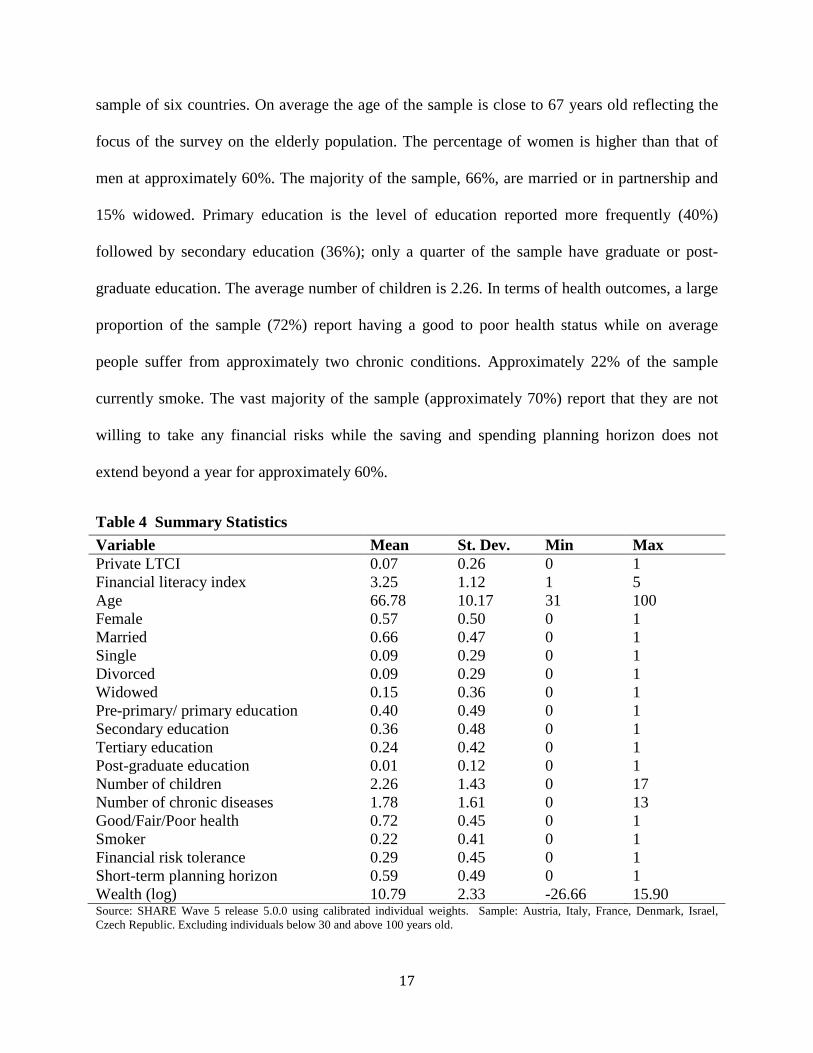
Table 4 presents summary statistics for all the variables used in the empirical model. LTC
insurance coverage lies on average around 7% and financial literacy at 3.25 for the restricted 11 SHARE also has a question on the relative school performance with respect to maths. Although we experimented with this variable as a possible instrument it didn’t satisfy the Hansen’s test of joint validity of instruments. We therefore used only language performance as an instrument in the main analysis and augmented the instrument set with other instruments for robustness.
17
sample of six countries. On average the age of the sample is close to 67 years old reflecting the
focus of the survey on the elderly population. The percentage of women is higher than that of
men at approximately 60%. The majority of the sample, 66%, are married or in partnership and
15% widowed. Primary education is the level of education reported more frequently (40%)
followed by secondary education (36%); only a quarter of the sample have graduate or post-
graduate education. The average number of children is 2.26. In terms of health outcomes, a large
proportion of the sample (72%) report having a good to poor health status while on average
people suffer from approximately two chronic conditions. Approximately 22% of the sample
currently smoke. The vast majority of the sample (approximately 70%) report that they are not
willing to take any financial risks while the saving and spending planning horizon does not
extend beyond a year for approximately 60%.
Table 4 Summary Statistics Variable Mean St. Dev. Min Max Private LTCI 0.07 0.26 0 1 Financial literacy index 3.25 1.12 1 5 Age 66.78 10.17 31 100 Female 0.57 0.50 0 1 Married 0.66 0.47 0 1 Single 0.09 0.29 0 1 Divorced 0.09 0.29 0 1 Widowed 0.15 0.36 0 1 Pre-primary/ primary education 0.40 0.49 0 1 Secondary education 0.36 0.48 0 1 Tertiary education 0.24 0.42 0 1 Post-graduate education 0.01 0.12 0 1 Number of children 2.26 1.43 0 17 Number of chronic diseases 1.78 1.61 0 13 Good/Fair/Poor health 0.72 0.45 0 1 Smoker 0.22 0.41 0 1 Financial risk tolerance 0.29 0.45 0 1 Short-term planning horizon 0.59 0.49 0 1 Wealth (log) 10.79 2.33 -26.66 15.90 Source: SHARE Wave 5 release 5.0.0 using calibrated individual weights. Sample: Austria, Italy, France, Denmark, Israel, Czech Republic. Excluding individuals below 30 and above 100 years old.
18
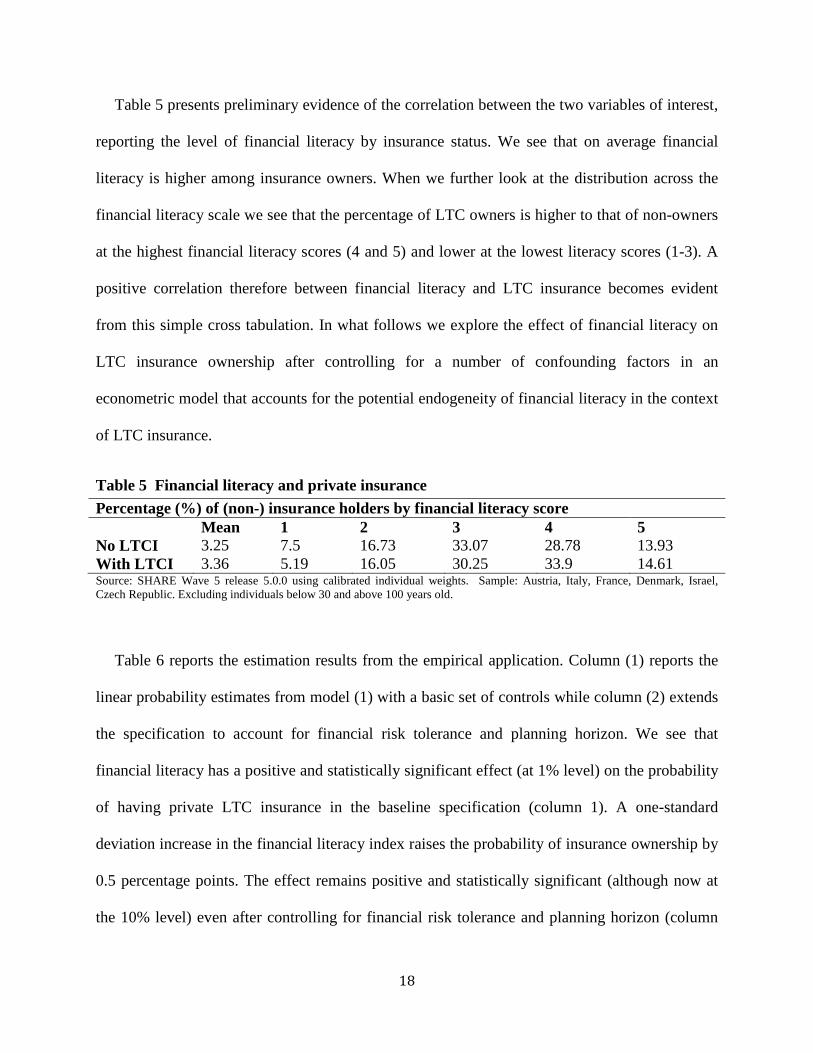
Table 5 presents preliminary evidence of the correlation between the two variables of interest,
reporting the level of financial literacy by insurance status. We see that on average financial
literacy is higher among insurance owners. When we further look at the distribution across the
financial literacy scale we see that the percentage of LTC owners is higher to that of non-owners
at the highest financial literacy scores (4 and 5) and lower at the lowest literacy scores (1-3). A
positive correlation therefore between financial literacy and LTC insurance becomes evident
from this simple cross tabulation. In what follows we explore the effect of financial literacy on
LTC insurance ownership after controlling for a number of confounding factors in an
econometric model that accounts for the potential endogeneity of financial literacy in the context
of LTC insurance.
Table 5 Financial literacy and private insurance Percentage (%) of (non-) insurance holders by financial literacy score Mean 1 2 3 4 5 No LTCI 3.25 7.5 16.73 33.07 28.78 13.93 With LTCI 3.36 5.19 16.05 30.25 33.9 14.61 Source: SHARE Wave 5 release 5.0.0 using calibrated individual weights. Sample: Austria, Italy, France, Denmark, Israel, Czech Republic. Excluding individuals below 30 and above 100 years old.
Table 6 reports the estimation results from the empirical application. Column (1) reports the
linear probability estimates from model (1) with a basic set of controls while column (2) extends
the specification to account for financial risk tolerance and planning horizon. We see that
financial literacy has a positive and statistically significant effect (at 1% level) on the probability
of having private LTC insurance in the baseline specification (column 1). A one-standard
deviation increase in the financial literacy index raises the probability of insurance ownership by
0.5 percentage points. The effect remains positive and statistically significant (although now at
the 10% level) even after controlling for financial risk tolerance and planning horizon (column
19
2). The effect in this specification drops to 0.3 percentage points. Age has a non-linear positive
effect initially rising and then falling after a certain age. We see therefore that our index of basic
financial knowledge has an independent effect on insurance demand, above and beyond the
effect of financial risk tolerance. Widowed individuals are significantly more likely to be
privately insured compared to married. This may reflect the greater need for formal care after the
death of a partner who could have been previously providing informal support. Evidence of
substitution from family members is also found in the case of children since the number of
children has a negative and statistically significant effect on the probability of having insurance.
An alternative mechanism, also compatible with this finding, is that of intra-family moral hazard
whereby parents may avoid insurance as a way to incentivize children to provide informal care.
The health-related variables like the number of chronic conditions and an indicator variable for
average to poor health status are interestingly found to reduce demand for private insurance in a
statistically significant way. Although counter-intuitive this result could be explained in the case
of supply side effects where people with worse health outcomes face higher insurance prices and
therefore reduce demand (Finkelstein and McGarry 2006). The finding is also compatible with
the presence of preference-based advantageous selection in the LTC insurance market. If
selection in this market takes place on the basis of characteristics like cautiousness, which has
been shown to increase both demand for LTC insurance and investment in health prevention
activities, it is likely we can observe a negative correlation between bad health conditions and
insurance demand (Finkelstein and McGarry 2006). In the second specification (column 2)
which controls for variables that could be omitted in the error term we see that the effects remain
negative and significant. The smoker indicator which except for a risk factor for LTC may also
measure cautiousness (Finkelstein and McGarry 2006) has a negative (yet not statistically
20
significant) effect on the probability of owning insurance suggesting a possible advantageous
selection in this sample. Insurance also seems to be purchased as a way of protecting individual
wealth from expensive LTC since the wealth coefficient is estimated positive and statistically
significant.
People with greater tolerance towards financial risks are associated with a higher insurance
demand compared to those not willing to take any financial risks. Although risk aversion is
intuitively associated with greater insurance demand (de Meza and Webb 2001) the positive
coefficient can be explained if our measure of financial risk tolerance picks up other
characteristics. The question does not correspond to the typical lottery questions used to measure
relative risk aversion coefficients. Although potentially highly correlated with the degree of risk
aversion as a preference parameter, we expect the specific question to also pick up unobserved
factors such as experience, attitude and even trust to financial products and markets. Evidence
from other markets (e.g. stock market, mortgages) suggests that risk tolerance is associated with
greater and more sophisticated participation in these markets (van Rooij, Lusardi et al. 2011,
Cox, Brounen et al. 2015). Lastly, people with a short-term saving and spending planning
horizon are, as expected, less likely to own insurance. Columns (3) and (4) report the respective
IV estimates from model (2). We see that in the instrumental variables specification the financial
literacy index coefficient remains positive and statistically significant (at the 1% level) in both
the baseline and extended specifications (columns 3 and 4 respectively). A one-standard
deviation increase in the financial literacy index raises the probability of insurance ownership by
approximately 5 percentage points. This effect is sizeable when looked in comparison to other
important determinants of insurance demand such as family arrangements, wealth and financial
risk tolerance. The instrument is highly correlated with financial literacy suggesting no problems
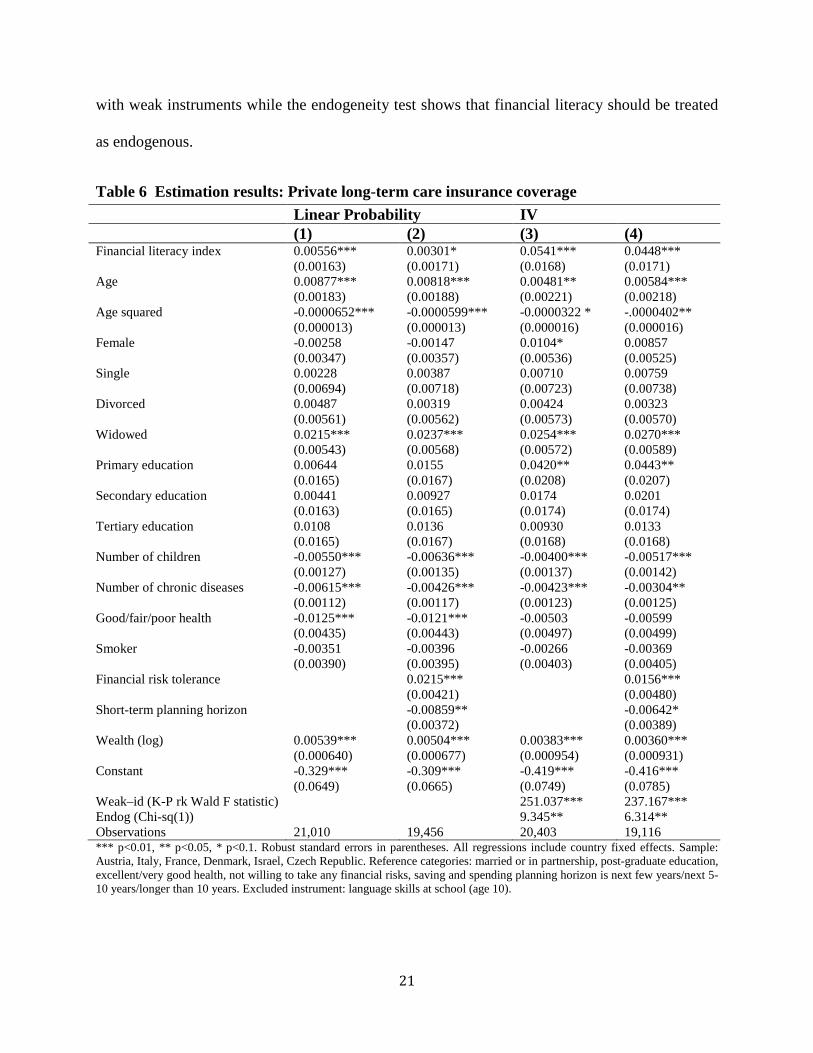
21
with weak instruments while the endogeneity test shows that financial literacy should be treated
as endogenous.
Table 6 Estimation results: Private long-term care insurance coverage Linear Probability IV (1) (2) (3) (4) Financial literacy index 0.00556*** 0.00301* 0.0541*** 0.0448*** (0.00163) (0.00171) (0.0168) (0.0171) Age 0.00877*** 0.00818*** 0.00481** 0.00584*** (0.00183) (0.00188) (0.00221) (0.00218) Age squared -0.0000652*** -0.0000599*** -0.0000322 * -.0000402** (0.000013) (0.000013) (0.000016) (0.000016) Female -0.00258 -0.00147 0.0104* 0.00857 (0.00347) (0.00357) (0.00536) (0.00525) Single 0.00228 0.00387 0.00710 0.00759 (0.00694) (0.00718) (0.00723) (0.00738) Divorced 0.00487 0.00319 0.00424 0.00323 (0.00561) (0.00562) (0.00573) (0.00570) Widowed 0.0215*** 0.0237*** 0.0254*** 0.0270*** (0.00543) (0.00568) (0.00572) (0.00589) Primary education 0.00644 0.0155 0.0420** 0.0443** (0.0165) (0.0167) (0.0208) (0.0207) Secondary education 0.00441 0.00927 0.0174 0.0201 (0.0163) (0.0165) (0.0174) (0.0174) Tertiary education 0.0108 0.0136 0.00930 0.0133 (0.0165) (0.0167) (0.0168) (0.0168) Number of children -0.00550*** -0.00636*** -0.00400*** -0.00517*** (0.00127) (0.00135) (0.00137) (0.00142) Number of chronic diseases -0.00615*** -0.00426*** -0.00423*** -0.00304** (0.00112) (0.00117) (0.00123) (0.00125) Good/fair/poor health -0.0125*** -0.0121*** -0.00503 -0.00599 (0.00435) (0.00443) (0.00497) (0.00499) Smoker -0.00351 -0.00396 -0.00266 -0.00369 (0.00390) (0.00395) (0.00403) (0.00405) Financial risk tolerance 0.0215*** 0.0156*** (0.00421) (0.00480) Short-term planning horizon -0.00859** -0.00642* (0.00372) (0.00389) Wealth (log) 0.00539*** 0.00504*** 0.00383*** 0.00360*** (0.000640) (0.000677) (0.000954) (0.000931) Constant -0.329*** -0.309*** -0.419*** -0.416*** (0.0649) (0.0665) (0.0749) (0.0785) Weak–id (K-P rk Wald F statistic) 251.037*** 237.167*** Endog (Chi-sq(1)) 9.345** 6.314** Observations 21,010 19,456 20,403 19,116 *** p<0.01, ** p<0.05, * p<0.1. Robust standard errors in parentheses. All regressions include country fixed effects. Sample: Austria, Italy, France, Denmark, Israel, Czech Republic. Reference categories: married or in partnership, post-graduate education, excellent/very good health, not willing to take any financial risks, saving and spending planning horizon is next few years/next 5-10 years/longer than 10 years. Excluded instrument: language skills at school (age 10).
22
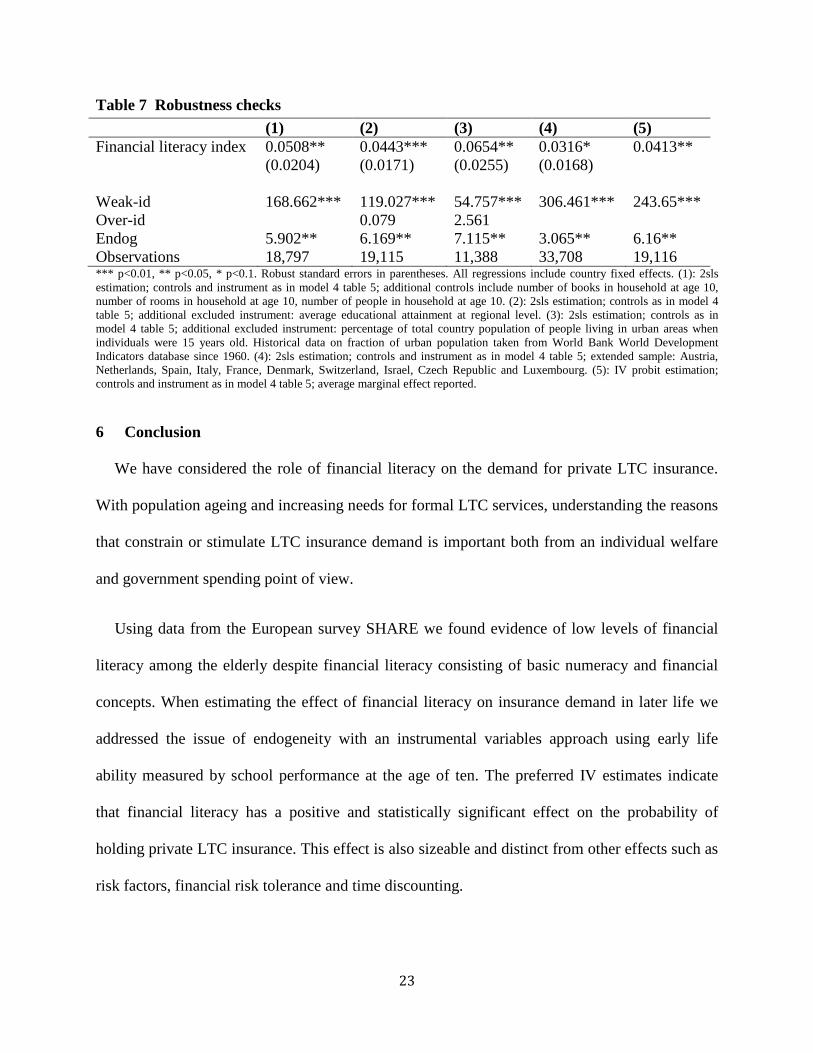
5.1 Robustness checks
Table 7 reports a battery of robustness checks. First we wanted to test that school performance
at age ten does not affect insurance demand due to a correlation with other early-life events and
family background. We therefore estimated the extended IV model now including as additional
controls the number of books, the number of rooms and the number of people in the household at
the age of ten (column 1). Second, the use of only one instrument does not allow us to test for
over identifying restrictions. To this end, we estimated the extended IV model with two
instruments this time. In addition to the early life language skills, the average education
attainment at the regional level (column 2) and the percentage of total country population of
people living in urban areas when individuals were fifteen years old (column 3) were used as
instruments. The rationale behind the choice of these instruments is that regional-level education
and country-level past fraction of urban population affect the incentives to invest in financial
literacy through increases in human capital and social interactions (Jappelli 2010) without
affecting the insurance decision. Next we replicated the main estimation model for the bigger
sample, now including the countries that were excluded due to potential misrepresentation of
coverage rates in the data (column 4). Lastly, we employed a non-linear specification with the
use of an IV probit model. The results did not change with the new specifications. The effect of
financial literacy is positive and statistically significant under all robustness checks.
Furthermore, the diagnostic tests support our hypotheses including the overidentifying
restrictions test that does not reject the null hypothesis of instrument validity in the case of two
instruments.
23
Table 7 Robustness checks (1) (2) (3) (4) (5) Financial literacy index 0.0508** 0.0443*** 0.0654** 0.0316* 0.0413** (0.0204) (0.0171) (0.0255) (0.0168) Weak-id 168.662*** 119.027*** 54.757*** 306.461*** 243.65*** Over-id 0.079 2.561 Endog 5.902** 6.169** 7.115** 3.065** 6.16** Observations 18,797 19,115 11,388 33,708 19,116 *** p<0.01, ** p<0.05, * p<0.1. Robust standard errors in parentheses. All regressions include country fixed effects. (1): 2sls estimation; controls and instrument as in model 4 table 5; additional controls include number of books in household at age 10, number of rooms in household at age 10, number of people in household at age 10. (2): 2sls estimation; controls as in model 4 table 5; additional excluded instrument: average educational attainment at regional level. (3): 2sls estimation; controls as in model 4 table 5; additional excluded instrument: percentage of total country population of people living in urban areas when individuals were 15 years old. Historical data on fraction of urban population taken from World Bank World Development Indicators database since 1960. (4): 2sls estimation; controls and instrument as in model 4 table 5; extended sample: Austria, Netherlands, Spain, Italy, France, Denmark, Switzerland, Israel, Czech Republic and Luxembourg. (5): IV probit estimation; controls and instrument as in model 4 table 5; average marginal effect reported.
6 Conclusion
We have considered the role of financial literacy on the demand for private LTC insurance.
With population ageing and increasing needs for formal LTC services, understanding the reasons
that constrain or stimulate LTC insurance demand is important both from an individual welfare
and government spending point of view.
Using data from the European survey SHARE we found evidence of low levels of financial
literacy among the elderly despite financial literacy consisting of basic numeracy and financial
concepts. When estimating the effect of financial literacy on insurance demand in later life we
addressed the issue of endogeneity with an instrumental variables approach using early life
ability measured by school performance at the age of ten. The preferred IV estimates indicate
that financial literacy has a positive and statistically significant effect on the probability of
holding private LTC insurance. This effect is also sizeable and distinct from other effects such as
risk factors, financial risk tolerance and time discounting.
24
A few limitations are worth noting. First, identification rests on the typical instrumental
variables assumptions some of which are difficult to test. The weak instruments and
overidentifying restrictions tests were satisfied and financial literacy was found significant even
after controlling for a range of other early life characteristics. To the extent that our measure of
early life skills captures exogenous characteristics we are confident that the instrument is
unlikely to be correlated to unobserved characteristics in later life.
A second limitation of this work is that we are not able to identify the mechanisms behind this
effect. The positive coefficient suggests that individuals underestimate the value of insurance in
the absence of financial literacy but the data does not allow us to disentangle the underlying
changes. We have discussed limited information and behavioural biases such as loss aversion,
framing and status quo bias as potential frameworks for the financial literacy effect but we
cannot be sure which effect is at play. We leave the study of these mechanisms for future
research.
The results have useful policy implications. If better financial skills in old age are linked to
higher coverage rates then better preparedness of the elderly is an effective way to stimulate
demand. Our measure of financial literacy in this application consisted of a set of very basic
numerical skills and financial knowledge such as interest rate compounding. The effect was
positive and significant beyond and above attitudes towards risk and time discounting suggesting
that enhancing even just basic financial knowledge is important. Of course educational programs
aimed at the financial sophistication of the elderly need to be considered along with other policy
alternatives, such as tax subsidies (Goda 2011) but given the large estimated effect it is likely
that they are a potentially cost effective intervention in raising insurance coverage.
25
Acknowledgements
This paper uses data from SHARE Waves 1, 2, 3 (SHARELIFE), 4 and 5 (DOIs:
10.6103/SHARE.w1.500, 10.6103/SHARE.w2.500, 10.6103/SHARE.w3.500,
10.6103/SHARE.w4.500, 10.6103/SHARE.w5.500), see Börsch-Supan et al. (2013) for
methodological details. The SHARE data collection has been primarily funded by the European
Commission through the FP5 (QLK6-CT-2001-00360), FP6 (SHARE-I3: RII-CT-2006-062193,
COMPARE: CIT5-CT-2005-028857, SHARELIFE: CIT4-CT-2006-028812) and FP7 (SHARE-
PREP: N°211909, SHARE-LEAP: N°227822, SHARE M4: N°261982). Additional funding
from the German Ministry of Education and Research, the U.S. National Institute on Aging
(U01_AG09740-13S2, P01_AG005842, P01_AG08291, P30_AG12815, R21_AG025169, Y1-
AG-4553-01, IAG_BSR06-11, OGHA_04-064) and from various national funding sources is
gratefully acknowledged (see www.share-project.org).
26
7 References
Agarwal, S., J. C. Driscoll, et al. (2009). "The Age of Reason: Financial Decisions over the Life Cycle and Implications for Regulation." Brookings Papers on Economic Activity: 51-101.
Atkinson, A. and F. Messy (2012). "Measuring Financial Literacy: Results of the OECD/ International Network on Financial Education (INFE) Pilot Study"." OECD Working Papers on Finance, Insurance and Private Pensions.
Baicker, K., W. J. Congdon, et al. (2012). "Health Insurance Coverage and Take-Up: Lessons from Behavioral Economics." Milbank Quarterly 90(1): 107-134.
Bajo, E., M. Barbi, et al. (2015). "Financial literacy, households' investment behaviour and risk propensity." Journal of Financial Management, Market and Institutions.
Banks, J. (2010). "Cognitive Function, Financial Literacy and Financial Outcomes at Older Ages: Introduction." Economic Journal 120(548): F357-F362.
Benartzi, S., A. Previtero, et al. (2011). "Annuitization Puzzles." Journal of Economic Perspectives 25(4): 143-164.
Börsch-Supan, A. (2015). Survey of Health, Ageing and Retirement in Europe (SHARE) Wave 5. Release version: 5.0.0. SHARE-ERIC. Data set. DOI: 10.6103/SHARE.w5.500.
Börsch-Supan, A., Brandt, M., Hunkler, C., Kneip, T., Korbmacher, J., Malter, F., Schaan, B., Stuck, S. and Zuber, S. (2013). Data Resource Profile: The Survey of Health, Ageing and Retirement in Europe (SHARE). International Journal of Epidemiology
Bradford, D. W. and J. F. Burgess (2010). Chapter 4 Individual Time Preferences and Health Behaviours with an Application to Health Insurance. Current Issues in Health Economics. D. Slottje and R. Tchernis, Emerald Group Publishing Limited. 290: 63-93.
Brammli-Greenberg, S., R. Waitzberg, et al. (2012). Private Long-Term Care Insurance in Israel, Smokler Center for Health Policy Research.
Brown, J., J. Kling, et al. (2008). "Why don't people insure later-life consumption? A framing explanation of the under-annuitization puzzle." American Economic Review 98(2): 304-309.
Brown, J. R. and A. Finkelstein (2008). "The interaction of public and private insurance: Medicaid and the long-term care insurance market." American Economic Review 98(3): 1083-1102.
Brown, J. R. and A. Finkelstein (2009). "The Private Market for Long-Term Care Insurance in the United States: A Review of the Evidence." Journal of Risk and Insurance 76(1): 5-29.
Bucher-Koenen, T., J. Schütz, et al. (2015). Long-term care insurance across Europe. Ageing in Europe - Supporting Policies for an Inclusive Society, SHARE.
Coe, N. B., M. M. Skira, et al. (2015). "Long-term care insurance: Does experience matter?" Journal of Health Economics 40: 122-131.
27
Colombo, F., A. Llena-Nozal, et al. (2011). Help Wanted? Providing and Paying for Long-Term Care, OECD Health Policy Studies.
Colombo, F. and J. Mercier (2012). "Help Wanted? Fair and Sustainable Financing of Long-term Care Services." Applied Economic Perspectives and Policy 34(2): 316-332.
Costa-Font, J. (2010). "Family ties and the crowding out of long-term care insurance." Oxford Review of Economic Policy 26(4): 691-712.
Costa-Font, J. and C. Courbage (2012). Financing long-term care in Europe: institutions, markets and models. Basingstoke, UK, Palgrave Macmillan.
Costa-Font, J. and M. Font (2009). "Does 'early purchase' improve the willingness to pay for long-term care insurance?" Applied Economics Letters 16(13): 1301-1305.
Courbage, C. and N. Roudaut (2008). "Empirical Evidence on Long-term Care Insurance Purchase in France." Geneva Papers on Risk and Insurance-Issues and Practice 33(4): 645-658.
Cox, R., D. Brounen, et al. (2015). "Financial Literacy, Risk Aversion and Choice of Mortgage Type by Households." Journal of Real Estate Finance and Economics 50(1): 74-112.
Davidoff, T. (2010). "Home equity commitment and long-term care insurance demand." Journal of Public Economics 94(1-2): 44-49.
de Meza, D. and D. C. Webb (2001). "Advantageous Selection in Insurance Markets." RAND Journal of Economics 32(2): 249-262.
Dominitz, J., A. Hung, et al. (2008). "How do mutual fund fees affect investor choices?" RAND Working Paper WR-653.
FFSA (2010). "Rapport Annuel FFSA."
Finkelstein, A. and K. McGarry (2006). "Multiple dimensions of private information: Evidence from the long-term care insurance market." American Economic Review 96(4): 938-958.
Genworth 2014, Cost of Care Survey
Goda, G. S. (2011). "The impact of state tax subsidies for private long-term care insurance on coverage and Medicaid expenditures." Journal of Public Economics 95(7-8): 744-757.
Gottlieb, D. and O. S. Mitchell (2015). "Narrow framing and long-term care insurance." NBER Working Paper 21048.
Havari, E. and F. Mazzonna (2011). "Can we trust older people's statements on their childhood circumstances? Evidence from SHARELIFE." SHARE Working Paper Series 05-2011.
Jappelli, T. (2010). "Economic litearcy: An international comparison." Economic Journal 120: F429-F451.
Jappelli, T. and M. Padula (2013). "Investment in Financial Literacy and Saving Decisions." Journal of Banking and Finance 37(8): 2779-2792.
28
Johnson, E. J., J. Hershey, et al. (1993). "Framing, Probability Distortions, and Insurance Decisions." Journal of Risk and Uncertainty 7(1): 35-51.
Kahneman, D., J. L. Knetsch, et al. (1991). "The Endowment Effect, Loss Aversion and Status Quo Bias: Anomalies." Journal of Economic Perspectives 5(1): 193-206.
Kahneman, D. and A. Tversky (1979). "Prospect Theory: An Analysis of Decision under Risk." Econometrica 47(2): 263-291.
Kahneman, D. and A. Tversky (2000). Choice, Values and Frames, Cambridge University Press.
Kunreuther, H. and M. Pauly (2004). "Neglecting Disaster: Why Don't People Insure Against Large Losses?" Journal of Risk and Uncertainty 28(1): 5-21.
Lusardi, A. and O. S. Mitchell (2007). "Baby Boomer retirement security: The roles of planning, financial literacy, and housing wealth." Journal of Monetary Economics 54(1): 205-224.
Lusardi, A. and O. S. Mitchell (2014). "The Economic Importance of Financial Literacy: Theory and Evidence." Journal of Economic Literature 52(1): 5-44.
Lusardi, A., O. S. Mitchell, et al. (2010). "Financial Literacy among the Young." Journal of Consumer Affairs 44(2): 358-380.
Meier, S. and C. D. Sprenger (2013). "Discounting financial literacy: Time preferences and participation in financial education programs." Journal of Economic Behavior & Organization 95: 159-174.
Mitchell, O. S. and A. Lusardi (2011). Financial Literacy: Implications for Retirement Security and the Financial Marketplace, Oxford University Press.
OECD (2011). Long-term Care - France.
OECD (2016). "Financial Education in Europe: Trends and Recent Developments." OECD Publishing.
Pauly, M. V. (1990). "The Rational Nonpurchase of Long-Term-Care Insurance." Journal of Political Economy 98(1): 153-168.
Slovic, P., B. Fischhoff, et al. (1997). "Preference for Insuring Against Probable Small Losses: Insurance Implications." Journal of Risk and Insurance 44(2): 237-258.
Tversky, A. and D. Kahneman (1992). "Advances in Prospect Theory: Cumulative Representation of Uncertainty." Journal of Risk and Uncertainty 5: 297-323.
van Rooij, M., A. Lusardi, et al. (2011). "Financial literacy and stock market participation." Journal of Financial Economics 101(2): 449-472.
Zhou-Richter, T., M. J. Browne, et al. (2010). "Don't They Care? Or, Are They Just Unaware? Risk Perception and the Demand for Long-Term Care Insurance." Journal of Risk and Insurance 77(4): 715-747.

29
8 Appendix
8.1 Financial literacy in SHARE
SHARE asks four numerical and financial questions that are used to construct the financial
literacy index:
1. If the chance of getting a disease is 10% how many people out of 1,000 would be
expected to get the disease? Possible answers: 100; 100; 90; 900 and another answer.
2. In a sale, a shop is selling all items at half price. Before the sale a sofa costs 300 euro.
How much will it cost in the sale? The possible answers: 150; 600 and another answer.
3. A second hand car dealer is selling a car for 6,000 euro. This is two-thirds of what it costs
new. How much did the car cost new? Possible answers: 9,000; 4,000; 8,000; 12,000,
18,000 and another answer.
4. Let’s say you have 2,000 euro in a savings account. The account earns 10% interest each
year. How much would you have in the account at the end of two years? Possible
answers: 2,420; 2,020; 2,100; 2,400 and another answer.
The way the financial literacy index is constructed is the following. If question (1) is
answered wrongly then respondents are asked question (2) while if it is answered correctly
respondents are directed to question (3). If both questions (1) and (2) are wrong then the
financial literacy index score is 1, which is the lowest possible. If question (1) is wrong while
question (2) is correct then the score is 2. Those respondents that answer question (1) correctly
are taken to questions (3) and (4). If question (3) is wrong then the score is 3. If questions (1) and
(3) are correct but (4) is wrong then the score is 4. If all questions (1), (3) and (4) are correct then
the score is 5, which is the highest possible score.

30
8.2 Early life variables in SHARE
SHARELIFE from Wave 3 and the Childhood Module from Wave 5 include a set of questions
on various aspects of childhood such as living conditions, accommodation, family structure and
performance at school. The school performance variables are used as instruments in the analysis
while other childhood variables are used as controls in the sensitivity analysis. The exact
wording of these questions was follows.
Relative position in language at the age of 10: “And how did you perform in Language
compared to other children in your class? Much better, better, about the same, worse or much
worse than the average?”
Living conditions and accommodation: (a) “We would like to find out more about the
accommodation where you lived when you lived when you were 10 years old. How many rooms
did your household occupy in this accommodation, including bedrooms but excluding kitchen,
bathrooms and hallways?”; (b) “Including yourself, how many people lived in your household at
this accommodation when you were 10?”; (c) “Approximately how many books were there in the
place you lived when you were 10? Do not count magazines, newspapers or your school books.”