Embed Size (px)
Citation preview


Financial Management for Hospitality Decision Makers

To Dawne, Logan and Matthew

Financial Management forHospitality Decision Makers
Chris Guilding
OXFORD AMSTERDAM BOSTON LONDON NEW YORK PARISSAN DIEGO SAN FRANCISCO SINGAPORE SYDNEY TOKYO

Butterworth-HeinemannAn imprint of Elsevier ScienceLinacre House, Jordan Hill, Oxford OX2 8DP225 Wildwood Avenue, Woburn MA 01801-2041
First published 2002
Copyright © 2002, Chris Guilding. All rights reserved
The right of Chris Guilding to be identified as the author of this workhas been asserted in accordance with the Copyright, Designs andPatents Act 1988
No part of this publication may be reproduced in any material form (includingphotocopying or storing in any medium by electronic means and whetheror not transiently or incidentally to some other use of this publication) withoutthe written permission of the copyright holder except in accordance with theprovisions of the Copyright, Designs and Patents Act 1988 or under the terms ofa licence issued by the Copyright Licensing Agency Ltd, 90 Tottenham Court Road,London, England W1T 4LP. Applications for the copyright holder’s writtenpermission to reproduce any part of this publication should be addressedto the publisher
British Library Cataloguing in Publication DataA catalogue record for this book is available from the British Library
Library of Congress Cataloguing in Publication DataA catalogue record for this book is available from the Library of Congress
ISBN 0 7506 5659 X
For information on all Butterworth-Heinemann publicationsvisit our website at www.bh.com
Composition by Genesis Typesetting, Rochester, KentPrinted and bound in Great Britain

Hosp
italit
y, L
eisu
re &
Tou
rism
Ser
ies
Contents
Preface ix
Part 1 Introduction 11 Hospitality decision makers’ use of financial management 3
Introduction 4Key characteristics of the hospitality industry 4Financial management: its nature and relationship to accounting 9Financial management and hospitality decision makers 11Uniform system of accounts 11Summary 14References 14Problems 15
Part 2 Hospitality Financial Accounting 172 Analysing transactions and preparing year-end financial statements 19
Introduction 20The balance sheet and profit and loss statement 21Classifying transactions according to assets, liabilities and owners’ equity 23The importance of understanding financial accounting basics 27Summary 28References 28Problems 28
3 Double entry accounting 31Introduction 32Double entry accounting: some background concepts 32Double entry accounting: a worked example 34Summary 40References 40Problems 40
v

Contents
Hosp
italit
y, L
eisu
re &
Tou
rism
Ser
ies
4 Adjusting and closing entries 43Introduction 44Why do we need closing entries? 44Why do we need adjusting entries? 44Worked examples highlighting types of adjusting entry 45Summary 56References 56Problems 57
Part 3 Financial Information and Hospitality Management 615 Financial statement analysis 63
Introduction 64Profit performance 65Financial stability 71Ratios using operational measures 74Summary 78References 78Problems 79
6 Cost management issues 82Introduction 83Management’s need for cost information 83Major cost classification schemes 84Qualitative and behavioural factors in management decisions 94Summary 95References 95Problems 95
7 Cost–volume–profit analysis 100Introduction 101Contribution margin 101Breakeven analysis 103The assumptions of cost–volume–profit analysis 109Summary 109References 110Problems 110
8 Budgeting and responsibility accounting 114Introduction 115Responsibility accounting 116Issues of cost, revenue, profit and investment centre design 118Roles of the budget 123Behavioural aspects of budgeting 126Technical aspects of budget preparation 130Summary 134References 134Problems 135
vi

Contents
Hosp
italit
y, L
eisu
re &
Tou
rism
Ser
ies
9 Flexible budgeting and variance analysis 139Introduction 140Flexible budgeting 140Variance analysis 142Benchmarking 148Summary 149References 150Problems 150
10 Cost information and pricing 156Introduction 157Factors affecting pricing 159Traditionally applied pricing methods 160Summary 169References 170Problems 170
11 Working capital management 174Introduction 175Cash management 175Accounts receivable management 182Inventory management 184Accounts payable management 186Working capital management 187Summary 189References 190Problems 190
12 Investment decision making 195Introduction 196Accounting rate of return 196Payback 197Net present value (NPV) 198Internal rate of return 204Integrating the four investment appraisal techniques 205Summary 206References 206Problems 207
Solutions to problems 215
Index 237
vii

This Page Intentionally Left Blank

Hosp
italit
y, L
eisu
re &
Tou
rism
Ser
ies
Preface
Welcome to Financial Management for Hospitality Decision Makers. The current era ofgrowth and dynamic change in hospitality signifies that it is an exciting time to beinvolved with the industry. Like many other industries, the hospitality sector isexperiencing heightened levels of competition and a growing need to applyappropriate management techniques to ensure commercial success. These factorsincreasingly signify that a hotel manager needs a working knowledge of pertinentfinancial management tools, techniques and procedures.
From my experience as an instructor of financial management and accountinggenerally, and hospitality financial management and accounting in particular, I havefound students tend to approach their first class with a degree of trepidation and anexpectation that the subject will be dry and difficult to master. Through this book, Iendeavour to make the subject material accessible and to demonstrate the relevanceof financial management to decision making and control in today’s increasinglydynamic business environment. Recognition of financial management’s value to themodern manager is a critical factor that can facilitate a student’s understanding ofthe subject. Once relevance is appreciated, the student starts to explore the range ofways in which financial management can serve the hospitality manager.
The book has been designed to encourage confidence in financial management sothat current and future managers can demand excellence from their financialmanagement information system. Too frequently, managers are ‘turned-off’ byaccounting language and the presentation of reports produced by the accountsdepartment. It is an unfortunate reality that financial reports frequently appear to bedesigned by accountants for accountants. This problem is partially attributable to thefact that most qualified accountants have gained their qualification throughdemonstrating their mastery of the rules of external reporting (i.e. financialaccounting, which is the branch of accounting concerned with the preparation ofannual accounts for external parties such as shareholders). When providing financialmanagement information to managers within the hotel, however, reports should bedesigned with the decision-making needs of the managers in mind.
The book has been written with two specific audiences in mind. First, it can serveas a valuable self-help tool for the practising hospitality manager interested inimproving their appreciation of financial management techniques and procedures.
ix

Preface
Hosp
italit
y, L
eisu
re &
Tou
rism
Ser
ies
Second, it has been designed to serve as a text that can be used in a financialmanagement or accounting course in a hospitality-related course of study. The bookis compatible with stage two of the Butterworth-Heinemann hospitality, leisure andtourism series of texts, and is therefore consistent with level two of an under-graduate degree. While the depth of the material covered signifies it would servewell as a stage two text, it could also be used in a first year of study as no prior studyof accounting or financial management is presumed.
In my view, not only can a well-designed book meet the needs of both thepractitioner and student audiences, a well-balanced book is likely to result fromaddressing the needs of both audiences. Addressing the practising manageraudience ensures that the book imparts information that is relevant to today’shospitality manager in a direct and readily accessible style. The reader will be ableto quickly see the wood from the trees and gain an early appreciation of howconcepts introduced can be applied in practice. Addressing a student audienceensures that the material covered provides a broad foundation. A set of problemsaddressing the main issues raised appears at the end of each chapter. Inclusion ofthese problems was motivated primarily by a desire to provide students with anopportunity to practise applying issues raised in the chapters and also to gainexposure to the type of problems that can be encountered in examination situations.A review of these problems will also prove extremely beneficial to the practisingmanager, however, as deeper understanding of the material introduced in the textwill result from exposure to a range of real-world decision-making scenarios.Solutions to the first three problems in each chapter appear at the back of the text.This is a self-help feature designed to further facilitate learning and enable studentsto appraise their understanding of concepts covered by the book. Additionalsolutions to problems are available to lecturers on a password protected site whichcan be accessed at: http://www.bh.com/manuals/075065659X.
A distinctive aspect of the book is its international orientation. The hospitalityindustry is becoming increasingly international with large multinational chainsdominating the 5- and 4-star market segments. This factor, together with thedrawing together of countries to form economic alliances such as the EuropeanEconomic Union, signifies that the career path of hotel managers increasinglyinvolves some international work experience. Further, the clientele base of hotels isbecoming more international as a result of increased international business andtourist travel. In combination, these factors highlight the need for a book that viewshospitality financial management in a globalized context. International differences inkey accounting terms used in different countries as well as the format of keyfinancial statements such as the profit and loss statement (‘income statement’ in theUSA and Canada) will be noted. In addition, scenarios introduced and problemsposed will draw on a range of international settings. This will develop the reader’sfamiliarity with addressing financial problems in the context of a range of countriesand currencies.
A second distinctive aspect of the book is its hospitality decision makers’orientation. This theme will be apparent from the problem-solving approach usedthroughout the text. In each chapter this approach is supplemented by the inclusionof a case that takes a particular hospitality manager’s perspective on an issue raised.Each of these cases is headed ‘Financial Decision Making in Action’.
The book is structured according to three main parts: an introduction (Chapter 1),hospitality financial accounting (Chapters 2–4), and financial information and
x

Preface
Hosp
italit
y, L
eisu
re &
Tou
rism
Ser
ies
hospitality management (Chapters 5–12). Each part can be approached independ-ently of the other parts, i.e. if the reader is exclusively interested in financialmanagement, they can commence their reading at Chapter 5.
In Chapter 1, in the course of providing an overview of the nature of financialmanagement, the contents of the book are introduced. Chapters 2, 3 and 4 build onone another to provide a basic understanding of financial accounting. Whilefinancial accounting does not represent the primary orientation of the book, a basicunderstanding of the workings of the financial accounting system can be highlybeneficial to the hospitality manager, due to the importance of financial statementssuch as the balance sheet and profit and loss statement. It is difficult to overstate theimportance of these statements as they represent a key resource used by outsiders togauge an organization’s performance. The need for management to understand themechanisms by which they are judged externally is clearly important.
The theme of Chapter 5, analysing financial performance, moves us more towardsfinancial management. In this chapter a detailed review of how management canmonitor financial dimensions of a hotel’s performance is undertaken. Chapters 6–12consider hospitality management decision making from the followingperspectives:
� Classifying costs in order to facilitate decision making� Cost–volume–profit analysis� Budgeting and responsibility accounting� Flexible budgeting and variance analysis� Cost information and pricing� Working capital management� Investment decision making.
Again, an accessible and problem-orientated approach has been taken in presentingthis subject matter.
The book has been designed to facilitate a flexible teaching and learning approach.While the sequencing of the chapters results from my view of the most appropriateorder in which to present the material covered, many of the chapters can be read outof sequence. The only chapters that build on one another to such a degree that theyshould be read consecutively are Chapters 2, 3 and 4 and Chapters 8 and 9.
I hope you find this book to be a stimulating read and that your career benefitsfrom your enhanced ability to recognize how financial management techniques andprocedures can be applied in hospitality management.
Chris Guilding
xi

This Page Intentionally Left Blank

P A R T• • • • 1
Introduction

This Page Intentionally Left Blank

C H A P T E R• • • • 1
Hospitalitydecision makers’use of financial
management
L e a r n i n g o b j e c t i v e sAfter studying this chapter, you should havedeveloped an appreciation of:
1 The financial management implications of keyhospitality industry characteristics
2 The nature of financial management
3 Some of the ways hospitality managers becomeinvolved in financial management
4 What is meant by the Uniform System of Accountsfor the Lodging Industry
5 The focus of this book.

Financial Management for Hospitality Decision Makers
Hosp
italit
y, L
eisu
re &
Tou
rism
Ser
ies
IntroductionThis book describes financial management procedures and analytical techniques inthe context of hospitality decision making. The purpose of this introductory chapteris to set the scene for the remainder of the book.
The next section of this chapter describes key characteristics relating to thehospitality industry and outlines financial management implications associatedwith these characteristics. Next, an overview of the nature of financial managementand its relationship to accounting is provided. We will see how financialmanagement is closely related to accounting, as accounting information representsa key resource extensively drawn upon in financial management decision making.In the course of describing the nature of financial management, the overallstructure of the book will be introduced. We will see that Chapters 2–4 provide agrounding in hospitality financial accounting and Chapters 5–12 introduce a rangeof topics that show how financial management techniques and procedures arecritically important to a host of hospitality decision-making situations. Thechapter’s subsequent section highlights some of the many ways that differenthospitality managers can apply financial management techniques and proceduresto inform their decision making.
The chapter’s final section introduces an important accounting report: the profitand loss statement. This statement is introduced in the context of a description of theUniform System of Accounts for the Lodging Industry. This system was developed in theUSA and is being increasingly used in large hotels internationally. This signifiesincreased standardization of the classification scheme used by hotels to record theirfinancial transactions, and also greater standardization of the financial performancereports produced by hotels.
Key characteristics of the hospitality industryThe hospitality industry encompasses a broad range of activities and types oforganization. Some of the industry’s primary players include restaurants and barsthat provide dining and beverage service and also lodging operations that offeraccommodation facilities. Restaurant organizations range from multinational com-panies to small street-corner cafes. Similarly, lodging operations range frommultinational hotels offering thousands of rooms worldwide to bed and breakfastoperations offering a single guest room. At the bed and breakfast extreme we havesmall family-run concerns with a limited service range, while at the other extremewe have multinational companies offering a range of services that transcendaccommodation, dining and a breadth of sports and leisure activities. The hospitalityindustry’s heterogeneity becomes apparent when we recognize that its diversityencompasses the following:
� Hotels� Motels� Restaurants� Fast-food outlets� Pubs and bars� Country and sport clubs� Cruise liners.
4

Hospitality decision makers’ use of financial management
Hosp
italit
y, L
eisu
re &
Tou
rism
Ser
ies
This book’s primary focus is on hotel management. This focus has been takenbecause the majority of large hotels provide most of the service elements offered bythe hospitality organizations listed above. In addition, as many large hotels have tocoordinate provision of a range of hospitality services, they confront a degree ofmanagement complexity not encountered in many other hospitality organizationsthat offer a narrower range of services. For example, a large hotel’s organizationalstructure and financial management system must be designed with due regard givento coordinating a range of disparate functions that, in most cases, will at least includethe provision of accommodation, restaurant and bar facilities. The disparity of thesefunctions is apparent when we recognize that the sale of rooms can be likened to thesale of seats in the airline or entertainment industries, a parallel exists between foodpreparation in restaurant kitchens and production activities in the manufacturingindustry, and bar operations can be likened to retailing. In addition to managing thisdisparate range of services, a hotel needs to coordinate a set of distinct supportoperations such as laundry, building and grounds maintenance, informationsystems, training, marketing, transportation, etc.
This disparate range of hospitality activities are housed within a single site (i.e.building and surrounds), that we refer to as a hotel. This creates a degree of sitecomplexity which is exacerbated when we recognize that the location of the serviceprovider is also the place where the customer purchases and consumes the servicesoffered. While this is patently obvious to anyone who has been to a hotel, we shouldnot forget that it is not the case in many other service industries (e.g. banking,transportation, telecommunications, law, accounting), or the manufacturing indus-try. This factor highlights a further dynamic of the hotel industry. Not only is a hotelsite the place where a broad range of activities is undertaken, it is the focal point ofextensive and continual vigilance with respect to cleaning, maintenance andsecurity. We can thus see that a hotel represents a complex site where distinctactivities are conducted in close proximity to one another. Where the performance ofone functional activity (e.g. cleaning) can be affected by the way another isconducted (e.g. maintenance), high interdependency is said to exist. Such highinterdependency can create problems when attempting to hold one functional area(e.g. cleaning) accountable for its performance.
Not only is functional interdependency an issue when trying to hold a manageraccountable for costs, it can be a problem when attempting to hold a managerresponsible for a particular department’s level of sales. For example, through nofault of her own, a food and beverage (F&B) manager may see her profits plummetas a result of a relatively low number of rooms sold by the rooms division.Such cross-functional interdependency needs to be recognized when identifyingwhich aspect of a hotel’s performance a particular manager should be heldaccountable for.
Sales volatilityThe hotel industry experiences significant sales volatility. The extent of this volatilitybecomes particularly apparent when we recognize it comprises at least four keydimensions:
� Economic cycle-induced sales volatility� Seasonal sales volatility
5

Financial Management for Hospitality Decision Makers
Hosp
italit
y, L
eisu
re &
Tou
rism
Ser
ies
� Weekly sales volatility� Intra-day sales volatility.
These dimensions of sales volatility and the implications they carry for hotelfinancial management are elaborated upon in Box 1.1.
High product perishabilityRelative to many other industries, in foodservice operations there can be limitedopportunities to produce for inventory. A significant proportion of food inventory ispurchased less than 24 hours prior to sale, and much food preparation is conductedwithin minutes of a sale. There is thus a very short time span between purchase,production and sale. Many menu items cannot be produced in advance of sales dueto their high perishability.
6
Box 1.1Dimensions of sales volatility in the hospitality industry
(1) Economic cycle-induced sales volatility: Hotels are extremely susceptible to the highs andlows of the economic cycle. Those with a high proportion of business clients suffer duringeconomic downturns due to significantly reduced corporate expenditure on business travel.Hotels offering tourist accommodation also suffer during economic downturns due to familiesreducing discretionary expenditure on activities such as holidays and travel. This highsusceptibility to the general economic climate highlights the importance of hotels developingoperational plans following careful consideration of predicted economic conditions.
(2) Seasonal sales volatility: Many hotels experience seasonal sales volatility over the courseof the year. This volatility can be so severe to cause off-season closure for some resortproperties. The decision whether to close can be informed by an appropriately conductedfinancial analysis such as that described in Chapter 6. Seasonal sales volatility can alsopose particular cash management issues. During the middle and tail-end of busy seasons,surplus cash balances are likely to result, while in the off-season and the build-up to thebusy season, deficit cash balances are likely to result. The need for careful cash planningand management is discussed in Chapter 11.
(3) Weekly sales volatility: Hotels with a high proportion of business clients will experiencehigh occupancy (i.e. a high proportion of rooms sold) from Monday to Thursday, and arelatively low occupancy from Friday to Sunday. By contrast, many resort hotels haverelatively busy weekends. Accurate forecasting of demand will inform management’sdecision making with respect to the amount and timing of room rate discounting.Forecasting is discussed in the context of budgeting in Chapter 8.
(4) Intra-day sales volatility: Restaurants experience busy periods during meal times, whilebars tend to be busiest at night times. This intra-day demand volatility has led to widelyused pricing strategies such as ‘early bird specials’ in restaurants and ‘happy hours’ inbars. Hotel pricing issues are discussed in Chapter 10. In addition to these dimensions ofintra-day activity volatility, staffing needs have to be considered in light of issues such asthe front desk experiencing a frenetic early-morning period processing check-outs and asecond, more protracted, busy period in the late afternoon processing check-ins.

Hospitality decision makers’ use of financial management
Hosp
italit
y, L
eisu
re &
Tou
rism
Ser
ies
Perishability is even more apparent with respect to room and banquet sales. If aroom is not occupied on a particular night, the opportunity to sell is lost forever. Nodiscounting of a room’s rate the following day can reverse this loss. This situationalso applies to conference and banqueting activities. The high perishabilityassociated with rooms, conferencing, banqueting and food underlines the impor-tance of accurate demand forecasting. With respect to food, an accurate forecast ofthe mix and level of demand can result in the maintenance of all options on a menuduring high-demand periods, and minimal cost of food scrapped during low-demand periods. With respect to rooms, an accurate forecast of room demand canenable appropriate pricing decisions to be made as part of an attempt to maximizerevenue. Appropriate room demand management is particularly important, as roomsales can be the prime determinant of sales of many of the hotel’s other activities(e.g. restaurant, bar, etc.).
High fixed component in cost structureA high proportion of a hotel’s costs do not vary in line with sales levels. These costsare referred to as ‘fixed’. The high fixed cost structure of hotels results from rent (asignificant investment is required to buy land and build a hotel), as well as fixedsalary costs associated with administrative and operational staff needed to manage,operate and maintain a hotel. The high proportion of fixed costs signifies that animportant issue in hotels concerns the determination of the level of sales necessaryto achieve breakeven (i.e. cover all fixed costs).
A considerable proportion of fixed costs result from periodic refurbishment ofrooms and also investment in the hotel’s physical infrastructure such as kitchen andlaundry equipment. In financial management we refer to such long-held assets of theorganization as ‘fixed assets’. In Chapter 4 we will see how the purchase of a fixedasset results in depreciation (the allocation of a fixed asset’s cost over its useful life),and in Chapter 12 techniques that can be used to appraise fixed asset investmentproposals will be described.
Labour-intensive activitiesIf you visit the typical modern factory, you are likely to be struck by the highlyautomated and capital-intensive nature of the production process. Procedures arescheduled by computers and robotic engineering is used extensively in physicalprocessing. This capital intensity in the conduct of work lies in stark contrast to whatyou see when entering a hotel. Major hotel activities include room housekeeping,restaurant food preparation and service as well as bar service. Despite the advent ofthe machine and computer age, the physical conduct of all these activities haschanged little over the last fifty years. They continue to have a high labourcomponent. Relative to many other industries, we can conclude that activitiesconducted in the hotel industry are still highly labour intensive.
The high labour intensity of the hospitality industry signifies the importance ofperformance measures that monitor labour productivity. Indices such as restaurantsales per employee-hour worked are described in Chapter 5. In addition, the needto analyse the difference between the actual cost of labour and the budgeted costof labour can represent a significant dimension of labour cost management. In
7

Financial Management for Hospitality Decision Makers
Hosp
italit
y, L
eisu
re &
Tou
rism
Ser
ies
8
Box 1.2The financial management implications of distinctive hospitalityindustry characteristics
Hospitality industrycharacteristic
Financial management implication
1 Disparity andinterdependency of functions
Care must be taken when determining a functional area’sscope of accountability. Due to their influence on sales andexpenses, some managers can be held profit accountable(e.g. a restaurant manager). Due to no direct influence onsales, others can only be held cost accountable (e.g. atraining manager). Factors affecting departmentalperformance can be complex in hotels, however. If roomoccupancy affects F&B sales, care must be taken ifattempting to hold an F&B manager profit-accountable.
2 High sales volatility Hotel activity can be highly volatile over the course of aneconomic cycle, a year, a week, and a day. As noted inBox 1.1, this issue highlights the importance of accuratebudgeting and forecasting systems to aid discountingdecisions with respect to room rates and restaurant menuprices.
3 High product perishability The absolute perishability of rooms, conference andbanquet facilities and the relative perishability of foodunderlines the importance of accurate hotel demandforecasting as part of the budgeting process. Generally, themost important aspect of forecasting is room occupancy,as room sales drive sales levels of other hotel activities.Accurate restaurant forecasting provides the basis formaintaining a full menu of options and minimizing the costof food wastage. With respect to rooms, forecastingaccuracy can enable appropriate room rate discountingdecisions.
4 High fixed costs Hotels involve considerable investment in fixed assetssuch as buildings on prime land as well as extensivefurnishings, fittings and equipment. This investmentgenerates high rent and depreciation cost (discussed inChapter 4), which, together with significant salary costs,result in hotels having a high fixed cost structure. Highinvestment highlights the importance of using appropriatefinancial analysis when appraising the relative merits ofproposed investments.
5 Labour-intensive activities The high labour intensity apparent in many hotel activitieshighlights the importance of monitoring differencesbetween actual labour cost and budgeted labour cost andalso using performance measures that focus on labourproductivity.

Hospitality decision makers’ use of financial management
Hosp
italit
y, L
eisu
re &
Tou
rism
Ser
ies
Chapter 9 we will see how differences between budgeted and actual labour costcan be segregated into labour rate and labour efficiency variances.
The distinctiveness of these hotel characteristics that have just been describedunderlines the degree to which hotel financial management systems must be tailoredto the particular needs of hotel management. In combination, these characteristicssignify that a hotel represents a fascinating arena in which to consider theapplication of financial management. Box 1.2 provides a summary of financialmanagement implications associated with each of the hospitality industry character-istics just described.
Financial management: its nature and relationship toaccountingFinance is generally viewed as a body of principles and theories concerned with thegeneration and allocation of scarce resources (generally money). The most relevantaspect of finance to most managers within a company concerns the effective andefficient use of resources that fall within their particular sphere of activity.Accordingly, in this book we are concerned with describing the financial tools andtechniques that can aid hospitality managers in their efforts to ensure efficient andeffective management of resources.
Financial management draws extensively on accounting information. Thedistinction between financial management and financial accounting can be difficultto discern in many small hotels as the financial controller is often responsible foroverseeing the hotel’s financial management function as well as its accountingfunction. Although the distinction can be blurred, we tend to view financialmanagement as a decision-making role that uses accounting information, while thefinancial accounting function is concerned with ‘recording, classifying and report-ing’ (Cooper and Ijiri, 1983) the financial transactions of an organization. The closelyrelated nature of financial management and accounting signifies that gaining a basicunderstanding of accounting procedures is a prerequisite to becoming a financiallyastute manager.
For most organizations, the accounting system represents the most extensive andall-encompassing information system. This is because accounting information isbased primarily on the most fundamental common denominator in business, i.e.money. A front-office manager might talk of the number of check-ins processed, arestaurant manager may talk of the number of covers served, a laundry managermay talk of the weight of linen laundered and a housekeeping manager may talk ofthe number of rooms cleaned. While each manager uses different operational unitswhen talking of their respective activities, they are all familiar with terms such as‘cost’ and ‘profit’. Cost and profit are denominated in monetary terms and thisunderlines the degree to which the accounting system is the organization’s mostpervasive and all-encompassing information system. It is also the only informationsystem that measures the economic performance of all departments within anorganization. When we recognize the pervasive nature of the accounting informa-tion system and the fact that we are living in a time that is frequently describedas ‘the information age’, we begin to appreciate the critically significant role ofaccounting in business management generally and financial management inparticular.
9

Financial Management for Hospitality Decision Makers
Hosp
italit
y, L
eisu
re &
Tou
rism
Ser
ies
Individuals from different functional areas should play an active financialmanagement role by demanding excellence in the design of accounting systems. Wesometimes need to remind ourselves that accounting system design is too importantto be left solely to accountants. Specific financial management information needsthat fall outside the scope of a conventional accounting system design will have tobe flagged by managers with decision-making and control responsibilities. There isboundless scope for tailoring an accounting information system, but the onus is onmanagers to inform the accounting service providers how the information providedshould be tailored to meet their decision-making needs.
In the last few years there appears to have been a strong movement away fromaccounting’s traditional ‘command and control’ philosophy to more of an ‘informand improve’ philosophy. Despite this, some question the appropriateness of usingfinancial measures to direct and control businesses. Criticisms include:
� Financial measures focus on symptoms rather than causes. Profit may declinebecause of declining customer service. It might therefore be more helpful formanagement to focus on monitoring factors such as customer service rather thanprofit.
� Financial measures tend to be oriented to the short-term performance of the past.This can hinder forward-looking, longer-term initiatives such as the developmentof a strong hotel chain image among customers.
Some of these criticisms have led to greater importance attached to a breadth offinancial and non-financial performance indicators, e.g. Kaplan and Norton (1992,1996) talk of the ‘Balanced Scorecard’. Despite such developments, given theimportance attached to published financial statements by the investing community,continued management emphasis on financial controls is to be expected.
Chapters 2, 3 and 4 provide a progressive introduction to the workings of financialaccounting systems. In Chapter 2 we will see how, like a coin, a financial transactionhas two sides. These two sides signify that all financial transactions have a doubleimpact on the business. In Chapters 3 and 4 we will see how the two sides of the‘financial transaction coin’ are referred to as debits and credits. It is important thatyou gain an understanding of the double entry bookkeeping system as it is a fairlyfundamental aspect of accounting. An analogy can be drawn between the manner inwhich knowing the alphabet serves reading and writing and the way in which anappreciation of the double entry bookkeeping system will aid your capacity toexercise appropriate financial management. Once you have mastered the basics ofdouble entry accounting, you will have a grounding that will allow you to beginconsidering how accounting information can be tailored to the specific financialdecision-making needs that arise in a hotel. It is from the information stored in thedouble entry record-keeping system that a profit and loss statement and balancesheet are periodically prepared. These statements, which represent key indicators ofan organization’s financial health and performance, are also described in Chapters 2and 3.
The book’s subsequent chapters have more of a financial management orientation.The financial management issues addressed concern: analysis of performance(Chapter 5), decision-making and control implications associated with cost manage-ment (Chapters 6 and 7), responsibility accounting and budgetary control (Chapters8 and 9), using cost information to inform pricing decisions (Chapter 10), managing
10
Hospitality decision makers’ use of financial management
Hosp
italit
y, L
eisu
re &
Tou
rism
Ser
ies
elements of working capital such as cash, accounts receivable, inventory andaccounts payable (Chapter 11), and conducting financial analyses of investmentproposals (Chapter 12).
Financial management and hospitality decision makersA theme of this book concerns viewing financial management from the perspectiveof a range of different hospitality management functions. This theme will be evidentfrom the book’s many worked examples that show how particular financialmanagement applications are pertinent to a range of hospitality managementdecision-making situations that can arise. To underline the theme still further,however, each chapter contains a particular case that shows how a financialmanagement issue raised in the chapter can be considered from a particular hotelmanager’s perspective. Each case is headed ‘Financial Decision Making in Action’and has a sub-heading relating to the particular hospitality decision maker and alsothe aspect of financial management in question.
To provide you with an early sense of the importance of financial management toa range of hospitality decision makers, an overview of these cases is provided in Box1.3. The hospitality functions identified are based on Burgess’s (2001) listing of thetypical executive committee in a large leisure hotel.
Uniform system of accountsThere is a uniform accounting system for the hotel industry that has been developedin the USA. It was initiated in 1925 by the Hotel Association of New York City.Application of this uniform system has grown in the USA and it is now increasinglyrecognized across the world. The current version of the uniform system, entitled theUniform System of Accounts for the Lodging Industry (USALI), was producedcollaboratively by the Hotel Association of New York City and the American Hotel& Motel Association. The following significant benefits derive from this uniformsystem:
� It represents an ‘off the shelf’ accounting system that can be adopted by anybusiness in the hotel industry
� The system can be viewed as ‘state of the art’ as it benefits from the accumulatedexperience of the parties that have contributed to the system’s development overmany years
� By promoting consistent account classification schemes as well as consistentpresentation of performance reports, it facilitates comparison across hotels
� It represents a common point of reference for hotels within the same hotelgroup.
A profit report for Canberra’s KangarooLodge Hotel is presented in Exhibit 1.1.This statement is presented in a format consistent with USALI. In the UK, Australiaand New Zealand this statement is called a ‘profit and loss statement’, while in theUSA and Canada it is referred to as an ‘income statement’. Profit can be viewed assynonymous with income. To minimize any potential misunderstanding, the terms‘profit’ and ‘profit and loss statement’ will be used throughout this book.
11

Financial Management for Hospitality Decision Makers
Hosp
italit
y, L
eisu
re &
Tou
rism
Ser
ies
Box 1.3Some perspectives of hospitality decision makers on aspects offinancial management
Hospitalityfunction
Financial management aspect ortool
Significance of the financial aspect or tool
General
A general manager needs tounderstand the nature and workingsof the main financial statements.Many managers incorrectly believethat asset values recorded in thebalance sheet represent the assets’worth (see Chapter 2).
Senior managers are increasingly benchmarkingthe performance of hotels within chains. Realestate inflation rates need to be considered ifconducting an analysis using asset values ofhotels bought in different time periods. This isbecause balance sheets report historical cost andnot current value of assets.
Manager Senior managers with no accountingtraining also sometimes incorrectlybelieve that the retained earningsaccount in the balance sheetrepresents cash that can beaccessed (see Chapter 3).
Retained earnings is frequently a large accountappearing in a balance sheet. It represents theaccumulation of all profits reinvested in the hotelsince its inception. Poor cash planning will occurif senior management believe it represents cash.
RoomsDivision
The Rooms Division Manager canuse cost–volume–profit analysis todetermine occupancy levelsnecessary to achieve breakeven(see Chapter 7).
Appreciating the dynamics of breakeven will helpthe Rooms Division Managers take steps toensure that sales do not fall below the breakevenlevel.
Manager Variance analysis is a tool that canhelp a range of managers, includingthe Rooms Division Manager, wheninvestigating differences betweenbudget and actual performance(see Chapter 9).
Appraising the efficiency of activities such asroom cleaning represents an important andon-going aspect of management. Varianceanalysis is a technique that helps a managerdetermine the factors causing room cleaningcosts to be above or below budget.
F&B
What type of inventory recordingsystem should be used?(see Chapter 4).
If stock loss represents a problem in F&B, aperpetual rather than a periodic system may bewarranted.
Manager Appropriately using cost informationto support decision making such aswhether to outsource (Chapter 6).
Hotels are increasingly outsourcing, andmanagers need to know how to correctly draw oncost data when making such decisions.
HumanResourceManager
Determining staffing needs frombudgeted sales levels(see Chapter 8).
In the light of the hospitality sector’s volatility,matching labour supply with hotel activity is animportant aspect of human resourcemanagement.
Financial
Use of debt financing to lever upreturns to shareholders(see Chapter 5).
Appropriate use of debt finance can have asignificant impact on returns earned byshareholders.
Controller Applying an appropriate financialanalysis when deciding whether totake a supplier’s offer of a discountfor early payment (see Chapter 11).
Many suppliers offer a discount for earlysettlement of an account. In the light of this, it isimportant that the accounts payable departmentis appropriately informed on when to make anearly payment.
Sales &MarketingManager
The use of yield management inpricing (see Chapter 10).
Demand volatility highlights the importance ofsales staff varying room rates charged throughthe year as part of a strategy to maximize profit.
ChiefEngineer
Financial analysis of investmentproposals (see Chapter 12).
Chief engineers are key players in buildingequipment investment decisions. Appropriateinvestment analysis is vital, as these decisionsoften involve large amounts of money.
12

Hospitality decision makers’ use of financial management
Hosp
italit
y, L
eisu
re &
Tou
rism
Ser
ies
The USALI profit and loss statement comprises three sections. In the top section,net revenue (i.e. net sales) for each functional area is identified in the first datacolumn. This is followed by three columns that identify expenses that can be directlyrelated to the functional areas listed, i.e. cost of sales, payroll & related expenses, andother expenses. Cost of sales refers to the cost of items that are sold, e.g. the cost ofwine sold through a restaurant. Each department’s profit is determined bydeducting the sum of the three expense items from net revenue. The statement’smiddle section is headed ‘undistributed operating expenses’. In this section theexpenses relating to a hotel’s service departments (e.g. administrative and general,human resources, marketing, etc.) are identified. The distinction between the hotel’sservice departments and the functional areas listed in the top section of thestatement is that no revenue can be traced directly to the service departments. Thestatement’s lower section includes expenses that are generally not traceable to ahotel’s operating management. Expenses such as rent, insurance and interest on debtare generally traceable to a tier of management that lies above a hotel’s operationalstaff. The last line of the statement presents the net profit, i.e. all hotel revenue minusall hotel expenses.
13
Exhibit 1.1Profit and loss statement prepared in USALI format
KangarooLodge HotelProfit and loss statement
for the year ended 30 June 20X1
Netrevenue
$
Cost ofsales
$
Payroll andrelated expenses
$
Otherexpenses
Profit(loss)
$Operating departmentsRooms 1,232,000 0 193,000 101,000 938,000Food 404,000 171,000 159,000 48,000 26,000Beverage 221,000 54,000 58,000 27,000 82,000Telecommunications 64,000 59,000 4,000 2,000 (1,000)
Total operating departments 1,921,000 284,000 414,000 178,000 1,045,000
Undistributed operating expensesAdministrative and General 51,000 28,000 79,000Human Resources 25,000 6,000 31,000Marketing 29,000 36,000 65,000Energy 0 79,000 79,000
105,000 149,000 254,000
Profit after undistributed operating expenses 791,000Rent, rates and insurance 182,000Loan interest 102,000Depreciation 123,000
Profit before tax 384,000Tax 110,000
Net profit 274,000

Financial Management for Hospitality Decision Makers
Hosp
italit
y, L
eisu
re &
Tou
rism
Ser
ies
It is apparent from Exhibit 1.1 that a profit and loss statement presented inaccordance with the USALI provides much profitability information at the hoteldepartment level (e.g. rooms, food, beverage department, etc.). This format supportsfinancial management as it allows a hotel’s management to consider the relativeprofitability levels of its different functional areas, e.g. from Exhibit 1.1, it can bedetermined that following the deduction of expenses directly related to rooms,76.14% of room revenue remains as a contribution to general hotel expenses andprofit ($938,000 ÷ $1,232,000 × 100).
The USALI is introduced in this first chapter in order to give you an earlyappreciation of a typical hotel’s profit and loss statement. It is also useful to notediffering terms used around the globe to describe the surplus of revenue overexpenses (‘income’ in the USA and ‘profit’ in the UK). This provides you with anearly warning to tread a little warily when consulting accounting and financialmanagement texts written in different countries. Your understanding of the nature ofthe profit and loss statement will be reinforced in the next chapter which, amongother things, focuses on the relationship between the profit and loss statement andthe balance sheet.
Summary
This chapter has set the scene for the remainder of the book. We have reviewed the particularcharacteristics of the hospitality industry and considered their implications for financialmanagement. We have also considered the nature of financial management in general and alsoits relevance to a range of hospitality decision makers. Finally, the chapter provided a shortintroduction to financial accounting by outlining the nature and presentation of a profit andloss statement produced using the standard that is generally referred to as the Uniform Systemof Accounts for the Lodging Industry.
Having read the chapter you should now know:
� Some of the hospitality industry’s particular characteristics and their financial managementimplications
� What is meant by financial management and how it relates to accounting� Some of the ways that different hospitality decision makers draw on financial information
and analyses in their decision making� The nature of information provided in a profit and loss statement.
References
Atkinson, H., Berry, A. and Jarvis, R. (1995) Business Accounting for Hospitality andTourism & Leisure, International Thomson Publishing, London, Chapter 1.
Burgess, C. (2001) Guide to Money Matters for Hospitality Managers, Butterworth-Heinemann, Oxford, Chapter 1.
Cooper, W.W. and Ijiri, Y. (eds) (1983) Kohler’s Dictionary for Accountants, 6th edition,Prentice Hall, Englewood Cliffs, NJ.
Harris, P. (1999) Profit Planning, Butterworth-Heinemann, Oxford, Chapters 1 and2.
Kaplan, R.S. and Norton, D.P. (1992) The Balanced Scorecard – measures that DrivePerformance, Harvard Business Review, 70, 1, 71–79.
14

Hospitality decision makers’ use of financial management
Hosp
italit
y, L
eisu
re &
Tou
rism
Ser
ies
Kaplan, R. S. and Norton, D.P. (1996) The Balanced Scorecard – Translating Strategy intoAction, Harvard Business School Press, Boston, MA.
Kotas, R. (1999) Management Accounting for Hospitality and Tourism, 3rd edition,International Thomson Business Press, London, Chapter 1.
Schmidgall, R. F. (1997) Hospitality Industry Managerial Accounting, 4th edition,Educational Institute – American Hotel & Motel Association, East Lansing, MI,Chapter 3.
Uniform System of Accounts for the Lodging Industry (1996) 9th edition, EducationalInstitute of the American Hotel & Motel Association, East Lansing, MI.
Problems
✓ indicates that a solution appears at the back of the text
✓ 1.1 (a) Describe what is meant by functional interdependency.(b) Describe why functional interdependency is an issue that needs to be considered
when designing a hotel’s system of accountability.
✓ 1.2 (a) What are the four main dimensions of sales volatility in the hotel industry?(b) What are the accounting implications arising from these four dimensions of sales
volatility?
✓ 1.3 (a) Describe what is meant by high perishability of the hotel product.(b) Describe the accounting implications arising from high product perishability.
1.4 Describe the factors causing hotels to have a high proportion of fixed costs.
1.5 (a) Describe the manner in which hotel activities tend to be labour intensive.(b) Describe the accounting implications arising from the high labour intensity of
hotel activities.
1.6 Give one example of how a particular financial management tool or technique mightbe drawn upon in the context of a particular hospitality management function.
1.7 Identify three advantages that derive from using the Uniform System of Accounts forthe Lodging Industry (USALI).
15

This Page Intentionally Left Blank

P A R T• • • • 2
HospitalityFinancial
Accounting

This Page Intentionally Left Blank
C H A P T E R• • • • 2
Analysingtransactions and
preparingyear-end financial
statements
L e a r n i n g o b j e c t i v e sAfter studying this chapter, you should havedeveloped an appreciation of:
1 How there is a double financial implication arisingfrom every financial transaction undertaken by anorganization
2 The nature and format of the balance sheet
3 The nature and format of the profit and lossstatement
4 How profit computed in the profit and lossstatement flows into the owner’s equity section ofthe balance sheet via the statement of owner’sequity.
Financial Management for Hospitality Decision Makers
Hosp
italit
y, L
eisu
re &
Tou
rism
Ser
ies
Introduction
This is the first of the three chapters concerned with financial accounting. Financialaccounting concerns the preparation of financial reports that are made available toexternal users such as shareholders. This chapter provides an overview of the mainfinancial accounting statements that appear in annual reports prepared by publiclylisted companies (i.e. companies with shares listed on a stock exchange). Althoughthis is not a long chapter, the material presented is fairly concentrated. A consideredreview of this material will provide you with a good basic appreciation of the natureof the year-end financial statements. To achieve this appreciation you will need tocarefully follow through the chapter’s worked example that illustrates how a set offinancial transactions impact on the year-end accounts. Once you have gained anappreciation of the nature of the year-end financial statements, the next chapter willintroduce the ‘debit/credit’ double entry record-keeping process that underlies thefinancial accounting system. Finally, Chapter 4 introduces some more advancedaspects of double entry record-keeping by reviewing year-end adjustments that needto be made to the financial records in order to recognize time-related issues such asasset depreciation.
It may appear a little strange that a book concerned with hospitality decisionmaking has devoted three chapters to financial accounting. There are, however,several reasons why a hotel manager should have a basic familiarity with financialaccounting. Of particular significance is the fact that most professional accountingcourses of study have a bias towards financial accounting, rather than managementaccounting, which is the branch of accounting concerned with the provision ofaccounting information for management decision making and control. Oncequalified, many accountants secure jobs working in industries such as the hospitalitysector, with the result that a financial accounting mentality frequently prevails inorganizations’ internal accounting departments. It is important that all managersappreciate the potential for this tendency and have an ability and willingness to‘think outside the square’ by asking for accounting information and analyses to bepresented in a way that supports management decision making rather than theneeds of external reporting.
An example of ‘thinking outside the square’ might be a marketing manager whofeels that a customer profitability analysis would help management deliberationsconcerned with allocating a promotion budget. The manager might feel reluctant toask for such information, however, as the accounting system has never provided itin the past. If you review the material presented in Chapter 4, it will becomeapparent that a key concern of financial accountants is the accurate allocation ofprofit earned to particular periods of time. The financial accounting system does notrequire, however, that profit be allocated across customer segments. As the impetusfor allocating profit across customer segments is unlikely to come from anaccounting department, it will have to be initiated by the manager needing theinformation. (For a further discussion of the customer accounting issue in hotels seeGuilding et al., 2001.) A second reason why a hotel manager should understand thebasics of financial accounting is that two outputs of the financial accounting system,the balance sheet and the profit and loss statement, represent important sources ofinformation that can further management control of the company. The manner inwhich these statements can be used to facilitate management control will beextensively explored in Chapter 5.
20

Analysing transactions and preparing year-end financial statements
Hosp
italit
y, L
eisu
re &
Tou
rism
Ser
ies
The balance sheet and profit and loss statement
In most Western countries, four financial statements are presented in the publishedannual reports of publicly listed companies. These reports are the balance sheet, theprofit and loss statement, the statement of owners’ equity and the statement of cashflows. As noted in Chapter 1, in the USA and Canada the profit and loss statementis called the ‘income statement’.
The elements comprising the balance sheet, profit and loss statement andstatement of owner’s equity are described in this section. Following this, the workedexample in the next section will show the extent to which these statements can beseen as direct outputs of the financial accounting record-keeping process. Nodetailed review will be undertaken of the statement of cash flows which classifiescash inflows and outflows and identifies the net change in cash held by the firm overthe reporting period. Relative to the balance sheet and profit and loss statement, thisstatement is not used as much for decision making and control purposes. Althoughit will not be considered further in this book, if you see a cash flow statement youwill have an immediate rudimentary understanding of it, due to its resemblance toan aggregated version of your monthly bank statement.
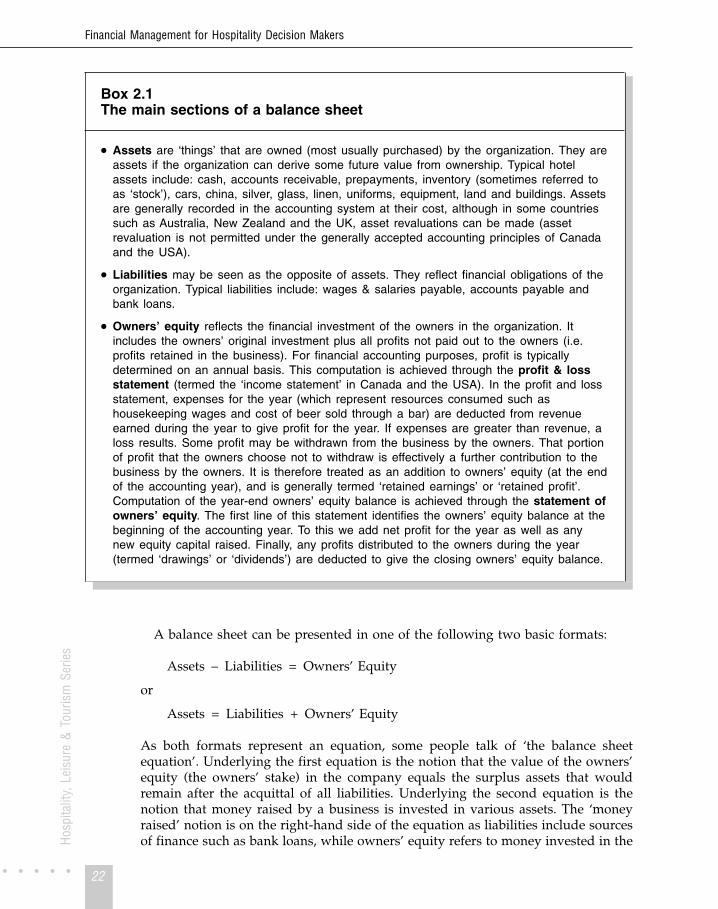
The balance sheet is a schedule summarizing what is owned and what is owed bya company at a particular point in time. Its three main sections which compriseassets, liabilities and owners’ equity, are described in Box 2.1.
From Box 2.1 it is apparent that profit earned increases owner’s equity. It is alsoevident that the profit computed through the profit and loss statement can be seen tofeed into the owners’ equity section of the balance sheet via the statement of owner’sequity. For this reason, at the year-end we need to prepare the profit and loss statementand statement of owner’s equity in advance of preparing the balance sheet.
One key difference between the profit and loss statement and the balance sheetpertains to time. The profit and loss statement (like the statement of owners’ equity)always relates to a period of time, i.e. the time taken to make the profit reported inthe profit and loss statement. The balance sheet, however, relates to a particularmoment in time.
Let’s draw on the analogy of your own financial situation to highlight thisimportant time distinction. If you were asked ‘How much do you earn?’ you canonly respond in the context of a time period, i.e. you could talk of your earnings lastmonth or your earnings last year. Your earnings are analogous to the profit of a firm,in fact, a firm’s profit represents what the business has earned for the owners of thefirm (note how a time period is referred to in the heading of the profit and lossstatement presented in Exhibit 2.2 below). Similarly, if you were asked ‘What is yourwealth?’ your answer would have to be in the context of a particular moment intime, as the value of your assets are constantly changing, i.e. you might receiveweekly payments for work rendered, you buy and consume things such as food ona daily basis, etc. To determine your wealth you would have to identify everythingyou own (your assets) and deduct everything that you owe (your liabilities) at aparticular point in time. The issue of determining personal wealth is analogous tothe preparation of a company’s balance sheet which can be seen as a representationof the wealth of the firm, i.e. it summarizes assets and liabilities. Like the wealth ofan individual, the wealth of a firm can only be conceived in the context of aparticular moment in time (note how a point in time is referred to in the wording ofthe balance sheet heading presented in Exhibit 2.2 below).
21
Financial Management for Hospitality Decision Makers
Hosp
italit
y, L
eisu
re &
Tou
rism
Ser
ies
A balance sheet can be presented in one of the following two basic formats:
Assets – Liabilities = Owners’ Equity
or
Assets = Liabilities + Owners’ Equity
As both formats represent an equation, some people talk of ‘the balance sheetequation’. Underlying the first equation is the notion that the value of the owners’equity (the owners’ stake) in the company equals the surplus assets that wouldremain after the acquittal of all liabilities. Underlying the second equation is thenotion that money raised by a business is invested in various assets. The ‘moneyraised’ notion is on the right-hand side of the equation as liabilities include sourcesof finance such as bank loans, while owners’ equity refers to money invested in the
22
Box 2.1The main sections of a balance sheet
� Assets are ‘things’ that are owned (most usually purchased) by the organization. They areassets if the organization can derive some future value from ownership. Typical hotelassets include: cash, accounts receivable, prepayments, inventory (sometimes referred toas ‘stock’), cars, china, silver, glass, linen, uniforms, equipment, land and buildings. Assetsare generally recorded in the accounting system at their cost, although in some countriessuch as Australia, New Zealand and the UK, asset revaluations can be made (assetrevaluation is not permitted under the generally accepted accounting principles of Canadaand the USA).
� Liabilities may be seen as the opposite of assets. They reflect financial obligations of theorganization. Typical liabilities include: wages & salaries payable, accounts payable andbank loans.
� Owners’ equity reflects the financial investment of the owners in the organization. Itincludes the owners’ original investment plus all profits not paid out to the owners (i.e.profits retained in the business). For financial accounting purposes, profit is typicallydetermined on an annual basis. This computation is achieved through the profit & lossstatement (termed the ‘income statement’ in Canada and the USA). In the profit and lossstatement, expenses for the year (which represent resources consumed such ashousekeeping wages and cost of beer sold through a bar) are deducted from revenueearned during the year to give profit for the year. If expenses are greater than revenue, aloss results. Some profit may be withdrawn from the business by the owners. That portionof profit that the owners choose not to withdraw is effectively a further contribution to thebusiness by the owners. It is therefore treated as an addition to owners’ equity (at the endof the accounting year), and is generally termed ‘retained earnings’ or ‘retained profit’.Computation of the year-end owners’ equity balance is achieved through the statement ofowners’ equity. The first line of this statement identifies the owners’ equity balance at thebeginning of the accounting year. To this we add net profit for the year as well as anynew equity capital raised. Finally, any profits distributed to the owners during the year(termed ‘drawings’ or ‘dividends’) are deducted to give the closing owners’ equity balance.

Analysing transactions and preparing year-end financial statements
Hosp
italit
y, L
eisu
re &
Tou
rism
Ser
ies
business by the owners. With respect to the left-hand side of the second equation, themoney raised finances the purchase of assets and any money raised but not used topurchase assets must be held as cash, which is itself an asset.
Classifying transactions according to assets, liabilitiesand owners’ equityLike a coin, a financial transaction has two sides. These two sides signify that allfinancial transactions have a double impact on a business. We will now consider aset of transactions and see how, as a result of their double impact, the balance sheetequation is always left intact. In this worked example the balance sheet equation isstated as ‘assets = liabilities + owners’ equity’. The same exercise could be performedusing a format based on the alternative balance sheet equation, however.
In Exhibit 2.1, transactions undertaken in the first ten days of trading for Joe Blow,a small hotel offering seminar facilities close to Montreal’s Ile Notre-Dame FormulaOne Grand Prix circuit, are summarized. Following this, the way in which each of thetransactions affect the balance sheet are noted in the ‘account’ columns appearingunder the main balance sheet headings: assets, liabilities and owners’ equity. In theinterests of capturing all the transactions in one matrix, transactions that affect profit(i.e. a sale or the incurrence of an expense) appear in the final column headed ‘profitand loss’. As profit affects owners’ equity, this column appears under the owners’equity heading. Investments in the business by the owners are recorded in the ‘capital’column which also appears under the owners’ equity heading.
Following the steps undertaken in Exhibit 2.1 represents a learning activitydesigned to develop your appreciation of the fact that every transaction has a doubleimpact on the balance sheet equation. As will be seen later in Exhibit 2.2, in reality,transactions affecting profit flow first into the profit and loss statement and thenflow into the balance sheet via the statement of owners’ equity.
Following through the steps involved in Exhibit 2.1 is an important exercise. Notonly do they clearly demonstrate how every transaction has a double impact on thebalance sheet, the exercise also lays the basis for your appreciation of the workingsof the balance sheet. You should approach Exhibit 2.1 by considering eachtransaction in turn and noting its double impact on the balance sheet in a mannerthat leaves assets equal to the sum of liabilities and owners’ equity. A description ofhow each transaction results in a double impact is provided in Schedule 2.1.
We can present the results of the ten transactions described in Exhibit 2.1 in a moreconventional accounting format by compiling Joe Blow’s profit and loss statementand statement of owner’s equity for the first ten days of May and also Joe Blow’sbalance sheet as at 10 May. These statements are presented as Exhibit 2.2. Note howthe column totals in the balance sheet equation matrix appearing at the bottom ofExhibit 2.1 feed into the statements compiled in Exhibit 2.2. Also note how the profitdetermined in the profit and loss statement feeds into the balance sheet via thestatement of owners’ equity.
The balance sheet presented in Exhibit 2.2 has been compiled according to ahorizontal format whereby assets appear on one side and liabilities and owners’equity appear on the other. You may also encounter balance sheets presented usinga vertical format in which the totals of assets, liabilities and owners’ equity appearone above another (see, for example, the balance sheet presented later in the book asExhibit 5.2).
23

Financial Management for Hospitality Decision Makers
Hosp
italit
y, L
eisu
re &
Tou
rism
Ser
ies
While both the horizontal and vertical balance sheet formats are widely usedwithin the same countries, some different balance sheet formatting conventions doexist internationally. Relative to other English-speaking countries, some distinctconventions are particularly evident in the UK. In Australia, Canada, New Zealandand the USA, the convention is to present assets in order of liquidity, i.e. the assetsthat are closest to cash are presented first. If a business has cash, marketablesecurities, accounts receivable and inventory, then cash is presented first, marketablesecurities are second (marketable securities are readily convertible into cash),accounts receivable are third (accounts receivable are converted into cash in theshort term in the normal course of business), and inventory appears fourth (with the
24
Exhibit 2.1Illustration of how transactions affect the balance sheet equation
May1 Owner contributes $30,000 cash to commence business.2 Purchased a van for $12,000, paying $3,000 in cash and obtaining a loan for the balance.3 Purchased non-perishable food stock including a large maple syrup shipment on credit for $800.4 Billed clients $19,000 for use of conference facilities.5 Received $6,000 from customers billed in (4) above.6 Paid $500 to trade creditors to reduce amount owing for inventory stock purchased.7 Owners withdrew $1,500 from the business.8 The accountant has determined that $600 of inventory stock has been used.9 Paid $250 for miscellaneous expenses (telephone, electricity, etc.).
10 Repaid $5,000 of the loan taken out for the van.
Balance sheet equation
Assets = Liabilities +Owners’ equity
$ $
May
Cash atbank
$
Accountsreceivable
$Inventory
$Vehicles
$
Accountspayable
$
Loanpayable
$Capital
$
Profit& loss
$
1 +30,000 +30,000
2 –3,000 +12,000 +9,000
3 +800 +800
4 +19,000 +19,000
5 +6,000 –6,000
6 –500 –500
7 –1,500 –1,500
8 –600 –600
9 –250 –250
10 –5,000 –5,000
Total 25,750 13,000 200 12,000 300 4,000 28,500 18,150
$50,950 = $4,300 + $46,650

Analysing transactions and preparing year-end financial statements
Hosp
italit
y, L
eisu
re &
Tou
rism
Ser
ies
25
Schedule 2.1The impact of Exhibit 2.1’s ten transactions on the balance sheet
Transactiondate
Description of balance sheet impact
1 May The business now has $30,000 in cash (increase cash account). Thecapital account records all financial investments in the business made bythe owners (increase capital account).
2 May This transaction is slightly awkward as it affects three accounts. Thebusiness now has a motor vehicle which is an asset that cost $12,000(increase vehicles account). It paid for the van by using $3,000 cash(reduce the cash account) and by borrowing $9,000 (increase loanpayable account).
3 May The business now has $800 in inventory (increase inventory account). Itowes money for this purchase (increase accounts payable account).
4 May The business is now owed $19,000 for services rendered (increaseaccounts receivable account). The business has now made a sale(increase the revenue account – treated in this exercise as positivelyaffecting owners’ equity by increasing profit).
5 May The business now has a further $6,000 in cash (increase cash account).The money it was owed with respect to the sale made on 4 May is now$6,000 less (reduce accounts receivable account).
6 May Cash has now declined by $500 (reduce cash account). The amountowing with respect to the purchase made on 3 May is now $500 less(reduce accounts payable account).
7 May The business cash balance has now declined by a further $1,500 (reducecash account). The net investment in the business made by the ownershas declined by $1,500 (reduce capital account).
8 May The cost of stock held in the business has declined by $600 (reduceinventory account). This decline in stock signifies that resources havebeen consumed (increase cost of sales account – treated in this exerciseas negatively affecting owners’ equity by reducing profit).
9 May Cash has declined by $250 (reduce cash account). The use of telephoneand electricity signifies resources have been consumed (increasemiscellaneous expense account – treated in this exercise as negativelyaffecting owners’ equity by reducing profit).
10 May Cash has declined by $5,000 (reduce cash account). The amount owingon the loan taken out for the van is now $5,000 less (reduce loan payableaccount).

Financial Management for Hospitality Decision Makers
Hosp
italit
y, L
eisu
re &
Tou
rism
Ser
ies
exception of cash sales, a sale from inventory will become an account receivableprior to translation to cash). In these countries, a similar rationale is applied to thesequencing of liabilities, i.e. those liabilities with the shortest term to paymentappear first. In the UK, however, this sequencing for assets and liabilities is reversed.A further distinguishing feature of balance sheets in the UK concerns the positioningof the three main balance sheet sections. In a UK horizontal balance sheet, theconvention is to place owners’ equity and liabilities on the left-hand side (owners’equity above liabilities) and assets on the right-hand side. To illustrate this distinctnature of the balance sheet format used in the UK, the same balance sheet numbersas those appearing in Joe Blow Hotel’s balance sheet in Exhibit 2.2 are presentedusing a UK horizontal format in Exhibit 2.3 (in this exhibit £s replace $s).
26
Exhibit 2.2Illustration of how the profit and loss statement is linked to the balance sheetvia the statement of owners’ equity
Joe Blow HotelProfit and loss statement
for the first 10 days of May
$ $Sales revenue 19,000less ExpensesStock used 600Miscellaneous 250
850Profit 18,150
Joe Blow HotelStatement of owners’ equity
10 days ending 10 May
$Owners’ equity contribution 30,000plus Net profit 18,150 �
48,150less Drawings 1,500Owners’ equity at end of period 46,650
Joe Blow HotelBalance sheetas at 10 May
Assets $ Liabilities $ $Cash 25,750 Accounts payable 300Accounts receivable 13,000 Loan payable 4,000Inventory 200 4,300Vehicles 12,000 Owners’ equity
Capital 46,650 �
50,950 50,950

Analysing transactions and preparing year-end financial statements
Hosp
italit
y, L
eisu
re &
Tou
rism
Ser
ies
The importance of understanding financial accountingbasicsIn your working life you are highly likely to meet senior managers who have a poorunderstanding of the mechanics of financial accounting. In the financial decision-making case presented below, we see how an unfamiliarity with the basics offinancial accounting can be a recipe for poor decision making.
Case 2.1Financial Decision Making in Action –
The General Manager’s use of balance sheet information
Senior managers are increasingly using the performance of other hotels as a benchmarkfor appraising their own performance. A widely quoted performance indicator is return oninvestment (ROI) which is computed by stating a hotel’s annual profit as a percentage ofthe investment in its assets (ROI will be more extensively discussed in Chapter 5).Considerable care needs to be exercised in this type of analysis, however, as balancesheets record assets (i.e. investment) at their historical cost and not their current value.
Imagine hotels A and B are in the same hotel chain and are highly comparable in termsof markets served, size, quality and profits generated. Hotel A was purchased seven yearsago at a price that was 30% less than the price paid for Hotel B five years ago. Thedifference in the amount invested resulted from rapid inflation around the time the twohotels were acquired. If ROI is calculated based on conventional accounting records, it willappear that Hotel A is the better performer. This will be attributable more to the time it waspurchased than good management by the general manager, however. To provide a betterbasis for benchmarking the relative management performance in the two hotels, currentmarket value rather than historical cost could be used as the basis for valuing theinvestment in each hotel.
This issue of assets being recorded at their historical cost is also pertinent to insurancedecisions taken. Senior managers should ensure that all assets are insured for what itwould cost to replace them. Replacement cost can be significantly different from thehistorical cost recorded in a balance sheet.
27
Exhibit 2.3Illustration of a UK balance sheet prepared in a horizontal format
Joe Blow HotelBalance sheet as at 10 May
£ £ £Owners’ equity Assets
Capital 46,650 Vehicles 12,000Liabilities Inventory 200
Loan payable 4,000 Accounts receivable 13,000Accounts payable 300 Cash 25,750
4,300
50,950 50,950

Financial Management for Hospitality Decision Makers
Hosp
italit
y, L
eisu
re &
Tou
rism
Ser
ies
Summary
In this chapter we have seen how two financial implications arise from every financialtransaction undertaken by a business. We have also reviewed the nature and content of themain financial reports: the balance sheet and the profit and loss statement. We have seen thatthe balance sheet comprises assets, liabilities and owners’ equity accounts. The profit and lossstatement comprises revenue and expense accounts.
Having read the chapter you should now know:
� The main account headings in a balance sheet and profit and loss statement� The layout of a balance sheet and profit and loss statement� How to classify transactions according to their impact on assets, liabilities and owners’
equity accounts� How profit is determined in the profit and loss statement and flows into the balance sheet
via the statement of owners’ equity� The importance of senior managers having a basic understanding of the balance sheet.
References
Atkinson, H., Berry, A. and Jarvis, R. (1995) Business Accounting for Hospitality andTourism & Leisure, International Thomson Publishing, London, Chapters 3 and 4.
Carnegie, G., Jones, S., Norris, G., Wigg, R. and Williams, B. (1999) Accounting:Financial and Organisational Decision Making, Irwin/McGraw-Hill, New York,Chapter 3.
Coltman, M. M. and Jagels, M. G. (2001) Hospitality Management Accounting, 7thedition, John Wiley, Chichester, Chapter 1.
Guilding, C., Kennedy, D. and McManus, L. (2001) Journal of Hospitality and TourismResearch, 25, 2, 173–194.
Harris, P. (1999) Profit Planning, Butterworth-Heinemann, Oxford, Chapter 2.Kotas, R. and Conlan, M. (1997) Hospitality Accounting, 5th edition, International
Thomson Publishing, London, Chapter 1.Owen, G. (1994) Accounting for Hospitality, Tourism & Leisure, Pitman Publishing,
London, Chapter 4.Schmidgall, R. F. (1997) Hospitality Industry Managerial Accounting, 4th edition,
Educational Institute – American Hotel & Motel Association, East Lansing, MI,Chapters 2 and 3.
Problems
✓ indicates that a solution appears at the back of the text
✓ 2.1 Describe what is meant by:
(a) an asset(b) a liability(c) owners’ equity.
✓ 2.2 Describe what is meant by the term ‘balance sheet equation’.
✓ 2.3 Describe the difference between a profit and loss statement and a balance sheet.
28

Analysing transactions and preparing year-end financial statements
Hosp
italit
y, L
eisu
re &
Tou
rism
Ser
ies
2.4 Identified below are a set of transactions for the SerenitySleep Hotel whichcommenced business in Wellington, New Zealand on 1 June.
June1 Owner commenced business by depositing $20,000 in a new business bank
account.2 Purchased some basic office furniture for $3,000 cash.3 Purchased inventory stock for $900 cash.4 Purchased more inventory stock on credit for $1,400.5 Purchased an office computer for $6,000, paying $1,500 in cash and obtaining
a loan for the balance.6 Billed clients $1,000 for use of conference facilities.7 The owner withdrew $800 from the business.8 Banked the first week’s cash revenue $1,300.9 It was determined that $400 of inventory has been used since the commence-
ment of business.10 Paid $240 for miscellaneous expenses (telephone, electricity, etc.)
Required • • •Using a format similar to that appearing in Exhibit 2.1, demonstrate the impact eachtransaction will have on the balance sheet equation.
2.5 The Johnson Hotel is located in Perth, Western Australia. Identified below are theaccount balances for the Johnson Hotel following its commercial activities throughthe month of December 20X1.
$Accounts payable 10,000Accounts receivable 12,000Cash 5,000Linen 8,000Uniforms 7,500Buildings 250,000Loan payable 100,000Owners’ equity 148,000Sales revenue 38,000Inventory stock used 6,500Miscellaneous expenses 3,000Owners’ drawings 4,000
Required • • •(a) Prepare the Johnson Hotel’s profit and loss statement for December 20X1.(b) Prepare Johnson Hotel’s statement of owner’s equity for December 20X1.(c) Prepare Johnson Hotel’s balance sheet as at 31 December 20X1.
29

Financial Management for Hospitality Decision Makers
Hosp
italit
y, L
eisu
re &
Tou
rism
Ser
ies
2.6 In April 20X1, Jock MacNoodle opened the MacNoodle Italian Restaurant in Glasgow.Identified below are the restaurant’s financial transactions in its first month ofbusiness.
Date Transaction
1 April Jock MacNoodle deposited £10,000 in a newly opened businessbank account.
2 April Paid £400 cash for non-perishable food items to build up aninventory of food.
4 April Purchased a photocopier costing £1,000. 10% of the purchaseprice was paid in cash and a loan was taken to cover the balance.
5 April Purchased £500 of wine stock on credit.
7 April Banked the £350 received for cash sales made in first week.
8 April Paid £450 rent for April.
14 April Paid a kitchen assistant and waiter wages of £100.
18 April Paid £300 as part settlement of the wine merchant’s account.
27 April It was noted that half of the stock of wine purchased on 5th ofApril had been sold.
28 April Banked £460 received from cash sales.
29 April Paid a kitchen assistant and waiter wages of £280.
30 April It was noted that £60 of food inventory had been used.
30 April It was noted that credit sales made in the first month of businesswere £340.
Required • • •Using a format similar to that appearing in Exhibit 2.1, demonstrate the impact eachtransaction will have on the restaurant’s balance sheet equation.
2.7 In connection with the information provided in problem 2.6 above, prepare thefollowing:
(a) The MacNoodle restaurant’s profit and loss statement for April 20X1.(b) The MacNoodle restaurant’s statement of owners’ equity for April 20X1.(c) The MacNoodle restaurant’s balance sheet as at 30 April 20X1.
30

C H A P T E R• • • • 3
Double entryaccounting
L e a r n i n g o b j e c t i v e sAfter studying this chapter, you should havedeveloped an appreciation of:
1 The mechanics of double entry bookkeeping
2 How the terms ‘debit’ and ‘credit’ are used infinancial accounting
3 The fact that asset and expense accountsnormally have a debit balance
4 The fact that liability, owners’ equity and revenueaccounts normally have a credit balance
5 The distinction between current assets and fixedassets and also current liabilities and long-termliabilities.

Financial Management for Hospitality Decision Makers
Hosp
italit
y, L
eisu
re &
Tou
rism
Ser
ies
IntroductionThis chapter focuses on the fundamentals of double entry accounting and willreinforce the understanding of the balance sheet and profit and loss statement thatyou acquired from reading Chapter 2.
Double entry accounting: some background conceptsIn Chapter 2 we saw how a double impact arises from any financial transaction. Inthe light of this, it is not surprising that the financial accounting recording processis based on a system of double entries. In this chapter we will see that the columnsin the previous chapter’s Exhibit 2.1 represent ‘accounts’ in a real accounting system.In Exhibit 2.1 there were columns pertaining to cash, accounts receivable, inventory,etc. In double entry accounting we have a cash account, an accounts receivableaccount, an inventory account, etc. Further, we will see that the ‘+’ and ‘–’ symbolsthat indicated the directional change for each of the accounts in Exhibit 2.1 representa ‘debit’ or ‘credit’ in double entry accounting. An important word of caution iswarranted at this point, however. A ‘+’ does not always represent a debit or creditand a ‘–’ does not always represent a debit or credit. As we will see in Exhibit 3.1presented below, the relationship between the ‘+’ and ‘–’ used in the previouschapter and the debit and credit terms used in double entry accounting depends onthe nature of the account in question.
Before exploring the workings of the double entry bookkeeping system, it ishelpful to review the nature of the five basic account categories. In an accountingsystem these comprise: assets, liabilities, owners’ equity, revenues and expenses.Asset, liability and the owners’ equity accounts relate to a certain point in time (theyare sometimes referred to as ‘snapshot’ accounts). Their ‘snapshot’ nature should beapparent from the fact that they all appear in the balance sheet. We noted in Chapter2 that the balance sheet refers to a particular point in time, and not a period of time.Revenue and expense accounts are ‘flow’ accounts (they only make sense whenreferring to a period of time). Again, this should be apparent from the fact thatexpense and revenue accounts appear in the profit and loss statement which, unlikethe balance sheet, refers to a time period and not a particular point in time.
Let us now turn to the fundamentals of double entry accounting. In Box 3.1 thereis a summary of key principles that can help when first confronting the debits andcredits of double entry accounting.
The first two principles in Box 3.1 provide a framework that can serve as a highlyvaluable reference point when learning the double entry accounting process. Thisframework is also depicted as a matrix in Exhibit 3.1. From this matrix we can seethat asset accounts usually have a debit balance (column 1). It follows that a debitentry is made to record an increase in an asset account (column 2), and a credit entryis made to record a decrease in an asset account (column 3). Similarly, it is alsoevident from Exhibit 3.1 that liability accounts usually have a credit balance (column1), we credit a liability account to increase it (column 2), and debit a liability accountto decrease it (column 3).
The fourth principle of double entry accounting referred to in Box 3.1 concerns theworkings of the cash account. Gaining a familiarity with the workings of the cashaccount is a useful first step when attempting to understand the double entryaccounting system. This is because many transactions affect cash. Cash is an
32

Double entry accounting
Hosp
italit
y, L
eisu
re &
Tou
rism
Ser
iesexample of an asset account, and once you have mastered the way this account
works, you will have gained an insight into the workings of all asset accounts. Ascash is an asset, it is evident from Exhibit 3.1 that a receipt of cash (i.e. an increasein cash) will be recorded by debiting the cash account and a disbursement of cash(i.e. a decrease in cash) will be recorded by crediting the cash account.
The cash account’s workings can be illustrated using a ‘T account’, as depictedin Exhibit 3.2. The left-hand side of all T accounts (regardless of whether they areassets, liabilities, etc.) is the debit side (sometimes abbreviated as ‘Dr’) and theright-hand side of all T accounts is the credit side (sometimes abbreviated as ‘Cr’).Some find it helpful to visualize money flowing through the cash T account fromleft to right, i.e. money flows into the left-hand side of the account (the arrow onthe left in Exhibit 3.2), and flows out of the right-hand side of the account (thearrow on the right in Exhibit 3.2). Consistent with this visualization, a receipt of
33
Box 3.1Key principles of double entry accounting
� With respect to balance sheet accounts: asset accounts normally have a debit balance,liabilities and owners’ equity accounts normally have a credit balance. This is a helpful rule,however be warned that in some situations it can be broken, e.g. while we normally think ofa bank account as an asset (i.e. debit balance), if it becomes overdrawn it will represent aliability (i.e. credit balance).
� With respect to profit and loss accounts: revenue accounts have a credit balance, expenseaccounts have a debit balance.
� For every debit entry, there must be an equal credit entry.
� Where there is a cash inflow we debit the cash account. For a cash outflow, we credit thecash account.
Exhibit 3.1The double entry accounting framework
Type of account (1)Usual
balance
(2)If increasingthe account
(3)If decreasingthe account
Asset (balance sheet account) Debit Debit Credit
Liability (balance sheet account) Credit Credit Debit
Owners’ equity (balance sheet account) Credit Credit Debit
Revenue (P&L account) Credit Credit Debit
Expense (P&L account) Debit Debit Credit

Financial Management for Hospitality Decision Makers
Hosp
italit
y, L
eisu
re &
Tou
rism
Ser
ies
money is recorded as a debit to the cash account and an outflow of cash isrecorded as a credit to the cash account.
Because of the terminology used by banks, many students of accounting areconfused when introduced to the workings of the cash account. They are used totheir bank informing them that a deposit of funds in their account represents acredit. This confusion arises because the bank is using terminology from itsperspective and not the account holder’s perspective. This will be illustrated by thefollowing small example. Imagine that Monica Miser deposits $300 in her savingsaccount held with the Loyalty bank. The double entry that the Loyalty bank willrecord in its accounting system is as follows:
Cash M. Miser Savings Account
300 300
Note that the cash account (which is an asset from the bank’s perspective) hasbeen debited. This is consistent with Exhibit 3.2. Note also that the bank’s record ofMonica Miser’s savings account has been credited. This account represents a liabilityfrom the perspective of the bank (i.e. it records what the bank owes to M. Miser). Asthe bank’s liability to Monica Miser has increased, the savings account has beencredited (check back to column 2 in Exhibit 3.1). When Monica Miser receives astatement from her bank, she will find that the $300 deposit has been recorded as acredit to her savings account. The confusion for the student of accounting stemsfrom the fact that the savings account represents a liability for the bank, but an assetfor the account holder.
Double entry accounting: a worked exampleWe are now in a position to explore the nature of double entry accounting througha worked example comprising several transactions. In the following example we willsee the double entry recording of a series of transactions and the subsequentpreparation of a profit and loss statement and balance sheet.
Imagine that on 28 June the Winnie Pooh Hotel Ltd commenced business next toa children’s theme park in Cardiff, Wales. On 30 June the only balances in W. PoohHotel Ltd’s accounting system were as follows:
34
Exhibit 3.2The cash ‘T account’
Cash
Debit side Credit side
Money in Money out�
�

Double entry accounting
Hosp
italit
y, L
eisu
re &
Tou
rism
Ser
ies
£Cash 8,000Revenue 300Owners’ Equity 7,700
Identified below are nine transactions that occurred in July, together with thedouble entry necessary to record each transaction in the accounting system. Thecircled numbers in the ‘T-accounts’ highlight the entry necessary to record thetransaction in question.
Transaction 11 July: From the £8,000 balance in the bank account, beverage stock was purchasedfor £200 cash.
Cash Inventory
Openingbalance(OB)
8,000
200 200
Both cash and inventory are asset accounts. From Exhibit 3.1 it can be determinedthat the decrease in cash necessitates a credit to the cash account, and the increase ofstock necessitates a debit to the inventory account.
Note: Exhibit 3.1 indicates that we expect to see a debit balance in an asset account(e.g. cash or inventory).
Transaction 24 July: At an American Independence Day banquet function the beverage stockbought on 1 July was sold for £500 cash.
Note: this is a slightly tricky transaction to record as we have to complete two sets ofentries. The first set deals with the sales aspect of the transaction, the second setdeals with the expense aspect of the transaction.
Cash Revenue
8,000 OB 300200
500 500
Note: Exhibit 3.1 indicates that we expect to see a credit balance in a revenueaccount.
35
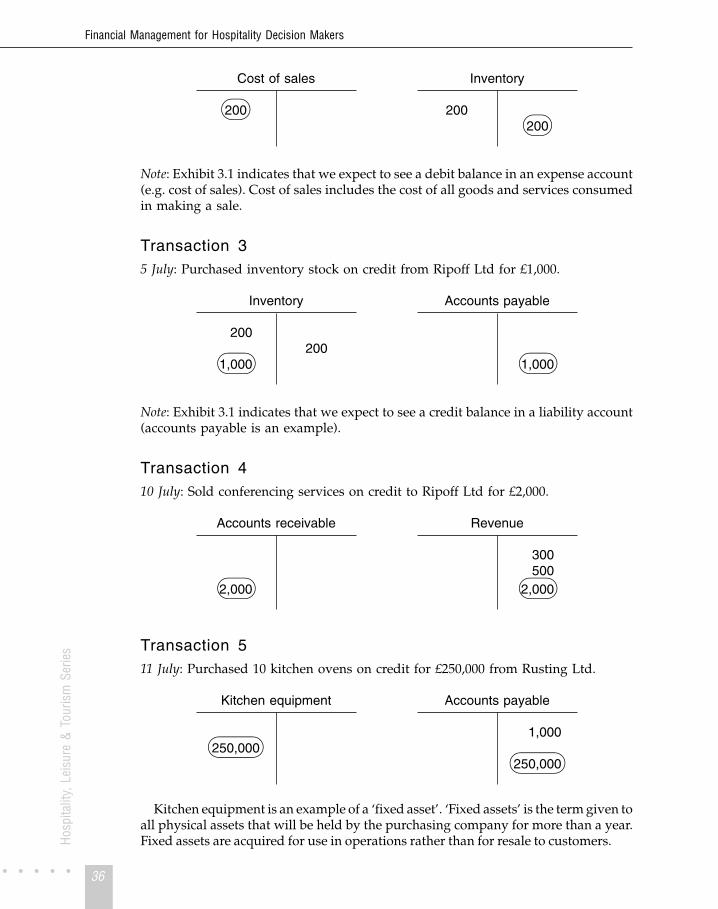
Financial Management for Hospitality Decision Makers
Hosp
italit
y, L
eisu
re &
Tou
rism
Ser
ies
Cost of sales Inventory
200 200200
Note: Exhibit 3.1 indicates that we expect to see a debit balance in an expense account(e.g. cost of sales). Cost of sales includes the cost of all goods and services consumedin making a sale.
Transaction 35 July: Purchased inventory stock on credit from Ripoff Ltd for £1,000.
Inventory Accounts payable
200200
1,000 1,000
Note: Exhibit 3.1 indicates that we expect to see a credit balance in a liability account(accounts payable is an example).
Transaction 410 July: Sold conferencing services on credit to Ripoff Ltd for £2,000.
Accounts receivable Revenue
300500
2,000 2,000
Transaction 511 July: Purchased 10 kitchen ovens on credit for £250,000 from Rusting Ltd.
Kitchen equipment Accounts payable
1,000250,000
250,000
Kitchen equipment is an example of a ‘fixed asset’. ‘Fixed assets’ is the term given toall physical assets that will be held by the purchasing company for more than a year.Fixed assets are acquired for use in operations rather than for resale to customers.
36

Double entry accounting
Hosp
italit
y, L
eisu
re &
Tou
rism
Ser
ies
Transaction 618 July: Paid Rusting £250,000 to settle the outstanding account.
Cash Accounts payable
8,000 1,000200
500 250,000250,000 250,000
Transaction 720 July: Paid £300 for electricity bill.
Cash Electricity expense
8,000200 300
500250,000
300
Transaction 824 July: To correct the business bank overdraft, the owner invests a further £500,000into the company.
Cash Owners’ equity
8,000OB 7,700
200500 500,000
250,000300
500,000
Note: Exhibit 3.1 indicates that we expect to see a credit balance in the owners’ equityaccount.
Transaction 931 July: The owner realizes that in the previous week he had taken too much out ofhis personal account and that he now faces a shortfall of cash. As a result, he took£1,500 back out of the business account and put it in his personal account.
37

Financial Management for Hospitality Decision Makers
Hosp
italit
y, L
eisu
re &
Tou
rism
Ser
iesCash Drawings
8,0001,500
200500
250,000300
500,0001,500
Note: Drawings is the term used to describe the transaction occurring when anowner takes funds out of the business. In the case of companies with shareholderownership, drawings are referred to as ‘dividends’. Drawings is the one account thatdoes not lend itself to interpretation through the framework outlined in Exhibit 3.1.If attempting to use Exhibit 3.1, it is best to view drawings as a negative owners’equity account. If an owner adds to his investment in the business (increase inowners’ equity) we credit the owners’ equity account. It follows that a debit to theowners’ equity account refers to a decrease in owners’ equity. Instead of debiting theowners’ equity account directly, however, when an owner removes funds from thebusiness, we debit the drawings account.
Assuming there were no further transactions for the W. Pooh Hotel, the profit andloss statement can be produced as follows:
Winnie Pooh Hotel LtdProfit & Loss statement
for the period ended 31 July
£ £Revenue 2,800Cost of Sales 200Gross Profit 2,600Electricity Expense 300Net Profit 2,300
less Drawings 1,500Retained Earnings 800
In Chapter 2 we saw that the owners’ equity balance can be computed by way ofa ‘statement of owners’ equity’. It is also common practice to segregate owners’equity into two underlying elements: the capital account and the retained earningsaccount. The capital account records direct investments made into the business by itsowners, the retained earnings account records all business profits made and notdistributed to the owners. The retained earnings balance can be computed in themanner noted above, i.e. by deducting drawings from the net profit figure in theprofit and loss statement.
38

Double entry accounting
Hosp
italit
y, L
eisu
re &
Tou
rism
Ser
ies
In the following balance sheet for the Winnie Pooh Hotel, assets have beensegregated between current assets and fixed assets. Current assets include cash andother assets that through the business’s operating cycle will be converted into cash,sold or consumed within one year of the balance sheet date. As noted earlier, fixedassets include all physical assets that will not be sold in the next 12 months.Similarly, a distinction can be drawn between current and longer-term liabilities.Current liabilities include those liabilities that are due for payment in the course ofthe next 12 months, while long-term liabilities include liabilities that are not due forpayment in the next 12 months.
Winnie Pooh Hotel LtdBalance Sheet as at 31 July
£ £ £ £Current Assets Current liabilitiesCash 256,500 Accounts payable 1,000Accounts receivable 2,000 Owners’ equityInventory 1,000 Capital account 507,700
259,500 Retained earnings 800
Fixed Assets 508,500Kitchen equipment 250,000
509,500 509,500
For well-established companies, the retained earnings account can be one of thelargest accounts appearing in a balance sheet. As highlighted in the financialdecision-making case presented below, it is an account that is frequently misunder-stood by managers.
Case 3.1Financial Decision Making in Action –
The General Manager’s interpretation of the retained earnings account
The retained earnings account records the accumulated profits earned by a company andretained in the business. There is a common tendency, however, for managers who havehad no accounting training to believe that the retained earnings account represents cashheld.
It is imperative that senior management do not fall prey to this misconception of theretained earnings account because:
� As will be seen in Chapter 11, careful cash management is fundamental to maintainingbusiness solvency. The immediate factor that causes a bankruptcy is a shortage of cash.
� The retained earnings account is frequently one of the largest accounts appearing in abalance sheet.
Senior managers should not allow the retained earnings balance to influence their thinkingin any decision that carries significant cash management implications. To determine howmuch cash a business holds, look at the cash (or bank) balance that appears as an assetin the balance sheet.
39

Financial Management for Hospitality Decision Makers
Hosp
italit
y, L
eisu
re &
Tou
rism
Ser
ies
Summary
This chapter has built on Chapter 2’s introduction to financial accounting by describing the‘debit and credit’ system of double entry bookkeeping. A framework was introduced showingyou that a debit increases asset and expense accounts and that a credit increases liability,owners’ equity and revenue accounts. In connection with a worked example, you were shownan accounting transaction affecting each of these main account groupings.
Having read the chapter you should now know:
� How to increase or decrease asset, liability, owners’ equity, revenue and expense accounts� That profits not paid out to the owners of a business as dividends or drawings are generally
credited to an owners’ equity account called ‘retained earnings’� That current assets include cash and other assets that through the business’s operating cycle
will be converted into cash, sold or consumed within one year of the balance sheet date� That current liabilities include those liabilities that are due for payment in the course of the
next 12 months.
References
Carnegie, G., Jones, S., Norris, G., Wigg, R. and Williams, B. (1999) Accounting:Financial and Organisational Decision Making, Irwin/McGraw-Hill, New York,Chapter 4.
Coltman, M. M. and Jagels, M. G. (2001) Hospitality Management Accounting, 7thedition, John Wiley, Chichester, Chapter 1.
Kotas, R. and Conlan, M. (1997) Hospitality Accounting, 5th edition, InternationalThomson Publishing, London, Chapter 2.
Owen, G. (1994) Accounting for Hospitality, Tourism & Leisure, 1st edition, PitmanPublishing, London, Chapter 2.
Schmidgall, R. F. (1997) Hospitality Industry Managerial Accounting, 4th edition,Educational Institute – American Hotel & Motel Association, East Lansing, MI,Chapter 1.
Problems
✓ indicates that a solution appears at the back of the text
✓ 3.1 Describe whether we can say that a debit to an account signifies that somethingbeneficial has happened for the business concerned.
✓ 3.2 Are we able to say that in double entry accounting a debit represents a plus and acredit represents a minus?
✓ 3.3 What is the difference between fixed assets and current assets?
3.4 Record a hotel’s following five transactions in appropriately headed T-accounts.
(a) Hotel receives $500 for room sales.(b) Hotel pays staff $400 in wages.(c) Hotel makes $600 of restaurant sales all on credit.
40

Double entry accounting
Hosp
italit
y, L
eisu
re &
Tou
rism
Ser
ies
(d) Hotel owner withdraws $1,000 from the business.(e) Hotel buys $700 of inventory stock on account.
3.5 Dublin’s BlarneyStone Pub opened on 1 April and the following six transactionsoccurred in its first week of business. Record the transactions in appropriatelyheaded T-accounts for the BlarneyStone Pub’s manager.
(a) Owner invested A4,000 in a newly opened bank account for the pub.(b) Purchased A5,000 of ‘Old Black Creamy’ stout on account.(c) Paid cash A450 for a delivery of potato crisps and salted peanuts.(d) Purchased a cash register for A1,000 on credit.(e) Banked the first week’s bar takings of A350.(f) Determined that the cost of ‘Old Black Creamy’ sold in the first week wasA150.
3.6 (a) Using ‘T-accounts’, record debit and credit entries for each of the followingtransactions that all occurred in January 20X1 for a San Francisco restaurant.The T-accounts you will need are: Cash, Food Inventory, Beverage Inventory,Accounts Receivable, Furniture and Equipment, Accounts Payable, Bank Loan,Owners’ Equity, Revenue, Food Purchase Expense, Beverage PurchaseExpense, Wage Expense, Supplies Expense, Rent Expense, Interest Expense.
a Mr T. Francis commenced business by investing $30,000 cash in therestaurant.
b Purchased on credit food stock for $4,000, and beverage stock for $6,000.c Purchased furniture and equipment for $20,000, paying $12,000 cash and
owing the balance.d The bank extended a loan of $20,000 to the business.e Made sales of $40,000 during the month – 75% of this was cash sales, the
remainder was on credit.f Purchased $9,000 of perishable food items (food purchase expense) on credit
and paid $2,000 cash for beverages (beverage purchase expense). Thebusiness has established that both these purchases should be immediatelyexpensed.
g Paid $12,000 to trade creditors.h Repaid $2,000 of the bank loan plus interest of $100.i Paid $10,800 of wages.j Paid $4,000 for miscellaneous supply items. The business has a policy of
expensing these items on purchase.k On the last day of the month, paid $1,500 rent for January.
(b) Once the T-account entries have been recorded, prepare a profit and lossstatement for January 20X1 and a balance sheet as at 31 January 20X1.
3.7 The following transactions occurred during the first month of operations for ‘OzHinterland’, a hotel proprietor’s new business located in the Australian Kimberleys:
a Owner invested $80,000 of her own money in Oz Hinterland.b In order to provide further capital, a bank extended a loan of $40,000 for the
business.c Paid cash for land and buildings $99,500.
41

Financial Management for Hospitality Decision Makers
Hosp
italit
y, L
eisu
re &
Tou
rism
Ser
ies
d Purchased kitchen equipment for $20,000. $8,000 of this was paid for in cash,with the balance owing.
e Purchased on credit a stock of linen and uniforms for $5,800.f During month received revenue of $12,000 for room sales and restaurant
revenue.g Paid $1,500 for first month’s wages.h Paid $300 covering one month’s interest on the bank loan.i Paid $1,200 insurance premium covering the first year of operations.j Paid $6,000 of the balance owing for kitchen equipment.k Purchased beverage stock of $1,500 for cash. By the end of the first month it
was determined that one third of this stock had been sold in the restaurant.l Determined that during the month the kitchen had purchased $1,800 of
perishable food supplies for cash. No balance of food stock remained at theend of the month.
Required • • •(a) Enter these transactions on T-accounts.(b) Prepare a profit and loss statement for the first month and a balance sheet as at
the month-end.
42

C H A P T E R• • • • 4
Adjusting andclosing entries
L e a r n i n g o b j e c t i v e sAfter studying this chapter, you should havedeveloped an appreciation of:
1 What is meant by ‘closing entries’
2 What is meant by ‘adjusting entries’
3 The distinction between periodic and perpetualinventory accounting systems
4 How the accountant accounts for bad debts
5 How the accountant accounts for depreciation.

Financial Management for Hospitality Decision Makers
Hosp
italit
y, L
eisu
re &
Tou
rism
Ser
ies
IntroductionThis chapter focuses on adjusting entries and closing entries. ‘Adjusting entries’ isthe term used to describe the set of bookkeeping entries that need to be made inorder to update some accounts prior to the preparation of the accounting year-endprofit and loss statement and balance sheet. ‘Closing entries’ is the term used todescribe the set of year-end accounting entries that are made in order that allaccounts relating to a period of time (i.e. revenue, expense, and the drawings ordividends account) begin the new accounting year with a zero balance. It is onlyonce all adjusting entries have been completed that closing entries can be made. Thisis because closing entries result in the transference of account balances to the profitand loss account.
As the mechanics of adjusting entries are more challenging than those of closingentries, the chapter is structured around the different types of adjusting entries thatcan be encountered. In the course of considering a range of adjusting entries, themechanics of making closing entries will also be demonstrated.
Why do we need closing entries?Immediately prior to entering the new accounting year, all accounts that relate to aperiod of time (i.e. those accounts that do not flow directly to the balance sheet) needto be wound back to zero. If these accounts were not wound back to a zero balanceon an annual basis, their balances would not reflect the current year’s sales revenue(for a revenue account) or the current year’s expenses (for an expense account). Ineffect, failure to close these accounts would result in the revenue account and also allexpense accounts showing balances that reflect sales achieved and expensesincurred since the inception of the business. The term ‘closing entry’ is used todescribe the year-end transference of balances in these accounts to the profit and lossaccount (the profit and loss statement can be thought of as an account in whichrevenues are credits and expenses are debits).
In Chapter 2, we saw that the balance on the profit and loss account (i.e. net profit)is transferred to the owner’s equity section of the balance sheet by way of thestatement of owner’s equity. This highlights the fact that all accounts flow eventuallyinto the balance sheet. This flow is direct for those accounts that are sometimesdescribed as ‘permanent’ (i.e. asset, liability and owner’s equity accounts) andindirect via the profit and loss statement for other accounts that are sometimesreferred to as ‘temporary’ (e.g. revenue and expense accounts).
Why do we need adjusting entries?In many cases the need for adjusting entries arises because the timing of cash flows(either receipts or disbursements) does not coincide with the period in which it isappropriate to recognize the related revenue or expense. This distinction between thetiming of a cash flow and the timing of the recognition of a revenue or an expense itemstems from the accrual concept of accounting. The nature of this concept, as well assome examples of year-end adjusting entries are presented in Box 4.1.
The examples of year-end adjusting entries referred to in Box 4.1 will be more fullyexplained in the next section which provides a worked example of year-endadjusting entries.
44

Adjusting and closing entries
Hosp
italit
y, L
eisu
re &
Tou
rism
Ser
ies
Worked examples highlighting types of adjusting entryIn this section, the following four basic types of adjusting entry will be explained byway of worked examples:
� Costs paid for but not yet incurred (i.e. expenses pre-paid)� Costs incurred but not yet paid for (e.g. money owing for wages)� Unearned revenue (i.e. cash received prior to delivery of a good or service)� Revenue earned but no cash received (e.g. interest on an investment account that
is earned but not yet received).
In addition, three further commonly confronted situations that give rise to adjustingentries are explored:
� Supplies used� Bad debts (uncollectible account receivables)� Depreciation.
Adjusting entry type 1: Costs paid for but not yet incurredThis situation arises for insurance and rent (in rental and insurance situations thepayee typically pays prior to the period in which the rental or insurance benefit isreceived).
45
Box 4.1Adjusting entries and the nature of the accrual concept
Most year-end adjusting entries arise because of the accrual concept of accounting whichholds that:
� Revenue is recognized when it is earned and certain, rather than simply when cash isreceived
� An expense is recognized in the period when the benefit derived from the associatedexpenditure arises (e.g. wages for work conducted during the current period are treated asan expense of the current period, regardless of whether or not they have been paid forduring the current period).
Examples of year-end adjusting entries include:
� Recording wages accrued (at the year-end there are wages owing for employee workconducted but not yet paid for)
� Allocating the cost of a fixed asset to those accounting periods in which the benefit ofowning the fixed asset occurs (this is ‘depreciation’)
� Allocating a pro-rated portion of prepaid insurance to the most recent accounting period
� Adjusting accounts receivable (debtors) to recognize that some of the balance appearing inthe accounts receivable ledger may prove to be uncollectible.

Financial Management for Hospitality Decision Makers
Hosp
italit
y, L
eisu
re &
Tou
rism
Ser
ies
Imagine that on 1 January 20X1 Winnipeg’s TrudeauInn took advantage of aspecial insurance offer and purchased 18 months’ insurance coverage for $3,000. On30 June 20X2 this policy was renewed for a further 12 months at a cost of $2,400.TrudeauInn’s accounting year-end is on 31 December.
To compute the insurance expense to be charged to the P&L statement, prorate theamounts paid to the periods of time in which the insurance coverage expired, i.e.:
20X1 Insurance expense = two thirds of $3,000 = $2,000.
20X2 Insurance expense = one third of $3,000 + half of $2,400 = $2,200.
Accounting treatment:
1 January 20X1:
Insurance prepaid Cash
3,000 3,000
Note: The insurance cover is paid for in advance of the period of time that it pertainsto. This signifies that immediately following the payment of the insurance premiumwe have an asset (i.e. insurance coverage) that runs for the life of the insurancecontract. This asset is referred to as ‘insurance prepaid’.
31 December 20X1 (adjusting entry):
Insurance expense Insurance prepaid
2,000 3,0002,000
Note: The need to make this year-end entry can be viewed from an asset-depletionperspective or an expense-incurred perspective. With respect to the asset-depletionperspective, two thirds of the insurance coverage paid for at the beginning of theyear has now expired due to the passage of time. This signifies that the $3,000 asset(i.e. prepaid insurance) has diminished by $2,000. With respect to the expenseperspective, 12 months of insurance cover was ‘consumed’ in 20X1. From theprorated calculation above, we found that the 20X1 insurance cover effectively cost$2,000.
31 December 20X1 (closing entry):
Insurance expense P&L account
2,000 2,0002,000
46

Adjusting and closing entries
Hosp
italit
y, L
eisu
re &
Tou
rism
Ser
ies
Note: Prior to entering the new accounting year, all revenue, expense and drawingaccounts (i.e. ‘period related’ or ‘temporary’ accounts) need to be wound back tozero in order that their balance at any time reflects the revenue, expense or drawingsfor the current accounting year. This process is generally referred to as makingclosing entries. These accounts are closed by transferring their balances to the profitand loss account, which results in the compilation of the profit and loss statement forthe year.
30 June 20X2:
Insurance prepaid Cash
3,000 2,4002,000
2,400
This 30 June 20X2 entry is to record the $2,400 insurance premium paid.
31 December 20X2 (adjusting entry):
Insurance expense Insurance prepaid
3,0002,200 2,000
2,4002,200
Note: Again, we can take an asset depletion or an expense incurred perspective onthis adjusting entry. With respect to the asset depletion perspective, in the first sixmonths of 20X2 $1,000 of the $3,000 prepayment expired. In the second six monthsof 20X2, $1,200 of the $2,400 prepayment expired. From the expense perspective, thissignifies that insurance coverage costing a total of $2,200 is attributable to 20X2. Notealso that a rationale can be offered for the $1,200 year-end debit balance remainingon the insurance prepaid account. This represents the cost of acquiring insurancecover for the first six months of 20X3, i.e. the cost of insurance cover that is prepaidas at 31/12/X2.
31 December 20X2 (closing entry):
Insurance expense P&L account
2,200 2,2002,200
Finally, on 31 December 20X2, all revenue and expense accounts are closed off to theprofit and loss account.
47

Financial Management for Hospitality Decision Makers
Hosp
italit
y, L
eisu
re &
Tou
rism
Ser
ies
In this example, it has been presumed that on payment of the premium, ‘insuranceprepaid’ is debited. In some accounting systems this amount may be chargedimmediately to ‘insurance expense’. This approach is referred to as ‘expensing onpurchase’. If this alternative approach is taken, the year-end adjusting entry willhave to set up the prepaid amount. For example, in the case described above, if thecompany had immediately expensed the $3,000 insurance cover purchased on 1January 20X1, the year-end adjusting entry would be as follows:
31 December 20X1 (adjusting entry):
Insurance expense Insurance prepaid
3,000 1,0001,000
Note: Regardless of the initial method taken to record the insurance cover purchased,once the year-end adjusting entries have been made, the insurance expense accounthas a debit balance of $2,000 and the insurance prepaid account has a debit balanceof $1,000. Some find it helpful to approach adjusting entries by first consideringwhat year-end balance is needed in the prepaid account and the expense account. Ifyou can determine what year-end balance needs to be reflected in these accounts,you can work out what adjusting entry needs to be made.
Adjusting entry type 2: costs incurred but not paid for(accrued expenses)Costs incurred but not yet paid are frequently referred to as ‘accrued expenses’. Oneof the main examples of accrued expenses arises in connection with wages andsalaries. If, at the end of the accounting period, employee work costing $1,000 hasbeen performed but has not yet been paid for, accrued wages are recorded as follows(the wages accrued account is a liability account that reflects wages owing):
Wage expense Wages accrued
1,000 1,000
Like all expense accounts, at the year-end the debit balance of the wage expenseaccount will be closed off to the P&L account. In the new accounting year, if the firstwage bill paid amounts to $5,000, the following entry will have to be made:
Cash Wage expense Wages accrued
5,000 4,000 1,0001,000
Note: This first entry in the new accounting year is slightly complicated as it involvesthree accounts. The cash account credit entry of $5,000 is straightforward as $5,000
48

Adjusting and closing entries
Hosp
italit
y, L
eisu
re &
Tou
rism
Ser
ies
has been paid out. The wage expense account starts the new year with a zero balanceas a result of the closing entry made at the end of the previous year. Of the $5,000wage payment, $1,000 relates to the previous year (this is evident from the $1,000credit balance in the wages accrued account). $4,000 of the $5,000 wage paymentmust therefore relate to work conducted this year. As the wage expense accountreflects the cost of work completed this year, it is appropriate that it be debited with$4,000. Finally, prior to the wage payment, the wages accrued account reflects aliability of $1,000. Immediately following the payment of wages the liability toemployees is removed, therefore it is appropriate that a zero balance be reflected, i.e.a $1,000 debit entry is warranted. The intricacies of this particular set of accountingentries only arise around the year-end, as in most accounting systems this is the onlytime that entries are made to the wages accrued account.
Adjusting entry type 3: unearned revenueImagine that on 1 December the Captain Cook Hotel in Whitby, Yorkshire received£50,000 as an advance payment from a conference organizer, covering the cost of a5-day conference that the hotel will host commencing on 30 December. At the closeof business on 31 December (the hotel’s accounting year-end), 40% of the conferenceservice can be seen to have been provided (i.e. the hotel has completed the hostingof 2 days of the 5-day conference).
Accounting treatment made in the hotel’s records would be as follows:
1st December accounting entry:
Cash Unearned revenue
50,000 50,000
Note: Unearned revenue is the name of the account that is credited when cash isreceived in advance of the provision of goods or services associated with a sale. Thisis a liability account. In the above example, in the period following the £50,000receipt but prior to hosting the convention, the £50,000 can be seen to represent aliability. Under a typical conference contract, if a contingency arises preventing thehotel from hosting the convention, it will have to refund the conference organizer.
31 December accounting entry (adjusting entry):
Revenue Unearned revenue
20,000 50,00020,000
Note: As 40% of the work contracted for (i.e. hosting the conference) has beencompleted by the year-end, 40% of the original unearned revenue amount can beviewed as earned by 31 December. We therefore make a credit entry of £20,000 (40%of £50,000) to the revenue account and reduce the balance on the unearned revenueaccount by making a debit entry of £20,000.
49

Financial Management for Hospitality Decision Makers
Hosp
italit
y, L
eisu
re &
Tou
rism
Ser
ies
Adjusting entry type 4: Revenue earned but no cashreceivedThe issue of accounting for ‘unearned’ revenue frequently arises when a reportingentity has an investment in an interest bearing account. Imagine Aberdeen’s ScroogeHotel has an investment of £24,000 yielding 10% annual interest with cash interestpaid semi-annually. The last time Scrooge updated its records with respect to thisinvestment occurred on 30 September which is when it last received an interestpayment of £1,200 earned for the six months commencing 1 April. If Scrooge has a31 December year-end, the year-end adjusting entry required to record the interestthat it is owed as a result of holding the investment through October, November andDecember is as follows:
31st December accounting entry (adjusting entry):
Interest receivable Interest revenue
600 600
Note: Scrooge’s investment is earning interest at the rate of £200 per month. At theyear-end it has not recorded the interest earned in the final three months of the year.A £600 credit entry to the interest revenue account updates the company’s record ofinterest earned in the year. The £600 debit entry to the interest receivable accounthighlights that the company has an asset in the form of interest that it is owed at theyear-end.
Adjusting entry type 5: accounting for suppliesSupplies such as office stationery generally represent a relatively small investmentfor most hotels. As a result, many hotels adopt the relatively simple accountingprocedure of periodically determining the supplies balance by conducting a stock-take (this approach is generally referred to as a periodic inventory accountingsystem). Under a periodic inventory system, the purchases of supplies are simplyrecorded by debiting a ‘supplies purchases’ account. Operation of a periodicinventory system and the adjusting entry that it gives rise to are demonstratedthrough the worked example in Exhibit 4.1.
The year-end adjusting entries that would have to be made in the scenariodescribed in Exhibit 4.1 can be managed in two stages. First, the purchases accountbalance can be transferred to the supplies inventory account. Consistent with thephilosophy of closing entries, this results in the purchases account starting the newaccounting year with a balance of zero.
Supplies purchases Supplies inventory
2,80014,000
14,000 14,000
50

Adjusting and closing entries
Hosp
italit
y, L
eisu
re &
Tou
rism
Ser
ies
Second, the supplies expense account can be debited with the £14,800 cost ofsupplies used that was calculated above. The corresponding credit entry should thenbe made to the supplies inventory account. These entries result in the recognition ofan expense (the supplies expense account will be closed to the profit & lossstatement). They also result in a £2,000 debit balance in the supplies inventoryaccount, which reflects the result of the year-end stock-take. This inventory accountbalance will comprise part of the total assets recorded in the year-end balancesheet.
Supplies expense Supplies inventory
2,80014,800 14,000
14,800
Using a periodic inventory control system signifies that a degree of control is lostwith respect to inventory. Between stock-takes the manager responsible for orderingsupplies will have no administrative record of the supplies held in stock. If this isbelieved to represent a significant problem, the manager could consider using aperpetual inventory system. The relative merits of perpetual and periodic inventorysystems are outlined in the following financial decision-making case.
51
Exhibit 4.1Determining stock used in a periodic inventory system
Suzy Defoe is the office manager of Manchester’s Old Trafford Hotel. The hotel operates a periodicinventory system with respect to office supplies. At the year-end, the hotel accountant asked Suzy tooversee a year-end stock-take of supplies, in order that the cost of supplies used during the year could bedetermined. The year-end stock-take revealed that £2,000 of office supplies were held on 31 December20X1. Suzy then consulted the supplies inventory account which had last been updated 12 monthspreviously (i.e. following the previous year-end’s stock-take) and noted a debit balance of £2,800.Throughout the year she debited the ‘supplies purchases’ account whenever purchasing supplies. Shenotes that prior to making any adjusting entries, this account had a year-end debit balance of £14,000.
Calculation of the cost of supplies used in the year can be determined by solving for ? in the schedulebelow.
£Opening balance 2,800add Supplies purchased 14,000
Supplies made available 16,800less Supplies used ?
Closing balance 2,000
As we have determined that the cost of supplies made available is £16,800, and we know that at the endof the year the stock of supplies available cost £2,000, we can conclude that £14,800 of supplies musthave been used during the year.

Financial Management for Hospitality Decision Makers
Hosp
italit
y, L
eisu
re &
Tou
rism
Ser
ies
Case 4.1Financial Decision Making in Action –
The F&B Manager’s choice of inventory control procedures
Rather than depending on a periodic stock-take to determine what amount of stock is held,a perpetual inventory system can be operated. A perpetual inventory accounting systeminvolves debiting the inventory account every time inventory is purchased and crediting itevery time a sale or issue of stock is made. Deciding between a periodic and perpetualinventory approach can be a significant issue for an F&B manager due to the many low-cost food items that can be held.
Perpetual accounting systems are generally more expensive to operate due to thenumber of individual inventory records that have to be maintained. Despite this, an F&Bmanager would consider adopting a perpetual inventory accounting approach for particularfood and drink items if one or all of the following issues is believed to be significant:
1. Significant stock shrinkage is occurring due to theft.2 A significant loss of customer goodwill would result if certain menu items were to
become unavailable.3 Observing whether the stock item in question needs to be reordered is awkward and
time consuming.
Adjusting entry type 6: Bad and doubtful debtsAn initial word of warning is warranted here. Without wanting to sound alarmist,accounting for bad debts gives rise to what is probably the most complicated set ofaccounting entries described in this book. Proceed at a gentle pace through thissection!
At the end of the accounting period, an adjusting entry needs to be made to reflectthe fact that some of the balance in ‘accounts receivable’ may prove to beuncollectible. If some of the accounts receivable balance does prove to beuncollectible, the revenue account will be overstated as it will include ‘bad sale’entries, i.e. sales for which we will obtain no receipt of funds.
The following three steps outline a widely adopted approach to accounting forbad and doubtful debts.
Step 1: The provision • • •Periodically (say, every month-end during the accounting year) update records toreflect and provide for the problem of potentially non-collectible accounts. If everymonth we make $100,000 of credit sales and we believe on average 2% will prove tobe uncollectible, having already debited ‘accounts receivable’ $100,000 and credited‘revenue’ $100,000, we can make the following month-end ‘adjusting entry’.
Bad debts expense Allowance for doubtful accounts
2,000 2,000
52

Adjusting and closing entries
Hosp
italit
y, L
eisu
re &
Tou
rism
Ser
ies
The ‘bad debts expense’ account can be described as a ‘contra’ account, as it flowsthrough to the profit and loss statement where it will off-set the revenue account’scredit balance. The ‘allowance for doubtful accounts’ account can also be describedas a contra account as its credit balance will be recorded in the balance sheet in amanner that off-sets the account receivables’ debit balance.
Step 2: An account turns bad • • •Imagine that half-way through the accounting year one of our clients, Untrustwor-thy Ltd, went bankrupt while owing us $3,500. It is determined that we are unlikelyto collect any of the amount outstanding. The ‘step 1’ month-end entry is designedto provide for this type of eventuality. Now the eventuality has been realized andwe need to update the books as follows:
(a) Remove the $3,500 from ‘accounts receivable’ (if we don’t do this, the accountwill contain a growing amount of entries for amounts that will never becollected).
(b) Remove the $3,500 from ‘allowance for doubtful accounts’, as, following removalof the amount from ‘accounts receivable’ we no longer have a need to allow forit, i.e. no need for an off-setting contra entry.
Allowance for doubtful accounts Accounts receivable
3,500 3,500
Step 3: Year-end adjusting entry • • •Following an appraisal of the $150,000 year-end accounts receivable balance, it isestimated that $3,200 may well prove to be uncollectible. An investigation of thebooks reveals that the ‘allowance for doubtful accounts’ has a balance of $3,000.Therefore, prior to making a year-end adjusting entry, ‘net’ accounts receivable isrecorded at $147,000 ($150,000 – $3,000). As we expect to be able to collect $146,800($150,000 – $3,200), net accounts receivable is overstated by $200 and we need tomake a $200 adjusting entry.
Bad debts expense Allowance for doubtful accounts
3,000
200 200
The debit and credit entry made here is the same as the ‘step 1’ entry. The need forthe year-end adjusting entry has arisen because the ‘step 1’ entries during the yearhad not been sufficient to create the requisite year-end balance on the ‘allowance fordoubtful accounts’. If at the year-end it is found that there is an over-provision in‘allowance for doubtful accounts’, we would need to reverse the above entry bycrediting ‘bad debts expense’ and debiting ‘allowance for doubtful accounts’.
53
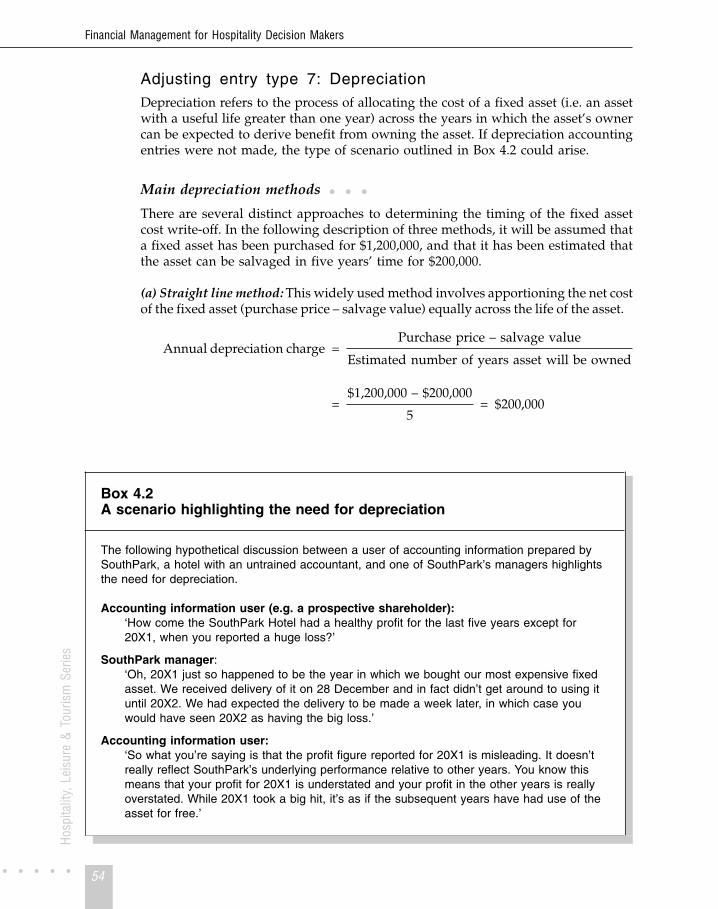
Financial Management for Hospitality Decision Makers
Hosp
italit
y, L
eisu
re &
Tou
rism
Ser
ies
Adjusting entry type 7: DepreciationDepreciation refers to the process of allocating the cost of a fixed asset (i.e. an assetwith a useful life greater than one year) across the years in which the asset’s ownercan be expected to derive benefit from owning the asset. If depreciation accountingentries were not made, the type of scenario outlined in Box 4.2 could arise.
Main depreciation methods • • •There are several distinct approaches to determining the timing of the fixed assetcost write-off. In the following description of three methods, it will be assumed thata fixed asset has been purchased for $1,200,000, and that it has been estimated thatthe asset can be salvaged in five years’ time for $200,000.
(a) Straight line method: This widely used method involves apportioning the net costof the fixed asset (purchase price – salvage value) equally across the life of the asset.
Annual depreciation charge =Purchase price – salvage value
Estimated number of years asset will be owned
=$1,200,000 – $200,000
5= $200,000
54
Box 4.2A scenario highlighting the need for depreciation
The following hypothetical discussion between a user of accounting information prepared bySouthPark, a hotel with an untrained accountant, and one of SouthPark’s managers highlightsthe need for depreciation.
Accounting information user (e.g. a prospective shareholder):‘How come the SouthPark Hotel had a healthy profit for the last five years except for20X1, when you reported a huge loss?’
SouthPark manager:‘Oh, 20X1 just so happened to be the year in which we bought our most expensive fixedasset. We received delivery of it on 28 December and in fact didn’t get around to using ituntil 20X2. We had expected the delivery to be made a week later, in which case youwould have seen 20X2 as having the big loss.’
Accounting information user:‘So what you’re saying is that the profit figure reported for 20X1 is misleading. It doesn’treally reflect SouthPark’s underlying performance relative to other years. You know thismeans that your profit for 20X1 is understated and your profit in the other years is reallyoverstated. While 20X1 took a big hit, it’s as if the subsequent years have had use of theasset for free.’

Adjusting and closing entries
Hosp
italit
y, L
eisu
re &
Tou
rism
Ser
ies
(b) Reducing balance method: Under this method, each year a fixed percentage of theasset’s net book value (the net book value is the cost of the asset minus theaccumulated depreciation charged on the asset since its purchase) is expensed asdepreciation. This will result in a reducing depreciation charge as the net book value(NBV) will be reducing. In the following example, suppose 40% has been identifiedas the annual percentage rate.
$
Opening net book value – year 1 1,200,0001st year dep’n charge (NBV × 40%) 480,000Opening net book value – year 2 720,0002nd year dep’n charge (NBV × 40%) 288,000Opening net book value – year 3 432,0003rd year dep’n charge (NBV × 40%) 172,800
(c) Usage based method: This is not a widely used method. To demonstrate how itcan be applied, imagine that the asset purchased is a small airplane and that it hasbeen estimated that the plane will fly 1 million kilometres in its life with thecompany.
If 200,000 kilometres were flown in 20X1, 20X1 depreciation charge =
(200,000 ÷ 1,000,000) × $1,000,000 = $200,000
If 300,000 kilometres were flown in 20X2, 20X2 depreciation charge =
(300,000 ÷ 1,000,000) × $1,000,000 = $300,000
55
Recording depreciation • • •Similar to the contra account set up for doubtful accounts, when depreciating, we setup an ‘accumulated depreciation’ account, which acts as a contra account off-settingthe balance in the fixed asset account.
For the 20X2 depreciation charge of $300,000 in the airplane example above, the20X2 year-end depreciation entry would be as follows:
Depreciation expense Accumulated depreciation
200,000
300,000300,000
As the depreciation expense account and the accumulated depreciation accounthave somewhat similar names it is vital that their very different roles are clearlyunderstood. The depreciation expense account is closed off to the P&L account at theyear-end. The fact that it is closed off in this manner should be evident from theword ‘expense’ appearing in its title.
The accumulated depreciation account is reported in the balance sheet as a contraaccount that off-sets the fixed asset account. The fact that it is an account that

Financial Management for Hospitality Decision Makers
Hosp
italit
y, L
eisu
re &
Tou
rism
Ser
ies
accumulates across accounting periods suggests that it is a balance sheet account.Note how, by the end of 20X2, the accumulated depreciation account has increasedfrom the $200,000 depreciation expensed in 20X1 to $500,000, as a result of the$300,000 expensed in 20X2. The fixed asset section of the company’s balance sheet atthe end of 20X2 would appear in a format such as that presented below:
$ $Fixed assets at cost 1,200,000Less Accumulated depreciation 500,000Net Book Value of Fixed Asset 700,000
Summary
Through the use of worked examples, this chapter has outlined the nature of closing andadjusting entries. At the end of each financial year, closing entries are made to all accountsrelating to a period of time, i.e. revenue, expense and dividend accounts. If these accounts arenot closed at the end of a year, they would not have a zero balance at the start of the newfinancial year. Adjusting entries need to be made in advance of preparing the year-endstatements in order to update some accounts. For example, as depreciation is a function oftime, periodically an adjusting entry has to be made to update all depreciation accounts.
Having read the chapter you should now know:
� That all revenue, expense and dividend accounts have to be closed at the end of thefinancial year
� That costs paid for but not yet incurred represent prepaid expenses and are treated asassets
� That expenses incurred but not yet paid for represent accruals and are treated asliabilities
� That if a customer pays for a service in advance of receiving the service, the receipt isreferred to as unearned revenue and is treated as a liability
� The difference between perpetual and periodic inventory accounting procedures� How to account for bad debts� How to account for depreciation.
References
Carnegie, G., Jones, S., Norris, G., Wigg, R. and Williams, B. (1999) Accounting:Financial and Organisational Decision Making, Irwin/McGraw-Hill, New York,Chapter 7.
Coltman, M. M. and Jagels, M. G. (2001) Hospitality Management Accounting, 7thedition, John Wiley, Chichester, Chapter 1.
Kotas, R. and Conlan, M. (1997) Hospitality Accounting, 5th edition, InternationalThomson Publishing, London, Chapters 11 and 12.
Owen, G. (1994) Accounting for Hospitality, Tourism & Leisure, 1st edition, PitmanPublishing, Chapter 4.
Schmidgall, R. F., (1997) Hospitality Industry Managerial Accounting, 4th edition,Educational Institute – American Hotel & Motel Association, East Lansing, MI,Chapter 1.
56

Adjusting and closing entries
Hosp
italit
y, L
eisu
re &
Tou
rism
Ser
ies
Problems
✓ indicates that a solution appears at the back of the text
✓ 4.1 Describe the difference between adjusting entries and closing entries.
✓ 4.2 Given the following information for Dunedin’s CityCentre Hotel, post relevantadjusting entries to CityCentre’s general ledger. Assume 30 June is the year-end.
(a) The telephone account of $500 for June is unpaid and unrecorded.(b) Rent of $3,600 for the six-month period ending 31 August is due to be paid in
arrears in October.(c) It was estimated at the time of purchasing a car two years ago for $6,000 that the
car would be salvaged five years later for $1,000. The company uses straight linedepreciation for all fixed assets. This year’s depreciation entry for the car is stillto be made.
(d) The next fortnightly pay date for the company’s employees is 7 July. Thefortnightly payroll is $140,000.
(e) On 2 March received $1,600 cash from a client. This was an advance payment forservices to be rendered. At the time of receipt, $1,600 was recorded as a credit tounearned revenue. On 30 June 75% of this service had been provided.
(f) On 1 May received six month’s rent revenue in advance totalling $600. At the timeof the receipt, this was recorded as a credit to rental revenue.
✓ 4.3 On 30 November, account balances relating to the accounts receivable managementfunction of Minnesota’s CitySlickers Hotel were as follows:
Accounts receivable $141,500 Debit balanceAllowance for doubtful accounts $2,400 Credit balanceRevenue $1,320,000 Credit balanceBad debts expense $12,400 Debit balance
The following transactions occurred in December:
1 Cash collected from credit sale customers was $92,000.2 Credit sales were $101,000.
On a monthly basis, the manager of accounts receivable has made an allowance of1.25% of sales to cover the contingency of trade debts turning bad. At the hotel’s year-end, on 31 December, a review of accounts receivable has revealed the following:
Year-end estimate of doubtful accounts
Age of account Accountreceivable amount
% Estimated asuncollectible
0–30 days $84,000 0.7531–60 days 44,000 1.2561–180 days 18,000 5Over 180 days 4,500 100
$150,500
57

Financial Management for Hospitality Decision Makers
Hosp
italit
y, L
eisu
re &
Tou
rism
Ser
ies
The company accountant has decided that all accounts with an age of 180 days ormore should be written off from the accounts receivable ledger. In addition, thedoubtful accounts balance should be revised to reflect the remaining estimateddoubtful accounts following the year-end review of the accounts receivableledger.
Required • • •(a) Record December’s credit sales and cash collected transactions in appropriately
titled ‘T-accounts’.(b) Record all necessary year-end adjusting entries in appropriately titled
‘T-accounts’.
4.4 Marlow’s WatersEdge Hotel operates a periodic inventory system with respect to itscleaning supplies. A year-end stock-take has identified a balance of £4,200 cleaningsupplies held on 31 December 20X1. The cleaning supplies stock account, which hasnot been adjusted since the previous year-end stock-take, reflects a debit balance of£3,400. Throughout the year, all cleaning supplies purchased have been debited tothe ‘cleaning supplies purchases’ account which has a closing debit balance of£36,000. In addition, any returns to suppliers have been credited to a ‘cleaningsupplies returns’ account which has a year-end closing balance of £1,020.
Required • • •Using appropriately titled ‘T-accounts’, make all required adjusting and closingentries.
4.5 The accounting manager at Antwerp’s TranquilStay Hotel has prepared the followingprofit and loss statement that pertains to the most recent accounting year.
TranquilStay HotelProfit and loss statement
for the year ended 30 June 20X1
E E
Sales revenue 420,000less: Cost of sales 80,000
Gross profit 340,000add: Interest revenue 11,000
351,000
less: ExpensesSalaries and wages expense 145,000Depreciation expense 82,000Car park rental expense 3,000Insurance expense 18,000Sundry expense 14,000
262,000
89,000
58

Adjusting and closing entries
Hosp
italit
y, L
eisu
re &
Tou
rism
Ser
ies
The accounting manager is uncertain how to handle year-end adjusting entries andhas sought your advice. Following a review of the business, you determine thefollowing:
1. A A2,500 advance payment received in connection with a conference to be held inlate July has been included in the sales revenue figure.
2 Employees have not been paid A4,000 in wages and salaries earned in the last 4days of June.
3 Depreciation of A10,000 on a new car purchased this year has not beenrecorded.
4 The hotel rents a small adjoining property which it uses for patrons’ car parkingwhenever the hotel’s underground car park is full. The last rental fee paid wasA900. This payment was made on 1 May and covered a three-month period. Theaccount manager recorded this as prepaid rent and no entry has been made toadjust this account at the year-end.
5 The hotel holds an investment that earns A1,000 interest per month. June’sinterest, which will be received in July has not been recorded in the accounts.
6 Annual property insurance of A24,000 is paid semi-annually in advance. The lastA12,000 payment, which was made on 1 April 20X1 was debited to prepaidinsurance. No adjusting entry to the prepaid insurance account has been made.
Required • • •(a) Prepare the necessary adjusting entries for the TranquilStay Hotel.(b) Following completion of the adjusting entries, prepare TranquilStay’s revised
profit and loss statement for the year-ending 30 June 20X1.
4.6 Given the following information for Ottawa’s Capital Hotel, prepare relevant adjustingentries. Assume that 30 June is the year-end.
(a) On 1 June the hotel received $4,000 in advance for services to be rendered. Thistransaction was recorded on 1 June by debiting bank and crediting unearnedservice revenue. It was determined that by 30 June, 25% of the service paid forhad been provided.
(b) On 1 May six months’ insurance premium was purchased for $1,800. When thepayment was made, the hotel debited prepaid insurance and credited bank.
(c) The hotel has an investment that is earning a return of $2,400 interest per annum.The last interest payment was received on 30 April. The accounting records needto be adjusted to reflect the last two months of interest accrued.
(d) In the current financial year, the hotel’s supplies account had an opening balanceof $600. $7,000 of supplies have been purchased during the year and debited tothe supplies account. A year-end stock-take has revealed $400 of supplies instock. During the year no accounting entries reflective of supplies usage havebeen made.
4.7 Given the following year-end account balances for Boston’s Johnson Hotel,prepare:
(a) A profit and loss statement for the period ended 30/6/20X1(b) A balance sheet as at 30/6/20X1.
59

Financial Management for Hospitality Decision Makers
Hosp
italit
y, L
eisu
re &
Tou
rism
Ser
ies
Johnson HotelAccount balancesas at 30 June 20X1
Debit Credit$ $
Cash at bank 2,200Dividends paid 2,000Accounts receivable 1,500Closing inventory 400Depreciation expense 250Plant and machinery 11,000Accumulated depreciation 1,020Sales revenue 26,500Cost of sales 16,000General operating expenses 4,640Accrued wages 400Accounts payable 1,900Unearned revenue 200Share capital 4,800Retained profits 3,170
37,990 37,990
60

P A R T• • • • 3
FinancialInformation and
HospitalityManagement

This Page Intentionally Left Blank

C H A P T E R• • • • 5
Financialstatement analysis
L e a r n i n g o b j e c t i v e sAfter studying this chapter, you should havedeveloped an appreciation of:
1 How insights can be gained from dissecting ROI(return on investment) into its two underlyingelements: profit margin and asset turnover
2 How a systematic analysis of a hotel’s profitperformance can be conducted through the use ofratios
3 How an analysis of a hotel’s short-term andlong-term financial stability can be achievedthrough ratio analysis
4 How operational ratios can be used as an aid tomonitoring the operating performance of hotels
5 How an aged schedule of accounts receivable canassist the management of receivables
6 How it is important that an analyst develops theability to tailor ratios with due regard to the natureof the hotel under investigation.

Financial Management for Hospitality Decision Makers
Hosp
italit
y, L
eisu
re &
Tou
rism
Ser
ies
IntroductionThis chapter moves us closer to financial management issues as it focuses ontechniques that can be used to analyse the financial performance and stability oforganizations. Much of the analysis can be conducted through the use of ratios, e.g.return on investment (ROI tells us the ratio of return to investment), and, as aconsequence, we frequently refer to ‘ratio analysis’ in a manner synonymous withfinancial statement analysis.
The results of a ratio analysis convey limited information unless they are put intosome context, however. Ratio analyses are most usually conducted in the context ofa comparison to one or more of the following four benchmarks:
� The hotel’s ratios from prior years (a trend analysis);� Ratios that have been set as goals (i.e. ratios underlying the hotel’s budget);� Ratios achieved by other hotels (or divisions) in the same company;� Industry average ratios compiled by companies such as Dun and Bradstreet and the
large accounting firms (this type of benchmarking is sometimes referred to as across-sectional analysis).
In this chapter’s description of a systematic approach to conducting a financialanalysis of the year-end accounts, two distinct perspectives will be taken:
� First, we will see how the profit performance of a company can be appraised.� Second, we will see how to appraise the financial stability of a company.
We will conduct these analyses by drawing on the year-end financial statementsof Melbourne’s Celestial Hotel Ltd. These statements are presented in Exhibits 5.1and 5.2.
64
Exhibit 5.1
Celestial Hotel LtdProfit and loss statement
for the year ending 31/12/20X1
$000 $000Revenue (60% of sales on credit) 100less Cost of Sales 40Gross Profit 60less Expenses
Selling 15General Administration 5
20
Earnings (profit) before interest and tax (EBIT) 40less Interest 10
Taxable profit 30less Taxation 15
Net Profit after Tax 15
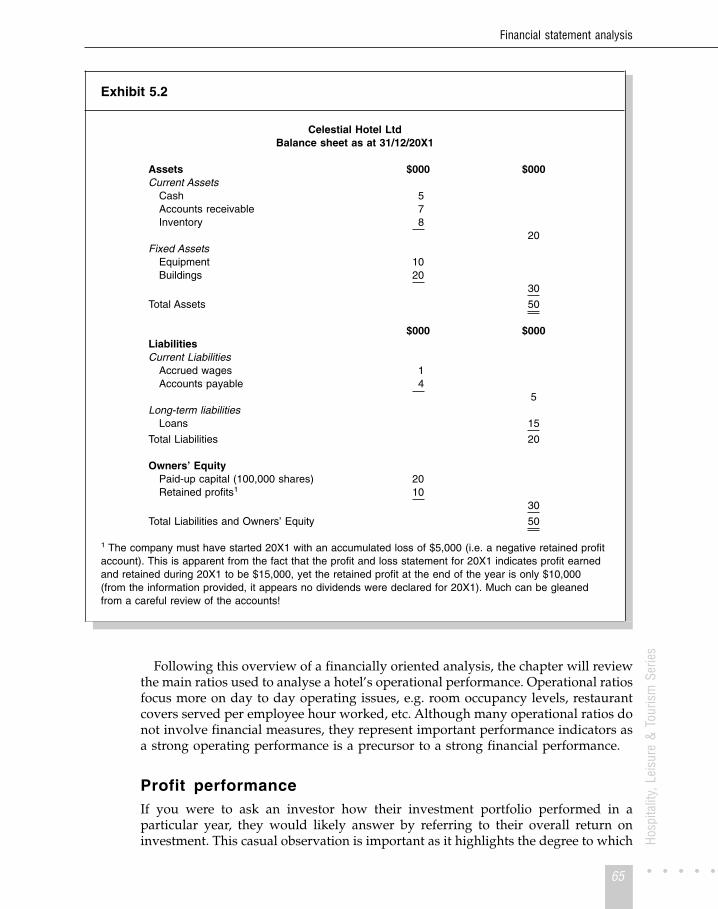
Financial statement analysis
Hosp
italit
y, L
eisu
re &
Tou
rism
Ser
ies
Following this overview of a financially oriented analysis, the chapter will reviewthe main ratios used to analyse a hotel’s operational performance. Operational ratiosfocus more on day to day operating issues, e.g. room occupancy levels, restaurantcovers served per employee hour worked, etc. Although many operational ratios donot involve financial measures, they represent important performance indicators asa strong operating performance is a precursor to a strong financial performance.
Profit performanceIf you were to ask an investor how their investment portfolio performed in aparticular year, they would likely answer by referring to their overall return oninvestment. This casual observation is important as it highlights the degree to which
65
Exhibit 5.2
Celestial Hotel LtdBalance sheet as at 31/12/20X1
Assets $000 $000Current Assets
Cash 5Accounts receivable 7Inventory 8
20Fixed Assets
Equipment 10Buildings 20
30
Total Assets 50
$000 $000LiabilitiesCurrent Liabilities
Accrued wages 1Accounts payable 4
5Long-term liabilities
Loans 15
Total Liabilities 20
Owners’ EquityPaid-up capital (100,000 shares) 20Retained profits1 10
30
Total Liabilities and Owners’ Equity 50
1 The company must have started 20X1 with an accumulated loss of $5,000 (i.e. a negative retained profitaccount). This is apparent from the fact that the profit and loss statement for 20X1 indicates profit earnedand retained during 20X1 to be $15,000, yet the retained profit at the end of the year is only $10,000(from the information provided, it appears no dividends were declared for 20X1). Much can be gleanedfrom a careful review of the accounts!

Financial Management for Hospitality Decision Makers
Hosp
italit
y, L
eisu
re &
Tou
rism
Ser
ies
return on investment (ROI) represents a fundamental indicator of performance. Iflimited to one ratio in an appraisal of a company’s performance, a financial analystwould most likely use ROI.
In the analysis of profit performance that follows, we will take a systematicapproach by first computing ROI and then dissecting it into its underlyingcomponents. The perspective of appraising a hotel management’s performance ingenerating a return (profit) from the assets available will be taken. This signifies thatEBIT (earnings before interest and tax) is the appropriate profit level to focus on.This is because EBIT captures the operating performance of a hotel, as interestexpense (the first item appearing after EBIT in the P&L statement) relates to afinancing decision which is frequently outside the influence of the hotel generalmanager. Accordingly, we will calculate ROI in the following way:
Return on investment (ROI) = EBIT ÷ Total assets
Celestial’s 20X1 ROI = 40 ÷ 50 = 0.8 (or 80%)
This 80% ROI can be broken into two elements (a profit margin and a turnovercomponent) as illustrated in Exhibit 5.3.
The equation in Exhibit 5.3 can be verified very simply by cancelling ‘revenue’ inthe left-hand circle (or profit margin component) with ‘revenue’ in the right-handcircle (or asset turnover component) to leave us with the basic ROI formula (EBIT ÷Total assets).
This dissection of ROI into the two underlying ratios is widely referred to as the‘Dupont formula’ (the formula was first observed in use in the Dupont company inthe USA). The Dupont formula is highly significant as it provides the basis for asystematic analysis of ROI under two headings:
(a) profit margin(b) asset turnover.
Profit marginFollowing our first step in the ratio analysis, we found Celestial’s ROI to be 80%.While this may appear to represent a healthy return, imagine it is down from lastyear’s figure of 85%. Management would want to know what lies behind this
66
Exhibit 5.3Dissecting ROI into profit margin and asset turnover
ROI =EBIT
Revenue×
Revenue
Total assets
Profitmargin
Assetturnover

Financial statement analysis
Hosp
italit
y, L
eisu
re &
Tou
rism
Ser
ies
67
decline. By using the Dupont formula we can determine whether the decline stemsfrom a decrease in the company’s profit margin or its asset turnover (or acombination of both). If the profit margin is down from last year, we can worksystematically through the profit & loss statement, picking up all profit figuresprovided and comparing them to revenue. In the Celestial example, the first profitfigure in the P&L statement is gross profit. Paralleling the approach taken tocompute profit margin in Exhibit 5.3, we compute gross profit margin (GPM) asfollows:
Gross profit margin (GPM) = Gross profit ÷ Revenue
Celestial’s 20X1 GPM = 60 ÷ 100 = 0.6 (or 60%)
If this 60% GPM is similar to last year’s GPM, we would be able to conclude thatthe lower overall margin has not resulted from a change in the ratio of selling priceto cost of sales. It would be apparent that the decline in the ratio of EBIT to Revenuemust have resulted from a relative increase in selling and general administrationcosts, as these represent the two expense categories appearing after gross profit andbefore EBIT in the P&L statement. By taking this approach of progressively movingdown the P&L statement, comparing every level of reported profit to Revenue, weare able to isolate the category of expense that has caused a change in the overallprofit margin. If we had originally used net profit margin (net profit after tax ÷revenue) in the ROI computed above, we could have computed more profit marginsin the course of systematically progressing through the P&L statement. Publishedaccounts of large companies generally provide data sufficient to allow thecalculation of several profit margins.
Asset turnoverReturning to the Dupont formula in Exhibit 5.3, now imagine that we have notedthat a decline in the total asset turnover ratio has occurred and that this decline liesbehind the lower ROI. This observation would lead the analyst to look into thoseratios that feed in to the total asset turnover ratio.
Similar to the approach of working systematically through the P&L statementwhen exploring for factors resulting in a changed profit margin, we can workthrough the balance sheet looking for that group of assets that lie behind a changedasset turnover ratio.
Whenever the term ‘turnover’ is used, it signifies we are comparing an asset torevenue (or, in the case of inventory, cost of sales). Consistent with the total assetturnover ratio computed above as part of the Dupont formula, for each turnoverratio we divide revenue (or, in the case of inventory, cost of sales) by the particularasset grouping under investigation.
Each ‘turnover’ ratio tells us how ‘hard’ the particular asset has ‘worked’ togenerate revenue. For this reason, the turnover ratios are frequently referred to as‘efficiency’ ratios. Widely computed ‘turnover’ ratios include:
� Accounts receivable turnover� Inventory turnover� Fixed asset turnover.

Financial Management for Hospitality Decision Makers
Hosp
italit
y, L
eisu
re &
Tou
rism
Ser
ies
Accounts receivable turnoverAccounts receivable turnover = Credit sales ÷ Accounts receivable
Celestial’s 20X1 A.R. turnover = (100 × 0.6) ÷ 7 = 8.57
Many managers find it difficult to conceptualize the meaning of the 8.57 computedabove. For this reason the information is commonly converted into ‘number of days’by dividing the number of days in a year by the turnover.
Average number of days to collect accounts receivable =365
AR turnover
Celestial’s average number of daysto collect accounts receivable =
365
8.57= 42.6 days
If the accounts receivable turnover ratio is decreasing, the average number of daysto collect accounts receivable will be increasing.
Inventory turnoverCalculation of inventory turnover and also the ‘number of days inventory held’parallel the approach just taken for accounts receivable. There is one key difference,however. Unlike all the other ‘turnover’ ratios, we divide inventory into cost of salesand not revenue. The reason for this difference is that inventory is recorded at costprice and not selling price. If we were to compare inventory to revenue and duringthe year selling prices doubled, we would see the inventory turnover ratiocomputed also double. The doubling of the ratio would be the result of a changedselling price and not a changed stocking policy, however. The potential for thismisinterpretation is avoided if we compute inventory turnover using a consistentvaluation basis, i.e. cost for the denominator (inventory) and cost for the numerator(cost of sales).
Inventory turnover = Cost of sales ÷ Inventory
Celestial’s 20X1 inventory turnover = 40 ÷ 8 = 5
Similar to accounts receivable turnover, inventory turnover can be converted into ameasure of the average number of days that inventory is held by dividing 365 by theinventory turnover.
Celestial’s average number of days inventory held =365
5= 73 days
When analysing a hotel’s inventory turnover performance, it is desirable thatbeverage inventory be treated separately from the inventory of food supplies. Thisis because there might be differing stocking policies in the two areas. Drawing thisdistinction is particularly important where different personnel exercise stock makingdecisions in the two areas. Failure to distinguish between the two types of inventorymight mask the existence of a low turnover in one area due if there is a high turnoverin the other area.
68

Financial statement analysis
Hosp
italit
y, L
eisu
re &
Tou
rism
Ser
ies
Fixed asset turnover
Fixed asset turnover = Revenue ÷ Fixed assets
Celestial’s 20X1 fixed asset turnover = 100 ÷ 30 = 3.33 days
Fixed asset account balances do not tend to be as volatile as accounts receivable andinventory account balances. Nevertheless, due to the large relative size of fixedassets in hotels, a small percentage movement can have a significant impact on totalasset turnover. The large investment in fixed assets can warrant the calculation of aturnover figure for every fixed asset sub-category identified, if such furtherinformation is available, i.e. in the Celestial example we could have computed aturnover figure for equipment as well as buildings.
General comments on turnover ratiosExcept for cash, we have now computed the turnover ratio for each asset inCelestial’s balance sheet. If we had noted a decline in total asset turnover, and hadsubsequently discovered that none of the turnovers computed above had declined,then there must have been a decrease in the ratio of revenue to cash. Consistent withthe other ratios, we could compute a ‘cash turnover ratio’ by dividing ‘revenue’ by‘cash’. Due to the relatively small nature of the cash account, however, this ratio isseldom calculated. If we found that the problem lay in a declining cash turnoverratio, we would know that relative to revenue, the business is now holding morecash. We would then need to turn to question whether this development isdesirable.
While it might appear from Exhibit 5.3 that we would like to see increasingturnover ratios (a higher asset turnover will increase ROI), the downside implicationof turnover ratios becoming too high should also be appreciated. If inventoryturnover becomes very high, we might experience stock-outs, which could result inlost sales and loss of customer goodwill. If the accounts receivable turnoverincreases, we are on average extending less credit to our customers. If other hotelsare extending longer periods of credit, this could result in the loss of some sales.
In the worked example presented above, we took year-end balances of the assetaccounts when computing the turnover ratios. A preferred approach, however,would be to take the average balance of the asset account throughout the year. Itcould be that the year-end inventory balance is at an all-time temporary low and thatCelestial normally holds twice this amount of inventory. If this is the case, theturnover computed will be a poor reflection of reality, i.e. the inventory holdingperiod computed will be half the year’s average holding time for inventory. If theasset in question is subject to high seasonal volatility, the average asset balancethroughout the year should be sought. This could be done by calculating the averageof the 12 month-end balances for the year. While using an average asset balanceprovides a better picture of the asset’s average turnover over the whole year, a newinventory manager who has been in place for only three months would be justifiedin arguing that her inventory turnover performance should be assessed byappraising average inventory balances since she took up her position, and notinventory balances recorded in advance of her job commencement. The samerationale applies to a recently recruited credit manager.
69

Financial Management for Hospitality Decision Makers
Hosp
italit
y, L
eisu
re &
Tou
rism
Ser
ies
The problem of defining ROIIt can be confusing trying to ‘tie down’ ROI. It is a generic term that is tailored tomany different situations, e.g. it could be used in the sense of the interest rate youearn on a bank account, or the net after-tax return made on a portfolio of shares. Itsexact calculation depends on the perspective being taken in an analysis. Thefollowing is an inexhaustive list of types of ROI that can be used to assess acompany’s performance:
� Return on assets employed� Return on assets available� Return on long-term funds� Return on equity
‘Assets employed’, ‘assets available’, ‘long-term funds’ and ‘equity’ are all types ofinvestment. If we wish to judge the performance of a manager who has been placedin charge of a group of assets that include some assets which, for some reason, hecannot currently employ (maybe rooms undergoing refurbishment), we might liketo compare EBIT to assets employed and not assets available. If we take ashareholder’s perspective, we might like to compare net profit after tax toshareholders’ equity. It can thus be seen that the definition of return and thedefinition of investment is dependent on the context in which the analysis isbeing made.
Two share market-related performance measuresA widely used ratio when considering the total profit performance of a companyfrom the shareholder’s perspective is earnings per share (EPS). This ratio, whichindicates how much company profit has been earned by each individual share, iscalculated by dividing net profit by the number of ordinary shares issued by acompany:
Earning per share (EPS) = Net profit ÷ Total shares outstanding
A danger with EPS arises if you attempt to use it as part of a cross-companycomparison. A 20X1 EPS of $4 in ABC Company does not signify a betterperformance than a 20X1 EPS of $2 for XYZ Company. Imagine that during 20X1,shares in ABC traded for around $50 while shares in XYZ traded for $10. Theearnings when stated as a return on the owner’s investment (this is sometimes calledthe earnings yield and is calculated by dividing EPS by the share price) is 8% forABC (4 ÷ 50 × 100), and 20% for XYZ (2 ÷ 10 × 100). EPS can be used, however, aspart of a trend analysis of a single company (assuming the number of shares issuedremains constant), and is particularly useful when combined with share price to giveus the price/earnings ratio (PE ratio). The PE ratio is computed as follows:
Price/Earnings (PE) ratio = Market price per share ÷ Earnings per share
Unlike EPS, the PE ratio can be used as part of a cross-company analysis. A high PEfor a company relative to its competitors in the same industry can be caused byeither of the following factors:
70

Financial statement analysis
Hosp
italit
y, L
eisu
re &
Tou
rism
Ser
ies
1 The investing community expects an increase in the company’s EPS in the futureand this has resulted in increased demand for the share which, in turn, hasincreased the share price (past earnings are only of interest to the investor to theextent that they provide an indication of expected future earnings).
2 The investing community perceives relatively low risk in the company. Asinvestors are averse to risk, increasing levels of risk will result in decreasingdemand for the share which, in turn, results in a decreased share price.
Financial stabilityAnalysis of financial stability (sometimes referred to as solvency, i.e. the ability torepay liabilities as they fall due) can be broken into short-term and long-termperspectives.
Short-termAppraisal of a company’s short-term financial stability is sometimes referred to as a‘liquidity analysis’. Analysis of liquidity concerns assets that in the normal course ofbusiness will be converted to cash, sold or consumed within a year (current assets)and also liabilities that are due for payment within a year (current liabilities). Oneindicator of liquidity is ‘working capital’ (current assets – current liabilities),however this indicator does not provide a sound basis for comparison acrosscompanies of varying sizes. More widely advocated measures of liquidity are thecurrent asset ratio and the quick asset ratio (sometimes called the ‘acid test ratio’).The current asset ratio is calculated as follows:
Current asset ratio = Current assets ÷ Current liabilities
Celestial’s current asset ratio as at 31/12/X1 = 20 ÷ 5 = 4
This signifies that Celestial’s ‘close to cash’ assets cover its liabilities that will fall duefor payment in the next 12 months by four times. This suggests a highly liquidsituation.
If inventory is held for some time in the business prior to conversion to cash, acase can be made for its exclusion from current assets. This approach is taken in theacid test ratio, a liquidity measure which also excludes prepaid expenses fromcurrent assets. Prepaid expenses are excluded because in the normal course ofbusiness they will not be converted to cash. The acid test ratio is calculated asfollows:
Acid test ratio =Current assets – Inventory – Prepaids
Current liabilities
Celestial’s acid test ratio as at 31/12/X1 = 12 ÷ 5 = 2.4
In the hotel sector, due to the relatively ‘liquid’ nature of most inventory, it is usualto base an appraisal of short-term liquidity on the current ratio rather than the acidtest ratio. If a hotel had a large inventory of slow-moving wine, however, it wouldbe appropriate to calculate a tailored liquidity ratio by deducting the wine inventory
71

Financial Management for Hospitality Decision Makers
Hosp
italit
y, L
eisu
re &
Tou
rism
Ser
ies
from current assets. Tailoring ratios in this manner can be justified if they result ina more accurate insight into the particular aspect of the company that is underinvestigation.
While we would certainly be concerned to see the current ratio or the acid testratio fall below ‘1’, it is difficult to provide an optimal current or acid test ratio. Muchwill depend on hotel-specific factors. A lender to the hotel would like to see highliquidity ratios as this would indicate a high ability to pay short term debts. In fact,some lenders seek to protect themselves by requiring the borrower to maintainliquidity indicators, such as the current ratio, above a certain level. A loan provisioncan be drafted to this effect, and if the borrower’s current ratio falls below what isstipulated in the loan provision, the lender can require the borrower to immediatelyrepay the loan. If a business experiences liquidity problems, a variety of rectificationoptions can be considered. For instance:
� Some fixed assets could be sold, maybe under a sale and lease-back agreement(increase to cash, no effect on current liabilities).
� A long-term loan could be sought (increase to cash, no effect on currentliabilities).
� Further equity could be sought (increase to cash, no effect on current liabilities).
Caution needs to be exercised in liquidity management, however, as high liquidityratios do not signify astute management. High liquidity ratios signify sub-optimaluse of funds, as funds invested in short-term assets do not provide a high rate ofreturn to owners. If funds can be freed up from current assets, greater investmentcan be made in long-term assets which can be seen to represent the engine roomfrom which owners derive profits. Further discussion of working capital manage-ment issues is provided in Chapter 11.
Long termOver the long term we are concerned with a firm’s ability to pay all its debts, notmerely short-term debt.
The long-term indebtedness of the firm is generally referred to as financialleverage or gearing. Two of the most commonly cited financial leverage measuresare debt to assets and debt to equity. Debt to assets (sometimes called the ‘debt ratio’)is calculated as follows:
Debt to assets = Total debt ÷ Total assets
Celestial’s 31/12/X1 debt to assets ratio = 20 ÷ 50 = 0.4 (or 40%)
Debt to equity is calculated as follows:
Debt to equity = Total debt ÷ Total equity
Celestial’s 31/12/X1 debt to equity ratio = 20 ÷ 30 = 0.667 (or 66.7%)
Lenders like to see a low level of financial leverage (low level of debt) as thissignifies that there is a relatively low likelihood of insolvency resulting from an
72

Financial statement analysis
Hosp
italit
y, L
eisu
re &
Tou
rism
Ser
ies
inability to honour debt obligations. While owners would also be concerned by theinsolvency implications of high levels of debt, their returns can increase as a resultof increased levels of leverage. The way financial leverage can be used to increasereturns to owners is demonstrated in financial decision making case 5.1.
Case 5.1Financial Decision Making in Action –
The Financial Controller and financial leverage
Imagine Nottingham’s RobinHood hotel chain has £2 million of assets and a debt to assetsratio of 40% (£800,000 in debt and £1,200,000 of equity). It pays 10% annual interest onits debt, currently achieves an EBIT of 15% on assets employed, and pays company taxat the rate of 40%. The management of RobinHood is considering a £1 million expansionin capital which, consistent with existing assets, is projected to earn a 15% return. Themanagement is deliberating whether to fund the £1 million expansion through arranging afurther loan at 10% annual interest or to finance the expansion through raising more equitycapital. Management believes that issuance of debt will not result in insolvency problemsand is primarily focusing on its desire to maximize the hotel owners’ return. The impact onthe owners’ return resulting from the issuance of debt (financing option 1) versus theissuance of further equity capital (financing option 2) are detailed in the schedulepresented below.
Financing option 1(debt)
£
Financing option 2(equity)
£
Projected return on assets: 15% of £3 m 450,000 450,000Less interest on debt a 180,000 80,000
Profit before Tax 270,000 370,000Less 40% Tax 108,000 148,000
Profit after Tax 162,000 222,000
% Return on owners investmentb 13.5% 10.1%
a For financing option 1: 10% of £1,800,000; for financing option 2: 10% of£800,000.
b For financing option 1: £162,000 ÷ £1,200,000 × 100; for financing option 2: £222,000÷ £2,200,000 × 100.
From this example, it is apparent that a greater return on owners’ investment resultsfrom taking the debt financing option. This highlights how the hotel finance function canuse debt financing to ‘lever’ or ‘gear’ up returns to equity holders. As a result, the terms‘leverage’ and ‘gearing’ are used when talking of a company’s level of debt financing.
The Financial Controller must be careful not to raise too much debt, however, due torisk implications. High perceived risk will reduce the value of the hotel’s equity. Relativeto many other industries, the hotel sector has fairly high business risk due to relativelyvolatile sales and a relatively high proportion of fixed costs. As a result, hotel financialcontrollers tend to be averse to taking on high levels of financial leverage.
73

Financial Management for Hospitality Decision Makers
Hosp
italit
y, L
eisu
re &
Tou
rism
Ser
ies
Again, it is difficult to identify an optimal leverage ratio. However, these ratios doprovide a means for comparing a firm’s long-term liquidity position relative to thatof its competitors. In addition, a trend analysis could highlight an alarming trend ofincreasing levels of indebtedness.
A final ratio can be computed as a further indicator of a firm’s capacity to meet itslong-term debt obligations. While the above ratios might suggest an insignificantlevel of leverage for a company, the company may be experiencing problemsservicing its outstanding debt due to a low level of profitability. Such a situationwould be highlighted by using the following ratio:
Times interest earned = EBIT ÷ Annual interest payment
Celestial’s 31/12/X1 times interest earned ratio = 40 ÷ 10 = 4
The times interest earned ratio is sometimes referred to as a ‘coverage’ ratio, i.e. itindicates the extent to which interest charges are covered by the company’s level ofprofit. The above times interest earned ratio of 4 signifies that Celestial is currentlyexperiencing little problem servicing its debt.
74
Ratios using operational measuresPerformance ratios that have more of an operational focus than the financial ratiospresented above are grouped below according to whether they relate primarily torooms or restaurant activities.
Rooms-related performance measuresOccupancy level is a widely quoted performance indicator in the hotel industry. Ithas become such an established performance indicator that hotels competing in thesame geographical area frequently share information on each others’ occupancylevels.
Room (or bed) occupancy =Number of rooms (beds) let in hotel
Total rooms (beds) in hotel× 100
This activity level indicator can be a little misleading in those hotels that let out asignificant number of complimentary rooms. As a result, management’s under-standing of the exact nature of the occupancy level can be enhanced by modifyingthe room occupancy measure to provide ‘paid occupancy’ and also ‘complimentaryoccupancy’ activity indicators. These two indicators are nothing more thanadaptations of the room occupancy performance indicator. They again highlight theimportance of modifying ratios to fit the particular circumstance of the hotel underinvestigation.
Paid occupancy % =Number of rooms sold
Total rooms in hotel× 100
Complimentary occupancy % =Number of complimentary rooms let
Total rooms in hotel× 100

Financial statement analysis
Hosp
italit
y, L
eisu
re &
Tou
rism
Ser
ies
A high paid occupancy percentage does not necessarily signify a high revenue fromrooms, however. Not all room sales are made at the rack rate (the rack rate can bedefined as the maximum price that will be quoted for a room). Similar to the airlineindustry that sells seats in the same class and flight for a range of discounted prices,discounting room prices below the rack rate is a key characteristic of the hospitalityindustry. Accordingly, a performance measure that indicates the average room ratecharged needs to be computed. This can be achieved via the ‘average room rate’(sometimes called the average daily rate or ‘ADR’) performance indicator which iscalculated as follows:
Average room rate =Day’s revenue from room letting
Number of rooms let in the day
The room occupancy and the average room rate performance indicators, whenconsidered independently, represent incomplete measures of sales performance. Ahigher level of total revenue from rooms will not result from an increased occupancylevel if the room rate has been disproportionately dropped. Similarly, a higher levelof total revenue from rooms will not result if an increase in the average room ratecoincides with a disproportionate decline in the occupancy level.
There is a highly intuitively appealing performance measure that circumvents this‘incompleteness’ problem. The manager interested in monitoring room salesperformance can calculate the average revenue earned by every room in the hotel(both sold and unsold rooms). This ‘revenue per available room’ ratio is widelyreferred to by the abbreviation ‘revpar’ and can be calculated as follows:
Revenue per available room (Revpar) = Total daily room letting revenue
Total hotel rooms (both sold and unsold)
Box 5.1 demonstrates how revpar circumvents the incompleteness problem of theoccupancy and average room rate performance indicators. The more comprehensivenature of revpar is apparent from the fact that it can be calculated by multiplying theoccupancy level (stated as a decimal) by the average room rate. The significance ofrevpar as a performance measure will be further elaborated upon in Chapter 10’sdiscussion of yield management.
The revpar dimension of room sales performance can be measured slightlydifferently by viewing actual revenue as a percentage of potential revenue. Thisratio, which is generally referred to as ‘room yield’, will always run in tandem withrevpar, i.e. a high revpar will signify a high room yield. Accordingly, there is no needto compute both performance indicators. Both measures are introduced herebecause, while most hotel managers use revpar, others also refer to room yield.
Room yield =Actual total room revenue
Potential total room revenue
On the expense side of a hotel’s room sales activities, the efficiency of room serviceexpenditure can be monitored by calculating the service cost per room in thefollowing manner:
Service cost per room =Total daily room servicing costs
Number of rooms serviced in the day
75

Financial Management for Hospitality Decision Makers
Hosp
italit
y, L
eisu
re &
Tou
rism
Ser
ies
Restaurant-related performance measuresA measure providing insight concerning the productivity of restaurant labour isrevenue per employee hour worked, and can be computed as follows:
Revenue per employee hour worked =Restaurant revenue
Number of employee hours worked
Revenue per employee hour worked can also be applied to beverage sales. If seekingto compare labour productivity across different meal times (where there can be aconsiderable spread in the profitability of meals served and also average spend perhead), it might be more appropriate to calculate covers sold per employee hourworked in the following manner:
Covers per employee hour worked =Number of covers served in period
Number of employee hours worked
76
Box 5.1Revpar: a comprehensive indicator of room sales performance
Imagine you are comparing the room sales performance of two Canadian properties that arepart of LuxuryLife’s worldwide chain of hotels. Toronto’s 120-room LuxuryLife property hasbeen achieving an occupancy level of 65% and an average room rate of $100. Vancouver’s90-room LuxuryLife property has an average occupancy level of 72% and an average roomrate of $80. The performance of these two properties highlights how the occupancy level andaverage room rate are relatively incomplete indicators of room sales performance. The Torontoproperty has the higher average room rate, but the Vancouver property has the higher averageoccupancy. The incompleteness of these two measures can be overcome by integrating thetwo measures into one, i.e. multiply occupancy level by average room rate to generaterevenue per available room (revpar), i.e.:
Hotel Occupancy Average room rate Revpar
Toronto 0.65 × $100 = $65.0
Vancouver 0.72 × $80 = $57.6
We can check that the product of occupancy and average room rate generates revpar bycalculating the Toronto property’s revpar using the ‘total daily room revenue ÷ total hotelrooms’ revpar formula as follows:
Toronto property’s total daily room revenue = 120 × 0.65 × $100 = $7,800
Toronto property’s revpar = $7,800 ÷ 120 = $65.
As the Toronto property is achieving the higher revpar, we would conclude it has the betterroom sales performance.

Financial statement analysis
Hosp
italit
y, L
eisu
re &
Tou
rism
Ser
ies
Similar to the room occupancy performance measure used to gauge the roomsactivity level, in restaurants, activity can be gauged by calculating seat turnover. Thisprovides an indicator of the number of customers served on each restaurant seatduring a day and can be calculated as follows:
Seat turnover =Number of covers served per day
Number of restaurant seats
Paralleling the trade-off between room occupancy and the average room rate notedabove, a trade-off exists in restaurants between seat turnover and expenditure madeby each customer. If menu prices are increased, we can anticipate a decrease in seatturnover. Expenditure per customer is generally referred to as ‘average spend perhead’ and can be calculated as follows:
Average spend per head =Total restaurant revenue
Number of covers served in period
77
Box 5.2Revenue yield per seat: a comprehensive indicator of restaurant salesperformance
Imagine that in May 20X1 ‘MedievalMeals’, which is an 80-seat restaurant adjoining a Welshcastle, was open for 27 days and had a revenue of £67,500 from 2,700 covers sold. In May20X2 MedievalMeals was open for 28 days and earned £75,264 from 2,688 covers sold. Thetable below presents the calculation of MedievalMeals’ seat turnover, average spend per head,and average daily revenue yield per seat for the two periods. From these calculations, animproved sales performance in May 20X2 is apparent as the daily revenue yield per seat is£2.35 greater (£33.60 – £31.25), despite the decline in seat turnover from 1.25 to 1.2.
Period Seat turnoverAverage spend
per headAverage revenue
yield per seat
May 20X1 1.25a × £25b = £31.25
May 20X2 1.20 × £28 = £33.60
a Number of covers served per day = 2,700 ÷ 27 = 100Seat turnover = 100 ÷ 80 = 1.25
b $67,500 ÷ 2,700 = $25
We can check that the product of seat turnover and average spend per head generatesrevenue yield per seat, by calculating revenue yield per seat for May 20X1 using the ‘totalrevenue ÷ number of restaurant seats’ formula as follows:
£67,500 ÷ (80 × 27) = £31.25

Financial Management for Hospitality Decision Makers
Hosp
italit
y, L
eisu
re &
Tou
rism
Ser
ies
Just as average room rate and room occupancy are incomplete measures of roomsperformance, so too are average spend per head and seat turnover incompletemeasures of restaurant performance. Following the approach taken to generaterevpar, a more complete indicator of restaurant sales performance can be achievedby multiplying average spend per head by seat turnover. This term, which can bereferred to as ‘revenue yield per seat’, provides an indication of the salesproductivity of each restaurant seat. A simple way of computing revenue yield perseat is as follows:
Revenue yield per seat =Total restaurant revenue
Number of restaurant seats
The way in which revenue yield per seat represents a combination of the averagespend per head and seat turnover performance indicators is demonstrated inBox 5.2.
Summary
This chapter has described how a systematic approach can be taken when analysing acompany’s profit performance and financial stability. By segregating the ROI measure into aprofit margin and an asset turnover dimension and working through the elements that affectthese two aspects of profitability, we can ensure a comprehensive profitability analysis isundertaken. We have also seen that a comprehensive analysis of financial stability can beundertaken by considering a company’s short-and long-term degree of indebtedness. Inaddition to these financial analyses, the chapter has overviewed operational measures that arewidely used in the hospitality industry.
Having read the chapter you should now know:
� How to take a systematic approach when analysing a company’s profitability� How to analyse a company’s short-and long-term financial stability� How to compute a range of operational measures that are widely used in the hospitality
industry� How an aged schedule of accounts receivable can assist managers involved in accounts
receivable management� That it is important to tailor ratios with due regard given to the nature of the organization
being analysed.
References
Atkinson, H., Berry, A. and Jarvis, R. (1995) Business Accounting for Hospitality andTourism & Leisure, International Thomson Publishing, London, Chapter 11.
Carnegie, G., Jones, S., Norris, G., Wigg, R. and Williams, B. (1999) Accounting:Financial and Organisational Decision Making, Irwin/McGraw-Hill, New York,Chapter 12.
Coltman, M. M. and Jagels, M. G. (2001) Hospitality Management Accounting, 7thedition, John Wiley, Chichester, Chapter 4.
78

Financial statement analysis
Hosp
italit
y, L
eisu
re &
Tou
rism
Ser
ies
Kotas, R. (1999) Management Accounting for Hospitality and Tourism, 3rd edition,International Thomson Publishing, London, Chapter 15.
Kotas, R. and Conlan, M. (1997) Hospitality Accounting, 5th edition, InternationalThomson Publishing, London, Chapter 22.
Owen, G. (1994) Accounting for Hospitality, Tourism & Leisure, Pitman Publishing,London, Chapter 17.
Schmidgall, R. F. (1997) Hospitality Industry Managerial Accounting, 4th edition,Educational Institute – American Hotel & Motel Association, East Lansing, MI,Chapter 5.
Problems
✓ indicates that a solution appears at the back of the text
✓ 5.1 HoJo and EasyRest are two companies in the American hotel and catering industry.The following financial data for 20X0 relate to their food and beverage activities:
Hojo$m
Easyrest$m
Revenue 500 300Cost of sales 200 220EBIT 50 15Total assets 250 75
Required • • •(a) Use the Dupont formula (based on EBIT) to compare the performance of the two
companies’ F&B activities.(b) Do the two companies appear to be operating different strategies, and if so, in
what way?
✓ 5.2 In the last financial year London’s Enwad Hotel group achieved a revenue of £28.75million and a gross profit margin of 40%. Its end-of-quarter inventory balances wereas follows:
Quarter Inventory
1 £ 400,0002 £ 800,0003 £ 900,0004 £ 200,000
Required • • •(a) Calculate the firm’s inventory turnover and the average age of inventory.(b) Comment on Enwad’s liquidity, assuming most of its competitors record an
inventory turnover of 40.
79

Financial Management for Hospitality Decision Makers
Hosp
italit
y, L
eisu
re &
Tou
rism
Ser
ies
✓ 5.3 A friend who owns a Sydney restaurant has presented the following information toyou and asked you to comment on the restaurant’s performance in 20X2.
Year-end 20X1$
Year-end 20X2$
Current assetsCash 10,800 14,300Accounts receivable 27,000 26,000Marketable securities 7,500 7,500Inventories 10,400 12,000Prepaid expenses 1,500 1,600
Current liabilitiesAccounts payable 8,400 12,200Accrued expenses 3,600 5,600Current tax payable 4,500 3,400Deposits and credit balances 700 400Current portion of loan 10,700 9,500
Required • • •(a) For both years calculate the working capital.(b) For both years calculate the current asset ratio.(c) For both years calculate the acid test ratio.(d) Comment on whether the restaurant is becoming more or less liquid.
Revenue for the year 20X2 was $500,000 (55% of this was credit sales) and the costof sales was $150,000. Calculate the following for 20X2:
(e) The accounts receivable turnover.(f) The accounts receivable average collection period.(g) The inventory turnover.(h) The average age of inventory.
5.4 The following financial information highlights the profitability and financial stability inthe last three years of FlyingFood, one of Heathrow Airport’s restaurants:
Year 20X1 20X2 20X3
Current asset ratio 1.20 1.34 1.46Food inventory turnover 36 times 30 times 25 timesAccounts receivable turnover 29 times 25 times 19 timesDebt to equity 2.40 2.20 1.85Return on shareholders’ equity 10.56% 9.44% 9.02%Sales (all on credit) £945,000 £952,000 £948,000
Required • • •Using the above information, answer each of the following questions, including anexplanation of why you answered each question in this way.
(a) On average, is the restaurant extending a shorter or longer credit period to itscustomers?
(b) Over the years has more or less money been invested in food inventory?
80

Financial statement analysis
Hosp
italit
y, L
eisu
re &
Tou
rism
Ser
ies
(c) During the period, has the liquidity of the restaurant improved?(d) Do you expect the shareholders to be satisfied with their return on investment?
From the shareholders’ point of view, is the profitability of the operation improvingor not?
(e) Imagine that in 20X3 the restaurant wants to finance a proposed expansionthrough a loan. Relative to its financial position in 20X1 do you think it will beeasier or harder to borrow?
5.5 Imagine you are head of the food and beverage department in a large Los Angeleshotel complex. One of the hotel’s restaurants is currently earning an annual ROI of14% on the $200,000 of assets attributed to the restaurant. The average profit marginon covers served is 40%. The restaurant manager believes that if cover prices weredropped by 10% (the average cover currently provides $20 revenue), there would bea significant increase in ROI.
Required • • •(a) Prior to the proposed price decrease, what is the restaurant’s sales/total assets
turnover ratio?(b) If the proposed price decreases were implemented, what level of sales to total
assets must be achieved in order to avoid a decline in ROI?(c) Following on from part (b), how many more covers must be served in order to
avoid a decline in ROI?
5.6 Imagine you are the rooms manager of Will’sWooms an 80-room hotel located inStratford upon Avon. Demand for hotel rooms is significantly affected by the touristseason and the popularity of plays appearing in the nearby Shakespeare theatre. TheGeneral Manager has asked you to defend your decision to increase average roomrates to £120 during the recent summer theatre season. Occupancy for this year’ssummer theatre season was 80% which is down from the previous year’s summeroccupancy of 90%. Average room rates charged during the previous year’s summerseason were £100.
Required • • •Use revpar to defend your decision to increase room rates charged during thissummer’s theatre season.
5.7 A manager of a 120-seat Singaporean restaurant is interested in comparing the salesperformance of two recent years. In 20X1, the restaurant achieved an average lunchspend per head of $15 and a lunchtime seat turnover of 1.4. Also in this year, itsdinner average spend per head was $28 with a dinnertime seat turnover of 1.1. In20X2 the restaurant was open for 312 days and had a revenue of $2,135,000. 37%of the revenue was earned from lunches (56,160 covers served) and 63% wasearned from dinners (44,928 covers sold).
Required • • •Provide the manager with an analysis comparing the relative sales performance ofthe two years.
81

C H A P T E R• • • • 6
Cost managementissues
L e a r n i n g o b j e c t i v e sAfter studying this chapter, you should havedeveloped an appreciation of:
1 How the range of decision making and controlsituations confronted by managers results in manydifferent cost classifications
2 What is meant by an opportunity cost
3 What is meant by direct and indirect costs
4 Methods that can be used to allocate indirect coststo departments
5 What is meant by fixed and variable costs
6 What is meant by incremental and sunk costs.

Cost management issues
Hosp
italit
y, L
eisu
re &
Tou
rism
Ser
ies
IntroductionThis chapter focuses on the different ways costs are classified in order to supportmanagement decision making and organizational control. When referring to costs ineveryday hotel affairs, managers use terms suggesting a multitude of cost classifica-tion schemes. These classifications include: fixed and variable costs, direct andindirect costs, opportunity costs, incremental costs, sunk costs, non-controllable andcontrollable costs. It is not surprising that staff without any accounting backgroundbecome somewhat bewildered by the existence of so many cost classifications.
It is important to recognize that the range of cost classifications used resultsfrom the wide diversity of management decision-making and control situationsthat can arise. Rather than attempting to memorize widely used cost classifica-tions, however, it is recommended that you focus on common control and deci-sion-making issues that can arise and how cost information can be tailored to suitthe particular management issue at hand. This chapter provides an overview ofseveral typical decision-making and control scenarios that can arise and the maincost classification schemes that have been developed in light of these scenarios.Before considering this range of scenarios, it is important to recognize thataccountants refer to any ‘thing’ that is to be costed as a ‘cost object’. The range ofcost objects that one could confront in a career is limitless. Generally monitoredcost objects in the hotel industry include: cost of cleaning a room, cost of process-ing a unit of laundry, and food cost in a meal. To further highlight the range ofcost objects that can be encountered, five cost objects that could be referred to inrestaurant management are summarized in Box 6.1.
Management’s need for cost informationAccounting information is a resource that has a cost. It is important to recognize thatorganizational resources are expended collecting and analysing cost information. Weshould not spend more money on collecting and analysing cost information than thedecision making or control benefit that will derive from the costing information.
83
Box 6.1Exploring cost objects: examples found in large restaurants
When considering costing for different purposes, it is important that we recognize what it isthat we are costing. The ‘thing’ that is being costed is called a cost object. For a largerestaurant, possible cost objects include:
1 Cost of staffing a shift (we might be considering dropping a shift)2 Cost of food in a meal (for the purposes of controlling costs, we might like to compare
actual cost to budgeted cost)3 Cost of providing and serving a meal (we might like this information to aid menu pricing
decisions)4 Cost of cleaning the restaurant (we might like this information if we were considering
outsourcing this function to a cleaning specialist)5 Cost of overhauling the kitchen (we might be considering replacing kitchen infrastructure).

Financial Management for Hospitality Decision Makers
Hosp
italit
y, L
eisu
re &
Tou
rism
Ser
ies
We will begin this chapter’s review of widely used cost classifications by firstconsidering some general examples of how cost information can be used inmanagement decision making and control.
Decision makingCost information can be important for decisions such as:
� Should we close a shop?� Should we outsource laundry activities?� What rate should be charged for a room?� Should we promote single room sales more than double room sales?
Cost classification issues that can arise in connection with decision making includethe need to distinguish between fixed and variable costs. As will be seen below, wemay want to distinguish between fixed costs and variable costs because in the shortrun it can be in the organization’s interest to accept a room rate that covers only thevariable cost of selling one night’s accommodation.
ControlWhen monitoring the performance of a departmental head, it is desirable that wedistinguish between controllable costs (those which the department head caninfluence) and non-controllable costs. If we fail to make this distinction, theperformance measure used will not represent an appropriate proxy for appraisingthe department head’s managerial judgement and effort. As department headstend to be acutely aware of inappropriately calibrated performance measures,frustration and resentment typically result from poorly designed performancemeasurement systems.
The need for departmental control also raises the issue of how best to deal withthose hotel costs that are not readily traceable to a department that sells services.For example, should a portion of training costs be allocated to the F&B and roomsdepartments? While both these departments benefit from hotel training pro-grammes provided, can a sound basis be developed for allocating training costs toother departments? As will be seen below, costs that are readily traceable to thecost object in question (in this case the F&B and rooms departments), are referredto as direct costs, and costs that are not readily traceable to the cost object arereferred to as indirect costs.
Major cost classification schemesIn this section, five cost classification schemes are described:
(a) Outlay versus opportunity costs(b) Direct versus indirect costs(c) Variable versus fixed costs(d) Controllable versus non-controllable costs(e) Incremental versus sunk costs.
84

Cost management issues
Hosp
italit
y, L
eisu
re &
Tou
rism
Ser
ies
Outlay versus opportunity costsAn outlay cost is ‘real’ in the sense that it involves a disbursement of funds. Anopportunity cost does not involve a disbursement of funds, it is, however, a cost tothe organization in the sense of an opportunity that is lost. The nature of opportunitycost is illustrated via a hypothetical scenario in Box 6.2.
Direct versus indirect costsAs already noted, a direct cost is readily traceable to a particular cost object, whilean indirect cost is not easily traced to a cost object. The term ‘overhead cost’ is alsowidely used and means the same as ‘indirect cost’. A cost may be direct with respectto one cost object, but indirect with respect to another, e.g. the cost of a hotel’ssponsorship of a local sporting event, is a direct cost with respect to the hotel’smarketing department (one cost object), but will be indirect with respect to roomsand restaurant meals sold (another set of cost objects).
The direct versus indirect cost classification is significant when designing adepartmental performance reporting system. Some hotel accounting systems do notallocate indirect costs to departments while others attempt allocation of someindirect costs. The manner in which indirect cost allocation can be achieved will beillustrated through the following ‘HighRollers’ scenario.
Imagine HighRollers, a large Chicago hotel and casino complex with three profit-making departments: F&B, rooms and casino. Since its construction ten years ago,HighRollers’ performance reporting system has not allocated indirect costs to thesethree profit centres. This is evident from the copy of HighRollers’ most recentquarterly performance report reproduced as Exhibit 6.1.
HighRollers’ General Manager has had a concern that some of the complex’smanagers are not directing sufficient attention to indirect cost containment. Inaddition, he feels that some of the profit centres may be setting prices without due
85
Box 6.2The nature of opportunity cost
The nature of opportunity cost can be illustrated by a small worked example. Imagine London’sVictoria Hotel is appraising whether to open a new restaurant that will require floor area that iscurrently leased out to a souvenir vendor for £5,000 per annum. If the Victoria proceeds withthe proposed restaurant development, it will no longer be able to lease out the floor space andwill therefore lose the £5,000 per annum revenue. This loss is described as an ‘opportunitycost’, as although the Victoria does not have to pay £5,000, it will have lost the opportunity ofreceiving £5,000.
It is important that this potential loss of the £5,000 annual lease revenue is considered atthe time the restaurant development decision is taken. However, if the hotel decided to expandthe restaurant, the accounting system would not continue to record the £5,000 opportunitycost. To record all opportunity costs on a continuing basis would be an impossible exercise, asevery time an organization assigns a resource to a particular purpose (the resource could becash, floor space, people, etc.), the organization has incurred the opportunity cost associatedwith not assigning the resource to some other purpose.

Financial Management for Hospitality Decision Makers
Hosp
italit
y, L
eisu
re &
Tou
rism
Ser
ies
regard to ensuring a sufficient margin is earned to cover indirect costs as well asdirect costs. He feels that if indirect costs were to be allocated to the profit centres,there would be a greater incentive for the profit centre managers to hold other staffin the complex more accountable for efficient indirect cost management. In addition,the General Manager feels that allocating indirect costs to the profit centres wouldresult in managers setting revenue targets that result in adequate profit marginsearned on all costs, not just direct costs.
As a result, the General Manager has approached the Financial Controller andasked that the performance report presented as Exhibit 6.1 be redesigned in a waythat results in the allocation of the indirect costs to the three profit centres. Followingthis request, the Financial Controller collected information that she felt provided thebasis for a rational allocation of the indirect costs. The indirect cost allocation basesused, together with the rationale for their usage, are outlined in Exhibit 6.2.
Following development of the indirect cost allocation bases, the FinancialController produced a revised hotel performance report for the three months ending31 December 20X1 (Exhibit 6.3). In this report, the indirect costs have been allocatedto the three profit centres in a manner consistent with the rationale outlined inExhibit 6.2.
The performance report that includes the allocation of indirect costs (Exhibit 6.3)indicates a loss of $2,000 for the F&B department. Be careful not to conclude fromthis that the complex would be more profitable if the F&B department were tobe closed. Two factors highlight why this view is inappropriate. First, from acommercial viewpoint, it would appear naıve to suggest a casino could be operatedsuccessfully in the absence of food and beverage services. Second, closure of the F&B
86
Exhibit 6.1HighRollers’ unallocated profit and loss performance statement for the3 months ending 31 December 20X1
Casino$
Rooms$
Food &Beverage
$Total
$
Revenue 700,000 200,000 100,000 1,000,000Cost of sales 20,000 20,000Labour 210,000 41,000 25,000 276,000Other direct costs 65,000 8,000 7,000 80,000
Departmental profit 425,000 151,000 48,000 624,000Indirect costs:Advertising 60,000Senior management salaries & administrative support 120,000General building maintenance 40,000Training and personnel 35,000Transportation 10,000
Total indirect costs 265,000
Profit before tax 359,000Tax 107,700
Net profit 251,300

Exhibit 6.2Methods used to allocate HighRollers’ indirect costs to profit centres
Amount allocated to profit centres ($)
Indirect cost Rationale for the indirect cost allocation basis used Casino Rooms F&B
Department-specificadvertising
$20,000 of the $60,000 advertising expenditure was found to bespecific to the complex’s casino activities. This will all be allocatedto the casino.
20,000
General advertising The remaining advertising expenditure ($40,000) was general,complex-wide advertising. This is to be allocated to departmentsbased on their proportion of the complex’s total sales (i.e. casino:70%, rooms: 20% and F&B: 10%).
28,000(0.7 × $40,000)
8,000(0.2 × 40,000)
4,000(0.1 × $40,000)
Senior managementsalaries and admin.support
Senior management have indicated that they can provide areasonable estimate of time spent on each profit centre’s affairs.On average senior management’s time is distributed as follows:50% on casino, 25% on rooms and 25% on F&B.
60,000(0.5 × 120,000)
30,000(0.25 × 120,000
30,000(0.25 × 120,000)
General buildingmaintenance
Building maintenance is to be allocated to departments based ontheir relative floor space occupation. The casino occupies 15% ofthe complex’s floor space, rooms occupies 80% of floor space andF&B occupies 5%.
6,000(0.15 × 40,000)
32,000(0.8 × 40,000)
2,000(0.05 × 40,000)
Training and personnel Most of the training and personnel department’s activities aregenerated by staff turnover. In the last year the casino hired 50new staff, rooms hired 20 new staff and F&B hired 30 new staff.Training & personnel costs are to be allocated based on theseproportions.
17,500(0.5 × 35,000)
7,000(0.2 × 35,000)
10,500(0.3 × 35,000)
Transportation Staff transportation costs are to be allocated according to therelative number of equivalent full time staff in each department. On31st December 20X1 the number of full time staff in eachdepartment was: Casino: 100; Rooms: 30; F&B:70.
5,000(0.5 × 10,000)
1,500(0.15 × 10,000)
3,500(0.35 × 10,000)
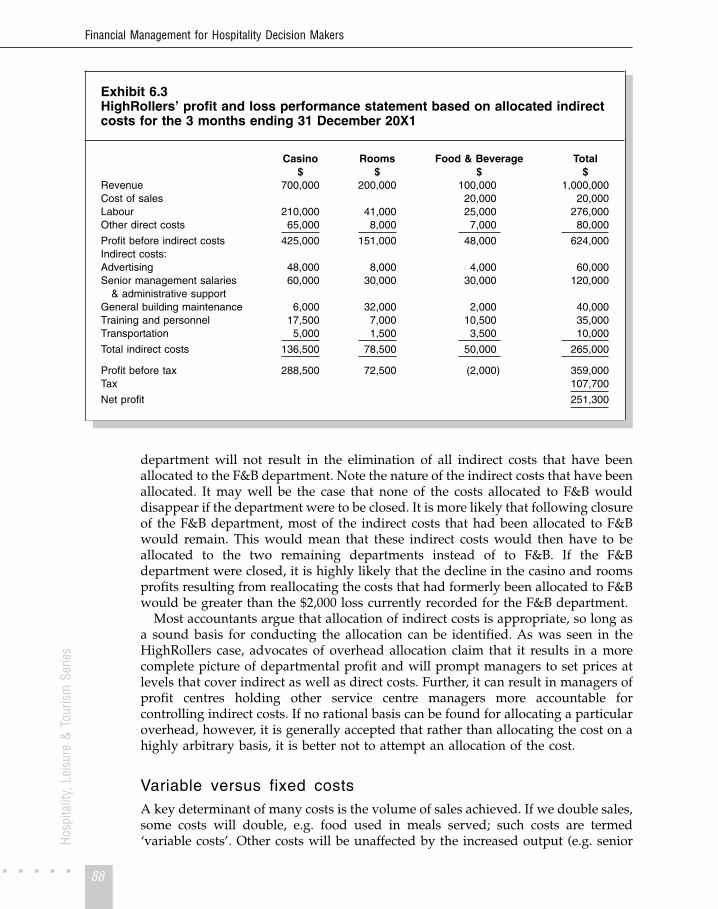
Financial Management for Hospitality Decision Makers
Hosp
italit
y, L
eisu
re &
Tou
rism
Ser
ies
department will not result in the elimination of all indirect costs that have beenallocated to the F&B department. Note the nature of the indirect costs that have beenallocated. It may well be the case that none of the costs allocated to F&B woulddisappear if the department were to be closed. It is more likely that following closureof the F&B department, most of the indirect costs that had been allocated to F&Bwould remain. This would mean that these indirect costs would then have to beallocated to the two remaining departments instead of to F&B. If the F&Bdepartment were closed, it is highly likely that the decline in the casino and roomsprofits resulting from reallocating the costs that had formerly been allocated to F&Bwould be greater than the $2,000 loss currently recorded for the F&B department.
Most accountants argue that allocation of indirect costs is appropriate, so long asa sound basis for conducting the allocation can be identified. As was seen in theHighRollers case, advocates of overhead allocation claim that it results in a morecomplete picture of departmental profit and will prompt managers to set prices atlevels that cover indirect as well as direct costs. Further, it can result in managers ofprofit centres holding other service centre managers more accountable forcontrolling indirect costs. If no rational basis can be found for allocating a particularoverhead, however, it is generally accepted that rather than allocating the cost on ahighly arbitrary basis, it is better not to attempt an allocation of the cost.
Variable versus fixed costsA key determinant of many costs is the volume of sales achieved. If we double sales,some costs will double, e.g. food used in meals served; such costs are termed‘variable costs’. Other costs will be unaffected by the increased output (e.g. senior
88
Exhibit 6.3HighRollers’ profit and loss performance statement based on allocated indirectcosts for the 3 months ending 31 December 20X1
Casino$
Rooms$
Food & Beverage$
Total$
Revenue 700,000 200,000 100,000 1,000,000Cost of sales 20,000 20,000Labour 210,000 41,000 25,000 276,000Other direct costs 65,000 8,000 7,000 80,000
Profit before indirect costs 425,000 151,000 48,000 624,000Indirect costs:Advertising 48,000 8,000 4,000 60,000Senior management salaries
& administrative support60,000 30,000 30,000 120,000
General building maintenance 6,000 32,000 2,000 40,000Training and personnel 17,500 7,000 10,500 35,000Transportation 5,000 1,500 3,500 10,000
Total indirect costs 136,500 78,500 50,000 265,000
Profit before tax 288,500 72,500 (2,000) 359,000Tax 107,700
Net profit 251,300

Cost management issues
Hosp
italit
y, L
eisu
re &
Tou
rism
Ser
ies
staff salaries, grounds maintenance, depreciation of fixed assets, etc.). Those coststhat do not alter with changed levels of sales activity are termed ‘fixed costs’. Somecosts have a fixed and a variable component, these are termed ‘semi-variable’ or‘mixed’ costs. A marketing manager’s salary that comprises a fixed monthly amountand a commission component that varies according to the number of sales made isan example of a semi-variable cost.
There are several decision-making scenarios necessitating the classification ofcosts into variable and fixed. One of these is in connection with breakeven analysis,which is a particular analytical technique which will be addressed in the nextchapter. Three other scenarios where the distinction between variable and fixed costsis important are:
(a) The danger of treating fixed costs as variable when considering a range ofactivity levels for the organization
(b) Short-term pricing decisions(c) The decision to close a hotel during the off-season.
Following a description of how an organization can classify its costs into fixed andvariable, these situations where an appreciation of the distinction between fixed andvariable costs is important will be described.
Determining the variable and fixed cost functions • • •An approximation of an organization’s fixed and variable costs can be determinedrelatively easily using a technique generally referred to as the ‘high–low’ method.An example illustrating the application of this method is presented in Box 6.3.
The high–low method has the advantage of being simple to calculate and servesas a rough approximation of the cost function. However, only two observations – thehighest and the lowest points – are considered and it may not always be the case thatthese two observations are representative of the underlying fixed and variable costrelationship throughout the year. More sophisticated approaches such as regressionanalysis, which is a statistical technique generally available on most statisticalcomputer software packages, can also be used. The technical aspects of thistechnique are not reviewed here as the steps necessary to complete the exercise willdepend on the software used. The interested reader will find further discussion ofregression analysis in most introductory statistics books.
A range of activity levels and the danger of treating fixed costs asvariable costs • • •A trap that some managers and accounting students fall into relates to treating fixedcosts as if they are variable costs. As can be seen from the example provided in Box6.4, you fall into this trap if you attempt to interpret average cost per unitinformation in the context of a range of activity levels.
Short-term pricing decisions • • •The distinction between fixed and variable costs is also important when consideringshort-term pricing situations. The example in Box 6.5 shows that in the short term itcan be justifiable to accept a price that covers variable cost and not total cost.
89

Financial Management for Hospitality Decision Makers
Hosp
italit
y, L
eisu
re &
Tou
rism
Ser
ies
This use of variable cost in short-term pricing is particularly pertinent to roomrates charged during the off-season. If we have spare room capacity and wish toadopt a very aggressive room-pricing strategy in an effort to increase occupancylevels, an argument can be made for dropping the room rate to a level just above thevariable cost associated with room occupancy. If the sale of one more room resultsin extra variable costs of $10 (most of this would be the cost of cleaning the roomfollowing checkout), then an argument can be made for dropping the room rate toa level just above $10. If one extra room was sold at a rate of $11 then $1 additional
90
Box 6.3Determining fixed and variable costs using the ‘high–low’ method
Imagine the SqueakyClean Hotel, a fell walkers retreat located in the English Lake District.Identified below are data relating to SqueakyClean’s housekeeping costs for January to June20X1.
MonthHousekeeping costs
£Number of rooms
cleaned
January 17,000 2,100February 15,500 1,800
March 16,250 1,950April 16,450 1,990May 16,500 2,000June 16,775 2,055
To use the high–low method, we compare across the organization’s busiest and quietestperiods. It can be seen that January is the busiest month and February is the quietest month.By determining the changed level of activity and also the change in costs across these twomonths, we can determine the variable cost per unit. SqueakyClean’s variable housekeepingcost per room can be determined as follows:
When 2,100 rooms were cleaned (highest level of activity), cost = £17,000.
When 1,800 rooms were cleaned (lowest level of activity), cost = £15,500.
It therefore costs an extra £1,500 (£17,000 – £15,500), to clean an extra 300 rooms(2,100 – 1,800).
Therefore, the variable cost per room is £1,500 ÷ 300 = £5 per room.
Having determined that the variable cost per room is £5, determining the fixed costs isstraightforward:
As Total cost = Total Variable cost + Total Fixed cost,
Total cost – Total Variable cost = Total fixed cost
SqueakyClean’s total housekeeping costs for January are £17,000, and their variablehousekeeping costs are £10,500 (£5 × 2,100 rooms). Fixed housekeeping costs musttherefore be £6,500 (£17,000 – £10,500).

Cost management issues
Hosp
italit
y, L
eisu
re &
Tou
rism
Ser
ies
profit will result ($11 – $10). Again, significant marketing issues would arise if suchan aggressive room-pricing strategy were to be adopted. Nevertheless, variable costinformation can be important in the context of short-term pricing decisions. Thisissue is further explored in Chapter 10.
The decision whether to close during the off-season • • •As many hotel operations experience significant seasonality, hotel managers canconfront the issue of whether to close a hotel for a period of the year. As will beapparent from the following example, drawing a distinction between fixed andvariable costs provides useful insight when deciding whether to close during a quietperiod. Imagine the RockiesResort, a Canadian mountain lodge that has a high
91
Box 6.4The danger of treating average cost per unit as a constant
Be careful if you are provided with total cost information and use it to determine an averageunit cost. Danger awaits if you attempt to use this information in the context of different levelsof activity. To demonstrate how easy it can be to fall into this trap, work through this smallexercise.
Before reading any further, place your right hand over the final two columns appearing in theschedule of data at the bottom of this box (i.e. that part of the schedule relating to cleaning100 rooms). From the schedule, which concerns room cleaning costs, you will note thatcleaning 50 rooms requires $250 of labour costs and $450 of depreciation. From this we caneasily determine that the average cost of cleaning a room is $14 ($700 ÷ 50). Now, are wesafe to conclude that if twice as many rooms are cleaned it will cost us $1,400 (i.e. $14 ×100)? Unfortunately many managers and accounting students fall into this trap. They believethat once they have calculated average cost at one level of activity, this number can be usedto determine total cost across a range of different activity levels.
You can now take your hand away from the page. Note that doubling the level of activity to100 rooms cleaned does not result in the total cost doubling. Part of the costs have doubled,i.e. the total labour cost, as labour is variable. However, depreciation is a fixed cost and it isthe same in total for each period of time, regardless of the level of activity in that period. Thekey to understanding this little conundrum involves recognizing that the cost of cleaning aroom is $14 only when 50 rooms are cleaned. If more rooms are cleaned, the per room cost ofcleaning goes down because the fixed cost of $450 is spread across more rooms, i.e. when100 rooms are cleaned, the average cost per room is $9.5 ($950 ÷ 100). Be careful in yourorganization if someone quotes an average cost for making an item or performing a particularactivity. If fixed costs are present (some of an organization’s costs are invariably fixed), theaverage cost for making the item or for performing the activity will change depending on theactivity level.
Cleaning 50 rooms Cleaning 100 roomsTotal Per room Total Per room
Labour $250 $5.0 $500 $5.0Equipment depreciation $450 $9.0 $450 $4.5
$700 $14.0 $950 $9.5

Financial Management for Hospitality Decision Makers
Hosp
italit
y, L
eisu
re &
Tou
rism
Ser
ies
occupancy of skiers in the winter months and a low occupancy in the summermonths. During winter months a relatively high room rate is charged and averageoccupancy levels are 90%. During the summer months average occupancy is 30%and a lower room rate is charged. Exhibit 6.4 analyses RockiesResort’s profitabilityin the summer and winter seasons.
Variable costs move in line with occupancy levels. With respect to the semi-variable costs, there is a fixed electricity charge of $1,000 per six-month period, andmaintenance costs have a fixed cost component of $2,000 per six-month period.
Although it appears from Exhibit 6.4 that the hotel is making a loss of $28,000during the summer months, it would be wrong to conclude from this that the hotelshould be closed during this time. Closure of the hotel in the summer period wouldnot result in the removal of the fixed costs associated with the summer period.Similar to the approach taken earlier, this type of problem can be approached byconducting an incremental analysis that identifies all factors that would changefollowing closure in the summer. If the hotel were to close, the following changeswould occur:
92
Box 6.5Using variable cost as a short-term pricing threshold
Imagine that a restaurant in Turin has a monthly output of 20,000 meals which are sold for anaverage of A20 per meal. Variable cost per meal is A8 and fixed costs per month are A40,000.Mr Bozo, the restaurant’s accountant, has worked out the average cost per meal to be:
A8 + (A40,000 ÷ 20,000) = A10
The restaurant currently has excess capacity that would allow it to serve a further 5,000 mealsper month, and during a local senior citizens’ convention that is running for a month, therestaurant has received a one-off offer to provide 4,000 meals for A9.50 per head. Bozobelieved that the offer should be rejected as it fails to cover the cost per meal. Is he right?
An easy way to tackle a problem such as this involves taking an incremental perspective,i.e. identify all changes that will occur if the offer is accepted. If the offer is accepted, changesthat will occur are:
E Profit impactIncreased total variable cost (4,000 × A8) 32,000 NegativeIncreased fixed cost 0Increased revenue (4,000 × A9.50) 38,000 Positive
Net impact on profit 6,000 Positive
On the basis of a short-term profit impact appraisal, the offer could be accepted as it willincrease profit by A6,000 (A38,000 – A32,000). It should be acknowledged, however, that thisrepresents a short-term profitability impact analysis only. The analysis has not consideredlonger-term marketing issues such as whether the convention organizer might return andbargain hard for a discounted price again in the future, and also whether there is a likelihoodthat existing clients will become dissatisfied and start seeking lower prices if they becomeaware of the rates charged to the senior citizens.

Cost management issues
Hosp
italit
y, L
eisu
re &
Tou
rism
Ser
ies
$ Impact on annual profit
Lost revenue 100,000 NegativeReduction in variable costs 30,000 PositiveReduction in electricity ($4,000 – $1,000) 3,000 PositiveReduction in maintenance ($4,000 – $2,000) 2,000 PositiveNet impact on profit 65,000 Negative
From this analysis we can conclude that closing the hotel in the summer wouldreduce profit for the year by $65,000. As a result, the hotel should be kept openduring the summer months.
Controllable versus non-controllable costsIn responsibility accounting, managers should only be held accountable for coststhat they can control. In a manager’s performance report, an attempt should bemade to segregate controllable costs from non-controllable costs. The issue ofresponsibility accounting is explored in greater detail in Chapter 8.
Incremental versus sunk costsIn some decision-making situations, the distinction between incremental and sunkcosts can be important. As can be seen from financial decision making Case 6.1, sunkcosts are irrelevant in many decision-making situations. This is because ‘sunk’ is theterm used to describe a cost that has been incurred in the past and is nowirreversible. A good example of a sunk cost is depreciation. This is because it is a costthat relates to the purchase of an asset at an earlier time. As the fixed asset purchasecannot be reversed, the depreciation charge cannot be avoided.
93
Exhibit 6.4RockiesResort profit and loss analysis
November–April$
May–October$
Total$
Sales 500,000 100,000 600,000
Variable costs 90,000 30,000 120,000Semi-variable costs
Electricity 10,000 4,000 14,000Maintenance 8,000 4,000 12,000
Fixed costs 90,000 90,000 180,000
Total costs 198,000 128,000 326,000
Net profit 302,000 (28,000) 274,000

Financial Management for Hospitality Decision Makers
Hosp
italit
y, L
eisu
re &
Tou
rism
Ser
ies
Case 6.1Financial Decision Making in Action – The F&B Manager
and the decision to outsource
It is important that decision makers appreciate that cost information has to be tailored tosuit the particular circumstances of each decision confronted. Imagine an F&B manager isconsidering outsourcing pastry production. A local baker has offered to supply pastries ata cost of $7.50 per tray. Data pertaining to the F&B department’s pastry-making activitiesfor last year follows:
Direct materials $20,000Direct labour $110,000Variable overhead $10,000Fixed overhead $90,000Trays of pastry produced 20,000
The direct materials, labour and variable overhead can all be expected to be incremental(i.e. will change if pastry production is ceased). If fixed overhead comprises depreciationon ovens used in pastry production, the $90,000 can be treated as a sunk cost (non-incremental) and not relevant to the decision. We will assume the ovens cannot be solddue to prohibitively high removal costs. Based on these data, it appears undesirable topurchase outside as the incremental cost of continuing to make the 20,000 trays ofpastries is $140,000 ($20,000 + $110,000 + $10,000) which is less than the $150,000(7.5 × 20,000 trays) it would cost to buy outside.
Qualitative and behavioural factors in managementdecisionsAll the issues addressed above have been approached by conducting quantitativeanalyses. The financial data provided by the accounting system frequently play apowerful information role as they carry an air of ‘objectivity’. Despite this, it isimportant to remember that qualitative factors must also be appraised. In theoutsourcing decision-making scenario outlined above, it might be that the costsaving associated with purchasing outside would have to be very significant beforethe F&B manager is willing to sacrifice a position of being able to guaranteecontinued availability of pastries. In addition, quality issues are obviously importantin the context of an outsourcing decision, and marketing issues are obviouslyimportant in decisions such as what price to charge and whether a hotel should closeduring the off-season. Clearly, an astute manager will always attempt to strike anappropriate balance between quantitative and qualitative analyses when makingdecisions.
94

Cost management issues
Hosp
italit
y, L
eisu
re &
Tou
rism
Ser
ies
95
Summary
In this chapter we have reviewed different ways that costs can be classified. The reason thatseveral cost classification schemes exist is that there is a wide diversity of decision-makingand control situations that can arise. Decision-making situations requiring a particularanalysis of cost information include the setting of prices, the decision whether to close duringthe off season as well as the decision whether to outsource a function or activity.
Having read the chapter you should now know:
� Cost analysis has to be designed in accordance with the specific needs of each decision-making scenario at hand
� When opportunity costs should be appraised� The distinction between direct and indirect costs� Methods that can be used to allocate indirect costs to departments� The importance of distinguishing between fixed and variable costs� The significance of distinguishing between incremental and sunk costs.
References
Atkinson, H., Berry, A. and Jarvis, R. (1995) Business Accounting for Hospitality andTourism & Leisure, International Thomson Publishing, London, Chapter 13.
Carnegie, G., Jones, S., Norris, G., Wigg, R. and Williams, B. (1999) Accounting:Financial and Organisational Decision Making, Irwin/McGraw-Hill, New York,Chapter 23.
Coltman, M. M. and Jagels, M. G. (2001) Hospitality Management Accounting, 7thedition, John Wiley, Chichestar, Chapter 7.
Kotas, R. (1999) Management Accounting for Hospitality and Tourism, 3rd edition,International Thomson Publishing, London, Chapter 3.
Kotas, R. and Conlan M. (1997) Hospitality Accounting, 5th edition, InternationalThomson Publishing, London, Chapters 17 and 18.
Owen, G. (1994) Accounting for Hospitality, Tourism & Leisure, Pitman Publishing,London, Chapter 11.
Schmidgall, R. F. (1997) Hospitality Industry Managerial Accounting, 4th edition,Educational Institute – American Hotel & Motel Association, East Lansing, MI,Chapter 6.
Problems
✓ indicates that a solution appears at the back of the text
✓ 6.1 Why do so many different classifications of cost arise in accounting?
✓ 6.2 The conference department of the MerryWeather hotel in Inverness, Scotland hasfixed costs of £360 per day. A local university is seeking a quote in connection witha conference it is planning to hold next year. The university would like the hotel toprovide morning coffee, lunch, afternoon tea and to prepare conference materials tobe distributed to all conference attendees. The hotel’s cost of providing food and drink

Financial Management for Hospitality Decision Makers
Hosp
italit
y, L
eisu
re &
Tou
rism
Ser
ies
during the day is £7 per attendee. In addition, preparing the conference materialswould cost the hotel £6 per attendee. The university has estimated that theconference will be attended by between 80 and 120 people.
Required • • •(a) What is the total average cost per attendee if the conference has an attendance
of 80 people?(b) What is the total average cost per attendee if the conference has an attendance
of 120 people?(c) Explain why the cost per attendee is affected by the number of people that attend
the conference.(d) If 120 people attend the conference and the hotel wants to earn a profit of 20%
on revenue, what price per person should be charged?(e) There are several other local hotels that provide conference facilities. The
university, which holds several conferences per year, has always used a venueprovided by MerryWeather’s main competitor. MerryWeather’s conferencemanager is exceedingly keen to develop a working relationship with theUniversity and has received permission from the General Manager to provide avery aggressively priced quote to the University. To help in his deliberations onthis matter, the conference manager has approached MerryWeather’s accountingdepartment and asked them to determine what is the lowest price that can becharged per attendee without the conference adversely affecting this year’s hotelprofit. If you were an accountant at MerryWeather, what advice would you give tothe conference manager?
✓ 6.3 Darwin’s HighFlyer Hotel has spare laundry capacity and is considering offering alaundry service to the Luigi Brothers who own three Italian restaurants. To aiddeliberations concerned with what rate should be quoted when offering the service,the Laundry Manager has asked for your assistance in analysing the Laundrydepartment’s fixed and variable costs.
From her departmental records, the laundry manager has extracted the followingschedule of cost information.
Month Laundry costs$
Kilograms of laundryprocessed
July 22,000 20,000August 21,600 19,500September 21,800 19,750October 20,800 18,500November 20,720 18,400December 20,400 18,000
Required • • •(a) Use the high–low method to determine the laundry department’s fixed and
variable cost structures.(b) Provide an estimate of the total cost if 25,000 kilograms of laundry were
processed in a month.
96

Cost management issues
Hosp
italit
y, L
eisu
re &
Tou
rism
Ser
ies
6.4 Hawaii’s SurfingViews Hotel has three selling departments: rooms, restaurants andbars. Some of SurfingViews’ indirect operating expenses are allocated to the threedepartments in the following manner.
Indirect expense Allocation basis Total expense to be allocated
Rent Floor space $90,000Advertising Sales $20,000Depreciation Net book value of assets $45,000Personnel department Salaries and wages $100,000
The hotel’s accountant has collected the following information in connection with thehotel’s indirect cost allocation exercise.
Rooms Restaurants Bars
Floor space in square metres 350 100 50Sales $1,150,000 $250,000 $100,000Net book value of fixed assets $900,000 $200,000 $100,000Salaries and wages $250,000 $210,000 $40,000
Required • • •Calculate the amount of indirect expense to be allocated to each department.
6.5 The Santa Fe is a Californian hotel with three revenue-generating departments. Oneof these is a foyer shop that has recorded a loss in each of the last three years. In themost recent year, the shop’s profit performance schedule was as follows.
$
Sales 300,000Cost of goods sold 185,000Gross profit 115,000Other expenses 126,000Net loss (11,000)
Included in other expenses is an allocated hotel electricity expense of $7,500. Thisoverhead is allocated to the shop according to a complicated formula that recognizesfloor space as well as the hours that the shop is open. Of the $7,500 allocated, it isestimated that if the shop were to close, $3,000 in electricity would be saved. Theother expenses also include $12,000 of allocated overheads pertaining to rent of thebuilding and also maintenance of the hotel’s physical infrastructure. All of theremaining ‘other expenses’ are directly traceable to the shop and would be eliminatedif the shop were to close.
Required • • •Prepare a financial analysis that demonstrates whether the shop should be closed.
97
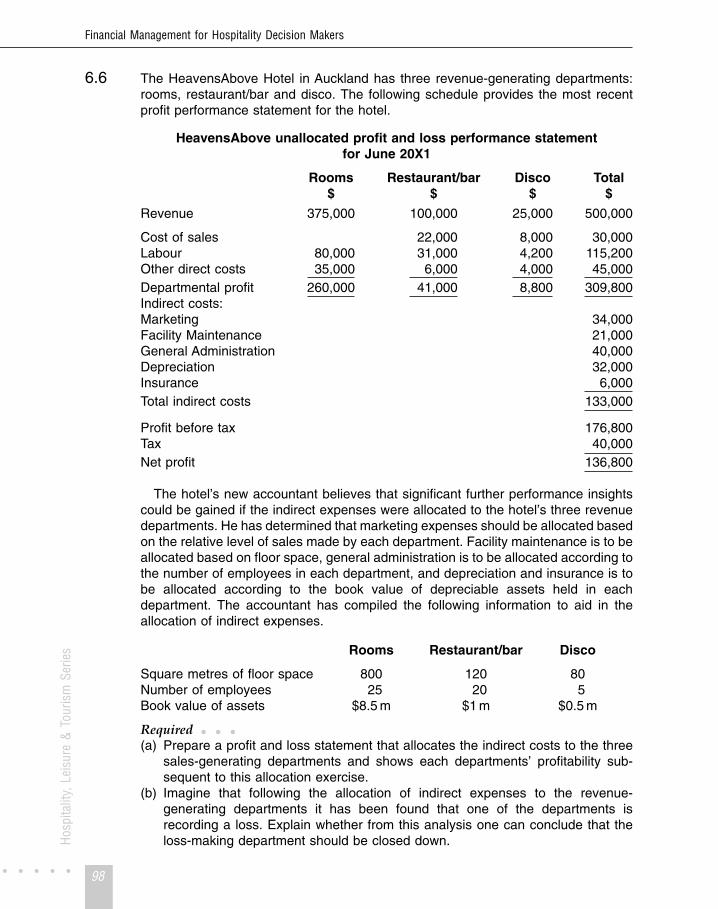
Financial Management for Hospitality Decision Makers
Hosp
italit
y, L
eisu
re &
Tou
rism
Ser
ies
6.6 The HeavensAbove Hotel in Auckland has three revenue-generating departments:rooms, restaurant/bar and disco. The following schedule provides the most recentprofit performance statement for the hotel.
HeavensAbove unallocated profit and loss performance statementfor June 20X1
Rooms$
Restaurant/bar$
Disco$
Total$
Revenue 375,000 100,000 25,000 500,000
Cost of sales 22,000 8,000 30,000Labour 80,000 31,000 4,200 115,200Other direct costs 35,000 6,000 4,000 45,000Departmental profit 260,000 41,000 8,800 309,800Indirect costs:Marketing 34,000Facility Maintenance 21,000General Administration 40,000Depreciation 32,000Insurance 6,000Total indirect costs 133,000
Profit before tax 176,800Tax 40,000Net profit 136,800
The hotel’s new accountant believes that significant further performance insightscould be gained if the indirect expenses were allocated to the hotel’s three revenuedepartments. He has determined that marketing expenses should be allocated basedon the relative level of sales made by each department. Facility maintenance is to beallocated based on floor space, general administration is to be allocated according tothe number of employees in each department, and depreciation and insurance is tobe allocated according to the book value of depreciable assets held in eachdepartment. The accountant has compiled the following information to aid in theallocation of indirect expenses.
Rooms Restaurant/bar Disco
Square metres of floor space 800 120 80Number of employees 25 20 5Book value of assets $8.5 m $1 m $0.5 m
Required • • •(a) Prepare a profit and loss statement that allocates the indirect costs to the three
sales-generating departments and shows each departments’ profitability sub-sequent to this allocation exercise.
(b) Imagine that following the allocation of indirect expenses to the revenue-generating departments it has been found that one of the departments isrecording a loss. Explain whether from this analysis one can conclude that theloss-making department should be closed down.
98

Cost management issues
Hosp
italit
y, L
eisu
re &
Tou
rism
Ser
ies
6.7 The General Manager of Nova Scotia’s Trenton Hotel is concerned that in Januaryand February her hotel is running at a loss. She has decided to hold a seniormanagement meeting to consider whether the hotel should be closed during thesetwo months. Prior to the meeting she has asked the chief accountant to prepare ananalysis of profit that compares the hotel’s performance in January and February withthe performance in the remainder of the year. The accountant has produced thefollowing schedule.
Trenton Hotel – profit performance
January–February$
March–December$
Total$
Revenue 8,000 150,000 158,000Cost of sales 2,000 37,500 39,500Gross profit 6,000 112,500 118,500Other expenses
Salaries & Wages 6,800 45,000 51,800Electricity 340 6,000 6,340Advertising 800 4,000 4,800Maintenance 300 1,600 1,900Depreciation 7,000 35,000 42,000Insurance 200 1,000 1,200
Total expenses 15,440 92,600 108,040Net profit (loss) (9,440) 19,900 10,460
In addition, the accountant has produced the following information pertaining to theproposed two-month closure.
Salaries and Wages: $3,000 of this cost is fixed per month as it relates to long-term salaried staff.
Electricity: Even if closed, $50 of electricity would be used per month.
Advertising: The hotel has been conducting advertising that costs $400per month. The cost of two months’ advertising would besaved if closed for January and February.
Maintenance: It is estimated that $200 of maintenance would be saved ifthe hotel closed for two months.
Depreciation: The accountant applies depreciation on a time basis, i.e.20% per annum depreciation is being charged on thehotel’s assets that have a gross book value of $210,000.
Insurance: If closed, the hotel would save $40 per month ininsurance.
Required • • •Prepare an analysis that shows the financial implication of closing the hotel forJanuary and February.
99

C H A P T E R• • • • 7
Cost–volume–profit analysis
L e a r n i n g o b j e c t i v e sAfter studying this chapter, you should havedeveloped an appreciation of:
1 What is meant by ‘contribution margin’ and‘contribution margin ratio’
2 The benefits that derive from using the contributionmargin format when preparing a profit and lossstatement
3 How breakeven can be determined
4 How the level of sales required to achieve abefore- or after- tax target profit can bedetermined.

Cost–volume–profit analysis
Hosp
italit
y, L
eisu
re &
Tou
rism
Ser
ies
IntroductionWhen considering a decision to enter a new commercial activity (e.g. open arestaurant), questions frequently posed by managers include: ‘How many units willwe need to sell in order to break even?’ and ‘How much will we need to sell in orderto achieve our target profit level?’ Other questions that sometimes arise inconnection with existing activities include: ‘What will happen to profit if we manageto increase sales volume by 10%?’ and ‘If we increase advertising by 15%, how muchmore would we have to sell in order to maintain our current level of profit?’ Thischapter outlines an analytical approach that will enable you to answer these typesof questions. This approach is generally referred to as ‘cost–volume–profit’ (CVP)analysis.
Contribution marginThe primary focus in CVP analysis concerns projecting future levels of profitability.Projecting profit requires an understanding of how much costs and profits willfluctuate following a change in sales volume. The conventional profit and lossstatement, such as that presented as Exhibit 7.1, is unfortunately not well designedto support such an analysis.
When a profit and loss statement is presented in this conventional format, costsare classified according to business function (e.g. administration, marketing, etc.).An alternative to this approach involves classifying costs according to whether theyare variable or fixed. Total revenue minus total variable costs is generally referred toas ‘contribution margin’. Accordingly, a profit and loss statement that distinguishesbetween variable and fixed costs is generally described as presented in acontribution margin format. DapperDrake’s profit and loss statement for the periodending 30 June 20X1 is restated using the contribution margin format in Exhibit 7.2.
101
Exhibit 7.1The DapperDrake Resort Profit and loss statement for the year ending 30 June20X1 (conventional format)
$ Percentage
Sales revenue 2,000,000 100less Cost of sales 300,000 15
Gross Profit 1,700,000 85Operating expenses
Administration 400,000 20Marketing 380,000 19Human resources 120,000 6Engineering 260,000 13Financial expenses 220,000 11Other 100,000 5
1,480,000 74
Net Profit 220,000 11

Financial Management for Hospitality Decision Makers
Hosp
italit
y, L
eisu
re &
Tou
rism
Ser
ies
Note that the only difference between the two statements is the cost classificationsused. The revenue and the net profit figures are the same in the two statements.
The advantage of the contribution margin layout is that it highlights whatproportion of revenue is consumed by variable costs. In the case of DapperDrake,this is 25% (i.e. variable cost of sales comprise 15% of revenue, and variableoperating expenses comprise 10% of revenue). It is important to recognize thatbecause variable costs move in line with revenue, this relationship is constant. Byimplication, as 25% of DapperDrake’s sales revenue is consumed by variable costs,75% of its sales revenue remains as a contribution towards covering fixed costs. Oncerevenue achieves a level that is sufficient to cover all fixed costs, additional sales willcontribute to the earning of profit. As the contribution is 75% of revenue, once fixedcosts are covered, profit will accumulate at the rate of 75% of every additional dollarof sales. Note the use of the words ‘contribution’ and ‘contribute’ in the previous twosentences. This highlights why the term ‘contribution margin’ is used when referringto sales revenue minus variable costs. ‘Contribution margin ratio’ refers to thepercentage of sales that is not consumed by variable costs. It is found as follows:
Contribution margin ratio = Contribution margin ÷ Revenue × 100
DapperDrake’s contribution margin ratio is:
$1,500,000 ÷ $2,000,000 × 100 = 75%
The contribution margin format is useful as it enables us to quickly answer questionssuch as ‘What will happen to DapperDrake’s profit if revenue increases by$200,000?’. As DapperDrake’s contribution margin ratio is 75%, we know thatincreased revenue of $200,000 will add $150,000 (0.75 × $200,000) to profit. Viewedslightly differently, as revenue and variable costs move in tandem, a 10% increase in
102
Exhibit 7.2The DapperDrake Resort Profit and loss statement for the year ending 30 June20X1 (contribution margin layout)
$ Percentage
Sales revenue 2,000,000 100.0Variable costs
Variable cost of sales 300,000 15.0Variable operating expenses 200,000 10.0
Contribution margin 1,500,000 75.0Fixed costs
Administration 380,000 19.0Marketing 350,000 17.5Human resources 70,000 3.5Engineering 210,000 10.5Financial expenses 220,000 11.0Other 50,000 2.5
1,280,000 64.0
Net Profit 220,000 11.0
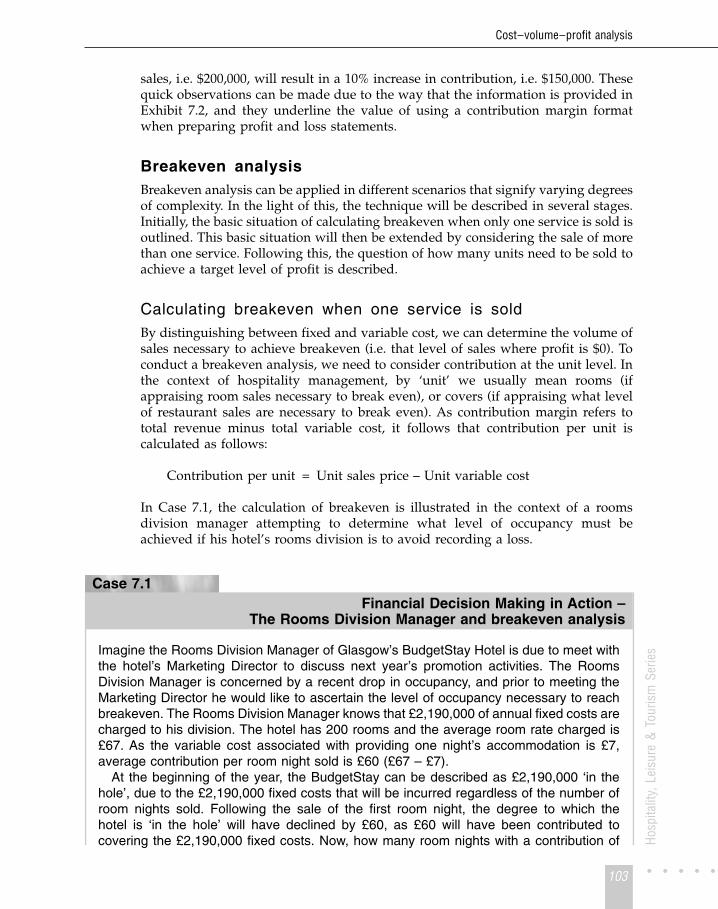
Cost–volume–profit analysis
Hosp
italit
y, L
eisu
re &
Tou
rism
Ser
ies
sales, i.e. $200,000, will result in a 10% increase in contribution, i.e. $150,000. Thesequick observations can be made due to the way that the information is provided inExhibit 7.2, and they underline the value of using a contribution margin formatwhen preparing profit and loss statements.
Breakeven analysisBreakeven analysis can be applied in different scenarios that signify varying degreesof complexity. In the light of this, the technique will be described in several stages.Initially, the basic situation of calculating breakeven when only one service is sold isoutlined. This basic situation will then be extended by considering the sale of morethan one service. Following this, the question of how many units need to be sold toachieve a target level of profit is described.
Calculating breakeven when one service is soldBy distinguishing between fixed and variable cost, we can determine the volume ofsales necessary to achieve breakeven (i.e. that level of sales where profit is $0). Toconduct a breakeven analysis, we need to consider contribution at the unit level. Inthe context of hospitality management, by ‘unit’ we usually mean rooms (ifappraising room sales necessary to break even), or covers (if appraising what levelof restaurant sales are necessary to break even). As contribution margin refers tototal revenue minus total variable cost, it follows that contribution per unit iscalculated as follows:
Contribution per unit = Unit sales price – Unit variable cost
In Case 7.1, the calculation of breakeven is illustrated in the context of a roomsdivision manager attempting to determine what level of occupancy must beachieved if his hotel’s rooms division is to avoid recording a loss.
Case 7.1Financial Decision Making in Action –
The Rooms Division Manager and breakeven analysis
Imagine the Rooms Division Manager of Glasgow’s BudgetStay Hotel is due to meet withthe hotel’s Marketing Director to discuss next year’s promotion activities. The RoomsDivision Manager is concerned by a recent drop in occupancy, and prior to meeting theMarketing Director he would like to ascertain the level of occupancy necessary to reachbreakeven. The Rooms Division Manager knows that £2,190,000 of annual fixed costs arecharged to his division. The hotel has 200 rooms and the average room rate charged is£67. As the variable cost associated with providing one night’s accommodation is £7,average contribution per room night sold is £60 (£67 – £7).
At the beginning of the year, the BudgetStay can be described as £2,190,000 ‘in thehole’, due to the £2,190,000 fixed costs that will be incurred regardless of the number ofroom nights sold. Following the sale of the first room night, the degree to which thehotel is ‘in the hole’ will have declined by £60, as £60 will have been contributed tocovering the £2,190,000 fixed costs. Now, how many room nights with a contribution of
103

Financial Management for Hospitality Decision Makers
Hosp
italit
y, L
eisu
re &
Tou
rism
Ser
ies
£60 have to be sold to cover all the hotel’s £2,190,000 annual fixed costs? As 36,500contributions of £60 provide £2,190,000 (i.e. £2,190,000 ÷ £60), we can conclude thatonce the BudgetStay sells 36,500 rooms, it will have achieved breakeven. This line of logichas taken us through the following widely quoted formula for determining breakeven:
Breakeven number of units to be sold = Fixed costs ÷ Contribution per unit
BudgetStay’s breakeven point of 36,500 rooms sold per annum can also be stated interms of the occupancy level required to achieve breakeven. If the hotel is open for 365days per annum, it would have 73,000 room nights available per annum (365 days ×200 rooms). 36,500 rooms represents 50% of BudgetStay’s annual available roomnights (36,500 ÷ 73,000 × 100). We can therefore conclude that an occupancy rate of50% will result in BudgetStay achieving breakeven. The occupancy breakeven formulacan be stated as:
Number of room sales necessary for breakeven ÷ Room nights available × 100
If the Rooms Division Manager develops a basic grasp of breakeven, he will quicklyrecognize that the breakeven level of room sales would be lowered if he can achieve anyof the following:
� Increase the average room rate above £67� Reduce the variable costs per room night sold below £7� Reduce the level of fixed costs below £2,190,000.
Exhibit 7.3 presents a graphical representation of breakeven. In this graph, salesactivity is shown on the horizontal axis with dollars on the vertical axis. If we drawin the total sales revenue line and also the total cost line for all levels of activity, wecan determine the breakeven level of sales. As breakeven occurs at that activity levelwhere total cost equals total sales, breakeven is represented by the point where thesales and total cost lines intersect. In the graph, this breakeven point is highlightedby the vertical dotted line. Any level of sales to the right of the dotted line will resultin a profit. Any level of sales to the left of the line will result in a loss. Some managersfind that breakeven graphs represent useful visual aids to considering the profitimplications of different levels of sale activity.
One further extension to the basic breakeven analysis that some managers finduseful concerns the safety margin concept. This concept arises when managers raisethe question ‘By how many sales are we surpassing breakeven?’ Alternatively, amanager might ask ‘How much could our level of occupancy decline before wewould record a loss?’ Calculation of safety margin is illustrated in Box 7.1.
Calculating breakeven when more than one service is soldFinding breakeven when more than one service is sold will be considered initially ina scenario of a hotel selling two types of room with different contribution margins.Following this, the case of different contribution levels arising from two differentroom types and also restaurant sales is explored.
In Box 7.2 an approach to calculating breakeven when selling two services isoutlined.
104

$
Units sold
Fixed costs
Total variable costs
Total costs
Sales revenue
Loss
Profit
Breakeven point
Cost–volume–profit analysis
Hosp
italit
y, L
eisu
re &
Tou
rism
Ser
ies
105
Exhibit 7.3Graphing breakeven
Box 7.1Calculating safety margin
To illustrate how the safety margin can be calculated, let us continue with the BudgetStaybreakeven scenario developed in the earlier financial decision-making case. Imagine thatBudgetStay has current annual sales revenue of £3,668,250. We have already determined thatBudgetStay must sell 36,500 rooms to break even, i.e. revenue must be £2,445,500 (36,500 ×£67). Annual sales could therefore fall by £1,222,750 (£3,668,250 – £2,445,500) before thehotel would incur a loss. £1,222,750 of sales represents 18,250 room nights (£1,222,750 ÷£67). As a result, we can also state that annual room nights sold could fall by 18,250, or 25%of occupancy (18,250 ÷ 73,000 × 100), before the hotel enters loss-making levels of salesactivity.
Following this rationale, it can be seen that margin of safety can be stated in any of thefollowing ways:
Margin of safety in £ sales = Current £ sales – £ sales required to break even.
Margin of safety in unit sales = Current unit sales – unit sales required to break even
% occupancy safety margin = Current occupancy % – occupancy % required to breakeven.

Financial Management for Hospitality Decision Makers
Hosp
italit
y, L
eisu
re &
Tou
rism
Ser
ies
106
Box 7.2Calculating breakeven: the case of two room types with differentcontribution margins
Assume that BudgetStay’s sister hotel, the BudgetRest, is in Toronto and has 110 single and90 double rooms. Past experience indicates that sales occur in the ratio of 4 single room salesfor every 3 double room sales. BudgetRest’s single rooms sell for an average of $67 per nightand a $7 variable cost is incurred cleaning the rooms. The double rooms have an average rateof $86 and cost $9 to clean. BudgetRest has annual fixed costs of $2,072,400.
As with the BudgetStay example, we commence the calculation of breakeven by determiningthe contribution earned from a room sale:
BudgetRest’s contribution earned per single room night sold = $67 – $7 = $60.
BudgetRest’s contribution earned per double room night sold = $86 – $9 = $77
One way of dealing with the fact that BudgetRest sells two types of room that earn differingcontribution levels involves viewing the hotel as selling packages. In light of the mix of roomssold in the past, we will view each package as comprising 4 single room sales and 3 doubleroom sales. We now determine the contribution earned from selling one package:
Contribution from sale of 1 package =
Contribution from 4 single rooms + Contribution from 3 double rooms =
(4 × $60) + (3 × $77) = $240 + $231 = $471.
Now, using the basic breakeven formula, we can determine how many packages need to besold to break even:
Breakeven in packages = Fixed costs ÷ Contribution per package
� BudgetRest’s breakeven in packages = $2,072,400 ÷ $471 = 4,400
As BudgetRest has to sell 4,400 packages to break even, and each package comprises 4single rooms and 3 double rooms, we can conclude that the hotel must sell 17,600 singleroom nights per annum (4,400 × 4) and 13,200 double room nights per annum (4,400 × 3) inorder to break even. The accuracy of this breakeven solution can be verified by checkingwhether this level of sales results in a zero level of profit.
Check to see if breakeven solution is correct:
Contribution from single room sales: 17,600 × ($67 – $7) $1,056,000Contribution from double room sales: 13,200 × ($86 – $9) $1,016,400
Total Contribution $2,072,400less Fixed costs $2,072,400
Profit $0
As profit is $0 when 17,600 singles and 13,200 doubles are sold, this representsbreakeven.

Cost–volume–profit analysis
Hosp
italit
y, L
eisu
re &
Tou
rism
Ser
ies
The case of two room types as well as restaurant sales • • •Some readers will have found the computation in Box 7.2 somewhat challenging.Unfortunately, in this sub-section the breakeven analysis becomes still morecomplicated, as we introduce a further dimension. For some this might represent onestraw too many, and enough to break the camel’s back. The task becomes easier,however, if you remember to view sales as comprising packages that consist of morethan one type of room and, in this case, restaurant meals as well.
We will illustrate an approach that can be taken to determine breakeven whencontribution is earned from two types of room as well as restaurant sales byextending the BudgetRest scenario developed in Box 7.2. Assume that BudgetRest’smanagement is considering converting an under-utilized lounge area into a facilitythat will provide buffet breakfasts. It has been estimated that breakfasts will have anaverage selling price of $8 and an average variable cost of $3. It has also beenestimated that the provision of breakfasts will increase the hotel’s annual fixed costsby $416,170 to $2,488,570. The existing ratio of single to double room sales isexpected to continue. All double room sales result in two guests and it is estimatedthat 20% of these guests will purchase a breakfast. Single room sales are only madeto individuals and it is estimated that 50% of single room guests will eat breakfastat the new facility.
The total contribution earned for each single room night sold now has to include50% of the $5 contribution earned per breakfast sold, as 50% of single guests will eattheir breakfast at the restaurant. Accordingly, total contribution per single room canbe calculated as follows:
($67 – $7) + (0.5 × $5) = $60 + $2.5 = $62.5
The total contribution earned for each double room night sold now has to include20% of the contribution earned from two breakfasts as 20% of double room nightsales will result in two breakfasts sold. Accordingly, total contribution per doubleroom can be calculated as follows:
($86 – $9) + (0.2 × 2 × $5) = $77 + $2 = $79
As rooms are sold in the ratio of 4 singles for every 3 doubles, we will again refer tounits as packages. As before, each package is viewed as comprising 4 single roomnights and 3 double room nights.
Contribution earned from sale of a package =(4 × $62.5) + (3 × $79) = $250 + $237 = $487
Number of packages to be sold to break even =Fixed costs ÷ contribution per package = $2,488,570 ÷ $487 = 5,110
As each package comprises 4 single rooms and 3 double rooms, 5,110 packagescomprise 20,440 single rooms (5,110 × 4) and 15,330 double rooms (5,110 × 3).
� Need to sell 20,440 single rooms and 15,330 doubles in order to break even.
107

Financial Management for Hospitality Decision Makers
Hosp
italit
y, L
eisu
re &
Tou
rism
Ser
ies
Box 7.3 Determining the sales necessary to achieve a targeted profit
To illustrate how to calculate the sales level necessary to achieve a targeted before-tax profit,let us return to the basic breakeven scenario outlined in Case 7.1. Recall that the BudgetStayHotel had annual fixed costs of £2,190,000, and offered one type of room. The average roomrate was £67 and a variable cost of £7 was incurred for each room night sold. Now imaginethat BudgetStay’s management wants to determine how many room sales are necessary toachieve an annual profit of £328,500.
If you were able to grasp the rationale for the approach taken in the basic breakevensituation, understanding how we determine the level of sales necessary to achieve a targetprofit will be relatively straightforward. In the breakeven formula, we found that 36,500 £60room night contributions were necessary to cover the fixed cost of £2,190,000. Now we areconcerned with not only covering £2,190,000 of fixed costs, we must also generate enoughsales to provide £328,500 profit. We could determine that beyond the breakeven point, afurther 5,475 room nights would have to be sold (i.e. £328,500 ÷ £60). Alternatively, we canfind the sales required to achieve the profit target by simply adding £328,500 to the fixed costsin the breakeven formula. Accordingly, the target profit formula can be stated as:
(Fixed cost + Target profit) ÷ Contribution per unit
Applying this formula to the BudgetStay scenario we find:
Room sales to achieve £328,500 profit = (£2,190,000 + £328,500) ÷ £60 = 41,975
Now imagine that BudgetStay revised its £328,500 before-tax profit target to a £328,500after-tax profit target, and that the hotel is subject to 40% tax. Note that until now we havebeen dealing exclusively with before-tax amounts. The easiest way to deal with an after-taxamount is to convert it to its before-tax equivalent. If a 40% tax applies, £100 before tax isequivalent to £60 after tax, i.e. £100 (1 – 0.4). As we multiply by ‘1 – tax rate’ to convert abefore-tax amount to its after-tax equivalent, we divide by ‘1 – tax rate’ when reversing theconversion. Accordingly, £60 after tax is equivalent to £100 before tax, i.e. £60 ÷ (1 – 0.4).We can incorporate this line of logic to the target profit formula to develop the followingformula for finding the level of sales necessary to achieve a targeted after-tax profit:
Fixed costs + (After-tax target profit ÷ ‘1 – tax rate’)
Contribution per unit
Applying this formula to the BudgetStay example, we find that room sales necessary togenerate an after-tax profit of £328,500 =
£2,190,000 + [£328,500 ÷ (1 – 0.4)]
£60= (£2,190,000 + £547,500) ÷ £60 = 45,625 rooms
108
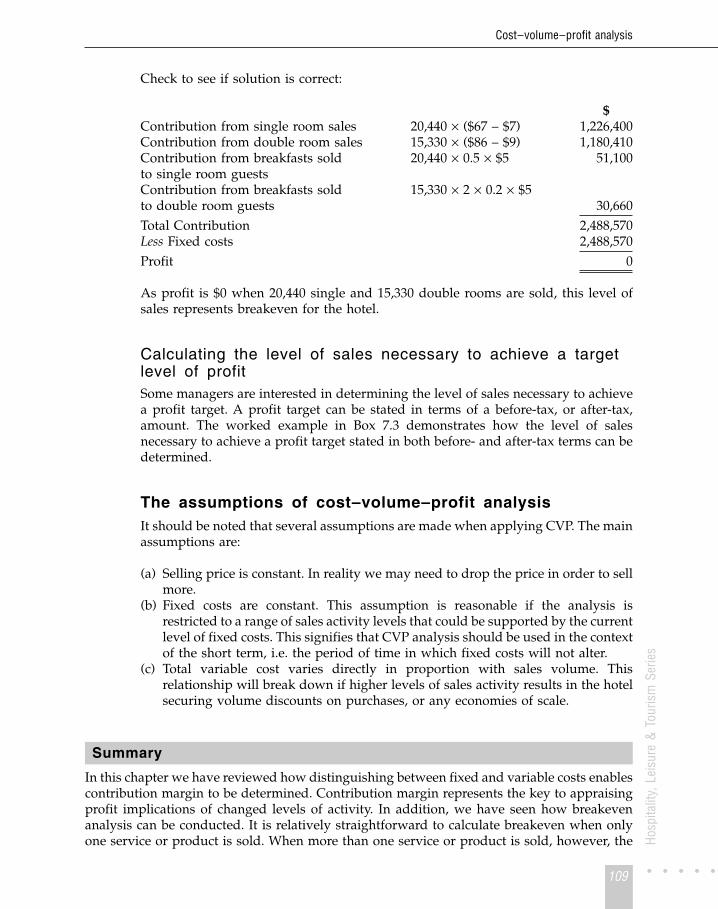
Cost–volume–profit analysis
Hosp
italit
y, L
eisu
re &
Tou
rism
Ser
ies
Check to see if solution is correct:
$Contribution from single room sales 20,440 × ($67 – $7) 1,226,400Contribution from double room sales 15,330 × ($86 – $9) 1,180,410Contribution from breakfasts soldto single room guests
20,440 × 0.5 × $5 51,100
Contribution from breakfasts sold 15,330 × 2 × 0.2 × $5to double room guests 30,660Total Contribution 2,488,570Less Fixed costs 2,488,570Profit 0
As profit is $0 when 20,440 single and 15,330 double rooms are sold, this level ofsales represents breakeven for the hotel.
Calculating the level of sales necessary to achieve a targetlevel of profitSome managers are interested in determining the level of sales necessary to achievea profit target. A profit target can be stated in terms of a before-tax, or after-tax,amount. The worked example in Box 7.3 demonstrates how the level of salesnecessary to achieve a profit target stated in both before- and after-tax terms can bedetermined.
The assumptions of cost–volume–profit analysisIt should be noted that several assumptions are made when applying CVP. The mainassumptions are:
(a) Selling price is constant. In reality we may need to drop the price in order to sellmore.
(b) Fixed costs are constant. This assumption is reasonable if the analysis isrestricted to a range of sales activity levels that could be supported by the currentlevel of fixed costs. This signifies that CVP analysis should be used in the contextof the short term, i.e. the period of time in which fixed costs will not alter.
(c) Total variable cost varies directly in proportion with sales volume. Thisrelationship will break down if higher levels of sales activity results in the hotelsecuring volume discounts on purchases, or any economies of scale.
Summary
In this chapter we have reviewed how distinguishing between fixed and variable costs enablescontribution margin to be determined. Contribution margin represents the key to appraisingprofit implications of changed levels of activity. In addition, we have seen how breakevenanalysis can be conducted. It is relatively straightforward to calculate breakeven when onlyone service or product is sold. When more than one service or product is sold, however, the
109

Financial Management for Hospitality Decision Makers
Hosp
italit
y, L
eisu
re &
Tou
rism
Ser
ies
analysis becomes more challenging. We have also seen how to determine the volume of salesnecessary to achieve a before- or after-tax target profit level.
Having read the chapter you should now know:
� How to compute contribution margin and also the contribution margin ratio associatedwith the sale of a particular product or service
� How to present a profit and loss statement using the contribution margin layout� How to compute breakeven when one or more products and services are sold� How to determine the level of sales necessary to achieve a before- or after-tax profit target.
References
Atkinson, H., Berry, A. and Jarvis, R. (1995) Business Accounting for Hospitality andTourism & Leisure, International Thomson Publishing, London, Chapter 13.
Carnegie, G., Jones, S., Norris, G., Wigg, R. and Williams, B. (1999) Accounting:Financial and Organisational Decision Making, Irwin/McGraw-Hill, New YorkChapter 25.
Coltman, M. M. and Jagels, M. G. (2001) Hospitality Management Accounting, 7thedition, John Wiley, Chichester, Chapter 8.
Harris, P. (1999) Profit Planning, Butterworth-Heinemann, Oxford, Chapter 5.Kotas, R. (1999) Management Accounting for Hospitality and Tourism, 3rd edition,
International Thomson Publishing, London, Chapter 4.Kotas, R. and Conlan, M. (1997) Hospitality Accounting, 5th edition, International
Thomson Publishing, London, Chapter 18.Owen, G. (1994) Accounting for Hospitality, Tourism & Leisure, Pitman Publishing,
London, Chapter 13.Schmidgall, R. F. (1997) Hospitality Industry Managerial Accounting, 4th edition,
Educational Institute – American Hotel & Motel Association, East Lansing, MI,Chapter 7.
Problems
✓ indicates that a solution appears at the back of the text
✓ 7.1 (a) Describe the benefits that derive from preparing a profit and loss statement usingthe contribution margin format.
(b) In what ways might a manager use cost–volume–profit analysis?
✓ 7.2 Paul Hulse, the owner of the Hulsey Restaurant in West Auckland, recently attendeda management training seminar in which he was shown the benefits of using thecontribution format to prepare profit and loss statements. He now wants to see hisrestaurant’s profit and loss statement prepared using the contribution margin format.In the year ending 31 December 20X1, the restaurant sold 20,000 covers with anaverage cover price of $25. Variable food and drink costs average $5 per cover andthe head chef’s salary includes a performance-related component giving him acommission of $0.8 per cover sold. All the hotel’s remaining costs can be viewed asfixed. The restaurant’s profit and loss statement presented in conventional format forthe year ended 31 December 20X1 is as follows:
110

Cost–volume–profit analysis
Hosp
italit
y, L
eisu
re &
Tou
rism
Ser
ies
The Hulsey RestaurantProfit and Loss statement
for the year ending 31 December 20X1
$
Sales revenue 500,000less Cost of sales 100,000
Gross Profit 400,000Operating expenses
Salaries and wages 160,000Marketing 10,000Rent 48,000Maintenance 5,000Other 10,000
Total operating expenses 233,000
Net Profit 167,000
Required • • •(a) Using the contribution margin format, prepare the Hulsey Restaurant’s profit and
loss statement for the year ending 31 December 20X1.(b) What is the restaurant’s current breakeven point?(c) If the volume of sales were to increase by 10%, by how much would the
restaurant’s profit increase?(d) If revenue next year reached $600,000, what would the restaurant’s profit be?(e) If the restaurant were to increase average menu prices by 10% but was able to
maintain the current volume of covers sold, what would be the impact onprofit?
✓ 7.3 A 60-room hotel near Land’s End in Cornwall incurs annual fixed costs of £360,000.The hotel is open for 365 nights in the year and charges an average room rate of £68.The variable costs associated with room occupancy are £8 per room night.
Required • • •(a) At what room occupancy level would the hotel break even?(b) At what level of sales would the hotel make a before-tax profit of £60,000?(c) If the hotel pays 40% tax, how many rooms must be sold in order to make an
after-tax profit of £72,000?
7.4 Tim Stokes recently invested $325,000 to acquire the RockOyster, a restaurant onVancouver Island. RockOyster meals sell for an average of $30 and the averagevariable cost per meal is $8. Tim believes that by reducing newspaper advertising, hecan reduce fixed costs by 10% from their current level of $12,000 per annum. Otherfixed costs amount to $100,000 per annum.
(a) What will be the restaurant’s breakeven level of sales in units and dollarssubsequent to the reduced advertising?
(b) Assuming the reduced level of advertising, determine how many meals must besold if Tim wants to earn a 20% after-tax annual rate of return on his investment.Assume the restaurant’s profits are subject to a 35% tax rate.
111

Financial Management for Hospitality Decision Makers
Hosp
italit
y, L
eisu
re &
Tou
rism
Ser
ies
7.5 Vermont’s PineCrest hotel has a restaurant and 90 double rooms and 60 singlerooms. The average room rate for double rooms is $88 and the variable cost perdouble room night sold is $8. Single room nights sell for $56 and the variable cost persingle room night sold is $6. The average occupancy for both types of room is 70%.The hotel has annual fixed costs of $1,998,000.
Past records indicate the following:
� 90% of guests staying in single rooms purchase breakfast in the hotel’s restaurant,and 50% of single guests buy their dinner in the restaurant.
� 70% of guests staying in double rooms purchase breakfast in the hotel’srestaurant, and 30% of double room guests buy their dinner in the restaurant.
� The average contribution per breakfast cover sold is $8 and the averagecontribution per dinner sold is $20. The restaurant serves only hotel guests.
� For every 3 double rooms sold, 2 single rooms are sold.� A double room sale signifies two guests and a single room sale signifies one
guest.
Required • • •(a) What is the volume of double room and single room sales that must be achieved
in order for the hotel to break even (assume the 3 double rooms to 2 single roomsratio is maintained)?
(b) What is the hotel’s current level of profit? Assume the hotel is open for 365 daysper year.
7.6 Mercury Hotel, a large hotel complex that operates a divisionalized managementstructure, is located in South East Queensland, Australia. The director of accom-modation has been called into the marketing director’s office. The marketing directortells the director of accommodation that he has just been approached by a Japanesetour operator who is looking to book accommodation in a South East Queenslandhotel for 800 guests. All guests would stay in double rooms for one of fourconsecutive weeks (200 guests per week booked into 100 rooms). The four-weekperiod falls within the hotel’s quiet season. Consistent with its competitors, the hotelhas never sold more than 40% of its 300 double rooms at this time of the year.
Mercury’s accounting department has estimated that the full cost per double roomsold per week is $300 and that the variable cost is $180. A recent analysis of pastbehaviour of Japanese guests indicates that in the course of a one-week stay, eachguest will purchase, on average, 2 dinners and 3 breakfasts at one of the hotel’srestaurants. Average contribution per dinner cover is $25. Average contribution perbreakfast served is $7.
The marketing director has informed the director of accommodation that theJapanese tour operator knows the Queensland hotel market well and the fact that itis the quiet season. He also believes that the tour operator will be seeking quotesfrom other hotels to secure a low price.
Required • • •(a) As the director of accommodation, concerned with maximizing reported profit for
your department, what is the lowest conceivable weekly rate you would be willingto quote for a double room in the off-season?
(b) The marketing director has been charged with the responsibility of maximizingprofit of the entire hotel. What is the lowest price the marketing director should be
112

Cost–volume–profit analysis
Hosp
italit
y, L
eisu
re &
Tou
rism
Ser
ies
willing to accept, for a double room booked during an off-season week by a‘typical Japanese guest’?
(c) How could the accounting system be modified in order to motivate the director ofaccommodation to act in a manner consistent with the maximization of total hotelprofit and not just his own department’s profit?
7.7 Saturn Ltd, a large American hotel organization, has purchased a small roominghouse on a property adjacent to one of its main hotels. The acquisition was made witha view to demolishing much of the existing structure and building a custom-designedhealth club that could be used by hotel guests. Building of the new health club is notdue to start for at least a year.
Saturn has been approached by Reg Norman, a contact of the property’s vendor.Norman specializes in arranging golfing holidays. In keeping with the last 5 years,Norman wants to use the building for 30 weeks to house a particular niche market of‘economy golfers’. Norman says that he can provide between six and fifteen guestsper week. Under the proposed arrangement, Norman will pay Saturn $200 for eachguest provided with lodging and morning and evening meals for a week.
Saturn’s accountant has developed the following cost data which he believesrelevant to the decision of whether to accept Norman’s offer.
Weekly cost incurred by Saturn per guest:Food $70Electricity $6Laundry, cleaning etc. $10
Casual staff to provide cleaning and other services for 30 weeks:For 6 to 10 guests per week: $22,000For 11 to 15 guests per week: $34,000
Other incremental costs if building occupied for 30 weeks:Maintenance and security: $12,000
Required • • •(a) From Saturn’s perspective what is the breakeven number of guests per week?(b) Calculate the change to Saturn’s total profit if 10 guest rooms are sold per week
throughout the 30-week period.(c) Calculate the change to Saturn’s total profit if 12 guest rooms are sold per week
throughout the 30-week period.
113

C H A P T E R• • • • 8
Budgeting andresponsibility
accounting
L e a r n i n g o b j e c t i v e sAfter studying this chapter, you should havedeveloped an appreciation of:
1 How organizations are subdivided intoresponsibility centres
2 The four main types of responsibility centre
3 How to compute residual income as an alternativeto using ROI when measuring the performance ofan investment centre
4 The importance of budgeting
5 The organizational roles that are served bybudgeting
6 The behavioural implications of budgeting
7 How a purchases, production and labour budgetschedule can be prepared.

Budgeting and responsibility accounting
Hosp
italit
y, L
eisu
re &
Tou
rism
Ser
ies
Introduction
This chapter focuses on responsibility accounting and budgeting. The underlyingtheme of these two topics is organizational control. Responsibility accountinginvolves sub-dividing an organization into units of accountability. It is fundamentalto control as it involves holding managers accountable for the performance of theirrespective units. Closely associated with responsibility accounting is budgeting. Thisis because budgeting involves allocating resources to an organization’s sub-units. Inaddition, the budget highlights benchmarks that are used when appraising a unitmanager’s performance.
Budgeting is an exceedingly important yet challenging exercise as it requiresmanagers representing the full range of an organization’s activities to committhemselves to the same co-ordinated plan. Emmanuel et al. (1990) highlight thebudget’s importance in the following way:
Budgetary planning and control is the most visible use of accountinginformation in the management control process. By setting standards ofperformance and providing feedback by means of variance reports, theaccountant supplies much of the fundamental information required foroverall planning and control. (p.160)
The extent to which the budget provides information that is fundamental toplanning and control becomes particularly evident if you try to envisage a largeorganization without a budget. If a hotel had no budget, management would haveno sense of what they should be striving for in terms of sales, costs, cash flow, etc.Without a sense of what we are trying to achieve, we cannot pass judgement on theadequacy of our performance. It follows that the budget is a critically importantinstrument required for maintaining organizational control.
The importance of the budget is also apparent when we consider its all-encompassing nature. If a General Manager of a hotel were asked for a model ofwhat his organization will be doing over the next year, in responding he would mostlikely refer to the hotel’s budget. The budget’s comprehensive nature underlineshow it serves as a common point of reference for managers drawn from all levels andrepresenting all functions within the organization.
Just as each division’s profit and loss statement feeds into a comprehensive profitand loss statement for a company, so the budget comprises many schedules that feedinto an overarching schedule that is widely referred to as the master budget. Themaster budget comprises the hotel’s forecast profit and loss statement for theforthcoming period (typically a year), and also the forecast balance sheet at the endof the budgeted period. These statements do not provide sufficient detail whenseeking to control the hotel’s many different departments, however. We need abudgeted profit and loss statement for F&B (maybe broken down by restaurants andkitchens), a budgeted profit and loss statement for the rooms division, plus manyother budget schedules to facilitate planning and control of the range of activitiesundertaken in a large hotel (e.g. budget schedules relating to labour cost, foodpreparation, training, advertising, cash flow, etc.).
The remainder of this chapter is structured as follows. The next two sectionsdescribe issues associated with responsibility accounting and the four main types ofresponsibility centre found in organizations. From this overview of responsibility
115

HotelGeneralManager
DepartmentHead
Accountingand Finance
DepartmentHead Human
ResourceManagement
DepartmentHead
Food andBeverage
DepartmentHead
Engineering
DepartmentHead
Rooms
ManagerRestaurant A
ManagerRestaurant A
ManagerBars
ManagerBanqueting
Financial Management for Hospitality Decision Makers
Hosp
italit
y, L
eisu
re &
Tou
rism
Ser
ies
accounting, it will become apparent that the scope of a manager’s influence shoulddetermine what he or she can be held accountable for (many organizations get thisfundamental principle wrong). Following this, the different roles performed bybudgets and behavioural aspects of budgeting are described. In the final section, themanner in which production, purchases and labour cost budget schedules can beprepared is illustrated via a worked example.
Responsibility accountingThe term ‘responsibility centres’ is used when talking of an organization’s sub-units,as each unit is concerned with a particular aspect of an organization’s affairs and themanager (or management team) overseeing a sub-unit will be held responsible for itsperformance. Segmenting an organization into responsibility centres can beachieved on the basis of function, e.g. F&B, rooms, training, accounting, engineering,laundry, gardening, conference and banqueting, etc., or it can be geographicallybased, e.g. a senior manager in a large multinational hotel chain may be heldaccountable for the performance of hotels in a designated region of a country, awhole county or a region of the world. For the purposes of this chapter, we aremainly concerned with responsibility accounting issues arising within a single hotel.For this reason, we are primarily concerned with functional segmentation.
A hotel’s responsibility accounting system is inextricably linked to its organizationstructure. An example of how an organization structure is generally depictedappears as Figure 8.1. This extract of an organizational chart has been prepared fromthe perspective of the F&B department. You should note that that each of theresponsibility centres identified in the chart is focused on a particular activity.
Most responsibility centres consume inputs (e.g. labour and materials). Somewill produce outputs that can be measured monetarily and some will have anidentifiable asset base that represents invested capital. The relationship of inputs,
116
Figure 8.1 An example of a hotel’s organization chart

Inputs(i.e. the costof resources
used)
1.
Responsibilitycentre
Output(e.g. revenue
from goods andservices sold)
2.
Investedcapital
(i.e. workingcapital and
fixed assets)
3.
Budgeting and responsibility accounting
Hosp
italit
y, L
eisu
re &
Tou
rism
Ser
ies
outputs and assets to a responsibility centre is depicted in Figure 8.2. In this figureinputs and invested capital are depicted as flowing into the responsibility centre,and outputs are depicted as flowing out of the centre.
The distinction between inputs, outputs and assets is important. These threeaspects of accountability provide a checklist when determining a manager’s scope ofinfluence. If we can identify which of these three areas can be affected by aresponsibility centre’s manager (in many cases it is more than one), we candetermine what he or she should be held accountable for. Applying this approach todetermining scope of accountability results in four main types of responsibilitycentre:
1 Cost centres2 Revenue centres3 Profit centres4 Investment centres.
A cost centre refers to a responsibility centre where the scope of the manager’sinfluence is limited to inputs (i.e. cost as depicted by circle 1 in Figure 8.2). A revenuecentre is the term used for a responsibility centre where the scope of the manager’sinfluence is limited to outputs that can be monetarily measured (i.e. revenue asdepicted by circle 2 in Figure 8.2). A profit centre is the term used to describe aresponsibility centre where the manager’s influence spans both costs and revenues(i.e. circles 1 and 2 in Figure 8.2). Finally, an investment centre is the term used fora responsibility centre where the manager’s influence includes costs and revenues(i.e. profit) as well as the asset base employed to generate profit (i.e. all three circlesin Figure 8.2).
117
Figure 8.2 A responsibility centre and its dimensions of accountability

Cost CentreOne dimension of accountability (cost).
Widely used objective:cost containment
Revenue CentreOne dimension of accountability (revenue).
Widely used objective:revenue maximization
Profit CentreTwo dimensions of accountability (cost and revenue).
Widely used performance measure:contribution, operating profit, etc.
Investment CentreThree dimensions of accountability (cost, revenue and assets).
Widely used performance measure:ROI maximization
Financial Management for Hospitality Decision Makers
Hosp
italit
y, L
eisu
re &
Tou
rism
Ser
ies
In order to highlight their differing scope and degree of accountability, these fourgeneric types of responsibility centre are presented hierarchically in Figure 8.3. Inthis figure, cost centres and revenue centres appear at the lowest level, as each isaccountable for only one of the three dimensions of accountability depicted in Figure8.2. A profit centre appears at the intermediary level as it is accountable for two ofthe circles in Figure 8.2. Investment centres appear at the top of Figure 8.3 asmanagers of investment centres are accountable for all three dimensions ofaccountability.
Issues of cost, revenue, profit and investment centredesignThis section provides an overview of issues arising in connection with the design ofthese four generic types of responsibility centre. When reading this section, it isimportant to remember that a responsibility centre’s sphere of influence determineswhether it is a cost, revenue, profit or investment centre. We will see that someorganizational units lend themselves better to accounting control than others. Forexample, we will see that accounting is well equipped to monitor the efficiency ofroom servicing, it is not, however, well equipped to monitor the performance ofadministrative support departments such as the personnel, training or accountingdepartments of a hotel.
Cost centresThere are two main types of cost centre: engineered cost centres and discretionary costcentres. An engineered cost centre is a centre where an output can be quantitativelymeasured and there is a reasonably good understanding of the input/outputrelationship, i.e. the level of costs that should be incurred to achieve a specified level of
118
Figure 8.3 A hierarchical perspective of responsibility centres’ accountability

Budgeting and responsibility accounting
Hosp
italit
y, L
eisu
re &
Tou
rism
Ser
ies
output is known. Examples of engineered cost centres in hotels include housekeeping(the average cost of cleaning a room can be predetermined), and laundry (the cost ofprocessing a specified amount of laundry can be also predetermined). In adiscretionary cost centre, however, more subjective judgement must be exercisedwhen budgeting. For example, as training results in no readily measurable output,setting the training budget is bound to involve a high degree of discretion. How manyhours should be spent training a new staff member? Should recruiting the highestquality (expensive) trainers be given high priority? Considerable subjectivejudgement is bound to be invoked when answering these questions. Even if an outputis relatively measurable, a poor understanding of the input/output relationship willsignify high judgement exercised when determining the budgeted expenditure level.For example, in the case of a marketing department, the level of sales may well be seenas a reasonably objective measure of output, however as appreciation of the input/output relationship between advertising expenditure and sales revenue is weak(many factors such as competitor actions affect sales), budgeting for advertisingexpenditure is bound to involve a relatively high degree of discretion.
In discretionary cost centres, the primary role of the budget is to restrictexpenditure to a predetermined amount. This is a relatively incomplete form ofcontrol, however, as reference to the budget provides little insight as to whetherresources have been expended efficiently. Accordingly, a report comparing actualexpenditure to budgeted expenditure in a discretionary cost centre should be vieweddifferently from a report prepared for an engineered cost centre. When consideringthe performance of an engineered centre, efficiency (i.e. the ratio of inputs tooutputs) can be monitored. In a discretionary cost centre, however, if performancemeasurement places too much emphasis on cost minimization, the discretionary costcentre manager will simply reduce expenditure. Such reduced expenditure does notsignify improved efficiency or performance, however. For example, cuttingadvertising expenditure by half may well carry long-term adverse implications forthe whole organization.
Discretionary cost centres in hotels can be classified according to two main types:administrative centres and marketing centres. Administrative centres include alladministrative support centres such as human resources, legal, training andaccounting. The accounting system does not represent a strong tool to objectivelymeasure performance in such centres. A major problem when managing thesecentres concerns a potential for goal incongruence (i.e. the goal of the centre maysignificantly differ from the goal of the whole organization). An example of goalincongruence is where a department is seeking to expand in order to help it reach itsinternal goal of providing an excellent service, despite the fact that the benefits offurther expansion in the department do not exceed the costs. In this type of situationwe have empire building, i.e. expansion is for the benefit of the head of thedepartment, but not for the benefit of the organization as a whole.
With respect to marketing responsibility centres, two significant control issuesarise:
1 A key performance indicator for marketing is the achievement of company salestargets. This might be an inappropriate indicator of performance, however, due tothe fact that sales are affected by many factors outside the marketing manager’ssphere of influence (e.g. actions taken by competitors). In addition, hotel sales areparticularly affected by the health of the economy, and hotels in tourist locations
119

Financial Management for Hospitality Decision Makers
Hosp
italit
y, L
eisu
re &
Tou
rism
Ser
ies
are affected by factors such as international exchange rates and the changingnature of a tourist destination’s image. These factors that affect sales all falloutside a marketing manager’s sphere of influence.
2 Although most marketing managers would agree that marketing activities resultin increased sales, many marketing budgets are set in a manner suggesting thereverse. When sales and profit increase, more money tends to be made availablefor marketing. This ‘sales-led marketing’ rather than ‘marketing-led sales’phenomenon underlines the discretionary nature of budget setting with respect tomarketing expenditure.
Revenue centresRevenue centres are not widely found in the hotel industry. They generally arise insales departments where sales quotas are set for staff (e.g. in real estate and car retailoperations). Unlike the case for inputs, it is often quite hard to measure outputs interms of money. For example, we generally do not attempt to attach a dollar valueto the outputs of departments such as accounting, training or public relations simplybecause these outputs do not lend themselves to financial measurement.
Profit centresProfit is clearly an important performance indicator as it is widely used by investorswhen monitoring company performance. It is a broader measure of performancethan the indicators used in revenue and cost centres as it encompasses both revenueand cost. Despite its considerable appeal, it is a less than perfect measure because:
(a) Monetary measures do not exactly measure all aspects of input or output.(b) Standards used as a basis of performance evaluation can only be estimates.(c) Profit measures are used predominately in the context of one year or less, i.e.
they tend to have a short-run achievement bias.(d) Rarely are all factors that determine profitability controllable by the profit centre
head.
Some cost centres exert a degree of influence over revenue, however it becomes ajudgement call as to whether this is sufficient to make them a profit centre. Arestaurant kitchen is a responsibility centre where this dilemma arises frequently.Kitchen staff can affect the profitability of a restaurant due to the time taken toprepare a meal, the quality of food prepared, and willingness to extend and vary themenu. In order to motivate kitchen staff to act in a way that is consistent withincreasing revenue, consideration can be given to treating the kitchen as a profitcentre.
A significant problem in profit centre accountability concerns what definition ofprofit should be used. Care should be taken to adhere to the golden rule of onlyholding a manager accountable for factors that he or she can influence. The exactboundary of a particular manager’s sphere of influence is not always clear-cut,however. For example, with respect to insurance, a manager may affect the premiumpaid due to the level of care taken ensuring adequate security is exercised over anasset held in his or her area. The selection of the insurance policy purchased tendsto be a decision taken at the level of head office, however. Who, therefore, should be
120
Budgeting and responsibility accounting
Hosp
italit
y, L
eisu
re &
Tou
rism
Ser
ies
held accountable for insurance premium expense? Should it be the manager incharge of the asset insured, or the head office official responsible for negotiating andpurchasing the insurance premium? This is but one example of many where it is noteasy to trace responsibility for a particular expense to a single functional area.
Possible measures of profit that can be used to gauge a profit centre’s performanceinclude:
(a) Gross profit – this is appropriate if the profit centre manager’s main sphere ofinfluence is limited to sales and cost of sales.
(b) Contribution margin – this is appropriate where the majority of fixed costs arerelatively uncontrollable by the profit centre’s manager. Over the long term,most fixed expenses are partially controllable, however.
(c) Profit before tax – this measure of profit will frequently include expenses that liebeyond the profit centre manager’s scope of influence. Its use can be defendedon the ground that it focuses the head of the profit centre on maintainingrevenues at a level that cover all expenses, not merely those which he or she candirectly influence.
Investment centresSeveral particular issues arise in connection with investment centre accountability. Inthis section, the issues surrounding the scope of an investment centre’s account-ability are initially outlined. Following this, performance measures that may be usedin investment centres are described.
Scope of investment centre accountability • • •It is evident from Figure 8.3 that of the four generic types of responsibility centre,investment centres encompass the greatest span of accountability (note how all threedimensions of accountability referred to in Figure 8.2 are captured in an investmentcentre). The more comprehensive nature of an investment centre’s accountabilitybecomes particularly apparent when we recognize the incomplete nature ofmeasuring profit without regard to the investment base that generates profit. If yourbank account earned you $200 interest last year, you would not be able to make aninformed comment on whether this represents a good rate of return unless you knewwhat you had deposited in the account, i.e. how big an investment you had made.Imagine a hotel with two restaurants, a large restaurant earning an annual profit of$500,000 and a small restaurant earning an annual profit of $100,000. Due to itshigher profit, there may be a tendency to view the large restaurant as the highperformer. If, however, the restaurants were established as investment centres andthe large restaurant had assets of $10 million (return on investment = 5%), and thesmall restaurant had assets of $1 million (return on investment = 10%), it becomesapparent that the small restaurant has the better financial performance.
In the above discussion of profit centres, it was noted that a degree of subjectivitytends to be exercised when defining the level of profit that a profit centre head is tobe held accountable for. This problem is also present in investment centres, howeverit becomes exacerbated as judgement has to also be exercised with respect to whichhotel assets are to be included in the investment centre’s scope of accountability.Again, the golden rule of only holding managers accountable for factors that they
121

Financial Management for Hospitality Decision Makers
Hosp
italit
y, L
eisu
re &
Tou
rism
Ser
ies
can influence should be applied. This signifies that heads of investment centresshould only be held accountable for an asset where they can influence whether it ispurchased or sold. A further issue concerns the value that should be assigned toassets. This issue can be challenging as there can be a wide discrepancy between thebook and market value of a fixed asset. This problem is discussed at some length inadvanced management accounting texts, and it is beyond the scope of this text.Nevertheless, it is noteworthy that the vast majority of companies use the bookvalue of assets when monitoring the performance of investment centres.
Performance measures used in investment centres • • •� Return on investment The most widely used performance measure in investment
centres is return on investment (ROI). It is normal to state ROI as a percentage, i.e.Profit ÷ Assets × 100. As noted in Chapter 5, ROI can be sub-divided into a profitmargin and an asset turnover component. This signifies that an investment
122
Box 8.1Highlighting a problem with ROI accountability
Consider the case of GlobalHotels, a large international company. The General Managers ofthe company’s European hotels have been told by the director of European operations tomaximize the ROI of their respective hotels. GlobalHotels has a corporate long-term ROItarget of 10%. Information relating to last year’s performance in its Madrid and Barcelonahotels appears below.
Madrid hotel Barcelona hotel
Profit A20,000 A90,000Investment A500,000 A500,000ROI 4% 18%
Imagine the General Manager of the Madrid Hotel has identified an asset that she believes willprovide an annual profit of A18,000 and can be purchased for A200,000. She wants topurchase the asset as it will increase her hotel’s ROI to 5.4% [(A20,000 + A18,000) ÷(A500,000 + A200,000)].
Meanwhile, the General Manager of the Barcelona hotel wants to sell one of his hotel’slower-performing assets for its book vale of A180,000. The sale of this asset will reduce hishotel’s annual profit by A21,600. The Barcelona hotel’s General Manager has justified hisdecision to sell on the basis that it will increase his division’s ROI from 18% to 21.4%[(A90,000 – A21,600) ÷ (A500,000 – A180,000)].
While the heads of the two divisions are following the Managing Director’s directive ofmaximizing their respective hotel’s ROI, the presence of sub-optimal decision making is clear.GlobalHotels is preparing to buy an asset that will provide an ROI of 9% (A18,000 ÷ A200,000)and at the same time to sell an asset that provides an ROI of 12% (A21,600 ÷ A180,000), i.e. itis proposing to buy an asset that earns less than the company’s target 10% ROI, and sell anasset that is currently earning a return greater than the company’s target 10% ROI. Thisexample highlights how a General Manager who is motivated by a desire to maximizedivisional ROI may be acting in a manner that is contrary to corporate interests. This particularproblem is avoided if residual income (explained in Box 8.2) is used in the place of ROI.

Budgeting and responsibility accounting
Hosp
italit
y, L
eisu
re &
Tou
rism
Ser
ies
centre’s ROI performance can be further analysed by considering its profit marginperformance as well as its asset turnover performance.
There is a particular shortcoming that can arise when managers are encouragedto maximize their investment centre’s ROI, however. Managers in high-performing centres might be motivated to sell relatively high-performing assetswhile managers in low-performing divisions may be motivated to purchaserelatively low-performing assets. A scenario outlining how this can occur ispresented in Box 8.1.
� Residual income Residual income is calculated as follows:
Investment centre profit – Capital charge(The capital charge is: Investment centre’s assets × Required rate of return)
Residual income can be used instead of ROI to evaluate the performance of aninvestment centre. Increasing an investment centre’s residual income signifiesincreased performance. An example that shows the calculation of residual incomeis presented in Box 8.2.
Roles of the budgetIt was noted in this chapter’s introduction that the budget plays an important rolein organizational control as it provides a set of benchmarks used in the appraisal ofresponsibility centres’ performance. Control is somewhat multidimensional, how-ever, and a different facet of control is evident in each of the budgetary roles outlinedbelow. As you read through these budgetary roles, it would be helpful to considerhow each role contributes towards maintaining control in a hotel. The main roles ofbudgets are:
(a) Authorization: The budget sets the limit on what a department can spend. Thisbudgetary role is particularly evident in connection with departments that havea high proportion of discretionary expenditure (as noted earlier, this isexpenditure where there is no strong cause/effect relationship that can informmanagement deliberations on how much should be spent). Hotel departmentswith a high proportion of discretionary expenditure include marketing (theamount of funds allocated to the advertising budget is highly discretionary) andpersonnel (the amount allocated to training is highly discretionary). Managers inthese cost centres can be heard to say ‘my budget is $200,000’. What they meanby this is, the budget authorizes $200,000 of expenditure for their cost centre inthe current year.
(b) Forecasting: The annual budgetary cycle represents a discipline requiring thesales and marketing departments to provide sales estimates for the forthcomingyear. These estimates require a forecast of trends and developments in the hotel’srelevant commercial environment. Factors to be considered in forecastinginclude the general economic climate, the timing of significant local events thatwill affect occupancy levels (e.g. large conventions), and also competitivedevelopments such as the opening date of a new competing hotel.
(c) Planning: The budget represents a plan. Managers should ensure that theforecast commercial environment informs their planning. The importance ofplanning is captured by the adage:
‘No business plans to fail. Many that flop, failed to plan’.
123

Financial Management for Hospitality Decision Makers
Hosp
italit
y, L
eisu
re &
Tou
rism
Ser
ies
(d) Communication and coordination: Preparation of a budget requires extensivenegotiation between members of the organization. This negotiation comprisesvertical communication (superiors discussing appropriate budgetary targetswith subordinates), and also horizontal communication (cross-departmentaldiscussion). Communication is important as the information shared can signifya key learning phase for management. It is also a process that requires
124
Box 8.2Calculating residual income
The GlobalHotels scenario developed in Box 8.1 will now be used to show the calculation ofresidual income. The schedule below calculates the residual income for the two hotels prior tothe proposed sale and purchase of assets using the formula:
Investment centre profit – Capital charge
(The capital charge is: Investment centre’s assets × Required rate of return)
Residual income prior to proposed purchase and sale of assets
Profit A20,000 A90,000minus Capital charge A50,000a A50,000a
Residual income (A30,000) A40,000a10% × A500,000
Residual income will now be used to demonstrate that the changes proposed by the GeneralManagers in the two hotels should not be made.
Residual income following proposed purchase and sale of assets
Madrid hotel Barcelona hotel
Profit A38,000 A68,400minus Capital charge A70,000a A32,000b
Residual income (A42,000) A36,400a10% × A700,000b10% × A320,000
Note how the residual income of both hotels would decline if the proposed sale andacquisition of assets were to take place. The Madrid hotel’s residual income would declinefrom – A30,000 to – A42,000, and the Barcelona hotel’s residual income would decline fromA40,000 to A36,400. If the Director of European operations were to use maximization ofresidual income rather than maximization of ROI as the performance target for the hotels, thetwo hotel general managers would be motivated to act in a manner that is more consistentwith the hotel group’s overall interests. This highlights how using residual income as aperformance measure can result in better outcomes than using ROI to motivate managers.Despite this, ROI is much more widely used than residual income in investment centres. Thismay be because managers find it more intuitively appealing to conceive of return as apercentage of assets.

Budgeting and responsibility accounting
Hosp
italit
y, L
eisu
re &
Tou
rism
Ser
ies
compromise between different parts of the organization holding incompatibleaspirations. Without the discipline imposed by the annual budgetary cycle,different areas of the hotel might increasingly pursue irreconcilable objectives(e.g. marketing seeking a significant increase in occupancy in a year of restrictedroom availability due to the rooms division’s plans to conduct room refurbish-ments). This highlights how horizontal communication triggered by thebudgetary cycle facilitates improved organizational coordination.
(e) Motivation: The budget provides a quantified performance target to be strivedfor. An enduring finding of psychological research suggests that a quantifiedtarget provides management with a point of focus and greater motivation thanwhen a manager has no target other than being told to ‘Do the best you can’.
(f) Performance evaluation: As already noted, the budget represents an importantvehicle generating benchmarks that can be used as a basis for assessingperformance.
(g) Attention directing: If something is monitored and recorded in the budget, it ismore likely to be regarded as important. The adage ‘What gets measured getsmanaged’ is pertinent here. Imagine that a hotel has decided to analyse itsrestaurant activity in a manner that distinguishes between sales made to hotelguests and sales made to customers not staying at the hotel. When budgeting forrestaurant sales, two factors would drive projected sales to hotel guests, theprojected number of guests staying at the hotel and the projected proportion ofhotel guests that dine in the hotel’s restaurant. If the budget were to be preparedin this manner, it would direct management’s attention to a dimension ofperformance that may have hitherto not been accounted for, i.e. the proportionof hotel guests that dine in the hotel’s restaurant. A reference in the budget to theproportion of hotel guests that dine at the hotel’s restaurant, will likely result inmanagers focusing more attention on this dimension of performance.
This range of budgetary roles highlights the degree to which there are a host ofways that hospitality managers are affected by budgeting. To illustrate oneparticular example of a manager’s interaction with the budget, Case 8.1 shows howa human resource manager will draw on budget information when determiningstaffing needs.
Case 8.1Financial Decision Making in Action –
Human Resource Managers’ use of budgets when planning staffing levels
Imagine a manager in a hotel’s human resource department is attempting to determinestaffing needs in housekeeping in the first quarter of a year. Staffing level plans are basedon the hotel’s sales department’s estimates of daily room sales which are developed inconnection with each year’s budget (it is normal for these forecasts to be updated duringthe year as events affecting demand occur).
For several years, the hotel’s human resource department has applied the standard thathousekeeping maids should clean 20 rooms in a standard 8-hour working day. By dividingthe projected daily room sales by the 20 rooms per day standard, the human resourcemanager can determine the number of staff necessary to complete the projected roomcleaning workload. Once projected staffing needs have been determined, the human
125

Financial Management for Hospitality Decision Makers
Hosp
italit
y, L
eisu
re &
Tou
rism
Ser
ies
resource manager can identify those times when the hotel is likely to experience a surplusor shortage of labour.
This calculation procedure is outlined in the schedule below. The ‘room sales’ columnlists the projected daily room sales, and the ‘performance standard’ column records thenumber of rooms a maid should clean in a day. The ‘labour days required’ is calculated bydividing ‘room sales’ by the ‘performance standard’. The ‘full-time staff available’ columnrecords the hotel’s projected supply of maids. Finally, the ‘adjustment needed’ columnhighlights when there is a projected surplus or shortage of labour (brackets highlight ashortage).
Day Roomsales
Performancestandard
Labour daysrequired
Full-timestaff available
Adjustmentneeded
Monday 150 20 7.5 9 1.5Tuesday 150 20 7.5 9 1.5Wednesday 160 20 8.0 9 1.0Thursday 160 20 8.0 9 1.0Friday 220 20 11.0 9 (2.0)Saturday 220 20 11.0 9 (2.0)Sunday 180 20 9.0 9 0
From the information developed, the human resource manager will note a projectedsurplus of staff on Mondays to Thursdays and a shortage on Fridays and Saturdays. Thisinformation would be used when developing staffing rosters. Attempts could be made toencourage staff to take any planned days off work on Mondays to Thursdays. In addition,the human resource department may feel it necessary to schedule some overtime or formore casual staff to be recruited to cover the projected labour shortage on Fridays andSaturdays.
126
Behavioural aspects of budgetingTraditionally, the behavioural aspects of control systems have been given littleattention, and accountants have tended to be viewed as technocrats with littleinterest in the behavioural implications of control systems. More recently, however,there appears to be a growing awareness of the behavioural implications ofbudgetary control. Consistent with this development, the following four majorbudget-related behavioural issues are now discussed:
(a) Budgets as targets(b) Budgets and performance evaluation(c) Manager participation in budget setting(d) Politically charged nature of budgeting.
Budgets as targetsWe noted above that one of the roles of the budget is to motivate. Setting budgetarytargets in a manner consistent with stimulating high motivation requires con-siderable managerial judgement. Psychological researchers suggest that higher

Difficult(challenging budget)
Actualperformance
Budgetdifficultylevel
Budget difficulty(e.g. sales level)
Per
form
ance
Easy(slack budget)
Accurateforecastbudget
Maximummotivation
budget
Budgeting and responsibility accounting
Hosp
italit
y, L
eisu
re &
Tou
rism
Ser
ies
motivation results when targets are just beyond reach, but not so hard that themanager views them as unreasonable (i.e. the budgetary target is perceived aschallenging but not unfair). If budgetary targets are set too high, managers mightview them as unreasonable and will lose motivation. This view on the appropriatedegree of difficulty in budgetary targets raises two issues:
(a) As we all differ in the way we respond to challenging targets, senior managersresponsible for setting budgetary targets should consider each subordinatemanager’s psychological nature and likely reaction to a challenging goal.
(b) If the desire to set high targets results in some targets not being achieved, thebudget will lose some of its value as a coordinating device. For example, if thedesire to set challenging targets results in budgeted sales levels set 5% abovemanagement’s sales forecasts, there is a high likelihood that the budgeted saleslevels will not be achieved. The budgeted level of sales drives operational plans,however, and areas such as F&B, rooms and laundry use the sales budget as a basisfor planning their staffing and purchasing needs. Accordingly, failure to achieve abudgeted sales level can compromise planning and result in wasted resources.This problem, which stems from two competing roles of the budget (i.e. themotivation and coordinating roles), is diagrammatically depicted in Figure 8.4.
In Figure 8.4, the diagonal line labelled ‘budget difficulty level’ shows how anincreasingly difficult budget signifies the setting of increasingly high performancestandards. The ‘actual performance’ line is positively sloping as a result of the
127
Figure 8.4 Budget difficulty and management performance (adapted from Emmanuel et al., 1990)

Financial Management for Hospitality Decision Makers
Hosp
italit
y, L
eisu
re &
Tou
rism
Ser
ies
motivating effect of the increasingly challenging budget. After a critical point,however, the actual performance will decrease. This is because if the budget is set atexceedingly challenging levels, it will lose its power to motivate (managers feel like‘throwing in the towel’). From the perspective of stimulating maximum manage-ment performance, the budget should be set at the level identified as ‘maximummotivation budget’. From the perspective of optimizing the budget’s use as acoordinating vehicle, however, it should be set at the level identified as ‘accurateforecast budget’, i.e. the point at which the ‘budget difficulty level’ and ‘actualperformance’ lines intersect.
There is no easy answer as to whether the budget should be set at the ‘accurateforecast’ or the ‘maximum motivation’ level, as the nature and priorities of eachbusiness unit need to be considered. If high emphasis is attached to accountingperformance measures in a hierarchical organization, failure of a subordinate toachieve a budgetary target will carry unfavourable budgetary performance implica-tions for the subordinate’s superior. As a result, in this situation we can expect the‘accurate forecast’ budget to predominate over the ‘maximum motivation’ budget.
Budgets and performance evaluationBudgets represent an important basis for monitoring the performance of managers.Management rewards that result from achieving budgetary targets include salaryincrements, promotion, and enhanced peer and self-esteem. In the light of thesignificance of budgets, managers frequently find budget setting to be a highlyemotionally charged organizational activity. To the extent possible, it is importantthat managers are set equally difficult budgets, as perceived inequity can bedisruptive and adversely affect morale.
Budgets cannot always serve as a strong basis for appraising performance,however. Before the budget is used in this manner, the factors outlined in Box 8.3should be considered.
Manager participation in budget settingParticipation refers to the degree to which managers are involved in setting thebudgetary targets for which they will be held accountable. Three benefits derivefrom greater participation:
(a) It can give rise to a more informed budgetary process, e.g. a manager workingin a particular restaurant may well have a more intimate understanding ofoperational factors in the restaurant than the director of F&B.
(b) Greater participation in target setting is likely to result in a manager feeling greatercommitment to achieving the target set (i.e. internalizing the budget goal).
(c) Participation in budget setting facilitates organizational learning as it providesmanagers with the opportunity to better understand the rationale for theorganization’s direction.
A danger arises with high budget participation, however, as it provides managerswith an opportunity to influence the setting of targets in a way that makes themrelatively easy to achieve. When the budget contains easy targets, it is described ascontaining ‘slack’.
128

Budgeting and responsibility accounting
Hosp
italit
y, L
eisu
re &
Tou
rism
Ser
iesIn addition to securing an appropriate level of participation from subordinates
when setting budgets, it is also important that senior managers are involved. Theinvolvement of senior managers facilitates vigilance over any tendency forbudgetary slack creation. In addition, it provides senior managers with theopportunity to develop their understanding of management issues confrontingsubordinates and to enhance the general perception of the budget’s importance. Ifthe budgetary process is not perceived to be important, its power as a vehicle oforganizational control will be adversely affected.
Political aspects of budgetingBudget setting represents a major process of negotiation that affects the entireorganization. This negotiation can be seen as vital to effective organizational
129
Box 8.3Factors affecting the accountability of a department’s performance
Before a manager attempts to use the budget to appraise the performance of a department,the following factors should be considered:
(a) Does the key dimension of a manager’s work lend itself to accounting measurement? Themanager of a restaurant can be held accountable for restaurant profit, and the manager ofhousekeeping held accountable for the average cost of cleaning a room. In discretionarycost centres such as personnel, public relations and accounting, however, it is difficult todetermine a key dimension of performance that lends itself to accounting measurement.
(b) To what extent is the performance of the responsibility centre in question affected by theactions of managers in other business units? Consider the case of a laundry manager.Laundry is a service department providing clean laundry to other hotel departments.Laundry managers frequently complain that a particular department’s low inventory of linennecessitates the provision of fast turnarounds. Maintaining a fast turnaround time canrequire laundering in uneconomic batch sizes, i.e. starting a washing cycle before thewashing machine is filled to capacity. If departments such as F&B and rooms have theability to require fast laundry turnarounds, the laundry department’s independence iscompromised, and part of its cost structure will be driven by the actions of other hotelresponsibility centres. Where this type of situation exists, it is inappropriate to placeemphasis on budget achievement as a performance indicator. High interdepartmentaldependency is often evident in restaurant management where sales can be affected by thehotel’s occupancy levels. In fact, restaurant sales can be affected more by the hotel’seffectiveness in marketing rooms than the restaurant manager’s actions.
(c) Is the hotel activity in question relatively new and therefore difficult to budget for? Imaginethat a new tennis facility has been opened in a hotel that emphasizes the achievement ofbudgetary targets. As it will be difficult to forecast the expected court usage in the firstyear, care should be taken not to place too much emphasis on the budget when appraisingthe performance of the tennis complex manager. This highlights the fact that achievementof a budgeted target can be affected as much by forecasting accuracy as goodperformance.

Foodingredientspurchased
Kichen activitiesare undertaken
(production)
Meals soldthrough therestaurant
Financial Management for Hospitality Decision Makers
Hosp
italit
y, L
eisu
re &
Tou
rism
Ser
ies
functioning. The budget is the most powerful vehicle driving the reconciliation ofpotentially conflicting aspirations held by managers representing the manydisparate parts of the organization. When we consider the degree of compromisethat has to be achieved, it is not surprising that managers frequently comment onfrustration experienced during the budget-setting process. In its capacity ofreconciling differences within functions, across functions, divisions and thecorporate office, the budget department will have to frequently return budgets toinitiators for revision. During this process, many managers will discover that someorganizational aspirations that they may have held for some time will notmaterialize. It is therefore not surprising that budget setting can become highlypolitical. Political aspects of budgeting include individuals competing for resourcesin a manner designed to gain the best outcome for themselves, and managersinformally developing coalitions in order to increase their bargaining strength.
This potential for politics in the budget-setting process is exacerbated when werecognize that for many managers the budget identifies the upper limit for theirexpenditure. The size of a manager’s budget is frequently related to the manager’sperceived organizational importance and power. Accordingly, ambitious managerscan be expected to be focused on securing large budgets for their departments.Conflicting ambitions of managers provide further scope for a wide range ofpolitical game playing during the budget-setting process.
Technical aspects of budget preparationIn this section, the preparation of budget schedules will be illustrated by means ofa worked example. This demonstrates preparation of the purchases, production andlabour cost budget schedules in a restaurant setting.
Before considering these specific budget schedules, it is important to note thatfrom a technical stand-point, the most important element of the budget is thebudgeted sales level. This is because the sales estimate drives much of the remainderof the budget. In the following worked example, note how budgeted salesinformation is a prerequisite to the preparation of the budget schedules. It shouldnot be forgotten, however, that as sales are affected by environmental factors that areexternal to the organization, projecting next year’s sales is perhaps the most difficultaspect of forecasting in the budgetary cycle. Further, the degree to which sales arevolatile in the hotel industry was noted in the first chapter.
When we think of a production setting such as a kitchen, we tend to think ofactivities as they occur. Figure 8.5 depicts this sequence, i.e. food ingredients arepurchased, kitchen staff then use these ingredients in the preparation of meals, andfinally the meals produced are sold in the restaurant.
130
Figure 8.5 Kitchen and restaurant physical sequencing of events

Foodingredientspurchased
Kichen activitiesare undertaken
(production)
Meals soldthrough therestaurant
Production activitiesdetermine purchases
Sales determineproduction activities
Budgeting and responsibility accounting
Hosp
italit
y, L
eisu
re &
Tou
rism
Ser
ies
When producing a budget, however, we need to conceive of these events inreverse order. This is because the amount of food ingredients purchased will bedriven by the projected kitchen production activity, and the amount of kitchenproduction activity is determined by food sales made in the restaurant. As restaurantsales drive kitchen production activities, and kitchen production activities drivefood ingredients purchased, if we are attempting to prepare a budget for foodingredients purchased we must first prepare a sales budget and then prepare akitchen production budget. This sequencing of the preparation of budget schedulesrelating to the kitchen is depicted in Figure 8.6.
The remainder of the chapter works through an example that demonstrates howbudgeted schedules for purchases, production and labour costs can be prepared. Inthis example, note how certain budget schedules can only be prepared once otherbudgeted schedules have been completed.
Imagine a large New Orleans hotel complex ‘the JazzFest’ which makes its ownpastries. The JazzFest hotel sells the pastries in its three restaurants and coffee shopbar. In addition, an outside baker purchases any excess pastries for cost price + 10%.
Ingredients required for pastry production include flour, fruit, margarine, salt andwater. 1 kilogram of flour is used per tray of pastries produced. Flour costs $1.50 perkilogram. At the end of the month, the pastry chef likes to always maintain in storesenough flour to support 10% of the following month’s production.
Following preparation of the pastry dough, pastries are baked on trays, with eachtray containing 25 pastries. To cater for any unexpected increases in demand, at theend of any month, the chef likes to have 5% of the following month’s projecteddemand for pastries stored in the freezer (freezer storage is handled on a rotatingbasis with no pastries held in the freezer for more than 10 days). On 1 April it isanticipated that 125 pastries will be held in the freezer.
The head chef has developed two schedules, the first providing details of pastryproduction labour costs (Exhibit 8.1), and the second providing information onanticipated demand for pastries over the next four months (Exhibit 8.2).
This information is sufficient to allow preparation of:
1 The budgeted pastry production schedule for April, May and June2 The budgeted purchase of flour schedule for April and May3 The budgeted pastry labour cost schedule for April, May and June.
It is evident from Figure 8.6 that the purchases budget cannot be prepared until theproduction budget has been prepared. In addition, as the labour cost information
131
Figure 8.6 The sequence in which budget schedules relating to kitchen activities are prepared

Financial Management for Hospitality Decision Makers
Hosp
italit
y, L
eisu
re &
Tou
rism
Ser
ies
provided in the chef’s first schedule relates to hourly production costs, the budgetedlabour cost schedule can only be prepared once the pastry production budgetschedule has been finalized. As will be seen, preparation of the budgeted productionand purchase schedules becomes somewhat complicated by movements in theopening and closing balances of inventory.
Preparation of the budgeted pastry production scheduleAn easy way to prepare a budgeted production schedule involves adding theinventory balance required at the end of the period to the production throughputrequired to support the period’s sales (this aggregated figure can be referred to as‘number of pastries to be made available’). The amount of pastries that must beproduced in the period can then be determined by deducting the number of pastriesheld at the beginning of the period (i.e. we do not need to produce what is alreadyavailable at the beginning of the period). Note that the number of pastries at the endof a particular month (closing inventory required) is the same as the number ofpastries at the beginning of the next month (opening inventory balance). JazzFest’sbudgeted pastry production schedule is presented as Exhibit 8.3.
Preparation of the budgeted purchase of flour scheduleHaving determined the monthly production of pastries, we are now in a position toprepare the budgeted purchases of flour schedule. Projected purchases for Junecannot be determined as we are unable to budget July’s production of pastries (wedo not know August’s projected sales and this figure is needed to determine July’sclosing inventory required), which is necessary to determine the flour inventoryrequired at the end of June. When preparing the budgeted purchases schedule we
132
Exhibit 8.1JazzFest pastry production labour costs
Hourly rate Time taken to produce10 trays of pastries
Pastry chef $22 5 hoursJunior kitchen staff $14 2 hours
Exhibit 8.2JazzFest projected sales demand for pastries
April May June July
Projected pastry sales 2,500 3,000 3,000 2,500

Budgeting and responsibility accounting
Hosp
italit
y, L
eisu
re &
Tou
rism
Ser
ies
can follow the approach taken to prepare the budgeted production schedule.Determining the closing kilograms of flour required involves dividing the number ofpastries to be produced in the following month by 25 (there are 25 pastries per tray)and then multiplying by 0.1 (enough flour to support 10% of next month’s demandmust be held in stock at the month end). Once the kilograms of flour to be purchasedin the month has been determined, this amount can be multiplied by $1.50 todetermine the cost of flour to be purchased. JazzFest’s budgeted purchase of flourschedule is presented as Exhibit 8.4.
Preparation of the budgeted labour cost for pastry productionscheduleCompared to the budgeted production and purchases schedules, preparation of thebudgeted labour cost schedule is relatively straightforward. From Exhibit 8.1 we cansee that it takes a pastry chef 5 hours to produce 10 trays of pastries, therefore 1 trayrequires half an hour of pastry chef labour. As these chefs are paid $22 per hour, itcosts $11 of pastry chef labour to make 1 tray of pastries. As 2 hours of junior kitchenstaff labour is involved in the production of 10 trays of pastries, 1 pastry trayrequires 0.2 hours of junior kitchen staff labour. The preparation of 1 tray of pastriestherefore costs $2.80 of junior kitchen staff labour ($14 × 0.2). JazzFest’s budgetedlabour cost for pastry production schedule is presented as Exhibit 8.5.
133
Exhibit 8.3JazzFest budgeted production of pastries
April May June
Closing inventory required (5% of following month’s sales) 150 150 125+ Sales 2,500 3,000 3,000
Number of pastries to be made available 2,650 3,150 3,125– Opening inventory balance 125 150 150
Production of pastries 2,525 3,000 2,975
Exhibit 8.4JazzFest budgeted purchase of flour schedule (in kilograms)
April MayClosing inventory of flour required (following month’s production ÷ 25 × 0.1) 12.0 11.9+ Flour necessary to support production (this month’s production ÷ 25) 101.0 120.0
Amount of flour to be made available 113.0 131.9
– Opening inventory balance (current month’s production ÷ 25 × 0.1) 10.1 12.0
Flour purchased in kilograms 102.9 119.9
Flour purchased in $ (kg purchases × $1.50) $154.35 $179.85

Financial Management for Hospitality Decision Makers
Hosp
italit
y, L
eisu
re &
Tou
rism
Ser
ies
Summary
In this chapter we have reviewed responsibility accounting and budgeting. Responsibilityaccounting refers to the way that different managers are held accountable for different aspectsof an organization’s activities. The main types of responsibility units are cost, revenue, profitand investment centres. We noted the importance of budgetary control in light of the manyorganizational roles performed by budgeting. In addition, we considered behaviouralimplications of budgeting and reviewed how to prepare a restaurant’s purchases, productionand labour cost budget schedules.
Having read the chapter you should now know:
� What issues need to be considered when deciding whether a responsibility centre should bea cost, revenue, profit or investment centre
� How to compute residual income as an alternative to using ROI when measuring theperformance of an investment centre
� The main organizational roles of budgeting� Behavioural issues that need to be considered when using budgetary controls� How to produce a purchases, production and labour cost budget schedule.
References
Atkinson, H., Berry, A. and Jarvis, R. (1995) Business Accounting for Hospitality andTourism & Leisure, International Thomson Publishing, London, Chapters 15 and 16.
Carnegie, G., Jones, S., Norris, G., Wigg, R. and Williams, B. (1999) Accounting:Financial and Organizational Decision Making, Irwin/McGraw-Hill, New York,Chapter 25.
Coltman, M. M. and Jagels, M. G. (2001) Hospitality Management Accounting, 7thedition, John Wiley, Chichester, Chapter 9.
Drury, C. (1992) Management and Cost Accounting, 3rd edition, Chapman and Hall,London, Chapters 16 and 20.
Emmanuel, C., Otley, D. and Merchant, K. (1990) Accounting for Management Control,2nd edition, Chapman and Hall, London, Chapter 7.
Hansen, D. R. and Mowen, M. M. (1996) Management Accounting, 4th edition, South-Western, Cincinnati, OH, Chapter 8.
Harris, P. (1999) Profit Planning, Butterworth-Heinemann, Oxford, Chapter 8.Kotas, R. (1999) Management Accounting for Hospitality and Tourism, 3rd edition,
International Thomson Publishing, London, Chapter 12.
134
Exhibit 8.5JazzFest budgeted labour cost for pastry production
April May June
Number of pastry trays produced (pastry production ÷ 25) 101 120 119
Pastry chef labour cost ($11 per tray) $1,111.0 $1,320 $1,309.0Junior kitchen staff labour cost ($2.8 per tray) $282.8 $336.0 $333.2
Total labour cost $1,393.8 $1,656.0 $1,642.2

Budgeting and responsibility accounting
Hosp
italit
y, L
eisu
re &
Tou
rism
Ser
ies
Kotas, R. and Conlan, M. (1997) Hospitality Accounting, 5th edition, InternationalThomson Publishing, London, Chapter 24.
Owen, G. (1994) Accounting for Hospitality, Tourism & Leisure, Pitman Publishing,London, Chapter 14.
Schmidgall, R. F. (1997) Hospitality Industry Managerial Accounting, 4th edition,Educational Institute – American Hotel & Motel Association, East Lansing, MI,Chapter 10.
Problems
✓ indicates that a solution appears at the back of the text
✓ 8.1 Describe the way in which a responsibility accounting system is closely linked to anorganization’s budgeting system.
✓ 8.2 Joe Smith is the stores and purchasing manager for the Pristine Waters hotel andgolfing complex located on one of Australia’s Whitsunday Islands. Joe receivespurchase requisitions from other department heads in the organization. When he tookthe job, Joe was informed that he had responsibility for servicing the purchasing needsof other department heads. In the case of rarely purchased items, it is customary forJoe to be provided with specifications from the department initiating the request.
In June last year, the hotel secured the contract for a large conference to take placein February this year. As a result of September and October meetings with theconference organizers, it was decided that the conference would include a high-tech‘real-time’ link-up to a similar conference being held at the same time in the USA. Thislive link-up was given significant prominence in the conference’s promotionalmaterial. To facilitate the link up, the hotel needed to buy a particular computeraccessory. Maxine Bromwich, the head of the hotel’s banquet and conferencedepartment, informed Joe of the need to purchase this computer accessory in lateNovember last year. At that time she also informed him that it would be needed for theFebruary convention. Following initial inquiries, Joe discovered that his regularsupplier of computer equipment did not stock the part. He called many other potentialsuppliers and finally found a computer specialist located in Perth that agreed tosupply the required accessory. Joe mailed the purchase order to the chosen supplierin mid-December. In mid-January, following his annual three week holiday, Joetelephoned the supplier to ensure that all was well with the shipment. At that time thesupplier informed him that the computer part was on its way. A week before theconference, the part had not arrived so Joe called again, and again he was told notto worry and that the part had left on time. Two days before the conference start datethe part had still not arrived. Joe called again and it was discovered that the part hadbeen mailed to the wrong address.
At the commencement of the conference, Maxine Bromwich informed delegatesthat due to a technical hitch, the forum that was to involve the link up to the USconference had been cancelled. This caused considerable ill-feeling amongdelegates and as part of a damage limitation exercise, they were reimbursed with$145. This represents the price charged to delegates for one night’s accommodationat the hotel. This damage limitation exercise signified a loss of $60,900 ($145 × 420delegates) for the hotel.
135

Financial Management for Hospitality Decision Makers
Hosp
italit
y, L
eisu
re &
Tou
rism
Ser
ies
Explain in one page or less, how this $60,900 loss should be accounted for. Youranswer should include an appropriately reasoned justification for the answer youprovide. Should it be charged to Joe Smith’s purchasing department, or should it becharged to Maxine Bromwich’s banquet and conference department? MaxineBromwich has complained that if it is to be charged to her department, she will beunable to meet her department’s budgeted profit for the year.
✓ 8.3 The ‘Dreaming of Stars’ company owns a chain of large hotels. Its hotel located onAmerica’s eastern seaboard is its largest and comprises a casino, four restaurants,extensive conference facilities, and a health club.
Over the last month, business activity at the hotel has been significantly downfollowing a radical political group’s terrorist threat to blow up a plane while in flightover American airspace. The terrorist threat has been taken very seriously by airaviation authorities and the matter has received considerable attention from the newsmedia.
Senior management at the hotel feel this is a largely uncontrollable setback, butthat demand should return to normal levels in a couple of months’ time. In themeantime, many unskilled workers have been temporarily laid off. Highly skilledchefs, however, are likely to find alternative employment if laid off and the director ofF&B has argued convincingly that it would be to the long-term detriment of Dreamingof Stars if they were to be allowed to leave. As a result of this stance, the highly skilledchefs have been employed in various menial facility maintenance tasks such asmaintaining gardens, building storage racks in the store rooms and painting some ofthe hotel rooms.
Upon receipt of his most recent performance report, the head of the maintenancedepartment was left fuming. The performance report indicated a 70% adversevariance compared to budgeted expenditure for the month. He went straight to theaccounting office and complained:
This just isn’t fair. The reason I’m 70% over budget this month is I’m usingthat elitist bunch of pastry cutters to do work that is going to get theirfingernails dirty. I normally pay my boys $9 per hour, this crowd comes in at$13.50 per hour. These guys know I can’t lay them off. They’re treating workin my department likes it’s a joke, and once they’ve gone back behindrevolving doors I’m going to have to work my boys overtime in order to meetour scheduled maintenance for the year.
Required • • •This is a fine example of how the accounting system can give rise to undesirable ill-feeling within a company. What do you see as the best course of action for theaccountant?
8.4 As part of a consulting assignment you have been asked to review the appropriate-ness of a hotel’s responsibility accounting system. In the course of conducting yourreview, you become aware of a degree of dissatisfaction felt by the head of the hotel’sfacility maintenance department.
The facility maintenance department was established as a cost centre a number ofyears ago. In recent years the department has experienced problems containingcosts within limits established by the budget. One particular area of concern to the
136

Budgeting and responsibility accounting
Hosp
italit
y, L
eisu
re &
Tou
rism
Ser
ies
head of the department is the cost of repairs to the hotel’s three staff buses whichhave recently been involved in a series of minor accidents. Most of these accidentshave been no more serious than bodywork dents resulting from reversing into one ofthe concrete pylons that surround the hotel car park’s perimeter. Consistent withrepairs to most of the hotel’s assets, bus repairs are managed by the facilitymaintenance department. In light of this, the cost of performing the repair work ischarged to the facility maintenance department. It is generally accepted that thisdepartment contains the greatest expertise and local contacts to effectively overseeasset repairs.
Three part-time employees are employed by the hotel to drive the staff buses. Astheir pick-up schedules are determined by the residential location of rostered staff,the drivers report to the head of personnel. This arrangement facilitates the flow ofpaperwork as the personnel department maintains staff roster records and also thedatabase containing staff members’ addresses.
The head of the facility management cost centre has complained to you that he hasasked the bus drivers to take more care when driving the buses. He believes,however, that the drivers take little notice of him as they feel primarily accountable tothe head of personnel.
Required • • •What recommendation would you make in your consulting report concerning thespecific lines of accountability uncovered by this case?
8.5 The Sea Breeze is a 200-room family resort hotel in Blackpool, Northern England thatis open 7 days per week. It has one restaurant and restaurant sales are only made tohotel guests. During the next quarter beginning 1 April, the rooms manager anticipatesan average occupancy of 70% and an average of 2.5 people in each occupied room.Restaurant records indicate that 90% of guests eat breakfast, 30% each lunch and60% eat dinner at the restaurant. The average contribution earned from covers servedin the restaurant is £4 for breakfast, £8 for lunch and £12 for dinner.
Required • • •Calculate the estimated contribution (revenue – variable costs) that will be earned atSea Breeze’s restaurant in the next quarter beginning 1 April.
8.6 One of the kitchens in a large Las Vegas hotel complex produces fresh local fruit jam.The jam is placed into expensive jars moulded with the hotel’s logo, a depiction oftumbling dice. The jam is labelled ‘Lucky Dip’. For several years a jar of ‘Lucky Dip’has been given as a complimentary gift to all guests staying in the hotel, and themarketing department feel that this promotion has been well received by guests.Some jam is also sold through the hotel’s gift shop.
The company accountant has provided the head chef with the following schedulethat outlines the anticipated demand for jam in the next four months.
Complimentaries Shop sales
October 1,000 jars 100 jarsNovember 800 jars 80 jarsDecember 1,200 jars 120 jarsJanuary 700 jars 70 jars
137

Financial Management for Hospitality Decision Makers
Hosp
italit
y, L
eisu
re &
Tou
rism
Ser
ies
The chef likes to have 10% of next month’s jam demand already produced and instock by the month end. On 30 September, 120 jars of ‘Lucky Dip’ were held asinventory.
The chef runs a fruit-stocking policy of holding 5% of next month’s fruit needs ininventory. On 30 September, 20 kg of fruit was held in inventory. Each jar of ‘LuckyDip’ requires 0.5 kg of fruit. It has been estimated that the fruit will cost $2 per kgduring the year’s final quarter.
Required • • •Prepare a purchases budget for fruit for October and November.
8.7 The manager of Ritzy Rooms, a small 40-room Saskatchewan roadside motel, isseeking a $90,000 bank loan bearing a 10% annual rate of interest. Mr Scroogy, themanager of the bank considering the loan application, requires the motel to producea budgeted profit and loss statement for next year, 20X1. Mr Scroogy requires thisinformation to help him assess Ritzy Rooms’ credit risk.
Ritzy Rooms’ accountant has assembled the following schedule of information tofacilitate preparation of 20X1’s budgeted profit and loss statement.
Number of single rooms 10Estimated occupancy of single rooms 70%Single rooms’ projected average room rate $50Average contribution earned on single rooms 85%Number of double rooms 30Estimated occupancy of double rooms 40%Double rooms’ projected average room rate $70Average contribution earned on double rooms 90%Operating fixed costs per annum (not including loan interest) $180,000Tax rate levied on profit after deduction of interest expense 40%
Required • • •(a) Assuming the motel is open for 360 days in the year, prepare the budgeted profit
and loss statement for 20X1. Include the interest on the $90,000 loan in thebudgeted statement.
(b) Mr Scroogy has a policy of not lending to any business that cannot demonstratea projected times interest earned ratio greater than 3 (the times interest earnedratio is described in Chapter 5). Based on the budgeted figures, does RitzyRooms satisfy the bank manager’s loan approval requirement?
138

C H A P T E R• • • • 9
Flexible budgetingand variance
analysis
L e a r n i n g o b j e c t i v e sAfter studying this chapter, you should havedeveloped an appreciation of:
1 The value of using flexible budgets
2 A systematic approach that can be used whenpreparing variance analyses
3 The insights resulting from variance analyses
4 The nature and merits of benchmarking.

Financial Management for Hospitality Decision Makers
Hosp
italit
y, L
eisu
re &
Tou
rism
Ser
ies
IntroductionThis chapter builds on some of the budget and responsibility accounting issuesintroduced in the previous chapter. First, we examine flexible budgeting, a techniquethat represents a slight refinement of the static budgeting approach described in theprevious chapter. In a static budgeting system, a budget is rigid in the sense that itis not modified once the actual volume of sales is known. While this approach is usedextensively, some managers find it helpful to flex budgets up or down in line withthe actual volume of sales achieved. Failure to accurately predict the volume of salesis a major factor causing many significant differences between the static budget andactual performance. Under flexible budgeting, however, the effect of a hotel sellingmore or less than was originally projected is excluded from differences between theactual and budgeted performance. Exclusion of this factor is significant because, bydefinition, managers in cost centres exert little influence on sales volumes. If managersin cost centres cannot affect sales, why should the effect of selling more thananticipated be included in a variance used to gauge their performance?
A second technique introduced in this chapter is variance analysis. ‘Variance’ isthe accounting term for any difference between an actual and budgeted amount.Variance analysis relates to the responsibility accounting issues introduced in theprevious chapter as it involves the isolation of factors contributing to variances.Greater appreciation of what factors lie behind a particular variance supportsresponsibility accounting through enhanced accountability. The chapter concludeswith a description of benchmarking, a technique that has commanded increasingattention as a financial management tool in the last few years.
Flexible budgetingAs just noted, the budget schedules developed in the previous chapter were basedon a single set of estimated levels of monthly activity, i.e. the projected sales demandfor pastries. A shortcoming of this static approach to budgeting is that invariably theactual level of activity achieved will differ from the budgeted activity level. Can youthink of a situation where a restaurant manager is able to exactly predict the numberof covers that will be sold in a year? Discrepancies between budgeted and actualactivity levels result in variances for revenue and variable costs. These variances arenot necessarily reflective of performance, however. A part of each observed variancewould be attributable to the fact that, in most businesses, it is almost impossible topredict exactly the volume of sales in a forthcoming accounting period.
To illustrate this issue with an example, imagine that a restaurant budgeted $8,000for food costs in a period when it was estimated that 1,200 covers would be sold. Ifthe restaurant actually incurred food costs of $8,400 and 1,320 covers were sold, is itreasonable to conclude there has been poor food cost management? A static budgetwould highlight that the cost of food for the period was $400 over budget ($8,000 –$8,400). This suggestion of poor food cost management is highly misleading, however.Food costs are variable (they increase in line with the volume of sales achieved),therefore we need to recognize the impact of the restaurant selling more covers thananticipated. In reality, the restaurant has been 10% busier than anticipated ([1,320 –1,200] ÷ 1,200 × 100), yet food costs are only 5% above budget ([$8,400 – $8,000] ÷$8,000 × 100). To overcome this problem of potentially misleading variances that canarise when using static budgets, we can prepare a flexible budget.
140

Flexible budgeting and variance analysis
Hosp
italit
y, L
eisu
re &
Tou
rism
Ser
ies
Flexible budgeting can be achieved by preparing a series of budgets for differentlevels of sales activity. More usually, however, once the actual volume of sales isknown, the static budget is proportionately ‘flexed’ up (if the actual volume ofsales is above the budgeted amount), or down (if the actual volume of sales isbelow the budgeted amount). The resulting flexible budget will show what costsand revenues should have been for the actual level of activity achieved. Anyunfavourable cost variances between actual performance and the flexible budgetwill be attributable to inefficient use of resources (e.g. labour or materialinefficiencies, etc.) or purchasing resources at prices above what was estimatedwhen the budget was originally set.
Exhibit 9.1 provides an illustration of a flexible budget and also the computationof flexible budget variances. To understand how the flexible budget was prepared,initially focus on the first two data columns, i.e. the actual and static budgetinformation. As the 1,800 actual room sales achieved are 90% of the 2,000 room salesprojected when the static budget was prepared, the flexible budget is set at 90% ofthe static budget. This signifies that all budget items that move with sales volume(i.e. revenue and variable costs) are recorded in the flexible budget at 90% of theamounts in the static budget.* Fixed costs in the flexible budget are unaltered fromthe value in the static budget as fixed costs are assumed to be unaffected by varying
141
* Alternatively, the unit price or cost for each line of the static budget could have been determined. Theseamounts could then be multiplied by the actual sales volume achieved to derive the flexible budgetamount. For example, the unit price of sales in the static budget must be $110, as $220,000 revenue wasbudgeted for 2,000 rooms sold. Multiplying $110 by the actual activity level, i.e. 1,800 rooms sold, we findthat the budgeted revenue to be included in the flexible budget is $198,000 ($110 × 1,800).
Exhibit 9.1The Poplars Hotel Rooms DepartmentFlexible budget performance report – month ended 30 April 20X1
Actual Staticbudget
Flexiblebudget (90% ofstatic budget)
Flexiblebudget
variancea
Room sales 1,800 2,000 1,800$ $ $ $
Revenue (sales) 207,000 220,000 198,000 9,000 (F)Variable Costs:
Labour 12,015 12,000 10,800 1,215 (U)Cleaning materials 5,200 6,000 5,400 200 (F)
Contribution Margin 189,785 202,000 181,800 7,985 (F)Fixed Costs 49,000 50,000 50,000 1,000 (F)
Operating Profit 140,785 152,000 131,800 8,985 (F)
aThe difference between the actual and the flexible budget amounts.U denotes unfavourable variances; F denotes favourable variances.

Financial Management for Hospitality Decision Makers
Hosp
italit
y, L
eisu
re &
Tou
rism
Ser
ies
levels of activity. Once the flexible budget has been prepared, the flexible budgetvariances for each line can be determined by calculating the difference between theactual results and the flexible budget amounts (final column in Exhibit 9.1). Thesevariances are labelled ‘U’ (unfavourable) if the direction of the variance carries anegative impact on the actual profit level relative to the budget, and ‘F’ (favourable)if the direction of the variance carries a positive impact on the actual profit levelrelative to the budget.
The following observations can be made with respect to this flexible budgetperformance report:
� The $9,000 flexible budget revenue variance signifies that average actual roomrates charged exceeded the budgeted room rate. If actual revenue is compared tothe revenue in the static budget, we find an unfavourable variance of $13,000($220,000 – $207,000). This variance stems primarily from the fact that the numberof room sales is below the static budget and masks the fact that the average roomrate achieved of $115 ($207,000 ÷ 1,800) compares favourably with the budgetedroom rate of $110 ($220,000 ÷ 2,000). It could be that setting the average room rateabove the budgeted room rate has contributed to the number of rooms sold beingbelow budget.
� Variable labour costs have a $1,215 unfavourable flexible budget variance. Thissignifies that the labour has performed inefficiently and/or labour’s actual hourlyrate of pay is greater than what was budgeted for. It could be that in light of thestatic budget (2,000 room sales predicted) more than the required amount of staffwere rostered. The extent of labour’s unfavourable performance is not highlightedif the actual performance is compared to the static budget as this reveals only asmall $15 unfavourable variance.
� The cleaning materials have a $200 favourable flexible budget variance. Thissignifies that the materials have been used efficiently and/or they have beenpurchased at an average price below the budgeted price.
� As noted above, fixed costs are not ‘flexed’ when producing a flexible budget. Thisis because they do not vary with levels of activity over the short term. The $1,000favourable fixed cost variance signifies that fixed-cost activities have beenconducted efficiently and/or items have been bought for prices below what wasbudgeted for. As staff salaries can represent a significant proportion of fixed costs,it might be that annual salary rates of pay are below what was budgeted for, or asalaried position was vacant for some of the month.
� Overall, there is a favourable flexible budget operating profit variance of $8,985.The primary factor driving this favourable variance is the $9,000 favourableflexible budget revenue variance (rooms sold at above the budgeted rate).
Variance analysisWe have just seen that a cost’s variance between actual and flexible budget may beattributable to more than one factor. For example, the $1,215 unfavourable flexiblebudget variance for labour in Exhibit 9.1 could be due to inefficient labourperformance and/or labour’s actual hourly rate being above the budgeted hourlyrate. In this section, we explore variance analysis, which is a technique that movesus closer to identifying the cause of a variance. The technique will be illustrated byconsidering it in the context of two specific types of cost variance: direct labour cost
142

Flexible budgeting and variance analysis
Hosp
italit
y, L
eisu
re &
Tou
rism
Ser
ies
variance and direct materials variance. In addition, an approach that can be taken toanalysing the variance between actual revenue and revenue identified in the staticbudget will be shown.
Direct labour varianceThe variance between actual labour cost and labour cost in the flexible budgetcomprises two main elements: the labour rate variance and labour efficiencyvariance. A labour rate variance arises when the actual wage rate differs to thebudgeted wage rate. A labour efficiency variance results when more or less than thebudgeted time is taken to complete a particular task.
Direct labour variance worked example • • •To illustrate the analysis of labour variance, we will return to the Poplars Hotelexample presented in Exhibit 9.1. We can see that in April the hotel was 200 roomsshort of selling its budgeted target of 2,000 rooms. Imagine that the budgeted cost oflabour was based on an anticipated $10 per hour wage rate and an expectation thateach room sold would generate 36 minutes of work. In addition, assume accountingrecords indicate that in April labour worked 1,350 hours at a rate of $8.90 per hour.
This provides us with enough information to determine Poplars’ labour rate andefficiency variances for April. We can take a systematic approach to calculating thesevariances by using the matrix presented as Exhibit 9.2. A particular strength of thisapproach will become evident as you progress through this section, as the samematrix format is used in all the variance analyses described in this chapter.
The matrix comprises three columns. In the first column we multiply actual hoursworked by the actual hourly pay rate to give us the actual total cost of labour, i.e.1,350 × $8.90 = $12,015. In the second column we make just one modification,replacing the actual rate of pay with the budgeted rate of pay to give us 1,350 × $10= $13,500. Moving to the final column, we make one further change, replacing actual
143
Exhibit 9.2Calculation of labour rate and efficiency variances
Actual labour hours Actual labour hours Budgeted labour hours× × ×
Actual rate Budgeted rate Budgeted rate1,350 1,350 1,080
× × ×$8.90 $10.00 $10.00
$12,015 $13,500 $10,800
←⎯⎯⎯⎯⎯⎯⎯⎯⎯⎯⎯→ ←⎯⎯⎯⎯⎯⎯⎯⎯⎯⎯⎯→
$1,485 Favourablelabour rate variance
$2,700 Unfavourablelabour efficiency variance
←⎯⎯⎯⎯⎯⎯⎯⎯⎯⎯⎯⎯⎯⎯⎯⎯⎯⎯⎯⎯⎯⎯⎯⎯⎯⎯→
$1,215 Labour unfavourable flexible budget variance

Financial Management for Hospitality Decision Makers
Hosp
italit
y, L
eisu
re &
Tou
rism
Ser
ies
hours with the hours that it should have taken to complete the output achieved. Asit was budgeted that each room sold should result in 36 minutes (0.6 hour) of directlabour and 1,800 rooms have been sold, we can conclude that 1,080 hours shouldhave been worked (0.6 × 1,800). The data compiled in column three provides us withthe flexible budget for labour which is $10,800 (1,080 × $10). It is important to notethat only one change was made when we moved from column one to column two,and again when moving from column two to column three.
Now let us consider the nature of the information provided by the matrix. Movingfrom column one to column two we substituted budgeted rate of pay for actual rateof pay. This signifies that the difference between the totals of these two columns isattributable to a pay rate differential. Accordingly, the term ‘labour rate variance’ isused to describe the $1,485 variation between the first two columns. This is afavourable variance as the actual hourly pay rate is below the budgeted pay rate.When moving from column two to column three, we changed actual hours workedto the hours that should have been worked given the number of rooms sold. Thissignifies that any variation between these two columns arises due to labour’s levelof efficiency. As we have found that actual labour time exceeds budgeted labourtime, we conclude that the $2,700 unfavourable variance has resulted from labourperforming inefficiently. Combining the $1,485 favourable rate variance and the$2,700 unfavourable efficiency variance gives us the $1,215 unfavourable labourflexible budget variance noted earlier in Exhibit 9.1. The significance of what thisanalysis reveals is discussed in Case 9.1.
Case 9.1Financial Decision Making in Action –
The Rooms Division Manager and variance analysis
The $1,215 labour cost flexible budget variance is the largest cost variance identified inExhibit 9.1. We can expect that the rooms division manager would want to find out whatlies behind this variance, not least because senior management is likely to hold himaccountable for it.
Requesting a variance analysis such as that presented in Exhibit 9.2 can be seen asrepresenting a first step to securing a greater understanding of what lies behind theunfavourable flexible budget variance for labour. Once the rooms division manager seesthat labour has been recruited at a rate below the budgeted rate, he may question whetherthis was due to the recruitment of untrained personnel. If it was, he may have determineda major factor that has contributed to the unfavourable labour efficiency variance andconclude that continued recruitment of untrained labour represents a false saving.
If the labour rate variance arose as a result of lower than expected labour ratesestablished in a company-wide enterprise agreement, then it would be appropriate for therooms division manager to regard the responsibility for the labour rate variance as restingwith the department that was influential in formulating the enterprise agreement (mostprobably human resources). This is significant as it highlights how the variance analysishas enabled the rooms division manager to trace some of the responsibility for one of ‘his’variances to a manager in another department. If, however, the labour rate variance hasresulted from the head of housekeeping deciding to recruit labour on a pay scale below thebudgeted pay scale, then clearly the responsibility for the labour rate variance rests withhousekeeping.
144

Flexible budgeting and variance analysis
Hosp
italit
y, L
eisu
re &
Tou
rism
Ser
ies
In light of the relatively large unfavourable labour efficiency variance uncovered by thevariance analysis, the rooms division manager can be expected to want someexplanations from the staff member in charge of housekeeping. It could be that thevariance was due to an excessive number of staff rostered by human resources followingthe sales estimates fed into the budget by the marketing department (remember that theactual volume of sales was 10% below the sales level projected in the static budget). If thiswas the case, it would again highlight how the variance analysis has enabled the roomsdivision manager to determine that a causal factor for the labour cost flexible budgetvariance lies largely beyond his control.
Direct material varianceThe direct material variance comprises two elements: materials price variance andmaterials efficiency variance. The price variance shows the impact of not purchasingmaterials at the budgeted price. The efficiency variance shows the impact of notusing the budgeted standard amount of materials to produce the actual volume ofoutput achieved.
Direct material variance worked example • • •Imagine that a restaurant kitchen makes trays of lasagne and it has been determinedthat each tray should contain 0.5 kilogram of meat at a cost of $5 per kilogram.Accounting records indicate that during last month, 1,000 trays of lasagne wereproduced and 600 kilograms of meat was used at a total cost of $2,700.
The materials purchase price and materials efficiency variances can be calculatedusing a very similar approach to that taken in calculating the labour variances (asnoted earlier, the beauty of this approach is that it can be used in a range of varianceanalyses). The direct material variance analysis is presented in Exhibit 9.3. Exhibit9.3 parallels Exhibit 9.2, the only differences are materials replace labour hours, andwe talk of ‘price’ rather than ‘rate’ in connection with materials. Note how in bothtables we calculate actual cost in the first column, in the second column wesubstitute budgeted price (rate) for actual price (rate), and in the final column wesubstitute budgeted materials (labour hours) for actual materials (labour hours).From the information provided, we can determine that the actual per kilogram costof meat is $4.50 (i.e. $2,700 ÷ 600). In the interest of completeness, the actual perkilogram cost has been calculated and included in column one, however it is notactually needed as the total actual cost of meat (i.e. the total for column one) wasprovided in the scenario information outlined above. It is again important to notethat ‘budgeted amount of materials’ in column three refers to the amount ofmaterials that should have been used to produce the volume of output actuallyachieved.
From Exhibit 9.3 it can be seen that a $300 difference appears between columnsone and two. As actual price in column one is replaced by budgeted price in columntwo, it is evident that this $300 difference is attributable to the material’s price. Theactual price is less than the budgeted price so the materials price variance isfavourable.
There is a $500 difference between columns two and three. As the only differencebetween these columns relates to the amount of materials actually used and the
145

Financial Management for Hospitality Decision Makers
Hosp
italit
y, L
eisu
re &
Tou
rism
Ser
ies
amount of materials that should have been used to produce the 1,000 lasagne trays,this variance is referred to as the ‘materials efficiency variance’. The actual amountof materials used were above the amount that should have been used, therefore thisvariance is unfavourable.
Upon further investigation, we might find that the quality of the meat purchasedwas below the normal standard and that this has resulted in the favourable pricevariance. If this were the case, the low-quality meat might in turn account for theunfavourable efficiency variance, due to a larger than normal proportion of meatbeing discarded. The restaurant official responsible for food purchasing should beheld accountable for the price variance. This could be the chef, or if the restaurant isin a large hotel containing several other restaurants, it could be a purchasingmanager. The chef that oversees the preparation of lasagne should be heldaccountable for the efficiency variance.
A potential problem can arise when one manager is held accountable for foodpurchasing and a different manager is held accountable for food preparation. Intheir pursuit of favourable price variances, there may be a tendency for purchasingmanagers to compromise on the quality of materials purchased. This will carrynegative implications for those managers responsible for overseeing efficient use ofmaterials, as a significant proportion of substandard materials may have to bescrapped. High scrap rates will increase the volume of materials used, and this willresult in an unfavourable materials efficiency variance.
This scenario represents a good example of how accounting systems can provideincentives that counter the development of a team culture by placing managers inadversarial positions. If this type of problem becomes significant, an attempt can bemade to introduce quality standards for meats purchased. Alternatively, if this is notworkable, consideration can be given to moving the purchasing function under thecontrol of the manager responsible for production (i.e. the chef in the lasagneexample just outlined).
146
Exhibit 9.3Calculation of material price and efficiency variances
Actual amountof materials
Actual amountof materials
Budgeted amountof materials
× × ×Actual price Budgeted price Budgeted price
600 kg 600 kg 500 kg× × ×
$4.50 $5.00 $5.00
$2,700 $3,000 $2,500
←⎯⎯⎯⎯⎯⎯⎯⎯⎯⎯⎯→ ←⎯⎯⎯⎯⎯⎯⎯⎯⎯⎯⎯→
$300 Materials favourableprice variance
$500 Materials unfavourableefficiency variance
←⎯⎯⎯⎯⎯⎯⎯⎯⎯⎯⎯⎯⎯⎯⎯⎯⎯⎯⎯⎯⎯⎯⎯⎯⎯⎯→
$200 Materials unfavourable flexible budget variance

Flexible budgeting and variance analysis
Hosp
italit
y, L
eisu
re &
Tou
rism
Ser
ies
Revenue varianceAnalysis of the variance between budgeted revenue and actual revenue can beapplied to any of a hotel’s sources of revenue (food & beverage, accommodation,etc.). In the following example, revenue variance analysis is illustrated in the contextof a banqueting department.
Revenue variance worked example • • •Imagine that for a hotel’s most recent quarter, the banqueting department hadbudgeted to serve 9,500 guests at an average price of $20 per person. Fromaccounting records it has been determined that 8,000 guests were served at anaverage price of $21 per person. From this information we can determine that thereis an unfavourable revenue variance of $22,000, i.e. (8,000 × $21) – (9,500 × $20).However, two underlying revenue variances can be uncovered by again applyingthe matrix that was used in the labour and materials variance analyses. The analysisof revenue variance is presented in Exhibit 9.4 which shows how the selling priceand the sales volume variance can be isolated from one another.
Determination of the selling price and sales volume variances may well increasethe banqueting manager’s understanding of factors behind the $22,000 unfavourablerevenue variance. Accountability for the two variances will depend on a hotel’sorganizational structure, as the scope of a banqueting manager’s influence variessignificantly across hotels. If the setting of banqueting prices and the marketing ofbanquets are influenced by different functional heads, care must be taken torecognize the degree of inter-dependency between these two aspects of a banquetingdepartment’s performance. For example, the setting of higher prices will likely resultin a lower sales volume.
147
Exhibit 9.4Calculation of the selling price and sales volume variances
Actual volumeof sales
Actual volumeof sales
Budgetedsales volume
× × ×Actual selling price Budgeted selling price Budgeted selling price
8,000 guests 8,000 guests 9,500 guests× × ×
$21 $20 $20
$168,000 $160,000 $190,000
←⎯⎯⎯⎯⎯⎯⎯⎯⎯⎯⎯→ ←⎯⎯⎯⎯⎯⎯⎯⎯⎯⎯⎯→
$8,000 Favourable sellingprice variance
$30,000 Unfavourable salesvolume variance
←⎯⎯⎯⎯⎯⎯⎯⎯⎯⎯⎯⎯⎯⎯⎯⎯⎯⎯⎯⎯⎯⎯⎯⎯⎯⎯→
$22,000 Unfavourable revenue variance
Financial Management for Hospitality Decision Makers
Hosp
italit
y, L
eisu
re &
Tou
rism
Ser
ies
Other variance analysesThe materials, labour and revenue variance analyses just outlined can be regarded asthree of the most widely used forms of variance analysis. They do not represent acomplete listing, however, as there are other aspects of a hotel’s performance thatcan be investigated using variance analysis. These other aspects include variable andfixed overheads, sales mix (e.g. the proportion of F&B to accommodation sales),market share and market size. All of these analyses can be conducted using a similarapproach to that outlined above. The question of which variance analyses should beconducted can only be answered by appraising the nature and context of a particularhotel’s business. If a hotel is located in a well-defined market segment andsignificant resources are assigned to the maintenance and development of marketshare, a variance analysis of market share and size could be warranted. In such ananalysis, the profit implication of a variance between actual and budgeted marketsize is isolated from the profit implication of actual market share varying frombudgeted market share. While a detailed review of the techniques to be used in anextensive range of variance analyses is beyond the scope of this book, such reviewscan be found in many advanced management accounting texts.
When should a variance warrant further investigation?There is no hard generalizable rule with respect to when a variance is deserving offurther investigation. Senior managers see the need to conduct further investigationof variances in the context of factors pertinent to a hotel at a particular time. A smallunanticipated variance might warrant a senior manager’s attention more than alarger anticipated variance. For items critical to a hotel’s overall performance, asmall variance might be viewed as important. For example, as room sales frequentlyaffect the sales levels of other hotel activities, a small room sales volume variancemight be significant. For other items, senior management might choose to follow upvariances that are above a certain percentage of the budgeted amount, or above acertain dollar size. Obviously a 3% variance in labour costs of $30,000 may warrantgreater scrutiny than a 10% variance in miscellaneous costs of $2,000. Consequently,rules such as ‘investigate all variances greater than $4,000 or 10% of budget’ arefrequently applied in practice.
BenchmarkingIn variance analysis we are concerned with identifying underlying factors thataccount for differences between a hotel’s actual performance and its budgetedperformance. Widespread use of variance analysis clearly highlights the importanceof the budget as a performance benchmark. Recent years have seen thisbenchmarking philosophy broadened to include non-budgetary and also non-financial benchmarks of performance. A significant non-financial benchmark thathas been used extensively in the hospitality industry for many years is occupancyrate. This is a key performance indicator and some competing hotels have beenobserved to share their occupancy level information on a nightly basis.
For the many hotel managers that work in a large chain organization, dataprovided by high-performing hotels within the chain can provide a valuable
148

Flexible budgeting and variance analysis
Hosp
italit
y, L
eisu
re &
Tou
rism
Ser
ies
performance benchmark. In fact the term ‘benchmarking’ is frequently used in thesense of comparing to best practice. The hotel with the best performance for a givenactivity is the one that provides the standard for that activity. Such benchmarkingcan become a highly formalized process with high-performing hotels sharinginformation on how their performance levels have been achieved. In order for sucha benchmarking process to work, it is obviously important that consistentaccounting methods and measures are used within each hotel. In addition, if it isimportant that managers in high-performing hotels participate fully in thebenchmarking process by sharing the secrets of their success, care must be taken notto attach significant management rewards to relative performance levels. If highrewards are attached to relative performance, managers in high-performing unitswill be reluctant to share information that could improve the standing of lowperformers, as this would reduce the high performers’ margin of superiority.
Benchmarking can also involve making comparisons with competitors. Whilesuch benchmarking might provide the basis for improved performance, competitorbenchmarking is frequently compromised by the problems of accessing informa-tion and also inconsistent accounting practices applied across hotels (e.g. differentdepreciation methods, central administration cost allocation, procedures, etc.). Oneway around this problem is to purchase industry average data compiled byorganizations such as Dun and Bradstreet and large accounting firms such asPricewaterhouseCoopers. These companies collect data from hotels and produceaggregated hotel profit and loss and balance sheet statements and also keyperformance indices. The information is generally categorized according to three-,four- and five-star properties and presented on a percentage basis, i.e. the readercan determine ratios such as cost of sales as a percentage of sales, labour costs asa percentage of sales, etc.
It is important to put the role of variance analysis and benchmarking intocontext. These approaches to performance monitoring represent little more thanattention-directing activities of the accounting function. Determining what courseof action needs to be taken in light of observed discrepancies is an issue requiringmanagerial judgement. The importance of establishing an effective attention-directing system should not be underestimated, however. Failure to detect a firewill always result in failure to put out a fire. The accounting system can frequentlyaid fire detection, but managerial judgement is required when determining howthe fire is to be extinguished.
Summary
In this chapter we have reviewed flexible budgeting, variance analysis and benchmarking.Flexible budgeting involves adjusting the beginning of year budget in line with the actualvolume of sales achieved. This approach is particularly justified when a large proportion ofreported variances between actual and budgeted performance result from the challengingnature of correctly predicting sales volume. Flexible budgeting is also particularly pertinent incost centres, as cost centre managers are not in a position to influence sales levels. Varianceanalysis is a technique that helps a manager to identify underlying factors giving rise tovariances. We saw how a systematic approach can be taken in variance analysis. In addition,the chapter described how managers are increasingly using the performance of other hotels asa benchmark when appraising their own hotel’s performance.
149

Financial Management for Hospitality Decision Makers
Hosp
italit
y, L
eisu
re &
Tou
rism
Ser
ies
Having read the chapter you should now know:� How to produce a flexible budget and the merits of flexible budgeting� How a hotel manager can use variance analysis as a useful complement to budgetary
controls� The role of benchmarking in performance management.
References
Atkinson, H., Berry, A. and Jarvis, R. (1995) Business Accounting for Hospitality andTourism & Leisure, International Thomson Publishing, London, Chapter 16.
Coltman, M. M. and Jagels, M. G. (2001) Hospitality Management Accounting, 7thedition, John Wiley, Chapter, Chapter 9.
Drury, C. (1992), Management and Cost Accounting, 3rd edition, Chapman and Hall,London, Chapter 18.
Hansen, D. R. and Mowen, M. M. (1996) Management Accounting, 4th edition, South-Western, Circinnati, OH, Chapter 9.
Harris, P. (1999) Profit Planning, Butterworth-Heinemann, Oxford, Chapter 9.Horngren, C. T., Foster, G. and Datar, S. M. (2000) Cost Accounting: A Managerial
Emphasis, Prentice Hall International, Englewood Cliffs, NJ, Chapter 7.Kotas, R. (1999) Management Accounting for Hospitality and Tourism, 3rd edition,
International Thomson Publishing, London, Chapter 12 and 13.Schmidgall, R. F. (1997) Hospitality Industry Managerial Accounting, 4th edition,
Educational Institute – American Hotel & Motel Association, East Lansing, MI,Chapter 10.
150
Problems
✓ indicates that a solution appears at the back of the text
✓ 9.1 Karen Brady, the general manager of the Curbside Motor Lodge in Central England,has approached you for advice in connection with her most recently quarterlyperformance report. The summarized version of the report is as follows:
The Curbside Motor LodgeFinancial performance report
for the quarter ended 30 September 20X1
Actual Budget Variance
Room nights sold 12,420 10,800
£ £ £Sales Revenue 1,179,900 1,080,000 99,900 (F)Variable Costs:
Labour 84,456 75,600 8,856 (U)Room amenities 5,216 5,400 184 (F)
Contribution Margin 1,090,228 999,000 91,228 (F)Fixed Costs 241,000 235,000 6,000 (U)Operating Profit 849,228 764,000 85,228 (F)

Flexible budgeting and variance analysis
Hosp
italit
y, L
eisu
re &
Tou
rism
Ser
ies
The lodge has produced this type of quarterly internal financial report for severalyears now. Karen has heard that some hospitality businesses are using flexiblebudgeting, a technique that she has not encountered before in her career. She iswondering what insights can derive from preparing flexible budgets and whether it isa technique that she should introduce at the lodge.
Required • • •(a) Prepare a flexible budget for the Curbside Motor Lodge for the quarter ending 30
September 20X1. Also record all flexible budget variances, and indicate whetherthey are favourable or unfavourable.
(b) In connection with the flexible budget performance report you have prepared forthe Curbside Motor Lodge, prepare a brief statement for Karen Brady thatsummarizes the benefits of flexible budgeting.
✓ 9.2 With respect to the previous problem concerned with the Curbside Motor Lodge,imagine you have conducted a detailed review of accounting records and found thefollowing.
� The budgeted wage rate was £14 per hour and the budgeted allowance forcleaning rooms was half an hour per room night sold. The actual average wagerate paid was £15 per hour and 5,630.40 hours were worked cleaning rooms in thequarter ended 30 September 20X1.
� Room amenities were provided in guest bathrooms in small transparent plasticpacks comprising shampoo, conditioner and a bar of soap. The lodge budgeted oneach amenity pack costing £0.50 and the provision of one amenity pack per roomnight sold. It appears, however, that the rate of one pack per room night wasexceeded as 13,040 amenity packs were issued from stock during the quarter.These amenity packs actually cost £0.40 each.
Required • • •(a) Calculate the room cleaning labour rate and efficiency variances.(b) Calculate the room amenity price and efficiency variances.(c) Calculate the selling price and sales volume variances.
✓ 9.3 Tiff’s Bordeaux restaurant serves breakfasts, lunches and dinner. In June it wasbudgeted that 500 covers would be served. The budgeted revenue and variable costper cover is presented in Schedule 1 below. In addition, the restaurant managerbudgeted that June’s fixed costs would be A800.
Schedule 1: Tiff’s RestaurantJune budgeted volume of covers, average revenue
and variable cost per cover served
Coversserved
Average revenueper cover
Variable costper cover
Breakfasts 100 A7 A2.5Lunch 150 A14 A5.0Dinner 250 A25 A10.0
151

Financial Management for Hospitality Decision Makers
Hosp
italit
y, L
eisu
re &
Tou
rism
Ser
ies
Actual results achieved in June are detailed in Schedule 2. Fixed costs actuallyincurred in June were A740.
Schedule 2: Tiff’s RestaurantJune actual volume of covers served, average revenue
and variable cost per cover served
Coversserved
Average revenueper cover
Variable costper cover
Breakfasts 110 A6.9 A2.20Lunch 100 A17.0 A5.40Dinner 300 A22.0 A9.50
Required • • •(a) Produce a flexible budget performance schedule for June that presents theflexible budget revenue variances and also the flexible budget variable cost variancesfor each of the three restaurant sittings.
(b) Comment on any variances that might warrant further managementinvestigation.
9.4 In the face of increasing local competition, the financial director of a large Canadianhotel complex convened a task force with the express purpose of identifying potentialcost-saving initiatives. One of the participants on the task force, the head ofengineering, aired the view that water consumption in the complex had risenconsiderably over the last couple of years and that this had occurred during a time ofincreasing water rates. The head of engineering felt that, as a result of minimal realaccountability in this area, little was being done to ensure efficient water usage. Herecommended that the hotel’s five restaurants should be separately metered in orderto monitor water consumption and that an appropriate accounting analysis be madeof performance with regards to water consumption. The task force agreed that thiswas an initiative worth pursuing. In the following month, all restaurants were meteredfor water consumption and monthly water expense budgets developed.
The ‘Niagra Falls’ restaurant’s monthly water expense budget was set at $600. Thiswas set based on an estimated monthly consumption of 60,000 litres of water at arate of $10 per 1,000 litres. In formulating this budget it had been agreed that watercan be viewed as a variable cost, i.e. when restaurant activity doubles, waterconsumption would double.
Niagra Falls’ performance in the first month of ‘water accountability’ was asfollows:
Covers served: 10% above budgetWater consumed: 90,000 litresCost per 1,000 litres: $9.50
Required • • •(a) Calculate water price and efficiency variances for Niagra Falls in the first month
of ‘water accountability’.(b) Who should be held accountable for the water efficiency variance, and who
should be held accountable for the water price variance?
152

Flexible budgeting and variance analysis
Hosp
italit
y, L
eisu
re &
Tou
rism
Ser
ies
9.5 The kitchen of the Ambience Hotel in Australia’s Gold Coast has developed a stronglocal reputation for its pastries. It sells the pastries to carefully chosen bakeries andalso through one of its restaurant outlets. At the beginning of the current financialyear, the company’s management established the standard that it should take half anhour of labour time to produce 1 tray of pastries. It was also budgeted that labourshould be paid at the rate of $14 per hour.
At the end of the January, the performance report for the kitchen revealed that 120hours had been worked by the pastry chefs. They were paid $1,440 and hadproduced 220 trays of pastries.
Required • • •(a) Calculate the labour rate and efficiency variances. Indicate whether each
variance is favourable or unfavourable.(b) Comment on any adverse implications that may arise from a head chef paying
particular attention on attaining favourable labour rate variances.
9.6 The kitchen of Sydney’s Deluxe Hotel makes large meat pies for sale in one of thehotel’s restaurants and also to a local meat pie retailer. It makes the pastry and alsothe meat sauce that goes into the pies. The budgeted direct cost of a pie is $2.80,made up as follows:
0.5 kg of meat $1.50100 grams of pastry $0.106 minutes of labour $1.20
Per unit budgeted standard direct cost $2.80
During June, 2,600 pies were made at the following cost:
1,400 kg of meat used at a cost of: $3,990270 kg of pastry used at a cost of: $300280 direct labour hours worked at a cost of: $4,060
Required • • •(a) Calculate the meat price and efficiency variances. Indicate whether each
variance is favourable or unfavourable.(b) Calculate the pastry price and efficiency variances. Indicate whether each
variance is favourable or unfavourable.(c) Calculate the direct labour price and efficiency variances. Indicate whether each
variance is favourable or unfavourable.(d) Do you see any potential shortcomings arising if significant importance is
attached to achieving favourable meat price variances?
9.7 (This question draws partially on material covered in the previous chapter)Val Dizzy Air is a hotel complex located in a well-known ski resort in Queenstown,New Zealand. The town’s population doubles during the skiing months of Junethrough to October, and hotel activity also doubles during these months.
A new chief administration officer was hired one year ago as part of an initiativedesigned to increase the hotel’s profitability. Among the new ideas introducedwas responsibility accounting. This was formally announced in a memorandum
153

Financial Management for Hospitality Decision Makers
Hosp
italit
y, L
eisu
re &
Tou
rism
Ser
ies
accompanying quarterly cost reports supplied to department heads. Previously, costdata were presented to department heads infrequently. Excerpts from the announce-ment and the first cost report received by the supervisor of laundry services arepresented below.
The new administrator constructed the annual budget for 20X3 and then divided itby four to facilitate the provision of quarterly feedback to the operating managers. Theadministrator considered establishing a budget according to an average of the priorthree years’ costs, hoping that installation of the system would reduce costs to thislevel. However, because of rapidly increasing prices, 20X2 costs, less 3%, werefinally chosen for the 20X3 budget. Activity levels were set at the volume achieved in20X2, which was approximately equal to the volume in each of the previous twoyears.
Val Dizzy Air Hotel
MEMORANDUM
To: Supervisor, Laundry Department
From: Hotel Chief Administration Officer
Date: 15 October 20X3
As I indicated to you in our last department heads’ meeting, I am introducinga quarterly performance reporting system. Please find your performancereport for July, August and September attached.
Under this new system, all heads of department will receive quarterlyreports, which will identify the costs of operating your department, yourdepartmental budget and variations between your actual performance andbudgeted performance. Highlighting variances in this manner will enable youto quickly identify aspects of your operation requiring immediate attention. Asyou know, I based this year’s budget for costs by taking last year’sperformance less 3%. I believe this to be an appropriate basis for our budgetsetting as it is consistent with our hotel’s philosophy of seeking continuousimprovement. I trust we would all agree that there is always scope forimprovement.
You will note from the report that your department’s costs are significantlyabove budget (all items over budget are indicated by way of brackets in thevariance column). I would be grateful if you could prepare a report for meoutlining why these variations have occurred and also what remedial actionsyou plan to implement.
154

Flexible budgeting and variance analysis
Hosp
italit
y, L
eisu
re &
Tou
rism
Ser
ies
Val Dizzy Air HotelLaundry Department quarterly performance report
3 months to 30 September 20X3
Actual Budget Variance % Variance
Room occupancy days 9,600 8,000 (1,600) (20%)Kilograms of laundryprocessed
100,000 80,000 (20,000) (25%)
$ $ $
Cleaning products 944 800 (144) (18%)Laundry equipment electricity 605 500 (105) (21%)Labour 9,200 8,000 (1,200) (15%)Salaried supervision 2,995 3,000 5 0.2%Laundry equipment depreciation 425 425 – –Facility maintenance 1,650 1,500 (150) (10%)Allocation of centraladministration overheads
896 800 (96) (12%)
16,715 15,025 1,690
Required • • •(a) Describe two ways that the budget-setting exercise could be improved at the Val
Dizzy Air Hotel. Your answer can refer to technical as well as behavioural aspectsof budget-setting.
(b) Explain whether the report effectively communicates the level of efficiency of thelaundry department.
(c) Redesign the quarterly performance report so that it provides a more meaningfuland fair appraisal of the performance of the supervisor of the LaundryDepartment.
9.8 Explain what is meant by ‘benchmarking’ and how it can be used to improveperformance.
155

C H A P T E R• • • • 10
Cost informationand pricing
L e a r n i n g o b j e c t i v e sAfter studying this chapter, you should havedeveloped an appreciation of:
1 Factors affecting pricing policy
2 Cost-based approaches to F&B pricing
3 Cost-based approaches to setting room rates
4 The importance of variable cost in the context ofshort-term price setting.

Cost information and pricing
Hosp
italit
y, L
eisu
re &
Tou
rism
Ser
ies
Introduction
Pricing is an important and challenging aspect of hospitality decision making. Thechoice on restaurant menus highlights the number of meals that have to be priced,and a price differential frequently exists between lunchtime and dinner menus. Withrespect to accommodation, many hotels offer a range of rooms with differentconfigurations. These different rooms have to be priced in busy as well as quietseasons. These pricing decisions are made more challenging by the fact that it is rareto find two restaurant meals that represent exactly the same dining experience, andno two hotel stays constitute exactly the same accommodation experience. As aresult, a hotel cannot conduct direct price comparisons to the same degree ascompanies operating in the retail sector. Supermarkets, for example, have a largevolume of goods to price, however they can conduct direct price comparisons withcompeting outlets that offer identical products.
The distinct nature of the various goods and services sold in the hospitalityindustry constitutes a further factor that complicates pricing. Compare the variablecost to revenue ratio for a room night sold with the variable cost to revenue ratio fora bottle of wine sold through a restaurant. The cost of selling one more room night(i.e. variable cost) is basically the cost of cleaning the room. The cost of selling onemore bottle of wine in a restaurant is basically the cost of purchasing the bottle ofwine. Cleaning a room might cost $10 and rooms may have a rack rate of $120, whilethe bottle of wine might cost $20 and command a restaurant price of $40. Note thelarge difference in the apparent percentage profit margin associated with these twosales. This apparent difference is misleading, however. In the cost data provided wehave excluded reference to fixed costs. The ratio of fixed costs to variable costs istypically much higher for accommodation activities than F&B activities. It isfrequently difficult to trace fixed costs to individual sales, however. As a result, ahigh price mark-up over variable cost does not necessarily signify a high mark-upover all costs.
This distinction between F&B and room pricing is particularly apparent when weconsider the range of price discretion apparent in the two areas. Exhibit 10.1demonstrates how there is greater price discretion in the case of rooms. This greaterprice discretion arises because it is presumed that the hotel would, at a minimum,want to cover its variable cost. As variable cost represents a greater proportion of theselling price for the bottle of wine, an F&B manager is relatively constrained in termsof being able to discount the wine’s selling price. Because of the significantlydifferent cost structures in F&B and the rooms division, pricing issues arising inthese two areas of hotel management are considered separately in this chapter.
If a hotel or restaurant has many local competitors, its volume of sales will beheavily affected by the prices it sets. A hotel that charges high room rates relativeto its local competition will achieve lower occupancy levels than if it were to dropits room rates. This signifies that room managers are bound to be confronted bythe need to manage the trade-off between a quest for achieving high room ratesand maintaining high levels of occupancy. A parallel can also be noted withrestaurant pricing. High pricing can be expected to result in reduced numbers ofcovers served.
When setting prices, managers obviously need to consider what prices are beingcharged by competitors. In addition, pricing needs to consider factors such as imagesought and whether management believes that setting a low price for a particular
157
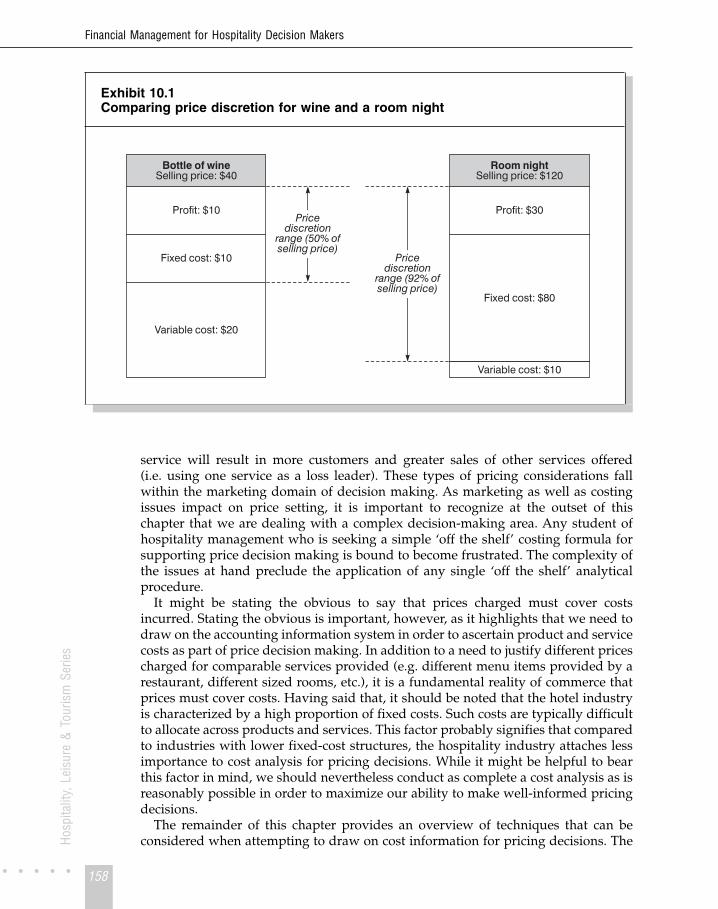
Bottle of wineSelling price: $40
Room nightSelling price: $120
Profit: $10
Fixed cost: $10
Variable cost: $20
Profit: $30
Fixed cost: $80
Variable cost: $10
Pricediscretion
range (50% ofselling price)
Pricediscretion
range (92% ofselling price)
Financial Management for Hospitality Decision Makers
Hosp
italit
y, L
eisu
re &
Tou
rism
Ser
ies
service will result in more customers and greater sales of other services offered(i.e. using one service as a loss leader). These types of pricing considerations fallwithin the marketing domain of decision making. As marketing as well as costingissues impact on price setting, it is important to recognize at the outset of thischapter that we are dealing with a complex decision-making area. Any student ofhospitality management who is seeking a simple ‘off the shelf’ costing formula forsupporting price decision making is bound to become frustrated. The complexity ofthe issues at hand preclude the application of any single ‘off the shelf’ analyticalprocedure.
It might be stating the obvious to say that prices charged must cover costsincurred. Stating the obvious is important, however, as it highlights that we need todraw on the accounting information system in order to ascertain product and servicecosts as part of price decision making. In addition to a need to justify different pricescharged for comparable services provided (e.g. different menu items provided by arestaurant, different sized rooms, etc.), it is a fundamental reality of commerce thatprices must cover costs. Having said that, it should be noted that the hotel industryis characterized by a high proportion of fixed costs. Such costs are typically difficultto allocate across products and services. This factor probably signifies that comparedto industries with lower fixed-cost structures, the hospitality industry attaches lessimportance to cost analysis for pricing decisions. While it might be helpful to bearthis factor in mind, we should nevertheless conduct as complete a cost analysis as isreasonably possible in order to maximize our ability to make well-informed pricingdecisions.
The remainder of this chapter provides an overview of techniques that can beconsidered when attempting to draw on cost information for pricing decisions. The
158
Exhibit 10.1Comparing price discretion for wine and a room night

Cost information and pricing
Hosp
italit
y, L
eisu
re &
Tou
rism
Ser
ies
chapter is structured as follows. Initially, we will review two factors affecting pricedecision making. The following section outlines traditional costing perspectives onF&B pricing, room rate setting and also contribution pricing.
Factors affecting pricingIn this section, the manner in which price elasticity and product or serviceperishability affect pricing policies is described.
Price elasticityA highly price elastic service is one where a change in price results in a relativelyhigh change in demand for the service. A service with low price elasticity, on theother hand, is one where a change in price results in a relatively low change in thedemand for the service. Higher degrees of price elasticity provide a potential formore imaginative approaches to pricing strategy. For example, if a particular hotelhas found that room sales are highly price sensitive, decreasing room rates duringthe off-season might represent an effective strategy to increase occupancy levels andtotal revenue. If, however, it has been found that room rates are relatively priceinelastic, dropping the room rate might not be an appropriate strategy as it will notresult in a significant increase in occupancy (if a hotel operates in a remote townwith no competitors, relatively low price elasticity is likely to result).
A product or service is viewed as being price elastic if a percentage change in priceresults in a greater percentage change in demand. For example, imagine that a hotelhas found that at a room rate of $120 it maintains an average sales level of 500 roomnights per week. In addition, it has also found that that if it increases its room rateby 10% to $132, a 15% reduction in demand will result, i.e. sales will drop to 425room nights per week. As the percentage change in demand is greater than thepercentage change in price the rooms can be described as price elastic. Priceelasticity is generally measured using the following formula:
Price elasticity =% change in quantity demanded
% change in price
If this formula yields a value greater than 1, the demand is price elastic. If it yieldsa value less than 1, the demand is inelastic.
Most introductory micro-economic texts provide a more detailed discussion of thenature of price elasticity. For the purposes of this text, it is important that hospitalitymanagement accounting students are aware of the concept of price elasticity, as itrepresents an important contextual consideration when determining a pricingstrategy for a particular product or service.
Perishability of the product or servicePricing strategies should take into account the degree to which a product or serviceis perishable. To illustrate the issue of perishability, let us compare a bottle of wineand a fresh cream cake that are available for purchase from a cafe that adjoins ahotel’s foyer. While these two items are sold through the same cash register, amanager would be justified in implementing very different pricing strategies for the
159

Financial Management for Hospitality Decision Makers
Hosp
italit
y, L
eisu
re &
Tou
rism
Ser
ies
two products. Let us assume that the unit variable cost of making the cakes is $1.20,and that immediately following production, the cakes are priced at $4 each. Let usalso assume that if a cake is not sold by the end of the day following its production,it will have to be discarded as waste. On the day following the cake’s production, ifthe cake is not sold by the time the cafe closes, its revenue-earning potential will belost forever. Accordingly, a manager might be justified in dropping the retail price ofthe cakes to $0.5 one hour before the cafe is due to close. Based on his experience,this results in most cakes selling and the manager justifies his action by saying:
If I didn’t drop the price, none of the cakes would sell in the final hour of theirlife. Better to make a loss of $0.70 per cake ($1.20 variable cost – $0.5revenue) than the $1.20 I’ve effectively lost when they’re tossed in the bin.What would you prefer, $0.5 or $0 in the till for the cake?
The bottle of wine does not suffer from the same perishability as the cream cake.The closing of the cafe on a particular day does not signify that the future revenuepotential of the bottle of wine is lost. Accordingly, the rationale for dropping theprice of cream cakes to a point that is below their variable cost does not apply to thebottle of wine. This issue of perishability is particularly pertinent in the hospitalityindustry. Much of what is produced by a restaurant’s kitchen is perishable. Inaddition, rooms and conference facilities can be viewed in a similar light. If, on aparticular night, a room is not sold, the revenue-earning potential of that particularroom night has been lost forever. As the likelihood of this loss occurring increases asthe time for the unsold room night approaches, so the incentive for dropping theprice of the room increases. In a manner paralleling the cream cake example, it isbetter to gain some revenue rather than earn no room revenue for the room.
The room example differs in one key regard to the cream cake example, however.The room sale generates subsequent costs, i.e. the room will have to be cleaned.Therefore, unlike the cake example where earning some revenue was viewed asbetter than earning no revenue, in the room-pricing situation the room rate shouldnot be set below the variable cost of servicing the room. This difference arises as thesale of the cake does not generate subsequent costs.
This discussion of pricing perishable products and services needs to be placed inthe context of marketing issues. Care must be taken when discounting items as theyapproach their time of expiry. Heavy price discounting can result in damaging ahotel’s image. It can also result in customers, who are aware of the practice,deferring their purchase until after the discounted price is offered.
Traditionally applied pricing methodsIn this section we initially consider food and beverage pricing issues. This isfollowed by a description of techniques relating to setting room rates. The sectionconcludes with a discussion of contribution pricing, which concerns the significantnature of variable cost in short-term pricing situations.
Food and beverage pricingCost-plus pricing is extensively applied in food and beverage management. Theapproach involves identifying costs traceable to the food or beverage item to be
160

Cost information and pricing
Hosp
italit
y, L
eisu
re &
Tou
rism
Ser
ies
priced and marking up the cost by a multiple in order to determine a selling price.Compared to pricing meals on a restaurant menu, pricing beverages on a cost mark-up basis is relatively straightforward. This is because beverages served frequentlycontain only one purchased ingredient, sometimes they contain two ingredients, butseldom more than three ingredients. The situation is very different, however, whencosting meal items on a restaurant menu. Meals can comprise many ingredients anddetermining the cost and quantity of each ingredient used can be challenging. Thisis because some ingredients have a kitchen labour component, and some are subjectto seasonal and daily cost fluctuations. For this reason, when determining the costof a meal, it is common practice to restrict the costing exercise to the mainingredients used.
Cost-plus pricing of a particular menu item will be illustrated through thefollowing worked example. Imagine that an analysis has been conducted todetermine the cost of the ingredients in a fish dinner at Marseille’s Poissonrestaurant. This analysis has resulted in the preparation of the schedule presented asExhibit 10.2.
It will be assumed that the Poisson restaurant has a pricing strategy of marking upits ingredient costs by a multiple of 8. From Exhibit 10.2 it is apparent that theingredients in the fish salad have been estimated to cost A2.80. The price to becharged can be calculated as follows:
Cost of meal ingredients × ‘Cost-plus’ multiple = Price
i.e. A2.80 × 8 = A22.40
Because of marketing considerations such as customer attitudes to differentprice bands, prices charged by competitors for similar meals, etc., management islikely to round the ‘raw price’ of A22.40 to a price that is consistent with itsmarketing strategy on pricing. For instance, the restaurant may have a strategy ofsetting its prices at 5 cents below the nearest round Euro. This would mean thatthe raw price calculated might be rounded down to A21.95 or rounded up toA22.95.
A variation on this pricing example might involve including only the mainingredient in the costing analysis. Such an approach might be justified on severalgrounds. First, it would make the costing analysis easier. Second, the main
161
Exhibit 10.2Poisson restaurant – cost of ingredients used in fish salad
Ingredient E cost
Fish 2.00Potato salad 0.18Green salad (lettuce, tomato, etc.) 0.28Rice 0.14Bread roll and butter 0.20
Total 2.80

Financial Management for Hospitality Decision Makers
Hosp
italit
y, L
eisu
re &
Tou
rism
Ser
ies
ingredient accounts for the bulk of the total cost of all ingredients. Third, it may wellbe that the main ingredient’s cost is more volatile than the other ingredients, with theresult that changes in restaurant prices need to reflect changes in the cost of the mainingredient. If price is to be determined based on the main ingredient alone, clearlythe ‘cost-plus’ multiple will have to be greater in order for the restaurant to earn thesame level of gross profit for the meal. Returning to the example illustrated inExhibit 10.2, if the Poisson restaurant uses cost-plus pricing based on the mainingredient alone, it might use a multiple of 11. Applying this multiple to the cost offish served provides the following raw price calculation:
Cost of main ingredient × cost plus multiple = Price
i.e. A2.00 × 11 = A22.00
The issue of applying a multiple to cost in order to determine a desired price raisesan issue that frequently troubles students of accounting. A percentage mark-up oncost is not the same as a gross profit margin percentage. The former concerns apercentage of cost while the latter concerns a percentage of selling price. Thisdistinction can be illustrated through a simple example. Imagine a restaurant buysits house wine for $16 per bottle and prices it on the menu at $20. The cost mark-upstated as a percentage is 25% ($4 ÷ $16 × 100). However, gross profit margin as apercentage is 20% ($4 ÷ $20 × 100). From this example it can be seen that if a serviceis being sold at a 24% gross profit margin, it is earning less profit than a service witha 20% cost mark-up.
Setting room ratesA variety of cost-based approaches can be used to inform the setting of room rates.Three of these approaches are outlined here. First, a rule of thumb approach knownas the ‘rule of a thousand’ can be utilized. Second, where a hotel has severaldifferently sized rooms, room pricing can be based on room size. Third, hotelmanagement can determine the level of profit sought as a function of investment,and attempt to work back to the price that has to be charged in order to provide therequired profit level.
Rule of a thousand approach to room rates • • •The rule of a thousand approach to setting room rates is outlined through a workedexample in Box 10.1.
This method should be regarded as a rather vague rule of thumb approach, as itfails to address key issues such as seasonality of demand and the time at whichinvestment was made in competing hotels. If a hotel that was built prior to a periodof high inflation in building costs applied the rule of a thousand when setting roomrates, it is unlikely that a competing hotel built following the high-inflation periodcould survive by also applying the same pricing strategy. If the second hotel were toapply the rule of a thousand, it would have higher rates and would lose muchcustom to its competitor.
162

Cost information and pricing
Hosp
italit
y, L
eisu
re &
Tou
rism
Ser
ies
Relative room size approach to setting room rates • • •The relative room size approach to pricing is explained via a worked example inBox 10.2.
Required rate of return approach to setting room rates • • •This approach involves determining what room rate must be charged to generate anannual revenue that is sufficient to cover all costs and taxes and, in addition, providea sufficient level of profit to meet the owners’ targeted return on investment. In theUnited States this approach is widely referred to as the ‘Hubbart formula’. It is alsosometimes referred to as the ‘bottom-up’ approach to setting room rates as, once theowners’ required rate of return has been determined (i.e. the hotel’s net profit whichis on the last line of the profit and loss statement), the technique involvesprogressing up the elements referred to in the profit and loss statement, culminatingin the term referred to on the first line of the statement, i.e. sales revenue. Thetechnique will be illustrated through the following worked example.
Imagine that the ComfortAssured is a 180-room Winnipeg hotel with assets of $10million and liabilities of $7 million. The hotel’s owners are seeking a 14% annualreturn on their investment. The hotel is subject to 40% tax and pays 9% interest ona loan of $6.75 million. Other fixed costs, which include administration, depreciationand energy, total $2 million per annum. The food and beverage departmentgenerates $400,000 in profit prior to the deduction of fixed costs. The hotel projectsan average occupancy of 65% and is open 365 days a year, i.e. 42,705 room nights aresold per annum (180 × 0.65 × 365). The rooms department has estimated variablehousekeeping costs of $15 per room sold.
The calculations required to determine the average room rate required to providethe owners with their target ROI are shown in Exhibit 10.3. As already noted, the keyto understanding this schedule stems from an appreciation that it represents anupward movement through the hotel’s profit and loss statement. This approachstems from the fact that in this schedule we are not seeking to calculate profit (whichis the last line in a conventional profit and loss statement), instead we aredetermining the level of revenue (i.e. the first line in a conventional profit and lossstatement) that is sufficient to provide a target profit level.
163
Box 10.1Rule of a thousand approach to setting room rates
One broad sweep indicator of room pricing that has been referred to for many years in theindustry is the ‘rule of a thousand’. This involves setting room prices at the rate of $1 for every$1,000 capital invested in a room. For example, assume that the total cost of building a100-room hotel is $15,000,000, and that 20% of the infrastructure investment relates tonon-accommodation hotel activities such as F&B. By spreading the $12,000,000 invested inaccommodation (80% of $15,000,000) across the 100 rooms we can determine the investmentin each room to be $120,000 ($12,000,000 ÷ 100). Application of the $1 charged for every$1,000 invested formula would result in room rates being set at $120 ($120,000 ÷ 1,000).

Financial Management for Hospitality Decision Makers
Hosp
italit
y, L
eisu
re &
Tou
rism
Ser
ies
164
Box 10.2Relative room size approach to pricing
Imagine London’s Britannica Hotel has 20 rooms that are 125 square metres and 40 roomsthat are 100 square metres. Both types of room run at a 70% occupancy level. The roomsmanager is seeking a revenue of £1,474,200 for the 360 days that the hotel will be open nextyear. Based on room size, at what rate should the rooms be priced?
Note that the 20 large rooms are 25% larger than the 40 small rooms, therefore, based onroom size they will a command a rate that is 25% higher than that charged on the smallrooms. The key to determining this problem is to determine how many square metres will besold on the average night, and then to determine at what rate each square metre must becharged in order to provide the desired level of revenue.
Total square metres that will be sold on the average night:
Number ofrooms
Squaremetres
Occupancy Total squaremetres sold
20 × 125 × 0.7 = 1,75040 × 100 × 0.7 = 2,800
4,550
Average revenue required per night is the target annual revenue divided by the number ofdays the hotel is open in the year:
£1,474,200 ÷ 360 = £4,095
Rate to charge each square metre is the average revenue required per night divided by thetotal square metres sold:
£4,095 ÷ 4,550 = £0.9
As each square metre needs to be charged at £0.9 per night, the 20 large rooms should havean average rate of £112.50 (125 × £0.9), and the 40 smaller rooms should have an averagerate of £90 (100 × £0.9).
We can check to see whether this solution is correct by calculating whether it provides the£1,474,200 target annual revenue.
Total square metres that will be sold on the average night:
Number ofrooms
Occupancy £Rate
Annualoperating days
Total £revenue
20 × 0.7 × 112.50 × 360 = 567,00040 × 0.7 × 90 × 360 = 907,200
£1,474,200

Cost information and pricing
Hosp
italit
y, L
eisu
re &
Tou
rism
Ser
ies
The $83.08 computed in Exhibit 10.3 for the ComfortAssured Hotel can be used asa target average room rate, as it is sufficient to provide the owners’ their target ROI.If the hotel has a mixture of double and single rooms and management would liketo charge a $15 premium for the double rooms, we can determine what price shouldbe charged for each type of room. Imagine that 60 of the ComfortAssured’s 180rooms are doubles and that both room types have an average occupancy of 65%. Thissignifies that the hotel will sell an average of 39 double rooms per day (0.65 × 60),and 78 single rooms per day (0.65 × 120). The price to be charged for each room typecan be determined by solving the following equation in which p represents the priceto be charged for the single rooms and p + 15 is the price to be charged in the doublerooms.
Note that average required daily revenue from rooms =
$9,720.75 (i.e. $3,548,075 ÷ 365).
78p + 39 (p + 15) = 9,720.75
78p + 39p + 585 = 9,720.75
117p = 9,135.75
p = 78.08
165
Exhibit 10.3Using required rate of return to set room rates
Description ofamount required
Calculation $Amount
Net profit required to meetowners’ target ROI
Owners equity × 14%:($10,000,000 –$7,000,000) × 0.14
420,000
Required pre-tax profit Required profit ÷ (1 – tax rate):a
$420,000 ÷ (1 – 0.4)700,000
Required profit before taxand interest
Add interest:$700,000 + (0.09 × $6,750,000) =$700,000 + $607,500 = $1,307,500
1,307,500
Required profit beforededuction of all fixed costs
Add fixed costs:$1,307,500 + $2,000,000 = $3,307,500
3,307,500
Profit required from rooms Deduct profits provided by other departments:$3,307,500 – $400,000
2,907,500
Total revenue requiredfrom rooms
Add variable housekeeping costs (rooms sold × $15):(42,705 × $15) + $2,907,500 =$640,575 + $2,907,500 = $3,548,075
3,548,075
Required average roomrate
Total revenue required from rooms ÷ number of rooms soldper annum:
$3,548,075 ÷ 42,705
83.08
aSee Chapter 7 for a discussion of calculating a pre-tax amount.
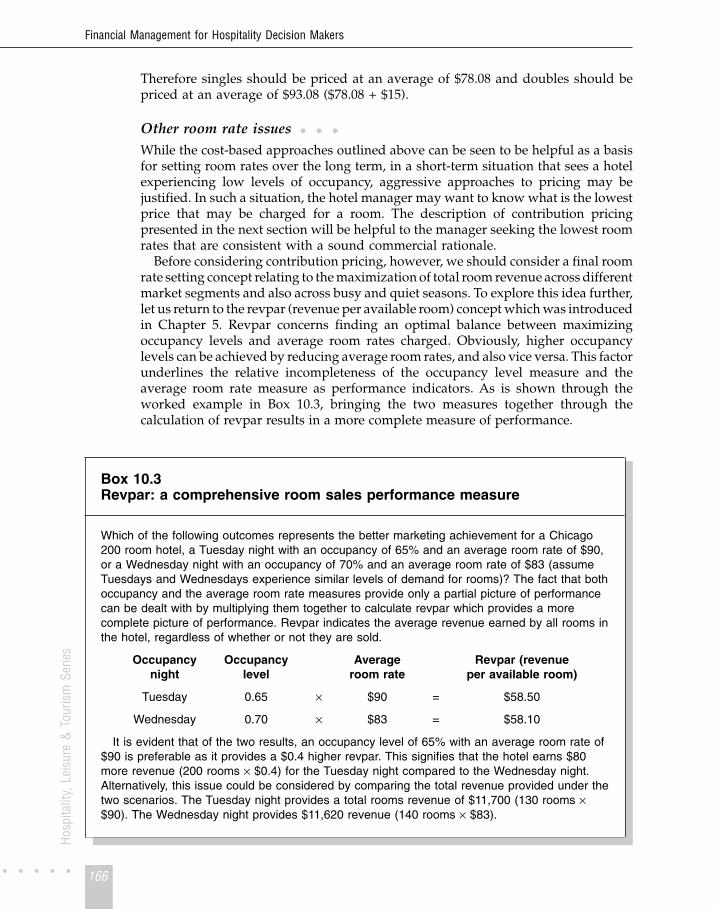
Financial Management for Hospitality Decision Makers
Hosp
italit
y, L
eisu
re &
Tou
rism
Ser
ies
Therefore singles should be priced at an average of $78.08 and doubles should bepriced at an average of $93.08 ($78.08 + $15).
Other room rate issues • • •While the cost-based approaches outlined above can be seen to be helpful as a basisfor setting room rates over the long term, in a short-term situation that sees a hotelexperiencing low levels of occupancy, aggressive approaches to pricing may bejustified. In such a situation, the hotel manager may want to know what is the lowestprice that may be charged for a room. The description of contribution pricingpresented in the next section will be helpful to the manager seeking the lowest roomrates that are consistent with a sound commercial rationale.
Before considering contribution pricing, however, we should consider a final roomrate setting concept relating to the maximization of total room revenue across differentmarket segments and also across busy and quiet seasons. To explore this idea further,let us return to the revpar (revenue per available room) concept which was introducedin Chapter 5. Revpar concerns finding an optimal balance between maximizingoccupancy levels and average room rates charged. Obviously, higher occupancylevels can be achieved by reducing average room rates, and also vice versa. This factorunderlines the relative incompleteness of the occupancy level measure and theaverage room rate measure as performance indicators. As is shown through theworked example in Box 10.3, bringing the two measures together through thecalculation of revpar results in a more complete measure of performance.
166
Box 10.3Revpar: a comprehensive room sales performance measure
Which of the following outcomes represents the better marketing achievement for a Chicago200 room hotel, a Tuesday night with an occupancy of 65% and an average room rate of $90,or a Wednesday night with an occupancy of 70% and an average room rate of $83 (assumeTuesdays and Wednesdays experience similar levels of demand for rooms)? The fact that bothoccupancy and the average room rate measures provide only a partial picture of performancecan be dealt with by multiplying them together to calculate revpar which provides a morecomplete picture of performance. Revpar indicates the average revenue earned by all rooms inthe hotel, regardless of whether or not they are sold.
Occupancynight
Occupancylevel
Averageroom rate
Revpar (revenueper available room)
Tuesday 0.65 × $90 = $58.50
Wednesday 0.70 × $83 = $58.10
It is evident that of the two results, an occupancy level of 65% with an average room rate of$90 is preferable as it provides a $0.4 higher revpar. This signifies that the hotel earns $80more revenue (200 rooms × $0.4) for the Tuesday night compared to the Wednesday night.Alternatively, this issue could be considered by comparing the total revenue provided under thetwo scenarios. The Tuesday night provides a total rooms revenue of $11,700 (130 rooms ×$90). The Wednesday night provides $11,620 revenue (140 rooms × $83).

Cost information and pricing
Hosp
italit
y, L
eisu
re &
Tou
rism
Ser
ies
As a performance measure, revpar is preferred to total revenue as it facilitatesbenchmarking comparisons across hotels with different numbers of rooms. Itshould, however, be recognized that maximizing revpar does not necessarily signifyprofit maximization. In a situation of major room rate discounting, the higher revparassociated with an increase in occupancy could result in a lower level of overallprofit if the increased total revenue does not outweigh the additional housekeepingand energy costs associated with the hotel’s increased level of activity. Althoughincreased costs for the rooms department result from increased levels of occupancy,there will also be increased F&B profit made from additional F&B sales resultingfrom the higher occupancy level. In addition, greater future profitability may resultfrom favourable word of mouth promotion provided by the additional guests. Allthese factors need to be borne in mind when using a performance measurementsystem that attaches high importance to maximizing revpar. When a hotel usesmarket segment demand data as part of an attempt to maximize revpar over thelong term, it is generally described as practising yield management. This approachto pricing is commented upon in Case 10.1.
Case 10.1Financial Decision Making in Action –
The Sales and Marketing Manager and yield management
The application of pricing strategies designed to maximize revpar is often referred to as‘yield management’. Yield management involves sales and marketing managementdeveloping pricing plans that recognize factors such as whether a reservation pertains toa quiet or busy season, weekday or weekend and also the nature of a customer’s marketsegment (e.g. tour group booking vs a single transient guest).
The distinguishing feature of yield management relates to its focus on maximizingrevpar rather than simply attempting to maximize occupancy levels. To illustrate yieldmanagement decision making, consider the case of a reservation office deliberatingwhether to make an advanced sale of rooms to a tour operator. The hotel has 200 roomsand charges $80 per room for advanced bookings except for those placed by touroperators who are granted a 25% discount. A tour operator wants to book 30 rooms forthree nights in two months’ time. The hotel has already sold 170 of its rooms for the three-day period in question, and the sales department projects that if the sale is not made to thetour operator, 80% of the remaining rooms will be sold to full rate paying guests. Thereservations office can determine whether the sale should be made to the tour operator bycomparing projected revenue with and without the tour operator booking.
Revenue per night if sale is made to tour operator
170 rooms sold at $80 13,600
30 rooms sold at $60 1,800
$15,400
Revenue per night if sale is not made to tour operator
194 rooms sold at $80 $15,520
167

Financial Management for Hospitality Decision Makers
Hosp
italit
y, L
eisu
re &
Tou
rism
Ser
ies
As total revenue is greater if the sale is not made to the tour operator, the reservationsoffice should not reserve rooms for the tour operator.
This represents a fairly simplified example. It does, however, highlight that asyield management involves an attempt to match pricing to demand factors, itseffectiveness is heavily reliant on the maintenance of a well-developed demandforecasting system. This is a key issue for a hotel’s sales and marketing departments. Itshould be noted, however, that today yield management is generally highly computer-ized. Yield management computer software can track data such as: occupancy levels bymarket segment, the incidence of cancelled reservations, proportion of ‘no shows’, aswell as revenue lost through high-price customers being displaced by low-pricecustomers.
Contribution pricingContribution pricing is a particular type of cost-plus pricing where a mark-up isattached to a service or product’s variable cost. While contribution pricing can beapplied in the rooms, restaurant, and bar areas, it will be explored here in the contextof conference and banqueting operations. Applying contribution pricing in this areais particularly appropriate due to the fact that it is relatively easy to identify thevariable costs associated with hosting conferences and banquets (i.e. the cost ofadditional refreshments and covers served). In addition, contribution managementcan provide a useful perspective on conference and banquet price decision makingduring periods of excess capacity (i.e. during a period of low demand forconferences).
Contribution pricing allows the conference manager to determine the lowestprice that can be charged while ensuring a positive contribution towards profitresults from hosting the conference. Such an aggressive pricing policy might beparticularly pertinent during a period of excess capacity if any of the followingapplies:
(a) Competitors are very aggressively pricing their conference facilities(b) Hosting a conference results in the hotel increasing hotel profits in other areas,
e.g. the rooms and F&B departments(c) Hosting a particular conference carries the potential of stimulating further
conference sales in the future.
From the example in Box 10.4, it is apparent that the unit of analysis affects theway that we look at variable cost (i.e. in this example we have conducted theanalysis at the level of the whole conference as well as the individual attendee level).While this aggressive approach to pricing can be justified in the short term (in orderto utilize capacity that would otherwise be idle) or on the basis of one or more of thethree factors outlined above, it should be noted that it should not be viewed as along-term pricing strategy. Over the long term, fixed as well as variable costs haveto be covered if a profit is to result. Despite this, a justification could be made forrunning conferences at a price that results in a loss to the conference department, ifincreased conference activity has a positive impact on the hotel’s overall profitabilitydue to increased F&B and room sales.
168

Cost information and pricing
Hosp
italit
y, L
eisu
re &
Tou
rism
Ser
ies
Box 10.4Applying contribution pricing
Imagine a European conference organizer has approached a Munich hotel in connection witha proposed conference to be attended by approximately 200 delegates (the organizerestimates an attendance of not less than 150 and not more than 250 delegates). If a pricequotation is being sought where the organizer has confirmed an attendance of exactly 200attendees, the variable cost can be calculated at the level of the total conference as follows:
Variable cost for hosting conference with 200 attendees
E
Morning refreshments (A1 per person × 200 attendees) 200Lunch (A5 per person × 200 attendees) 1,000Afternoon tea (A1 per person × 200 attendees) 200Cost of 2 additional casual staff 300
Total variable cost for conference 1,700
If, however, the conference organizer is seeking a quotation on a ‘per attendee’ basis, thevariable cost analysis would have to be modified, as the cost of additional casual staff doesnot vary according to the number of attendees (it is assumed that the two additional casualstaff would be required regardless of whether there are 150 or 250 attendees). The cost of twocasual staff therefore represents an incremental cost of the conference, but a fixed cost interms of the number of attendees.
Variable cost per attendee attending proposed conference
E
Morning refreshments (A1 per person × 200 attendees) 1Lunch (A5 per person × 200 attendees) 5Afternoon tea (A1 per person × 200 attendees) 1
Total variable cost per attendee 7
In variable costing, it is generally claimed that so long as a price is charged that exceedsvariable cost, a positive contribution towards profit results. In this case, the variable costanalysis conducted at the ‘per attendee’ level has resulted in the exclusion of casual labour. Asthe two additional casual staff represent an incremental cost of holding the conference, ifpricing is based on the above ‘per attendee’ analysis, an additional mark-up would have to beincluded to cover the incremental cost of casual staff.
169
Summary
Due to the subject matter of this book, the pricing approaches outlined in this chapter have afinancial orientation. As noted in the introduction, the provision of accurate financialinformation is imperative in a price-sensitive industry such as the hospitality industry. Thisprice sensitivity has doubtlessly resulted in some managers, uninformed by an appropriatefinancial analysis, setting prices below cost. The significance of cost information for pricing

Financial Management for Hospitality Decision Makers
Hosp
italit
y, L
eisu
re &
Tou
rism
Ser
ies
becomes particularly apparent when we recognize that setting prices below variable costmeans that the more we sell, the more we lose. We should nevertheless remind ourselves thatprovision of costing information is only part of the management information required forwell-informed pricing setting. Marketing factors, which can include issues such as competitorpricing, image sought, the possibility of loss-leader pricing etc., also need to be consideredwhen formulating a pricing strategy.
In the chapter we have reviewed how factors such as perishability affect pricing policy. Wehave also seen how ‘cost-plus’ pricing approaches can be used in the context of F&B. Due tothe high fixed cost structure associated with the provision of accommodation, room pricing isslightly more complicated. Several approaches to setting room rates, including basing priceson room size and a required rate of return, were reviewed. In addition, the importance of yieldmanagement was described in the context of a hotel’s sales and marketing function.
Having read the chapter you should now know:
� The meaning of price elasticity and the significance of product and service perishabilitywhen approaching pricing decisions
� How a ‘cost-plus’ approach can be used in F&B pricing� How to apply the ‘rule of a thousand’ when setting room rates� How to apply the ‘relative room size’ approach to setting room rates� How to apply the required rate of return approach to setting room rates� What is meant by yield management� The importance of maintaining a positive contribution margin (i.e. covering variable cost)
when discounting prices.
References
Atkinson, H., Berry, A. and Jarvis, R. (1995) Business Accounting for Hospitality andTourism & Leisure, International Thomson Publishing, London, Chapter 14.
Coltman, M. M. and Jagels, M. G. (2001) Hospitality Management Accounting, 7thedition, John Wiley, Chichester, Chapter 6.
Hansen, D.R. and Mowen, M. M. (2000) Management Accounting, 5th edition, South-Western, Cincinnati, OH, Chapter 17.
Harris, P. (1999) Profit Planning, Butterworth-Heinemann, Oxford, Chapter 6.Kotas, R. (1999) Management Accounting for Hospitality and Tourism, 3rd edition,
International Thomson Publishing, London, Chapter 8.Owen, G. (1994) Accounting for Hospitality, Tourism & Leisure, Pitman Publishing,
London, Chapter 12.Schmidgall, R. F. (1997) Hospitality Industry Managerial Accounting, 4th edition,
Educational Institute – American Hotel & Motel Association, East Lansing, MI,Chapter 8.
Problems
✓ indicates that a solution appears at the back of the text
✓ 10.1 Aberdeen’s Thrifty hotel has forty rooms and has historically achieved an averageoccupancy of 55%. The hotel’s assets have a book value of £450,000 and the ownersbelieve the assets should generate a 15% return after tax. Assume tax is charged atthe rate of 50%.
170

Cost information and pricing
Hosp
italit
y, L
eisu
re &
Tou
rism
Ser
ies
The hotel has several fixed costs which include 9% interest charged on a £250,000bank loan, £40,000 of equipment and fittings depreciation and other fixed costs of£65,000 per year.
The hotel’s manager believes that the 55% occupancy level will again be achievednext year, and estimates that this level of activity will result in £85,000 of operatingexpenses.
Required • • •Assuming the hotel is open 365 days per year, calculate the room rate that should becharged in order to provide the owners with their target profit level.
✓ 10.2 The following information relates to a family-owned Adelaide restaurant:
Manager’s salary: $55,000 p.a.
Interest: Loan of $100,000 is outstanding; 8%annual interest rate
Depreciation: Equipment and furniture with book value of$120,000 is being depreciated at 25% ofbook value
Licence: $5,000 p.a.
Insurance: $6,000 p.a.
Maintenance: $4,000 p.a.
Other salaries: $28,000 p.a.
Variable costs: 75% of revenue
Before-tax operating profit target: 50% of owners’ investment of $120,000
Required • • •(a) What sales revenue does the restaurant have to achieve in order to make its
before-tax operating profit target?(b) The restaurant is closed for three weeks each year. In the remainder of the year
(assume 49 weeks) it opens every day except Mondays. The restaurant has 50seats, and averages a seat turnover of two times per day in the week and threetimes per day on Saturdays and Sundays. What must the average cover price bein order to achieve the target profit level?
✓ 10.3 The rooms manager of a new 90-room hotel in Texas has approached you seekingadvice on what room rates should be charged. The hotel, which will be open for 365days of the year, has the following three types of room:
Number of rooms Type Size
30 Economy 60 sq. metres30 Double 80 sq. metres30 Deluxe 110 sq. metres
The hotel’s balance sheet indicates that $18,000,000 has been invested in thebuilding and 30% of the building is dedicated to non-accommodation activities suchas F&B.
171

Financial Management for Hospitality Decision Makers
Hosp
italit
y, L
eisu
re &
Tou
rism
Ser
ies
Required • • •(a) According to the ‘rule of a thousand’ approach ($1 charge for each $1 invested),
what should be the average room rate charged?(b) Assume the rooms manager projects that each type of room will achieve a 70%
occupancy level. If the hotel is seeking to achieve a total revenue of $3,066,000from rooms next year and wishes to set room rates based on size, what rateshould the hotel charge for each of its rooms?
10.4 The manager responsible for pricing merchandise in a souvenir shop located in thefoyer of a hotel is discussing pricing strategy with a shop assistant. The two haveagreed on a policy of aggressively pricing a specific set of items. When discussingpricing, the shop assistant is used to talking of marking up cost by a specificpercentage. The manager, however, is more familiar with referring to ‘gross profitmargin’, a term which tends to be used at management meetings in the hotel. Theassistant has indicated that based on her experience in other merchandisingsituations, the minimum acceptable cost mark-up is 25%. Following discussions atthe most recent monthly management meeting, the manager feels that a gross profitmargin of 20% is acceptable for loss-leader items. The manager realizes, however,that he is using a different terminology from that used by the assistant. As a result ofthis he has decided to phone the accounting department to clarify the differencebetween ‘% cost mark-up’ and ‘% gross profit margin’.
Required • • •Through the use of a hypothetical example, demonstrate whether a 25% cost mark-up results in more profit than a 20% gross profit margin.
10.5 Hamilton’s Carvery restaurant has had a Sunday seat turnover of 5 while charging$40 per cover for its lunch to dinner ‘all you can eat roast’ special. The chef isconsidering increasing the price of the special meal to $45 and estimates that this willreduce the Sunday seat turnover to 4.5.
Required • • •For the price change proposed, determine whether the ‘all you can eat’ Sundayspecial is price elastic or inelastic.
10.6 Bristol’s Severn Bridge restaurant uses cost-plus pricing as an aid to determiningwhat prices to charge for its menu items. Identified below are the findings of a recentanalysis of the cost of the ingredients used in a traditional roast beef dinner. Therestaurant has a policy of marking up the cost of its ingredients by a multiple of 8.
Ingredient £ Cost
Beef 1.68Potatoes 0.24Carrots 0.16Peas 0.14Sprouts 0.20Yorkshire pudding 0.10
Total 2.52
172

Cost information and pricing
Hosp
italit
y, L
eisu
re &
Tou
rism
Ser
ies
Required • • •(a) What price should the restaurant charge for the roast beef dinner if it wishes to
achieve a mark-up multiple of 8?(b) The restaurant is considering taking a simpler approach to its mark-up
calculations of menu items. Under this simplified approach, only the mainingredient of each meal will be costed and price will be determined by using arevised cost mark-up multiple. If the restaurant wishes to earn the same level ofprofitability from its roast beef dinner what mark-up multiple should it attach to thecost of the main ingredient?
10.7 Quebec’s BonVivant hotel has 200 rooms. It sets its room rates according to a policyof charging $120 per night to business clients and $90 per night for group bookings.It has found that most guests stay for three nights. A manager is attempting todetermine whether a four-week advance reservation should be made for a group of40 seeking accommodation on the nights of 20, 21 and 22 June. Eighty rooms forthese three nights have already been booked by business clients and pastpurchasing patterns suggest that, subject to availability, 90% of the remaining 120rooms will also be sold to business clients.
Required • • •Determine whether it is in the hotel’s interest to accept the group booking for the partyof 40.
173
C H A P T E R• • • • 11
Working capitalmanagement
L e a r n i n g o b j e c t i v e sAfter studying this chapter, you should havedeveloped an appreciation of:
1 The manner in which cash budgeting representsan important tool in cash management
2 The reasons profit is not the same as cash
3 Factors that need to be considered whenextending credit to a customer
4 The role of an accounts receivable ageingschedule in credit management
5 How the economic order quantity (EOQ) caninform purchasing decisions
6 When to take advantage of a supplier’s offer of adiscount for early payment
7 The risk/return tradeoff apparent in short- vslong-term financing of current assets.
Working capital management
Hosp
italit
y, L
eisu
re &
Tou
rism
Ser
ies
Introduction
Working capital was defined in Chapter 5 as current assets minus current liabilities.In this chapter we explore financial management issues relating to the mainelements comprising current assets and current liabilities, i.e. cash, accountsreceivable, inventory and accounts payable.
Initially, we will highlight the distinction between cash flow and profit. A clearunderstanding of this distinction is important. The immediate cause of bankruptcyis not a business’s failure to make profit. Bankruptcy occurs when a firm does nothave enough cash to honour liabilities that are due for payment. We will highlightthis distinction between cash flow and profit by working through the mechanics ofpreparing a cash budget. The cash budget is particularly important as it predicts thetiming of cash surpluses and deficits. Knowing when there will be a cash surplusallows investment plans to be formulated. Knowing the timing of a projected cashdeficit allows short-term borrowing arrangements to be made in advance of the cashshortfall occurring. Failure to predict the timing of cash shortfalls can result in costlyborrowing arrangements, or, much worse, bankruptcy.
In connection with accounts receivable management, we will consider factorsthat should be taken into account when deciding whether to extent credit to acustomer. In addition, the nature and use of an ageing of accounts receivableschedule will be introduced. Following this, the economic order quantity (EOQ),which is a tool that can shed light on the optimal purchase order size for inventory,will be described.
In connection with accounts payable management, a technique enabling you todetermine whether to accept a supplier’s offer of a discount for early payment willbe introduced. This technique is not only useful in accounts payable management, italso represents a fundamentally important analytical tool for any managerconsidering offering corporate customers a discount for early payment.
Finally, issues surrounding different approaches to financing a hotel’s investmentin current assets will be explored. We will see that a risk/return trade-off underliesthe question of how much short-term, relative to long-term, borrowing should beundertaken. If a hotel uses a relatively high degree of short-term financing, it will bereducing its costs (i.e. increasing its return) but decreasing its net working capital(i.e. increasing its risk), and vice versa.
Cash managementIt is important to understand that net cash flow is not the same as profit earned ina period. It is an alarming reality that many business managers have a negligibleappreciation of this fundamental aspect of accounting. As a result, business failurescan frequently be attributed to managers’ failure to recognize a looming liquiditycrisis (liquidity refers to the ability to honour short-term financial obligations whenthey are due). Part of the problem stems from management’s tendency to giveinsufficient attention to cash management, due to an overly blinkered focus onprofit. This management tendency is understandable when we recognize thewidespread use of profit as a key business performance indicator.
By requiring regular and careful preparation of cash budgets, we can counter thistendency for ‘profit myopia’. This is because cash budgets:
175

Financial Management for Hospitality Decision Makers
Hosp
italit
y, L
eisu
re &
Tou
rism
Ser
ies
1 Identify periods in which a cash deficit is anticipated. Failure to predict suchperiods is not only potentially costly, it can represent commercial suicide. If a hotelunexpectedly runs out of cash and no lender can be found at short notice, it willhave to either liquidate some assets, quickly arrange some long-term finance, ordefault on liabilities due. An attempt to hastily pursue either of the first twooptions is likely to result in a costly outcome. By predicting cash deficit periods,however, early negotiations can be conducted with a lending institution (e.g. abank), and a crisis avoided by establishing a short-term borrowing facility. Bytaking these steps in a timely manner, not only will a hotel greatly enhance itschances of negotiating favourable loan terms, in extreme cases financial collapsewill be averted.
2 Identify periods in which a cash surplus is anticipated. By predicting cash sur-pluses, plans concerning the optimal investment of the surplus can be developed.
The need for cash budgeting is especially apparent in the hotel industry due to thedegree of seasonality experienced in many properties (see discussion in Chapter 1).As careful cash budgeting is a key element of effective cash management, in thissection we closely review a cash budget’s preparation. By working through theexample, your understanding of how cash differs from profit will be consolidated.Although it is an important management tool, you should not be intimidated by theidea of a cash budget. In many ways it is very similar to your bank statement, i.e. itidentifies an opening cash balance, lists cash inflows and outflows, and shows theclosing cash balance. To minimize any sense of intimidation, prior to workingthrough the example, you should take a quick sneak preview of the cash budgetpresented in Exhibit 11.5.
For the cash budgeting example, imagine the BackWoods Escape, a hotel locatedin Banff, Canada. The hotel offers accommodation, dining, bar and also seminarfacilities. Sue George, BackWoods’ General Manager, wishes to refocus themarketing of the hotel’s seminar facilities by pursuing the small corporateconvention and retreat market. Consistent with this, plans have been finalized torefurbish the hotel’s two seminar rooms and equip them with state of the artpresentation technology.
Following two meetings with the hotel accountant, the projected profit and lossstatements presented in Exhibit 11.1 have been developed for January, February andMarch next year. In compiling this budgeted statement, it has been assumed that thehotel’s seminar facilities will be refurbished during December this year and that thefirst conventions will be sold in January next year. No convention, restaurant or barsales will be made in December while the refurbishment work is underway.Consistent with the higher prices that will be charged upon completion of therefurbishment, the projections indicate higher profit margins than those earned inthe past by the hotel. Sue George is particularly encouraged by the projected profitand would like to draw up plans to invest cash earned during this period. It is inconnection with this that she has asked you to prepare a cash budget for theJanuary–March period.
In addition to the budgeted profit and loss statements, the information detailed inExhibit 11.2 has been gathered to facilitate your preparation of BackWoods’ cashbudget.
The profit and loss statements presented in Exhibit 11.1, together with theprojected cash receipts and payments details in Exhibit 11.2, provide you with
176

Working capital management
Hosp
italit
y, L
eisu
re &
Tou
rism
Ser
ies
sufficient information to prepare BackWoods’ cash budget for next January, Februaryand March.
The easiest way to compile a cash budget involves breaking the exercise into thefollowing three steps:
1 Prepare a schedule of projected receipts by month.2 Prepare a schedule of projected cash disbursements (payments) by month.3 Prepare the monthly cash budget by consolidating the monthly receipts and
payments schedules and also the estimated cash balance at the beginning of thebudget period.
We will now work through each of these steps, in turn, for the BackWoodsRetreat.
BackWoods’ schedule of projected cash receiptsPreparing the schedule of cash receipts can be tricky when there is a significantvariation in the period of credit taken by customers. In the BackWoods Retreat case,we have convention receipts occurring in three instalments (5% in the month priorto the sale, 40% in the month of the sale, and 55% in the month following the sale).In addition, we have 40% of restaurant & bar receipts coinciding with the month ofsale (i.e. cash sales) and 60% of receipts occurring one month after the sale.
The best way to deal with this slightly awkward pattern of collections is todevelop a table with months as columns and types of receipt as rows. The types ofreceipt are classified according to the period of credit taken (e.g. month prior to sale,month of sale, one month’s credit, etc.). BackWoods’ schedule of projected cash
177
Exhibit 11.1BackWoods Retreat budgeted profit and loss statements for January, Februaryand March
January February MarchRevenue $ $ $ $ $ $
Conventions 34,000 36,000 40,000Restaurant & Bar 16,000 17,000 20,000
50,000 53,000 60,000
ExpensesFood & drink 8,000 9,000 10,000Wages & salaries 7,000 7,400 7,800Supplies 1,000 1,100 1,200Electricity 400 400 400Insurance 500 500 500Advertising 2,000 2,000 2,000Depreciation 3,000 3,000 3,000
21,900 23,400 24,900
Profit 28,100 29,600 35,100

Financial Management for Hospitality Decision Makers
Hosp
italit
y, L
eisu
re &
Tou
rism
Ser
ies
receipts is presented in Exhibit 11.3. Most people find it easier to prepare thisschedule by moving along the rows (i.e. consider each type of receipt in turn), ratherthan moving down the columns. The total monthly receipts is found by adding theconvention monthly receipts to the restaurant and bar monthly receipts. The totalpresented as the final column is not strictly needed, however, it does provide auseful check that the sum of the rows equals the sum of the columns.
BackWoods’ schedule of projected cash disbursementsConsistent with the projected cash receipts schedule, the schedule of cashdisbursements can be compiled by placing months in columns and cash flow typein rows. BackWoods’ schedule of projected disbursements is presented in Exhibit
178
Exhibit 11.2Information relating to BackWoods projection of cash flows
(i) Receipts: It is anticipated that favourable credit terms will have to be extended to the corporate clientstargeted when marketing the hotel’s new convention facilities. It is projected that 5% of convention revenuewill be received in the month prior to the convention as a deposit, 40% of convention revenue will bereceived at the time the seminar is held, and the remaining 55% will be received in the month followingthe convention. $42,000 in convention sales are predicted for April. In the past, 40% of restaurant and barsales have been for cash and 60% have been charged and collected in the month following the sale. Thiscash to credit ratio for restaurant and bar sales is expected to continue.
(ii) Food and drink purchases: Food and drink stocks are replenished frequently. This signifies that foodand drink purchases in a month are approximately equal to food and drink expenses for the month. Onemonth’s credit is taken for all food and drink purchases.
(iii) Wages, salaries and supplies payments: Wages, salaries and supplies are paid in the month theyare incurred as an expense.
(iv) Electricity payments: Electricity is paid quarterly. The cost per quarter has been estimated at $1,200and the first annual payment is made in March.
(v) Insurance payments: The annual insurance premium of $6,000 is paid in February.
(vi) Advertising payments: In order to promote the hotel’s new seminar facilities, a major advertisingcampaign costing $5,000 per month will be undertaken during the first four months of the year. In May,following the initial period of intensive promotion, advertising will revert to the hotel’s traditional level of$500 per month. This signifies that $24,000 will be spent on advertising over the course of the year ([4 ×$5,000] + [8 × $500]). The hotel’s accountant felt that for profit and loss statement purposes, it isreasonable to pro rata this $24,000 equally across the year at the rate of $2,000 per month. He defendedthis approach on the grounds that sales for the whole year would benefit from the additional marketexposure achieved during the initial intensive advertising campaign. All advertising is paid for in the monththe service is provided.
(vii) Fixed asset payments: Following an appraisal period in which tests will be conducted to ensure thatthe new presentation equipment is meeting the vendor’s specifications, a final installment payment of$150,000 for the seminar room equipment will be made in February. The expense associated with thisrefurbishment has been included in the depreciation figure in BackWoods’ budgeted profit and lossstatement for January–March.
(viii) Opening bank balance: It is projected that BackWoods will be holding a bank balance of $6,000 atthe beginning of January.

Working capital management
Hosp
italit
y, L
eisu
re &
Tou
rism
Ser
ies
11.4. The key to accurately projecting cash receipts and also cash disbursements liesin using well-laid-out schedules such as those presented in Exhibits 11.3 and 11.4. Ifyour schedule is well-designed, compiling the data required becomes a relativelystraightforward exercise. Now work carefully through Exhibit 11.4 to ensure youcan see how each disbursement item has been determined. Again, you will find iteasiest to approach the table on a ‘row by row’, rather than ‘column by column’basis. The disbursement items are presented in Exhibit 11.4 in the same sequence asin Exhibit 11.2.
179
Exhibit 11.3Schedule of projected cash receipts for BackWoods Retreat
Jan. Feb. March Total
Convention sales $34,000 $36,000 $40,000
Deposit (5% of next month’s sales) $1,800 $2,000 $2,100a $5,90040% received in month of sale 13,600 14,400 16,000 44,00055% received in month following sale 0 18,700 19,800 38,500
Total convention receipts $15,400 $35,100 $37,900 $88,400
Restaurant & bar sales $16,000 $17,000 $20,000
40% cash sales $6,400 $6,800 $8,000 $21,20060% received in month following sale 0 9,600 10,200 19,800
Total restaurant & bar receipts 6,400 16,400 18,200 41,000
Total all receipts $21,800 $51,500 $56,100 $129,400
aPoint (i) in Exhibit 11.2 indicates that $42,000 is predicted for April’s convention sales.
Exhibit 11.4Schedule of projected cash disbursements for BackWoods Retreat
$ $ $ $
Disbursements January February March Total
Food and drink (paid in month following purchase) 0 8,000 9,000 17,000Wages and salaries (paid in month expense is incurred) 7,000 7,400 7,800 22,200Supplies (paid in month expense is incurred) 1,000 1,100 1,200 3,300Electricity (paid quarterly) 1,200 1,200Insurance (paid annually) 6,000 6,000Advertising (paid in month advertising is conducted) 5,000 5,000 5,000 15,000Final instalment payment for presentation equipment 150,000 150,000
Total disbursements 13,000 177,500 24,200 214,700

Financial Management for Hospitality Decision Makers
Hosp
italit
y, L
eisu
re &
Tou
rism
Ser
ies
BackWoods’ cash budgetOnce the projected cash receipts and cash disbursements schedules have beenprepared, preparation of the cash budget becomes a relatively straightforwardexercise. In the cash budget we determine each month’s net cash flow by subtractingthe month’s total disbursements from the month’s total receipts. We then add theopening cash balance to determine the projected cash balance at each month-end.This is the approach that has been taken in preparing BackWood’s cash budgetpresented in Exhibit 11.5.
Cash versus profitIt is very important to note that while BackWoods is profitable throughout thequarter (see Exhibit 11.1), it is projected that over the same period its cash balancewill decline. Having seen the budgeted monthly profit and loss statements,BackWoods’ General Manager had anticipated a growing cash balance for thequarter. It is surprising how often in business you will encounter the misconceptionthat cash equates to profit. This example, however, should give you a strong senseof why cash flow is not the same as profit. If you have any continuing uncertaintyover this issue, you should review Box 11.1 which provides an overview of some ofthe main reasons why profit is not the same as cash.
Appreciating that profit is not the same as cash is important for two reasons:
1 It shows why we need to prepare budgeted cash flow statements in addition tobudgeted profit and loss statements.
2 It highlights the potential of profitable firms becoming bankrupt. Many newprofitable ventures expand very quickly. This period of expansion can be a verydangerous stage in the life of an organization, as expansion signifies an outflow offunds on assets such as accounts receivable, inventory, and fixed assets. The cashflow associated with this expansion can result in a liquidity crisis, i.e. the
180
Exhibit 11.5A cash budget for BackWoods Retreat
$ $ $ $January February March Total
Total cash receiptsa 21,800 51,500 56,100 129,400
less Total cash disbursementsb 13,000 177,500 24,200 214,700
Net cash flow 8,800 (126,000) 31,900 (85,300)add Opening cash balancec 6,000 14,800 (111,200) 6,000
Ending cash balance (negative balance in brackets) 14,800 (111,200) (79,300) (79,300)↗ ↗
aFrom Exhibit 11.3.bFrom Exhibit 11.4.cJanuary’s opening balance provided in Exhibit 11.2 (point viii).

Working capital management
Hosp
italit
y, L
eisu
re &
Tou
rism
Ser
ies
expanding firm can run out of cash. Just look at the highly profitable BackWoodsRetreat example. The hotel’s investment in assets resulted in it having a negativecash balance in February. If BackWoods management did not take care to producea cash budget and arrange a loan to cover its projected cash deficit period, itsinability to pay creditors could put it out of business. This clearly shows howprofitable firms can go bankrupt. If you ensure maintenance of sufficient cash,you will ensure maintenance of a business.
181
Box 11.1Why is profit not the same as cash?
Revenue versusreceipts
We recognize revenue at the time a service is provided, not when cashis received. When a sale is made on account, an account receivable iscreated and the receipt will lag behind revenue. For BackWoods, as55% of convention sales and 60% of restaurant and bar sales are oncredit, receipts will tend to lag behind revenue.
Purchasesversus payments
To facilitate trade, many suppliers extend credit. BackWoods’ supplierof food and drink items extend one-month credit. This signifies thatpayments lag behind purchases.
Wages andsalaries
Employees are paid following the completion of work or a workingperiod. While most waged employees are paid weekly, the paymentnevertheless lags behind the time when work is performed, which isthe time wage expense is recognized. This is more marked for salariedemployees, especially in those countries where monthly salarypayments are common.
Electricity In many countries, electricity accounts are settled on a quarterly basis.This signifies at least a three-month discrepancy between some of theelectricity expense incurred and payment for electricity.
Insurance Insurance and rent are paid in advance of charging the associatedexpense to the profit and loss statement. In the case of insurance,payment is made a year in advance of a portion of the expense.
Fixed assetaccounting (i.edepreciation)
One of the most significant reasons causing a discrepancy betweencash and profit arises in connection with depreciation accounting.There are two reasons for this:1 Fixed assets can be very expensive items.2 The time lag can be considerable. If a fixed asset is being
depreciated over 10 years, a portion of the asset’s expense lags 10years behind the actual payment for the asset.
Long-termfinancing
When a company arranges a loan or increases its share capital thereis an immediate large positive impact on cash flow. The only profit andloss statement impact concerns the loan’s annual interest expense,however.

Financial Management for Hospitality Decision Makers
Hosp
italit
y, L
eisu
re &
Tou
rism
Ser
ies
Accounts receivable managementOne of the closest to cash assets is accounts receivable. This is because in the normalcourse of business an account receivable will become cash in the short term. Thereare two costs associated with extending credit to customers:
1 The cost of the selling company not being able to deposit the monetary value ofa completed sale in its bank, i.e. as a result of not collecting cash at the time of asale, the vendor will forgo some bank account interest (or if the vendor has a bankoverdraft, it will incur additional interest expense).
2 The cost associated with lost revenue due to some accounts receivable proving tobe uncollectible.
These costs might cause you to question why companies extend credit. Theanswer is because credit facilitates trade. Considerable sales would be lost if creditwas not extended. It is hard to contemplate a 5-star hotel not allowing customers touse a credit card to settle their accounts. This shows how much we are conditionedto expect the granting of credit whenever we purchase a service from a hotel. Inaddition to credit card sales, many large hotels have corporate clients that purchaseon account.
The cost associated with extending trade credit signifies that hotels have toperform a credit balancing act, i.e. they have to ensure the credit period extended isneither too much nor too little. In addition, a hotel has to ensure that credit is onlygranted to creditworthy customers. The widely acknowledged five C’s of creditmanagement provides a useful checklist of factors to consider when decidingwhether to grant credit to a particular customer. The five C’s comprise character,capacity, capital, conditions and collateral, and are described in Box 11.2.
182
Box 11.2The five C’s of credit management
The following issues should be appraised when considering whether to extend trade credit to acustomer:
1 Character: does the customer have a predisposition towards timely payment of accounts?
2 Capacity: does the customer have the capacity to run a successful business?
3 Capital: does the customer have sufficient working and long-term capital to honour theaccount when it is due for payment?
4 Conditions: are there any particular economic conditions that might affect the potentialcustomer’s ability to pay? In addition, there might be particular circumstances such as lowoccupancy in the off-season that might cause a hotel to consider extending credit to lesscreditworthy customers.
5 Collateral: does the customer have assets that could be liquidated relatively easily in theevent of a liquidity crisis that threatened timely reimbursement of the account due?
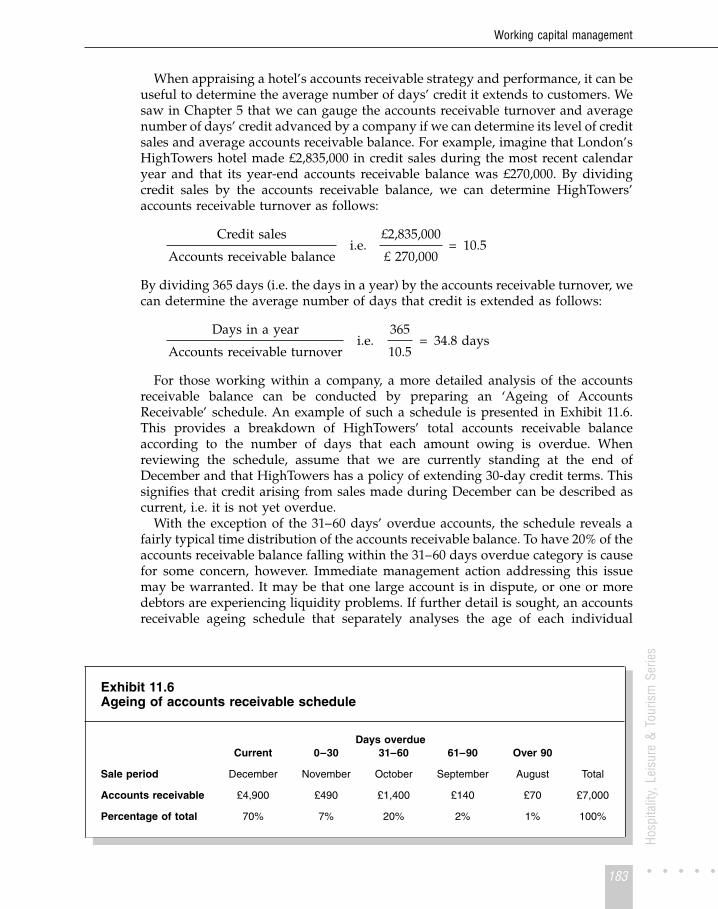
Working capital management
Hosp
italit
y, L
eisu
re &
Tou
rism
Ser
ies
When appraising a hotel’s accounts receivable strategy and performance, it can beuseful to determine the average number of days’ credit it extends to customers. Wesaw in Chapter 5 that we can gauge the accounts receivable turnover and averagenumber of days’ credit advanced by a company if we can determine its level of creditsales and average accounts receivable balance. For example, imagine that London’sHighTowers hotel made £2,835,000 in credit sales during the most recent calendaryear and that its year-end accounts receivable balance was £270,000. By dividingcredit sales by the accounts receivable balance, we can determine HighTowers’accounts receivable turnover as follows:
Credit sales
Accounts receivable balancei.e.
£2,835,000
£ 270,000= 10.5
By dividing 365 days (i.e. the days in a year) by the accounts receivable turnover, wecan determine the average number of days that credit is extended as follows:
Days in a year
Accounts receivable turnoveri.e.
365
10.5= 34.8 days
For those working within a company, a more detailed analysis of the accountsreceivable balance can be conducted by preparing an ‘Ageing of AccountsReceivable’ schedule. An example of such a schedule is presented in Exhibit 11.6.This provides a breakdown of HighTowers’ total accounts receivable balanceaccording to the number of days that each amount owing is overdue. Whenreviewing the schedule, assume that we are currently standing at the end ofDecember and that HighTowers has a policy of extending 30-day credit terms. Thissignifies that credit arising from sales made during December can be described ascurrent, i.e. it is not yet overdue.
With the exception of the 31–60 days’ overdue accounts, the schedule reveals afairly typical time distribution of the accounts receivable balance. To have 20% of theaccounts receivable balance falling within the 31–60 days overdue category is causefor some concern, however. Immediate management action addressing this issuemay be warranted. It may be that one large account is in dispute, or one or moredebtors are experiencing liquidity problems. If further detail is sought, an accountsreceivable ageing schedule that separately analyses the age of each individual
183
Exhibit 11.6Ageing of accounts receivable schedule
Days overdueCurrent 0–30 31–60 61–90 Over 90
Sale period December November October September August Total
Accounts receivable £4,900 £490 £1,400 £140 £70 £7,000
Percentage of total 70% 7% 20% 2% 1% 100%

Financial Management for Hospitality Decision Makers
Hosp
italit
y, L
eisu
re &
Tou
rism
Ser
ies
debtor’s account can be prepared. Most computerized accounting systems have thecapacity to provide accounts receivable aging schedules in such a format.
Once problem accounts have been identified, a series of steps designed to collectoutstanding debts can be initiated. These steps are summarized in Box 11.3. If anaccount is particularly large, several initial steps can inform what collection strategywould be most appropriate. These include:
1 Determine why the customer has withheld payment.2 Determine the payment history of the customer.3 Determine whether the customer is a large client that might take their business
elsewhere if a significant dispute over credit develops.4 Determine whether we have personnel who might be able to expedite payment
through their contacts in the debtor firm.
Inventory managementParalleling the balancing act that has to be performed when determining the creditperiod to be extended to customers, care has to be taken in inventory managementto ensure that neither too little nor too much inventory is held. A hotel that holds lowinventory balances runs the risk of experiencing stock-outs. This can result in theimmediate loss of sales and, perhaps more significantly, it can also significantly
184
Box 11.3Accounts receivable collection techniques
The following account collection methods are listed in the order with which they are generallyused in connection with a particular account:
1 Letters: once an account has been overdue for a number of days, a polite reminder can bemailed. Following a designated period, if payment is not forthcoming, a second morestrongly worded letter can be sent.
2 Telephone calls: in addition to letters, one or more telephone calls to the accounts payableofficer concerned can be made. This technique can be particularly effective if the creditmanager possesses good negotiating skills and has extensive business contacts.
3 Site visits: visiting the debtor can be an effective counter to the ‘cheque is in the mail’syndrome, as payment can be made on the spot. It is only feasible, however, when thedebtor is located in the vicinity of the company seeking reimbursement.
4 Collection agency: there are an increasing number of factoring companies that specialize incredit management and debt collection. As this can represent an expensive way to collectaccounts receivable, it should only be used if none of the techniques referred to above havebeen successful.
5 Legal action: this can be regarded as the most radical step in a collection strategy. It isexpensive and can trigger the debtor company’s bankruptcy. Even if successful, legal actionmight sour relations with the debtor firm and signify the end of a trading relationship.

Working capital management
Hosp
italit
y, L
eisu
re &
Tou
rism
Ser
ies
damage customer goodwill (e.g. a restaurant customer becoming disgruntled whenseveral menu items are unavailable). If too much inventory is held, the hotel willexperience high inventory carrying costs that include:
1 The opportunity cost of money tied up in inventory, i.e. money invested ininventory can be viewed as money that could be earning interest if it was investedin a bank account.
2 The cost of pilferage.3 Cost of deterioration of perishable items.4 Cost of inventory insurance.5 Handling costs, i.e. if large amounts of inventory are held, additional costs may
result from problems associated with storing, locating and moving inventory.6 The cost of maintaining and financing storage space.
185
Box 11.4 Using the EOQ model to determine optimal order size
The EOQ model assumes:
� rate of demand for inventory item in question is relatively predictable� administrative order costs do not vary with size of order processed.
The EOQ can be calculated by applying the following formula:
EOQ = √ (2 × U × O ÷ C)
where:
U = Usage per period of time (same period of time as used for carrying cost).
O = Cost of ordering and receiving an order.
C = Carrying cost per unit of inventory per period of time (same period of time as usedfor usage).
ExampleImagine that New York’s Elite Restaurant offers an extensive menu of fine wines. The averagecase of wine costs Elite $360. Past experience indicates 750 cases of wine are sold per yearby the restaurant. Following discussions with Elite’s purchasing and store managers, Elite’saccountant has estimated that the cost of ordering and receiving a shipment of wine is $30. Asthe restaurant holds any excess working capital as marketable securities that earn 5% perannum, the accountant estimates the cost of holding a case of wine for a year to be $18 (i.e.$360 × 5%).
The EOQ for Elite’s wine inventory can be calculated as follows:
√ (2 × 750 × $30 ÷ $18) = √ (2,500) = 50 cases per order.
By applying the EOQ, we have determined that if Elite orders its wine in shipment sizes of 50cases, the sum of its annual carrying and ordering costs will be minimized.

Financial Management for Hospitality Decision Makers
Hosp
italit
y, L
eisu
re &
Tou
rism
Ser
ies
The correct amount of inventory to be held is largely a matter of judgement. Oneway to inform such a judgement is to monitor inventory turnover. As noted inChapter 5, this can be computed by dividing the cost of sales by the averageinventory balance. If a hotel is part of a chain, it can be a useful exercise tobenchmark inventory turnover rates in order to identify those members of the chainholding relatively high or low levels of inventory.
A second aspect of inventory management that lends itself to analysis is thequestion of how much inventory should be ordered when making a purchase order.The economic order quantity (EOQ) model is a technique enabling us to estimate theoptimal order size for purchase orders. While theoretically correct, the model doesrequire fairly restrictive assumptions. Despite this, the model can be applied inmany hotel situations and it does highlight how purchasing officers should attemptto balance the trade-off between minimizing inventory holding costs and the costs ofprocessing orders and shipments. The model is outlined in Box 11.4.
Accounts payable managementAccounts payable management can be seen as the flip side of accounts receivablemanagement. For an account receivable, bank interest that could be earned is lostdue to money that relates to a sale being held by a customer. For an account payable,we can gain bank interest from holding money that relates to a purchase alreadymade. Care should be taken not to abuse credit terms extended by suppliers,however. Good supplier relations can be a key source of competitive advantage.Characteristics of a good supplier include a willingness to:
1 meet rush orders2 tailor shipments to specific requests3 maintain high quality in goods and services supplied4 provide flexible credit terms.
One particular issue that can arise in connection with accounts payablemanagement is a discount offered by a supplier for early payment of an account.This type of trade discount is typically stated using abbreviated terms such as ‘1/10net 30’. This means that the purchaser can deduct a 1% discount off the invoicedamount if payment is made 10 days after the start of the credit period (typically theinvoice date), and if the discount is not taken, the invoiced amount is due forpayment 30 days after the start of the credit period. A method enabling you toappraise whether the discount should be taken is described in Case 11.1.
Case 11.1Financial decision making in action –
The Financial Controller determining whether to take a trade discount
In most organizations, accounts payable management falls within the financial controller’sjurisdiction. An issue that needs to be managed in accounts payable management is thequestion of whether to take the early payment discount offered by some suppliers. Thisissue can be analysed by viewing an early payment as an advance of funds that earns areturn. We can determine the effective annual rate of return on this advance relativelyeasily in the following way.
186

Working capital management
Hosp
italit
y, L
eisu
re &
Tou
rism
Ser
ies
Imagine British Airways has received a £1,000 invoice and credit terms of 2/10 net 45from one of its contract food suppliers. This means BA can either pay £980 in 10 days’time, or £1,000 in 45 days’ time. By advancing £980 35 days earlier than necessary, BAwill get a return of £20 (i.e. the £20 saved on the invoice payment). To find what thisrepresents in terms of an annual rate of return, we have to gross up the £20 return on the£980 advance to translate it from a 35-day period to 365 days, i.e.:
£20
£980×
365
35= 0.213 (or 21.3%)
This calculation used the actual monetary amounts involved. Alternatively, the followinggeneric formula can be used:
% discount offered
100 – % discount offered×
Days in a year
Days difference in final due date and discount date
This generic formula can be applied to the above example as follows:
2
98×
365
(45 – 10)= 0.213 (or 21.3%)
For this example, the financial controller would conclude that if BA has enough cash toenable early payment, and if it is earning less than 21.3% per annum interest on any cashbalances held, then it should take the discount and gain the benefit of an effective 21.3%annual rate of return. If BA does not have sufficient cash and must borrow to take thediscount, then as long as the cost of borrowing is less than 21.3%, it is in its interest toborrow £980 and take advantage of the trade discount offered.
Working capital managementAs noted in the chapter’s introduction, net working capital is defined as currentassets – current liabilities. So far we have considered management issues arising inconnection with the main elements of working capital, i.e. cash, accounts receivable,inventory and accounts payable. We now turn to consider a more holistic dimensionof working capital management. Working capital management can be a particularlyimportant dimension of financial management in hotels, as high seasonalitytranslates into high working capital volatility. During the busy season, a hotel willhave a relatively high level of current assets. This is because:
� Higher levels of cash will be needed to support the above-average levels of dailypurchase payments
� Higher accounts receivable will result from the above-average levels of sales� Higher inventory levels will be needed to support the above-average levels of
activity.
Figure 11.1 depicts investment in fixed and current assets for a resort hotel thatexperiences a busy mid-summer and mid-winter season. Note how the hotel’s fixed
187

Ass
etin
vest
men
t ($m
)
140
130
120
110
100
90
80Ja
n.
Feb.
Mar
ch
Apr
il
May
June
July
Aug
.
Sep
t.
Oct
.
Nov
.
Dec
.
Current assets
Fixed assets
Financial Management for Hospitality Decision Makers
Hosp
italit
y, L
eisu
re &
Tou
rism
Ser
ies
assets remain constant throughout the year. Its current assets, however, exhibitconsiderable volatility, rising to highs during busy seasons and lows during quietseasons. It is this volatility in current assets that results in the volatility of the hotel’stotal asset base.
A key working capital management issue that arises in connection with Figure11.1 concerns the mix of current liabilities and long-term capital that should be usedto finance a hotel’s fluctuating asset base. It is widely acknowledged in the financeliterature that long-term assets (i.e. fixed assets) should be financed through long-term capital. Therefore, for the hotel depicted in Figure 11.1, the minimum amountof long-term financing that should be raised is $90 m. It is also apparent from Figure11.1 that the permanent amount of funds required during the year is $100 m (totalassets never drop below $100 m), and a case could be made for financing all of thispermanent portion of total assets with long-term capital.
The issue of what proportion of the floating current asset base should be financedthrough current liabilities reduces to a profit versus risk trade-off decision. This isbecause, as is explained in Box 11.5, a relatively high ratio of current liabilities tolong-term capital signifies a high profit/high risk strategy, and a relatively low ratioof current liabilities to long-term capital signifies a low profit/low risk strategy.While all managers like to see increased profit levels, it is obvious that care must betaken not to jeopardize an organization’s solvency by becoming too dependent oncurrent liability financing.
When considering this short- versus long-term financing issue, if an aggressivefinancing approach is taken, it should be noted that not all incremental investmentsin current assets have to be financed by short-term loans. This is because part of the
188
Figure 11.1 The impact of seasonality on asset investment

Working capital management
Hosp
italit
y, L
eisu
re &
Tou
rism
Ser
ies
extra current asset investment occurring during busy seasons will be financedspontaneously by higher current liabilities that also arise during busy seasons. Thegreater business activity levels that stimulate higher current assets will also result inhigher accounts payable and average wage accruals due to increased levels ofpurchasing and casual staff employment.
Summary
In this chapter we have looked at management issues associated with the main accounts thatcomprise working capital, i.e. cash, accounts receivable, inventory and accounts payable. Aparticularly important aspect of the chapter concerned an illustration of how cash flow is notthe same as profit.
Having read the chapter you should now know:
� How cash budgeting represents an important aspect of cash management� How cash differs from profit� What issues need to be considered when deciding whether to extend credit to a new
customer� How an accounts receivable ageing schedule can aid the identification of customer accounts
warranting particular attention� How application of the EOQ model can aid the reduction of costs associated with inventory
management� How to analyse whether to accept a supplier’s offer of a discount for early payment of an
account payable� How a risk/return trade-off exists when deciding what proportion of short- versus long-
term capital should be used to finance current asset investments.
189
Box 11.5The profit/risk trade-off in current liability financing
The profit aspect: Current liabilities are cheaper to finance than long-term capital. Accountspayable and wages accrued generally have no cost associated with them. In addition, exceptfor times when there is a widespread expectation that interest rates will decline in the future, itis normal for short-term lending rates to be below long-term lending rates.
The risk aspect: If a hotel increases its current liabilities relative to long-term capital its networking capital will decline. Net working capital is a key indicator of a firm’s ability to pay itsdebts over the short term. A decrease in net working capital signifies increased risk due to thelower short-term asset coverage of short-term liabilities.
Effects of high current liability financing: Synthesizing the profit and risk aspects of currentliability financing, we can conclude that a relatively high short- to long-term financing ratio hasa positive impact on profit and risk.
Effects of low current liability financing: It follows that a relatively low short- to long-termfinancing ratio has a negative impact on profit and risk.
Financial Management for Hospitality Decision Makers
Hosp
italit
y, L
eisu
re &
Tou
rism
Ser
ies
References
Atkinson, H., Berry, A. and Jarvis, R. (1995) Business Accounting for Hospitality andTourism & Leisure, International Thomson Publishing, London, Chapter 17.
Coltman, M. M. and Jagels, M.G. (2001) Hospitality Management Accounting, 7thedition, John Wiley, Chichester, Chapter 11.
Gitman, L. J., Juchau, R., Flanagan, J., Pearson, K. and Clemens, M. (1998) Principlesof Managerial Finance, 2nd edition, Addison-Wesley Longman Australia Pty Ltd,Sydney, Chapters 16–19.
Hansen, D. R. and Mowen, M. M. (2000) Management Accounting, 5th edition, South-Western, Cincinnati, OH, Chapter 19.
Kotas, R. (1999) Management Accounting for Hospitality and Tourism, 3rd edition,International Thomson Publishing, London, Chapter 18.
Kotas, R. and Conlan, M. (1997) Hospitality Accounting, 5th edition, InternationalThomson Publishing, London, Chapter 23.
Owen, G. (1994) Accounting for Hospitality, Tourism & Leisure, Pitman Publishing,London, Chapter 17.
Problems
✓ indicates that a solution appears at the back of the text
✓ 11.1 The marketing department of Singapore’s CrownJewel Hotel has projected thefollowing sales in the last half of the current financial year.
CrownJewel projected sales (in $000)
July August September October November December
Rooms 630 660 600 540 500 600
Restaurant & Bar 90 100 80 70 60 80
Most of CrownJewel’s room sales are made to corporate clients. Past experienceindicates that 10% of room sales are for cash, 50% is collected in the month followingthe sale, 35% is collected two months following the sale and 5% of sales are to alarge company that takes three months to settle accounts.
In the past, 30% of restaurant and bar sales have been for cash and 70% havebeen charged and collected in the month following the sale.
Required • • •Prepare a schedule showing CrownJewel’s projected cash receipts in October,November and December.
✓ 11.2 In connection with the CrownJewel sales estimates provided in Problem 11.1,experience has shown that room variable costs are 20% of room revenue. Sixty percent of these variable costs are paid for in the month the expense is incurred and theremainder is paid for in the following month.
Restaurant and bar variable costs comprise wages, food and drink. Wages are10% of restaurant and bar revenue and are paid for in the month incurred. The costof food and drink is 15% of restaurant and bar revenue. Due to the CrownJewel’sinventory stocking policy, 40% of food and drink is purchased one month before it is
190

Working capital management
Hosp
italit
y, L
eisu
re &
Tou
rism
Ser
ies
sold. The remainder is purchased in the month of sale. All food and drink is purchasedfrom the same company which extends one-month trade credit.
The hotel has fixed costs of $15,000 per month which are paid for in the monthincurred. In addition, the hotel estimates it will make a quarterly electricity payment of$3,000 in November and its annual insurance premium of $7,500 is due for paymentin December.
Required • • •Prepare a schedule showing CrownJewel’s projected cash disbursements forOctober, November and December.
✓ 11.3 Draw on your solutions provided to Problems 11.1 and 11.2 to prepare CrownJewel’scash budget for October, November and December. It has been estimated that thehotel will have a positive cash balance of $12,000 on 30 September.
11.4 The ShireLodge provides a residential convention service in England’s YorkshireDales. The lodge’s general manager is concerned about cash flow in the next fewmonths particularly as insurance will soon be due for payment.
The following revenue and expense estimates have been developed for the firstfour months of 20X2:
January February March April£ £ £ £
Convention sales revenue 10,000 12,000 13,000 14,000Fixed costs:
Salaries 4,000 4,000 4,000 4,000Ground maintenance 500 500 500 500
Insurance 420 420 420 420
It has been estimated that sales in December 20X1 will be £8,000. Previous cashcollections indicate that 10% of all sales are collected in the month prior to the saleas a deposit. Fifty per cent of all sales are collected in the month of the sale, and 40%of sales are collected in the month following the sale.
Variable costs are 15% of revenue. Ninety per cent of variable costs are paid in themonth of the sale to which they relate, and the remainder are paid in the month priorto the sale (purchase of some food and other items in preparation for conventions).Salary and ground maintenance fixed costs are paid for as they are incurred.Insurance is paid for twice a year, in January and July. It is estimated that on 1January 20X2 the lodge will have £4,200 in its bank account.
Required • • •Prepare a cash budget showing receipts, disbursements and opening and closingcash balances for each of the first three months of 20X2.
191

Financial Management for Hospitality Decision Makers
Hosp
italit
y, L
eisu
re &
Tou
rism
Ser
ies
11.5 A review of the accounts receivable records of Auckland’s CreatureComforts Hotelreveals the following year-end information.
CreatureComforts HotelAnalysis of age of accounts receivable as at 31/12/X1
Month of sale Accountsreceivable $
%
July 2,594 1August 13,448 5September 2,782 1October 7,890 3November 26,300 10December 210,000 80
Total year-end balance 263,014 100
The credit manager believes that the report accurately shows the proportion of theyear-end accounts receivable balance that can be traced to months in which creditsales were made. Forty per cent of the hotel’s $6,000,000 annual sales are on credit.The hotel extends 30-day credit terms.
Required • • •(a) Using the year-end account balance, evaluate the effectiveness of the hotel’s
accounts receivable collection system.(b) If the hotel’s peak season runs from November through to January, how does this
additional information affect your answer to part (a)?(c) Prepare an ageing of accounts receivable schedule in order to obtain additional
insight into the status of the hotel’s accounts receivable balance. What furtherobservations can be made from the ageing schedule?
11.6 The laundry department of the Edinburgh hotel, TartanDays, orders concentratedlaundry detergent in 10-kilogram boxes. Each box costs £32. It costs £20 to place,process and receive a laundry detergent order and TartanDays has estimated that itwould cost £2 to hold a box of detergent in inventory for a year. The hotel uses 25boxes of detergent per month.
Required • • •What is the TartanDays’ EOQ for laundry detergent?
11.7 Toronto’s Roma Pizzeria sells a variety of pizzas. The largest inventory item held byRoma is cheese. The owner has approached you for advice in connection with thesize of orders that should be placed when ordering cheese. You have ascertained thefollowing:
� Cheese is ordered in blocks at $20 per block.� Roma currently places an order with its cheese supplier every two weeks and the
average order size is 500 blocks. Roma has a policy of timing its cheese reorderingso that its inventory of cheese has declined to 40 blocks when the new shipmentarrives.
192

Working capital management
Hosp
italit
y, L
eisu
re &
Tou
rism
Ser
ies
� Money not invested in inventory could be invested in a bank account to earn Roma5% per annum.
� The cheese is shipped in refrigerated transport and the cost of ordering, shippingand receiving a shipment is $30.
Required • • •(a) What is the Roma’s EOQ for cheese? Assume 52 weeks in a year.(b) What is the sum of Roma’s current cheese carrying and ordering costs? Assume
52 weeks in a year.(c) What would Roma save in total carrying and ordering costs if it changed its order
size to the most economic order quantity (EOQ)?
11.8 Johannesburg’s ‘MouthWatering’ Restaurant has approached you for assistance indetermining whether it should take the 1/10 net 30 trade discount terms offered by itsmain food supplier. The restaurant currently has invested excess liquidity inmarketable securities earning an 8% average annual rate of return.
Required • • •Conduct an analysis to demonstrate whether the MouthWatering Restaurant shouldtake the trade discount offered.
11.9 Feast’N’Run provides a contract catering service to several university and collegecampuses. One of its main suppliers has offered trade discount terms of 1/10 net 40.In the past, Feast’N’Run has taken an average of 50 days’ credit when settling itstrade accounts. The chief accountant feels that this policy has not damaged relationswith any of its suppliers and proposes to continue with it, except when making anearly payment to secure a discount. Feast’N’Run finances its investment in workingcapital by short-term borrowing that carries an annual interest rate of 9.5%.
Required • • •Conduct an analysis to demonstrate whether Feast’N’Run should take the tradediscount offered.
11.10 Le SlopeVerticale is a French skiing hotel complex offering accommodation,restaurant, bar, ski shop and equipment hire facilities. The complex has estimated itwill have the following assets for the forthcoming year:
Month Current assets Fixed assets Total assetsE E E
January 60,000 1,000,000 1,060,000February 60,000 1,000,000 1,060,000March 60,000 1,000,000 1,060,000April 40,000 1,000,000 1,040,000May 6,000 1,000,000 1,006,000June 2,000 1,000,000 1,002,000July 2,000 1,000,000 1,002,000August 2,000 1,000,000 1,002,000September 2,000 1,000,000 1,002,000October 6,000 1,000,000 1,006,000November 40,000 1,000,000 1,040,000December 60,000 1,000,000 1,060,000
193

Financial Management for Hospitality Decision Makers
Hosp
italit
y, L
eisu
re &
Tou
rism
Ser
ies
With respect to the cost of financing these assets, no interest is paid on the balanceof trade accounts payable or accrued wages, which fluctuate through the year. At anytime, the aggregate of these two accounts is generally 60% of current assets. Theremainder of SlopeVerticale’s investment in assets is financed by:
� Long-term financing costing an average of 10% per annum� A floating short-term bank loan carrying an interest rate of 6% per annum (used to
cover any financing shortfall).
Required • • •(a) If SlopeVerticale’s long-term financing is A1,000,000:
1 Based on the asset projections provided, determine the floating short-termbank loan required in each month of the year.
2 Determine SlopeVerticale’s total financing cost for the year.(b) If SlopeVerticale’s long-term financing is A1,020,000:
1 Determine the floating short-term bank loan required in each month of theyear.
2 Determine SlopeVerticale’s total financing cost for the year.(c) What are the profit/risk trade-offs associated with the different financing options
identified in parts (a) and (b)?
194

C H A P T E R• • • • 12
Investmentdecision making
L e a r n i n g o b j e c t i v e sAfter studying this chapter, you should havedeveloped an appreciation of:
1 How the accounting rate of return, payback, netpresent value and internal rate of returninvestment appraisal techniques can be applied
2 The relative merits of these investment appraisaltechniques
3 What is meant by the ‘time value of money’
4 How the present value of a cash flow occurring inthe future can be determined using discountingtables.

Financial Management for Hospitality Decision Makers
Hosp
italit
y, L
eisu
re &
Tou
rism
Ser
ies
IntroductionThis topic focuses on analytical methods that can be used to assess the merit oflong-term investment proposals. The process of rationing funds to long-terminvestment proposals is often referred to as ‘capital budgeting’. In the context offinancial management, the term ‘capital’ is used when referring to long-term funds(we talk of a company ‘raising capital’ when it issues more equity finance orborrows long-term debt). In the earlier chapter concerned with budgeting, it wasnoted that the ‘budget’ relates to plans for the forthcoming year. It follows that‘capital budgeting’ relates to longer-term budgeting, i.e. decision making con-cerned with investing in fixed assets such as laundry or kitchen equipment, or thedecision to refurbish rooms. As a large proportion of a hotel’s assets are fixedassets, it is evident that capital budgeting is an important decision-making areafor hotel managers.
The chapter is structured around the following four investment appraisaltechniques:
� Accounting rate of return� Payback� Net present value� Internal rate of return.
Accounting rate of returnA worked example that highlights the calculation of the accounting rate of return ispresented in Box 12.1.
At first glance the ARR might appear conceptually appealing. It has majorshortcomings, however. These shortcomings include:
1 The ARR fails to consider the period of the investment. Suppose a hotel is decidingwhether to take this 40% ARR investment option with a 3-year life, or a second$8,000 investment option that has a 10-year life and an ARR of 38%. Both returnsappear very high. Consequently, we are left to question, would you like to makean investment that provides a very high return for 3 years, or an investment thatprovides a very high return for 10 years? Let us assume that the hotel in questiongenerally makes an average return of 12% on its assets. By investing in the 10-yearasset that provides a 38% ARR, it will be able to increase its average return onassets for 7 years longer than if it invests in the 3-year asset that provides a 40%ARR. In this case, it appears that the 10-year 38% ARR investment option ispreferable to the 3-year 40% ARR option.
2 The ARR is based on accounting profits. These figures involve some apportioningof cash flows to different accounting periods (e.g. depreciation). As a result, profitsare not ‘real’ in a tangible sense. They represent nothing more than theaccountant’s ‘account’ of performance. Cash flows, however, are real, and it is thecommercial reality of the timing of money entering and exiting the organization,and not the accountant’s account, that we need to incorporate into the decisionmodel.
196

Investment decision making
Hosp
italit
y, L
eisu
re &
Tou
rism
Ser
ies
PaybackSurveys of capital budgeting practice highlight the popularity of the paybackinvestment appraisal technique (e.g. Lamminmaki et al., 1996). Payback’s popularitymay result from it being an intuitively appealing approach that is relatively simpleto understand. In addition, payback can be used as an initial screening mechanismprior to the use of more sophisticated investment appraisal techniques. Applicationof the payback approach to appraising an investment proposal is outlined in Box12.2.
Like accounting rate of return, the payback technique has several shortcomings.Two major shortcomings of the payback approach are:
1 It fails to consider any cash flows occurring after the payback period. The secondof the two examples presented in Box 12.2 has the faster payback, but the firstexample generates the most lifetime cash inflows. In the first payback example,
197
Box 12.1Finding an investment proposal’s accounting rate of return
The accounting rate of return (ARR) can be found by applying the following formula:
ARR =Average annual profit generated by the investment
Average investment
Usually, ARR is stated as a percentage, therefore multiply the above formula by 100.Imagine Auckland’s KiwiStay Hotel is appraising a 1 January 20X0 investment of $8,000 in a
drinks vending machine that will increase accounting profits by $1,000 in 20X0, $2,000 in20X1 and $3,000 in 20X2. At the end of 20X2, it is estimated the vending machine will be soldfor $2,000.
Calculating the average annual profit generated by the investment is relativelystraightforward. We find it is $2,000 by taking the average of the profit generated in years20X0, 20X1 and 20X2 ([$1,000 + $2,000 + $3,000] ÷ 3).
The average investment is a slightly more challenging concept to grasp, however. Trythinking of it as ‘The average amount of money invested in the asset during its life’. At thebeginning of 20X0, it is evident that $8,000 is invested in the asset (i.e. the initial investment).At the end of the life of the asset, it is evident that $2,000 is effectively invested, as this is theamount that could be liquidated if the asset is sold. As the asset is worth $8,000 at thebeginning of its life and $2,000 at the end of its life, its average value over the duration of itslife is $5,000. This is the midpoint between $8,000 and $2,000, and can be computed asfollows: ([$8,000 + $2,000] ÷ 2).
As the average annual profit is $2,000 and the average investment in the asset is $5,000,the ARR can be computed as follows:
ARR =$2,000
$5,000× 100 = 40%

Financial Management for Hospitality Decision Makers
Hosp
italit
y, L
eisu
re &
Tou
rism
Ser
ies
note that if the projected operating cash inflows had been $100,000 in each of thelast four years of the investment’s life, the payback would still be 4 years.
2 It fails to recognize the time value of money, i.e. $1 today does not have the samevalue as $1 in a year’s time. Payback treats cash flows occurring in different timeperiods as if they have the same value.
Net present value (NPV)NPV is based on the concept that $1 in one time period is not worth the same as $1in another time period ($1 today is worth more than $1 in a year’s time). If $1 couldbe invested in a bank account to earn 10%, then we would be indifferent betweenhaving $1 now or $1.1 in a year’s time. Therefore, if we expect an interest rate of 10%for the foreseeable future, $1 today has the same value as $1.1 in one year’s time.
The view that $1 today does not have the same value as $1 in a year’s time is notrecognized in the accounting rate of return nor in the payback method. Note that inthe examples above, no attempt was made to adjust the value of future profits (in theARR example), or future cash flows (in the payback example) in order to bring theminto line with cash flows occurring at the beginning of the project’s life.
The NPV investment appraisal technique involves finding today’s value of futurecash flows associated with an investment proposal. When today’s value of a project’sinflows are greater than today’s value of the project’s outflows, the project isdescribed as having a positive ‘net present value’. A positive net present value
198
Box 12.2Finding an investment proposal’s payback
Payback can be calculated as follows:
Payback = The time taken to recoup the cash invested in an asset
Payback example 1Imagine an initial investment of $20,000 will increase operating cash inflows by $5,000 in eachof the 8 years of an asset’s life.
Payback = 4 years
(It takes 4 years to get the $20,000 back)
Payback example 2A 1 January 20X0 investment of $10,000 will increase operating cash inflows by $3,000 in20X0, $4,000 in 20X1 and $6,000 in 20X2.
Payback = 2.5 years
(After two years, $7,000 of the $10,000 investment will have been recouped. As the operatingcash inflow in the third year is $6,000, it is assumed that the final $3,000 needed will havebeen recouped half-way through 20X2)

Investment decision making
Hosp
italit
y, L
eisu
re &
Tou
rism
Ser
ies
signifies that a project is acceptable; a negative net present value (i.e. the presentvalue of a project’s outflows are greater than the present value of its inflows)signifies that a project should be rejected.
Today’s value of a future cash flow can be found by multiplying the future cashflow by the appropriate factor appearing in Table 12.1 or Table 12.2. These tables arewidely referred to as ‘discounting tables’. Table 12.1 presents the present valuefactors to be used when finding the present value of a single cash flow. Table 12.2presents the present value factors to be used when finding the present value of aseries of equal cash flows (a series of equal cash flows is referred to as an ‘annuity’).Box 12.3 presents two small examples that illustrate how the tables can be used tofind the present value of a future cash flow.
199
Box 12.3Using discounting tables to find the present value of future cash flows
Discounting example 1Assuming an interest rate of 10%, what is today’s value of a $300 cash inflow occurring in 4years’ time?
Answer: First, note that we are dealing with a single cash flow, therefore we turn to Table 12.1(present value factors for a single cash flow). In this table, move along the columns until youcome to the column headed 10%. Then move down the rows in this column until you come tothe 4-year row. The factor you will find is 0.683. This signifies that if we multiply $300 by0.683, we will have found today’s value (or the present value) of a $300 cash flow occurring in4 years’ time.
In the calculation presented below, the term ‘PV’ is an abbreviation of ‘present value’ and isused to highlight the fact that the factor used has been drawn from the ‘present value of asingle cash flow’ table. The first number following the ‘PV’ term refers to the relevant interestrate and the second number following the term refers to the relevant number of years. We findthe present value of $300 in four years’ time to be $204.90.
Present value = $300 (PV10%, 4 years) = $300 × 0.683 = $204.90
Discounting example 2Assuming an interest rate of 12%, what is today’s value of receiving an annual payment of$400 in each of the next 5 years? Assume the first payment is in 1 year’s time.
Answer: First, note that in this second example we are dealing with a series of equal cashflows, therefore we turn to Table 12.2 (present values factors for an annuity). This table hasbeen compiled on the basis that the first cash flow of the stream of equal cash flows will occurone year from today. In the same manner to that used in the first discounting example, movealong the columns until you come to the column headed 12%. Then move down the rows inthis column until you come to the 5-year row. The factor you will find is 3.605. In thecalculation presented below, the term ‘PVA’ is an abbreviation of ‘present value of an annuity’and is used to highlight the fact that the factor used has been drawn from the ‘present valuefactors for an annuity’ table.
Present value = $400 (PVA12%, 5 years) = $400 × 3.605 = $1,442

Year 1% 2% 3% 4% 5% 6% 7% 8% 9% 10% 11% 12% 13% 14% 15% 16% 17% 18% 19% 20%
1 0.990 0.980 0.971 0.962 0.952 0.943 0.935 0.926 0.917 0.909 0.901 0.893 0.885 0.877 0.870 0.862 0.855 0.847 0.840 0.833
2 0.980 0.961 0.943 0.925 0.907 0.890 0.873 0.857 0.842 0.826 0.812 0.797 0.783 0.769 0.756 0.743 0.731 0.718 0.706 0.694
3 0.971 0.942 0.915 0.889 0.864 0.840 0.816 0.794 0.772 0.751 0.731 0.712 0.693 0.675 0.658 0.641 0.624 0.609 0.593 0.579
4 0.961 0.924 0.888 0.855 0.823 0.792 0.763 0.735 0.708 0.683 0.659 0.636 0.613 0.592 0.572 0.552 0.534 0.516 0.499 0.482
5 0.951 0.906 0.863 0.822 0.784 0.747 0.713 0.681 0.650 0.621 0.593 0.567 0.543 0.519 0.497 0.476 0.456 0.437 0.419 0.402
6 0.942 0.888 0.837 0.790 0.746 0.705 0.666 0.630 0.596 0.564 0.535 0.507 0.480 0.456 0.432 0.410 0.390 0.370 0.352 0.335
7 0.933 0.871 0.813 0.760 0.711 0.665 0.623 0.583 0.547 0.513 0.482 0.452 0.425 0.400 0.376 0.354 0.333 0.314 0.296 0.279
8 0.923 0.853 0.789 0.731 0.677 0.627 0.582 0.540 0.502 0.467 0.434 0.404 0.376 0.351 0.327 0.305 0.285 0.266 0.249 0.233
9 0.914 0.837 0.766 0.703 0.645 0.592 0.544 0.500 0.460 0.424 0.391 0.361 0.333 0.308 0.284 0.263 0.243 0.225 0.209 0.194
10 0.905 0.820 0.744 0.676 0.614 0.558 0.508 0.463 0.422 0.386 0.352 0.322 0.295 0.270 0.247 0.227 0.208 0.191 0.176 0.162
11 0.896 0.804 0.722 0.650 0.585 0.527 0.475 0.429 0.388 0.350 0.317 0.287 0.261 0.237 0.215 0.195 0.178 0.162 0.148 0.135
12 0.887 0.789 0.701 0.625 0.557 0.497 0.444 0.397 0.356 0.319 0.286 0.257 0.231 0.208 0.187 0.168 0.152 0.137 0.124 0.112
13 0.879 0.773 0.681 0.601 0.530 0.469 0.415 0.368 0.326 0.290 0.258 0.229 0.204 0.182 0.163 0.145 0.130 0.116 0.104 0.093
14 0.870 0.758 0.661 0.577 0.505 0.442 0.388 0.340 0.299 0.263 0.232 0.205 0.181 0.160 0.141 0.125 0.111 0.099 0.088 0.078
15 0.861 0.743 0.642 0.555 0.481 0.417 0.362 0.315 0.275 0.239 0.209 0.183 0.160 0.140 0.123 0.108 0.095 0.084 0.074 0.065
16 0.853 0.728 0.623 0.534 0.458 0.394 0.339 0.292 0.252 0.218 0.188 0.163 0.141 0.123 0.107 0.093 0.081 0.071 0.062 0.054
17 0.844 0.714 0.605 0.513 0.436 0.371 0.317 0.270 0.231 0.198 0.170 0.146 0.125 0.108 0.093 0.080 0.069 0.060 0.052 0.045
18 0.836 0.700 0.587 0.494 0.416 0.350 0.296 0.250 0.212 0.180 0.153 0.130 0.111 0.095 0.081 0.069 0.059 0.051 0.044 0.038
19 0.828 0.686 0.570 0.475 0.396 0.331 0.277 0.232 0.194 0.164 0.138 0.116 0.098 0.083 0.070 0.060 0.051 0.043 0.037 0.031
20 0.820 0.673 0.554 0.456 0.377 0.312 0.258 0.215 0.178 0.149 0.124 0.104 0.087 0.073 0.061 0.051 0.043 0.037 0.031 0.026
Table 12.1 Present value factors for a single cash flow (PV)

Year 1% 2% 3% 4% 5% 6% 7% 8% 9% 10% 11% 12% 13% 14% 15% 16% 17% 18% 19% 20%
1 0.990 0.980 0.971 0.962 0.952 0.943 0.935 0.926 0.917 0.909 0.901 0.893 0.885 0.877 0.870 0.862 0.855 0.847 0.840 0.833
2 1.970 1.942 1.913 1.886 1.859 1.833 1.808 1.783 1.759 1.736 1.713 1.690 1.668 1.647 1.626 1.605 1.585 1.566 1.547 1.528
3 2.941 2.884 2.829 2.775 2.723 2.673 2.624 2.577 2.531 2.487 2.444 2.402 2.361 2.322 2.283 2.246 2.210 2.174 2.140 2.106
4 3.902 3.808 3.717 3.630 3.546 3.465 3.387 3.312 3.240 3.170 3.102 3.037 2.974 2.914 2.855 2.798 2.743 2.690 2.639 2.589
5 4.853 4.713 4.580 4.452 4.329 4.212 4.100 3.993 3.890 3.791 3.696 3.605 3.517 3.433 3.352 3.274 3.199 3.127 3.058 2.991
6 5.795 5.601 5.417 5.242 5.076 4.917 4.767 4.623 4.486 4.355 4.231 4.111 3.998 3.889 3.784 3.685 3.589 3.498 3.410 3.326
7 6.728 6.472 6.230 6.002 5.786 5.582 5.389 5.206 5.033 4.868 4.712 4.564 4.423 4.288 4.160 4.039 3.922 3.812 3.706 3.605
8 7.652 7.326 7.020 6.733 6.463 6.210 5.971 5.747 5.535 5.335 5.146 4.968 4.799 4.639 4.487 4.344 4.207 4.078 3.954 3.837
9 8.566 8.162 7.786 7.435 7.108 6.802 6.515 6.247 5.995 5.759 5.537 5.328 5.132 4.946 4.772 4.607 4.451 4.303 4.163 4.031
10 9.471 8.983 8.530 8.111 7.722 7.360 7.024 6.710 6.418 6.145 5.889 5.650 5.426 5.216 5.019 4.833 4.659 4.494 4.339 4.192
11 10.368 9.787 9.253 8.760 8.306 7.887 7.499 7.139 6.805 6.495 6.207 5.938 5.687 5.453 5.234 5.029 4.836 4.656 4.487 4.327
12 11.255 10.575 9.954 9.385 8.863 8.384 7.943 7.536 7.161 6.814 6.492 6.194 5.918 5.660 5.421 5.197 4.988 4.793 4.611 4.439
13 12.134 11.348 10.635 9.986 9.394 8.853 8.358 7.904 7.487 7.103 6.750 6.424 6.122 5.842 5.583 5.342 5.118 4.910 4.715 4.533
14 13.004 12.106 11.296 10.563 9.899 9.295 8.746 8.244 7.786 7.367 6.982 6.628 6.303 6.002 5.724 5.468 5.229 5.008 4.802 4.611
15 13.865 12.849 11.938 11.118 10.380 9.712 9.108 8.560 8.061 7.606 7.191 6.811 6.462 6.142 5.847 5.575 5.324 5.092 4.876 4.675
16 14.718 13.578 12.561 11.652 10.838 10.106 9.447 8.851 8.313 7.824 7.379 6.974 6.604 6.265 5.954 5.669 5.405 5.162 4.938 4.730
17 15.562 14.292 13.166 12.166 11.274 10.477 9.763 9.122 8.544 8.022 7.549 7.120 6.729 6.373 6.047 5.749 5.475 5.222 4.990 4.775
18 16.398 14.992 13.754 12.659 11.690 10.828 10.059 9.372 8.756 8.201 7.702 7.250 6.840 6.467 6.128 5.818 5.534 5.273 5.033 4.812
19 17.226 15.679 14.324 13.134 12.085 11.158 10.336 9.604 8.950 8.365 7.839 7.366 6.938 6.550 6.198 5.877 5.585 5.316 5.070 4.843
20 18.046 16.352 14.878 13.590 12.462 11.470 10.594 9.818 9.129 8.514 7.963 7.469 7.025 6.623 6.259 5.929 5.628 5.353 5.101 4.870
Table 12.2 Present value factors for an annuity (PVA)

Financial Management for Hospitality Decision Makers
Hosp
italit
y, L
eisu
re &
Tou
rism
Ser
ies
Having seen how the discounting tables can be used, we can now turn tocalculating the NPV of an investment proposal. To do so, we need to isolate allincremental cash flows resulting from a decision to invest (including changedtaxation cash flows), then bring these cash flows to present value. Remember, if aproposed investment has a positive NPV, it is acceptable. If it has a negative NPV, itshould be rejected. If we are choosing between two mutually exclusive projects,select the one with the higher NPV. Two examples that illustrate the determinationof an investment proposal’s NPV are provided in Box 12.4.
The discount rate to be used when calculating NPVIt is widely suggested that the discount rate that should be used when calculating aproject’s net present value is the risk-adjusted cost of capital. Much finance researchand discussion has focused on this issue. Stated simply, the cost of capital is theaverage cost (stated as a percentage) of the capital funds raised by a company. Itscalculation is illustrated in Box 12.5.
202
Box 12.4Finding an investment proposal’s net present value
A project’s NPV is determined by deducting its initial investment from the present value of thecash inflows that the project will generate.
NPV example 1: A proposed investment of $20,000 will increase net cash inflows by $5,000 ineach of the following 8 years. The company considering the investment has determined that itrequires a 12% return for this proposal to be acceptable.
NPV = –$20,000 + $5,000 (PVA 12%, 8 years)
= –$20,000 + $5,000 (4.968)
= –$20,000 + $24,840 = $4,840
NPV is positive, therefore proposal is acceptable
NPV example 2: A 1 January 20X0 investment of $10,000 will increase cash inflows by$3,000 in 20X0, $4,000 in 20X1 and $6,000 in 20X2. The company considering the investmentrequires a 12% return on investments.
NPV = –$10,000 + $3,000 (PV 12%, 1 year) + $4,000 (PV 12%, 2 years) + $6,000
(PV 12%, 3 years)
= –$10,000 + $3,000 (0.893) + $4,000 (0.797) + $6,000 (0.712)
= –10,000 + 2,679 + 3,188 + 4,272 = $139
NPV is positive, therefore proposal is acceptable

Investment decision making
Hosp
italit
y, L
eisu
re &
Tou
rism
Ser
ies
The 10.4% cost of capital computed for the Trafalgar group in Box 12.5 would bean appropriate discount rate to use when appraising one of the company’s averagerisk investment proposals. If appraising a higher risk investment, a risk premiumreflecting the higher risk should be added to the cost of capital. This is becauseinvestors are risk averse and they would want to be compensated via a higher returnif the hotel group were to assume a more risky profile. Likewise, if a below-averagerisk investment is under consideration, net present value should be calculated usinga rate below the 10.4% cost of capital. Readers seeking more information on the costof capital will find extensive discussion devoted to the topic in most introductorycorporate finance texts.
Concluding comments on NPVIn the interest of simplification, we have treated future cash flows as if they occur atthe end of the year rather than during the year. This approach is widely taken andsignifies that if the investment proposal under consideration fits the typical cashflow pattern of a large initial outlay followed by incremental net inflows, the netpresent value of the project will be slightly understated.
In theory, NPV is the preferred investment appraisal technique. If a companycommits itself to a project with an NPV of $5 m, and the share market is workingefficiently, the company’s value should increase by $5 m. This is because today’svalue of all the company’s future cash flows has been increased by $5 m.
203
Box 12.5Calculating the cost of capital
The cost of capital can be defined as a firm’s average cost of long-term financing. It is widelyused by companies as the discount rate to be used when calculating NPV.
Imagine the UK-based Trafalgar Hotel group has raised £1,000,000 in capital. £400,000comprises long-term debt with an annual interest of 8%. £600,000 has been raised in equity.Equity holders expect an annual return of 12% on their investment.
From the table below it can be seen that calculating Trafalgar’s cost of capital involves usingweights that reflect the relative size of each of Trafalgar’s long-term sources of finance (i.e.equity is 60% of capital, debt is 40% of capital). Multiplying the cost of each source of financeby its weighting, and summing the products we find the Trafalgar group’s weighted averagecost of capital to be 10.4%.
Cost Relative size ofcapital source
(weighting)
Cost � weighting
Equity (£0.6 m) 12% 0.6 7.2%Debt (£0.4 m) 8% 0.4 3.2%
Cost of capital 10.4%

Financial Management for Hospitality Decision Makers
Hosp
italit
y, L
eisu
re &
Tou
rism
Ser
ies
Internal rate of returnLike the NPV, the internal rate of return (IRR) investment appraisal technique is alsobased on discounting cash flows that occur in the future. Calculation of the IRR isillustrated through a worked example in Box 12.6.
This example represents a relatively easy IRR computation, as the cash inflowsare in the form of an annuity. Where the inflows are not an annuity, a trial anderror approach has to be adopted. This involves trying different discount ratesuntil one is found that results in an NPV of zero. If you have an advanced pocketcalculator, it might be able to compute the IRR, otherwise it can be a lengthyexercise!
The IRR approach to investment appraisal has the following shortcomings:
1 In some cases, where a project’s cash flows include future cash outflows, twodifferent discount rates can result in an NPV of zero (i.e. two IRRs for one project).
2 In a single project, accept or reject situation, NPV and IRR will give the sameindication (i.e. if IRR > required rate of return, NPV will be > 0). When ranking
204
Box 12.6Finding an investment proposal’s internal rate of return
Internal Rate of Return (IRR) = the discount rate that causes the present value of the project’sinflows to equal the present value of the project’s outflows, i.e. the discount rate that causesthe project’s NPV to equal zero.
If a proposed project’s IRR is greater than the company’s risk-adjusted cost of capital, theproject is acceptable.
An IRR exampleImagine a proposed investment of $20,000 will increase cash inflows by $5,000 in each of thefollowing 8 years. The company considering the investment has determined that it requires a12% return for this proposal to be acceptable.
The method taken to find the IRR of a proposed investment that generates future equalannual inflows (an annuity) involves setting the ‘NPV equation’ equal to zero. We thendetermine what discount rate yields the zero NPV.
IRR calculation:
0 = –$20,000 + $5,000 (PVA IRR, 8 years),
$20,000 ÷ $5,000 = (PVA IRR, 8 years),
4 = (PVA IRR, 8 years)
In the PVA table, looking along the 8-year row, we find 4 corresponds to between 18% and 19%.
IRR = is between 18% and 19%
Project is acceptable as IRR > 12%

Investment decision making
Hosp
italit
y, L
eisu
re &
Tou
rism
Ser
ies
projects, however, NPV and IRR can give conflicting signals, i.e. the highestNPV project will not necessarily be the highest IRR project. If this situation arises,preference should be given to the NPV indication as it is the theoreticallypreferred technique.
Despite IRR’s shortcomings (which are not as great as those apparent for ARR andpayback), it is widely used in practice. This may be because managers can conceiveof a proposed investment’s projected rate of return more easily than its projected netpresent value.
Integrating the four investment appraisal techniquesIn capital budgeting decision making, most large companies use more than one ofthe four investment appraisal techniques described in the previous section.Lamminmaki et al. (1996) report on the degree to which large companies use acombination of the techniques, with payback and NPV proving to be the mostpopular.
Case 12.1 is designed to underline the fact that most organizations use more thanone investment appraisal technique. In addition, it highlights that investmentappraisal techniques can be used when considering a cost-saving investment.
Case 12.1Financial Decision Making in Action –
The Chief Engineer and investment appraisal
Imagine the Bermuda Beach Hotel’s chief engineer is deliberating whether to upgrade thehotel’s old air-conditioning system. Investment in the new system would be $250,000 andit has been estimated that it will save the hotel $75,000 in electricity and maintenanceexpenses in each of the next five years. The investment would be depreciated at the rateof $50,000 per annum and have no salvage value at the end of its five-year life. The hotelhas a 10% cost of capital and operates in a tax haven (i.e. no tax applies).
If the chief engineer knows that the hotel’s finance department uses a breadth ofinvestment appraisal techniques, he could review the financial viability of the proposedinvestment by computing its ARR, payback, NPV and IRR in the following manner:
Accounting rate of return (Annual profit generated ÷ Average investment × 100)
ARR = ($75,000 –$50,000) ÷ $125,000 × 100 = 20%
Payback (time taken to recoup the cash invested in an asset)
Payback = $250,000 ÷ $75,000 = 3.33 (i.e. 3 years and 4 months).
Net present value
NPV = –$250,000 + $75,000 (PVA 10%, 5 years)
= –$250,000 + $75,000 (3.791)
= –$250,000 + $284,325 = $34,325.
205

Financial Management for Hospitality Decision Makers
Hosp
italit
y, L
eisu
re &
Tou
rism
Ser
ies
Internal rate of return
0 = –$250,000 + $75,000 (PVA IRR, 5 years),
$250,000 ÷ $75,000 = (PVA IRR, 5 years),
3.33 = (PVA IRR, 5 years),
In the PVA table, in the 5-year row, we find 3.33 corresponds to between 15% and16%.
IRR = is between 15% and 16%
From the above analysis, the chief engineer would have established that the air-conditioning upgrade is financially justifiable as its projected NPV is positive and its IRR isgreater than the cost of capital. Capital budgeting is not always conducted in a completelyrational way, however.
It may be that the Bermuda Beach Hotel has a risk-averse general manager who isunwilling to authorize any capital expenditure that does not meet a predicted payback ofless than three years. It may also be that the proposal is rejected as its submissioncoincides with a year of several other worthy investment projects. While the proposal maybe financially justifiable, the chief engineer will soon realize that it cannot be approved ifthe hotel has insufficient capital funds available.
Summary
In this chapter we have looked at the main financial techniques that can be used to appraiseinvestment proposals. You should now know:
� How to compute a proposed investment’s accounting rate of return, payback period, netpresent value and internal rate of return
� The relative merits of these four investment appraisal techniques� What is meant by the ‘time value of money’� How present values can be determined using discounting tables.
References
Atkinson, H., Berry, A. and Jarvis, R. (1995) Business Accounting for Hospitality andTourism & Leisure, International Thomson Publishing, London, Chapter 19.
Carnegie, G., Jones, S., Norris, G., Wigg, R. and Williams, B. (1999) Accounting:Financial and Organisational Decision Making, Irwin/McGraw-Hill, New York,Chapter 24.
Coltman, M. M. and Jagels, M. G. (2001) Hospitality Management Accounting, 7thedition, John Wiley, Chichester, Chapter 12.
Eyster, Jr, J. J. and Geller, A. N. (1981) ‘The Capital-Investment Decision: TechniquesUsed in the Hospitality Industry’, The Cornell Hotel and Restaurant AdministrationQuarterly, May, 69–73.
Harris, P. (1999) Profit Planning, Butterworth-Heinemann, Oxford, Chapter 12.
206

Investment decision making
Hosp
italit
y, L
eisu
re &
Tou
rism
Ser
ies
Kotas, R. (1999) Management Accounting for Hospitality and Tourism, 3rd edition,International Thomson Publishing, London, Chapter 19.
Lamminmaki, D., Guilding, C. and Pike, R. (1996) ‘A Comparison of British andNew Zealand Capital Budgeting Practices’, Pacific Accounting Review, 1–29.
Owen, G. (1994) Accounting for Hospitality, Tourism & Leisure, 1st edition, PitmanPublishing, London, Chapter 16.
Schmidgall, R. F. (1997) Hospitality Industry Managerial Accounting, 4th edition,Educational Institute – American Hotel & Motel Association, East Lansing, MI,Chapter 13.
207
Problems
✓ indicates that a solution appears at the back of the text
✓ 12.1 Michael Johnson has been given the opportunity of investing in a financial security thatwill pay him $600 in five years’ time. Assuming similar risk investments earn an annualreturn of 8%, what value should Michael put on this investment opportunity today?
✓ 12.2 (a) What is the value today of a stream of cash flows paying $500 at the end of eachof the next 8 years? Assume an interest rate of 10%.
(b) What is the value today of a stream of annual cash flows paying $500 at thebeginning of each of the next 8 years (i.e. the first cash flow will occur today)?Assume an interest rate of 10%. (Helpful hint: remember that the PVA table iscompiled on the basis that the first cash flow occurs in one year’s time.)
✓ 12.3 Given the following two sets of cash flows, determine whether A or B has the higherpresent value. Assume an interest rate of 12%. (Helpful hint: remember that the PVAtable is compiled on the basis that the first cash flow occurs in one year’s time.)
Yeara Cash stream A Cash stream B$ $
1 3,000 3,5002 3,000 3,5003 3,5004 3,000 3,5005 3,0006 3,0007 3,000 3,5008 3,000 3,500
a Assume that year 1 refers to a cash flow occurring in 1 year’s time, year 2 refersto a cash flow occurring in 2 years’ time, etc.
12.4 As part of its annual capital budgeting cycle, the Welsh Westmede hotel is decidingwhether investment proposal A or investment proposal B is more financiallyjustifiable. Investment proposal A requires an initial outlay of £36,000. It is estimatedthat £3,000 of this initial investment will be salvaged at the end of the investment’sfive-year life. Investment B also requires an initial investment of £36,000. It isestimated that this asset will be salvaged for £7,000 in five years’ time.
Financial Management for Hospitality Decision Makers
Hosp
italit
y, L
eisu
re &
Tou
rism
Ser
ies
The schedule below presents the timing of estimated increases to Westmede’soperating cash flows and also operating profit that would result if either investmentwere to be made.
Year
Investment ANet cashoperatinginflows
£
Increasedoperating
profita
£
Investment BNet cashoperatinginflows
£
Increasedoperating
profita
£
1 14,000 6,400 5,000 02 12,000 4,900 7,000 8003 10,000 3,400 15,000 8,4004 8,000 1,900 18,000 10,4005 8,000 2,400 13,000 5,400
a Annual depreciation charges associated with the new investment will causeoperating profits to be less than operating cash flows.
Required • • •(a) Calculate the accounting rate of return for the two investment proposals.(b) Calculate the payback for the two investment proposals.(c) Calculate the net present value for the two investment proposals assuming that
the company has a required rate of return of 12%. Assume that no tax implicationwill arise as a result of salvaging either of the proposed investments at the end oftheir useful lives.
(d) Which is the preferred investment opportunity?
12.5 Edmonton’s Green Park Hotel is considering purchasing some new laundryequipment for $200,000. Currently the hotel is outsourcing its laundry activities. Thehotel’s financial controller has estimated that if the laundry equipment is purchased,annual cash flows of $50,000 will be saved in each of the next five years, at whichtime the laundry equipment will have a zero salvage value. The hotel has a 10% costof capital.
Required • • •(a) What is the laundry equipment’s approximate internal rate of return?(b) In light of your answer to part (a), would you recommend that the hotel invests in
the laundry equipment?
12.6 (a) Imagine you are trying to find the IRR of an investment project that has increasingestimated future cash inflows in each of the next eight years. You have tried adiscount rate of 12% and have discovered that this results in a positive NPV for theinvestment project. Explain whether the project’s IRR is more or less than 12%.
(b) Your hotel is considering two options with respect to a major overhaul of anexisting restaurant. The restaurant will either be themed as an Italian restaurant,which will require the installation of a wood-fired pizza oven, or as a British pubwhich will require the installation of extensive bar facilities. It has been estimatedthat the Italian restaurant option will provide an IRR of 16% and an NPV of$420,000. It has also been projected that the British pub option will provide anIRR of 17% and an NPV of $350,000. From a financial perspective, explain whichof the two options is preferable.
208

Investment decision making
Hosp
italit
y, L
eisu
re &
Tou
rism
Ser
ies
12.7 Viking Hotels, a large international hotel chain, is structured according to sevengeographically based divisions worldwide. Shortly after he joined the company, theChief Executive of the European division informed General Managers in Viking’sEuropean hotels that he wanted an improved profit performance. This head of theEuropean division believes in a decentralized policy and likes to give Hotel GeneralManagers considerable autonomy in running their hotels as they see fit.
Eighteen months after the European Division’s Chief Executive took up hisposition, the performance of the group’s Birmingham and Manchester hotels caughthis eye. Both hotels had managed to increase their return on capital employed,following some expansion in the Birmingham hotel’s assets and some contraction inthe Manchester hotel’s assets. The schedule below summarizes the performance ofthe two hotels.
Birmingham hotel Manchester hotel
20X2 20X1 20X2 20X1
Net operating profit £144,000 £60,000 £228,000 £288,000Capital employed £2,400,000 £1,500,000 £1,200,000 £1,600,000
Return on capital employed 6% 4% 19% 18%
In addition to providing a financial summary of their hotel’s performance, eachHotel General Manager is expected to provide the division’s Chief Executive with awritten commentary that provides background to the financial performance. Thefollowing represents extracts taken from the commentaries provided by the GeneralManagers in the Birmingham and Manchester hotels.
The Birmingham hotel General Manager commented:
We’ve managed to expand operations this year following the completion ofthe hotel’s east wing extension. This expansion is already proving to behighly successful with operating profit more than doubling and return oncapital employed increasing from 4% to 6%. I, together with the hotel’ssenior management, am confident that continued expansion is possible andthat next year we will again be able to increase return on capital employedby a further percentage point to 7%.
The General Manager of the Manchester Hotel commented:
20X2 has been a year of rationalization. We’ve managed to sell offsome of the hotel’s grounds where we used to operate a restaurant, barand night club. This has had a positive impact on our return on capitalemployed. Further increases in return on capital employed may bepossible as we may be able to phase out other below average rate ofreturn activities.
Required • • •In light of Viking’s cost of capital, which is 12%, explain whether the actions of the twohotels give cause for any concern. (Helpful hint: consider the return on capitalemployed of the assets acquired at the Birmingham hotel and also the return oncapital employed of the assets sold at the Manchester hotel.)
209

Financial Management for Hospitality Decision Makers
Hosp
italit
y, L
eisu
re &
Tou
rism
Ser
ies
12.8 Len, the head of general stores in a large Australian hotel complex, has been askedto defend his ‘gut feel’ that an upgrade in the currently used stores computerizedinformation system is warranted. He has visited a company operating the recentlydeveloped ‘Super store’ software and has returned very favourably impressed. Henow needs to prepare an investment proposal in a manner that will find favour withthe finance group that closely scrutinizes all capital expenditure proposals.
Len has determined that the upgrade will cost the hotel $40,000 in new computerhardware. An annual software operating licence fee would also have to be paid. Lenrecommends that the licence agreement be entered into for 5 years as the softwarecompany is providing an introductory special of ‘sign up for 5 years and pay a fee ofonly $5,000 per annum – a saving of 10% off the standard fee charge’. Due tocomputer technology advancement, it is widely believed that the hardware will beworthless after five years. For this reason, the company’s policy will be to view theinvestment as having a life of five years.
Len believes that the new system will enable him to reduce clerical time associatedwith inputting data on the old computer system by 25 hours per week. This clericalwork has been performed by a casual employee who cost the hotel $15,000 in wageslast year. He also believes that the greater accuracy resulting from the improvedrecord keeping that would be achieved will reduce the investment in average stockheld by $10,000.
Required • • •(a) Ignoring tax, determine the payback of this investment.(b) Assuming a 40% tax rate and that computer hardware capital expenditure is
written off straight line over a five-year period for tax purposes, use NPV todetermine whether the proposed computer upgrade is justified. The hotel has a10% cost of capital.
12.9 The General Manager of Eating Extravagance Ltd has approached you seekingadvice on two competing investment opportunities that he has under consideration.Each investment requires an initial investment of $40,000 and will result in thefollowing annual cash flows over a six-year period.
Year Alternative 1 Alternative 2$ $
1 2,000 16,0002 8,000 13,0003 10,000 11,0004 12,000 8,0005 16,000 6,0006 24,000 4,000
Required • • •(a) Calculate the payback for each of the investment alternatives. Based on the
payback method, state which is the preferred investment.(b) Calculate the net present value of each of the alternatives, assuming the general
manager uses a discount rate of 10% in all NPV calculations.(c) Based on your calculations, comment on which, if either, of the investment
alternatives should be taken.
210

Investment decision making
Hosp
italit
y, L
eisu
re &
Tou
rism
Ser
ies
12.10 The Stellar Views’ Chapel Case Study
Introduction • • •This is a case that draws on a real investment opportunity that was underconsideration in a large Australian hotel. The numbers stated in the case have beenmodified and also the name of the hotel changed in order to provide anonymity to thehotel concerned. The case is presented partly as an illustration of the difficult natureof estimating future cash flows when a hotel is considering an investment in a newactivity that is significantly different from its existing activities. Textbooks that providean overview of capital budgeting too frequently give extensive consideration to thedifferent appraisal techniques that can be used, but give little attention to the problemof generating a proposed investment’s cash flow estimates.
Case description • • •The Stellar Views Hotel is located in a popular tourist region of Australia. The hotelcomprises two adjoining buildings located near a beach. The main building is 25storeys high, and the second is 6 storeys high. The smaller of the two buildings hasa large flat roof with easy pedestrian access available from the large building. A smalltennis facility comprising two courts has occupied this roof for the last ten years andthe courts are now in need of a major overhaul. The tennis facility has been providedas a free service to hotel guests.
Stellar Views’ management is considering dismantling the tennis facility andreplacing it with a small 100-seat wedding chapel. The management believes thereis considerable potential demand for this service, especially in light of the photoopportunities that the chapel’s position would offer. In addition to catering to the localmarket, the chapel would be targeted towards the many Japanese visitors that cometo the region to get married. Part of the rationale for the strong anticipated demandrelates to a change in the type of wedding/reception/accommodation mix currentlysought in the market for weddings. In earlier years it was typical for different venuesto be used for the wedding service, wedding reception and also the accommodationbooked before and after the wedding. Following consultation with a Japanese touristoperator, Stellar Views’ management has determined that couples are increasinglyseeking a facility that can enable the wedding service, reception and accommodationto be provided at a single site. Convenience and cost issues are the main factors thatlie behind this change. A single venue signifies that couples can benefit frompackaged prices and also save on additional costs such as limousine hire and churchdecorators.
The hotel’s management has commissioned a consulting group to developestimates of the initial costs of building the chapel and also the demand for weddingceremonies. It has been estimated that the chapel will cost $1,000,000 to build. Theschedule overleaf presents the consulting company’s demand estimates. Thedemand estimates are based on a ceremony fee of $550. This ceremony price alsocovers the provision of floral arrangements, pew bows, topiary trees and a redcarpeted aisle.
The hotel has also projected that each ceremony will have a variable cost of $100and that annual fixed costs associated with maintaining the chapel and surroundinggardens will be $10,000. Further, it has been estimated that 90% of the Japaneseinbound market ceremonies will result in a reception held at the hotel and extraguests staying at the hotel. It has been estimated that each Japanese reception heldat the hotel will generate a contribution of $2,000. For the 90% of Japanese
211
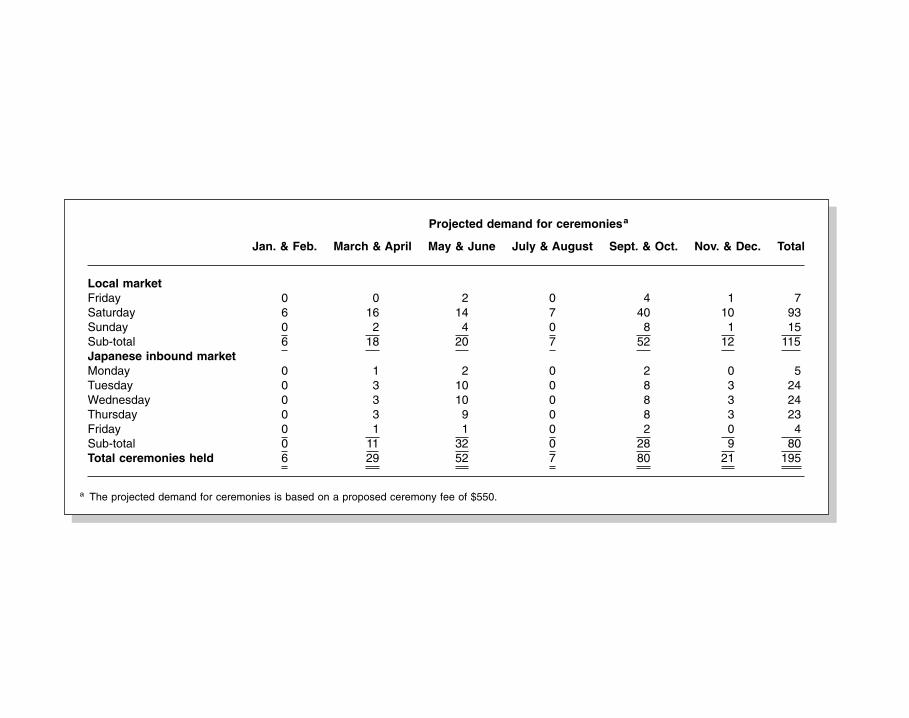
Projected demand for ceremoniesa
Jan. & Feb. March & April May & June July & August Sept. & Oct. Nov. & Dec. Total
Local marketFriday 0 0 2 0 4 1 7Saturday 6 16 14 7 40 10 93Sunday 0 2 4 0 8 1 15Sub-total 6 18 20 7 52 12 115Japanese inbound marketMonday 0 1 2 0 2 0 5Tuesday 0 3 10 0 8 3 24Wednesday 0 3 10 0 8 3 24Thursday 0 3 9 0 8 3 23Friday 0 1 1 0 2 0 4Sub-total 0 11 32 0 28 9 80Total ceremonies held 6 29 52 7 80 21 195
a The projected demand for ceremonies is based on a proposed ceremony fee of $550.
Investment decision making
Hosp
italit
y, L
eisu
re &
Tou
rism
Ser
ies
ceremonies that will result in extra guests staying at the hotel, it has been estimatedthat each ceremony will result in an additional $1,000 of accommodation profit earnedby the hotel.
With respect to the wedding ceremonies booked by locals, it is estimated that 20%will result in a reception at the hotel and these receptions will contribute $5,000 perreception. Further, it is estimated that the average local market ceremony will resultin 15 extra room sales which will generate an additional contribution of $100 perroom. The hotel’s financial controller has determined that the viability of this chapelinvestment will be assessed using a 14% discount rate.
Required • • •(a) Prepare an NPV analysis of the proposed chapel investment for Stellar Views’
management. Assume that the hotel’s management feels that the projecteddemand schedule presented above will apply for the first five years following thechapel’s construction. In addition, it feels the contributions earned fromreceptions and accommodation associated with ceremonies will be constant inthe chapel’s first five years. When calculating NPV, the management has a policyof not looking at cash flow estimates beyond a five-year period.
(b) Describe whether you see the proposed chapel investment as risky. With respectto the discount rate that should be used when calculating the chapel’s NPV, doyou feel Stellar Views should use its cost of capital?
(c) What sources of information do you feel the hotel might use with respect todeveloping its initial estimate of the cost of building the chapel?
213

This Page Intentionally Left Blank
Solutions toproblems
Chapter 1 Hospitality decisionmakers’ use of financial management
Problem 1.1(a) Functional interdependency exists when the per-
formance of one functional area is affected by theperformance of a separate functional area. Forexample, in a hotel complex that is dominated by acasino, the success of the rooms and food andbeverage departments will be affected by thesuccess of the casino operations in attracting clientsto the complex.
(b) Functional interdependency is an important issue forthe designers of a hotel’s system of accountabilitybecause care should be taken to hold a manageraccountable for only those aspects of the hotel’sperformance that he or she can influence. Forexample, the heads of rooms and food and bev-erage departments should not be held accountablefor a decrease in their room sales if it is caused byreduced casino activity.

Financial Management for Hospitality Decision Makers
Hosp
italit
y, L
eisu
re &
Tou
rism
Ser
ies
Problem 1.2(a) The four main dimensions of sales volatility in the hotel industry are:
1 Economic cycle-induced sales volatility,2 Seasonal sales volatility,3 Weekly sales volatility,4 Intra-day sales volatility.
(b) The implications that these dimensions of sales volatility carry for hotelaccounting systems are as follows:
1 Economic cycle-induced volatility: Hotel sales’ high susceptibility to generaleconomic conditions highlights the importance of hotels carefully forecastingeconomic cycles as part of the annual budgeting process.
2 Seasonal sales volatility: Three accounting implications arise:
� Seasonal sales volatility can be so severe to warrant temporary closure forsome resort properties. This possibility of having to make a closure decisionsignifies that cost and revenue data should be recorded in a manner that willenable a well-informed financial analysis of the pros and cons of closing.
� Seasonal sales volatility can also pose particular cash management issues.During the middle and tail-end of the busy seasons, surplus cash balancesare likely to result, while in the off-season and the build-up to the busyseason, deficit cash balances are likely to result. Careful cash budgeting willtherefore need to be conducted.
� Seasonal sales volatility will also affect price discounting decisions. Toensure such decisions are well informed, careful forecasting as part of theannual budgetary process will have to be conducted.
3 Weekly sales volatility: Accurate forecasting of weekly sales volatility willinform management’s decision making with respect to the amount and timingof room rate discounting, staffing needs as well as restaurant purchasingneeds.
4 Intra-day sales volatility: Intra-day demand volatility has led to widely usedpricing strategies such as ‘early bird specials’ in restaurants and ‘happy hours’in bars. Records concerning demand at different times of the day will have tobe maintained in order to inform such hotel pricing issues.
Problem 1.3(a) High product perishability signifies that an item cannot be held in inventory for
sale at a later time. Food items have a limited life inventory because of their rapidphysical deterioration. Room nights and conference facilities cannot be placed ininventory because they relate to a particular time period that expires.
(b) The absolute perishability of rooms, conference and banquet facilities and therelative perishability of food underlines the importance of accurate hotel demandforecasting as part of the budgeting process. Generally, the most importantaspect of forecasting is room occupancy, as room sales drive sales levels of otherhotel services. Accurate restaurant forecasting provides the basis for maintaininga full menu of options while also minimizing the cost of food wastage.
216

Solutions to problems
Hosp
italit
y, L
eisu
re &
Tou
rism
Ser
ies
Chapter 2 Analysing transactions and preparing year-endfinancial statementsProblem 2.1(a) Simply defined, assets are things that are owned by a business. Typical hotel
assets include: cash, accounts receivable, prepayments, inventory, cars, china,silver, glass, linen, uniforms, equipment, land and buildings.
(b) Simply defined, liabilities comprise financial obligations of the organization.Typical liabilities include: wages & salaries payable, accounts payable and bankloans.
(c) Simply defined, owners’ equity represents the residual claim that owners have onthe assets of an organization subsequent to the acquittal of all liabilities. Owners’equity increases when owners introduce more funds to the organization andwhen the organization makes a profit.
Problem 2.2The balance sheet equation relates to the fact that assets minus liabilities equalsowners’ equity. The equation can also be stated as assets equal liabilities plusowners’ equity.
Underlying the first equation is the notion that the value of the owners’ equity in abusiness equals the surplus assets that would remain following acquittal of allliabilities. Sense can also be made of the second equation as a business raisesmoney and then invests the money in various assets.
Problem 2.3A business balance sheet summarizes the assets, liabilities and owners’ equitypertaining to the business. It can thus be seen to be one representation of the wealthof the organization. It relates to a particular moment in time.
In the profit and loss statement sales revenue and expenses (i.e. resourcesconsumed) for a period of time are summarized. The deduction of total expensesfrom total revenue provides profit (or loss if expenses are greater than revenue).
Chapter 3 Double entry accounting
Problem 3.1No, it is inappropriate and misleading to suggest a debit to an account represents agood or a bad thing. It is true that a debit to the cash or bank account may be seenas beneficial as it signifies that an inflow of money has occurred. However, a debit toan expense account signifies an increase in the expense account and not manybusinesses would regard an increase in an expense as beneficial. We can concludethat we can only say that a debit to an account is a good thing if we know what typeof account we are talking about.
Problem 3.2No, in double entry accounting we cannot say that a debit represents a plus and acredit represents a minus. Debiting an asset account will usually represent a plus as
217

Financial Management for Hospitality Decision Makers
Hosp
italit
y, L
eisu
re &
Tou
rism
Ser
ies
asset accounts generally have a debit balance (the bank account can be anexception, however, if it is overdrawn). Liability accounts (e.g. accounts payable),however, generally have a credit balance, therefore a debit entry will have the effectof reducing the account’s credit balance.
Problem 3.3‘Fixed assets’ is the term given to all physical assets that will be held by the owningcompany for more than a year. They are acquired for use in operations rather than forresale to customers. ‘Current assets’ include cash and other assets that through thebusiness’s operating cycle will be converted into cash, sold or consumed within oneyear of the balance sheet date. The main current assets are: cash, prepayments(discussed in Chapter 4) accounts receivable and inventory.
Chapter 4 Adjusting and closing entries
Problem 4.1‘Adjusting entries’ is the term used to describe the set of bookkeeping entries thatneed to be made in order to update some accounts prior to the preparation of theaccounting year-end profit and loss statement and balance sheet. This ‘tidying up’ ofaccounts, which is really what the adjusting entries represent, has to be completedprior to closing entries. In many cases, the need for adjusting entries arises becausethe timing of cash flows (either receipts or disbursements) does not coincide with theperiod in which it is appropriate to recognize the revenue or expense. This distinctionbetween the timing of a cash flow and the timing of the recognition of a revenue or anexpense item stems from the accrual concept of accounting which holds that:
� Revenue is recognized when it is earned and certain, rather than simply when cashis received.
� An expense is recognized in the period when the benefit derived from theassociated expenditure arises.
Closing entries involve rolling all the accounts that feed into the profit and lossstatement (plus the drawings account) back to zero at the end of the accounting year.For this reason, these accounts are sometimes referred to as temporary accounts.Accounts that feed directly into the balance sheet are sometimes referred to aspermanent accounts as they are not rolled back to zero at the end of the accountingyear. The revenue, expense and drawings accounts have to be wound back to zeroat the end of the accounting year, otherwise they would carry amounts that relate tothe business since its inception, rather than the current accounting year.
218

Solutions to problems
Hosp
italit
y, L
eisu
re &
Tou
rism
Ser
ies
Problem 4.2(a) Telephone expense Telephone payable
500 500
(b) Rent expense Rent accrued
2,400 2,400
(c) Depreciation expense Accumulated depreciation
1,000 1,000
(d) Salary & wage expense Salaries & wages accrued
70,000 70,000
(e) Unearned revenue Revenue
1,200 1,200
(f) Rental revenue Unearned revenue
400 400
Problem 4.3(a)1. Cash Accounts receivable
92,000 OB 141,50092,000
2. Accounts receivable Revenue
141,500 OB 1,320,00092,000
101,000 101,000
219

Financial Management for Hospitality Decision Makers
Hosp
italit
y, L
eisu
re &
Tou
rism
Ser
ies
(b) The first entry is to record the write down of the accounts receivable for the 180days’ due balance:
Allowance for doubtful accounts Accounts receivable
4,500 OB 2,400 141,500 92,000101,000
4,500
Following the review of the accounts receivable ledger, it has been determined thatthe allowance for doubtful accounts should have a credit balance of $2,080 (($84,000× 0.0075) + ($44,000 × 0.0125) + ($18,000 × 0.05)).
An inspection of the balance on the ‘allowance for doubtful accounts’ accountreveals that following the above debit entry of $4,500, it has a debit balance of$2,100. In order to achieve the requisite closing credit balance of $2,080, an adjustingcredit entry of $4,180 has to be made to the ‘allowance for doubtful accounts’. Thisadjusting entry signifies that the allowance for doubtful accounts entries madethroughout the year were insufficient to reflect the doubtful account reality at the year-end. It is presumed that through the year, when the monthly entry has been made toallow for doubtful accounts, the ‘bad debts expense’ account has been debited.Accordingly, we need to increase the bad debts expense account at the year-end, i.e.make an adjusting debit entry of $4,180 to the ‘bad debts expense’ account.
Allowance for doubtful accounts Bad debts expense
4,500 2,400 OB 12,400
4,180 4,180
Chapter 5 Financial statement analysis
Problem 5.1
(a) Dupont(ROI)
EBIT
TA=
EBIT
Revenue×
Revenue
TA
HoJo: 50 ÷ 250 = 50 ÷ 500 × 500 ÷ 250,0.2 = 0.1 × 2
EasyRest 15 ÷ 75 = 15 ÷ 300 × 300 ÷ 75,0.2 = 0.05 × 4
(b) Both companies’ F&B activities have achieved a 20% return on total assets.However, their methods of achieving this return have been quite different. HoJohas earned a 10% profit margin and a 200% turnover of sales to total assets,whereas EasyRest has had a much higher sales turnover (4 or 400%) with asmaller profit margin (5%).
220

Solutions to problems
Hosp
italit
y, L
eisu
re &
Tou
rism
Ser
ies
The companies appear to have different pricing policies. HoJo’s mark-up oncost of sales is 150% (300/200), whereas EastRest only marks up cost of salesby 36% (80/220).
Problem 5.2(a) Cost of sales = 0.6 × £28,750,000 = £17,250,000
Average inventory =£400,000 + £800,000 + £900,000 + £200,000
4
= £575,000
Inventory turnover =£17,250,000
£575,000= 30
Average age of inventory =365
30= 12.17 days
(b) Enwad appears to have less liquid inventory than the average firm in the industry.Enwad’s inventory is converted into a sale after 12 days while the average firm inthe industry is taking approximately 9 days (365 ÷ 40).
Problem 5.3(a) Year ending 20X1 working capital:
($10,800 + 27,000 + 7,500 + 10,400 + 1,500) – ($8,400 + 3,600 + 4,500 + 700 +10,700) = $57,200 – $27,900 = $29,300Year ending 20X2 working capital:($14,300 + 26,000 + 7,500 + 12,000 + 1,600) – ($12,200 + 5,600 + 3,400 + 400+ 9,500) = $61,400 – $31,100 = $30,300
(b) Year ending 20X1 current asset ratio: $57,200 ÷ $27,900 = 2.05Year ending 20X2 current asset ratio: $61,400 ÷ $31,100 = 1.97
(c) Year ending 20X1 acid test ratio: ($57,200 – 10,400 – 1,500) ÷ $27,900 = 1.62Year ending 20X2 acid test ratio: ($61,400 – 12,000 – 1,600) ÷ $31,100 = 1.54
(d) The working capital shows a marginal increase, however both the current assetratio and the acid test ratio have decreased marginally. It appears the increase inthe working capital has largely been accounted for by an increase in the size ofthe business (all things being equal, as a business doubles in size, so its workingcapital needs to double in order to maintain the same level of liquidity). Overall,we can conclude that there has been a marginal decrease in the restaurant’slevel of liquidity.
(e) Accounts receivable turnover = Credit sales ÷ average accounts receivableCredit sales = $500,000 × 0.55 = $275,000Average accounts receivable = ($27,000 + $26,000) ÷ 2 = $26,500Accounts receivable turnover = $275,000 ÷ $26,500 = 10.38
(f) Accounts receivable collection period = 365 ÷ A.R. turnover:365 ÷ 10.38 = 35.16 days
221

Financial Management for Hospitality Decision Makers
Hosp
italit
y, L
eisu
re &
Tou
rism
Ser
ies
(g) Inventory turnover = Cost of sales ÷ average inventoryCost of sales = $150,000Average inventory = ($10,400 + $12,000) ÷ 2 = $11,200Inventory turnover = $150,000 ÷ $11,200 = 13.39
(h) Inventory collection period = 365 ÷ inventory turnover:365 ÷ 13.39 = 27.25 days
Chapter 6 Cost management issues
Problem 6.1The range of cost classifications arises due to the wide diversity of managementdecision-making and control situations that can arise. In the text of the chapter it wasnoted that the cost classifications that can arise include the following:
(a) Outlay versus opportunity costs(b) Direct versus indirect costs(c) Variable versus fixed costs(d) Controllable versus non-controllable costs(e) Incremental versus sunk costs.
An opportunity cost can be a significant issue if management is considering takingan action that will result in a lost opportunity. The issue of direct versus indirect costsis an issue when attempting to determine the profitability of revenue-generatingdepartments, as calculation of each departments’ net profit would necessitate theallocation of indirect costs. Many issues arise that necessitate a distinction betweenfixed and variable costs; one significant issue addressed in this chapter concerns theaggressive pricing strategy of setting prices over the short term at a level designed tocover variable costs. In responsibility accounting it is important that managers areonly held accountable for costs that they can control. Finally, sunk costs are irrelevantin decision making; the decision maker need only focus on costs that will be affectedby whatever decision is at hand.
Problem 6.2(a) Variable costs: £
Food and drink 7.0Conference materials 6.0
Fixed costs (£360 ÷ 80) 4.517.5
(b) Variable costs: £Food and drink 7Conference materials 6
Fixed costs (£360 ÷ 120) 316
222

Solutions to problems
Hosp
italit
y, L
eisu
re &
Tou
rism
Ser
ies
(c) The cost per attendee declines with more attendees because the fixed cost isspread across more attendees.
(d) If 120 people attend, the cost per attendee is £16.If profit is to be 20% of revenue, then cost must be 80% of revenue.As cost = £16 per person when 120 people attend, revenue per person mustbe
£16 ÷ 0.8 = £20.(e) The lowest price that does not result in the conference adversely affecting this
year’s profit is the variable cost, i.e. £13 (£7 + £6).
Problem 6.3(a) Determination of variable cost function:
When 20,000 kg of laundry was processed (highest level of activity),cost = $22,000.
When 18,000 kg of laundry was processed (lowest level of activity),cost = $20,400.
It therefore costs an extra $1,600 ($22,000 – $20,400), to process an extra2,000 kg of laundry (20,000 – 18,000).Therefore, the variable cost per kg is $1,600/2,000 = $0.80 per kg.Determination of fixed cost function:
Calculation based on July’s performance:HighFlyer’s laundry costs for July are $22,000, and their variable laundry costsare $16,000 ($0.80 × 20,000 kg). Fixed housekeeping costs must therefore be$6,000 ($22,000 – $16,000).
(b) Total laundry costs if 25,000 kg of laundry are processed: (25,000 × $0.80) +$6,000 = $26,000
Chapter 7 Cost–volume–profit analysis
Problem 7.1(a) The contribution margin format enables us to quickly answer questions such as
‘What will happen to profit if our hotel’s revenue increases by $100,000?’ Ifvariable costs are 20% of revenue, then the contribution margin ratio is 80%. Thissignifies that a $100,000 increase in revenue will result in an $80,000 increase inprofit (0.8 × $100,000).
The contribution margin format can also be seen as helpful to management’sunderstanding of cost structure as it places revenue alongside those costs thatare affected by the level of revenue achieved.
(b) Cost–volume–profit analysis can be helpful if a manager is considering questionssuch as:
1 ‘How many units will we need to sell in order to break even?’2 ‘How much will we need to sell in order to achieve our target profit level?’3 ‘What will happen to profit if we manage to increase sales volume by 10%?’4 ‘By what volume of sales are we currently surpassing our breakeven point?’5 ‘If fixed costs increase by $20,000, how much more would we have to sell in
order to maintain our current level of profit?’
223

Financial Management for Hospitality Decision Makers
Hosp
italit
y, L
eisu
re &
Tou
rism
Ser
ies
Problem 7.2(a) The Hulsey Restaurant
Profit and loss statement for the year ending 31 December 20X1(Contribution margin layout)
$ PercentageSales revenue 500,000 100.0Variable costs
Variable cost of sales 100,000 20.0Variable operating expenses 16,000 3.2
Contribution margin 384,000 76.8Fixed costs
Salaries and wages 144,000 28.8Marketing 10,000 2.0Rent 48,000 9.6Maintenance 5,000 1.0Other 10,000 2.0
217,000 43.4
Net Profit 167,000 33.4
(b) Breakeven point = Fixed costs ÷ Contribution per cover = $217,000 ÷ (25 – [5 +0.8]) = $217,000 ÷ $19.2 = 11,302 meals per annum
(c) From the profit and loss statement prepared using the contribution margin layout,it is evident that the contribution margin is 76.8%. An increase in sales of 10%represents a $50,000 sales increase ($500,000 × 0.1). As the contribution marginratio is 76.8% a 10% increase in sales will result in a $38,400 increase in profit($50,000 × 0.768).
(d) Profit = Contribution margin – Fixed costs. ($600,000 × 0.768) – $217,000 =460,800 – 217,000 = $243,800
(e) A 10% increase in revenue would signify that profit would increase by $50,000($500,000 × 0.1). Alternately stated, profit would increase by $2.5 for eachcover served. As there are 20,000 covers sold, profit would increase by $50,000($2.5 × 20,000).
Problem 7.3(a) Room nights to be sold to break even =
Fixed costs ÷ Contribution per room night£360,000 ÷ (£68 – £8) = 6,000 room nights.
Room nights available per annum = 365 × 60 = 21,900� Percentage occupancy necessary to break even =
6,000 ÷ 21,900 × 100 = 27.4%(b) Room nights to be sold to achieve a before-tax profit of £60,000 =
(Fixed costs + target profit) ÷ Contribution per room night =(£360,000 + £60,000) ÷ (£68 – £8) = 7,000 room nights.
224

Solutions to problems
Hosp
italit
y, L
eisu
re &
Tou
rism
Ser
ies
(c) Room nights to be sold to achieve an after-tax profit of £72,000 =[Fixed costs + (After-tax target profit ÷ ‘1 – tax rate’)]
÷ Contribution per room night =[£360,000 + (£72,000 ÷ 0.6)] ÷ (£68 – £8) =
(360,000 + 120,000) ÷ 60 = 8,000 room nights
225
Chapter 8 Budgeting and responsibility accounting
Problem 8.1Responsibility accounting involves sub-dividing an organization into units ofaccountability. It is fundamental to control as it involves holding managersaccountable for the performance of their respective units. Budgeting is closelyassociated with responsibility accounting because it involves allocating resourcesto an organization’s sub-units. In addition, the budget highlights benchmarks thatare used when appraising a unit manager’s performance. As the budgeting systemsets targets for all of an organization’s sub-units, it is difficult to conceive of anymeaningful budgeting occurring in the absence of a responsibility accountingsystem.
Problem 8.2There is no single ‘easy’ answer to this question. Issues that might be addressed ina well-reasoned answer include:
� So long as Bromwich provided the requisition to Joe in reasonable time (i.e.sufficient purchasing lead time), it would be inappropriate to hold the head ofbanqueting and conferences responsible for the part not arriving. Despite thisissue, it would appear that the head of banqueting and conferences wasresponsible for the refund decision and therefore justification could be given forcharging at least a portion of the lost revenue to her department. One could alsoargue that given the importance of the part, Maxine should have followed up withJoe more times.
� The following rationale could be developed for charging all of the lost revenue tothe purchasing department:
1 In the whole organization, the purchasing manager is the one who is mostclosely associated with the role of ensuring timely delivery.
2 Joe could be criticized for not getting another staff member or Maxine to followup on the order while he was away on holiday.
3 Joe could have requested that a copy of the consignment be faxed when toldthat the delivery was underway.
4 Joe should have informed Maxine earlier of the potential problem with thedelivery.
5 By requiring Joe’s department to carry the loss, he may take greater care whenordering one-off special parts in the future.
� It could also be argued to be inappropriate to attach blame to Joe (it was really thesupplier’s fault), as it appears he may well have made reasonable efforts to ensuretimely delivery.

Financial Management for Hospitality Decision Makers
Hosp
italit
y, L
eisu
re &
Tou
rism
Ser
ies
� Joe and Maxine could attempt to recoup some of the loss from the supplier. At thevery least, this would inform the supplier of the cost of their mistake.
� This case appears to be a situation highlighting how it can be very inappropriate touse the responsibility accounting system as an apportioning blame system ratherthan a ‘determining who should have the opportunity to explain’ system.
Problem 8.3(1) The first thing to note is that the responsibility accounting system appears to be
perceived as an ‘apportioning blame’ system. This is highly undesirable as it islikely to give rise to ill-feeling that is more damaging than helpful. A properly usedresponsibility system emphasizes information rather than blame. If managers feelthey are beaten around the head when unfavourable variances occur, they arelikely to view the system as a tool of bureaucracy and start conjuring up ways toundermine the system. When the numbers are used in a manner that emphasizesthe informational role of the responsibility system, managers are more likely to beopen to discussion with colleagues in a quest for gaining improved performance.Scheduling an inter-departmental management meeting following the receipt ofmonthly performance reports may be one way of focusing on the informationaspect of the responsibility accounting system.
(2) The accountant could agree that in the future ‘pastry cutters’ wages will becharged to Maintenance at the rate of $9 per hour and that a correction will bemade for last month’s entry. The $4.50 premium could be charged to a ‘Loss fromunused capacity’ account which is charged back to the F&B department becauseit was the F&B director who elected to retain these staff. The Maintenancemanager should be told that it is up to him to get $9 of work per hour out of thestaff placed under his direction. The fact that these are non-preferred personnelcould be recognized in a note to the monthly report.
(3) Theoretically, the accountant could argue that the $4.50 (or even the whole$13.50) represents investment in an asset as:
(a) It is an investment today that will yield a benefit in the future (i.e. retention ofpreferred kitchen staff)
(b) It is an investment today that will result in a saving in the future (i.e. no needto expend resources recruiting and training new skilled kitchen staff).
Due to conservatism, accountants would not tend to take this view, however. Thedistinction is nevertheless important. An ‘expense’ tends to be viewed in anegative light, while an ‘investment’ tends to be viewed in a positive light.
Chapter 9 Flexible budgeting and variance analysis
Problem 9.1
(a) As the lodge has made 15% more room sales than was budgeted for ([12,420 –10,800] ÷ 10,800 × 100), we can produce a flexible budget by increasing therevenue and variable cost figures stated in the static budget by 15%. A simpleway to achieve this is to multiply them by a factor of 1.15.
226

Solutions to problems
Hosp
italit
y, L
eisu
re &
Tou
rism
Ser
ies
The Curbside Motor LodgeFlexible budget performance report
for the quarter ended 30 September 20X1
Actual Budget Flexiblebudget
Flexiblebudget
variancesRoom nights sold 12,420 10,800 12,420
£ £ £ £Revenue (sales) 1,179,900 1,080,000 1,242,000 62,100 (U)Variable Costs:
Labour 84,456 75,600 86,940 2,484 (F)Room amenities 5,216 5,400 6,210 994 (F)
Contribution Margin 1,090,228 999,000 1,148,850 58,622 (U)Fixed Costs 241,000 235,000 235,000 6,000 (U)
Operating Profit 849,228 764,000 913,850 64,622 (U)
(b) A shortcoming of isolating variances between actual performance and thestatic budget is that much of a variance may be attributable to the fact that it ispractically impossible to correctly estimate the volume of sales that will occurin a forthcoming accounting period. Variances occurring as a result of anorganization being busier or quieter than expected are not really reflective ofthe performance of many managers. If we were to take static budget variancesto the extreme, we can see that very favourable variable cost variances can beachieved if we have no one staying at our hotel! To remove the effect of actualvolume of sales being different from the budgeted volume of sales, we canproduce a flexible budget. In a flexible budget, the static budget figures arerestated as if the actual volume of sales achieved had been known at the timethe budget was set.
The flexible budget performance report provides very different managementinsights to those provided by the static budget variances computed byCurbside’s conventional performance report. The extent of these differences ishighlighted by the following table.
227

Financial Management for Hospitality Decision Makers
Hosp
italit
y, L
eisu
re &
Tou
rism
Ser
ies
Curbside: Comparison of static budget and flexible budget variances
Static budgetvariances
Flexible budgetvariances
Revenue (sales) (F) (U)Variable Costs:
Labour (U) (F)Room amenities (F) (F)
Contribution Margin (F) (U)Fixed Costs (U) (U)Operating Profit (F) (U)
� The unfavourable flexible budget variance for revenue signifies that roomsmust have been sold below the rate budgeted for. This fact was not evidentfrom the static budget variance.
� The favourable flexible budget variance for labour signifies that labour workedefficiently or the labour rate was below the rate budgeted for. This fact was notevident from the static budget variance.
� The size of the unfavourable revenue flexible budget variance is sufficient tohave turned the favourable static budget contribution margin variance into anunfavourable flexible budget variance. This impact is also apparent at theoperating profit level.
Problem 9.2(a) Curbside: Room cleaning labour rate and efficiency variances
for quarter ending 30/9/X1
Actual labour hours Actual labour hours Budgeted labour hours� � �
Actual rate Budgeted rate Budgeted rate5,630.4 5,630.4 6,210
� � �£15 £14.00 £14.00
£84,456 £78,825.6 £86,940
←⎯⎯⎯⎯⎯⎯⎯⎯⎯⎯⎯→ ←⎯⎯⎯⎯⎯⎯⎯⎯⎯⎯⎯→£5,630.4 Unfavourable labour
rate variance£8,114.4 Favourable labour
efficiency variance
←⎯⎯⎯⎯⎯⎯⎯⎯⎯⎯⎯⎯⎯⎯⎯⎯⎯⎯⎯⎯⎯⎯⎯⎯⎯→£2,484 Labour favourable flexible budget variance
228

Solutions to problems
Hosp
italit
y, L
eisu
re &
Tou
rism
Ser
ies
(b) Curbside: Room amenities price and efficiency variancesfor quarter ending 30/9/X1
Actual packs Actual packs Budgeted packs� � �
Actual price Budgeted price Budgeted price13,040 13,040 12,420
� � �£0.40 £0.50 £0.50
£5,216 £6,520 £6,210
←⎯⎯⎯⎯⎯⎯⎯⎯⎯⎯⎯→ ←⎯⎯⎯⎯⎯⎯⎯⎯⎯⎯⎯→£1,304 Amenities favourable
price variance£310 Amenities unfavourableefficiency (or usage) variance
←⎯⎯⎯⎯⎯⎯⎯⎯⎯⎯⎯⎯⎯⎯⎯⎯⎯⎯⎯⎯⎯⎯⎯⎯⎯→£994 Amenities favourable flexible budget variance
(c) Curbside: Selling price and sales volume variancesfor quarter ending 30/9/X1
Actual volume of sales Actual volume of sales Budgeted volume of sales� � �
Actual selling price Budgeted selling price Budgeted selling price12,420 room nights 12,420 room nights 10,800 room nights
� � �£95* £100** £100
£1,179,900 £1,242,000 £1,080,000
←⎯⎯⎯⎯⎯⎯⎯⎯⎯⎯⎯→ ←⎯⎯⎯⎯⎯⎯⎯⎯⎯⎯⎯→£62,100 Unfavourable selling
price variance£162,000 Favourable sales
volume variance
←⎯⎯⎯⎯⎯⎯⎯⎯⎯⎯⎯⎯⎯⎯⎯⎯⎯⎯⎯⎯⎯⎯⎯⎯⎯→£99,900 Favourable revenue variance
* £1,179,900 ÷ 12,420 = £95** £1,080,000 ÷ 10,800 = £100
229

Financial Management for Hospitality Decision Makers
Hosp
italit
y, L
eisu
re &
Tou
rism
Ser
ies
Problem 9.3
(a) Tiff’s RestaurantFlexible budget performance report
for the month ended 30 June
ActualFlexiblebudget
Flexiblebudget
variance
Flexiblebudget
variancee e e %a
Breakfasts (actual served: 110)Revenue (sales) 759 770 11 (U) 1.4%Variable Costs 242 275 33 (F) 12.0%
Breakfast contribution margin 517 495 22 (F) 4.4%
Lunches (actual served: 100)Revenue (sales) 1,700 1,400 300 (F) 21.4%Variable Costs 540 500 40 (U) 8.0%
Lunch contribution margin 1,160 900 260 (F) 28.9%
Dinners (actual served: 300)Revenue (sales) 6,600 7,500 900 (U) 12.0%Variable Costs 2,850 3,000 150 (F) 5.0%
Dinners contribution margin 3,750 4,500 750 (U) 16.7%
Total restaurant contribution 5,427 5,895 468 (U) 7.9%
Less: Fixed costs 740 800 60 (F) 7.5%
Net profit 4,687 5,095 408 (U) 8.0%a Flexible budget variance as a percentage of the flexible budget.
(b) From the above table’s final column, it is evident that there is a large lunchrevenue flexible budget variance that is 21.4% of the flexible budget amount. Thisvariance has resulted from the average lunch revenue being e17, i.e. e3 morethan the budgeted average lunch revenue. If this higher average revenue stemsfrom higher than anticipated menu prices, the higher prices may have resulted inthe below-budget volume of lunch sales achieved (the restaurant has sold 50lunches less than was budgeted for). Management may need to consider whetherthe higher prices have resulted in a reduced volume of sales.
A second factor that might be worthy of further investigation is the e900unfavourable variance that has resulted from dinner average revenue beingbelow budget. Average dinner revenue was budgeted at e25, however actualaverage dinner revenue is e22. Management might review what has caused thefailure to meet budgeted average dinner revenue and whether dinner menuprices need to be increased.
230

Solutions to problems
Hosp
italit
y, L
eisu
re &
Tou
rism
Ser
ies
Chapter 10 Cost information and pricing
Problem 10.1Total costs:
£Bank loan (£250,000 @ 9%) 22,500Depreciation 40,000Other fixed costs 65,000Operating expenses 85,000
Total costs 212,500
After-tax profit sought by owners = £450,000 × 0.15 = £67,500.Before-tax profit needed to provide after-tax profit of £67,500 =
£135,000 (tax is 50%).Total revenue needed to provide before tax profit of £135,000 =Total costs + desired before-tax profit, i.e. £212,500 + £135,000 = £347,500Room rate = Total revenue ÷ Room nights sold in a yearRoom nights sold in a year = 40 × 0.55 × 365 = 8,030Room rate = £347,500 ÷ 8,030 = £43.27
Problem 10.2(a) Profit = Revenue – Variable costs – Fixed costs
Contribution = Revenue – Variable costs
In this problem Variable costs are 75% of Revenue,� Contribution = 25% of Revenue
We can therefore say:Target profit = 0.25 of Revenue – Fixed costs, or:50% of $120,000 = 0.25R – ($55,000 + $8,000 + $30,000 + $5,000 +
$6,000 + $4,000 + $28,000)
$60,000 + $136,000 = 0.25R,$196,000 ÷ 0.25 = RR = $784,000
Answer: total revenue of $784,000 will provide a 50% before-tax return on theowners’ investment of $120,000.
(b) Total number of weekdays restaurant is open = 49 × 4 = 196.Total number of weekday covers sold = 196 × 50 × 2 = 19,600.
Total number of Saturdays and Sundays restaurant is open = 49 × 2 = 98.Total number of weekend covers sold per annum = 98 × 50 × 3 = 14,700
Total number of covers sold per annum = 19,600 + 14,700 = 34,300� average selling price per cover to provide target profit =
$784,000 ÷ 34,300 = $22.86
231

Financial Management for Hospitality Decision Makers
Hosp
italit
y, L
eisu
re &
Tou
rism
Ser
ies
Problem 10.3(a) Total investment in rooms = $12,600,000 (70% of $18 m).
Average room investment = $140,000 ($12.6 m ÷ 90).Average room rate = $140 ($140,000 ÷ 1,000).
(b) Revenue required per day = $3,066,000/365 = $8,400Let M represent price charged per square metre.(21 × 60 M) + (21 × 80 M) + (21 × 110 M) = $8,4001,260 M + 1,680 M + 2,310 M = $8,4005,250 M = $8,400M = $1.6
For the economy rooms the rate should be: $1.6 × 60 = $96.For the double rooms the rate should be: $1.6 × 80 = $128.For the deluxe rooms the rate should be: $1.6 × 110 = $176.
Chapter 11 Working capital management
Problem 11.1Schedule of projected cash receipts
for CrownJewel in ($000)
October November December Total
Room sales 540 500 60010% cash sales. 54 50 60 16450% received in month following sale 300 270 250 82035% received 2 months following sale 231 210 189 6305% received 3 months following sale 31.5 33 30 94.5
Total room receipts 616.5 563 529 1,708.5
Restaurant & bar sales 70 60 8030% cash sales 21 18 24 6370% received in month following sale 56 49 42 147Total restaurant & bar receipts 77 67 66 210
Total all receipts 693.5 630 595 1,918.5
232

Solutions to problems
Hosp
italit
y, L
eisu
re &
Tou
rism
Ser
ies
Problem 11.2Schedule of projected cash disbursements
for CrownJewel Hotel (in $000)
October November December Total
Room variable costs paid in monthincurred (Room revenue × 0.2 × 0.6).
64.8 60.0 72.0 196.8
Room variable costs paid one month afterincurred (Room revenue × 0.2 × 0.4).
48.0 43.2 40.0 131.2
Restaurant & bar wages (Restaurantrevenue × 0.1).
7.0 6.0 8.0 21.0
Food & drink costs paid in month incurred(Rest. & bar revenue × 0.15 × 0.4)
4.2 3.6 4.8 12.6
Food & drink costs paid following monthincurred (R&B revenue × 0.15 × 0.6)
7.2 6.3 5.4 18.9
Fixed costs 15.0 15.0 15.0 45.0
Electricity and insurance 3.0 7.5 10.5
Total disbursements 146.2 137.1 152.7 436.0
Problem 11.3Cash budget for CrownJewel
October$
November$
December$
Total$
Total cash receipts a 693.5 630.0 595.0 1,918.5less Total cash disbursements b 146.2 137.1 152.7 436.0
Net cash flow 547.3 492.9 442.3 1,482.5add Opening cash balance 12,000.0 12,547.3 13,040.2 12,000.0
Ending cash 12,547.3 13,040.2 13,482.5 13,482.5a From solution to Problem 11.1.b From solution to Problem 11.2.
233

Financial Management for Hospitality Decision Makers
Hosp
italit
y, L
eisu
re &
Tou
rism
Ser
ies
Chapter 12 Investment decision making
Problem 12.1Present value = $600 (PV8,5 year) = $600 × 0.681 = $408.60
Problem 12.2(a) Present value = $500 (PVA10,8 years) = $500 × 5.335 = $2,667.50(b) In this problem, as the PVA table is compiled on the basis that the first cash flow
occurs in one year’s time, we need to isolate the first cash flow as it is due tooccur today. As this cash flow is occurring today, it is already stated in terms oftoday’s $, therefore there is no need to discount it. The present value of thisstream of cash flows will be calculated on the following basis:
Present value = Today’s cash flow + The present value of the annuity to bereceived at the end of the next seven years
Present value = $500 + $500 (PVA10,7 years) =$500 + ($500 × 4.868) = $500 + $2,434 = $2,934
Problem 12.3In this problem, each cash stream comprises two annuities (cash stream A comprisesa $3,000 annuity occurring at the end of year’s 1 and 2 and a cash flow annuityoccurring at the end of years 4–8). We will find the present value of each cash streamby treating them as comprising two separate annuities.
Cash stream APresent value of cash flows occurring in years 1 and 2 =$3,000 (PVA12,2 years) = $3,000 × 1.690 = $5,070
Finding the present value of the cash flows occurring in years 4–8 is slightlychallenging and will be calculated in two stages. First, the annuity table will beused as normal to find the present value of the five annual cash flows. However,as the annuity table has been compiled on the basis that the first cash flowoccurs in one year’s time, the answer provided will represent the value of thecash flows one year before the first cash flow occurs, i.e. at year 3. Consequentlywe will then have to discount the amount back over a three-year period using thePV table (we use the PV table as, at this point, we will be dealing with a $ valuestated at one point in time).Present value of cash flows occurring in years 4–8 = $3,000 (PVA12,5 years)(PV 12,3 years) = $3,000 × 3.605 × 0.712 = $7,700.28
We now add together the present value of the cash flows occurring in years 1and 2 to the present value of the cash flows occurring in years 4–8 to find thetotal present value of cash stream A.
Present value cash stream A = $5,070 + $7,700.28 = $12,770.28
Cash stream BThere is another method for dealing with an interruption in an annuity. While thepresent value of cash stream B could be calculated using the same approach as
234

Solutions to problems
Hosp
italit
y, L
eisu
re &
Tou
rism
Ser
ies
that used for cash stream A we will use the alternative approach in order toillustrate how it can be applied. In this approach we will initially assume that the$3,500 cash flow is present in the years 1–8 (i.e. we will use (PVA12,8 years).From the answer computed through this first step we will then deduct the presentvalue of the two cash flows that are actually missing from the 8 year annuity(years 5 and 6).
PV cash stream B = $3,500 (PVA12,8 years) – $3,500 (PV12,5 years) – $3,500(PV 12,6 years) =
$3,500 (4.968) – $3,500 (0.567) – $3,500 (0.507) =$17,388 – 1,984.5 – 1,774.5 = $13,629
From the above, it can be seen that the present value of cash stream A($12,770.28) is $858.72 less than the present value of cash stream B($13,629).
235

This Page Intentionally Left Blank

Index
Accounting, 9Accounts payable management, 186–7Accounting rate of return, 196Accounts receivable, 68, 182–4Accounts receivable ageing schedule, 183Accounts receivable collection period, 68Accounts receivable turnover, 68Accrual accounting, 45Accrued wages, 48Accumulated depreciation, 55Acid test ratio, 71Adjusting entries, 44–56Aging schedules, 183Assets, 21–2
Bad debts, 52–3Balance sheet, 21Balance sheet equation, 22Balanced Scorecard, 10Behavioural aspects of budgeting, 126–30Bottom up approach to setting room rates,
163Break even analysis, 103–9Budgetary participation, 128Budgetary roles, 123–5Budgets, 123–34
Capital budgeting, 196Cash budget, 175–80Cash management, 175–81Contra accounts, 53, 55Contribution, 101–3Contribution margin, 101–3Contribution pricing, 168Cost centres, 118Cost classifications, 84Cost object, 83Cost of sales, 13
Cost-plus pricing, 160Cost-volume-profit analysis, 101–9Closing entries, 44Credit entry, 22Creditors, 186Credit management, 186–7Current assets, 39, 71Current liabilities, 39, 71Current asset ratio, 71
Debit entry, 22Debt financing, 72–4Debt ratio, 72Debt to equity ratio, 72Depreciation, 54–6Direct costs, 85Discounting cash flows, 199Discretionary cost, 118Dividends, 38Double-entry accounting, 32–8Drawings, 38
Earnings per share, 70Efficiency variance, 143–6Elasticity, 159Economic Order Quantity, 185Equity, 21–2Expenses, 22
Financial accounting, 9, 20Financial management, 9Fixed assets, 7, 36, 39Fixed asset turnover, 69Fixed costs, 7, 88Flexible budgets, 140–2
237

Index
Hosp
italit
y, L
eisu
re &
Tou
rism
Ser
ies
Goal congruence, 119Gross profit, 64, 67Gross profit margin, 67
High-low method, 89Hubbart formula, 163
Income, 11Income statement, 11Incremental costs, 93Indirect costs, 85Insurance expense, 45–8Internal rate of return, 204Inventory, 50–2, 68, 184–6Inventory turnover, 68Investment centres, 121Investment decision making, 196–206
Labour intensity, 7Ledger accounts, 32Liabilities, 21–22, 39Liquidity, 71, 175, 180
Management accounting, 20Master budget, 115Menu pricing, 160Mixed costs, 89
Net book value, 55–6Net present value, 198Net profit, 13Net profit margin, 67
Occupancy (room or bed), 74Opportunity costs, 85Owner’s equity, 21–22
Payback method, 197Periodic inventory accounting, 50–2Perishability, 6, 159–60Perpetual inventory accounting, 52Political aspects of budgeting, 129–30Prepaid expenses, 45–8Price earnings ratio, 70Price elasticity, 159Price variance, 145–6
Pricing, 157–70Profit and loss statement, 11, 21Profit centres, 120–1
Quick ratio, 71
Rack rate, 75Ratio analysis, 64–73Regression analysis, 89Rent expense, 45Residual income, 123–4Responsibility accounting, 116Restaurant pricing, 77–8Retained earnings, 22, 38Return on equity, 70Return on investment, 65, 70, 122Revenue, 22Revenue centres, 120Revenue per available room, 75–6Roles of the budget, 123–5Room rates, 75–6
Sales volatility, 5Seasonality, 5Seat turnover, 77Semi-variable costs, 89Staffing schedules, 125–6Stock management, 184–6Sunk costs, 93
‘T’ accounts, 33Times interest earned, 74Turnover ratios, 67–9
Uniform system of accounts, 11
Variable costs, 88, 101Variance analysis, 142–8Volume variance, 147
Wages accrued, 48Working capital, 71Working capital management, 175–89
Yield management, 167–8
238