Embed Size (px)
Citation preview
Financial Market Views Macro-Top Down: The Euro and the Dollar
Tom Glaessner, Citigroup:
Prepared for the Dallas Fed Conference: The Euro and the Dollar in the Crisis and Beyond
My thanks to Jim Bai and Kerry –Ann Edwards
Mar 17, 2010

2
A Perfect Storm at Outset of 2010?
3
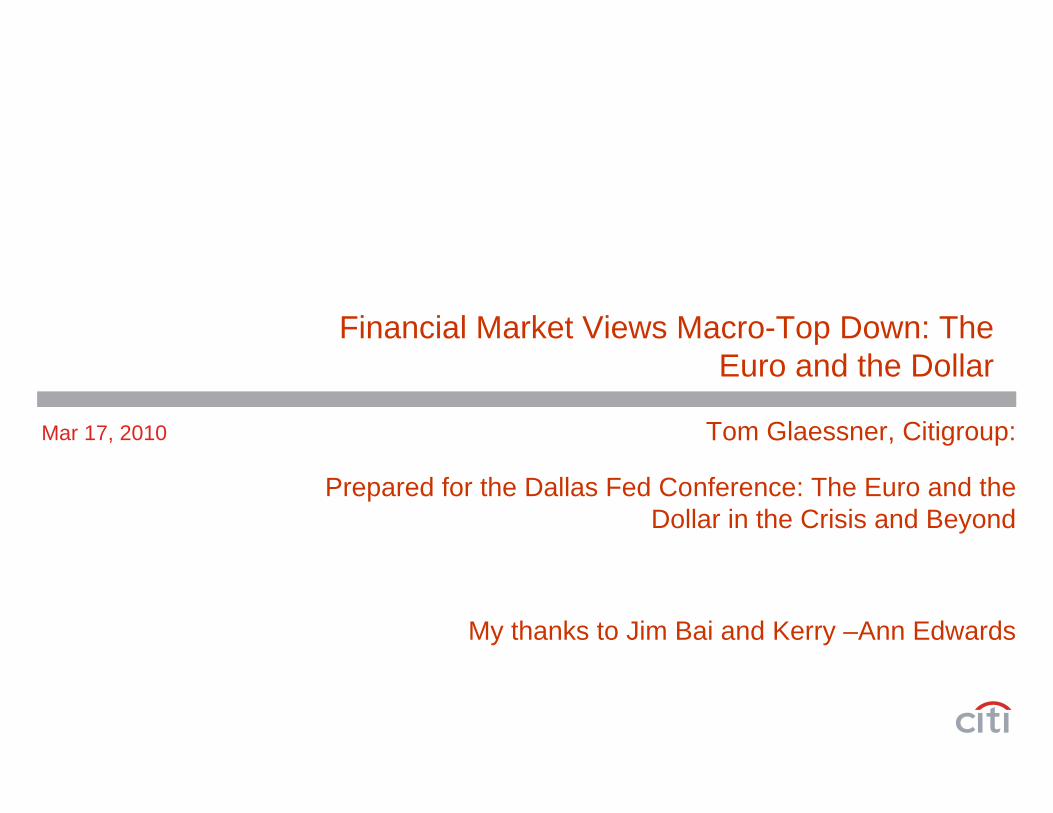
Technical and Fundamental Drivers and Macro Themes
An Eclectic Approach—Technical and Fundamental Drivers of the Dollar and the Euro– Technical and Positioning Drivers– Fundamental Drivers of Structural Trends in the Dollar and the Euro
US and European growth sustainability and medium term fiscal exit.Debt and Sovereign Credit concerns in Europe and US. Exit of US and ECB monetary policy.China Exit, FX policy, and Imbalances.Overall policy uncertainty and threats of market interventions in currency and credit markets and the Dollar and Euro

Technical and Positioning Drivers for the Dollar and Euro
5
Technical and Positioning Drivers
Short Term Technical and Positioning Drivers– Euro skew not as extreme toward depreciation as it has been in the past this year– Technical charts and sentiment suggest Euro appreciation and not depreciation – Flows overall not that positive for Euro but not wholly negative
Central Bank and SWF flows starting to favor Euro again after a drought at start of yearInstitutional client flow of real money—no evidence of capitulation in sale of euro-denominated portfolio despite recent movesHFs very negative on Euro a trade de jour as proxy for credit pressures in EuropeNet Corporate flows will work against Euro as companies missed the opportunities to hedge and many will look to hedge as shorts covered by others keeping pressure on Euro
– Markets trading more off relative interest rate differentials and differentiation of credit as well as away from interventions due to policy shifts (capital controls and fx intervention)
Favors the EM currencies in Asia and Latin America versus G-2 or G3Favors commoditiesThere are limits to these trends—and they are not unrelated to global liquidity
6
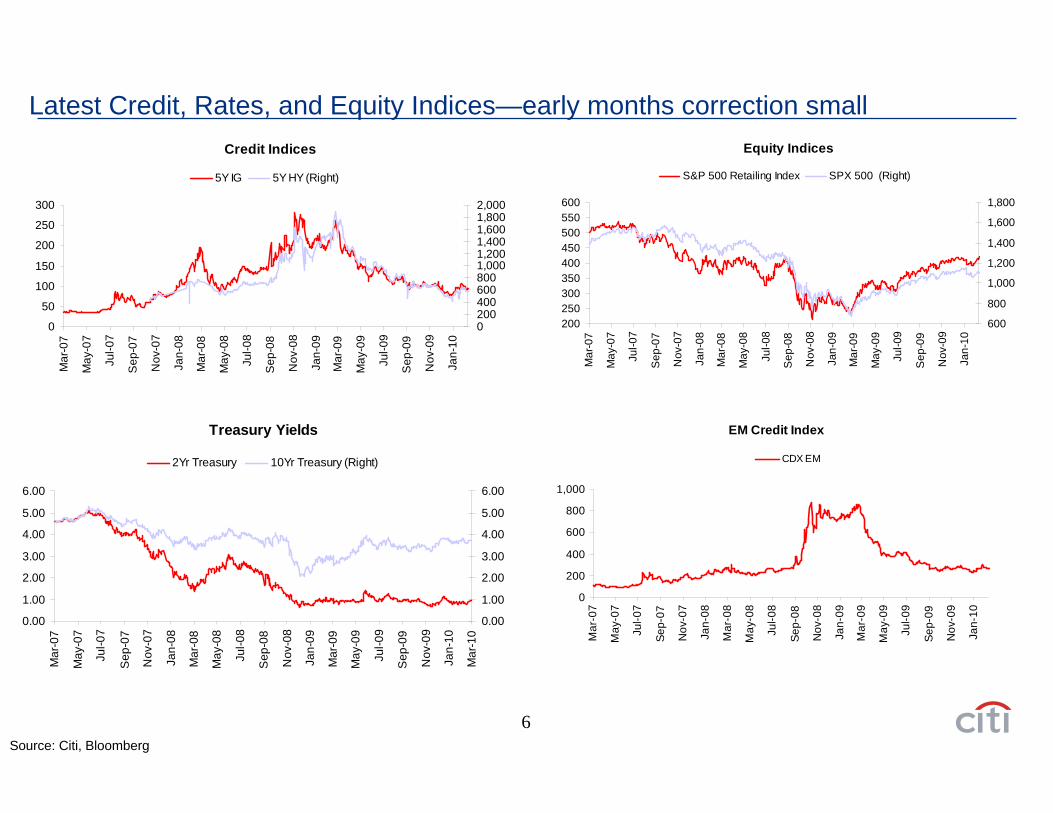
Latest Credit, Rates, and Equity Indices—early months correction small
Source: Citi, Bloomberg
Credit Indices
0
50
100
150
200
250
300
Mar
-07
May
-07
Jul-0
7
Sep
-07
Nov
-07
Jan-
08
Mar
-08
May
-08
Jul-0
8
Sep
-08
Nov
-08
Jan-
09
Mar
-09
May
-09
Jul-0
9
Sep
-09
Nov
-09
Jan-
10
02004006008001,0001,2001,4001,6001,8002,000
5Y IG 5Y HY (Right)
Equity Indices
200250300350400450500550600
Mar
-07
May
-07
Jul-0
7
Sep
-07
Nov
-07
Jan-
08
Mar
-08
May
-08
Jul-0
8
Sep
-08
Nov
-08
Jan-
09
Mar
-09
May
-09
Jul-0
9
Sep
-09
Nov
-09
Jan-
10
600
800
1,000
1,200
1,400
1,600
1,800
S&P 500 Retailing Index SPX 500 (Right)
Treasury Yields
0.00
1.00
2.00
3.00
4.00
5.00
6.00
Mar
-07
May
-07
Jul-0
7
Sep
-07
Nov
-07
Jan-
08
Mar
-08
May
-08
Jul-0
8
Sep
-08
Nov
-08
Jan-
09
Mar
-09
May
-09
Jul-0
9
Sep
-09
Nov
-09
Jan-
10
Mar
-10
0.00
1.00
2.00
3.00
4.00
5.00
6.00
2Yr Treasury 10Yr Treasury (Right)
EM Credit Index
0
200
400
600
800
1,000
Mar
-07
May
-07
Jul-0
7
Sep-
07
Nov
-07
Jan-
08
Mar
-08
May
-08
Jul-0
8
Sep-
08
Nov
-08
Jan-
09
Mar
-09
May
-09
Jul-0
9
Sep-
09
Nov
-09
Jan-
10
CDX EM
7
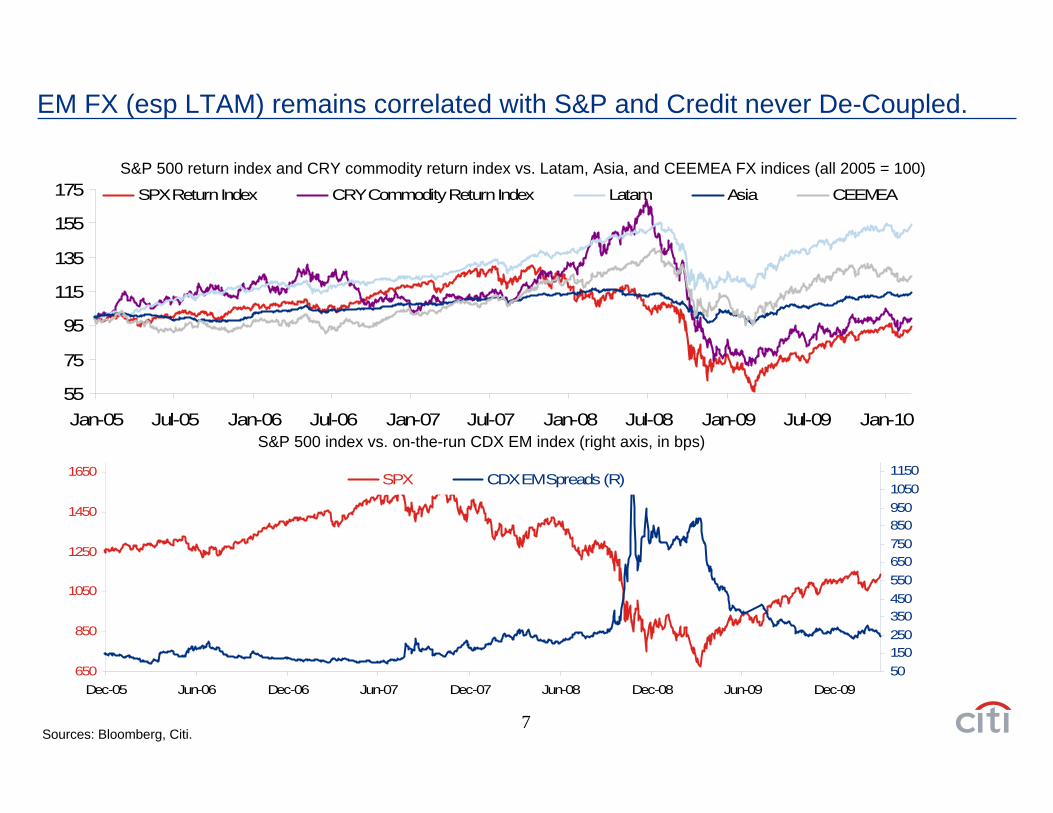
EM FX (esp LTAM) remains correlated with S&P and Credit never De-Coupled.
Sources: Bloomberg, Citi.
S&P 500 return index and CRY commodity return index vs. Latam, Asia, and CEEMEA FX indices (all 2005 = 100)
S&P 500 index vs. on-the-run CDX EM index (right axis, in bps)
55
75
95
115
135
155
175
Jan-05 Jul-05 Jan-06 Jul-06 Jan-07 Jul-07 Jan-08 Jul-08 Jan-09 Jul-09 Jan-10
SPX Return Index CRY Commodity Return Index Latam Asia CEEMEA
650
850
1050
1250
1450
1650
Dec-05 Jun-06 Dec-06 Jun-07 Dec-07 Jun-08 Dec-08 Jun-09 Dec-095015025035045055065075085095010501150SPX CDX EM Spreads (R)
8
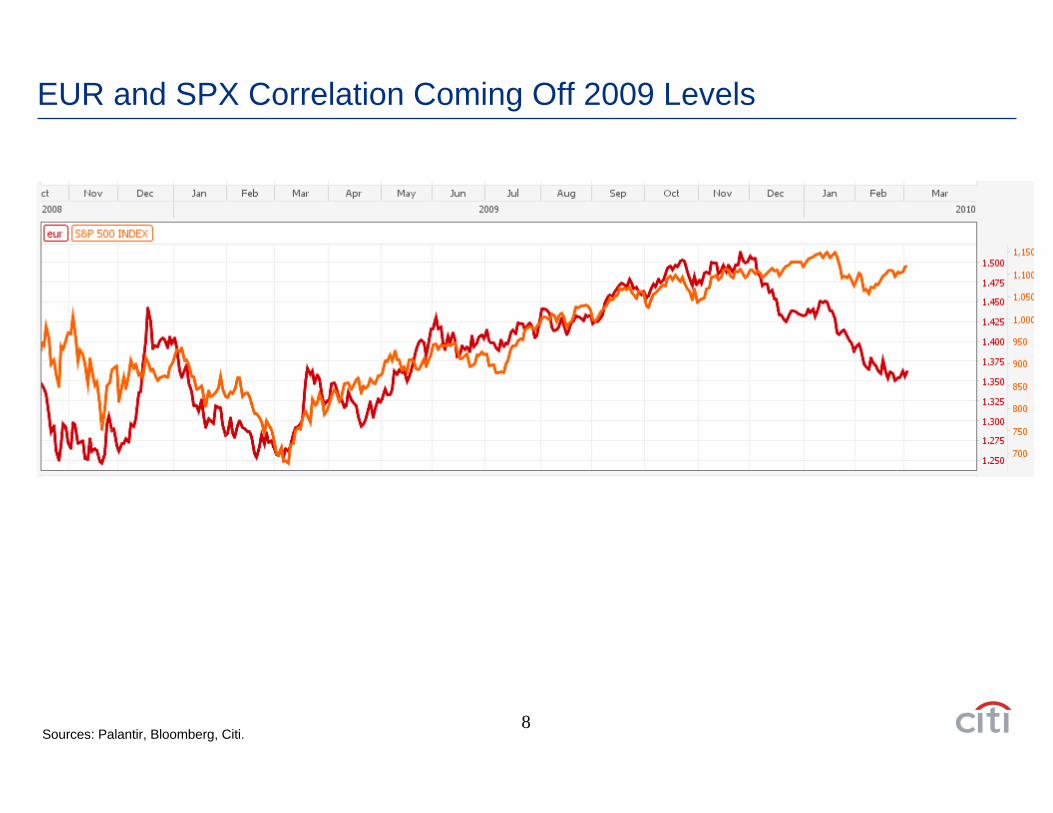
EUR and SPX Correlation Coming Off 2009 Levels
Sources: Palantir, Bloomberg, Citi.
9
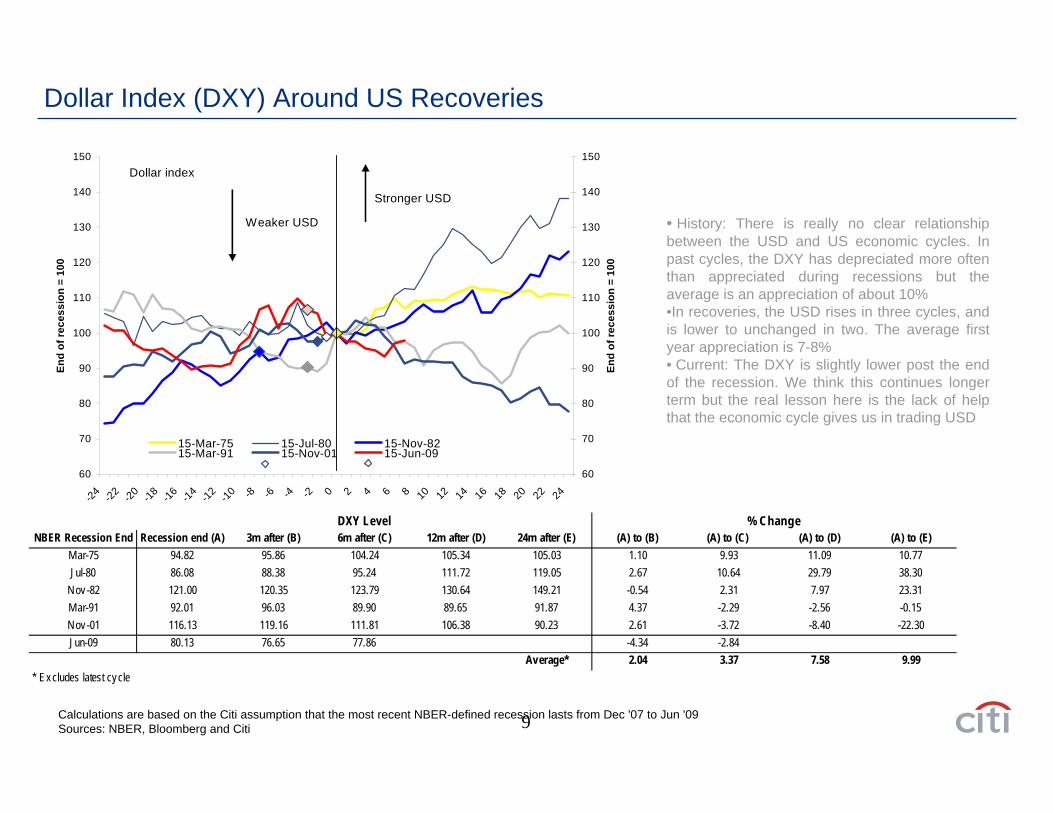
Dollar Index (DXY) Around US Recoveries
• History: There is really no clear relationship between the USD and US economic cycles. In past cycles, the DXY has depreciated more often than appreciated during recessions but the average is an appreciation of about 10%•In recoveries, the USD rises in three cycles, and is lower to unchanged in two. The average first year appreciation is 7-8%• Current: The DXY is slightly lower post the end of the recession. We think this continues longer term but the real lesson here is the lack of help that the economic cycle gives us in trading USD
Calculations are based on the Citi assumption that the most recent NBER-defined recession lasts from Dec '07 to Jun '09Sources: NBER, Bloomberg and Citi
NBER Recession End Recession end (A) 3m after (B) 6m after (C) 12m after (D) 24m after (E) (A) to (B) (A) to (C) (A) to (D) (A) to (E)Mar-75 94.82 95.86 104.24 105.34 105.03 1.10 9.93 11.09 10.77Jul-80 86.08 88.38 95.24 111.72 119.05 2.67 10.64 29.79 38.30
Nov -82 121.00 120.35 123.79 130.64 149.21 -0.54 2.31 7.97 23.31Mar-91 92.01 96.03 89.90 89.65 91.87 4.37 -2.29 -2.56 -0.15Nov -01 116.13 119.16 111.81 106.38 90.23 2.61 -3.72 -8.40 -22.30Jun-09 80.13 76.65 77.86 -4.34 -2.84
Average* 2.04 3.37 7.58 9.99* Excludes latest cycle
DXY Level % Change
60
70
80
90
100
110
120
130
140
150
-24 -22 -20 -18 -16 -14 -12 -10 -8 -6 -4 -2 0 2 4 6 8 10 12 14 16 18 20 22 24
End
of re
cess
ion
= 10
0
60
70
80
90
100
110
120
130
140
150
End
of re
cess
ion
= 10
0
15-Mar-75 15-Jul-80 15-Nov-8215-Mar-91 15-Nov-01 15-Jun-0915 M 75 S i 8 S i 9
Dollar index
Stronger USD
Weaker USD
10
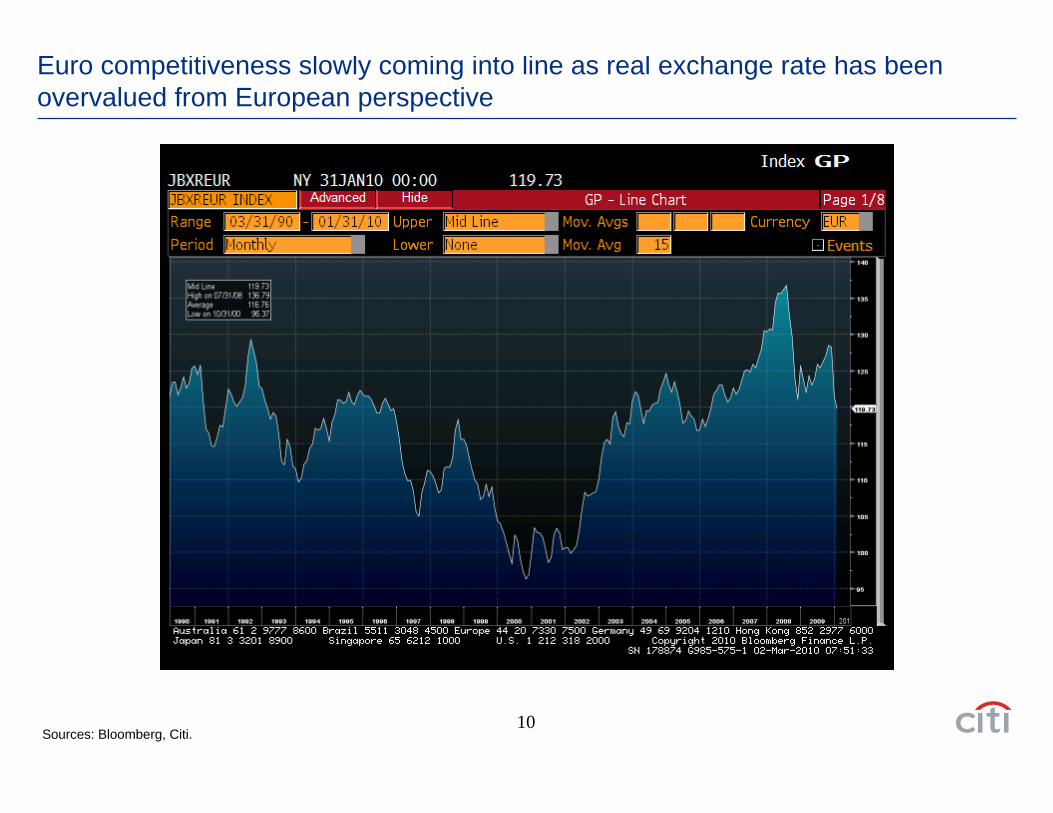
Euro competitiveness slowly coming into line as real exchange rate has been overvalued from European perspective
Sources: Bloomberg, Citi.
11
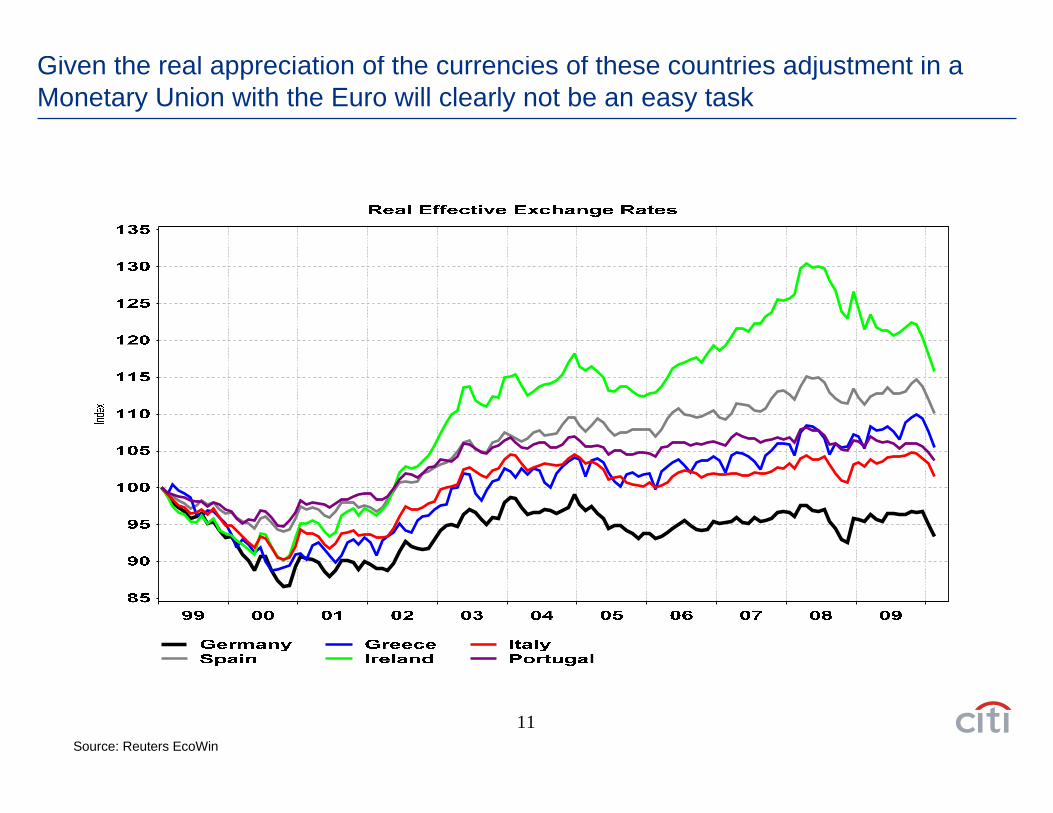
Given the real appreciation of the currencies of these countries adjustment in a Monetary Union with the Euro will clearly not be an easy task
Source: Reuters EcoWin
12
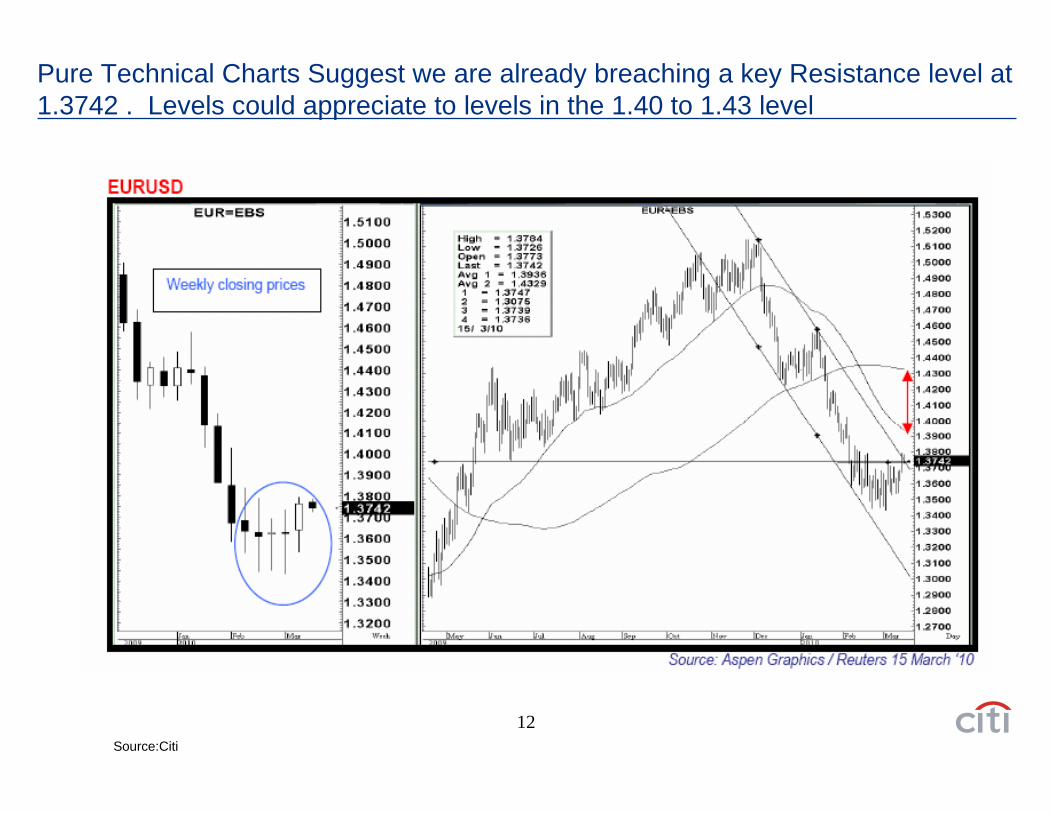
Pure Technical Charts Suggest we are already breaching a key Resistance level at 1.3742 . Levels could appreciate to levels in the 1.40 to 1.43 level
Source:Citi
13
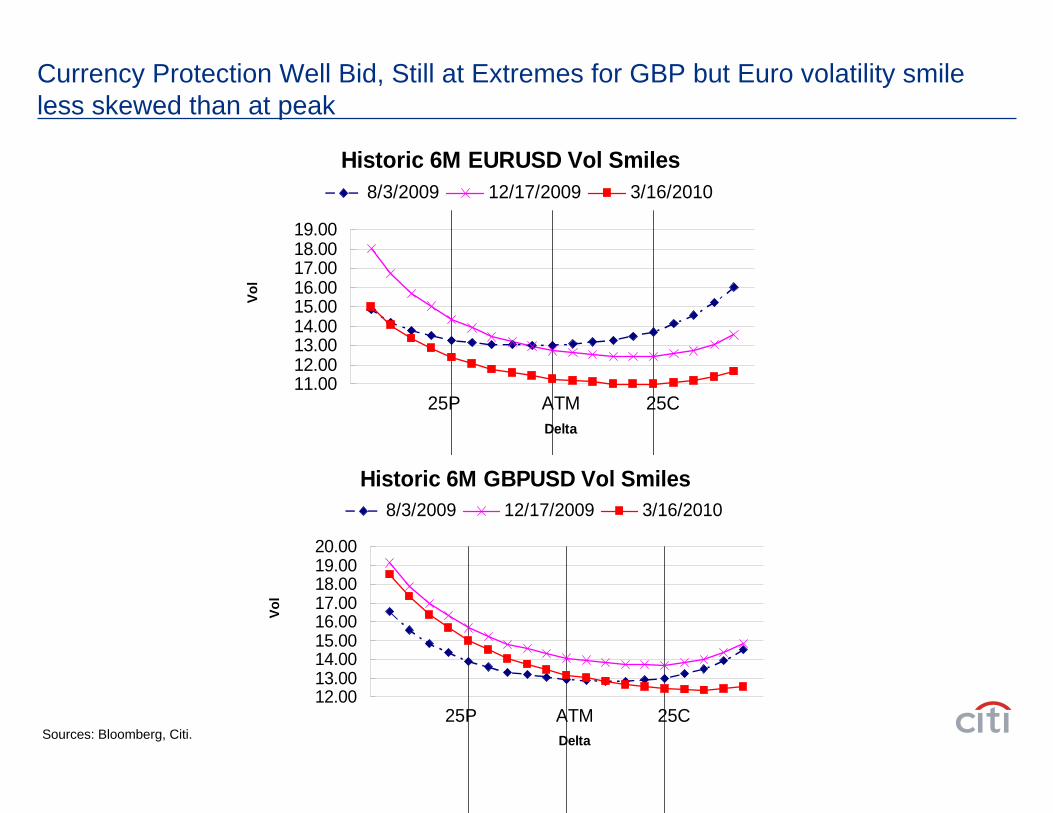
Currency Protection Well Bid, Still at Extremes for GBP but Euro volatility smile less skewed than at peak
Historic 6M EURUSD Vol Smiles
11.0012.0013.0014.0015.0016.0017.0018.0019.00
Delta
Vol
8/3/2009 12/17/2009 3/16/2010
25P ATM 25C
Historic 6M GBPUSD Vol Smiles
12.0013.0014.0015.0016.0017.0018.0019.0020.00
Delta
Vol
8/3/2009 12/17/2009 3/16/2010
25P ATM 25CSources: Bloomberg, Citi.
14
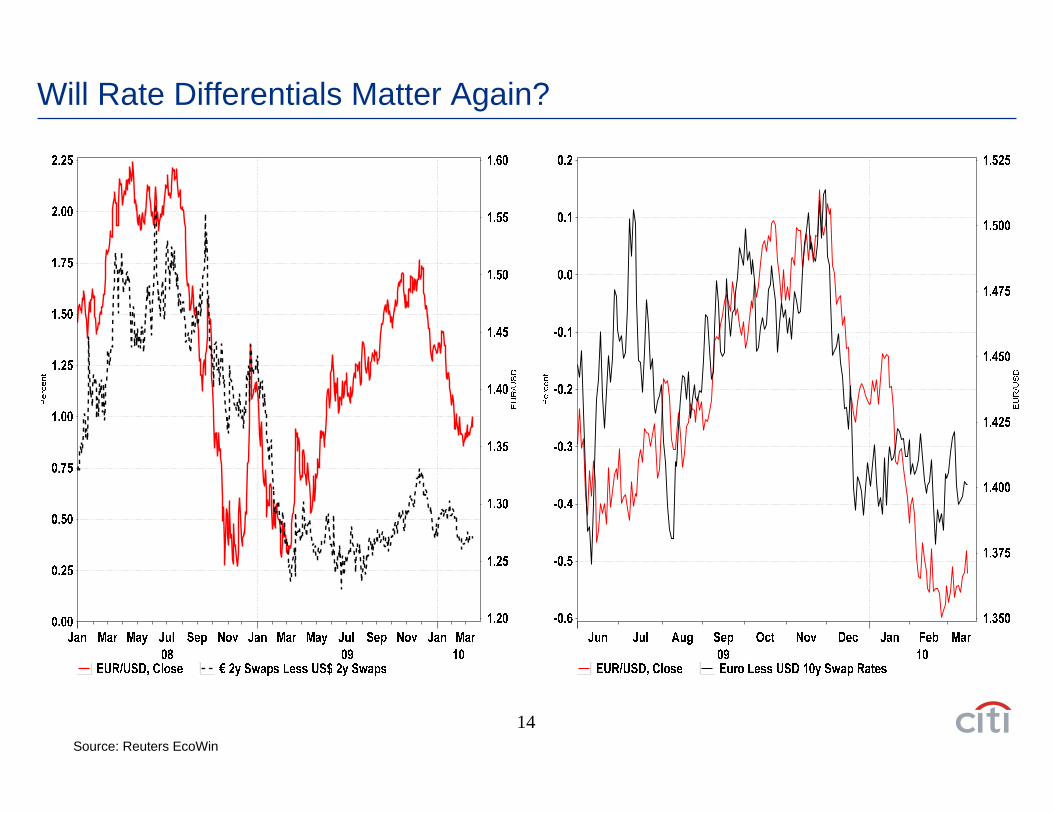
Will Rate Differentials Matter Again?
Source: Reuters EcoWin
15
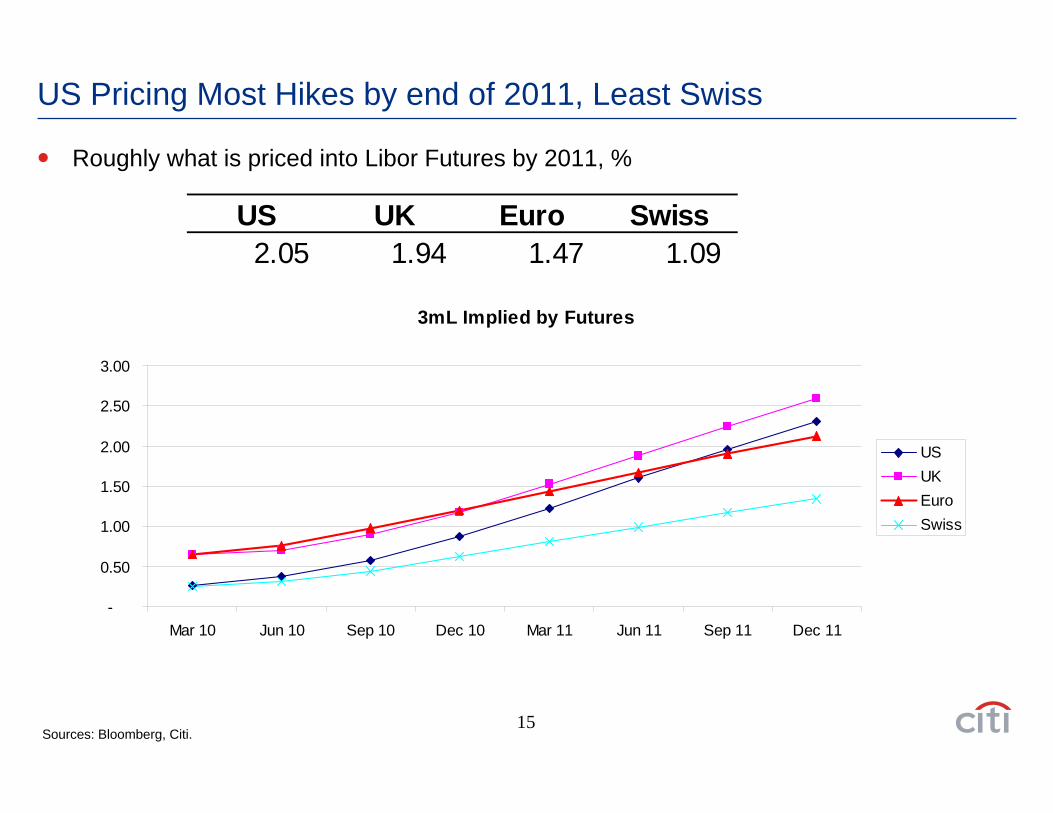
US Pricing Most Hikes by end of 2011, Least Swiss
Roughly what is priced into Libor Futures by 2011, %
3mL Implied by Futures
-
0.50
1.00
1.50
2.00
2.50
3.00
Mar 10 Jun 10 Sep 10 Dec 10 Mar 11 Jun 11 Sep 11 Dec 11
USUKEuroSwiss
US UK Euro Swiss2.05 1.94 1.47 1.09
Sources: Bloomberg, Citi.
16
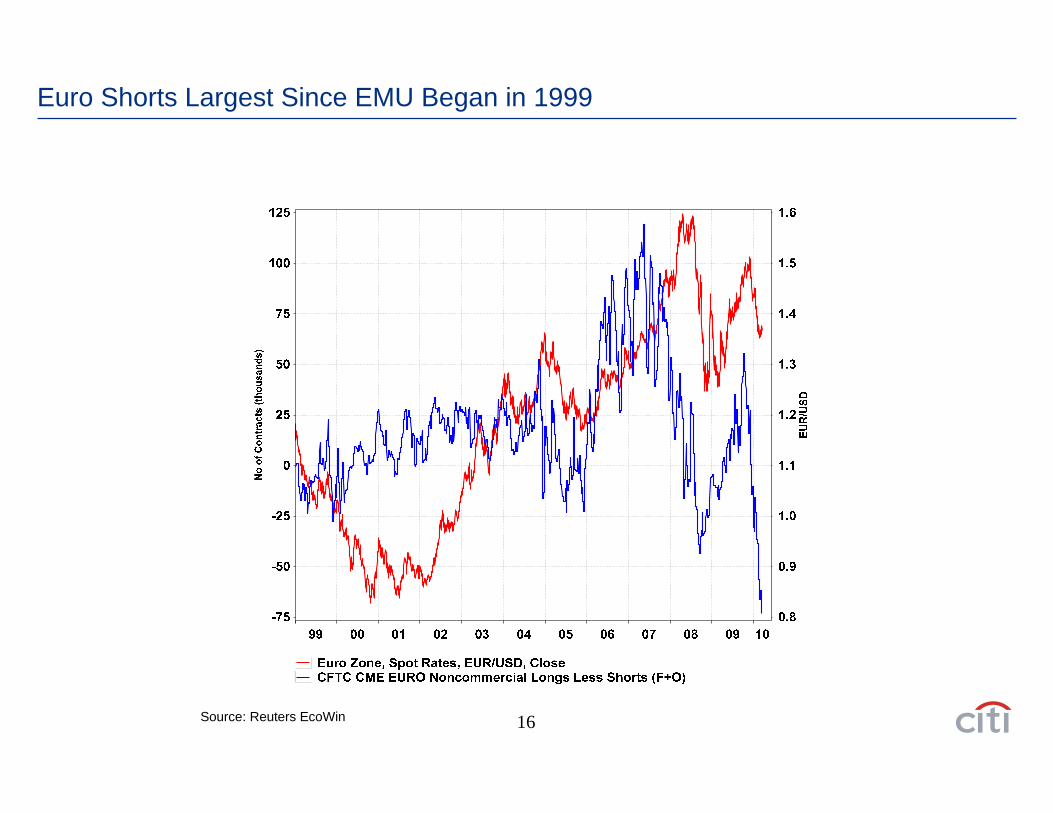
Euro Shorts Largest Since EMU Began in 1999
Source: Reuters EcoWin

17
Corporate Flows and Implications for Trends in the Euro
In US general feeling is that US corporates have missed this move lower in the EUR and are probably underhedged for 2010/2011 right now.
We have some orders to sell EUR at 1.3600, expect to see more between there and 1.4000 if we move back up.
Continental European corporate clients are opportunistic buyers of Euros vs USD at levels below 1.36 through a combination of options and forward cover.
The majority has little incentive to stand in the way of further USD appreciation as it makes their exports more valuable at a time of fragile sales and still low - albeit not as low as a year ago -forecasting ability.
Some USD sales are China related as this region becomes an ever bigger one of activity, especially for automotive and chemicals.
Eurozone fiscal worries are seen with a mix of concern about the repercucssions on domestic banks and potential consequences on lending standards in the future and a mood of 'didn't we know it all along'.
Little concern about export markets in smaller countries fading but Spain and Italy are a different matter.
18
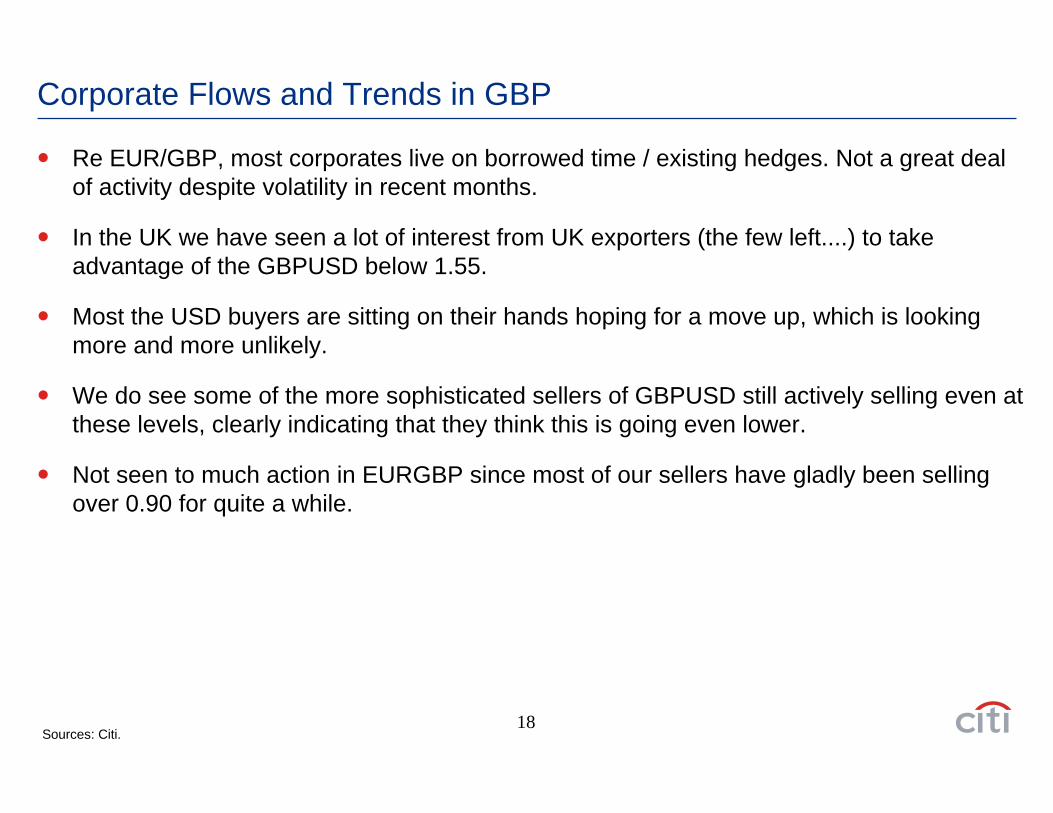
Corporate Flows and Trends in GBP
Re EUR/GBP, most corporates live on borrowed time / existing hedges. Not a great deal of activity despite volatility in recent months.
In the UK we have seen a lot of interest from UK exporters (the few left....) to take advantage of the GBPUSD below 1.55.
Most the USD buyers are sitting on their hands hoping for a move up, which is looking more and more unlikely.
We do see some of the more sophisticated sellers of GBPUSD still actively selling even at these levels, clearly indicating that they think this is going even lower.
Not seen to much action in EURGBP since most of our sellers have gladly been selling over 0.90 for quite a while.
Sources: Citi.
19
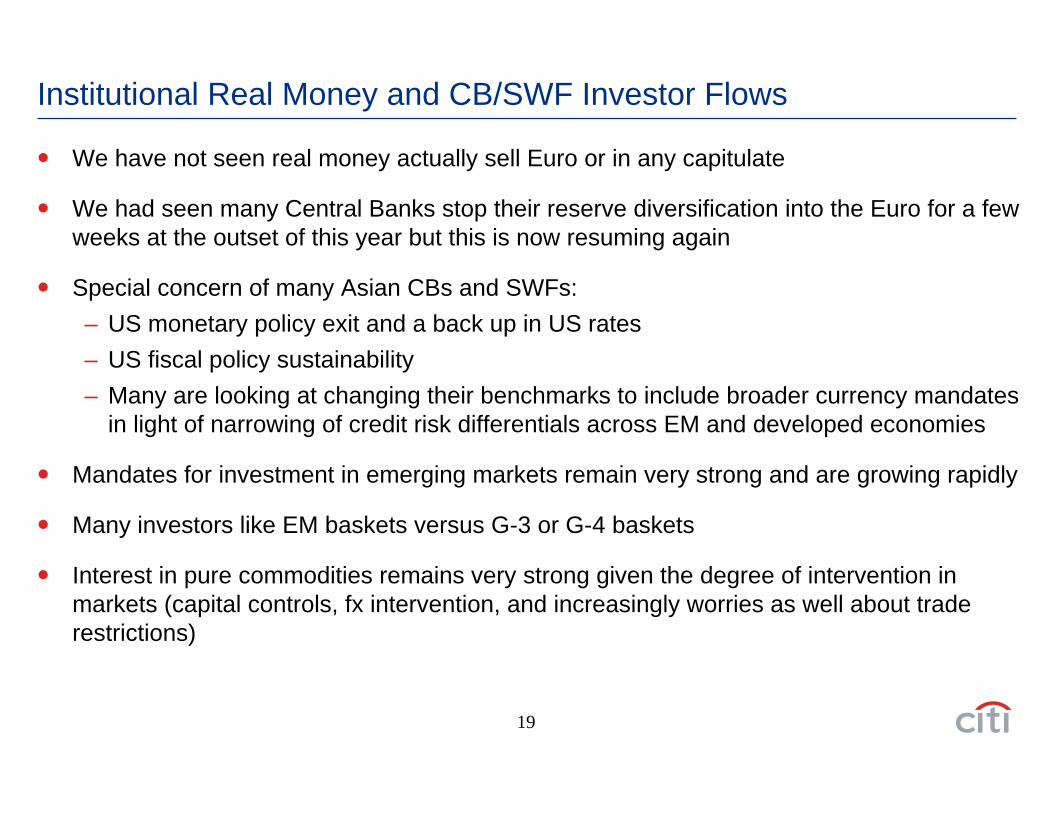
Institutional Real Money and CB/SWF Investor Flows
We have not seen real money actually sell Euro or in any capitulate
We had seen many Central Banks stop their reserve diversification into the Euro for a few weeks at the outset of this year but this is now resuming again
Special concern of many Asian CBs and SWFs:– US monetary policy exit and a back up in US rates– US fiscal policy sustainability– Many are looking at changing their benchmarks to include broader currency mandates
in light of narrowing of credit risk differentials across EM and developed economies
Mandates for investment in emerging markets remain very strong and are growing rapidly
Many investors like EM baskets versus G-3 or G-4 baskets
Interest in pure commodities remains very strong given the degree of intervention in markets (capital controls, fx intervention, and increasingly worries as well about trade restrictions)

US and European Growth Sustainability and Fiscal Exit
21
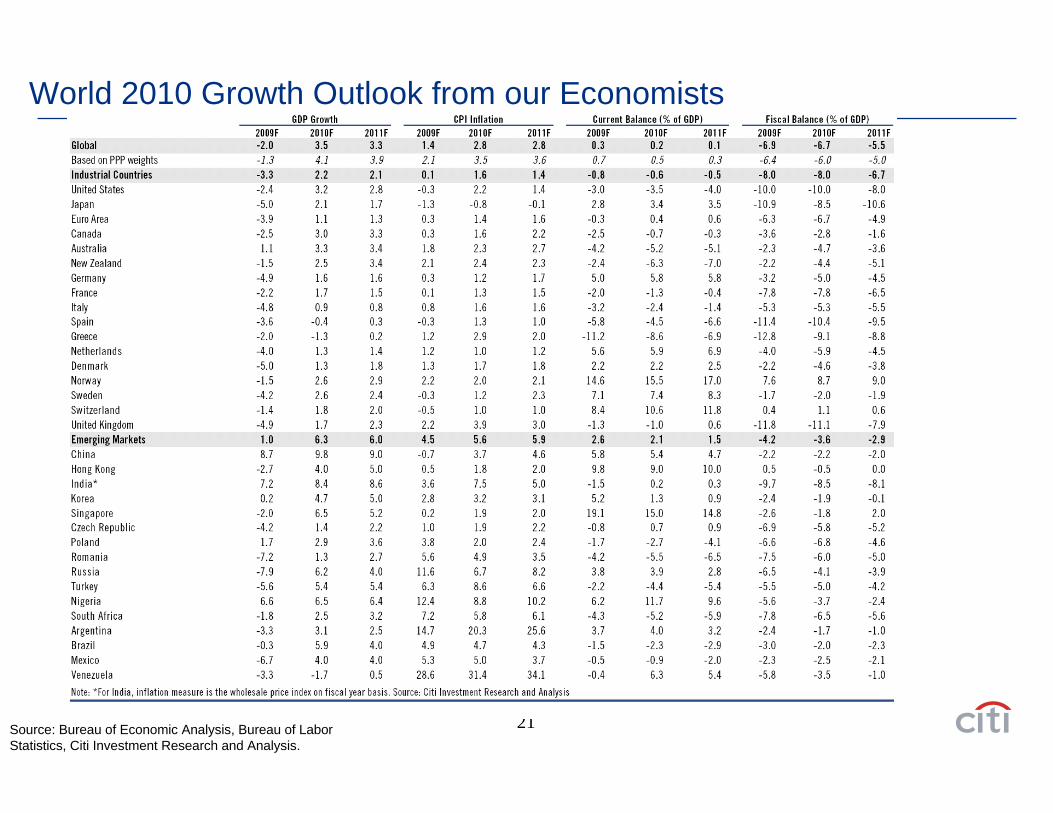
World 2010 Growth Outlook from our Economists
Source: Bureau of Economic Analysis, Bureau of Labor Statistics, Citi Investment Research and Analysis.
22
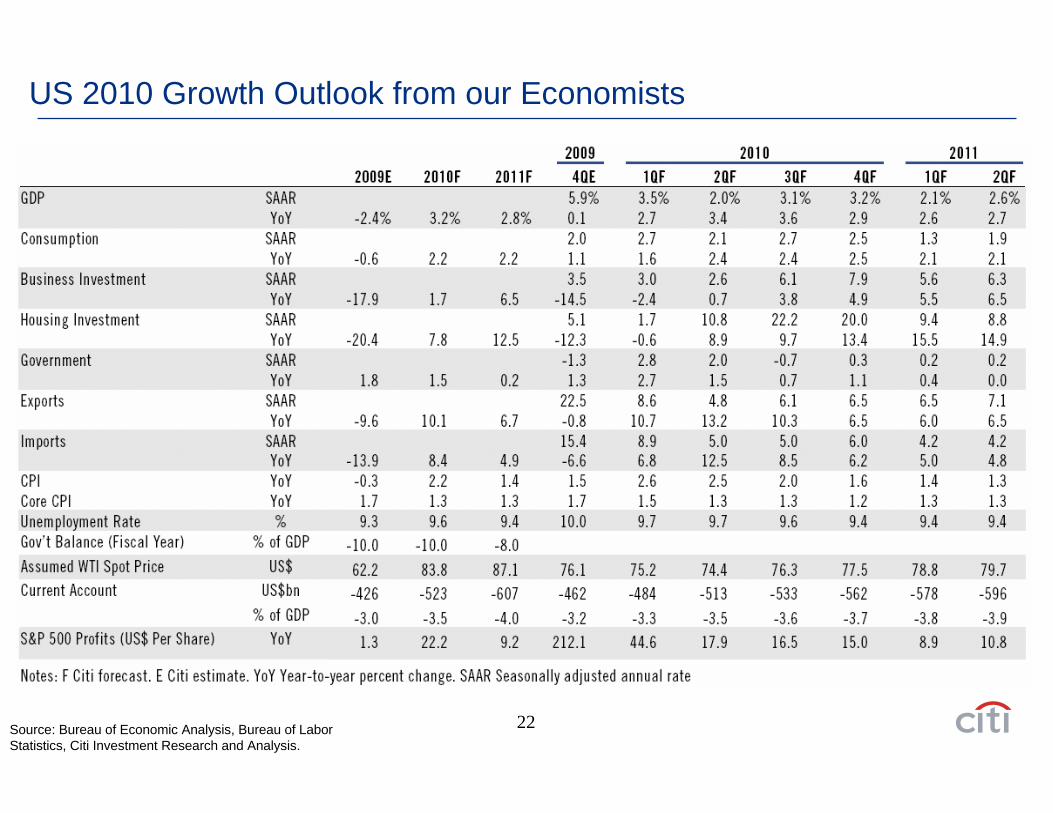
US 2010 Growth Outlook from our Economists
Source: Bureau of Economic Analysis, Bureau of Labor Statistics, Citi Investment Research and Analysis.
23
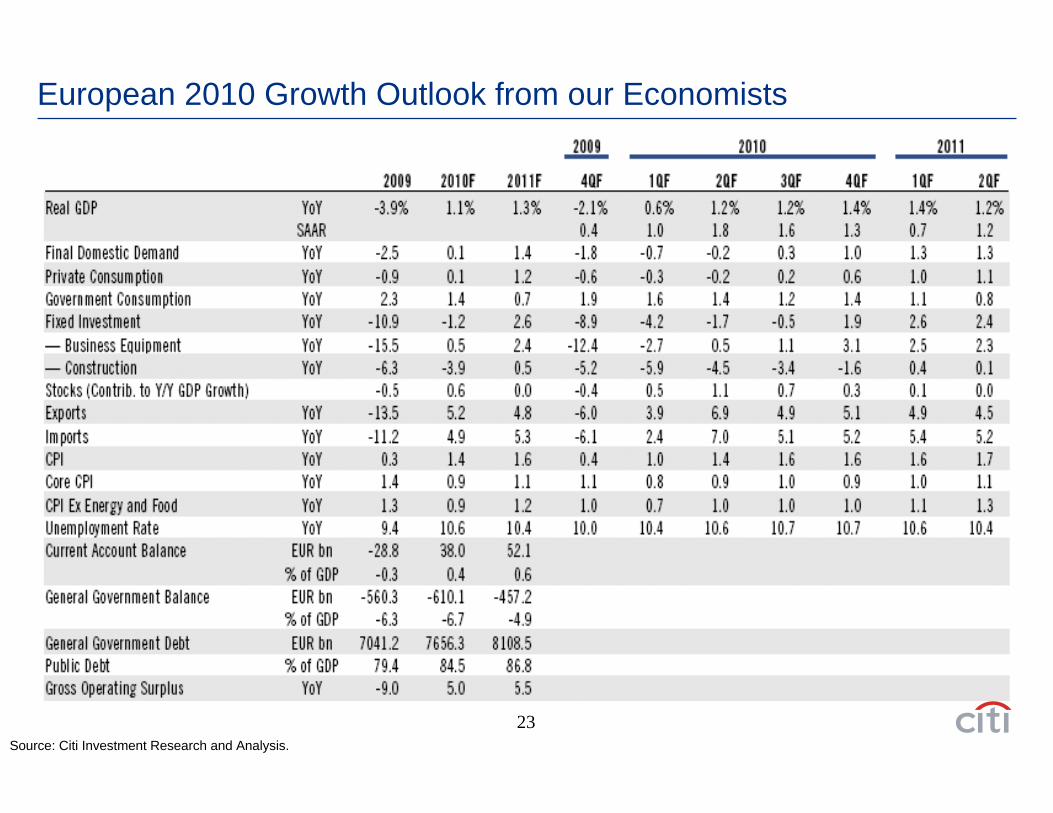
European 2010 Growth Outlook from our Economists
Source: Citi Investment Research and Analysis.
24
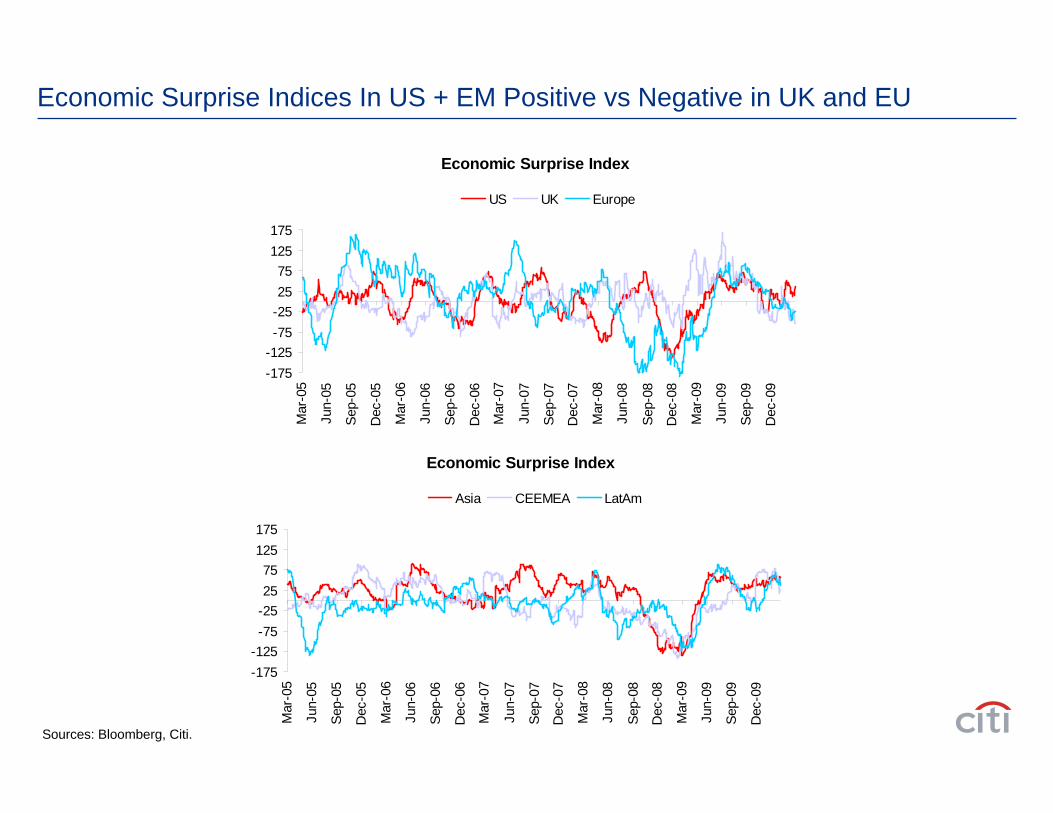
Economic Surprise Indices In US + EM Positive vs Negative in UK and EU
Economic Surprise Index
-175-125-75-252575
125175
Mar
-05
Jun-
05
Sep-
05
Dec
-05
Mar
-06
Jun-
06
Sep-
06
Dec
-06
Mar
-07
Jun-
07
Sep-
07
Dec
-07
Mar
-08
Jun-
08
Sep-
08
Dec
-08
Mar
-09
Jun-
09
Sep-
09
Dec
-09
Asia CEEMEA LatAm
Economic Surprise Index
-175-125-75-252575
125175
Mar
-05
Jun-
05
Sep-
05
Dec
-05
Mar
-06
Jun-
06
Sep-
06
Dec
-06
Mar
-07
Jun-
07
Sep-
07
Dec
-07
Mar
-08
Jun-
08
Sep-
08
Dec
-08
Mar
-09
Jun-
09
Sep-
09
Dec
-09
US UK Europe
Sources: Bloomberg, Citi.
25
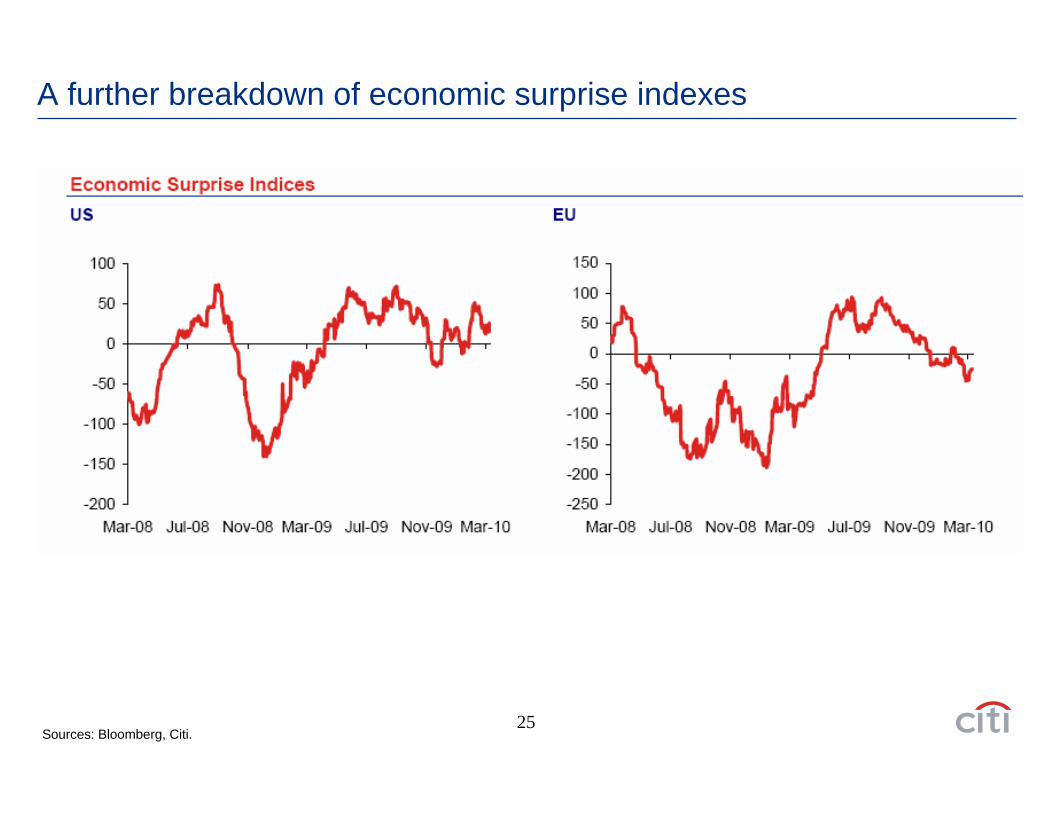
A further breakdown of economic surprise indexes
Sources: Bloomberg, Citi.
26
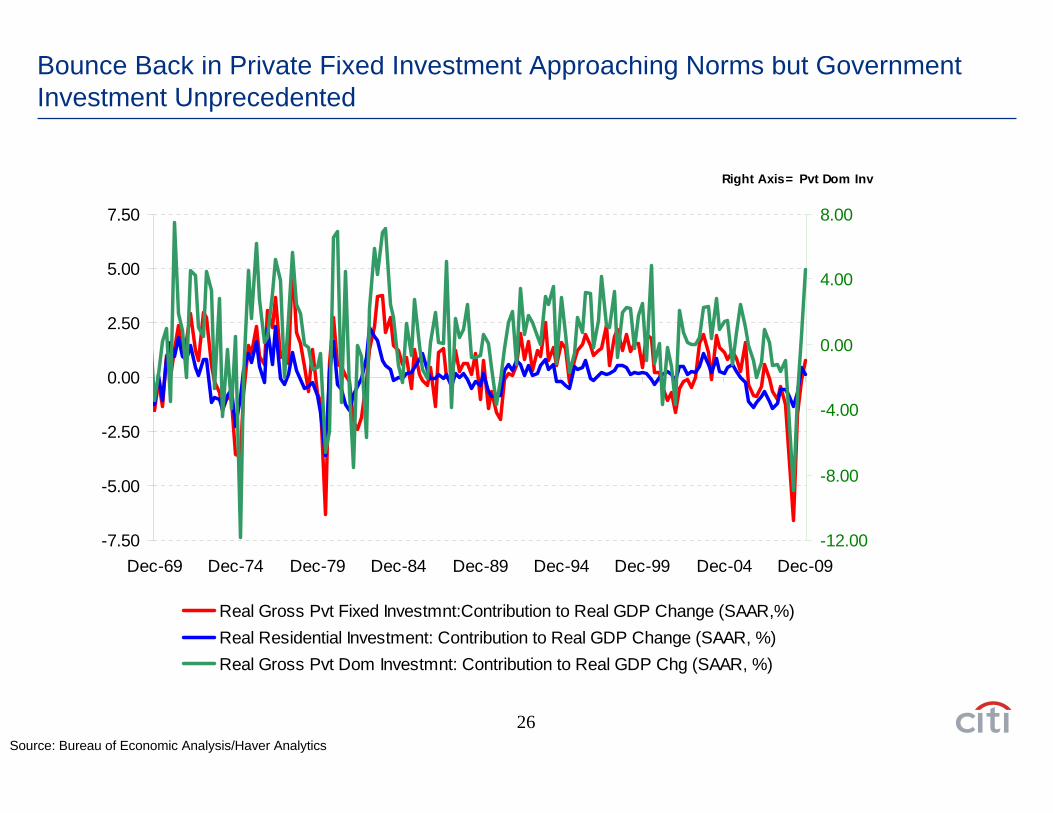
Bounce Back in Private Fixed Investment Approaching Norms but Government Investment Unprecedented
Source: Bureau of Economic Analysis/Haver Analytics
Right Axis= Pvt Dom Inv
-7.50
-5.00
-2.50
0.00
2.50
5.00
7.50
Dec-69 Dec-74 Dec-79 Dec-84 Dec-89 Dec-94 Dec-99 Dec-04 Dec-09-12.00
-8.00
-4.00
0.00
4.00
8.00
Real Gross Pvt Fixed Investmnt:Contribution to Real GDP Change (SAAR,%) Real Residential Investment: Contribution to Real GDP Change (SAAR, %) Real Gross Pvt Dom Investmnt: Contribution to Real GDP Chg (SAAR, %)
27
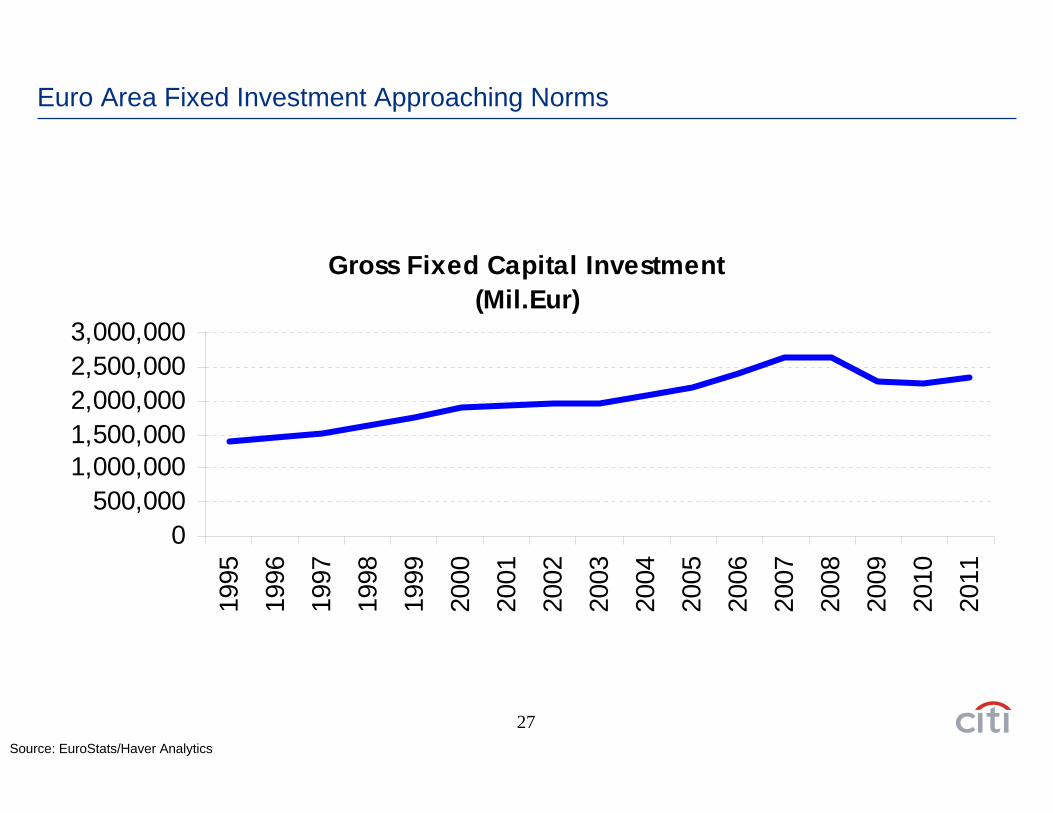
Euro Area Fixed Investment Approaching Norms
Source: EuroStats/Haver Analytics
Gross Fixed Capital Investment(Mil.Eur)
0500,000
1,000,0001,500,0002,000,0002,500,0003,000,000
1995
1996
1997
1998
1999
2000
2001
2002
2003
2004
2005
2006
2007
2008
2009
2010
2011
28
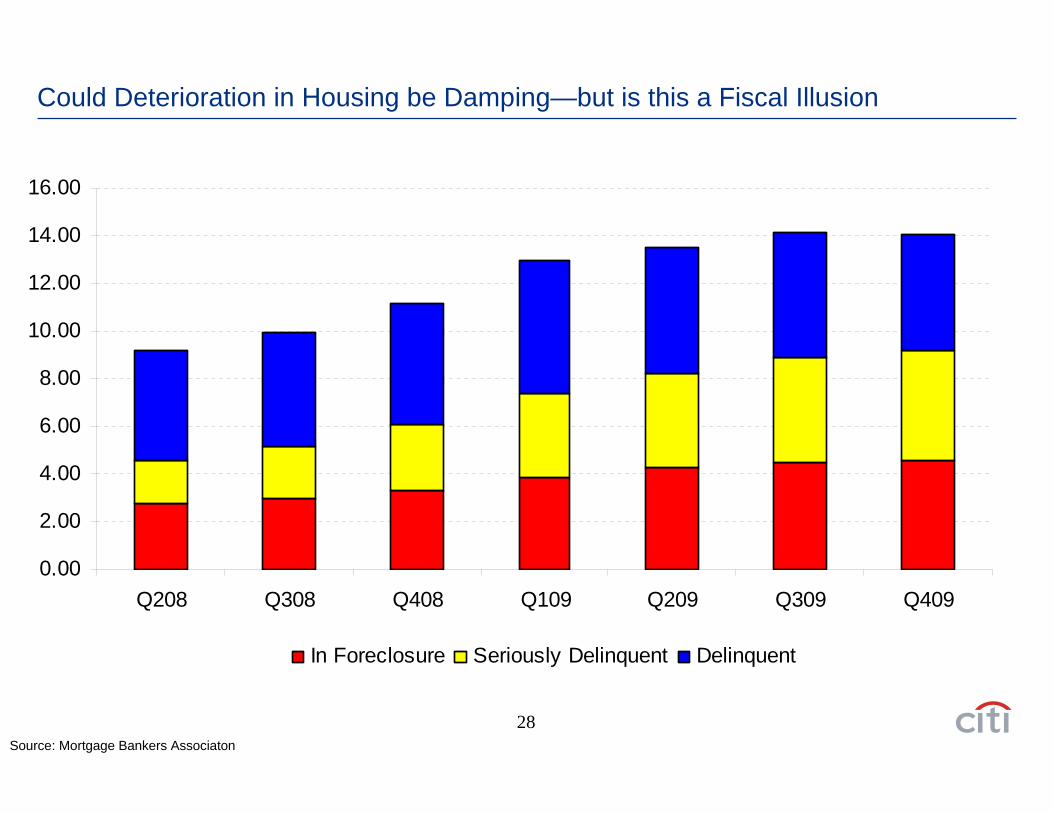
Could Deterioration in Housing be Damping—but is this a Fiscal Illusion
0.00
2.00
4.00
6.00
8.00
10.00
12.00
14.00
16.00
Q208 Q308 Q408 Q109 Q209 Q309 Q409
In Foreclosure Seriously Delinquent Delinquent
Source: Mortgage Bankers Associaton
29
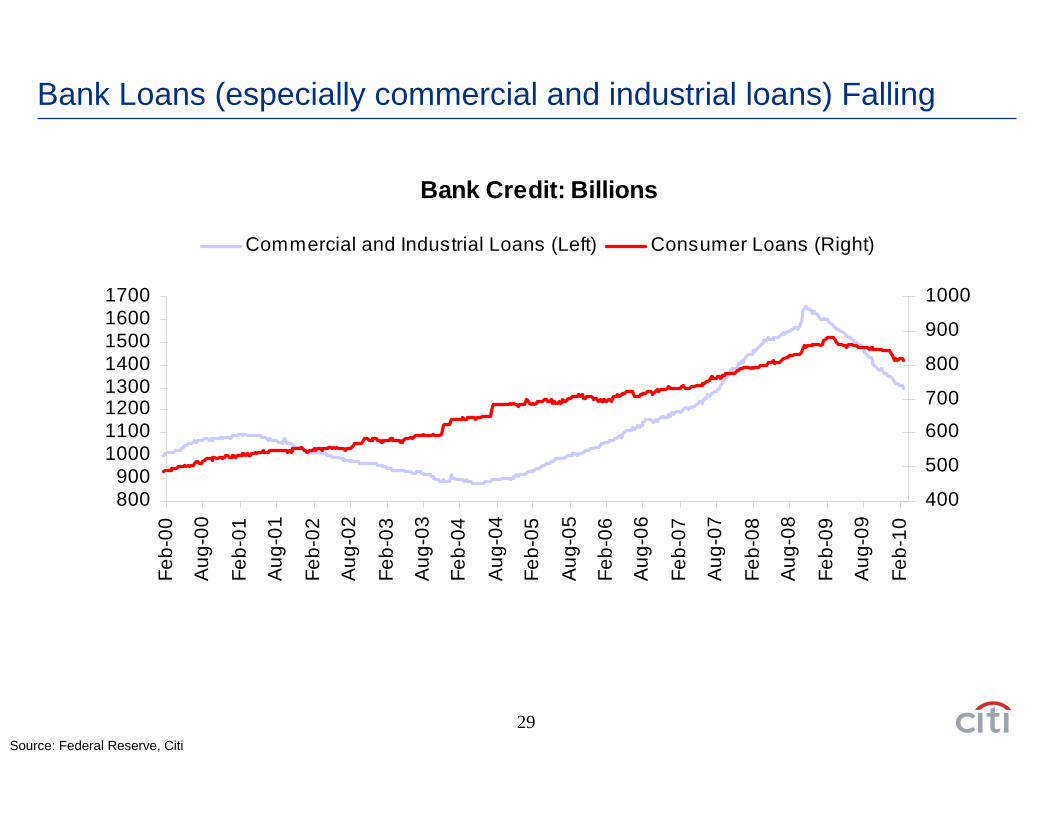
Bank Loans (especially commercial and industrial loans) Falling
Bank Credit: Billions
800900
10001100120013001400150016001700
Feb-
00
Aug
-00
Feb-
01
Aug
-01
Feb-
02
Aug
-02
Feb-
03
Aug
-03
Feb-
04
Aug
-04
Feb-
05
Aug
-05
Feb-
06
Aug
-06
Feb-
07
Aug
-07
Feb-
08
Aug
-08
Feb-
09
Aug
-09
Feb-
10
400
500
600
700
800
900
1000
Commercial and Industrial Loans (Left) Consumer Loans (Right)
Source: Federal Reserve, Citi
30
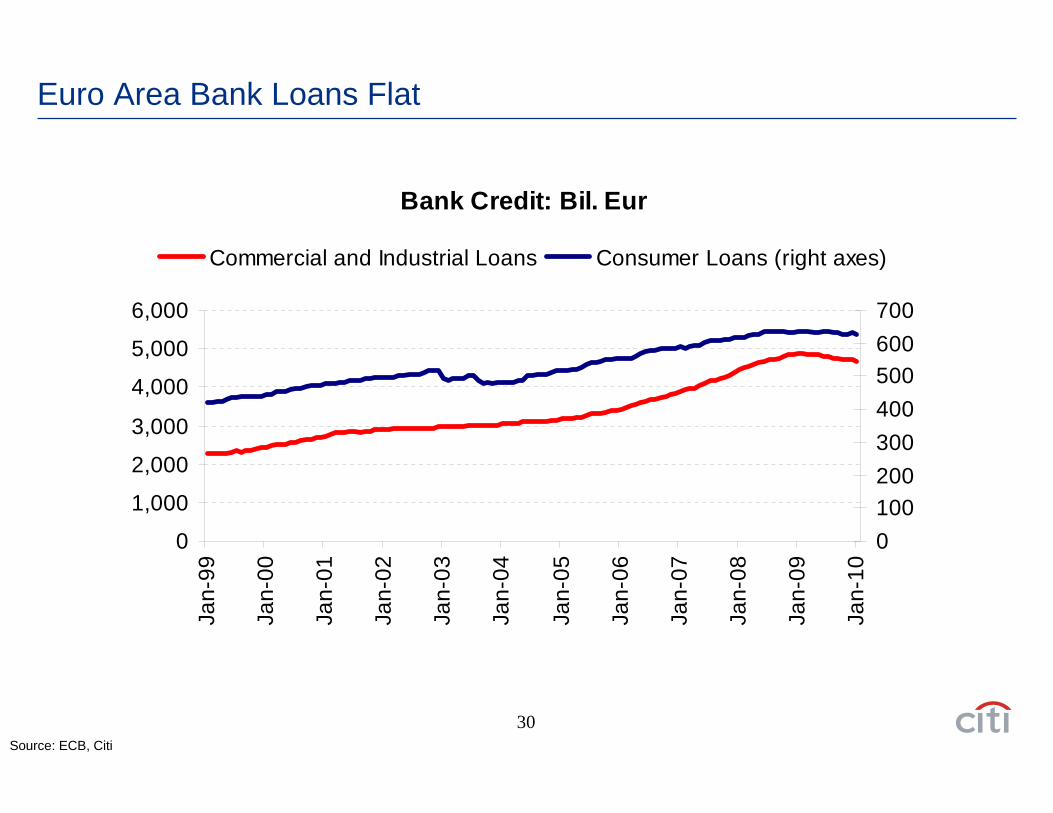
Euro Area Bank Loans Flat
Source: ECB, Citi
Bank Credit: Bil. Eur
0
1,000
2,000
3,000
4,000
5,000
6,000
Jan-
99
Jan-
00
Jan-
01
Jan-
02
Jan-
03
Jan-
04
Jan-
05
Jan-
06
Jan-
07
Jan-
08
Jan-
09
Jan-
10
0100200300400500600700
Commercial and Industrial Loans Consumer Loans (right axes)
31
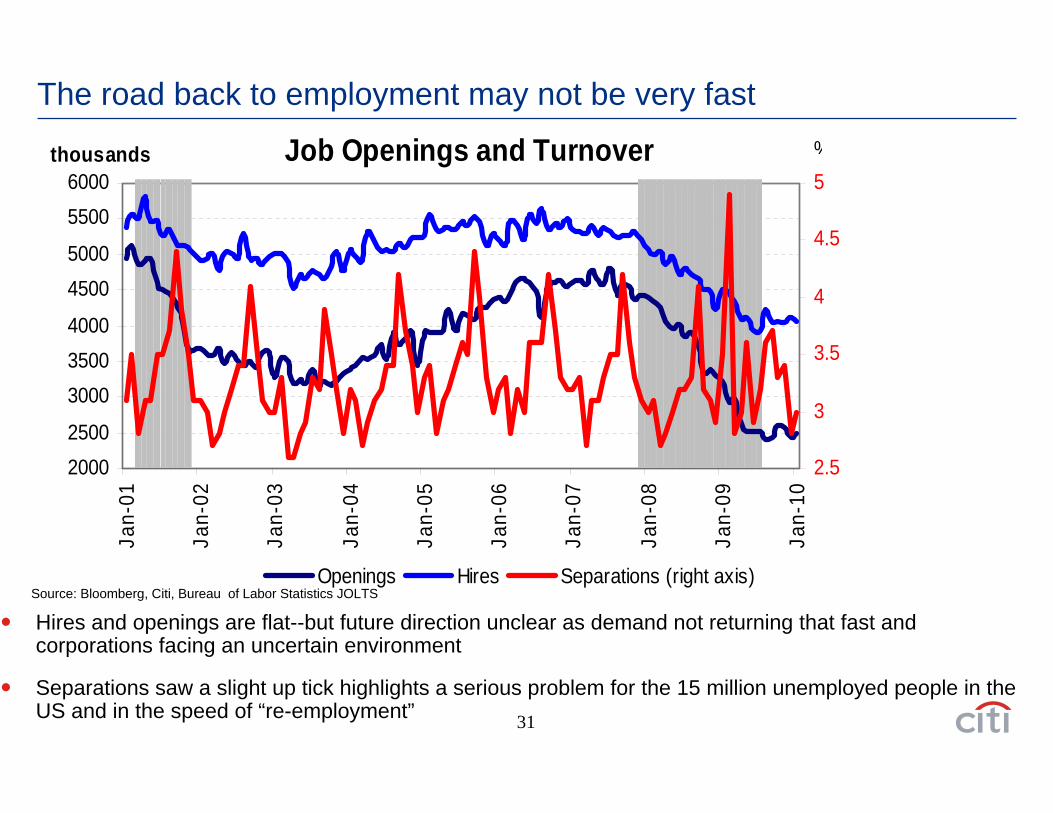
The road back to employment may not be very fast
Job Openings and Turnover
20002500
300035004000
45005000
55006000
Jan-
01
Jan-
02
Jan-
03
Jan-
04
Jan-
05
Jan-
06
Jan-
07
Jan-
08
Jan-
09
Jan-
10
2.5
3
3.5
4
4.5
5
Openings Hires Separations (right axis)
%thousands
Hires and openings are flat--but future direction unclear as demand not returning that fast and corporations facing an uncertain environment
Separations saw a slight up tick highlights a serious problem for the 15 million unemployed people in the US and in the speed of “re-employment”
Source: Bloomberg, Citi, Bureau of Labor Statistics JOLTS
32
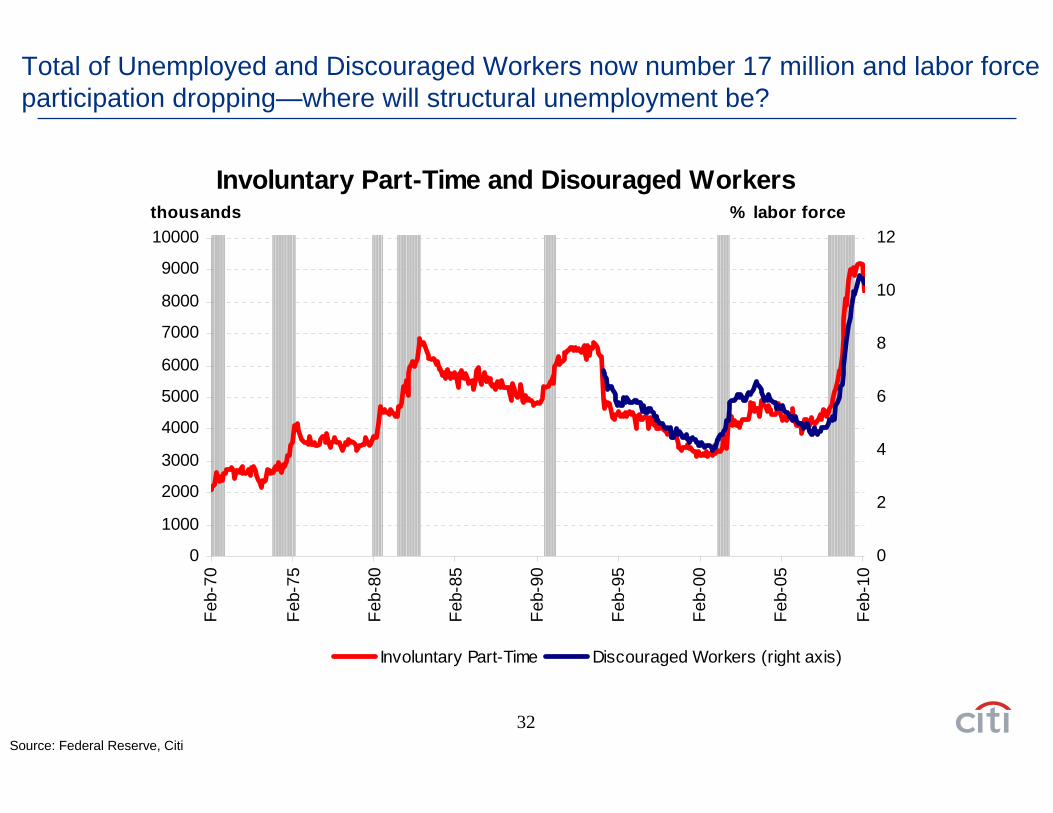
Total of Unemployed and Discouraged Workers now number 17 million and labor force participation dropping—where will structural unemployment be?
Source: Federal Reserve, Citi
Involuntary Part-Time and Disouraged Workers
0
1000
2000
3000
4000
5000
6000
7000
8000
9000
10000Fe
b-70
Feb-
75
Feb-
80
Feb-
85
Feb-
90
Feb-
95
Feb-
00
Feb-
05
Feb-
10
0
2
4
6
8
10
12
Involuntary Part-Time Discouraged Workers (right axis)
thousands % labor force
33
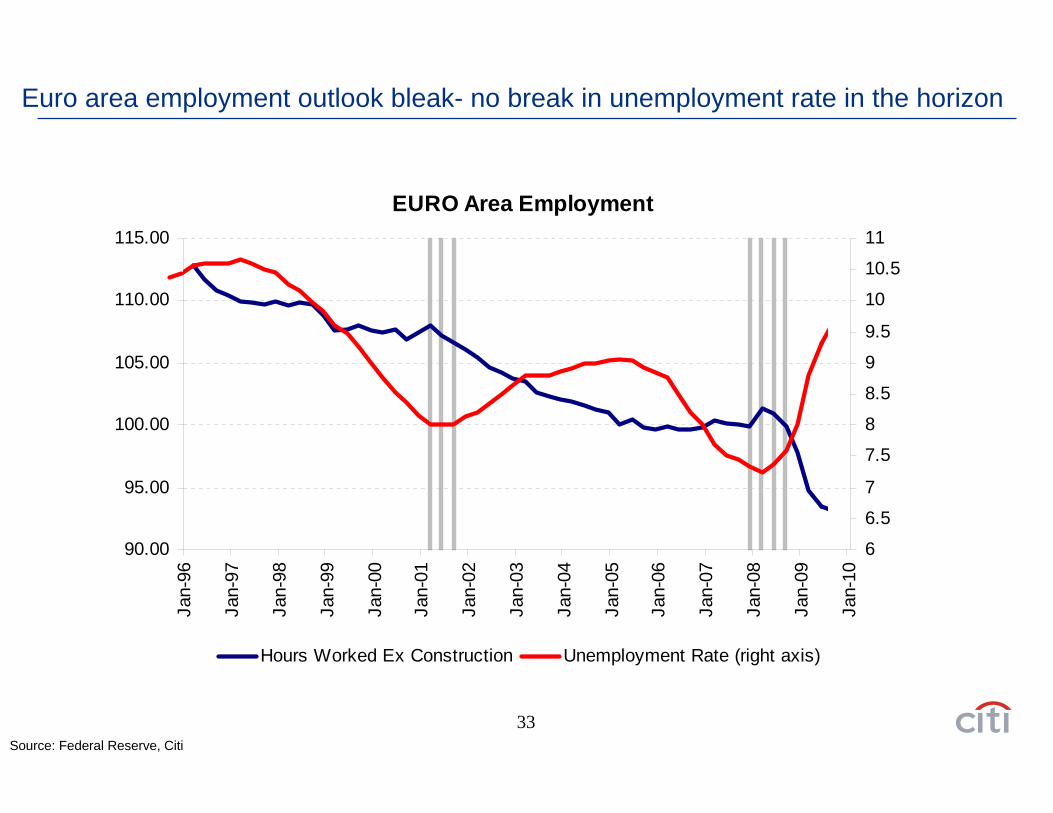
Euro area employment outlook bleak- no break in unemployment rate in the horizon
Source: Federal Reserve, Citi
EURO Area Employment
90.00
95.00
100.00
105.00
110.00
115.00
Jan-
96
Jan-
97
Jan-
98
Jan-
99
Jan-
00
Jan-
01
Jan-
02
Jan-
03
Jan-
04
Jan-
05
Jan-
06
Jan-
07
Jan-
08
Jan-
09
Jan-
10
6
6.5
7
7.5
8
8.5
9
9.5
10
10.5
11
Hours Worked Ex Construction Unemployment Rate (right axis)
34
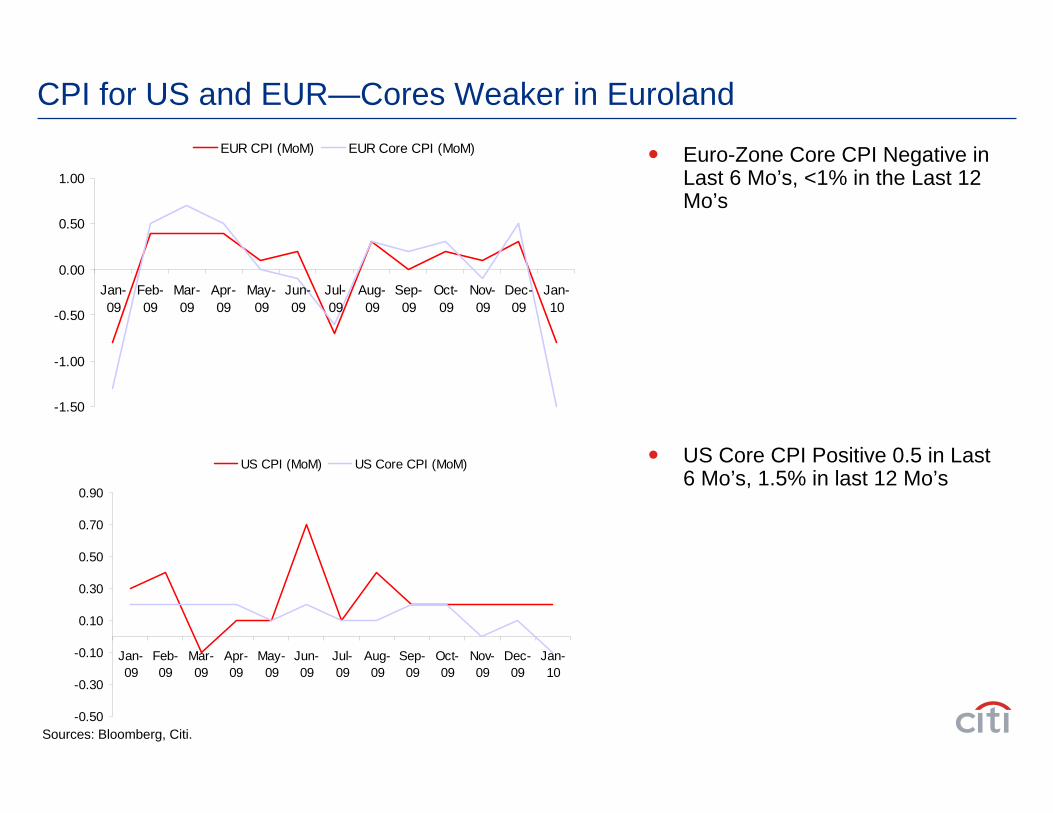
CPI for US and EUR—Cores Weaker in Euroland
-1.50
-1.00
-0.50
0.00
0.50
1.00
Jan-09
Feb-09
Mar-09
Apr-09
May-09
Jun-09
Jul-09
Aug-09
Sep-09
Oct-09
Nov-09
Dec-09
Jan-10
EUR CPI (MoM) EUR Core CPI (MoM)
-0.50
-0.30
-0.10
0.10
0.30
0.50
0.70
0.90
Jan-09
Feb-09
Mar-09
Apr-09
May-09
Jun-09
Jul-09
Aug-09
Sep-09
Oct-09
Nov-09
Dec-09
Jan-10
US CPI (MoM) US Core CPI (MoM)
Euro-Zone Core CPI Negative in Last 6 Mo’s, <1% in the Last 12 Mo’s
US Core CPI Positive 0.5 in Last 6 Mo’s, 1.5% in last 12 Mo’s
Sources: Bloomberg, Citi.
35
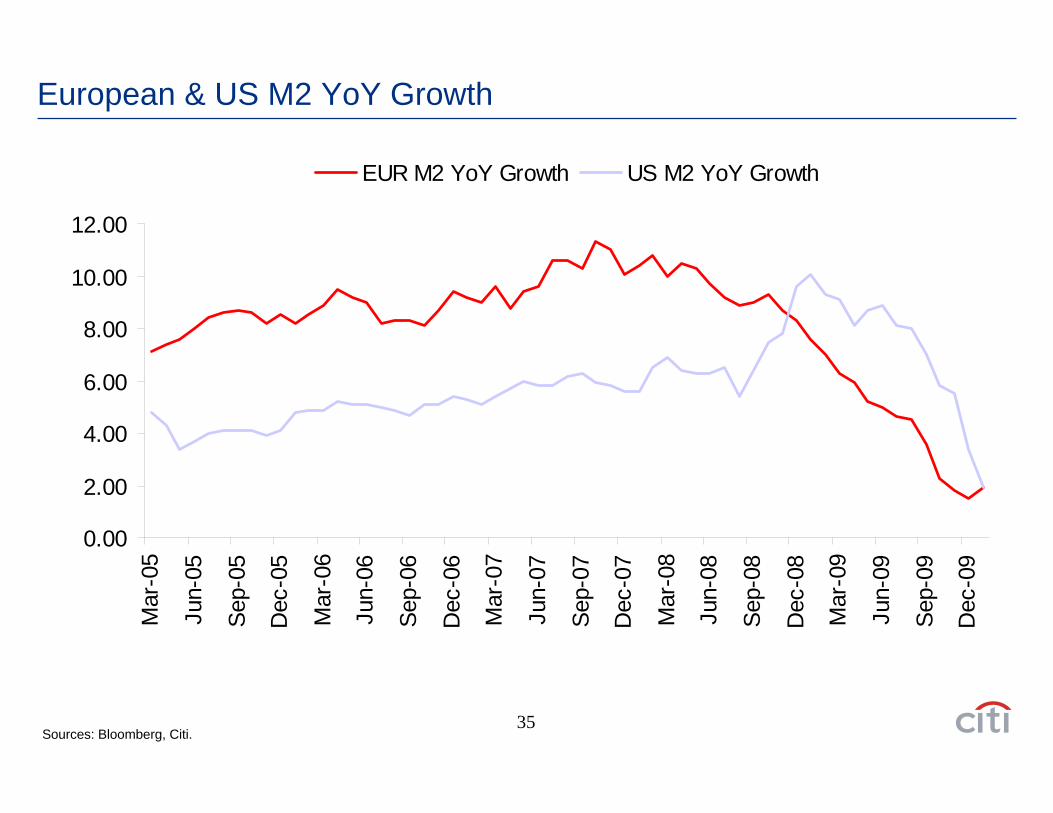
European & US M2 YoY Growth
0.00
2.00
4.00
6.00
8.00
10.00
12.00
Mar
-05
Jun-
05
Sep-
05
Dec
-05
Mar
-06
Jun-
06
Sep-
06
Dec
-06
Mar
-07
Jun-
07
Sep-
07
Dec
-07
Mar
-08
Jun-
08
Sep-
08
Dec
-08
Mar
-09
Jun-
09
Sep-
09
Dec
-09
EUR M2 YoY Growth US M2 YoY Growth
Sources: Bloomberg, Citi.
36
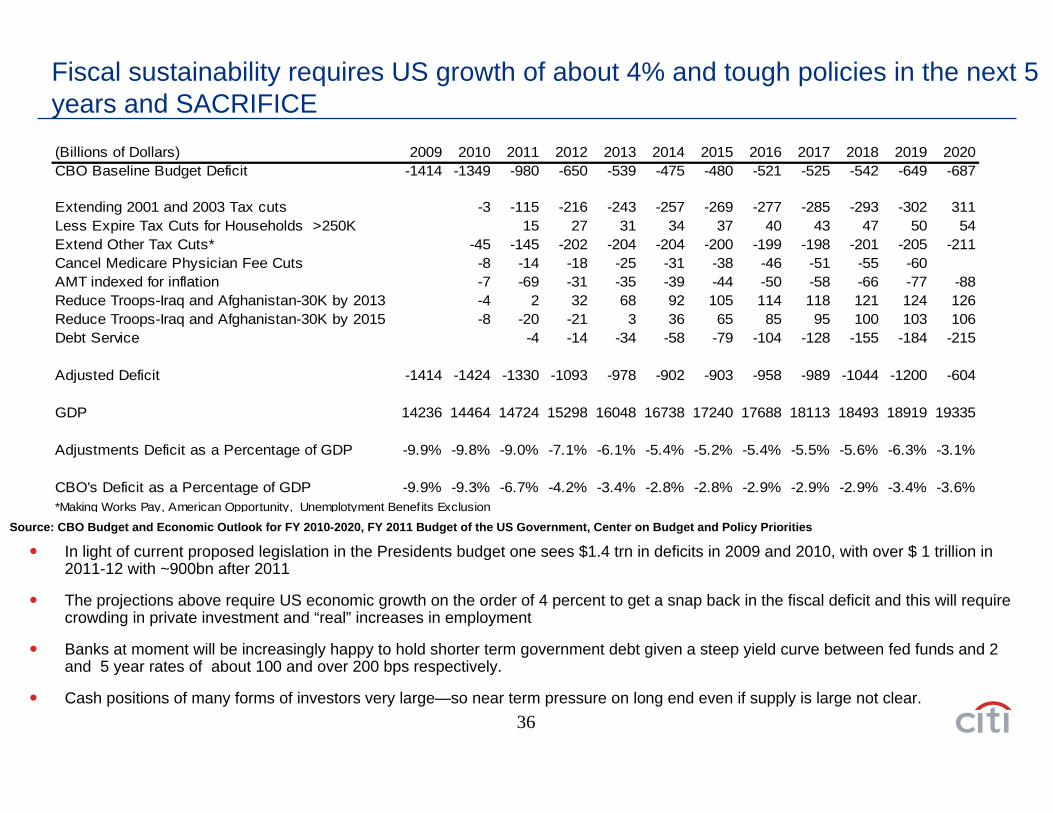
Fiscal sustainability requires US growth of about 4% and tough policies in the next 5 years and SACRIFICE(Billions of Dollars) 2009 2010 2011 2012 2013 2014 2015 2016 2017 2018 2019 2020CBO Baseline Budget Deficit -1414 -1349 -980 -650 -539 -475 -480 -521 -525 -542 -649 -687
Extending 2001 and 2003 Tax cuts -3 -115 -216 -243 -257 -269 -277 -285 -293 -302 311Less Expire Tax Cuts for Households >250K 15 27 31 34 37 40 43 47 50 54Extend Other Tax Cuts* -45 -145 -202 -204 -204 -200 -199 -198 -201 -205 -211Cancel Medicare Physician Fee Cuts -8 -14 -18 -25 -31 -38 -46 -51 -55 -60AMT indexed for inflation -7 -69 -31 -35 -39 -44 -50 -58 -66 -77 -88Reduce Troops-Iraq and Afghanistan-30K by 2013 -4 2 32 68 92 105 114 118 121 124 126Reduce Troops-Iraq and Afghanistan-30K by 2015 -8 -20 -21 3 36 65 85 95 100 103 106Debt Service -4 -14 -34 -58 -79 -104 -128 -155 -184 -215
Adjusted Deficit -1414 -1424 -1330 -1093 -978 -902 -903 -958 -989 -1044 -1200 -604
GDP 14236 14464 14724 15298 16048 16738 17240 17688 18113 18493 18919 19335
Adjustments Deficit as a Percentage of GDP -9.9% -9.8% -9.0% -7.1% -6.1% -5.4% -5.2% -5.4% -5.5% -5.6% -6.3% -3.1%
CBO's Deficit as a Percentage of GDP -9.9% -9.3% -6.7% -4.2% -3.4% -2.8% -2.8% -2.9% -2.9% -2.9% -3.4% -3.6%*Making Works Pay, American Opportunity, Unemplotyment Benefits Exclusion
In light of current proposed legislation in the Presidents budget one sees $1.4 trn in deficits in 2009 and 2010, with over $ 1 trillion in 2011-12 with ~900bn after 2011
The projections above require US economic growth on the order of 4 percent to get a snap back in the fiscal deficit and this will require crowding in private investment and “real” increases in employment
Banks at moment will be increasingly happy to hold shorter term government debt given a steep yield curve between fed funds and 2 and 5 year rates of about 100 and over 200 bps respectively.
Cash positions of many forms of investors very large—so near term pressure on long end even if supply is large not clear.
Source: CBO Budget and Economic Outlook for FY 2010-2020, FY 2011 Budget of the US Government, Center on Budget and Policy Priorities
37
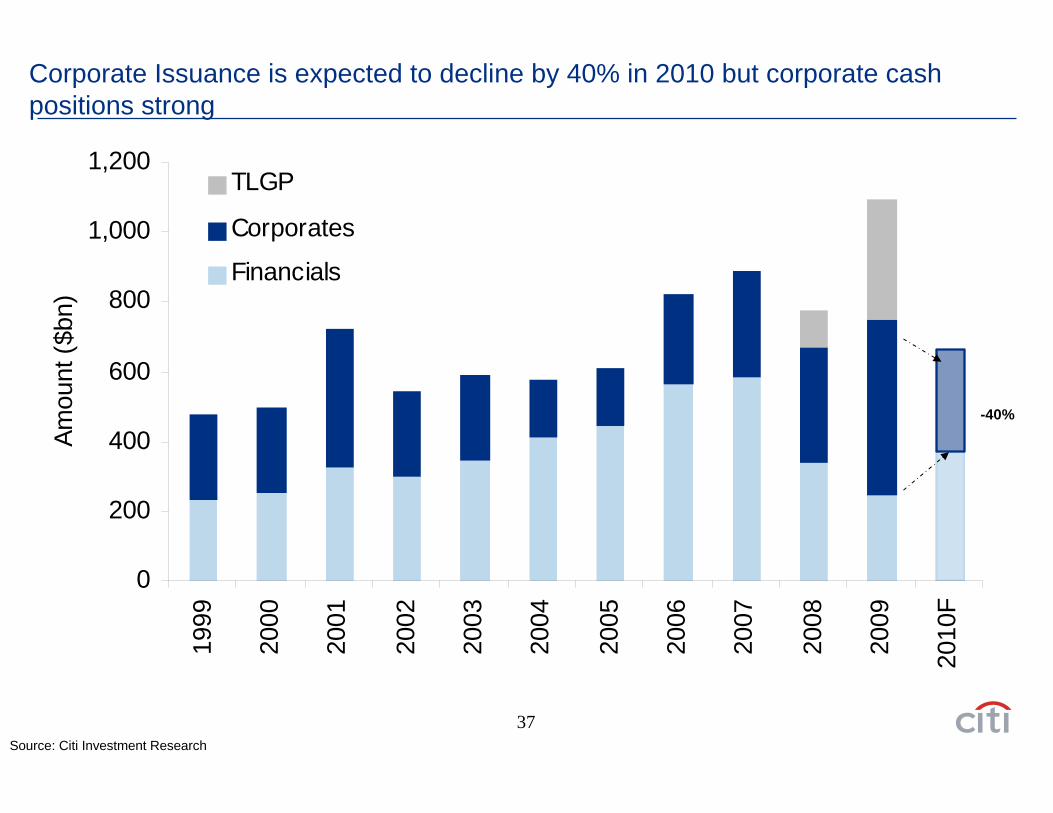
Corporate Issuance is expected to decline by 40% in 2010 but corporate cash positions strong
0
200
400
600
800
1,000
1,200
2010
F
2009
2008
2007
2006
2005
2004
2003
2002
2001
2000
1999
Amou
nt ($
bn)
TLGP
Corporates
Financials
Source: Citi Investment Research
-40%
38
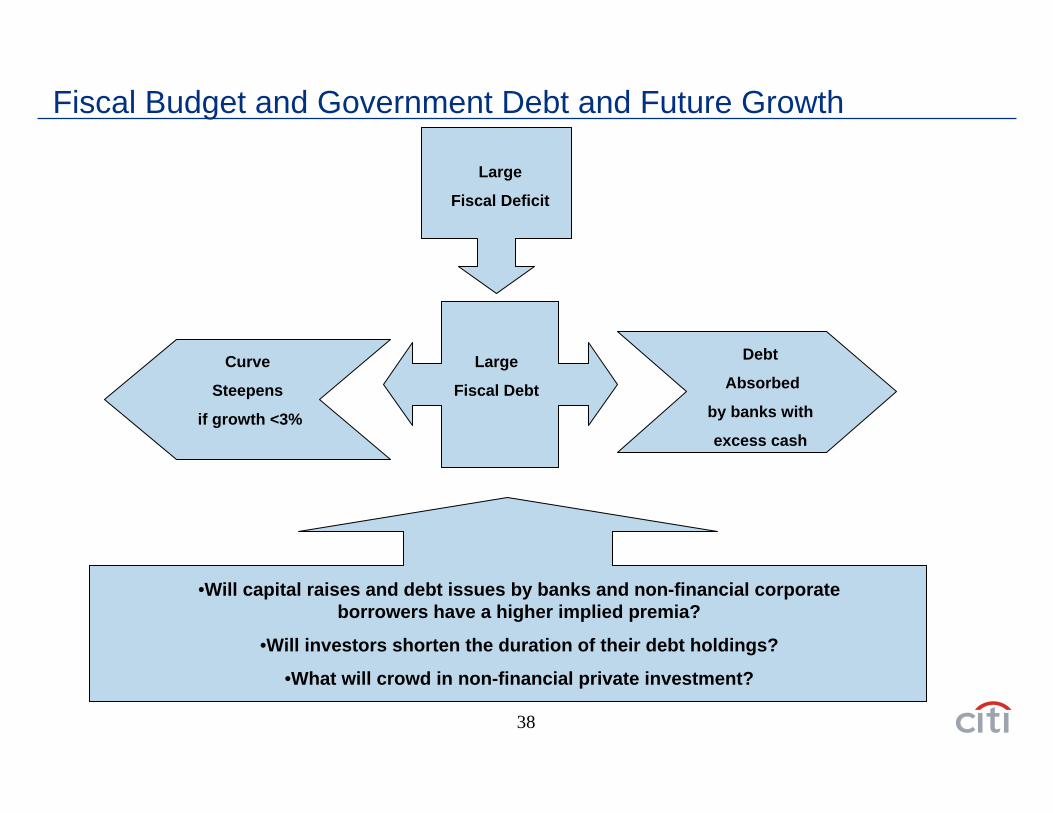
Fiscal Budget and Government Debt and Future Growth
Large
Fiscal Deficit
Curve
Steepens
if growth <3%
Large
Fiscal Debt
Debt
Absorbed
by banks with
excess cash
•Will capital raises and debt issues by banks and non-financial corporate borrowers have a higher implied premia?
•Will investors shorten the duration of their debt holdings?
•What will crowd in non-financial private investment?
Euro-Zone and US Debt and Credit Concerns
40
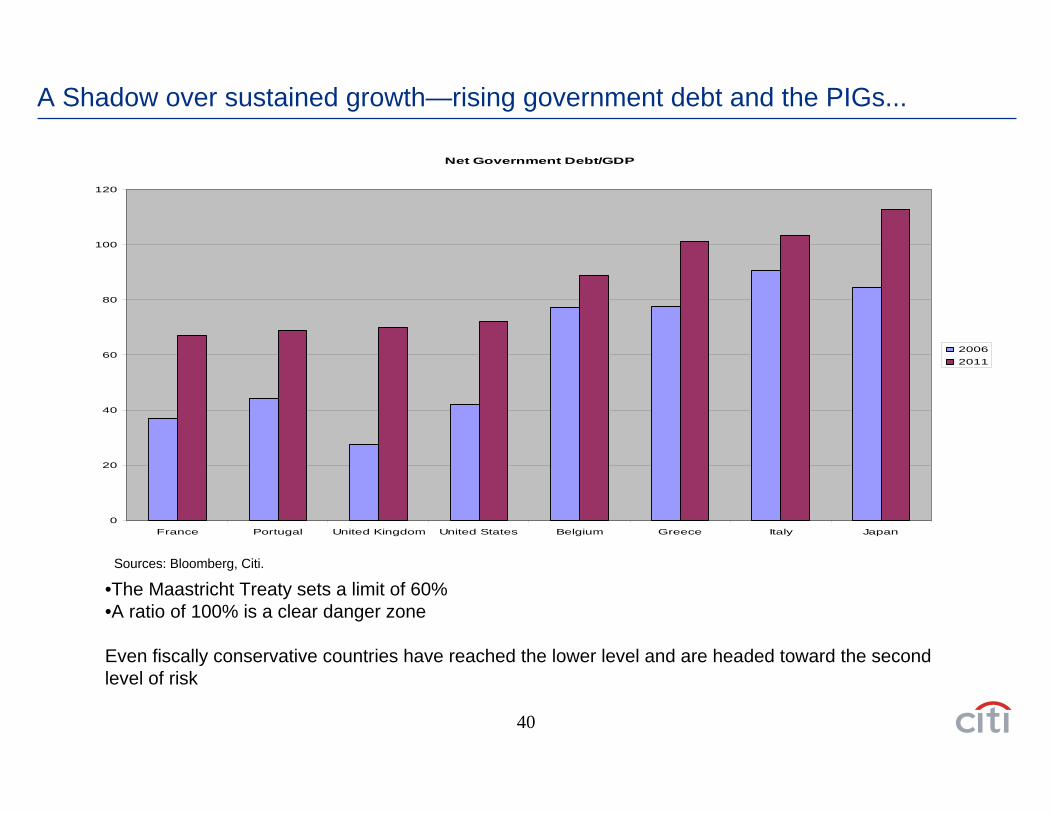
A Shadow over sustained growth—rising government debt and the PIGs...
Net Government Debt/GDP
0
20
40
60
80
100
120
France Portugal United Kingdom United States Belgium Greece Italy Japan
20062011
•The Maastricht Treaty sets a limit of 60% •A ratio of 100% is a clear danger zone
Even fiscally conservative countries have reached the lower level and are headed toward the second level of risk
Sources: Bloomberg, Citi.
41
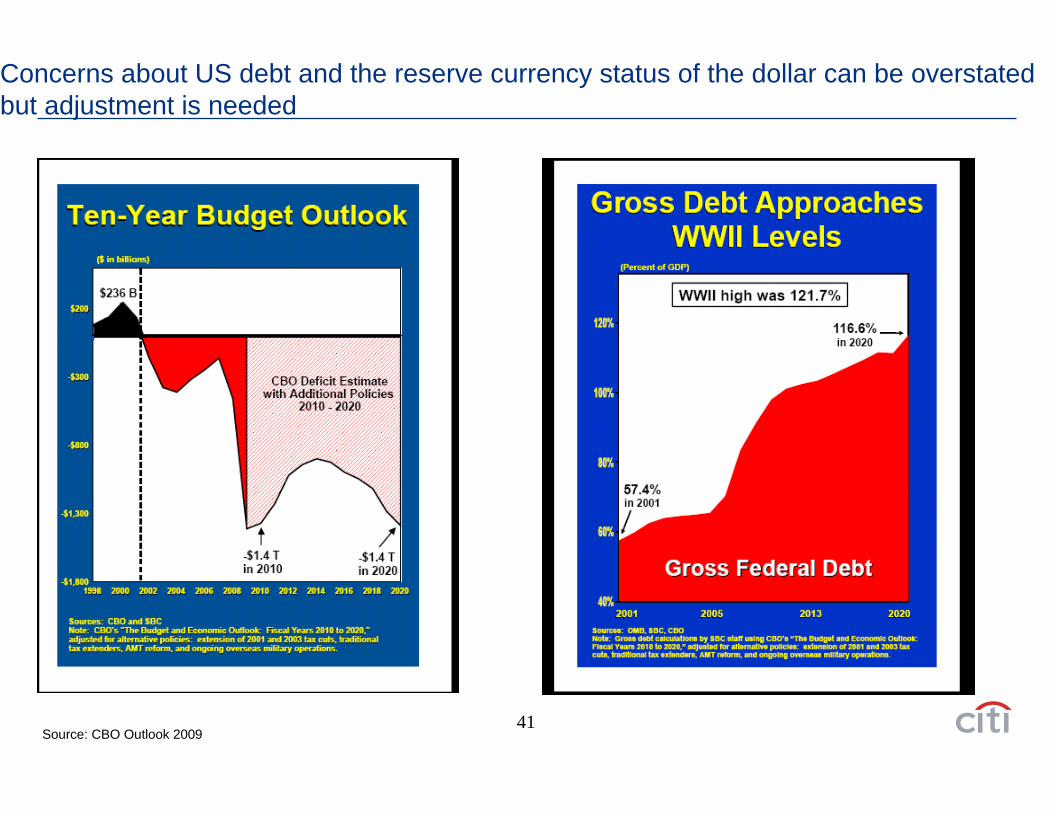
Concerns about US debt and the reserve currency status of the dollar can be overstated but adjustment is needed
Source: CBO Outlook 2009
42
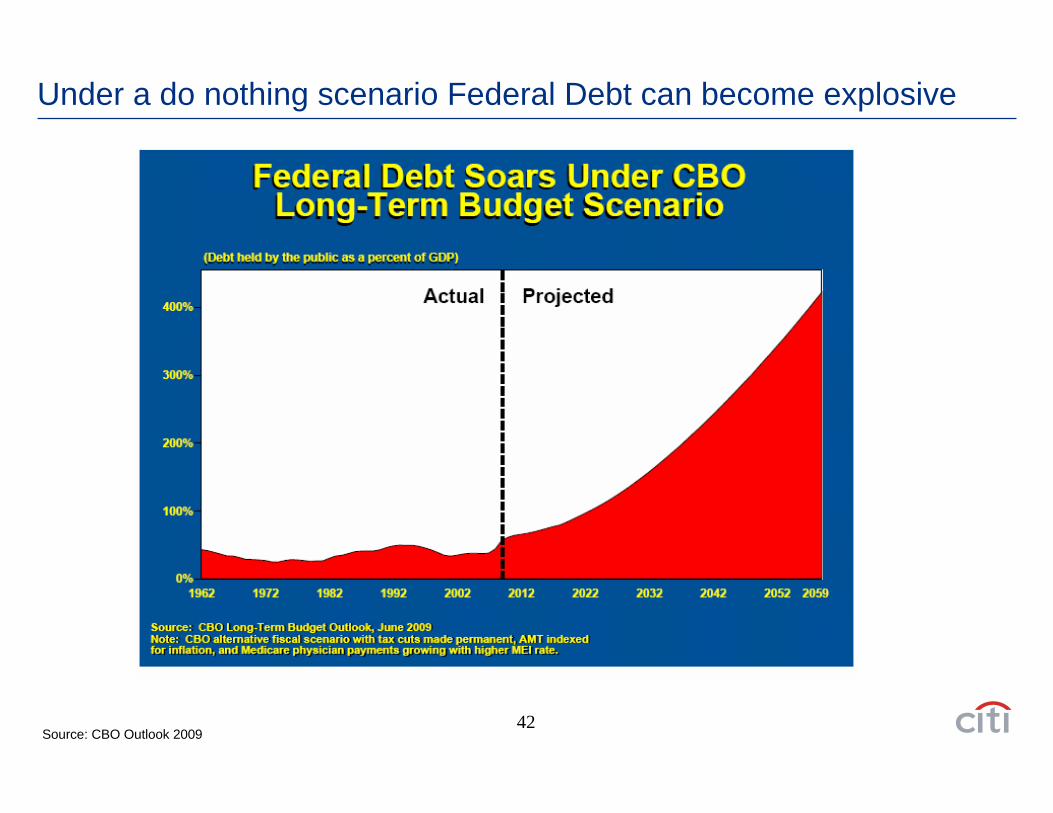
Under a do nothing scenario Federal Debt can become explosive
Source: CBO Outlook 2009
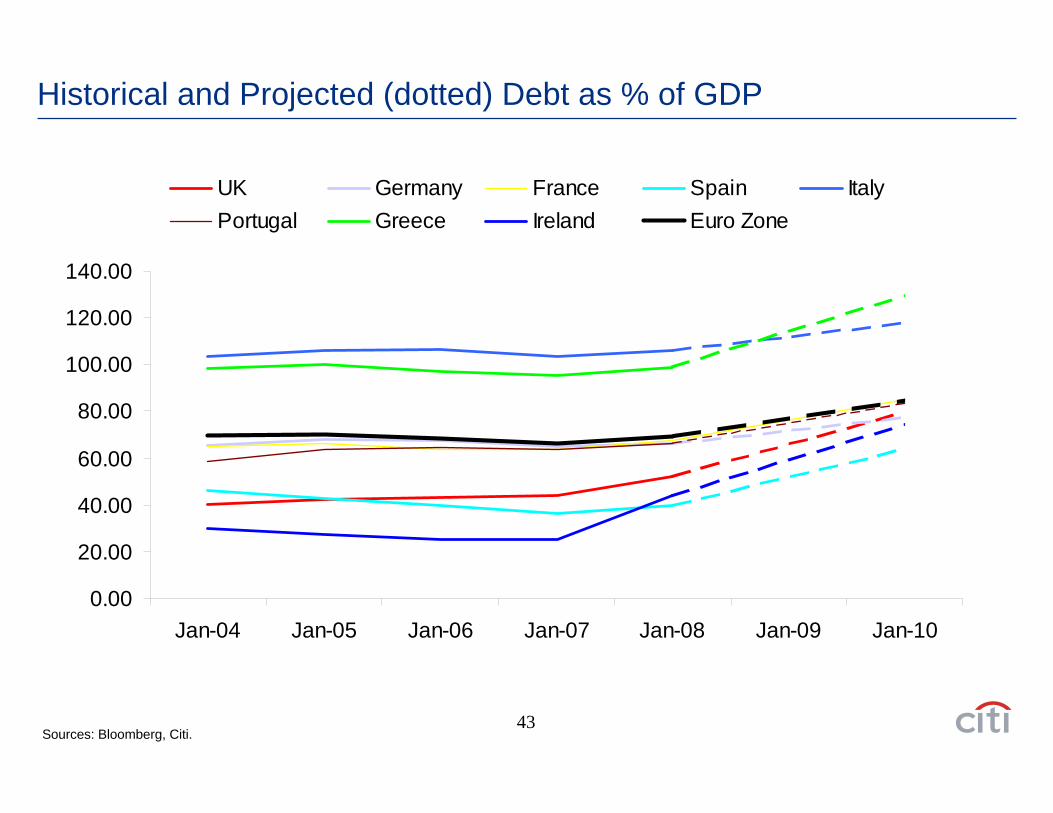
43
Historical and Projected (dotted) Debt as % of GDP
0.00
20.00
40.00
60.00
80.00
100.00
120.00
140.00
Jan-04 Jan-05 Jan-06 Jan-07 Jan-08 Jan-09 Jan-10
UK Germany France Spain ItalyPortugal Greece Ireland Euro Zone
Sources: Bloomberg, Citi.

Credit Concerns in European Periphery Countries
45
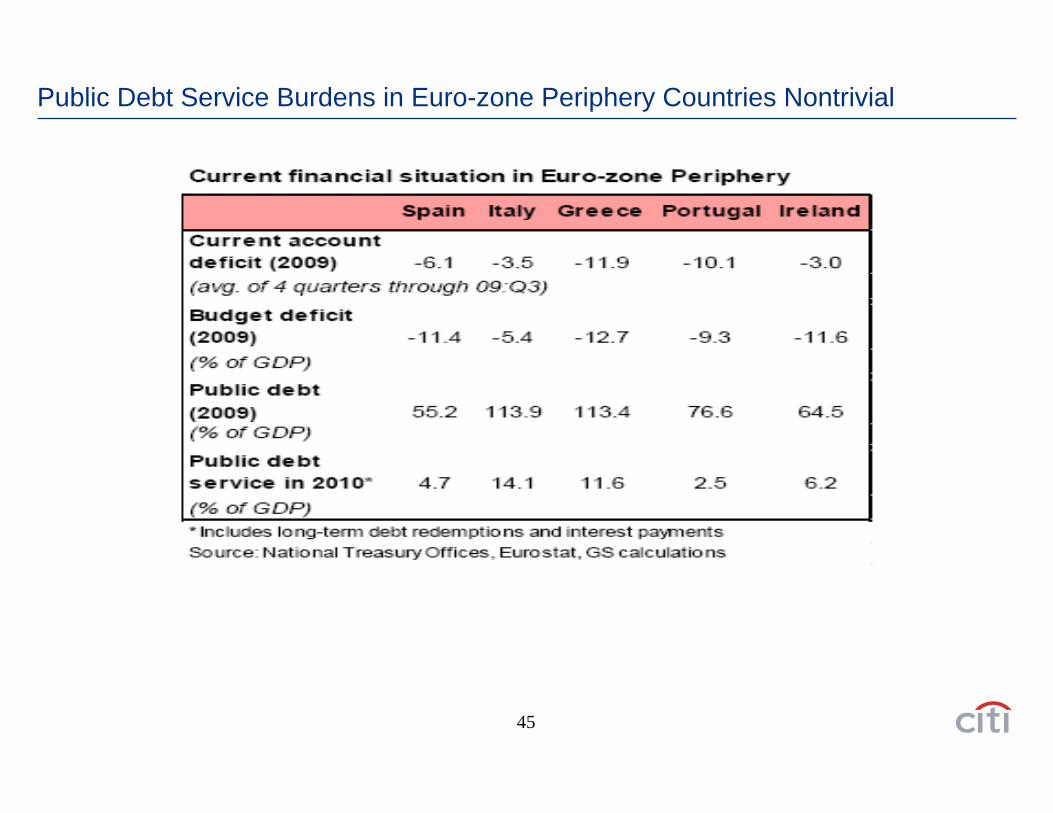
Public Debt Service Burdens in Euro-zone Periphery Countries Nontrivial
46
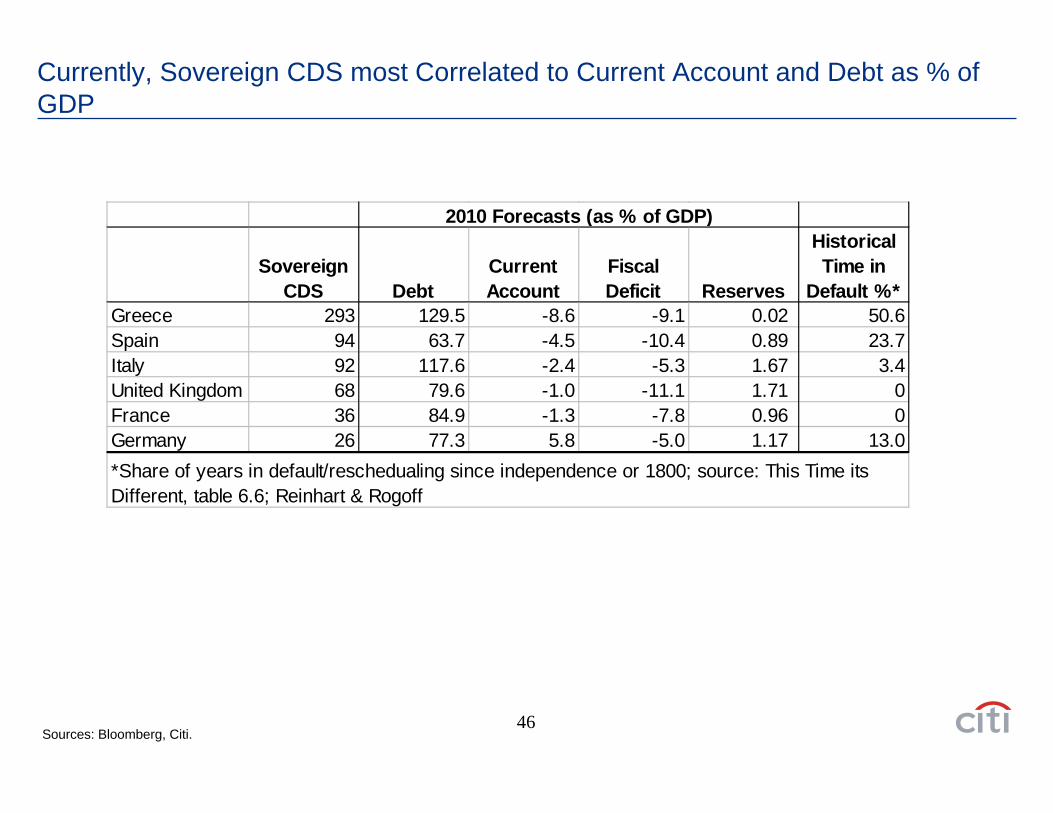
Currently, Sovereign CDS most Correlated to Current Account and Debt as % of GDP
Sovereign CDS Debt
Current Account
Fiscal Deficit Reserves
Historical Time in
Default %*Greece 293 129.5 -8.6 -9.1 0.02 50.6Spain 94 63.7 -4.5 -10.4 0.89 23.7Italy 92 117.6 -2.4 -5.3 1.67 3.4United Kingdom 68 79.6 -1.0 -11.1 1.71 0France 36 84.9 -1.3 -7.8 0.96 0Germany 26 77.3 5.8 -5.0 1.17 13.0
2010 Forecasts (as % of GDP)
*Share of years in default/reschedualing since independence or 1800; source: This Time its Different, table 6.6; Reinhart & Rogoff
Sources: Bloomberg, Citi.
47
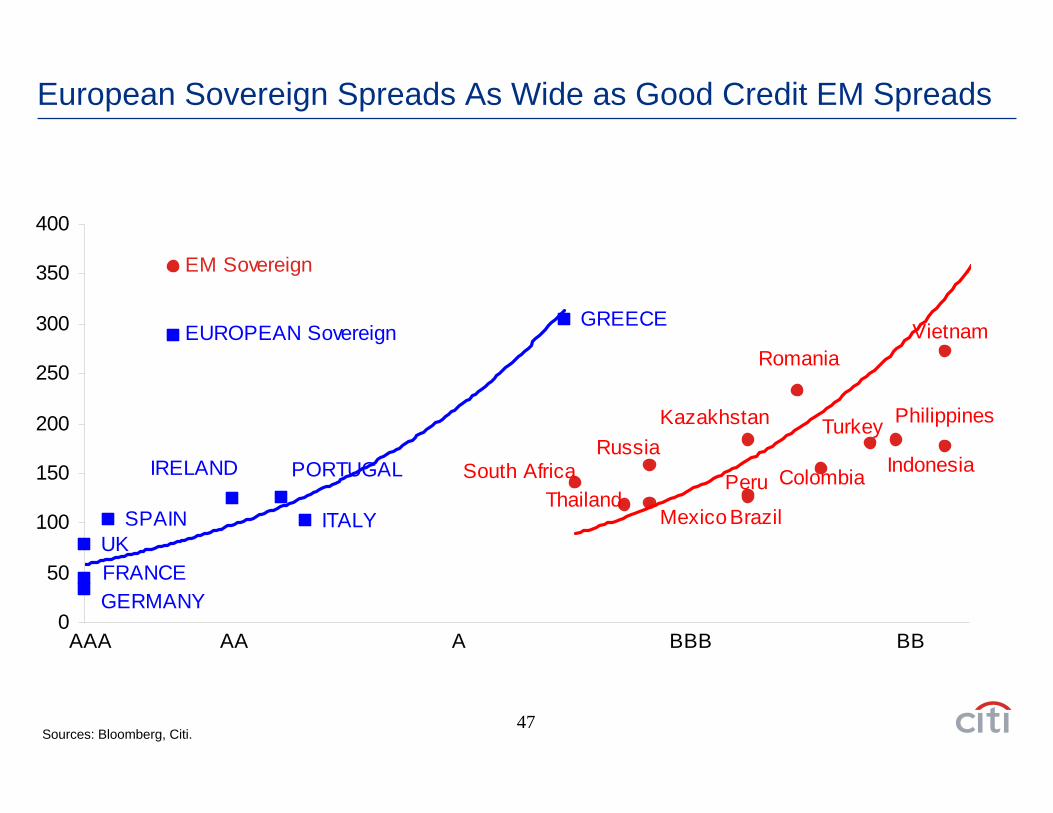
European Sovereign Spreads As Wide as Good Credit EM Spreads
Romania
South Africa
Vietnam
Turkey
Thailand
RussiaPhilippinesKazakhstan
IndonesiaPeru
Mexico
Colombia
Brazil
GREECE
SPAIN
PORTUGAL
ITALY
IRELAND
FRANCEGERMANY
UK
0
50
100
150
200
250
300
350
400
EM Sovereign
EUROPEAN Sovereign
AAA AA A BBB BB
Sources: Bloomberg, Citi.
48
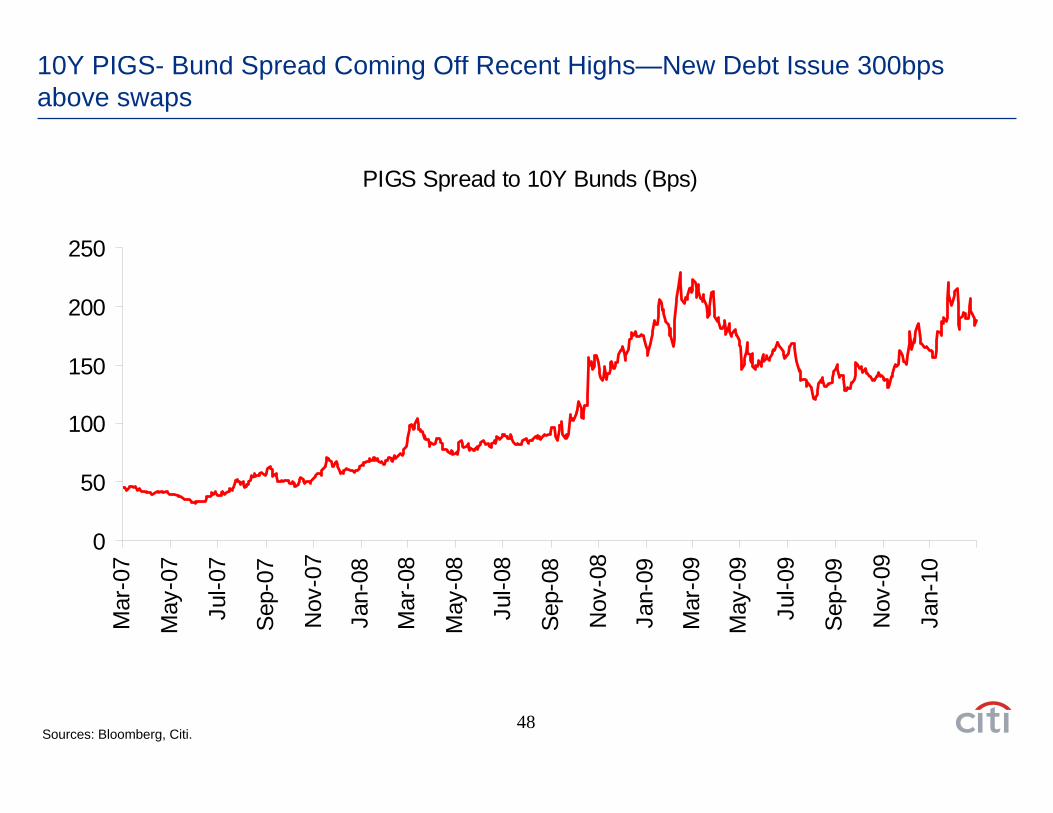
10Y PIGS- Bund Spread Coming Off Recent Highs—New Debt Issue 300bps above swaps
PIGS Spread to 10Y Bunds (Bps)
0
50
100
150
200
250
Mar
-07
May
-07
Jul-0
7
Sep-
07
Nov
-07
Jan-
08
Mar
-08
May
-08
Jul-0
8
Sep-
08
Nov
-08
Jan-
09
Mar
-09
May
-09
Jul-0
9
Sep-
09
Nov
-09
Jan-
10
Sources: Bloomberg, Citi.
49
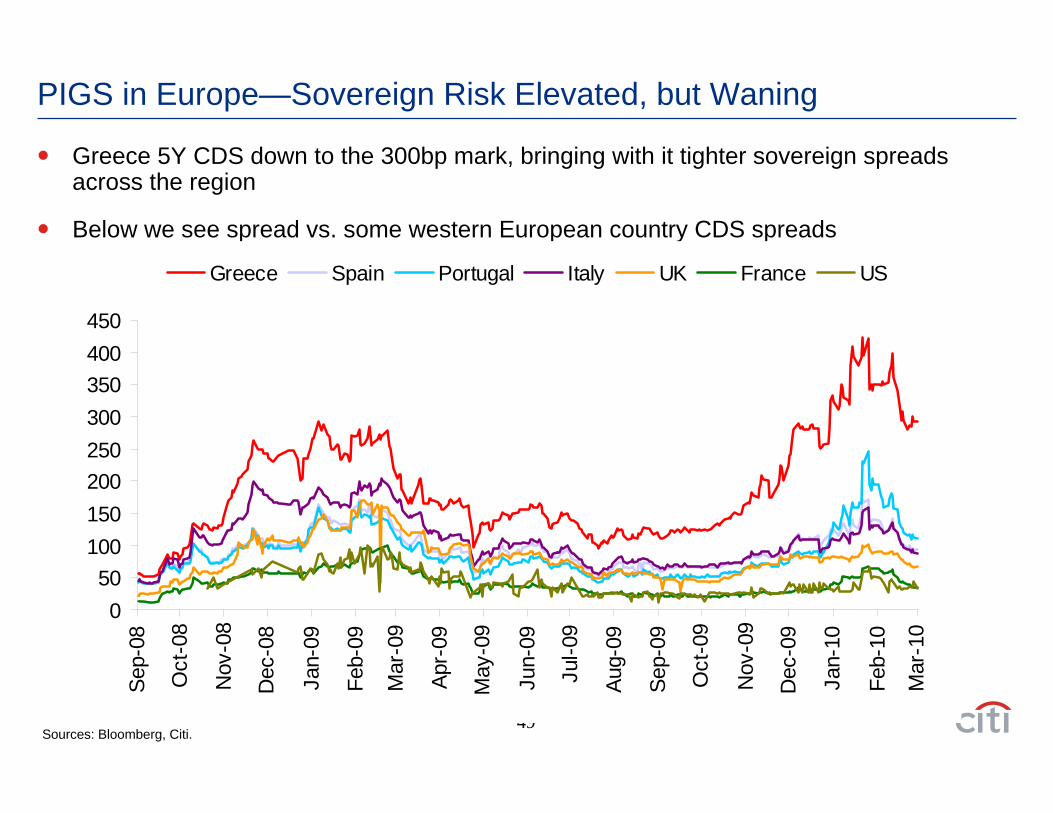
PIGS in Europe—Sovereign Risk Elevated, but Waning
Greece 5Y CDS down to the 300bp mark, bringing with it tighter sovereign spreads across the region
Below we see spread vs. some western European country CDS spreads
050
100150200250300350400450
Sep-
08
Oct
-08
Nov
-08
Dec
-08
Jan-
09
Feb-
09
Mar
-09
Apr-
09
May
-09
Jun-
09
Jul-0
9
Aug-
09
Sep-
09
Oct
-09
Nov
-09
Dec
-09
Jan-
10
Feb-
10
Mar
-10
Greece Spain Portugal Italy UK France US
Sources: Bloomberg, Citi.
50
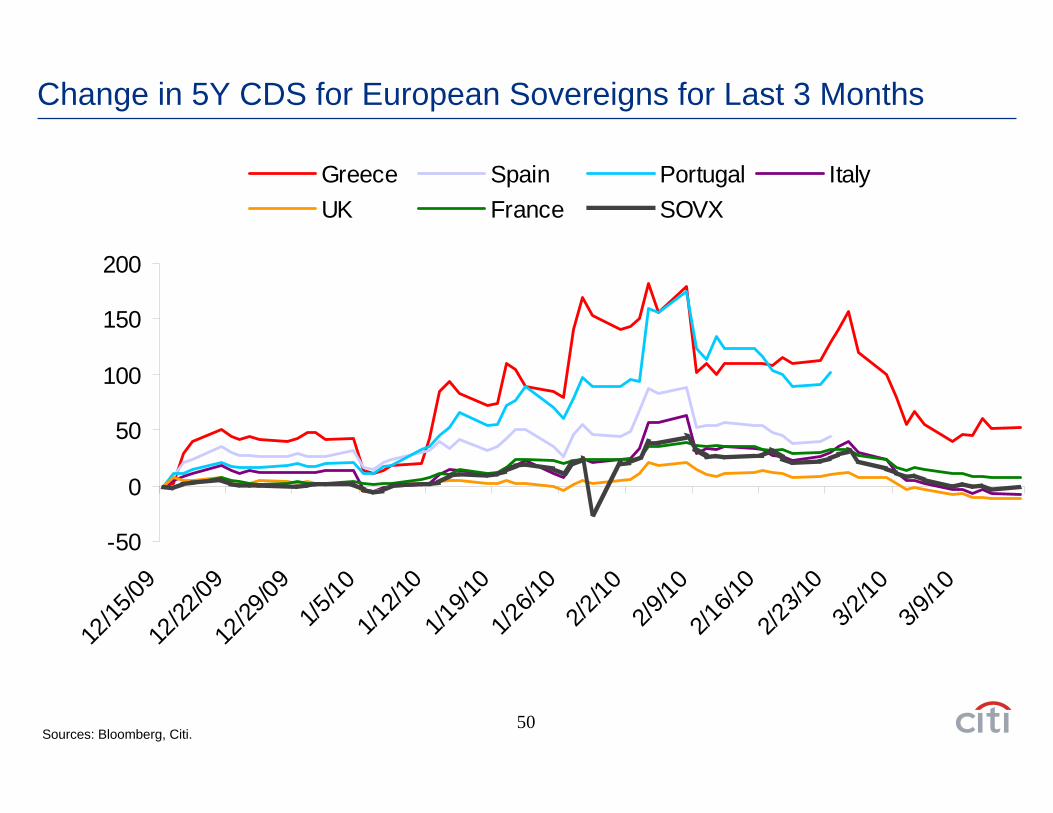
Change in 5Y CDS for European Sovereigns for Last 3 Months
-50
0
50
100
150
200
12/15
/0912
/22/09
12/29
/091/5
/101/1
2/10
1/19/1
01/2
6/10
2/2/10
2/9/10
2/16/1
02/2
3/10
3/2/10
3/9/10
Greece Spain Portugal ItalyUK France SOVX
Sources: Bloomberg, Citi.
51
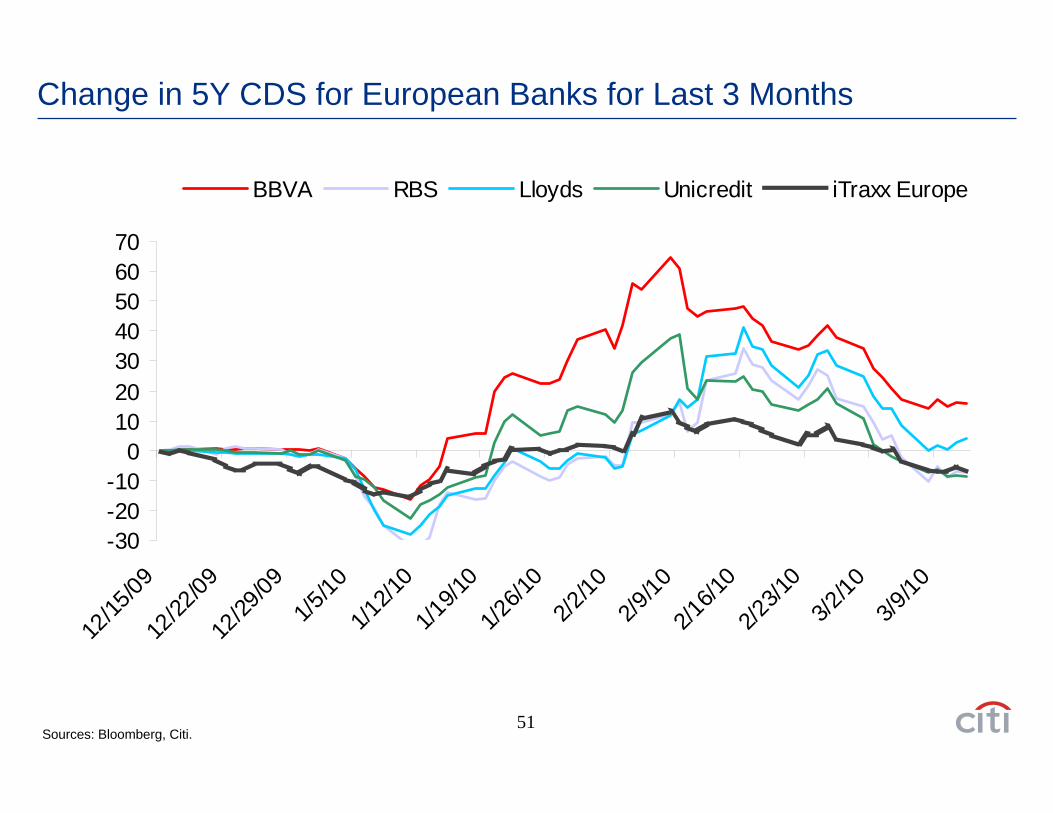
Change in 5Y CDS for European Banks for Last 3 Months
-30-20-10
010203040506070
12/15
/0912
/22/09
12/29
/091/5
/101/1
2/10
1/19/1
01/2
6/10
2/2/10
2/9/10
2/16/1
02/2
3/10
3/2/10
3/9/10
BBVA RBS Lloyds Unicredit iTraxx Europe
Sources: Bloomberg, Citi.
52
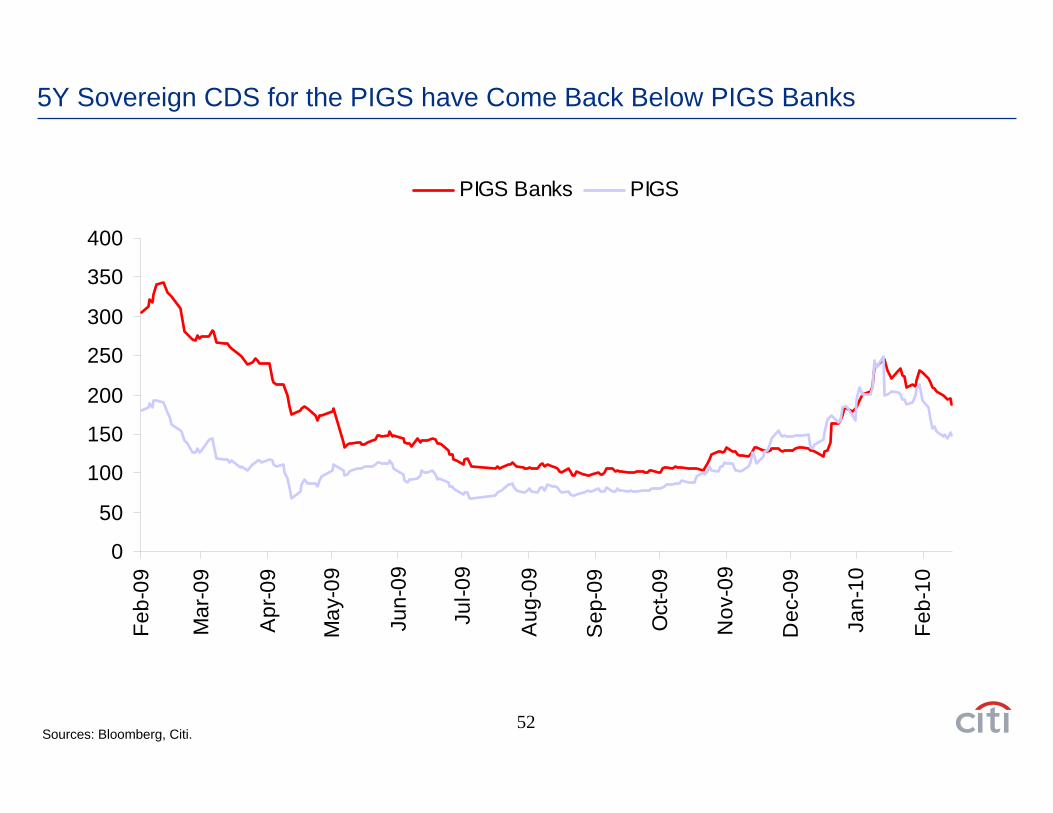
5Y Sovereign CDS for the PIGS have Come Back Below PIGS Banks
0
50
100
150
200
250
300
350
400
Feb-
09
Mar
-09
Apr
-09
May
-09
Jun-
09
Jul-0
9
Aug
-09
Sep
-09
Oct
-09
Nov
-09
Dec
-09
Jan-
10
Feb-
10
PIGS Banks PIGS
Sources: Bloomberg, Citi.
53
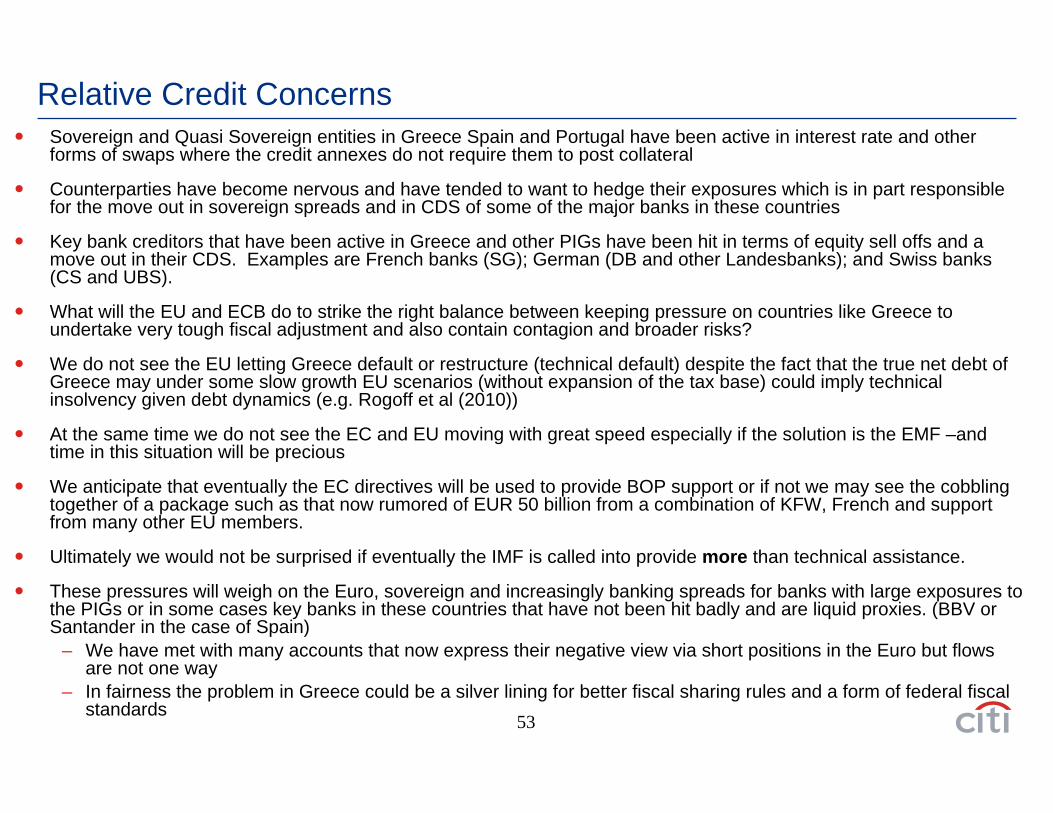
Relative Credit ConcernsSovereign and Quasi Sovereign entities in Greece Spain and Portugal have been active in interest rate and other forms of swaps where the credit annexes do not require them to post collateral
Counterparties have become nervous and have tended to want to hedge their exposures which is in part responsible for the move out in sovereign spreads and in CDS of some of the major banks in these countries
Key bank creditors that have been active in Greece and other PIGs have been hit in terms of equity sell offs and a move out in their CDS. Examples are French banks (SG); German (DB and other Landesbanks); and Swiss banks (CS and UBS).
What will the EU and ECB do to strike the right balance between keeping pressure on countries like Greece to undertake very tough fiscal adjustment and also contain contagion and broader risks?
We do not see the EU letting Greece default or restructure (technical default) despite the fact that the true net debt of Greece may under some slow growth EU scenarios (without expansion of the tax base) could imply technical insolvency given debt dynamics (e.g. Rogoff et al (2010))
At the same time we do not see the EC and EU moving with great speed especially if the solution is the EMF –and time in this situation will be precious
We anticipate that eventually the EC directives will be used to provide BOP support or if not we may see the cobbling together of a package such as that now rumored of EUR 50 billion from a combination of KFW, French and support from many other EU members.
Ultimately we would not be surprised if eventually the IMF is called into provide more than technical assistance.
These pressures will weigh on the Euro, sovereign and increasingly banking spreads for banks with large exposures to the PIGs or in some cases key banks in these countries that have not been hit badly and are liquid proxies. (BBV or Santander in the case of Spain)
– We have met with many accounts that now express their negative view via short positions in the Euro but flows are not one way
– In fairness the problem in Greece could be a silver lining for better fiscal sharing rules and a form of federal fiscal standards
US Sate and Municipal Credit Concerns

55
FY 2010 new budget gaps exceed 28 billion
Source: National Association of State Budget Officers State Expenditure Report FY 2008
FY 2010 State Fiscal Gap (as a % of Operating Budget)
0.00%2.00%4.00%6.00%8.00%
10.00%12.00%14.00%16.00%18.00%20.00%
Okl
ahom
aAr
izon
aIll
inoi
sH
awai
iN
ew M
exic
oC
olor
ado
Virg
inia
Kans
asM
aine
Sout
h C
arol
ina
Rho
de Is
land
Mis
siss
ippi
Alab
ama
Was
hing
ton
Cal
iforn
iaId
aho
New
Yor
kIo
wa
Geo
rgia
Mar
ylan
dM
onta
naN
ebra
ska
Verm
ont
Indi
ana
Arka
nsas
Con
nect
icut
Mas
sach
uset
tsKe
ntuc
kyN
ew H
amps
h.N
ew J
erse
yN
orth
Car
olin
aM
inne
sota
Ohi
oN
evad
aPe
nnsy
lvan
iaW
est V
irgin
ia
56
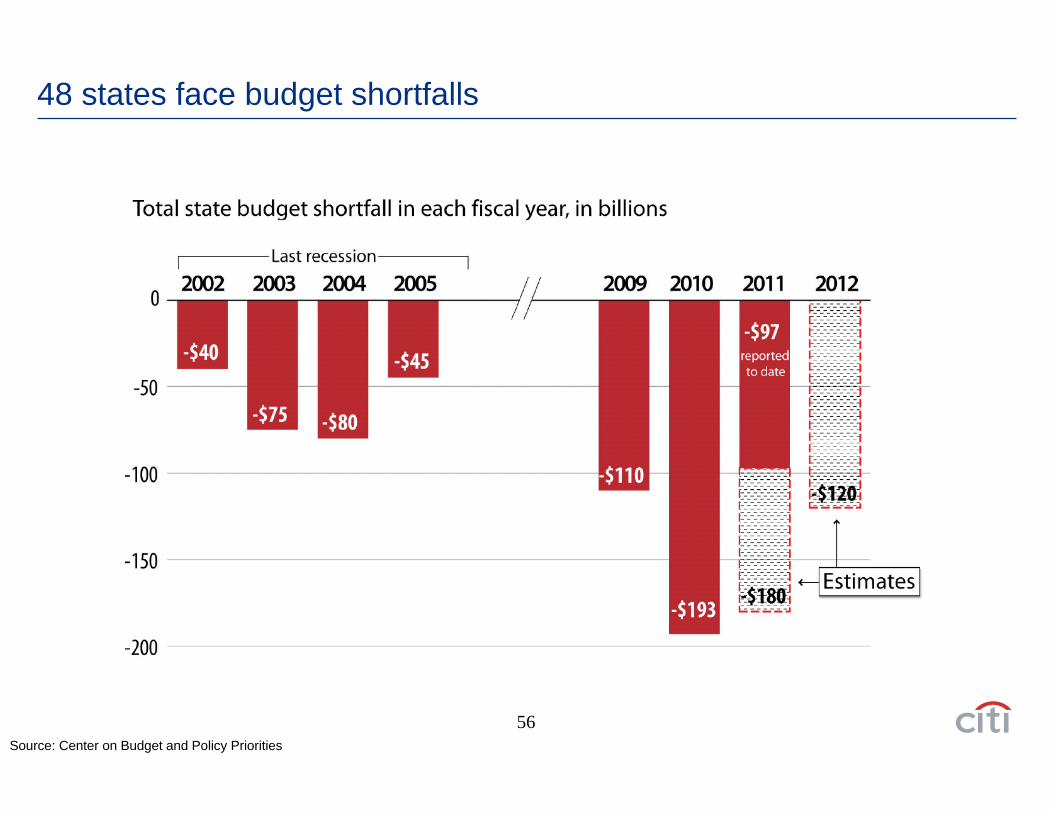
48 states face budget shortfalls
Source: Center on Budget and Policy Priorities
57
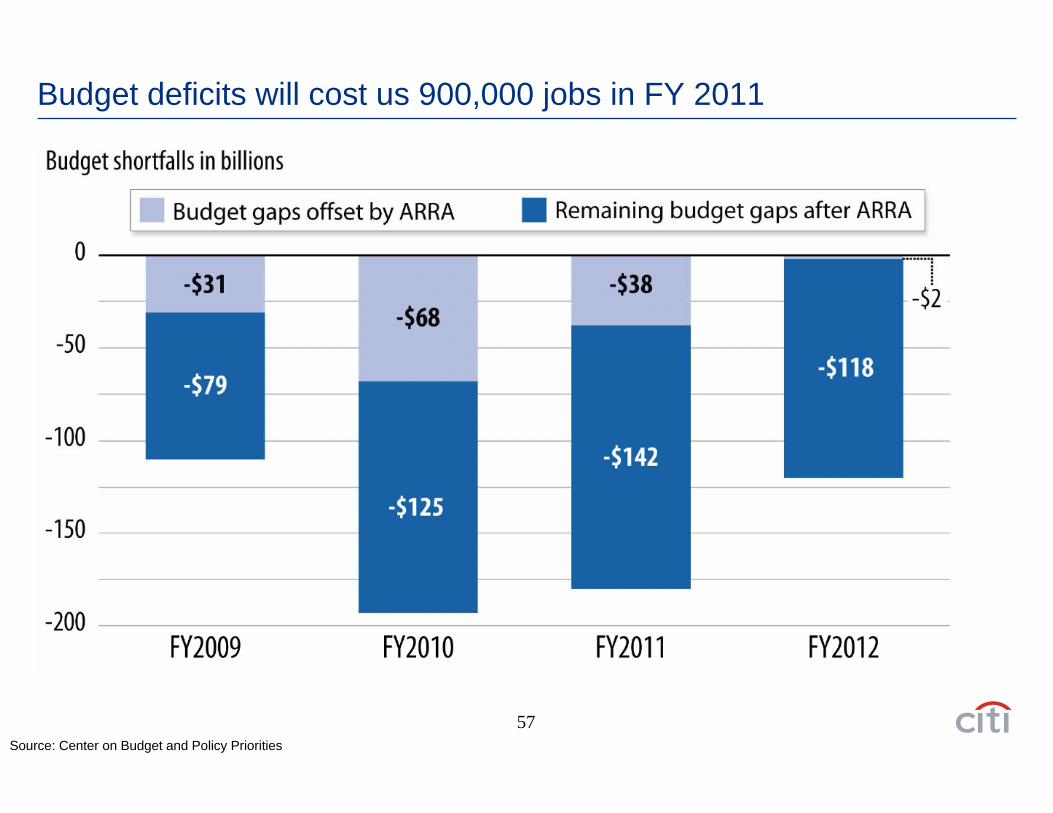
Budget deficits will cost us 900,000 jobs in FY 2011
Source: Center on Budget and Policy Priorities
58
State Budgets a Problem but Municipal Budgets and Debt Less Monitor able and cracks larger
900,000 jobs will be lost if states are unable to close their $142 billion deficit.
Budget Shortfalls - 1/4 of state budgets need to be filled at the moment.
Medicaid- States have to keep Medicaid at 2008 eligibility levels to receive Recovery Act funds. Enrollment increases went from -0.6% to 5.4% from 2007 to 2009
Unemployment Insurance - will pose a problem if benefits are not extended federally. – Already 17 states have included the extension in their budgets for FY 2011.– States have outstanding loans from the Fed Govt for unemployment insurance payments ($28.7
bil.).– Unemployment extension was recently removed from the JOBS bill up for vote this week.
States that face the most risk for FY 2011 include: Michigan, California, Arizona, NY, NJ, Illinois and Nevada
Unfunded pension liabilities for the 23 million active and retired public employees at the state and municipal level is not included in this US$ 142 billion gap. This could amount to as much as 1-2 trillion in studies by actuarial groups
A bill is now being developed in the Congress and Senate HR 4213 to provide USD 140 billion in support of actions that can provide further support to households and states and municipalities ----kicking the can down the road!
Exit in US and European Monetary Policy
60
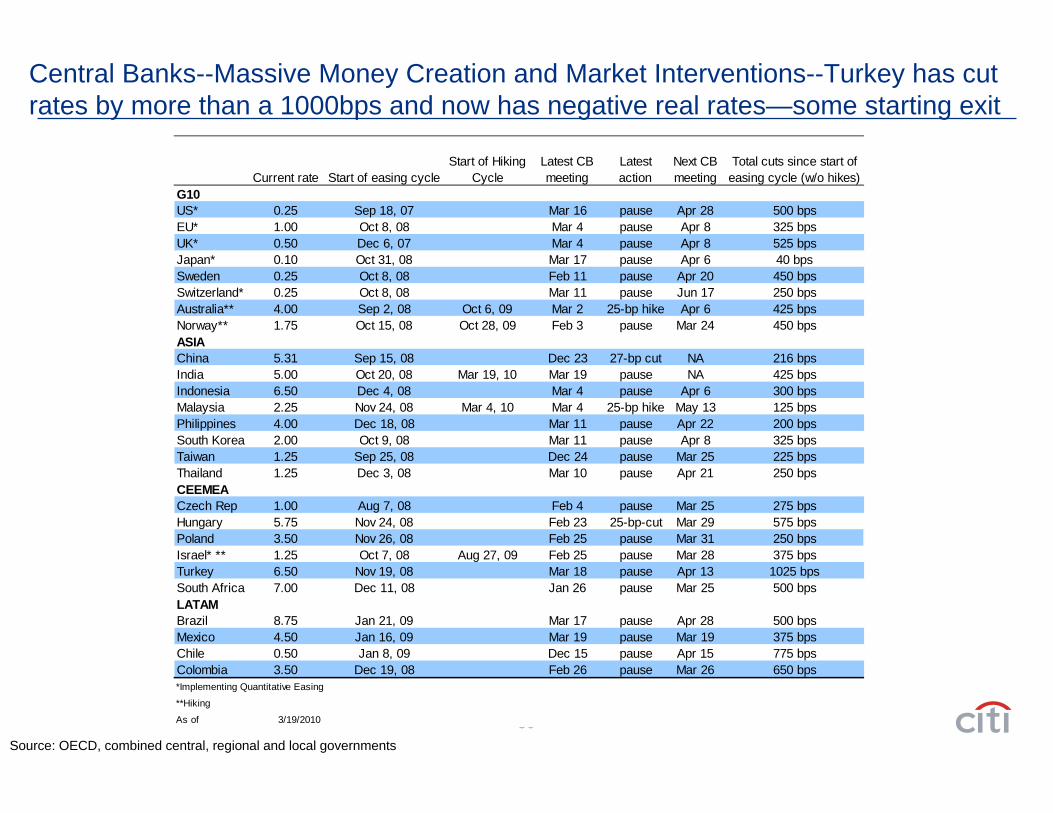
Central Banks--Massive Money Creation and Market Interventions--Turkey has cut rates by more than a 1000bps and now has negative real rates—some starting exit
Source: OECD, combined central, regional and local governments
Start of Hiking Cycle
G10US* 0.25 Sep 18, 07 Mar 16 pause Apr 28 500 bpsEU* 1.00 Oct 8, 08 Mar 4 pause Apr 8 325 bpsUK* 0.50 Dec 6, 07 Mar 4 pause Apr 8 525 bpsJapan* 0.10 Oct 31, 08 Mar 17 pause Apr 6 40 bpsSweden 0.25 Oct 8, 08 Feb 11 pause Apr 20 450 bpsSwitzerland* 0.25 Oct 8, 08 Mar 11 pause Jun 17 250 bpsAustralia** 4.00 Sep 2, 08 Oct 6, 09 Mar 2 25-bp hike Apr 6 425 bpsNorway** 1.75 Oct 15, 08 Oct 28, 09 Feb 3 pause Mar 24 450 bpsASIAChina 5.31 Sep 15, 08 Dec 23 27-bp cut NA 216 bpsIndia 5.00 Oct 20, 08 Mar 19, 10 Mar 19 pause NA 425 bpsIndonesia 6.50 Dec 4, 08 Mar 4 pause Apr 6 300 bpsMalaysia 2.25 Nov 24, 08 Mar 4, 10 Mar 4 25-bp hike May 13 125 bpsPhilippines 4.00 Dec 18, 08 Mar 11 pause Apr 22 200 bpsSouth Korea 2.00 Oct 9, 08 Mar 11 pause Apr 8 325 bpsTaiwan 1.25 Sep 25, 08 Dec 24 pause Mar 25 225 bpsThailand 1.25 Dec 3, 08 Mar 10 pause Apr 21 250 bpsCEEMEACzech Rep 1.00 Aug 7, 08 Feb 4 pause Mar 25 275 bpsHungary 5.75 Nov 24, 08 Feb 23 25-bp-cut Mar 29 575 bpsPoland 3.50 Nov 26, 08 Feb 25 pause Mar 31 250 bpsIsrael* ** 1.25 Oct 7, 08 Aug 27, 09 Feb 25 pause Mar 28 375 bpsTurkey 6.50 Nov 19, 08 Mar 18 pause Apr 13 1025 bpsSouth Africa 7.00 Dec 11, 08 Jan 26 pause Mar 25 500 bpsLATAMBrazil 8.75 Jan 21, 09 Mar 17 pause Apr 28 500 bpsMexico 4.50 Jan 16, 09 Mar 19 pause Mar 19 375 bpsChile 0.50 Jan 8, 09 Dec 15 pause Apr 15 775 bpsColombia 3.50 Dec 19, 08 Feb 26 pause Mar 26 650 bps*Implementing Quantitative Easing
**Hiking
As of 3/19/2010
Next CB meeting
Total cuts since start of easing cycle (w/o hikes)Current rate Start of easing cycle
Latest CB meeting
Latest action
61
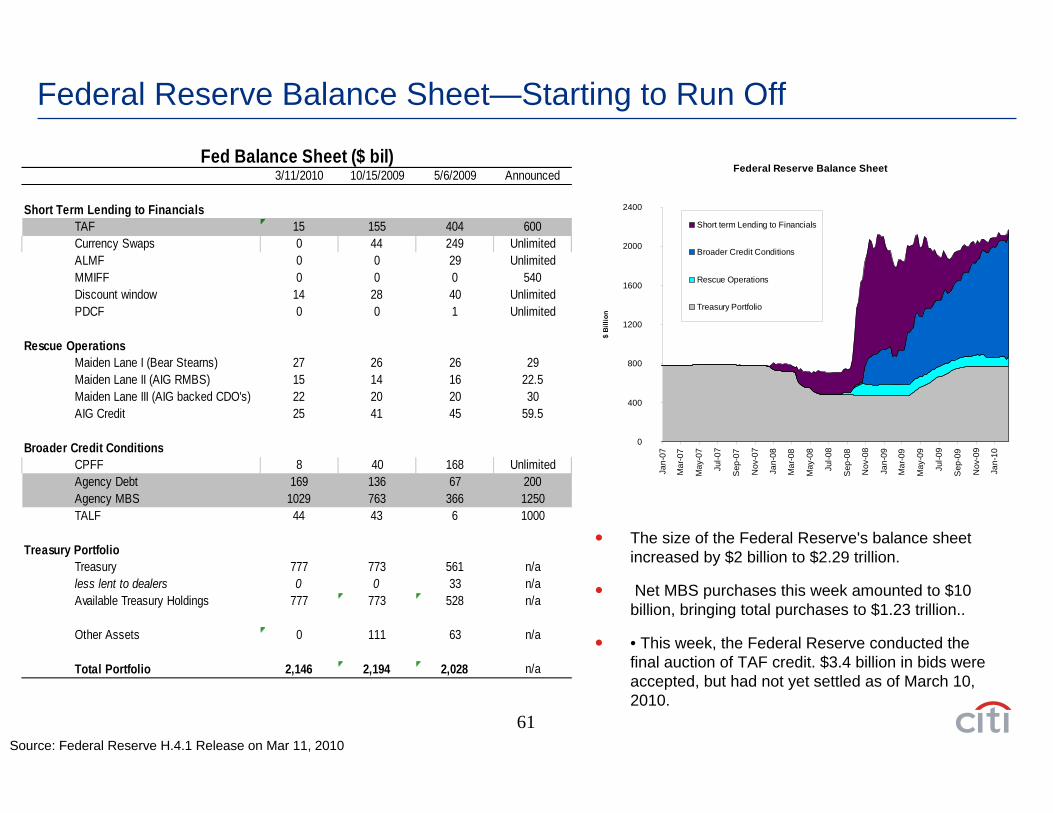
Federal Reserve Balance Sheet—Starting to Run Off
The size of the Federal Reserve's balance sheet increased by $2 billion to $2.29 trillion.
Net MBS purchases this week amounted to $10 billion, bringing total purchases to $1.23 trillion..
• This week, the Federal Reserve conducted the final auction of TAF credit. $3.4 billion in bids were accepted, but had not yet settled as of March 10, 2010.
Source: Federal Reserve H.4.1 Release on Mar 11, 2010
Federal Reserve Balance Sheet
0
400
800
1200
1600
2000
2400
Jan-
07
Mar
-07
May
-07
Jul-0
7
Sep
-07
Nov
-07
Jan-
08
Mar
-08
May
-08
Jul-0
8
Sep
-08
Nov
-08
Jan-
09
Mar
-09
May
-09
Jul-0
9
Sep
-09
Nov
-09
Jan-
10
$ Bi
llion
Short term Lending to Financials
Broader Credit Conditions
Rescue Operations
Treasury Portfolio
3/11/2010 10/15/2009 5/6/2009 Announced
Short Term Lending to FinancialsTAF 15 155 404 600Currency Swaps 0 44 249 UnlimitedALMF 0 0 29 UnlimitedMMIFF 0 0 0 540Discount window 14 28 40 UnlimitedPDCF 0 0 1 Unlimited
Rescue OperationsMaiden Lane I (Bear Stearns) 27 26 26 29Maiden Lane II (AIG RMBS) 15 14 16 22.5Maiden Lane III (AIG backed CDO's) 22 20 20 30AIG Credit 25 41 45 59.5
Broader Credit ConditionsCPFF 8 40 168 UnlimitedAgency Debt 169 136 67 200Agency MBS 1029 763 366 1250TALF 44 43 6 1000
Treasury PortfolioTreasury 777 773 561 n/aless lent to dealers 0 0 33 n/aAvailable Treasury Holdings 777 773 528 n/a
Other Assets 0 111 63 n/a
Total Portfolio 2,146 2,194 2,028 n/a
Fed Balance Sheet ($ bil)
62
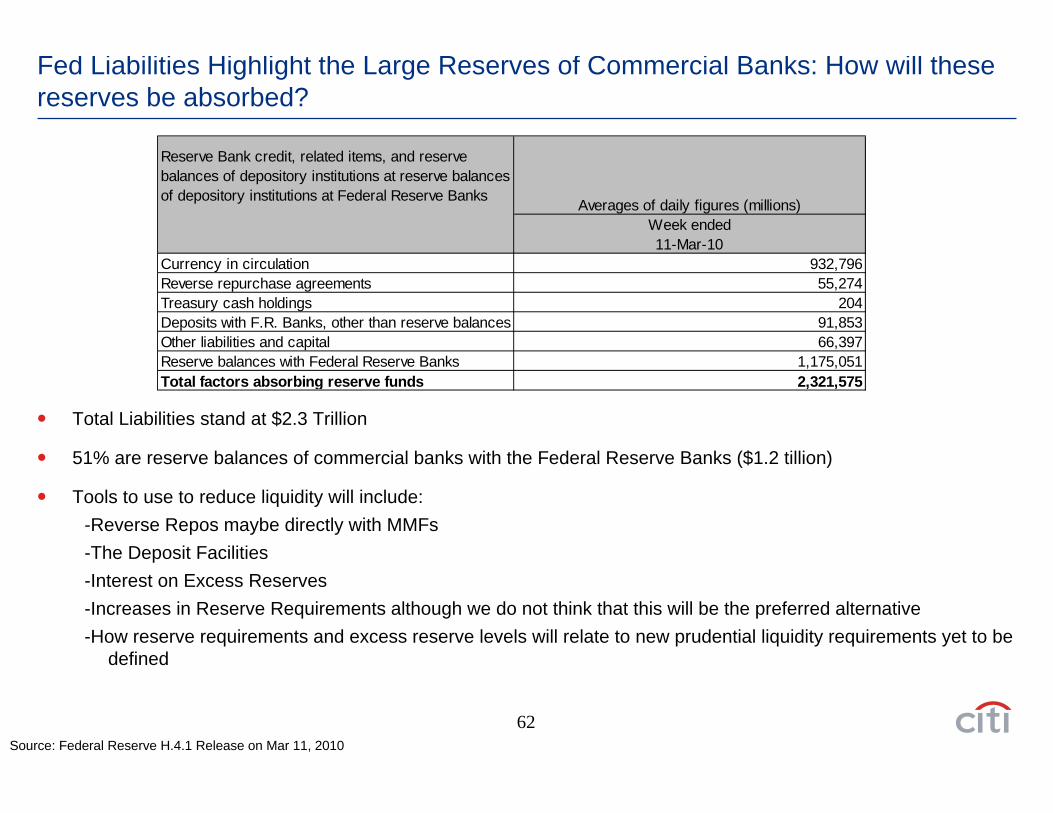
Fed Liabilities Highlight the Large Reserves of Commercial Banks: How will these reserves be absorbed?
Reserve Bank credit, related items, and reserve balances of depository institutions at reserve balances of depository institutions at Federal Reserve Banks Averages of daily figures (millions)
Week ended11-Mar-10
Currency in circulation 932,796Reverse repurchase agreements 55,274Treasury cash holdings 204Deposits with F.R. Banks, other than reserve balances 91,853Other liabilities and capital 66,397Reserve balances with Federal Reserve Banks 1,175,051Total factors absorbing reserve funds 2,321,575
Total Liabilities stand at $2.3 Trillion
51% are reserve balances of commercial banks with the Federal Reserve Banks ($1.2 tillion)
Tools to use to reduce liquidity will include:-Reverse Repos maybe directly with MMFs-The Deposit Facilities-Interest on Excess Reserves-Increases in Reserve Requirements although we do not think that this will be the preferred alternative-How reserve requirements and excess reserve levels will relate to new prudential liquidity requirements yet to be
defined
Source: Federal Reserve H.4.1 Release on Mar 11, 2010
63
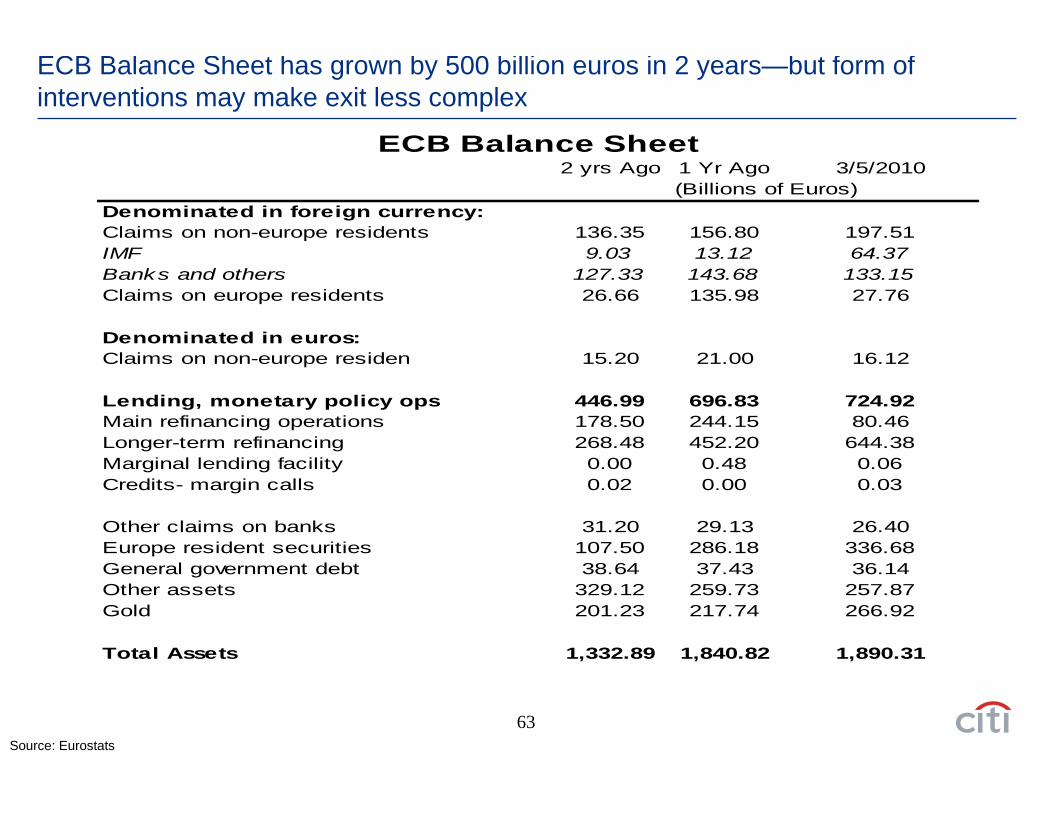
ECB Balance Sheet has grown by 500 billion euros in 2 years—but form of interventions may make exit less complex
Source: Eurostats
2 yrs Ago 1 Yr Ago 3/5/2010
Denominated in foreign currency:Claims on non-europe residents 136.35 156.80 197.51IMF 9.03 13.12 64.37Banks and others 127.33 143.68 133.15Claims on europe residents 26.66 135.98 27.76
Denominated in euros:Claims on non-europe residen 15.20 21.00 16.12
Lending, monetary policy ops 446.99 696.83 724.92Main refinancing operations 178.50 244.15 80.46Longer-term refinancing 268.48 452.20 644.38Marginal lending facility 0.00 0.48 0.06Credits- margin calls 0.02 0.00 0.03
Other claims on banks 31.20 29.13 26.40Europe resident securities 107.50 286.18 336.68General government debt 38.64 37.43 36.14Other assets 329.12 259.73 257.87Gold 201.23 217.74 266.92
Total Assets 1,332.89 1,840.82 1,890.31
(Billions of Euros)
ECB Balance Sheet
64
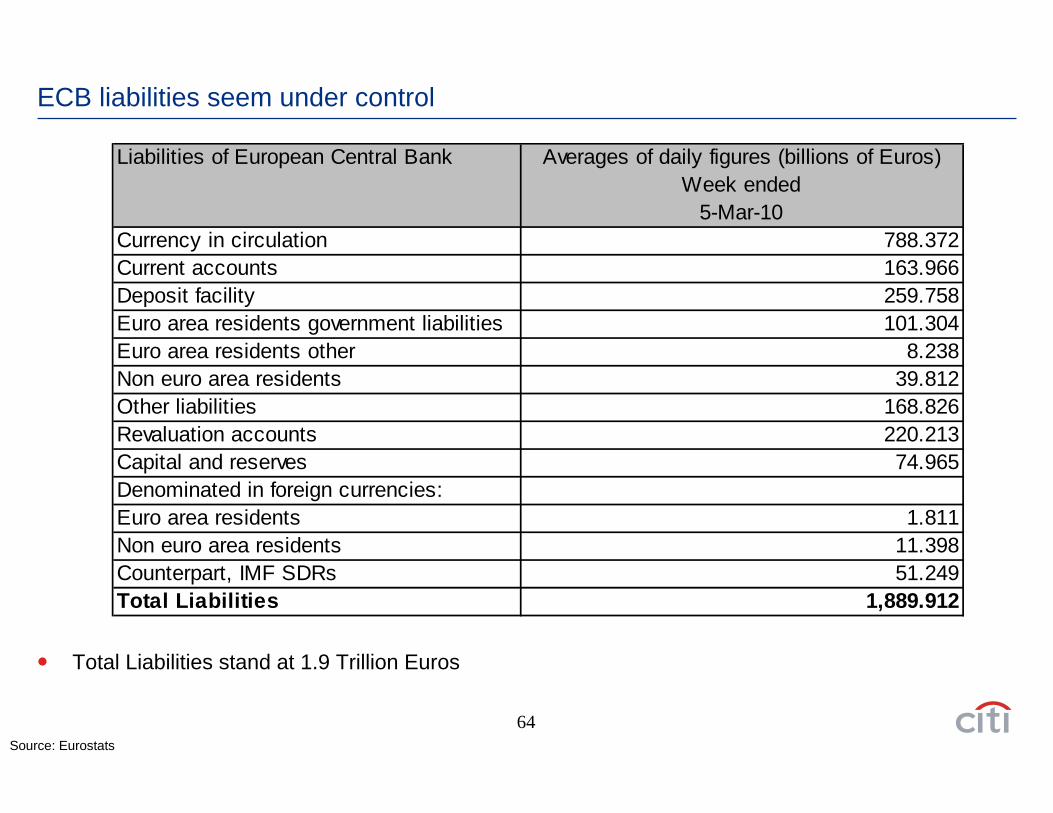
ECB liabilities seem under control
Total Liabilities stand at 1.9 Trillion Euros
Source: Eurostats
Liabilities of European Central Bank Averages of daily figures (billions of Euros)Week ended
5-Mar-10Currency in circulation 788.372Current accounts 163.966Deposit facility 259.758Euro area residents government liabilities 101.304Euro area residents other 8.238Non euro area residents 39.812Other liabilities 168.826Revaluation accounts 220.213Capital and reserves 74.965Denominated in foreign currencies:Euro area residents 1.811Non euro area residents 11.398Counterpart, IMF SDRs 51.249Total Liabilities 1,889.912
65
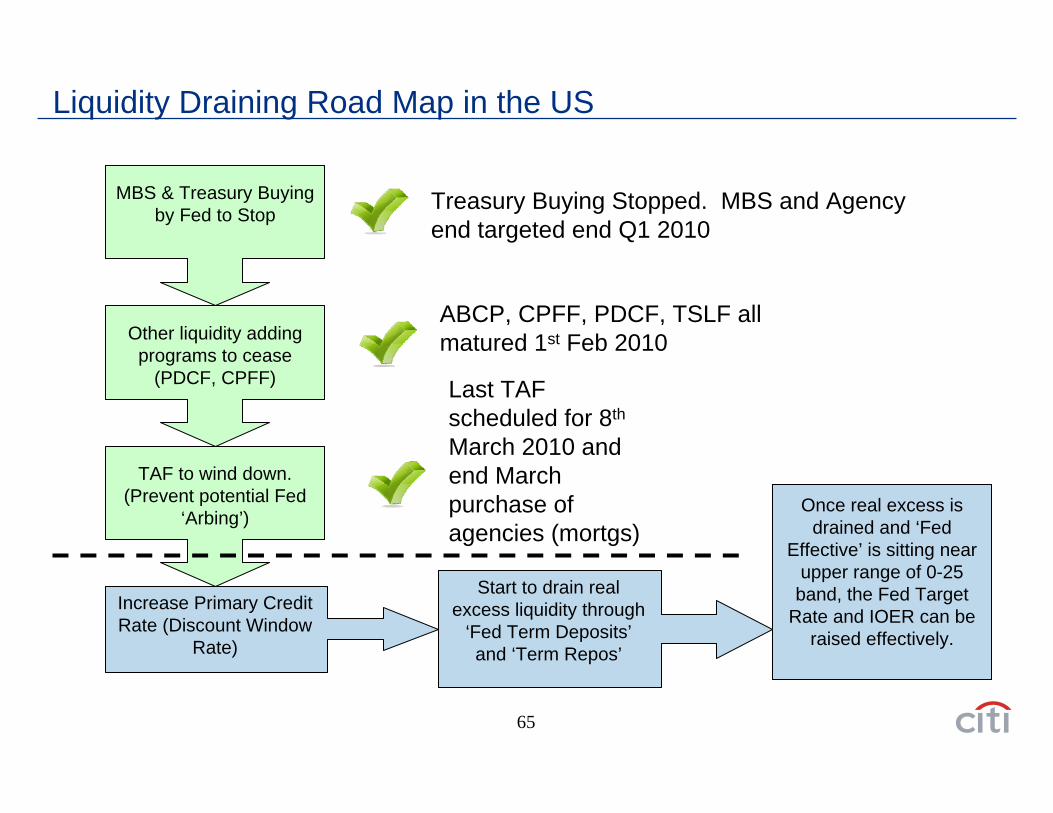
Liquidity Draining Road Map in the US
MBS & Treasury Buying by Fed to Stop
Other liquidity adding programs to cease
(PDCF, CPFF)
TAF to wind down. (Prevent potential Fed
‘Arbing’)
Increase Primary Credit Rate (Discount Window
Rate)
Start to drain real excess liquidity through
‘Fed Term Deposits’and ‘Term Repos’
Once real excess is drained and ‘Fed
Effective’ is sitting near upper range of 0-25 band, the Fed Target
Rate and IOER can be raised effectively.
Treasury Buying Stopped. MBS and Agency end targeted end Q1 2010
ABCP, CPFF, PDCF, TSLF all matured 1st Feb 2010
Last TAF scheduled for 8th
March 2010 and end March purchase of agencies (mortgs)
66
Exit in US Monetary PolicyExit will be slow, communication by the FED (and market confusion) will result in interesting opportunities for good entry into long bond and receiving in the short –end.
The FED Balance Sheet is running off in some areas: Treasury Buying stopped on October 31, 2009; ABCP, CPFF, PDCF, TSLF all matured Feb 1, 2010; TAF auctions to end March 2010; MBS and Agency end targeted end Q1 2010;
Large banks in the system unlike previous situations are long cash –with many of the largest banks having as much as US$ 100-200 billion in cash holdings in their accounts with the FED.
Total commercial bank reserves of over US$ 1.3 trillion now on the liability side of the FED balance sheet
Future elimination of many of the exceptional facilities is now in play with among the most important being the purchase of agency debt that likely will be ended in March of 2010
It is likely that the FED will employ the interest rate on excess reserves (IEOR) as a floor rate. The discount rate will act as a form of ceiling (so-called corridor system).
– The fed funds effective rate and other market rates will largely be above this rate and the fed funds rate may still be the intermediate target
– Market rates will not be allowed to fall too far below the floor IEOR– An increase in the Federal Reserve Discount rate will be part of the return to more traditional means to provide
liqudity assistance to banks, and will not signal the onset of “tightening” .– The announcement of the SPF of US$ 200 billion by Treasury like the discount rate is part of normalization– The FED doing reverse repos with the Agencies or letting natural run off take place will also be part of the
process of driving the fed effective rate up to the floor IEOR or 28bps.
The FED’s operations to reduce and normalize liquidity are likely not to be synonymous with monetary tightening—where removal of the “extended period” language will be key for actual target rate moves and further systematic liquidity removal.
Under a dual mandate progress in employment (even if a lagging indicator) along with inflation expectations will still be key
67
Exit in ECB Monetary Policy
We expect ECB to exit by October in the case of the long term credit facilities or even later.
Delay of exit in this area could imply that the ECB special financing facilities are further extended into 2011, if there is not a more fundamental structural fix to financing arrangements for periphery countries taking tough fiscal actions.
Real and more extensive monetary exit may actually take place from January 2011 onwards. A rate hike might well not occur before Q2 next year.
Greece related problems have already made implementation of any real ECB exit strategy difficult. The ECB will make sure that Greek debt will be eligible as collateral also after next January when old rules (A-) will be reinstated as indicated of late by ECB officials.
We have discerned a softening of views among many of the most hawkish ECB council members given deflation in last 6 months and the problems in periphery countries.
We see inflation and inflation expectations well anchored for at least another year.
Exit for the ECB is relatively easy relative to the US as entails gradual run off of liquidity. However, now with sovereign credit problems the quality of collateral problems can complicate the speed and form of exit.
68
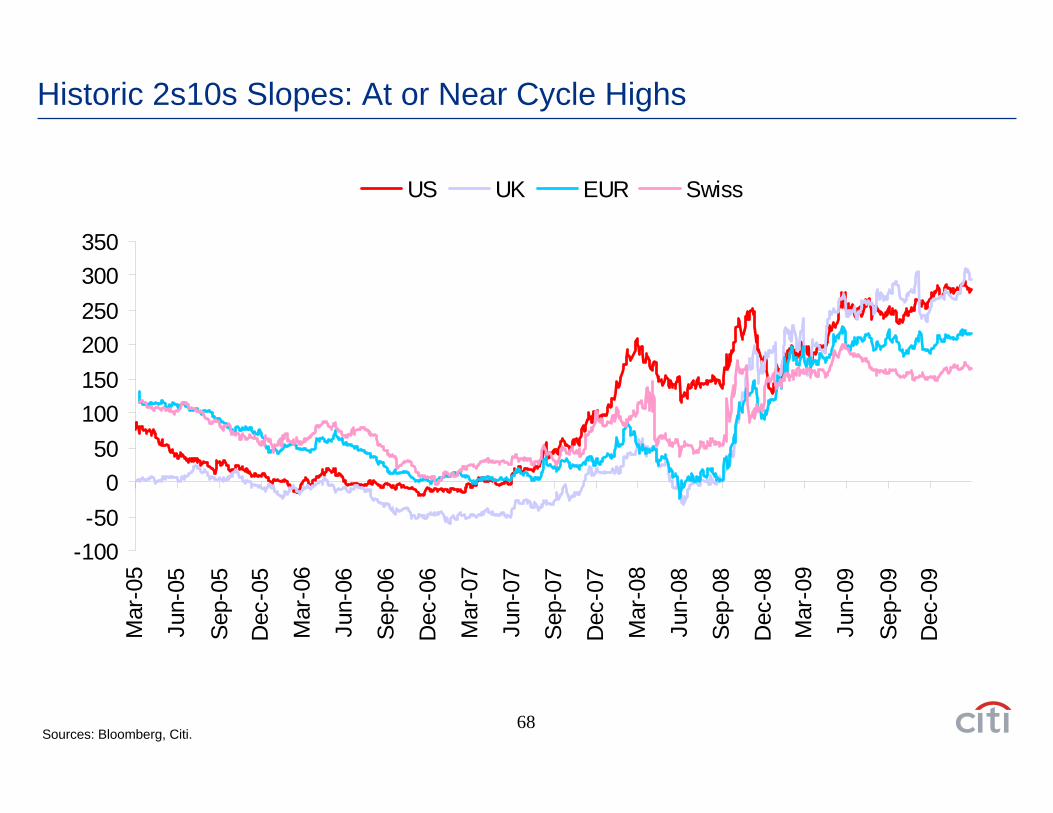
Historic 2s10s Slopes: At or Near Cycle Highs
-100-50
050
100150200250300350
Mar
-05
Jun-
05
Sep-
05
Dec
-05
Mar
-06
Jun-
06
Sep-
06
Dec
-06
Mar
-07
Jun-
07
Sep-
07
Dec
-07
Mar
-08
Jun-
08
Sep-
08
Dec
-08
Mar
-09
Jun-
09
Sep-
09
Dec
-09
US UK EUR Swiss
Sources: Bloomberg, Citi.
69
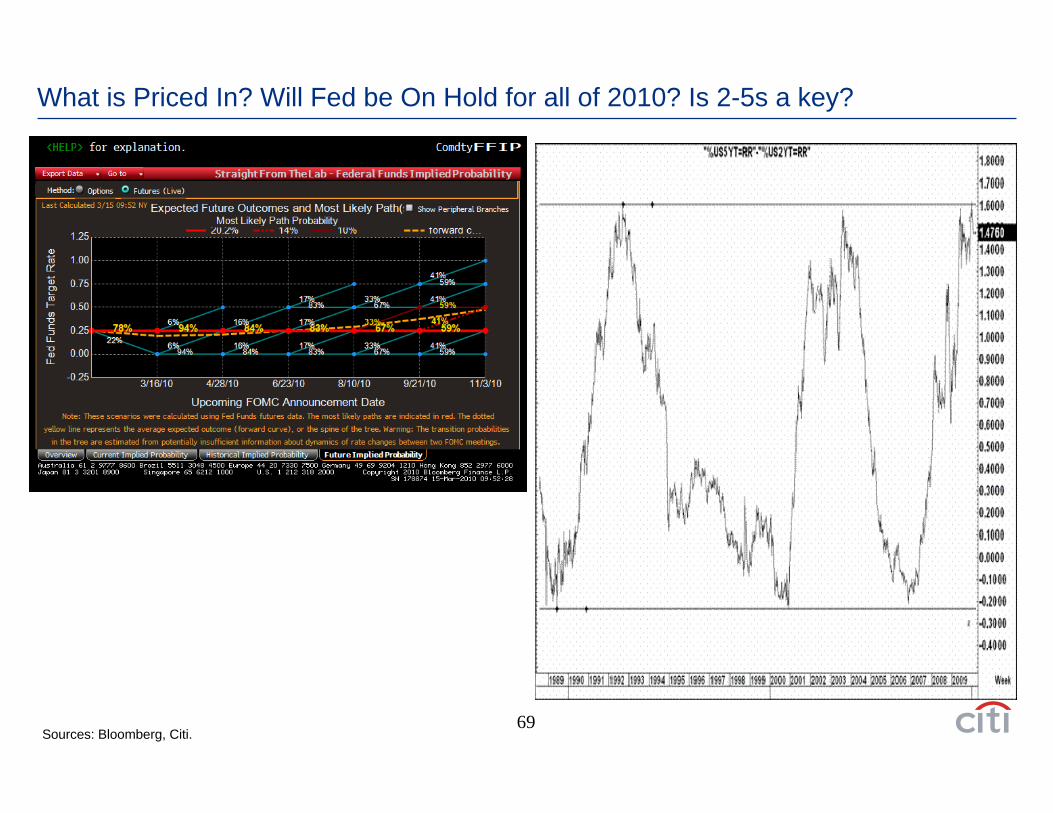
What is Priced In? Will Fed be On Hold for all of 2010? Is 2-5s a key?
Sources: Bloomberg, Citi.
70
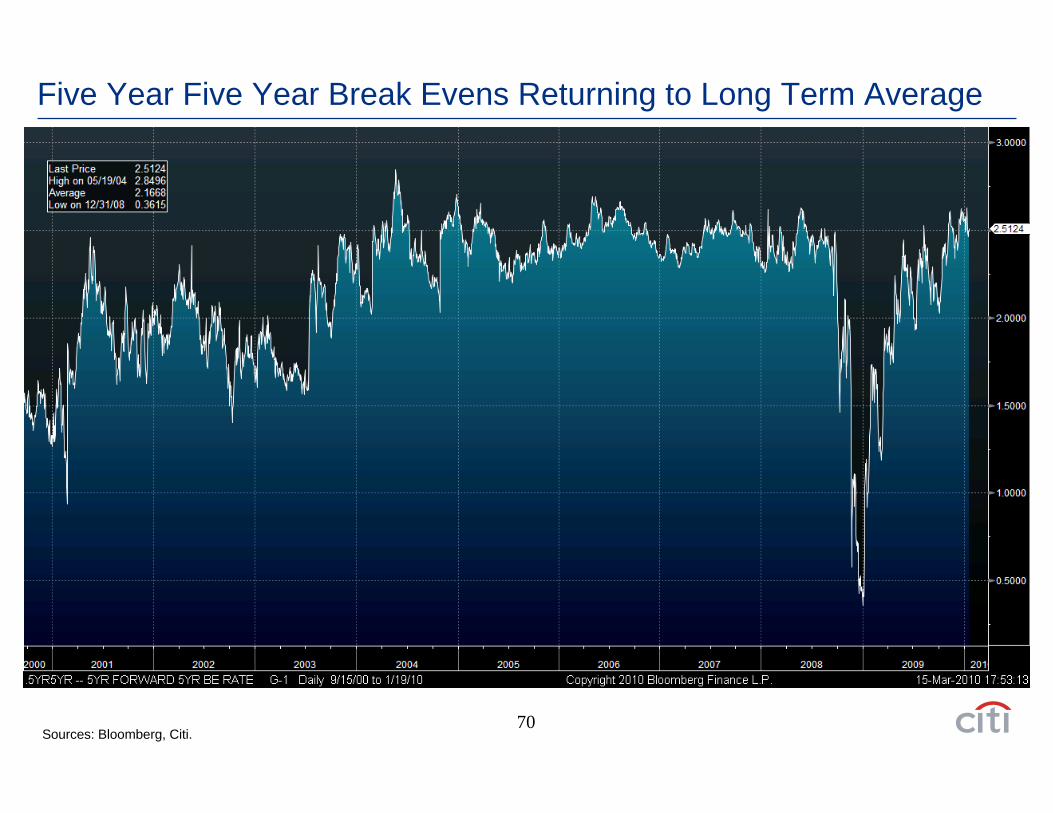
Five Year Five Year Break Evens Returning to Long Term Average
Sources: Bloomberg, Citi.
Implication of Exit in China
72
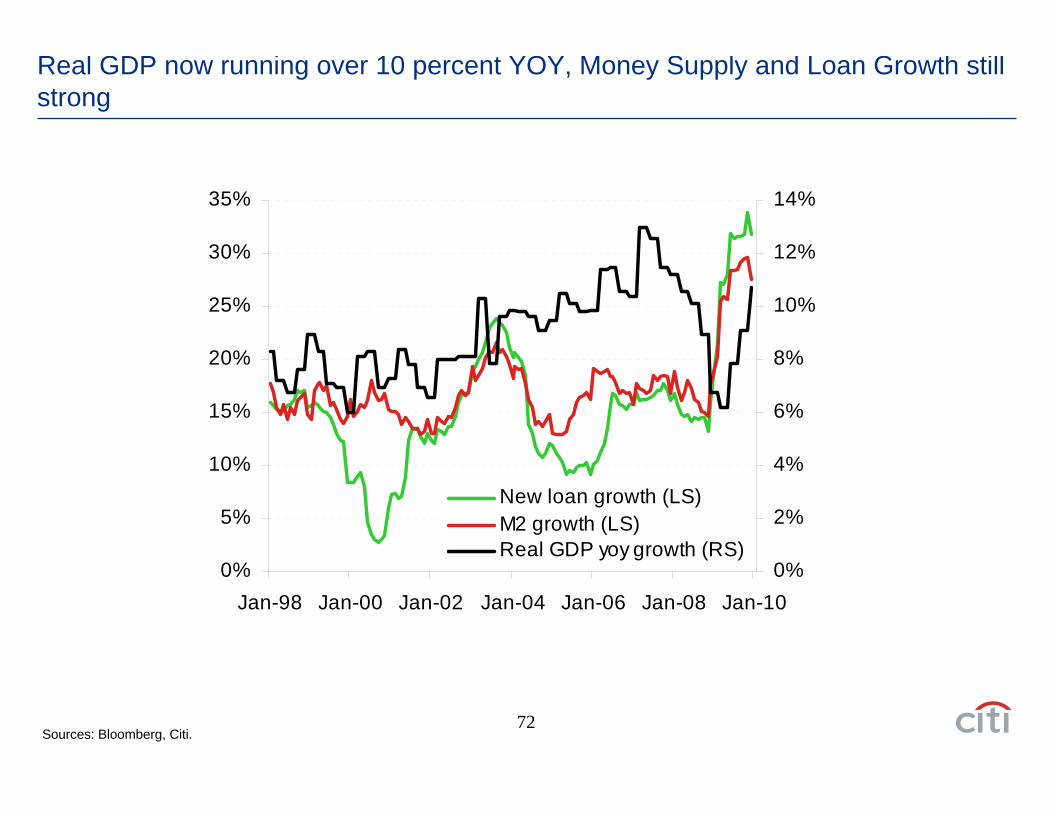
Real GDP now running over 10 percent YOY, Money Supply and Loan Growth still strong
0%
5%
10%
15%
20%
25%
30%
35%
Jan-98 Jan-00 Jan-02 Jan-04 Jan-06 Jan-08 Jan-100%
2%
4%
6%
8%
10%
12%
14%
New loan growth (LS)M2 growth (LS)Real GDP yoy growth (RS)
Sources: Bloomberg, Citi.
73
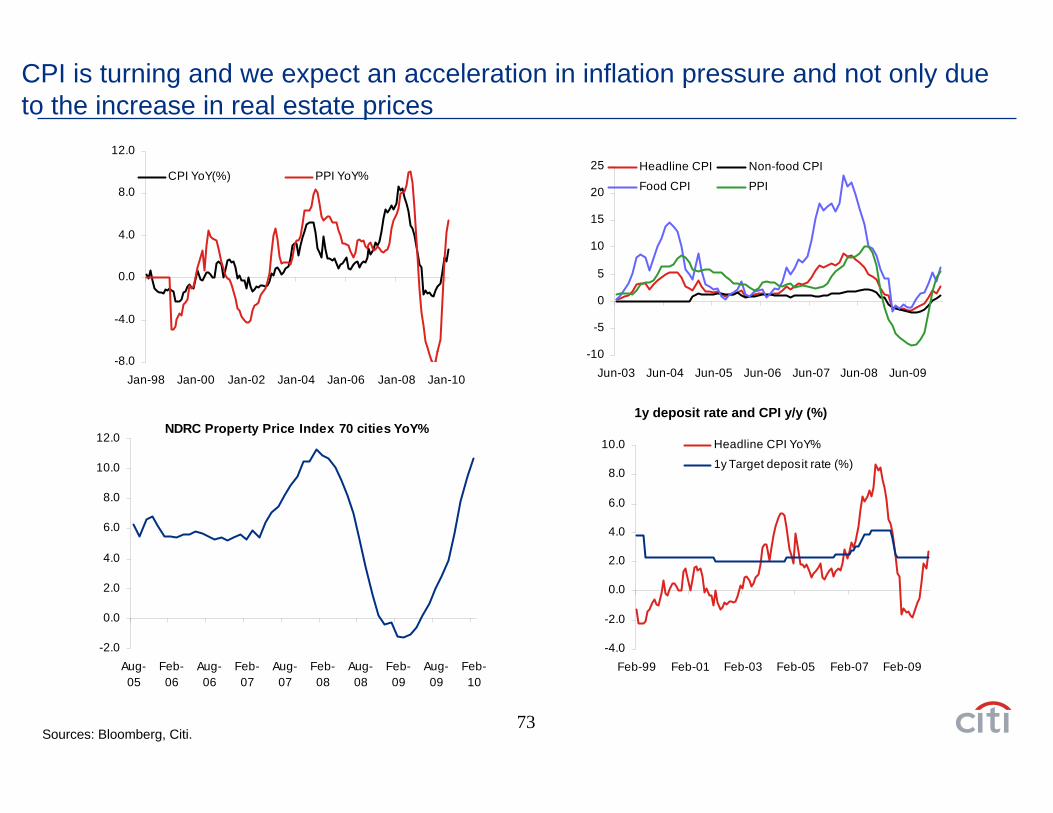
CPI is turning and we expect an acceleration in inflation pressure and not only due to the increase in real estate prices
-8.0
-4.0
0.0
4.0
8.0
12.0
Jan-98 Jan-00 Jan-02 Jan-04 Jan-06 Jan-08 Jan-10
CPI YoY(%) PPI YoY%
-10
-5
0
5
10
15
20
25
Jun-03 Jun-04 Jun-05 Jun-06 Jun-07 Jun-08 Jun-09
Headline CPI Non-food CPI
Food CPI PPI
NDRC Property Price Index 70 cities YoY%
-2.0
0.0
2.0
4.0
6.0
8.0
10.0
12.0
Aug-05
Feb-06
Aug-06
Feb-07
Aug-07
Feb-08
Aug-08
Feb-09
Aug-09
Feb-10
-4.0
-2.0
0.0
2.0
4.0
6.0
8.0
10.0
Feb-99 Feb-01 Feb-03 Feb-05 Feb-07 Feb-09
Headline CPI YoY%
1y Target deposit rate (%)
1y deposit rate and CPI y/y (%)
Sources: Bloomberg, Citi.
74
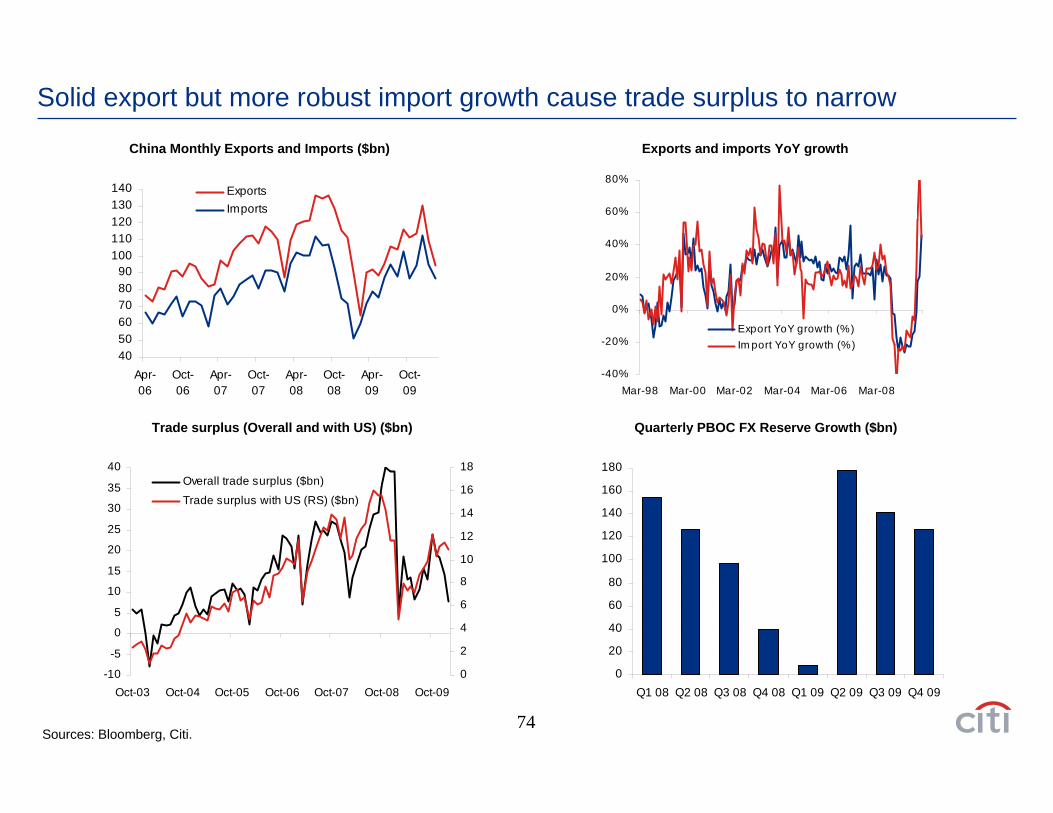
Solid export but more robust import growth cause trade surplus to narrow
405060708090
100110120130140
Apr-06
Oct-06
Apr-07
Oct-07
Apr-08
Oct-08
Apr-09
Oct-09
Exports Imports
China Monthly Exports and Imports ($bn)
-40%
-20%
0%
20%
40%
60%
80%
Mar-98 Mar-00 Mar-02 Mar-04 Mar-06 Mar-08
Export YoY growth (%)Im port YoY growth (%)
Exports and imports YoY growth
-10
-5
0
5
10
15
20
25
30
35
40
Oct-03 Oct-04 Oct-05 Oct-06 Oct-07 Oct-08 Oct-090
2
4
6
8
10
12
14
16
18Overall trade surplus ($bn)
Trade surplus with US (RS) ($bn)
Trade surplus (Overall and with US) ($bn)
0
20
40
60
80
100
120
140
160
180
Q1 08 Q2 08 Q3 08 Q4 08 Q1 09 Q2 09 Q3 09 Q4 09
Quarterly PBOC FX Reserve Growth ($bn)
Sources: Bloomberg, Citi.
75
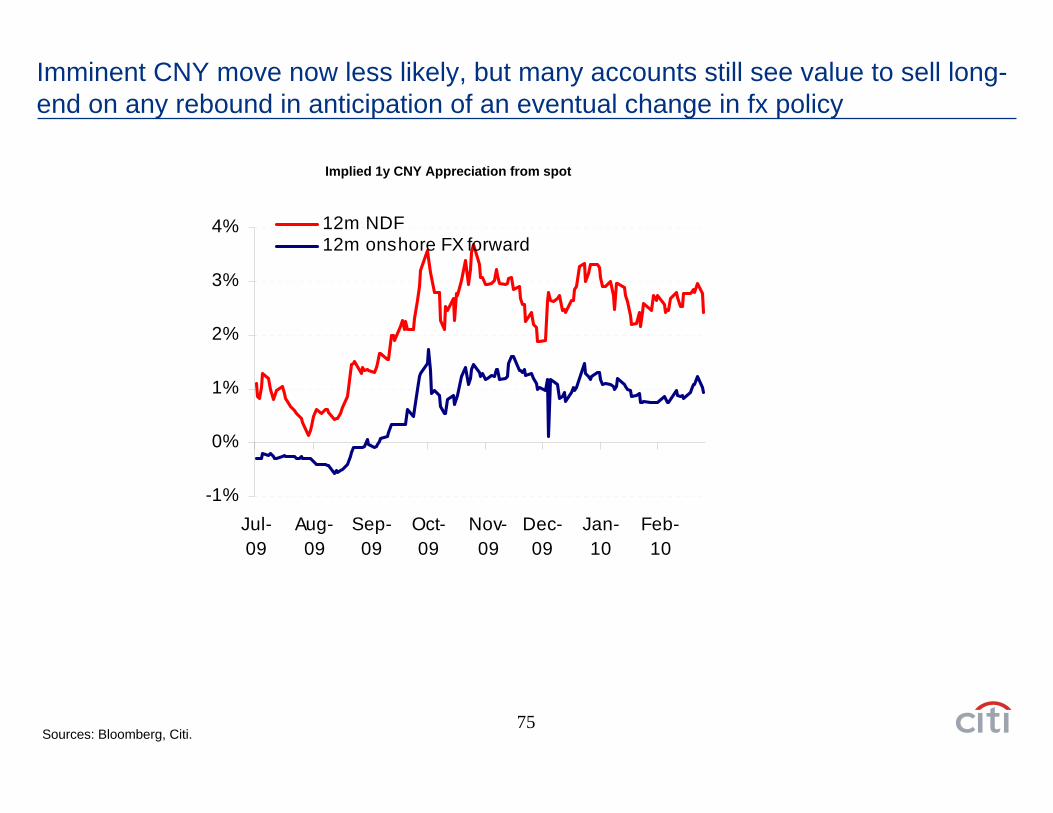
Imminent CNY move now less likely, but many accounts still see value to sell long-end on any rebound in anticipation of an eventual change in fx policy
-1%
0%
1%
2%
3%
4%
Jul-09
Aug-09
Sep-09
Oct-09
Nov-09
Dec-09
Jan-10
Feb-10
12m NDF12m onshore FX forward
Implied 1y CNY Appreciation from spot
Sources: Bloomberg, Citi.
76
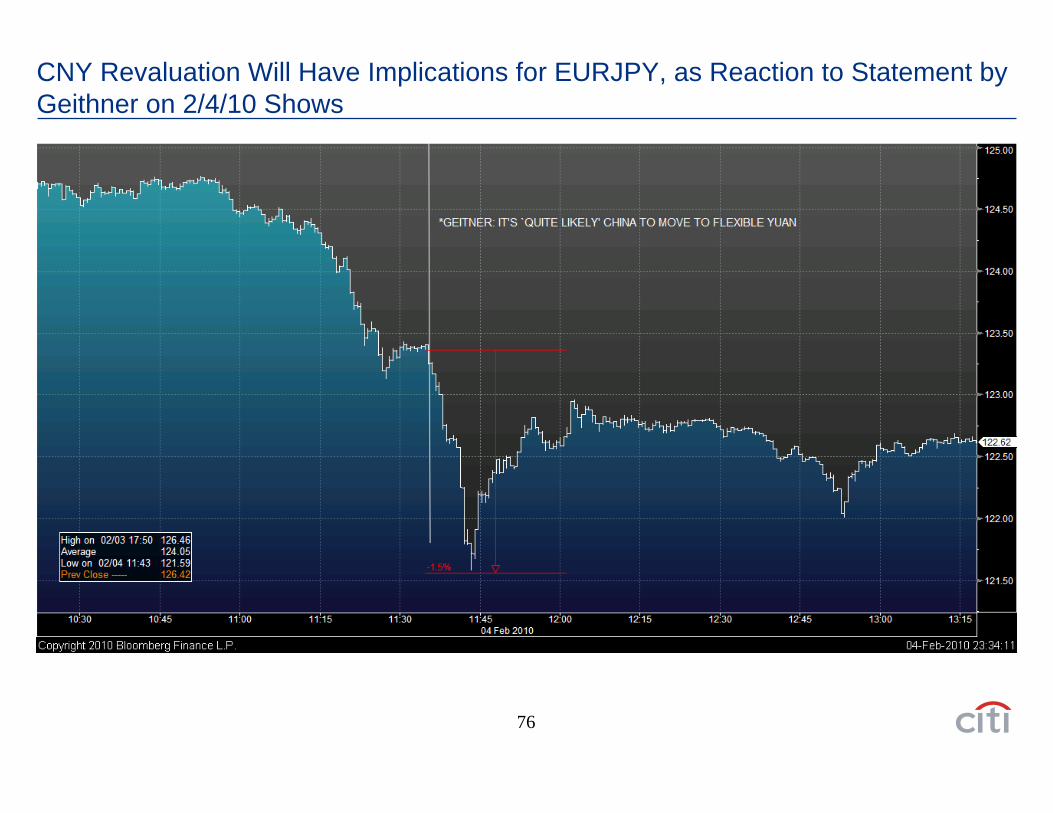
CNY Revaluation Will Have Implications for EURJPY, as Reaction to Statement by Geithner on 2/4/10 Shows
77
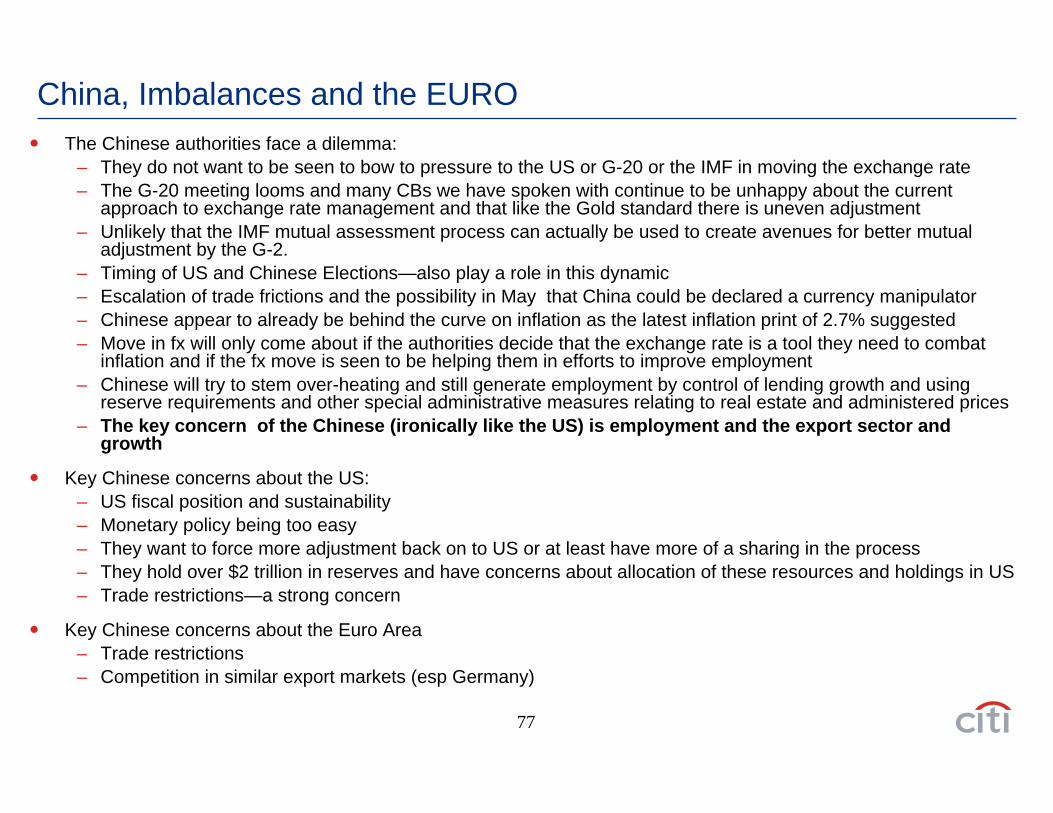
China, Imbalances and the EUROThe Chinese authorities face a dilemma:
– They do not want to be seen to bow to pressure to the US or G-20 or the IMF in moving the exchange rate– The G-20 meeting looms and many CBs we have spoken with continue to be unhappy about the current
approach to exchange rate management and that like the Gold standard there is uneven adjustment– Unlikely that the IMF mutual assessment process can actually be used to create avenues for better mutual
adjustment by the G-2.– Timing of US and Chinese Elections—also play a role in this dynamic– Escalation of trade frictions and the possibility in May that China could be declared a currency manipulator – Chinese appear to already be behind the curve on inflation as the latest inflation print of 2.7% suggested– Move in fx will only come about if the authorities decide that the exchange rate is a tool they need to combat
inflation and if the fx move is seen to be helping them in efforts to improve employment– Chinese will try to stem over-heating and still generate employment by control of lending growth and using
reserve requirements and other special administrative measures relating to real estate and administered prices – The key concern of the Chinese (ironically like the US) is employment and the export sector and
growth
Key Chinese concerns about the US:– US fiscal position and sustainability– Monetary policy being too easy – They want to force more adjustment back on to US or at least have more of a sharing in the process– They hold over $2 trillion in reserves and have concerns about allocation of these resources and holdings in US– Trade restrictions—a strong concern
Key Chinese concerns about the Euro Area– Trade restrictions – Competition in similar export markets (esp Germany)
Policy Risks and Interventions and the Euro
79
54% 73
%
64%
58%
50%
49%
44%60
%69%
54% 63
% 80%
36%
33%
25%
31%
33% 42
% 49%
40% 42% 62
%
54% 73
%
020406080
100
Bank
s
Auto
mot
ive
Med
iaC
ompa
nies
Insu
ranc
e
Ente
rtain
men
t
Hea
lth C
are
Indu
stry
Ret
ail
Ener
gy
Phar
ma
Biot
ech/
Life
Scie
nces
CPG
Man
ufac
ture
rs
Tech
nolo
gy
2008 2009
(33) (27)
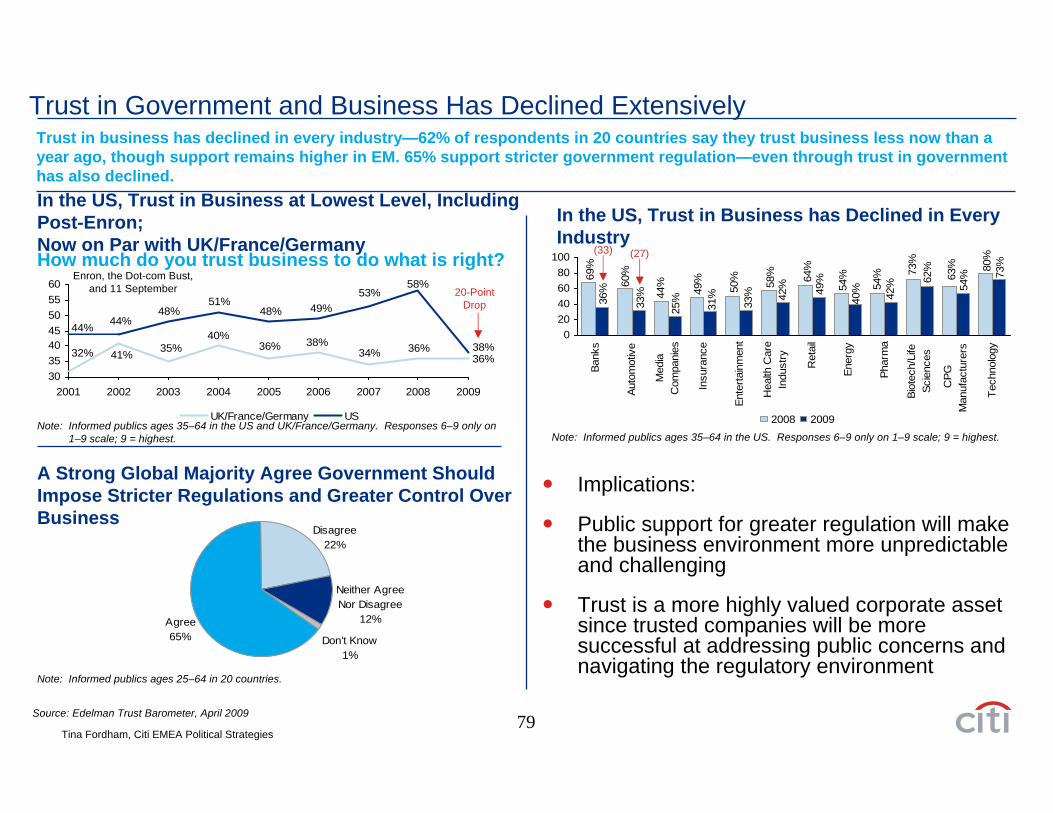
Trust in Government and Business Has Declined Extensively
In the US, Trust in Business at Lowest Level, Including Post-Enron; Now on Par with UK/France/GermanyHow much do you trust business to do what is right?
In the US, Trust in Business has Declined in Every Industry
58%
36%34%38%36%
40%35%
36%41%32%
53%49%48%
51%48%
44%44%
38%
30354045505560
2001 2002 2003 2004 2005 2006 2007 2008 2009
UK/France/Germany US
20-PointDrop
Enron, the Dot-com Bust,and 11 September
A Strong Global Majority Agree Government Should Impose Stricter Regulations and Greater Control Over Business
Neither Agree Nor Disagree
12%Agree65%
Disagree22%
Don’t Know1%
Note: Informed publics ages 35–64 in the US and UK/France/Germany. Responses 6–9 only on 1–9 scale; 9 = highest. Note: Informed publics ages 35–64 in the US. Responses 6–9 only on 1–9 scale; 9 = highest.
Note: Informed publics ages 25–64 in 20 countries.
Trust in business has declined in every industry—62% of respondents in 20 countries say they trust business less now than a year ago, though support remains higher in EM. 65% support stricter government regulation—even through trust in government has also declined.
Source: Edelman Trust Barometer, April 2009
Tina Fordham, Citi EMEA Political Strategies
Implications:
Public support for greater regulation will make the business environment more unpredictable and challenging
Trust is a more highly valued corporate asset since trusted companies will be more successful at addressing public concerns and navigating the regulatory environment
80
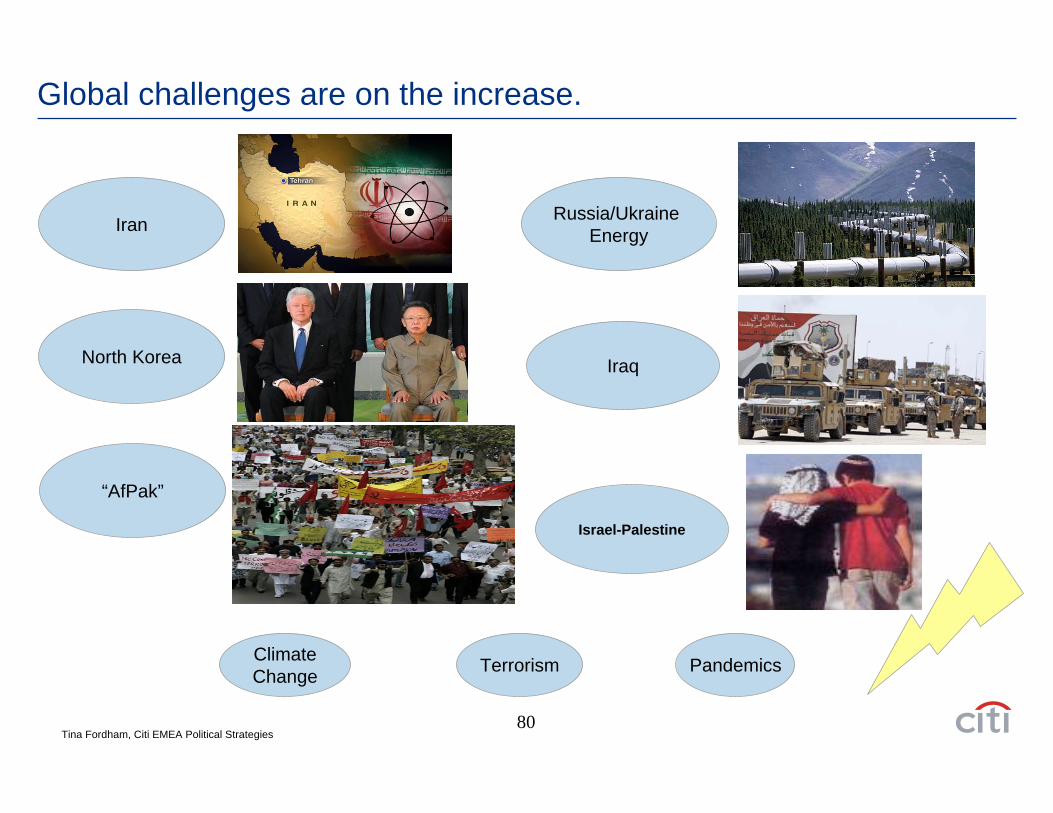
Global challenges are on the increase.
Iran
North Korea
“AfPak”
Russia/Ukraine Energy
Tina Fordham, Citi EMEA Political Strategies
TerrorismClimateChange Pandemics
Iraq
Israel-Palestine
81
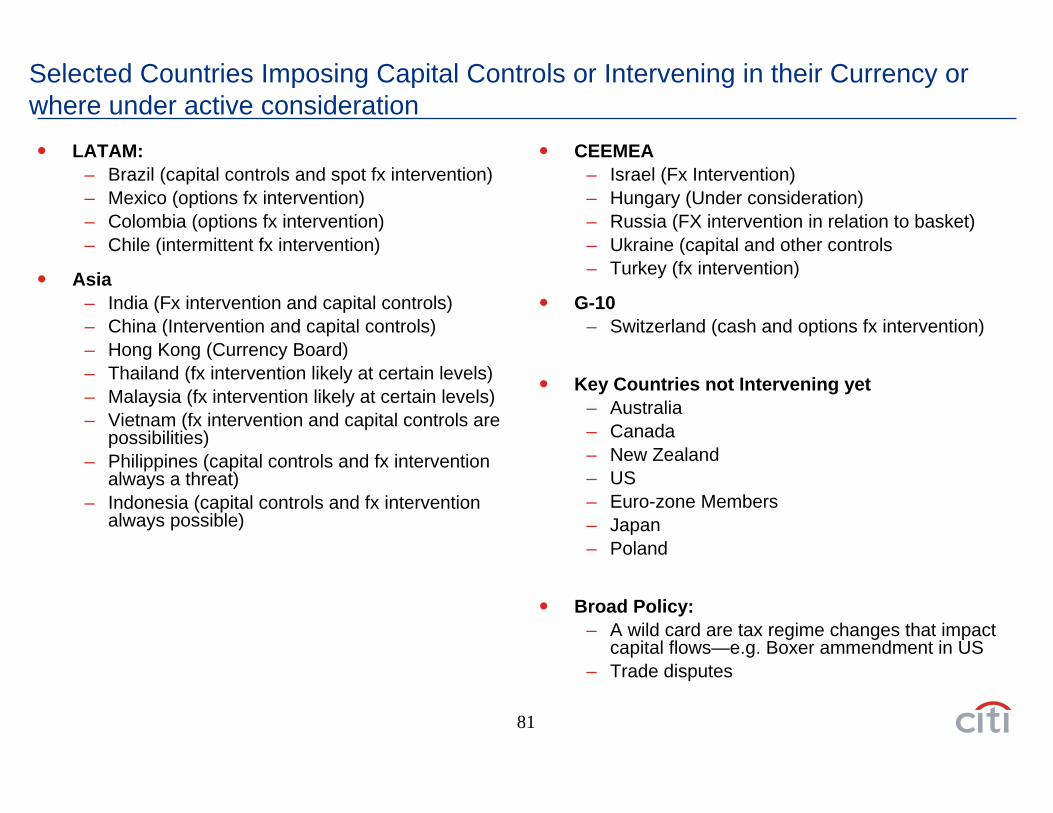
Selected Countries Imposing Capital Controls or Intervening in their Currency or where under active consideration
LATAM:– Brazil (capital controls and spot fx intervention)– Mexico (options fx intervention)– Colombia (options fx intervention)– Chile (intermittent fx intervention)
Asia– India (Fx intervention and capital controls)– China (Intervention and capital controls)– Hong Kong (Currency Board)– Thailand (fx intervention likely at certain levels)– Malaysia (fx intervention likely at certain levels)– Vietnam (fx intervention and capital controls are
possibilities)– Philippines (capital controls and fx intervention
always a threat)– Indonesia (capital controls and fx intervention
always possible)
CEEMEA– Israel (Fx Intervention)– Hungary (Under consideration)– Russia (FX intervention in relation to basket)– Ukraine (capital and other controls– Turkey (fx intervention)
G-10– Switzerland (cash and options fx intervention)
Key Countries not Intervening yet– Australia– Canada– New Zealand– US– Euro-zone Members– Japan– Poland
Broad Policy:– A wild card are tax regime changes that impact
capital flows—e.g. Boxer ammendment in US– Trade disputes
82
This communication is issued by a member of the sales and trading department of Citigroup Global Markets Inc. or one of its affiliates (collectively, “Citi”). Sales and trading department personnel are not research analysts, and the information in this communication (“Communication”) is not intended to constitute “research” as that term is defined by applicable regulations. Unless otherwise indicated, any reference to a research report or research recommendation is not intended to represent the whole report and is not in itself considered a recommendation or research report. All views, opinions and estimates expressed in this Communication (i) may change without notice and (ii) may differ from those views, opinions and estimates held or expressed by Citi or other Citi personnel.
This Communication is provided for information and discussion purposes only. Unless otherwise indicated, it does not constitute an offer or solicitation to purchase or sell any financial instruments or other products and is not intended as an official confirmation of any transaction. Unless otherwise expressly indicated, this Communication does not take into account the investment objectives or financial situation of any particular person. Recipients of this Communication should obtain advice based on their own individual circumstances from their own tax, financial, legal and other advisors before making an investment decision, and only make such decisions on the basis of the investor's own objectives, experience and resources. The information contained in this Communication is based on generally available information and, although obtained from sources believed by Citi to be reliable, its accuracy and completeness cannot be assured, and such information may be incomplete or condensed. Citi often acts as an issuer of financial instruments and other products, acts as a market maker and trades as principal in many different financial instruments and other products, and can be expected to perform or seek to perform investment banking and other services for the issuer of such financial instruments or other products. The author of this Communication may have discussed the information contained therein with others within or outside Citi and the author and/or such other Citi personnel may have already acted on the basis of this information (including by trading for Citi's proprietary accounts or communicating the information contained herein to other customers of Citi). Citi, Citi's personnel (including those with whom the author may have consulted in the preparation of this communication), and other customers of Citi may be long or short the financial instruments or other products referred to in this Communication, may have acquired such positions at prices and market conditions that are no longer available, and may have interests different from or adverse to your interests.
Investments in financial instruments or other products carry significant risk, including the possible loss of the principal amount invested. Financial instruments or other products denominated in a foreign currency are subject to exchange rate fluctuations, which may have an adverse effect on the price or value of an investment in such products. No liability is accepted by Citi for any loss (whether direct, indirect or consequential) that may arise from any use of the information contained in or derived from this Communication.Past performance is not a guarantee or indication of future results. Any prices provided in this Communication (other than those that are identified as being historical) are indicative only and do not represent firm quotes as to either price or size. You should contact your local representative directly if you are interested in buying or selling any financial instrument or other product or pursuing any trading strategy that may be mentioned in this Communication. Although Citibank, N.A. (together with its subsidiaries and branches worldwide, "Citibank") is an affiliate of Citi, you should be aware that none of the financial instruments or other products mentioned in this Communication (unless expressly stated otherwise) are (i) insured by the Federal Deposit Insurance Corporation or any other governmental authority, or (ii) deposits or other obligations of, or guaranteed by, Citibank or any other insured depository institution. IRS Circular 230 Disclosure: Citi and its employees are not in the business of providing, and do not provide, tax or legal advice to any taxpayer outside of Citi.
Any statements in this Communication to tax matters were not intended or written to be used, and cannot be used or relied upon, by any taxpayer for the purpose of avoiding tax penalties. Any such taxpayer should seek advice based on the taxpayer’s particular circumstances from an independent tax advisor. © 2009 Citigroup Global Markets Inc. Member SIPC. All rights reserved. Citi and Citi and Arc Design are trademarks and service marks of Citigroup Inc. or its affiliates and are used and registered throughout the world.
Disclaimer