Embed Size (px)
Citation preview

FINANCIAL MARKETS SERIES
BOND MARKETSOCTOBER 2012

TheCityUK champions the international competitiveness of the financial andprofessional services industry. Created in 2010, we support the whole of the sector,promoting UK financial and professional services at home and overseas and playing anactive role in the regulatory and trade policy debate.
TheCityUK has a global export focus with a commitment to help UK based firms growtheir business in other parts of the world. In 2010, the financial services industryaccounted for 9% of UK GDP and 12% of UK tax receipts. The sector currentlyemploys more than 1 million people, more than 66% of whom work outside London, and underpins the businesses that drive jobs and growth. Added together with nearly 1 million employed in professional services, it is easy to see the importance of a sector that employs 7% of the working population.
TheCityUK provides constructive advice and is the practitioner voice on trade policyand all aspects of taxation, regulation, and other legislative matters that affect thecompetitiveness of the sector. We conduct extensive research and run a national andinternational events programme to inform the debate. Our senior team regularlyengages with regulators and policymakers at home and overseas, ensuring the sector’sviews are represented at the highest levels. We are tasked with creating a new visionfor the financial services sector. We are focused on supporting policymakers andbusiness to deliver the new policy ideas which will help deliver growth.

BOND MARKETSOCTOBER 2012
The importance of bond markets as a source offinance has increased during the economic slowdownas companies have diversified away from reliance onbanks for funding and many governments also haveincreased borrowing. This report provides an overviewof the global bond market with particular emphasis onthe UK’s role as one of the largest centres for issuanceand trading of international bonds.
SUMMARYThe amounts outstanding on the global bond market totalled a record $100 trillion in March 2012, up 2% on twelve months earlier (Chart 1).Domestic bond markets accounted for 70% of the total, and internationalbonds for the remainder. The considerable growth in the size of the globalbond market over the past decade means that in March 2012 it was almosttwice the size of the global equity market which had a market capitalisationof around $53 trillion. As a proportion of global GDP, the world bondmarket increased to over 140% from around 80% a decade earlier. The USwas the largest market in March 2012 accounting for 33% of the valueoutstanding. It was followed by Japan 14%, the UK and France witharound 6% each.
Domestic bonds The global outstanding value of domestic bondsincreased by 2% in the twelve months to March 2012 to $70 trillion. Thiswas primarily due to strong government bond issuance during this period(Chart 2).
Government bonds accounted for 61% of the outstanding value ofdomestic bonds in March 2012, up from around a half in 2009. Demandfor government bonds in many countries has been strong since the start ofthe economic downturn as investors avoided more risky investments.
Concerns about the ability of some countries to continue to finance theirdebt have come to the forefront since 2009. Three countries significantlyaffected, Greece, Ireland and Portugal, collectively accounted for 6% of theeurozone's gross domestic product. Since June 2012, Spain has alsobecome a matter of concern, as rising interest rates have begun to affect itsability to access capital markets, leading to a bailout of its banks and othermeasures. While sovereign debt increases have been most pronounced inonly a few Euro area countries, they have become a problem for the area asa whole. Increasing concern about the ability of some countries to repaydebt, has resulted in a significant widening of their government bondyields. On the other hand, countries perceived as having a low sovereign
www.thecityuk.com 1
Amounts outstanding onthe global bond market
reach a record
Chart 1 World bond market
$bn, amounts outstanding1
1 Includes bonds, notes and money market instruments; 2 MarchSource: Bank for International Settlements
0
10,000
20,000
30,000
40,000
50,000
60,000
70,000
80,000
90,000
100,000
20122
20112010
20092008
20072006
20052004
20032002
International
Domestic
30%
80%
20%
70%
Chart 2 Domestic bond markets, annual change in stocks
$bn, annual change in stocks
Source: Bank for International Settlements
-2,000
-1,500
-1,000
-500
0
500
1,000
1,500
2,000
2,500
3,000
3,500
4,000
Corporate issuers
Financial institutions
Governments
20112010
20092008
20072006
20052004
20032002
2001
$100 trillion
2 www.thecityuk.com
BOND MARKETS OCTOBER 2012
Chart 3 Issuance on international bond market
$bn, net issues
Source: Bank for International Settlements
0
500
1,000
1,500
2,000
2,500
3,000
q2q1q4q3q2q1201120092007200520032001
annual quarterly
2011 2012
credit risk have seen their borrowing costs fall.
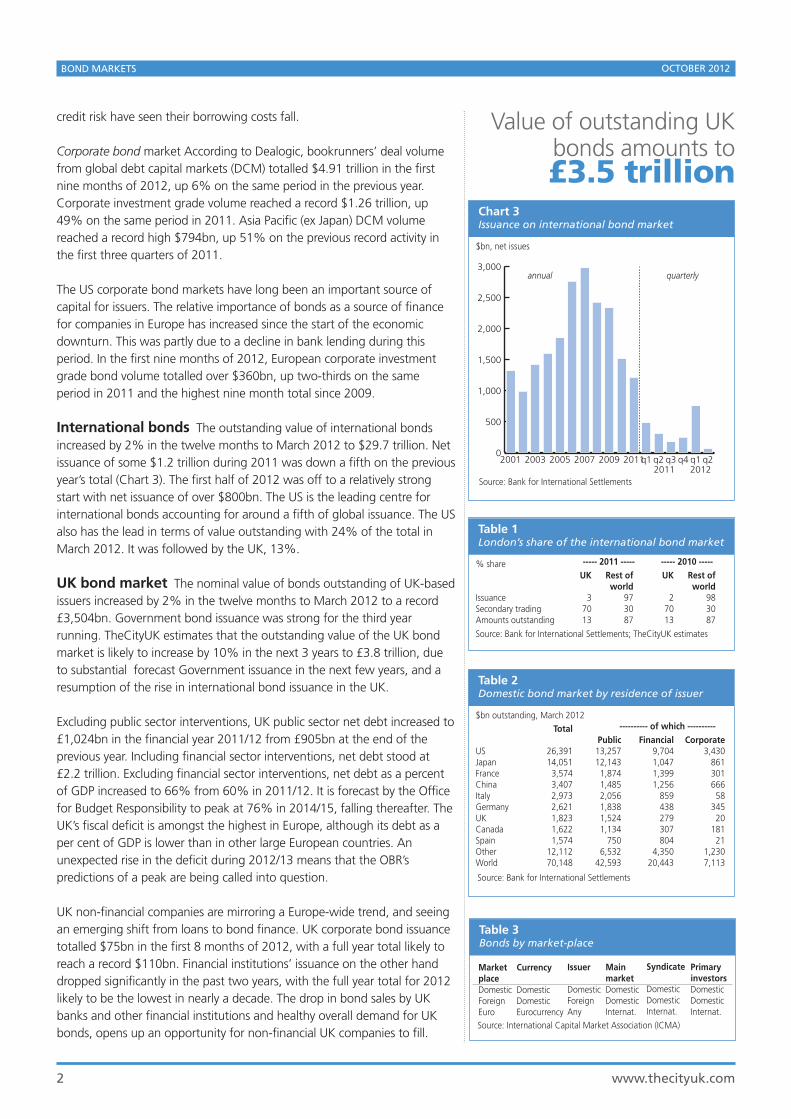
Corporate bond market According to Dealogic, bookrunners’ deal volumefrom global debt capital markets (DCM) totalled $4.91 trillion in the firstnine months of 2012, up 6% on the same period in the previous year.Corporate investment grade volume reached a record $1.26 trillion, up49% on the same period in 2011. Asia Pacific (ex Japan) DCM volumereached a record high $794bn, up 51% on the previous record activity inthe first three quarters of 2011.
The US corporate bond markets have long been an important source ofcapital for issuers. The relative importance of bonds as a source of financefor companies in Europe has increased since the start of the economicdownturn. This was partly due to a decline in bank lending during thisperiod. In the first nine months of 2012, European corporate investmentgrade bond volume totalled over $360bn, up two-thirds on the sameperiod in 2011 and the highest nine month total since 2009.
International bonds The outstanding value of international bondsincreased by 2% in the twelve months to March 2012 to $29.7 trillion. Netissuance of some $1.2 trillion during 2011 was down a fifth on the previousyear’s total (Chart 3). The first half of 2012 was off to a relatively strongstart with net issuance of over $800bn. The US is the leading centre forinternational bonds accounting for around a fifth of global issuance. The USalso has the lead in terms of value outstanding with 24% of the total inMarch 2012. It was followed by the UK, 13%.
UK bond market The nominal value of bonds outstanding of UK-basedissuers increased by 2% in the twelve months to March 2012 to a record£3,504bn. Government bond issuance was strong for the third yearrunning. TheCityUK estimates that the outstanding value of the UK bondmarket is likely to increase by 10% in the next 3 years to £3.8 trillion, dueto substantial forecast Government issuance in the next few years, and aresumption of the rise in international bond issuance in the UK.
Excluding public sector interventions, UK public sector net debt increased to£1,024bn in the financial year 2011/12 from £905bn at the end of theprevious year. Including financial sector interventions, net debt stood at£2.2 trillion. Excluding financial sector interventions, net debt as a percentof GDP increased to 66% from 60% in 2011/12. It is forecast by the Officefor Budget Responsibility to peak at 76% in 2014/15, falling thereafter. TheUK’s fiscal deficit is amongst the highest in Europe, although its debt as aper cent of GDP is lower than in other large European countries. Anunexpected rise in the deficit during 2012/13 means that the OBR’spredictions of a peak are being called into question.
UK non-financial companies are mirroring a Europe-wide trend, and seeingan emerging shift from loans to bond finance. UK corporate bond issuancetotalled $75bn in the first 8 months of 2012, with a full year total likely toreach a record $110bn. Financial institutions’ issuance on the other handdropped significantly in the past two years, with the full year total for 2012likely to be the lowest in nearly a decade. The drop in bond sales by UKbanks and other financial institutions and healthy overall demand for UKbonds, opens up an opportunity for non-financial UK companies to fill.
Table 1 London’s share of the international bond market
% share
Source: Bank for International Settlements; TheCityUK estimates
UK
27013
Rest ofworld
983087
IssuanceSecondary tradingAmounts outstanding
----- 2011 ----- ----- 2010 -----
UK
37013
Rest ofworld
973087
Table 2 Domestic bond market by residence of issuer
$bn outstanding, March 2012
Source: Bank for International Settlements
Total
26,39114,0513,5743,4072,9732,6211,8231,6221,574
12,11270,148
Public13,25712,1431,8741,4852,0561,8381,5241,134
7506,532
42,593
Financial9,7041,0471,3991,256
859438279307804
4,35020,443
Corporate3,430
86130166658
34520
18121
1,2307,113
USJapanFranceChinaItalyGermanyUKCanadaSpainOtherWorld
---------- of which ----------
Value of outstanding UKbonds amounts to£3.5 trillion
Table 3 Bonds by market-place
Source: International Capital Market Association (ICMA)
Currency
DomesticDomesticEurocurrency
MarketplaceDomesticForeignEuro
Issuer
DomesticForeignAny
MainmarketDomesticDomesticInternat.
Syndicate
DomesticDomesticInternat.
PrimaryinvestorsDomesticDomesticInternat.
OCTOBER 2012BOND MARKETS
The UK’s substantial domestic market in bonds is complemented byLondon’s continuing role as a major centre for issuance and the trading ofinternational bonds. London accounts for an estimated 70% of secondarymarket turnover in international bonds. The outstanding value ofinternational bonds issued in the UK has been practically unchanged since2008, after having doubled in value between 2005 and 2008.
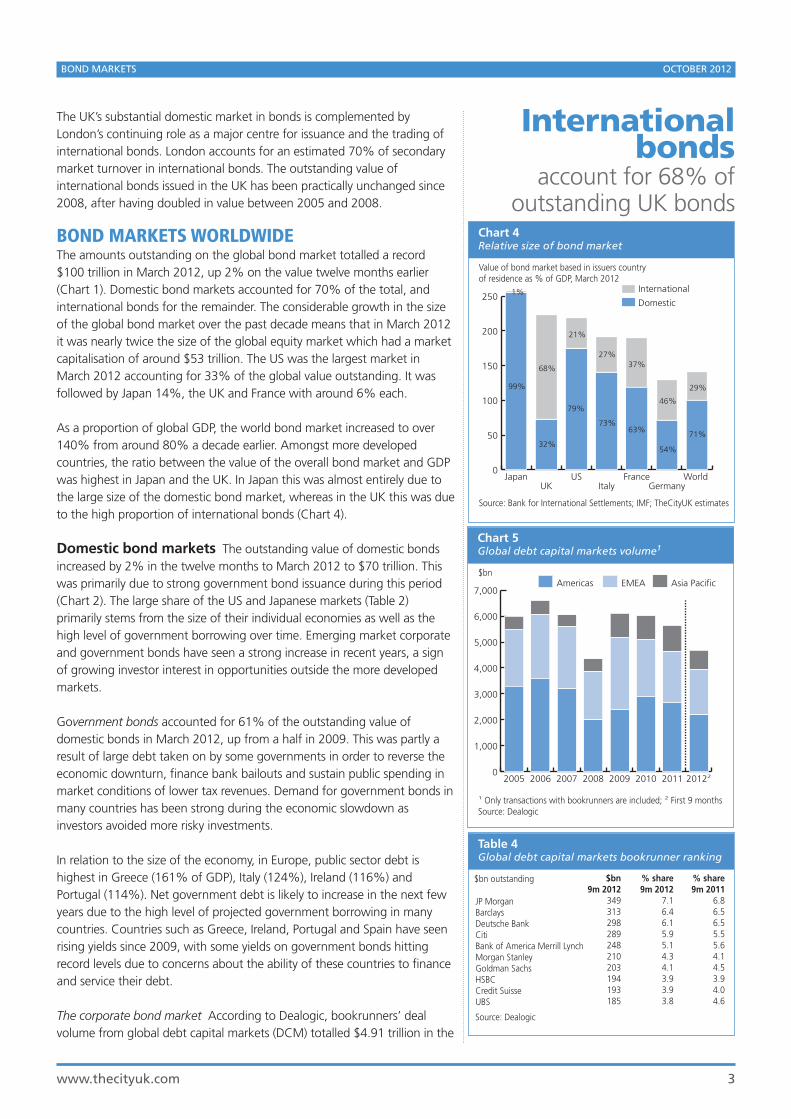
BOND MARKETS WORLDWIDEThe amounts outstanding on the global bond market totalled a record $100 trillion in March 2012, up 2% on the value twelve months earlier(Chart 1). Domestic bond markets accounted for 70% of the total, andinternational bonds for the remainder. The considerable growth in the sizeof the global bond market over the past decade means that in March 2012it was nearly twice the size of the global equity market which had a marketcapitalisation of around $53 trillion. The US was the largest market inMarch 2012 accounting for 33% of the global value outstanding. It wasfollowed by Japan 14%, the UK and France with around 6% each.
As a proportion of global GDP, the world bond market increased to over140% from around 80% a decade earlier. Amongst more developedcountries, the ratio between the value of the overall bond market and GDPwas highest in Japan and the UK. In Japan this was almost entirely due tothe large size of the domestic bond market, whereas in the UK this was dueto the high proportion of international bonds (Chart 4).
Domestic bond markets The outstanding value of domestic bondsincreased by 2% in the twelve months to March 2012 to $70 trillion. Thiswas primarily due to strong government bond issuance during this period(Chart 2). The large share of the US and Japanese markets (Table 2)primarily stems from the size of their individual economies as well as thehigh level of government borrowing over time. Emerging market corporateand government bonds have seen a strong increase in recent years, a signof growing investor interest in opportunities outside the more developedmarkets.
Government bonds accounted for 61% of the outstanding value ofdomestic bonds in March 2012, up from a half in 2009. This was partly aresult of large debt taken on by some governments in order to reverse theeconomic downturn, finance bank bailouts and sustain public spending inmarket conditions of lower tax revenues. Demand for government bonds inmany countries has been strong during the economic slowdown asinvestors avoided more risky investments.
In relation to the size of the economy, in Europe, public sector debt ishighest in Greece (161% of GDP), Italy (124%), Ireland (116%) andPortugal (114%). Net government debt is likely to increase in the next fewyears due to the high level of projected government borrowing in manycountries. Countries such as Greece, Ireland, Portugal and Spain have seenrising yields since 2009, with some yields on government bonds hittingrecord levels due to concerns about the ability of these countries to financeand service their debt.
The corporate bond market According to Dealogic, bookrunners’ dealvolume from global debt capital markets (DCM) totalled $4.91 trillion in the
www.thecityuk.com 3
Chart 4 Relative size of bond market
Source: Bank for International Settlements; IMF; TheCityUK estimates
Value of bond market based in issuers countryof residence as % of GDP, March 2012
0
50
100
150
200
250International
Domestic
World Germany
FranceItaly
USUK
Japan
99%
27%
29%
71%
46%
54%
37%
63%
1%
73%
21%
79%
68%
32%
Internationalbonds
account for 68% ofoutstanding UK bonds
Chart 5 Global debt capital markets volume1
1 Only transactions with bookrunners are included; 2 First 9 monthsSource: Dealogic
$bn
0
1,000
2,000
3,000
4,000
5,000
6,000
7,000Asia PacificEMEAAmericas
201222011201020092008200720062005
Table 4 Global debt capital markets bookrunner ranking
$bn outstanding
Source: Dealogic
$bn9m 2012
349313298289248210203194193185
% share9m 2012
7.16.46.15.95.14.34.13.93.93.8
% share9m 2011
6.86.56.55.55.64.14.53.94.04.6
JP MorganBarclays Deutsche BankCitiBank of America Merrill LynchMorgan StanleyGoldman SachsHSBCCredit SuisseUBS

first nine months of 2012, up 6% on the $4.63 trillion raised in the sameperiod in the previous year. Global corporate investment grade volumetotalled $1.26 trillion, the highest volume on record and up 49% on thesame period in 2011. Asia Pacific (ex Japan) DCM volume reached a record high $794bn, up 51% from the previous record activity betweenJanuary and September 2011. JP Morgan, Barclays and Deutsche Bank were the leading global bookrunners in the first nine months of 2012 (Table 4).
The US bond market is the largest securities market in the world. Its valueoutstanding has doubled in the decade up to 2011 to $37 trillion.Mortgage-backed bonds accounted for $8.4 trillion of this total, Treasurybonds for $9.9 trillion and corporate debt $7.9 trillion. Most of the remainder was in Federal Agency securities and municipal bonds. Issuance
4 www.thecityuk.com
BOND MARKETS OCTOBER 2012
Chart 7 Euro zone bond yields
%, 10 year government bond yield
1 up to AugustSource: ECB
0
5
10
15
20
25
30
UK
Portugal
Italy
Spain
Greece
Ireland
Germany
201212011201020092008
Chart 8 Europe corporate bonds and corporate loans
$bn
Source: Dealogic; TheCityUK estimate
0
100
200
300
400
500
q3q2q1q4q3q2q1q4q3q2q1q4q3q2q1q4q3q2q1q4q3q2q1
2007 2008 2009 2010 2011 2012
Corporate loans
Corporate bonds
Chart 6 Government budget deficits
1 Excluding financial sector interventionsSource: IMF; Wikipedia; Eurostat
-10 -8 -6 -4 -2 0
Germany
Italy
Euro area
France
UK
Spain
Greece
Ireland
US1
government budgetdeficit as % of GDP, 2011/12
debt as % of GDP, 2011/12
92
91
81
161
116
100
66-6.2%
-1.9%
-3.2%
-4.5%
-6.4%
-6.4%
-0.9%
-8.6%
-8.3%
124
82
European sovereign debt crisis
Government deficits and debt levels have increased as a result of the financialcrisis and subsequent economic downturn. Large amounts raised by somegovernments were largely a result of debt taken to finance bank bailouts,reverse the economic slowdown and sustain public spending in marketconditions of lower tax revenues.
Concerns about the ability of some countries to continue to finance and servicetheir debt have come to the forefront since late 2009. Three countriessignificantly affected, Greece, Ireland and Portugal, collectively accounted for6% of the eurozone's gross domestic product. Since June 2012, Spain has alsobecome a matter of concern, as rising interest rates have begun to affect itsability to access capital markets, leading to a bailout of its banks and othermeasures. While sovereign debt increases have been most pronounced in only afew Euro area countries, they have become a problem for the area as a whole.In some countries where sovereign debts have increased sharply (Chart 7),increased concerns have emerged about their government’s ability to repaydebt.
Concerns about the crisis led Europe's finance ministers in May 2010 to approvea rescue package worth €750 billion aimed at ensuring financial stability acrossEurope by creating the European Financial Stability Facility. In October 2011 andFebruary 2012, eurozone leaders agreed on more measures designed to preventthe collapse of member economies. This included an agreement whereby bankswould accept a 53.5% write-off of Greek debt owed to private creditors,increasing the EFSF to about €1 trillion, and requiring European banks toachieve 9% capitalisation. To restore confidence in Europe, EU leaders alsoagreed to create a European Fiscal Compact including the commitment of eachparticipating country to introduce a balanced budget amendment. Europeanpolicy makers have also proposed greater integration of the EU banking systemwith euro-wide deposit insurance, bank oversight and joint means for therecapitalization or resolution of failing banks.
Greece’s credit rating has been downgraded a number of times since December2009. Other countries with high budget deficits such as Portugal, Ireland,Turkey, Italy and Spain have also seen downgrades. This has resulted in thetightening of market conditions for government refinancing in these countriesand the widening of bond yield spreads between these countries and other EUmembers (Chart 7). The subsequent transmission of sovereign risk to localbanking systems and the wider economy remains a risk. On the other hand,countries perceived as having a low sovereign credit risk, such as Germany andthe US have seen their borrowing costs fall. Even though the US budget deficitand national debt are globally the highest in nominal terms, demand for itsTreasury bonds remains strong due to its traditional safe-haven status.

OCTOBER 2012BOND MARKETS
of US domestic bonds totalled $5.9 trillion in 2011, 10% down on the previous year. Although issuance of Treasury bonds was down by 9% in2011 to $2.1 trillion, it had more than tripled in the three previous years.Mortgage related bond issuance declined for the second year running by over 15% while corporate bond issuance fell slightly.
Corporations use the funds they raise from selling bonds for a variety ofpurposes, from building facilities to purchasing equipment to expandingtheir business. The US corporate bond markets have long been an important source of capital for issuers, with daily trading volume of $21bnand more than 400 mutual funds investing in US high-yield bonds.
In contrast to US companies, European SMEs have historically been relianton bank lending and more vulnerable to its reduced availability. Europe ishowever gradually moving towards a US style bond market and manycompanies are diversifying their funding sources to include bond markets.Stock exchanges across Europe are extending services to bond markets toboost their growth. In February 2010, the London Stock Exchangeintroduced the Order book for Retail Bonds (ORB) in response to growing private investor demand for greater accessibility to fixed incomesecurities.
The relative importance of bonds as a source of finance for companies in Europe has increased since the start of the economic downturn. This was partly due to a decline in bank lending during this period. In the first three quarters of 2012, European corporate investment grade bondvolume totalled over $360bn, up two-thirds on the same period in 2011and the highest nine month total since 2009. At the outset of the creditcrisis, loan volume was five times bond issuance. In the first three quartersof 2012 they were roughly the same. The shift towards bond markets,should it persist, could have important implications for how companies fundthemselves in Europe.
Total European DCM volume totalled around $1.7 trillion in the first nine
www.thecityuk.com 5
Chart 10European DCM, by industry
% share, 2011
Source: Dealogic
Other
Telecoms, 2%Utility & Energy
2%
Government
Finance
Total: $1,518bn
67%16%
13%
Chart 11Bond trading on exchanges
$bn
Source: World Federation of Exchanges
0
5,000
10,000
15,000
20,000
25,000
30,000
35,000
20112010
20092008
20072006
20052004
20032002
2001
Debt securitiesBonds and notes make up around 80% of the global bond market. Nearly four-fifths of this is in domestic securities. The structure of individual domestic markets differs markedly, mostly averaging 10-year maturities. The liquidity oflonger term securities tends to be smaller, although in the US, UK and Francebonds with longer term maturities are also issued and traded on the market.
Money market instruments The money market is an informal network whichhas no physical site where wholesale funds are borrowed and lent for shortperiods. The London Money Market facilitates trading in bills of exchange,certificates of deposit, treasury bills, and commercial paper. Most of trading insuch instruments has been generated by the financial markets in New York,Tokyo, Frankfurt and London.
The international bond market is a wholesale market where around 90% ofbonds are held by institutional investors such as insurance companies, pensionfunds and mutual funds. Bonds are traded on the secondary market, but aremore often purchased and held to maturity. Issuers mostly include largecompanies, national and local governments and international organisations.
Chart 9 Annual European DCM value
$bn1
1 figures are for Europe, Middle East, Africa; 2 to end-SeptemberSource: Dealogic
0
1000
2000
3000
201222011
20102009
20082007
20062005
20042003
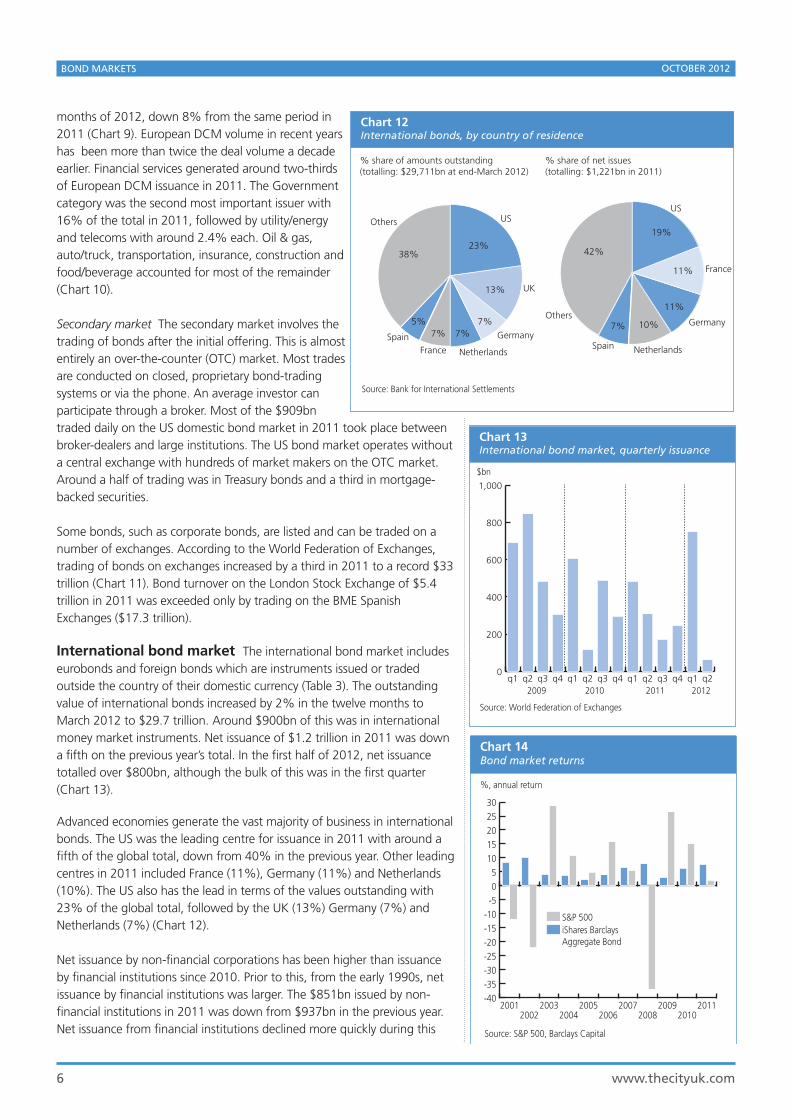
months of 2012, down 8% from the same period in2011 (Chart 9). European DCM volume in recent yearshas been more than twice the deal volume a decadeearlier. Financial services generated around two-thirdsof European DCM issuance in 2011. The Governmentcategory was the second most important issuer with16% of the total in 2011, followed by utility/energyand telecoms with around 2.4% each. Oil & gas,auto/truck, transportation, insurance, construction andfood/beverage accounted for most of the remainder(Chart 10).
Secondary market The secondary market involves thetrading of bonds after the initial offering. This is almostentirely an over-the-counter (OTC) market. Most tradesare conducted on closed, proprietary bond-tradingsystems or via the phone. An average investor canparticipate through a broker. Most of the $909bntraded daily on the US domestic bond market in 2011 took place betweenbroker-dealers and large institutions. The US bond market operates withouta central exchange with hundreds of market makers on the OTC market.Around a half of trading was in Treasury bonds and a third in mortgage-backed securities.
Some bonds, such as corporate bonds, are listed and can be traded on anumber of exchanges. According to the World Federation of Exchanges,trading of bonds on exchanges increased by a third in 2011 to a record $33trillion (Chart 11). Bond turnover on the London Stock Exchange of $5.4trillion in 2011 was exceeded only by trading on the BME SpanishExchanges ($17.3 trillion).
International bond market The international bond market includeseurobonds and foreign bonds which are instruments issued or tradedoutside the country of their domestic currency (Table 3). The outstandingvalue of international bonds increased by 2% in the twelve months toMarch 2012 to $29.7 trillion. Around $900bn of this was in internationalmoney market instruments. Net issuance of $1.2 trillion in 2011 was downa fifth on the previous year’s total. In the first half of 2012, net issuancetotalled over $800bn, although the bulk of this was in the first quarter(Chart 13).
Advanced economies generate the vast majority of business in internationalbonds. The US was the leading centre for issuance in 2011 with around afifth of the global total, down from 40% in the previous year. Other leadingcentres in 2011 included France (11%), Germany (11%) and Netherlands(10%). The US also has the lead in terms of the values outstanding with23% of the global total, followed by the UK (13%) Germany (7%) andNetherlands (7%) (Chart 12).
Net issuance by non-financial corporations has been higher than issuanceby financial institutions since 2010. Prior to this, from the early 1990s, netissuance by financial institutions was larger. The $851bn issued by non-financial institutions in 2011 was down from $937bn in the previous year.Net issuance from financial institutions declined more quickly during this
6 www.thecityuk.com
BOND MARKETS OCTOBER 2012
Chart 13 International bond market, quarterly issuance
$bn
Source: World Federation of Exchanges
0
200
400
600
800
1,000
q2q1q4q3q2q1q4q3q2q1q4q3q2q12012201120102009
Chart 12 International bonds, by country of residence
Source: Bank for International Settlements
Others
SpainFrance Netherlands
Germany
UK
US
Others
Spain Netherlands
Germany
France
US
% share of amounts outstanding(totalling: $29,711bn at end-March 2012)
% share of net issues(totalling: $1,221bn in 2011)
19%
42%
11%
7% 10%
23%
13%
7% 7% 7%
5%
38%
11%
Chart 14Bond market returns
Source: S&P 500, Barclays Capital
%, annual return
-40-35-30-25-20-15-10-505
1015202530
S&P 500iShares BarclaysAggregate Bond
20112010
20092008
20072006
20052004
20032002
2001

OCTOBER 2012BOND MARKETS
period from $564bn to $376bn.
The US dollar accounted for two-thirds of international bond issuance in2011, down from 72% in the previous year. The share of euro denominatedissues decreased to 26% from 42% in the previous year. Straight fixed ratebonds accounted for nearly all issues with floating rates bonds seeing anoutflow of $60bn, a result of borrowers adjusting their debt profile to lockin low funding costs. Equity related bonds either in the form of convertiblesor equity warrants remain an important niche market.
Secondary trading Secondary trading in the international bond market hasincreased over the past decade in line with the growing volume of issuesand increase in electronic trading. TheCityUK estimates that trading ininternational bonds probably grew ten-fold during the past decade to some$80 trillion in 2011. London is the leading centre for international bondtrading with an estimated 70% of secondary market turnover.
Bond market returns Bonds generally display less volatility thanequities. The Barclays Capital Aggregate Bond Index, which includes USGovernment, corporate and mortgage-backed securities with maturities ofat least one year returned 7.7% in 2010, up from 6.4% in the previousyear. (Chart 14). Since the start of the decade, the index has consistentlydelivered a positive return, fluctuating between 2.4% and 11.7%. Duringthis period the S&P 500 index moved between an annual gain of 29% andloss of 37%.
While there is retail investment interest, trading of bonds in value terms ismainly institutional. Factors such as the rate of inflation, the state ofgovernment finances and monetary policy all affect returns. Bond returnsare however, primarily subject to movements in interest rates. Upwardmoves in interest rates, for example, erode the value of fixed payments tobe received in the future, thereby reducing the value of a bond. Localcurrency movements also affect bond market returns.
The attraction of bonds as an investment has grown during the economicslowdown as institutional investors looked for less risky assets in volatilemarket conditions. Risk aversion and flight to quality has particularlyincreased demand for government bonds, mainly in countries traditionallyseen as more financially stable. Corporate bonds on the other hand haveoffered the potential for high returns. Yields among such bonds can differsubstantially based on the perceived credit risk of the individual corporationand the outlook for the profitability and competitiveness of its sector.
BOND MARKETS IN THE UKThe value of bonds outstanding of UK-based issuers totalled a record£3,550bn in March 2012, up 2% on twelve months earlier (Chart 15).Government bonds issuance was strong during this period while theoutstanding value of international bonds increased only marginally for thethird year running, after having doubled in value between 2005 and 2008.TheCityUK estimates that the outstanding value of the UK bond market islikely to increase by 10% in the next 3 years to £3.8 trillion, due tosubstantial forecast Government issuance in the next few years, and aresumption of the rise in international bond issuance in the UK. Thedemand for UK bonds has been strong, partly due to the UK’s status as a
www.thecityuk.com 7
Chart 16 UK international bond issuance
£bn, net issues
Source: Bank for International Settlements, TheCityUK estimates
-100
0
100
200
300
400
500
q2q1q4q32011
20102009
20082007
20062005
20042003
2002
annual quarterly
2011 2012
Chart 15 Size of the bond market in the UK
£bn outstanding by residence of issuer
1 to MarchSource: Bank for International Settlements, TheCityUK estimates
0
500
1,000
1,500
2,000
2,500
3,000
3,500
201212011201020092008200720062005200420032002
International
Government
Financial
Corporate
2%15%
28%
55%
68%
27%
5% <1%
Chart 17 UK Government net borrowing
Source: Office for National Statistics; OECD
£bn, net borrowing (bars)
0
20
40
60
80
100
120
140
160
11/1210/11
09/1008/09
07/0806/07
05/0604/05
03/0402/03
2
4
6
8
10
12
UK Governmentdeficit as per cent of GDP (line)
relative safe-heaven in Europe. Gilts have benefited from the eurozonecrisis, with yields falling to record lows. This has had a positive effect onsterling-denominated corporate bond sales.
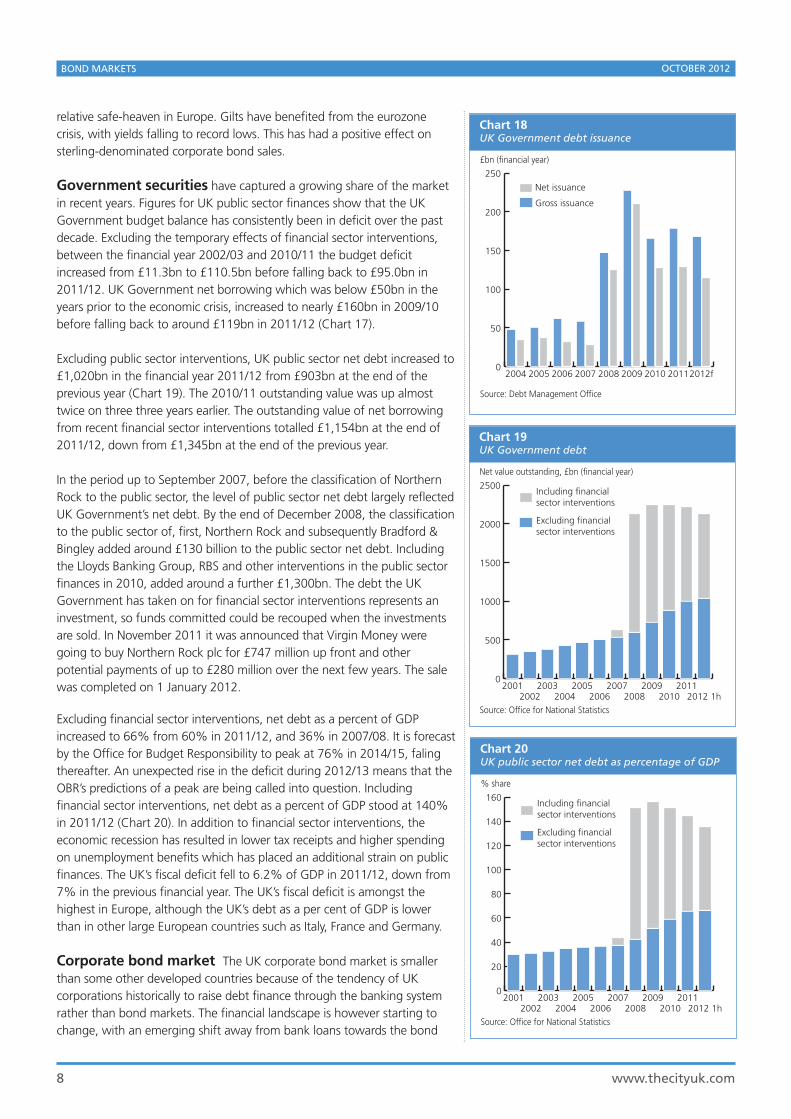
Government securities have captured a growing share of the marketin recent years. Figures for UK public sector finances show that the UKGovernment budget balance has consistently been in deficit over the pastdecade. Excluding the temporary effects of financial sector interventions,between the financial year 2002/03 and 2010/11 the budget deficitincreased from £11.3bn to £110.5bn before falling back to £95.0bn in2011/12. UK Government net borrowing which was below £50bn in theyears prior to the economic crisis, increased to nearly £160bn in 2009/10before falling back to around £119bn in 2011/12 (Chart 17).
Excluding public sector interventions, UK public sector net debt increased to£1,020bn in the financial year 2011/12 from £903bn at the end of theprevious year (Chart 19). The 2010/11 outstanding value was up almosttwice on three three years earlier. The outstanding value of net borrowingfrom recent financial sector interventions totalled £1,154bn at the end of2011/12, down from £1,345bn at the end of the previous year.
In the period up to September 2007, before the classification of NorthernRock to the public sector, the level of public sector net debt largely reflectedUK Government’s net debt. By the end of December 2008, the classificationto the public sector of, first, Northern Rock and subsequently Bradford &Bingley added around £130 billion to the public sector net debt. Includingthe Lloyds Banking Group, RBS and other interventions in the public sectorfinances in 2010, added around a further £1,300bn. The debt the UKGovernment has taken on for financial sector interventions represents aninvestment, so funds committed could be recouped when the investmentsare sold. In November 2011 it was announced that Virgin Money weregoing to buy Northern Rock plc for £747 million up front and otherpotential payments of up to £280 million over the next few years. The salewas completed on 1 January 2012.
Excluding financial sector interventions, net debt as a percent of GDPincreased to 66% from 60% in 2011/12, and 36% in 2007/08. It is forecastby the Office for Budget Responsibility to peak at 76% in 2014/15, falingthereafter. An unexpected rise in the deficit during 2012/13 means that theOBR’s predictions of a peak are being called into question. Includingfinancial sector interventions, net debt as a percent of GDP stood at 140%in 2011/12 (Chart 20). In addition to financial sector interventions, theeconomic recession has resulted in lower tax receipts and higher spendingon unemployment benefits which has placed an additional strain on publicfinances. The UK’s fiscal deficit fell to 6.2% of GDP in 2011/12, down from7% in the previous financial year. The UK’s fiscal deficit is amongst thehighest in Europe, although the UK’s debt as a per cent of GDP is lowerthan in other large European countries such as Italy, France and Germany.
Corporate bond market The UK corporate bond market is smallerthan some other developed countries because of the tendency of UKcorporations historically to raise debt finance through the banking systemrather than bond markets. The financial landscape is however starting tochange, with an emerging shift away from bank loans towards the bond
8 www.thecityuk.com
BOND MARKETS OCTOBER 2012
Chart 18 UK Government debt issuance
Source: Debt Management Office
£bn (financial year)
0
50
100
150
200
250
Net issuance
Gross issuance
2012f20112010200920082007200620052004
Chart 19 UK Government debt
Source: Office for National Statistics
Net value outstanding, £bn (financial year)
0
500
1000
1500
2000
2500Including financialsector interventions
Excluding financialsector interventions
2012 1h2011
20102009
20082007
20062005
20042003
20022001
Chart 20 UK public sector net debt as percentage of GDP
Source: Office for National Statistics
% share
0
20
40
60
80
100
120
140
160Including financialsector interventions
Excluding financialsector interventions
2012 1h2011
20102009
20082007
20062005
20042003
20022001

OCTOBER 2012BOND MARKETS
market and other forms of finance for non-financial companies.
The outstanding value of domestic UK corporate bonds totalled £13bn inMarch 2012. The outstanding value of domestic bonds of commercialbanks and other financial institutions was much larger at £175bn, butdown from £195bn at the end of 2010. The drop in bond sales by banksand other financial institutions and healthy overall demand for UK bonds,opens up an opportunity for non-financial UK companies to fill. Bondmarkets have become a more important source of finance for UKcompanies since the start of the economic slowdown (Chart 21). Largedeals in 2012 included bond market issues by Saab Miller Holdings, Arkle,Glaxo Smith Kline, Holmes and Fosse (Table 5). As the volume of corporatebond issuance rises, yields on corporate debt are falling. The falling cost ofbond issuance contrasts with rising costs for bank loans.
UK DCM issuance totalled $328bn in 2011, up on $307bn in 2010 and$258bn in 2008. The first eight months of 2012 saw issuance of some$230bn. The financial sector accounted for around a half of the 2012issuance, followed by Government 17%. Utility/energy and telecomsaccounted for around 5% each. UK corporate bond issuance totalled$75bn in the first 8 months of 2012, with a full year total likely to reach arecord $110bn. Financial institutions’ issuance on the other hand droppedsignificantly in the past two years, with the full year total for 2012 likely tobe the lowest in nearly a decade.
While the institutional bond market provides larger companies with analternative to the loan market, the smaller funding needs of SMEs havetypically made it more difficult to attract traditional fixed-income buyers. To help fill that gap, the London Stock Exchange (LSE) opened an electronicretail bond trading platform in 2010, the Order Book for Retail Bonds(ORB). This has helped to open up the UK corporate bond market to retailinvestors and increase transparency and liquidity in this market. The ORBhas been used by companies like Provident Financial, Tesco Personal FinancePLC, Places for People and National Grid to access capital. The ORB offerscontinuous, transparent, two-way tradable prices in nearly 150 individualUK gilts, supranational and corporate bonds, all tradable in typicaldenominations of £1,000 or less.
International bond issues in the UK totalled £24bn in 2011, slightly upfrom the previous year but well down from peak issuance of £494bn in2008. The first half of 2012 was however off to a stronger start with net
www.thecityuk.com 9
Chart 22 Annual UK DCM value
$bn
1 to end-AugustSource: Dealogic
0
100
200
300
400
500
201212011
20102009
20082007
20062005
20042003
Chart 21 UK corporate bonds and corporate loans
$bn
Source: Dealogic
0
20
40
60
80
100
120
q2q1q4q3q2q1q4q3q2q1q4q3q2q1q4q3q2q1q4q3q2q1
2007 2008 2009 2010 2011 2012
Syndicated loans
DCM
International bond trading in the UKThe market for international bonds in the UK is distinct from the domesticmarket. These bonds are typically traded over-the-counter. Since the beginningof the Euromarkets, the International Capital Market Association (ICMA) hasfacilitated the interaction between issuers, lead managers, dealers andinvestors. ICMA has been approved by the HM Treasury as an ‘internationalsecurities self-regulating organization’ (ISSRO) in the UK. ICMA is the only bodyto be accorded ISSRO status. ICMA has been designated by the UK FinancialServices Authority as a Designated Investment Exchange (DIE). It issues the rulesand recommendations which form a framework for trading in internationaldebt and related securities as well as for the clearing and settlement of tradesin such securities.
Chart 23UK DCM, by industry
% share, first 8 months 2012
Source: Dealogic
Other
Telecoms
Utility & Energy
Government
Finance
Total: $231bn
50%
17%
23%
5%
5%

issuance totalling nearly £60bn (Chart 16). The outstanding value ofinternational bonds in the UK totalled around £2.4 trillion at the end of2011, some 13% of the global total and second only to the US. Eurobondsaccount for around three-quarters of the UK total. London is the leadingcentre for international bond trading with an estimated 70% of secondarymarket turnover.
Dealing in UK bonds Turnover of UK Government debt and otherfixed interest securities totalled £5.8 trillion in 2011, up from £4.7 trillion in2010, but still down on peak activity of £8.8 in 2009 (Chart 24). Primarydealing in government securities is handled by Gilt-Edged Market Makers. AGilt-edged Market Maker is a primary dealer in gilts and actively trades in either conventional gilts, index-linked gilts or both. Inter-dealer brokers actas intermediaries for anonymous trading between market makers.
As well as UK government bonds, there are a variety of other domesticfixed interest securities that can be traded on the London Stock Exchange.These include fixed interest convertible and preference shares and otherbonds issued by companies, local authorities and banks. The remainingfixed interest securities include Commonwealth government stocks andsome preference and convertible shares.
10 www.thecityuk.com
BOND MARKETS OCTOBER 2012
Chart 24London Stock Exchange turnover in bonds
Source: London Stock Exchange
£bn
0
1,000
2,000
3,000
4,000
5,000
6,000
7,000
8,000
9,000
20112010
20092008
20072006
20052004
20032002
2001
Intra-market
Customer52%
48%
45%
55%
Table 5 Largest UK DCM deals
Source: Dealogic
Generalindustry
Food & beverageFinance
HealthcareFinanceFinance
$mvalue6,9746,2464,9774,3234,102
SAAB Miller Holdings IncArkle Master Issuer plcGlaxo Smith Kline Capital plcHolmes Master Issuer plc Fosse Master Issuer plc
OCTOBER 2012BOND MARKETS
www.thecityuk.com 11
LINKS TO OTHER SOURCES OF INFORMATION
Bank for International Settlementswww.bis.org
Dealogicwww.dealogic.com
Debt Management Officewww.dmo.gov.uk
European Commissionwww.ec.europa.eu
Financial Services Authoritywww.fsa.gov.uk
International Capital Market Association (ICMA)www.icmagroup.org
International Monetary Fundwww.imf.org
London Stock Exchangewww.londonstockexchange.com
National Statisticswww.statistics.gov.uk
Securities Industry and Financial Markets Associationwww.sifma.org
World Federation of Exchangeswww.world-exchanges.org

12 www.thecityuk.com
BOND MARKETS OCTOBER 2012


SIGN UP FOR NEW REPORTSIf you would like to receive immediate notification by email of new TheCityUK reports onthe day of release please send your email address to [email protected]
DATAFILESDatafiles in Excel format for all charts and tables published in this report can bedownloaded from the Reports section of TheCityUK’s website www.thecityuk.com
THECITYUK RESEARCH CENTRE:Report author: Marko Maslakovic
For further information about our work, or to comment on the programme/reports,please contact:
Duncan McKenzie, Head of [email protected], +44 (0)20 7776 8976
Marko Maslakovic, Economic Research Senior [email protected], +44 (0)20 7776 8977
TheCityUK, 65a Basinghall Street, EC2V 5DZ www.thecityuk.com© Copyright October 2012, TheCityUK
This report is based upon material in TheCityUK’s possession or supplied to us, which we believe to be reliable.Whilst every effort has been made to ensure its accuracy, we cannot offer any guarantee that factual errors maynot have occurred. Neither TheCityUK nor any officer or employee thereof accepts any liability or responsibility forany direct or indirect damage, consequential or other loss suffered by reason of inaccuracy or incorrectness. Thispublication is provided to you for information purposes and is not intended as an offer or solicitation for thepurchase or sale of any financial instrument, or as the provision of financial advice. Copyright protection exists inthis publication and it may not be reproduced or published in another format by any person, for any purpose.Please cite source when quoting. All rights are reserved.
MEMBERSHIPTo find out more about TheCityUK and the benefits of membership visitwww.thecityuk.com or email us at [email protected]