Embed Size (px)
Citation preview
1Copyright © 2013. Infor. All Rights Reserved. www.infor.comCopyright © 2013. Infor. All Rights Reserved. www.infor.com 1
Financial Overview
April 2015
2Copyright © 2013. Infor. All Rights Reserved. www.infor.com
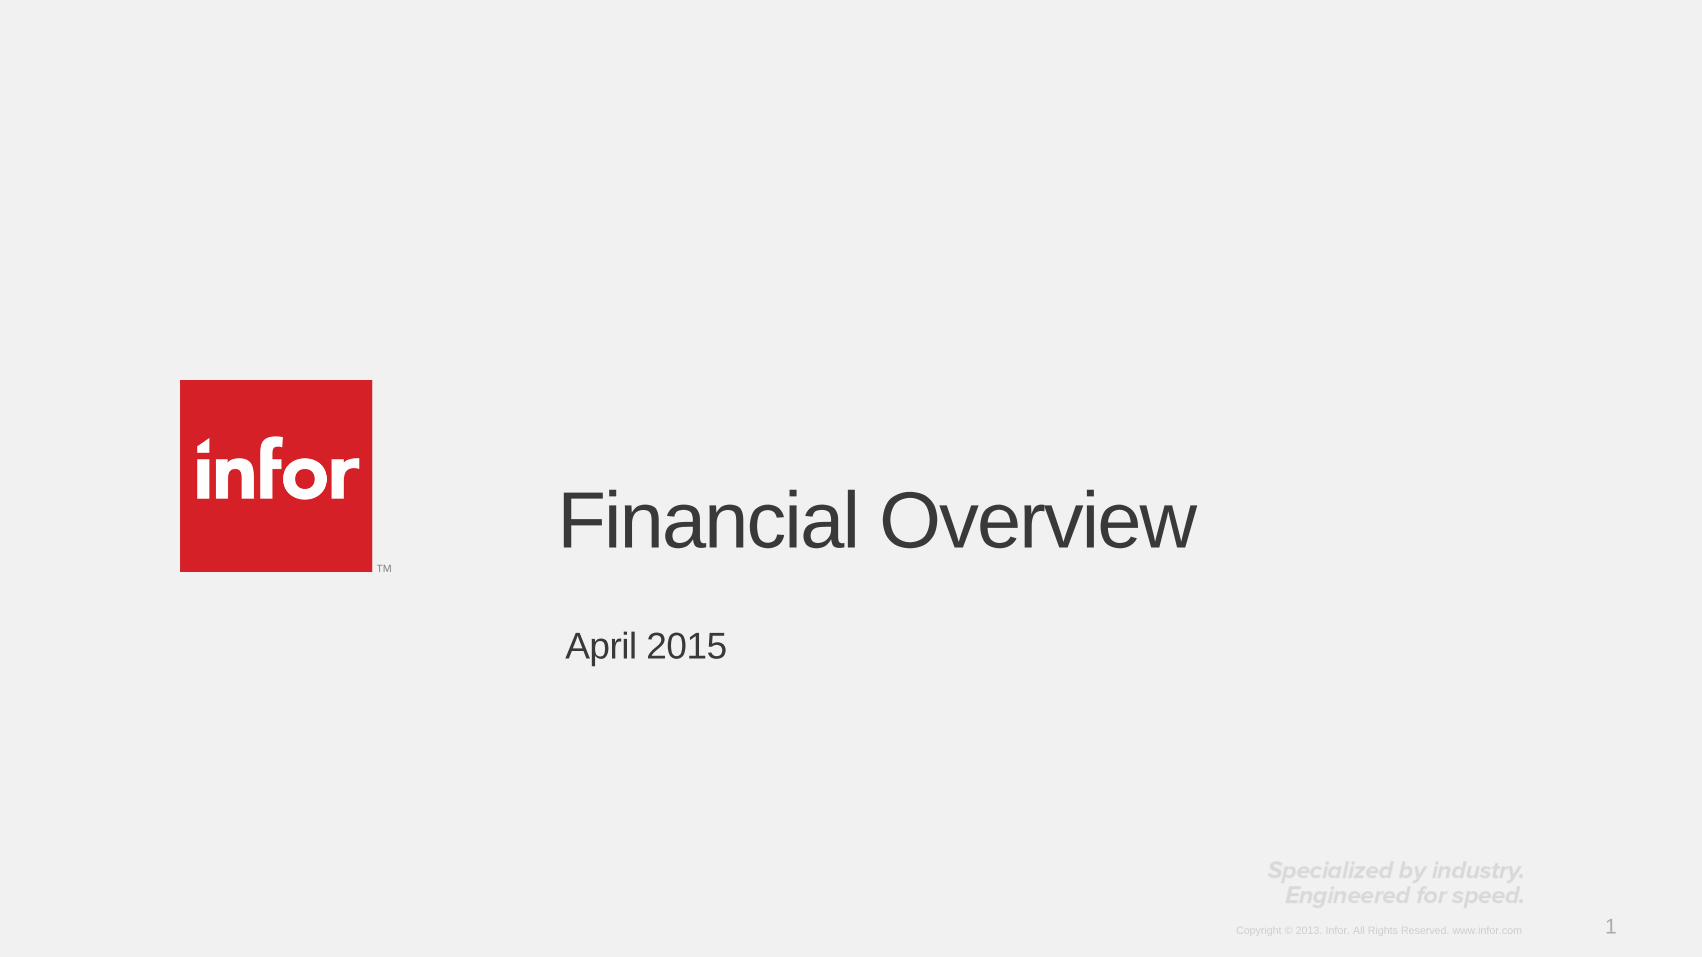
Infor Overview
one of the world’s
largest providers
of enterprise
software and
services
3,770developers
3,480consultants
1,620support
engineers
$786Madjusted EBITDA
FY15 LTM*
pro forma
45Mcloud users
3,444new customers
in FY15
12,790employees
$2.8Btotal revenue
FY15 LTM*
pro forma
18%growth net new
license bookings
(ACV)
* LTM = Last twelve months ended April 30, 2015
3Copyright © 2013. Infor. All Rights Reserved. www.infor.com
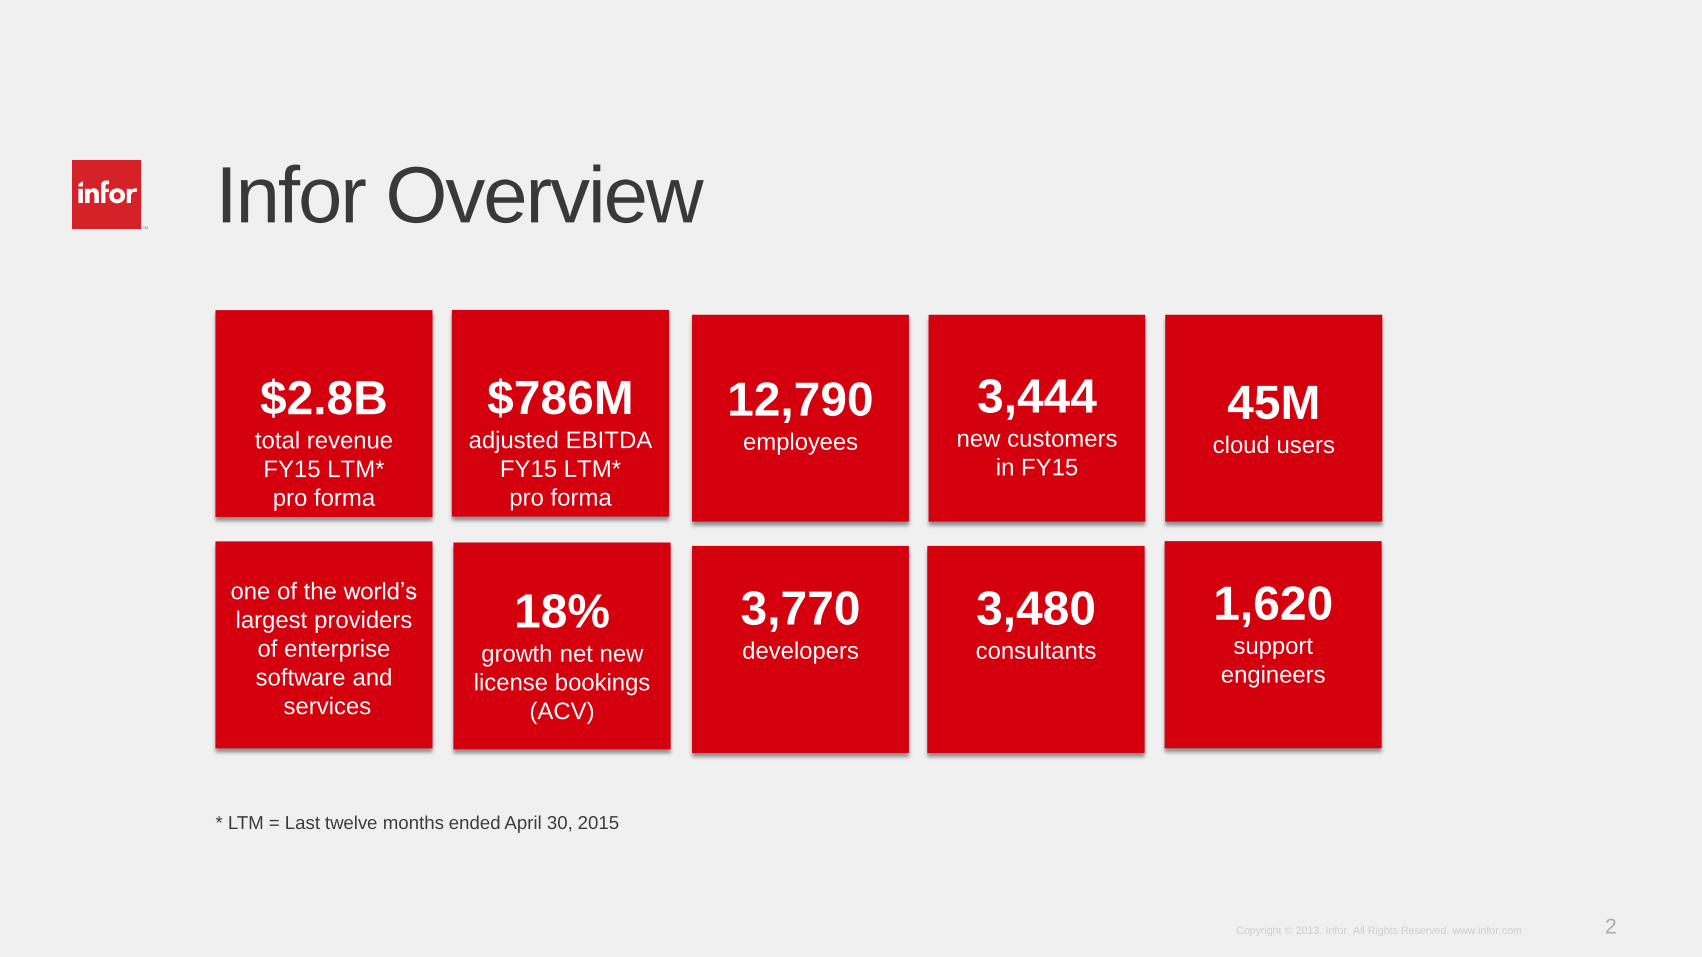
Pro forma revenue ($ in millions)
(1) Results as presented are based on actual currency and are pro forma for pre-acquisition results and reversal of acquisition related adjustments.
FY 2012 and FY 2013 Pro forma EBITDA includes $13.9 million and $3.3 million of incremental synergies yet to be realized, respectively.
(2) Beginning in the first quarter of FY 2015, we changed our fiscal year end to April 30 from May 31. As a result, our results of May 2014 are included in both the fourth quarter of Fiscal 2014 and
the first quarter of Fiscal 2015 and are reflected in the FY 2014 and FY 2015 LTM columns above.
(1)(2)
Historical Financial Summary Pro forma adjusted EBITDA ($ in millions)
(1)(2)
$778 $763 $750 $700
$1,444 $1,443 $1,467 $1,459
$537 $532 $553 $601
$0
$1,000
$2,000
$3,000
FY 2012 FY 2013 FY 2014 FY 2015 LTM
Services Maintenance License Fees
$2,759 $2,738$2,770 $2,760
$838 $829 $814 $786
$0
$200
$400
$600
$800
$1,000
FY 2012 FY 2013 FY 2014 FY 2015 LTM
EBITDA Margin: 30.4% 30.3% 29.4% 28.5%
4Copyright © 2013. Infor. All Rights Reserved. www.infor.com
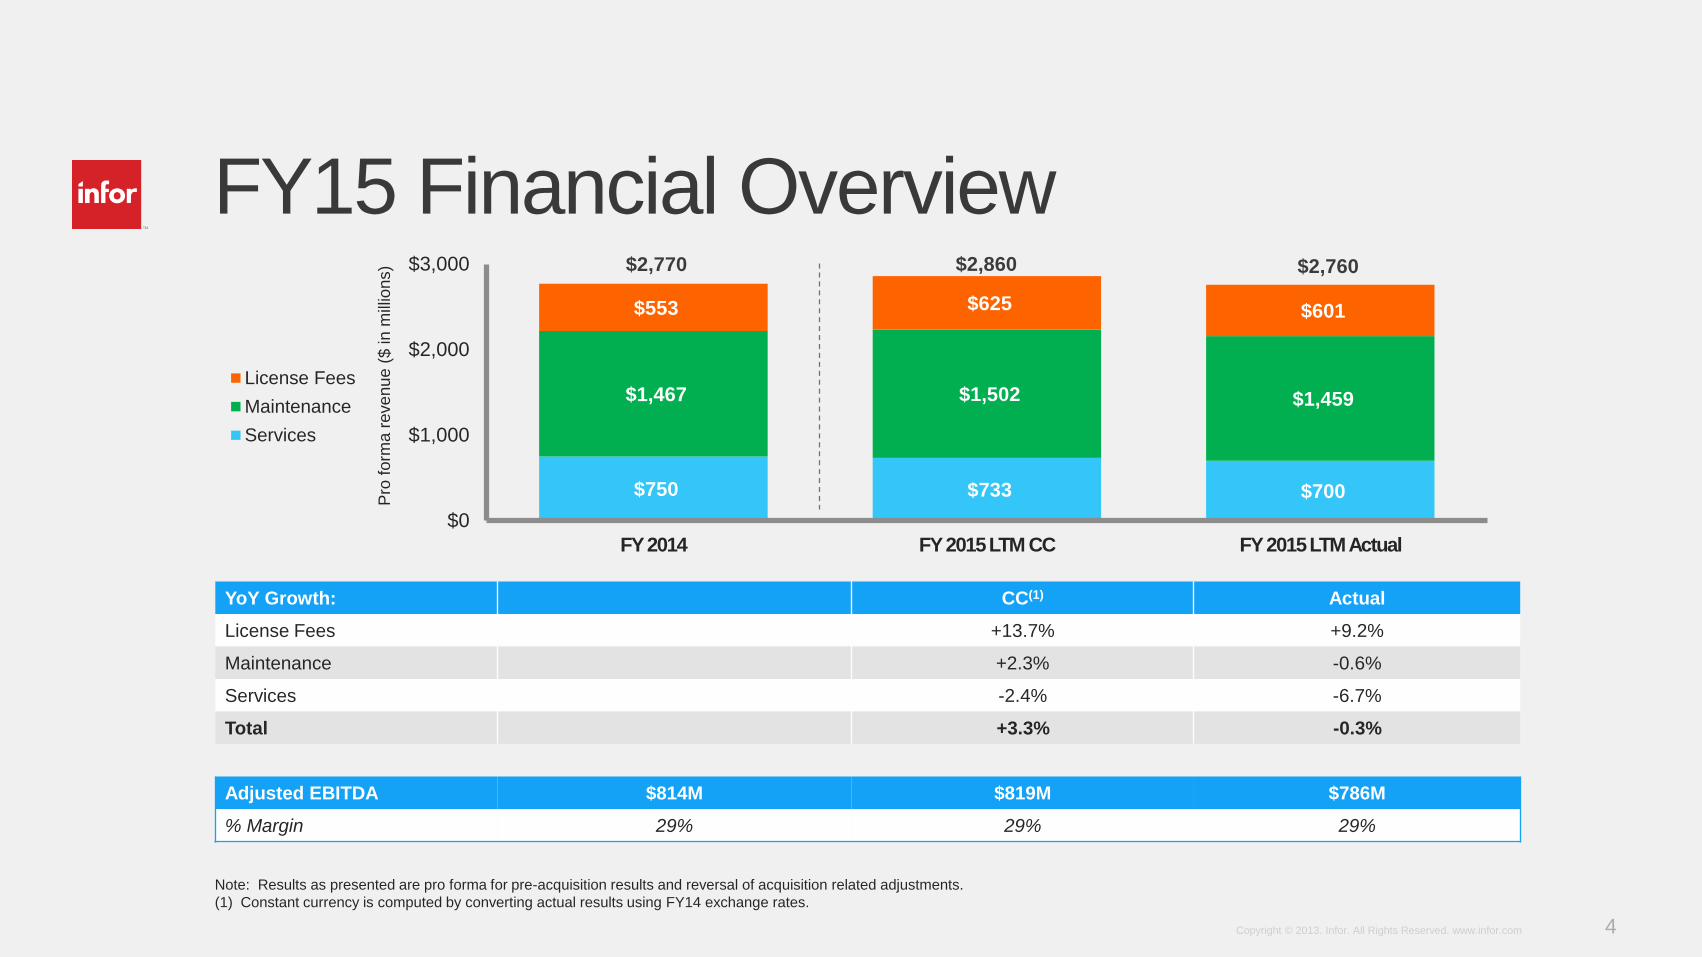
Note: Results as presented are pro forma for pre-acquisition results and reversal of acquisition related adjustments.
(1) Constant currency is computed by converting actual results using FY14 exchange rates.
FY15 Financial Overview
YoY Growth: CC(1) Actual
License Fees +13.7% +9.2%
Maintenance +2.3% -0.6%
Services -2.4% -6.7%
Total +3.3% -0.3%
Adjusted EBITDA $814M $819M $786M
% Margin 29% 29% 29%
$750 $733 $700
$1,467 $1,502 $1,459
$553 $625 $601
$0
$1,000
$2,000
$3,000
FY 2014 FY 2015 LTM CC FY 2015 LTM Actual
Pro
form
a r
even
ue
($ in m
illio
ns)
License Fees
Maintenance
Services
$2,760$2,770 $2,860

5Copyright © 2013. Infor. All Rights Reserved. www.infor.com
LTM April 2015 v. April 2014 P&L: Pro Forma $ in millions % %
Variance Variance
Revenue
Software license fees and subscriptions $ 600.7 $ 549.9 $ 50.8 9.2% $ (24.8) $ 625.5 $ 549.9 $ 75.6 13.7%
Product updates and support fees 1,458.9 1,467.3 (8.4) -0.6% (42.8) 1,501.7 1,467.3 34.4 2.3%
Software revenues 2,059.6 2,017.2 42.4 2.1% (67.6) 2,127.2 2,017.2 110.0 5.5%
Consulting services and other fees 700.4 750.6 (50.2) -6.7% (32.2) 732.6 750.6 (18.0) -2.4%
Total revenues 2,760.0 2,767.8 (7.8) -0.3% (99.8) 2,859.8 2,767.8 92.0 3.3%
Expenses
Cost of software license fees and subscriptions 127.6 100.2 27.4 27.3% (3.0) 130.6 100.2 30.4 30.3%
Cost of product updates and support fees 260.9 260.8 0.1 0.0% (7.9) 268.8 260.8 8.0 3.1%
Cost of consulting services and other fees 560.1 593.6 (33.5) -5.6% (24.5) 584.6 593.6 (9.0) -1.5%
Sales and marketing costs 466.7 457.6 9.1 2.0% (12.4) 479.1 457.6 21.5 4.7%
Research and development 404.5 392.2 12.3 3.1% (11.4) 415.9 392.2 23.7 6.0%
General and administrative 196.4 192.0 4.4 2.3% (7.8) 204.2 192.0 12.2 6.4%
Amortization of intangible assets and depreciation 245.7 263.7 (18.0) -6.8% (6.3) 252.0 263.7 (11.7) -4.4%
Restructuring costs 11.5 13.4 (1.9) -14.2% (0.1) 11.6 13.4 (1.8) -13.4%
Acquisition-related and other costs 1.7 26.3 (24.6) -93.5% - 1.7 26.3 (24.6) -93.5%
Total operating expenses 2,275.1 2,299.8 (24.7) -1.1% (73.4) 2,348.5 2,299.8 48.7 2.1%
Income from operations 484.9 468.0 16.9 3.6% (26.4) 511.3 468.0 43.3 9.3%
Interest expense, net 349.7 382.9 (33.2) -8.7% 0.1 349.6 382.9 (33.3) -8.7%
Loss on extinguishment of debt 172.4 5.2 167.2 nm - 172.4 5.2 167.2 nm
Other (income) expense, net (77.5) (46.1) (31.4) 68.1% (12.2) (65.3) (46.1) (19.2) 41.6%
Income before income taxes 40.3 126.0 (85.7) -68.0% (14.3) 54.6 126.0 (71.4) -56.7%
Income tax provision (benefit) (39.2) 7.3 (46.5) nm (3.6) (35.6) 7.3 (42.9) nm
Net income $ 79.5 $ 118.7 $ (39.2) -33.0% $ (10.7) $ 90.2 $ 118.7 $ (28.5) -24.0%#DIV/0!
Add backs 706.7 693.4 13.3 1.9% (22.1) 728.8 693.4 35.4 5.1%
Adjusted EBITDA $ 786.2 $ 812.1 $ (25.9) -3.2% $ (32.8) $ 819.0 $ 812.1 $ 6.9 0.8%
Adjusted EBITDA margin 28.5% 29.3% 28.6% 29.3%
(1) Pro Forma Results contain reversal of acquisition-related adjustments
(2) Pro Forma Results for FY15 reflect the twelve months ended April 30, 2015 -
Pro Forma Results for FY14 have been recast to reflect the corresponding twelve months ended April 30, 2014
(3) Currency impact is computed by converting actual results using FY14 exchange rates
Pro Forma Results(1)(2) Currency-adjusted Results
Actual Actual Currency Adjusted Actual
VarianceFY15 FY14 Variance Impact (3) FY15 FY14

6Copyright © 2013. Infor. All Rights Reserved. www.infor.com
Balance Sheet & Cash Flow Highlights• $526.7M cash & equivalents at Q4 FY15
• We have significant cash on our balance sheet and continue to generate strong cash flows
• In addition to cash on hand, we have $150.0 million revolving credit facility available to us that has not been used
• $338.0M in current accounts receivable at Q4 FY15
• Historical DSO less than 50 days
• $342.2M operating cash flow in FY15 LTM
• 53%+ of total revenue from maintenance in FY15 with 93%+ renewal rates
• Highly profitable and highly predictable revenue and cash flow model
7Copyright © 2013. Infor. All Rights Reserved. www.infor.com
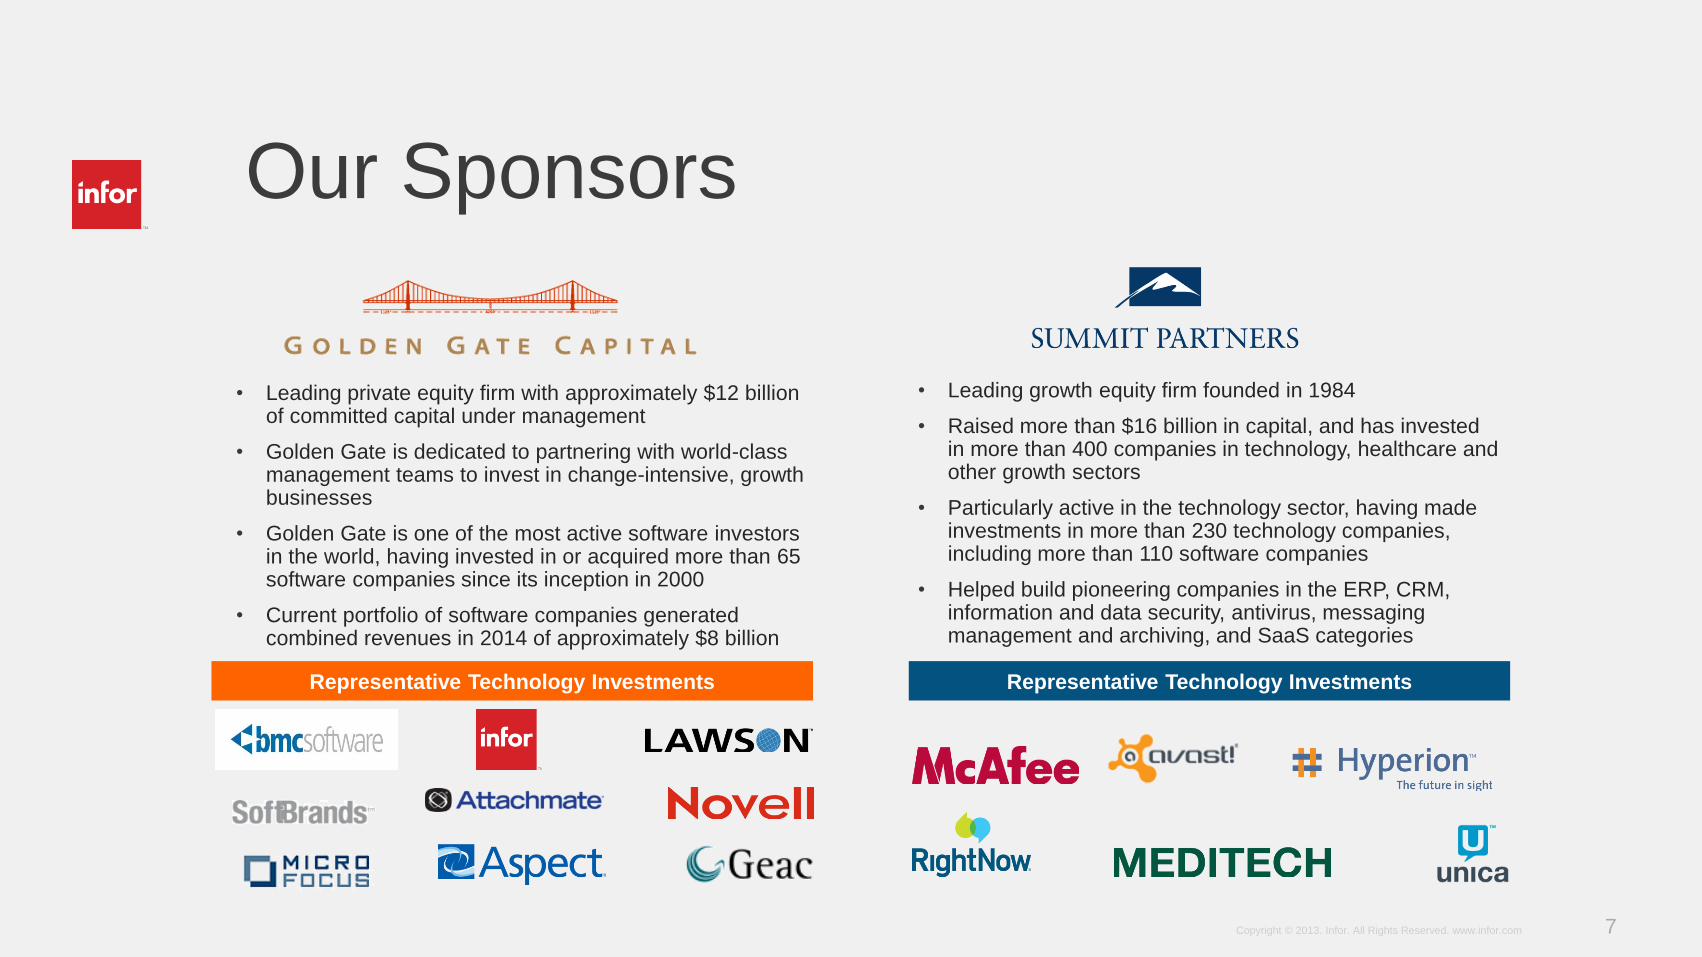
• Leading private equity firm with approximately $12 billion of committed capital under management
• Golden Gate is dedicated to partnering with world-class management teams to invest in change-intensive, growth businesses
• Golden Gate is one of the most active software investors in the world, having invested in or acquired more than 65 software companies since its inception in 2000
• Current portfolio of software companies generated combined revenues in 2014 of approximately $8 billion
• Leading growth equity firm founded in 1984
• Raised more than $16 billion in capital, and has invested in more than 400 companies in technology, healthcare and other growth sectors
• Particularly active in the technology sector, having made investments in more than 230 technology companies, including more than 110 software companies
• Helped build pioneering companies in the ERP, CRM, information and data security, antivirus, messaging management and archiving, and SaaS categories
Representative Technology Investments Representative Technology Investments
Our Sponsors

8Copyright © 2013. Infor. All Rights Reserved. www.infor.comCopyright © 2013. Infor. All Rights Reserved. www.infor.com 8
Appendix

9Copyright © 2013. Infor. All Rights Reserved. www.infor.com
FY15 v. FY14 P&L: GAAP 11-Month Transition Period$ in millions % %
Variance Variance
Revenue (recast) (recast)
Software license fees and subscriptions $ 479.2 $ 427.8 $ 51.4 12.0% $ (24.2) $ 503.4 $ 427.8 $ 75.6 17.7%
Product updates and support fees 1,330.3 1,340.9 (10.6) -0.8% (44.3) 1,374.6 1,340.9 33.7 2.5%
Software revenues 1,809.5 1,768.7 40.8 2.3% (68.5) 1,878.0 1,768.7 109.3 6.2%
Consulting services and other fees 629.4 677.0 (47.6) -7.0% (33.1) 662.5 677.0 (14.5) -2.1%
Total revenues 2,438.9 2,445.7 (6.8) -0.3% (101.6) 2,540.5 2,445.7 94.8 3.9%
Expenses
Cost of software license fees and subscriptions 109.7 81.9 27.8 33.9% (2.9) 112.6 81.9 30.7 37.5%
Cost of product updates and support fees 238.2 239.1 (0.9) -0.4% (8.1) 246.3 239.1 7.2 3.0%
Cost of consulting services and other fees 507.2 540.3 (33.1) -6.1% (25.3) 532.5 540.3 (7.8) -1.4%
Sales and marketing costs 412.9 403.3 9.6 2.4% (12.8) 425.7 403.3 22.4 5.6%
Research and development 369.8 357.1 12.7 3.6% (11.6) 381.4 357.1 24.3 6.8%
General and administrative 177.9 174.2 3.7 2.1% (8.1) 186.0 174.2 11.8 6.8%
Amortization of intangible assets and depreciation 222.9 241.5 (18.6) -7.7% (6.6) 229.5 241.5 (12.0) -5.0%
Restructuring costs 5.7 12.8 (7.1) -55.5% (0.2) 5.9 12.8 (6.9) -53.9%
Acquisition-related and other costs 1.4 27.3 (25.9) -94.9% - 1.4 27.3 (25.9) -94.9%
Total operating expenses 2,045.7 2,077.5 (31.8) -1.5% (75.6) 2,121.3 2,077.5 43.8 2.1%
Income from operations 393.2 368.2 25.0 6.8% (26.0) 419.2 368.2 51.0 13.9%
Interest expense, net 320.1 348.4 (28.3) -8.1% - 320.1 348.4 (28.3) -8.1%
Loss on extinguishment of debt 172.4 5.2 167.2 nm - 172.4 5.2 167.2 nm
Other (income) expense, net (66.8) (52.0) (14.8) 28.5% (11.9) (54.9) (52.0) (2.9) 5.6%
Income (loss) before income taxes (32.5) 66.6 (99.1) nm (14.1) (18.4) 66.6 (85.0) nm
Income tax provision (benefit) (52.2) (0.4) (51.8) nm (2.1) (50.1) (0.4) (49.7) nm
Net income $ 19.7 $ 67.0 $ (47.3) -70.6% $ (12.0) $ 31.7 $ 67.0 $ (35.3) -52.7%
(1) Actual Results for YTD FY15 reflect the eleven-month transition period of June 1, 2014, through April 30, 2015 -
Actual Results for YTD FY14 have been recast to reflect the corresponding eleven months ended April 30, 2014
(2) Currency impact is computed by converting actual results using FY14 exchange rates
Actual Results (1) Currency-adjusted Results
Actual Actual Currency Adjusted Actual
FY15 11-month FY14 11-month VarianceFY15 11-month FY14 11-month Variance Impact (2)
10Copyright © 2013. Infor. All Rights Reserved. www.infor.com
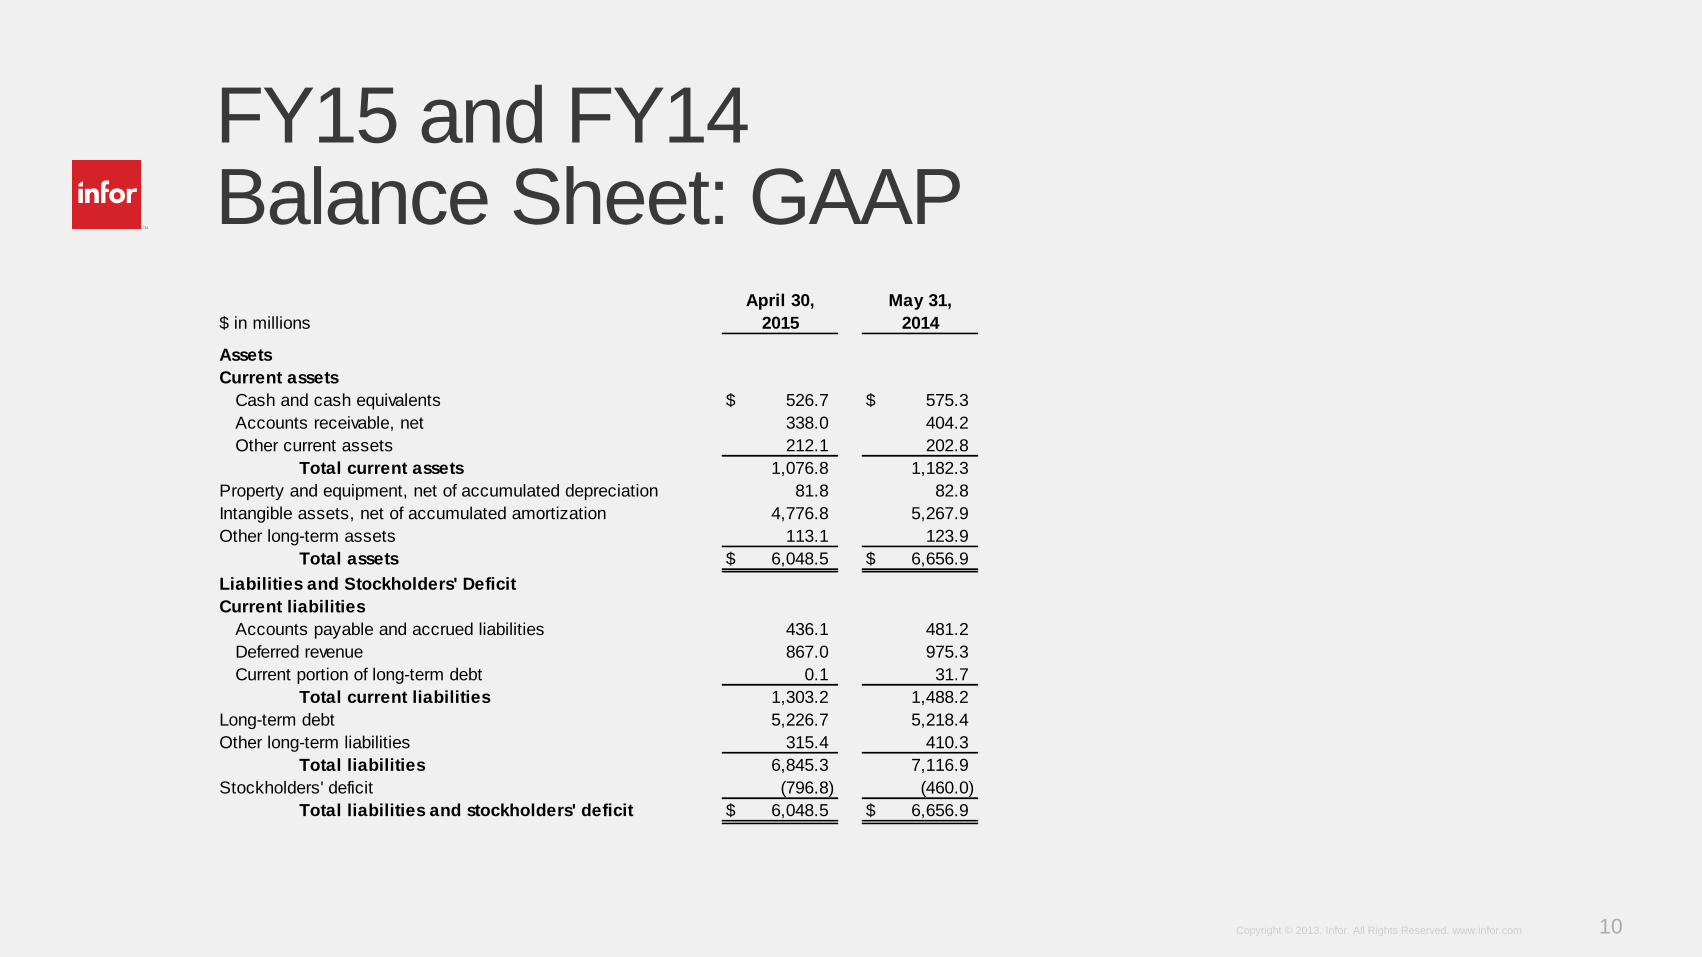
FY15 and FY14 Balance Sheet: GAAP
April 30, May 31,
$ in millions 2015 2014
Assets
Current assets
Cash and cash equivalents 526.7$ 575.3$
Accounts receivable, net 338.0 404.2
Other current assets 212.1 202.8
Total current assets 1,076.8 1,182.3
Property and equipment, net of accumulated depreciation 81.8 82.8
Intangible assets, net of accumulated amortization 4,776.8 5,267.9
Other long-term assets 113.1 123.9
Total assets 6,048.5$ 6,656.9$
Liabilities and Stockholders' Deficit
Current liabilities
Accounts payable and accrued liabilities 436.1 481.2
Deferred revenue 867.0 975.3
Current portion of long-term debt 0.1 31.7
Total current liabilities 1,303.2 1,488.2
Long-term debt 5,226.7 5,218.4
Other long-term liabilities 315.4 410.3
Total liabilities 6,845.3 7,116.9
Stockholders' deficit (796.8) (460.0)
Total liabilities and stockholders' deficit 6,048.5$ 6,656.9$
11Copyright © 2013. Infor. All Rights Reserved. www.infor.com
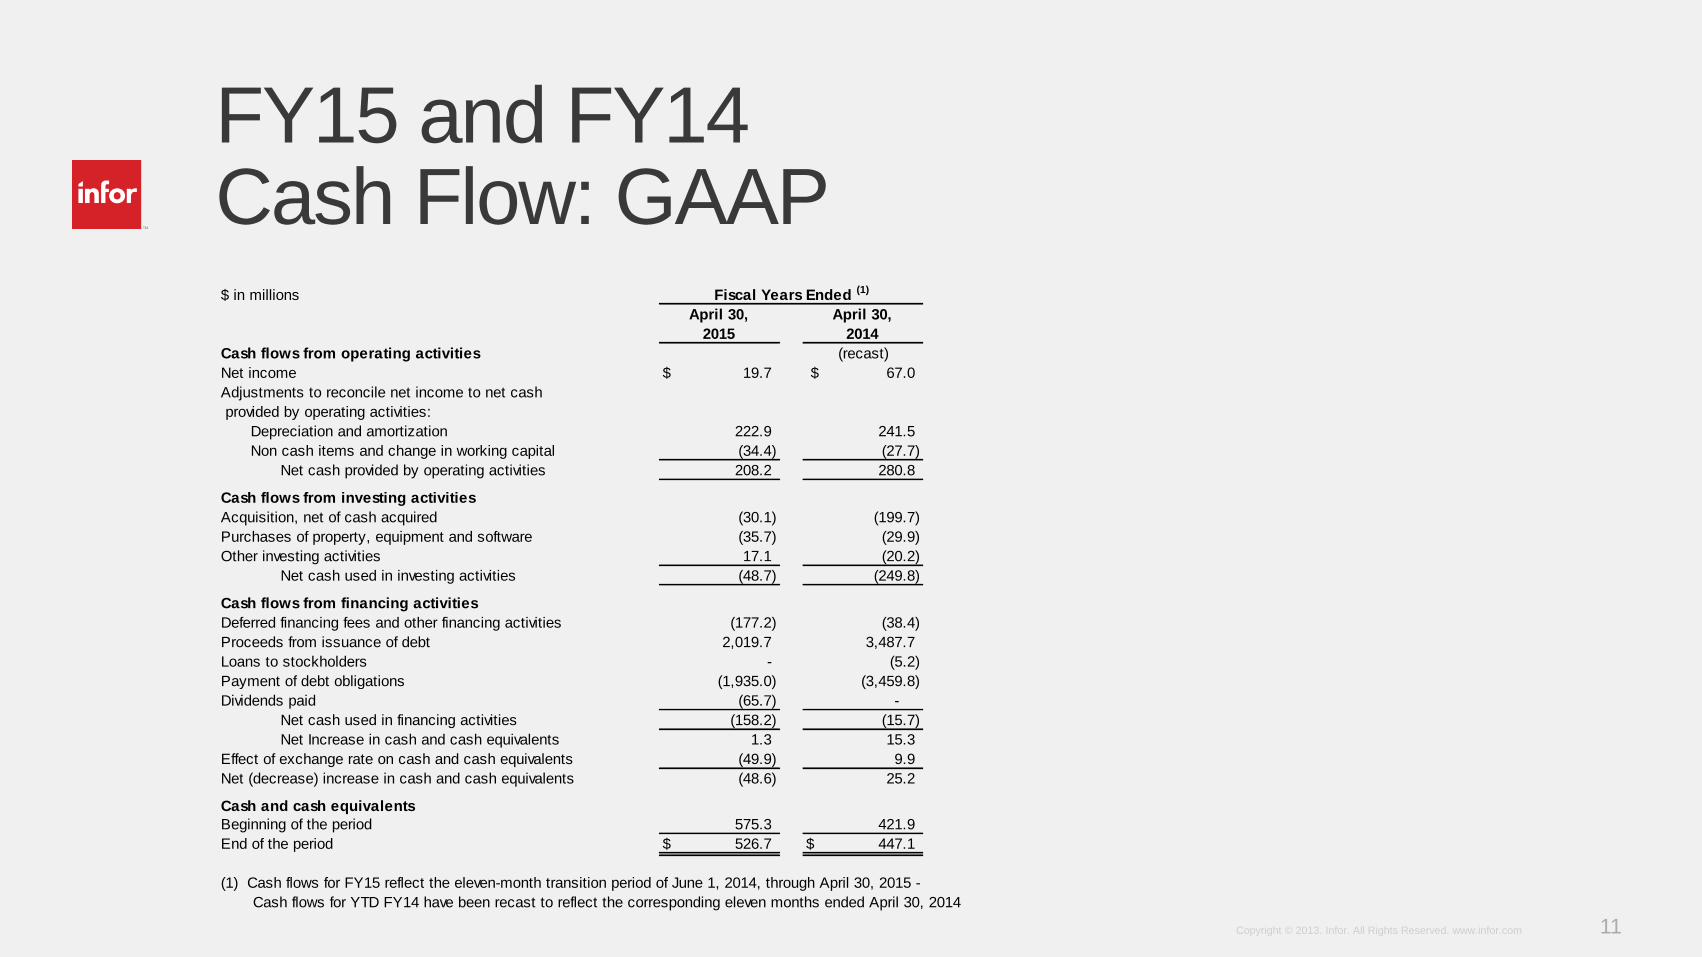
FY15 and FY14 Cash Flow: GAAP $ in millions
April 30,
2015
April 30,
2014
Cash flows from operating activities (recast)
Net income 19.7$ 67.0$
Adjustments to reconcile net income to net cash
provided by operating activities:
Depreciation and amortization 222.9 241.5
Non cash items and change in working capital (34.4) (27.7)
Net cash provided by operating activities 208.2 280.8
Cash flows from investing activities
Acquisition, net of cash acquired (30.1) (199.7)
Purchases of property, equipment and software (35.7) (29.9)
Other investing activities 17.1 (20.2)
Net cash used in investing activities (48.7) (249.8)
Cash flows from financing activities
Deferred financing fees and other financing activities (177.2) (38.4)
Proceeds from issuance of debt 2,019.7 3,487.7
Loans to stockholders - (5.2)
Payment of debt obligations (1,935.0) (3,459.8)
Dividends paid (65.7) -
Net cash used in financing activities (158.2) (15.7)
Net Increase in cash and cash equivalents 1.3 15.3
Effect of exchange rate on cash and cash equivalents (49.9) 9.9
Net (decrease) increase in cash and cash equivalents (48.6) 25.2
Cash and cash equivalents
Beginning of the period 575.3 421.9
End of the period 526.7$ 447.1$
(1) Cash flows for FY15 reflect the eleven-month transition period of June 1, 2014, through April 30, 2015 -
Cash flows for YTD FY14 have been recast to reflect the corresponding eleven months ended April 30, 2014
Fiscal Years Ended (1)

12Copyright © 2013. Infor. All Rights Reserved. www.infor.com