Embed Size (px)
Citation preview
i
A
2019
FINANCIAL PERFORMANCE
ANALYSIS ON PHARMACEUTICALS
COMPANIES
ii
Project Report On
“Financial Performance Analysis on Pharmaceuticals Companies”
Submitted to:
Ishrat Jahan
Assistant Professor,
School of Business & Economics
United International University (UIU)
Submitted By:
Sumaiya Akter Khanom
111 151 496
BBA
United International University (UIU)
Date of submission:
16 October 2019
iii
Letter of Transmittal
Date: 16.10.2019
Assistant Professor,
School of Business & Economics
United International University (UIU)
Subject: Submission of Project Report on “Financial Performance Analysis on
Pharmaceuticals Companies”
Dear Madam,
With due respect it is stated that I am submitting my Project Report on “Financial Performance
Analysis on Pharmaceutical companies Ltd” which is the requirement for obtaining the degree of
Bachelor of Business Administration (BBA) offered by United International University (UIU). It
was great experience for me to do the report on this interesting subject. This work has helped me
to apply my theoretical knowledge into practice. I have realized that theoretical knowledge is not
enough we need practical experience and knowledge also.
I hope that you will like my project report. This report is very informative. I have tried my best to
make the report informative and useful for other numerical uses. It will be delightful to me if you
accept my project report.
Yours Sincerely,
……………………………..
Sumaiya Akter Khanom
ID No. 111 151 496
Program: BBA
United International University (UIU).
iv
ACKNOWLEDGEMENT
The Project paper on “Financial Performance Analysis on Pharmaceuticals Companies” is a
great pleasure to me to complete. I have taken great aptitudes to complete this report. With the
kind, help of the faculty member encouraged me to do this on time.
Firstly, I am thankful to the Almighty Allah for his kindness and helpful gratitude to complete this
report. I am thankful to my honorable faculty “Ishrat Jahan” madam who helped me a lot and
guided me to finish the project report from first to last.
I would like to express my gratitude to my parents for their continuous support and prayers. Their
support and motivation encouraged me to overcome any obstacles and complete my BBA.
I would like to thank my friend who has supported me and helped me to accomplish this report by
providing proper information. Without these helps, I would face difficulties but this kind support
helped me to complete the report.
Also indebted to those websites and information desks that provided me information and I tried to
use those data properly to complete this report.
However, any reader or faculty may find my report error some in editing or any misinterpretation
mistakes. Apart from this any correction and suggestion from any person is warmly welcome.
v
ABSTRACT
Bangladesh is a country of potentiality. There are lot of industries in Bangladesh. The
pharmaceutical industry is growing faster. There is a huge demand of medicines both in domestic
and international markets. This project report is prepared on the performance analysis of some
leading pharmaceutical industries. The focus is on their financial position. There is company
profile, mission, and vision of BEXIMCO PHARMA, SQUARE PHARMA, ACME, IBN SINA,
ACI Ltd. It also included the ratio analysis from 2014 to 2018. They have lacks in performance. I
have added recommendation and findings to overcome these problems. All of the companies are
the future of Bangladesh’s drug industry. They are not only doing business but also helping the
economy to grow. They are following corporate social culture, providing employment and
empowering women in the society. I have suggested some ways they can provide help and flourish
their business.
6
Table of Contents
Contents 1. INTRODUCTION .................................................................................................................................... 8
1.1 Introduction ......................................................................................................................................... 9
1.2 THE PROJECT PAPER ................................................................................................................... 10
1.3 ORIGIN OF THE REPORT ............................................................................................................. 11
1.4 OBJECTIVE OF THE STUDY ........................................................................................................ 11
1.5 SCOPE OF THE REPORT ............................................................................................................... 12
1.6 METHODOLOGY ........................................................................................................................... 12
1.7 LIMITATION OF THE STUDY ...................................................................................................... 13
2. INDUSTRY OVERVIEW ...................................................................................................................... 14
2.1 INDUSTRY OVERVIEW ................................................................................................................ 15
2.2 INDUSTRY BACKGROUND ......................................................................................................... 15
2.3 INDUSTRY SIZE ............................................................................................................................. 15
2.4 LOCAL MARKET OVERVIEW ..................................................................................................... 15
3. COMPANY OVERVIEW ...................................................................................................................... 17
3.1 Beximco pharmaceuticals ................................................................................................................. 18
3.2 Square Pharmaceuticals .................................................................................................................... 18
3.3 ACME Laboratories Ltd. .................................................................................................................. 19
3.4 IBN SINA Pharmaceuticals Industry Ltd. ........................................................................................ 19
3.5 ACI Pharmaceuticals Ltd. ................................................................................................................. 20
4. THEORETICAL ANALYSIS ................................................................................................................ 21
4.1 Ratio Analysis ................................................................................................................................... 22
4.1.1WHAT IS RATIO ....................................................................................................................... 22
4.1.2 LIQUIDITY RATIO .................................................................................................................. 22
4.1.3 ACTIVITY RATIO.................................................................................................................... 22
4.1.4 PROFITABILITY RATIO ......................................................................................................... 22
4.1.5 COVERAGE RATIO ................................................................................................................. 23
4.1.6 LEVERAGE RATIO ................................................................................................................. 23
5. INDUSTRY RATIO ANALYSIS .......................................................................................................... 24
5.1 Industry Ratio Analysis ..................................................................................................................... 25
7
5.1.1 Current asset ............................................................................................................................... 25
5.1.2 Acid Test Ratio .......................................................................................................................... 26
5.1.3 Receivable turnover ratio ........................................................................................................... 26
5.1.4 Average Collection Period ......................................................................................................... 27
5.1.5 Inventory turnover Ratio ............................................................................................................ 27
5.1.6 Total Asset turnover ratio .......................................................................................................... 28
5.1.7 Fixed Asset turnover ratio .......................................................................................................... 29
5.1.8 Gross Profit Margin ................................................................................................................... 30
5.1.9 Net Profit Margin ....................................................................................................................... 31
5.1.10 Return On asset ........................................................................................................................ 31
5.1.11 Return on equity ....................................................................................................................... 32
5.1.12 Current asset coverage Ratio .................................................................................................... 33
5.1.13 Interest coverage Ratio ............................................................................................................. 34
5.1.14 Debt to equity Ratio ................................................................................................................. 35
5.1.15 Debt to Asset Ratio .................................................................................................................. 36
6. COMPANY’S RATIO ANALYSIS AND INTERPRETATION ........................................................... 37
6.1 Ratio analysis of Beximco Pharmaceuticals ..................................................................................... 38
6.2 Ratio Analysis of Square Pharmaceuticals Ltd ................................................................................. 53
6.3 Ratio analysis of ACME Laboratories Ltd........................................................................................ 68
6.4 Ratio Analysis of IBN SINA Pharmaceuticals Industry Ltd ............................................................ 83
6.5 Ratio analysis of ACI pharmaceuticals Ltd ...................................................................................... 96
7. CONCLUSION AND RECOMMENDATION .................................................................................... 110
7.1 Conclusion and Recommendations................................................................................................. 111
REFERENCES ......................................................................................................................................... 112
8
CHPATER 1
1. INTRODUCTION
9
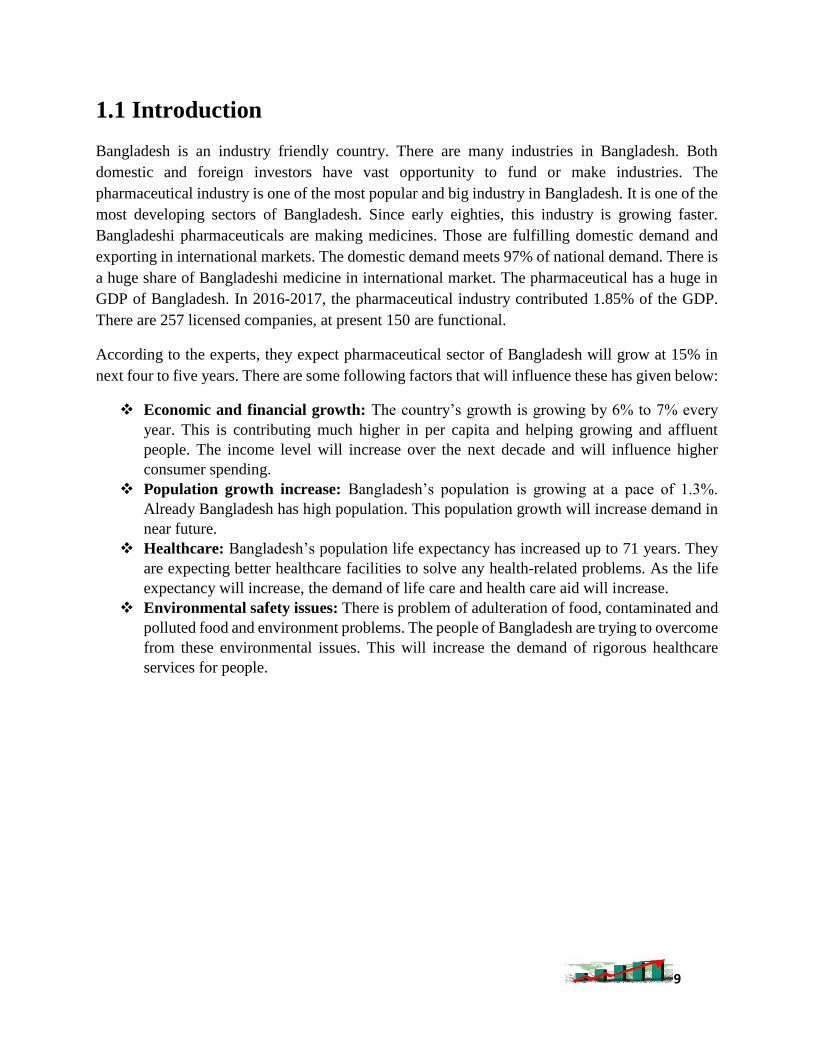
1.1 Introduction
Bangladesh is an industry friendly country. There are many industries in Bangladesh. Both
domestic and foreign investors have vast opportunity to fund or make industries. The
pharmaceutical industry is one of the most popular and big industry in Bangladesh. It is one of the
most developing sectors of Bangladesh. Since early eighties, this industry is growing faster.
Bangladeshi pharmaceuticals are making medicines. Those are fulfilling domestic demand and
exporting in international markets. The domestic demand meets 97% of national demand. There is
a huge share of Bangladeshi medicine in international market. The pharmaceutical has a huge in
GDP of Bangladesh. In 2016-2017, the pharmaceutical industry contributed 1.85% of the GDP.
There are 257 licensed companies, at present 150 are functional.
According to the experts, they expect pharmaceutical sector of Bangladesh will grow at 15% in
next four to five years. There are some following factors that will influence these has given below:
Economic and financial growth: The country’s growth is growing by 6% to 7% every
year. This is contributing much higher in per capita and helping growing and affluent
people. The income level will increase over the next decade and will influence higher
consumer spending.
Population growth increase: Bangladesh’s population is growing at a pace of 1.3%.
Already Bangladesh has high population. This population growth will increase demand in
near future.
Healthcare: Bangladesh’s population life expectancy has increased up to 71 years. They
are expecting better healthcare facilities to solve any health-related problems. As the life
expectancy will increase, the demand of life care and health care aid will increase.
Environmental safety issues: There is problem of adulteration of food, contaminated and
polluted food and environment problems. The people of Bangladesh are trying to overcome
from these environmental issues. This will increase the demand of rigorous healthcare
services for people.
10
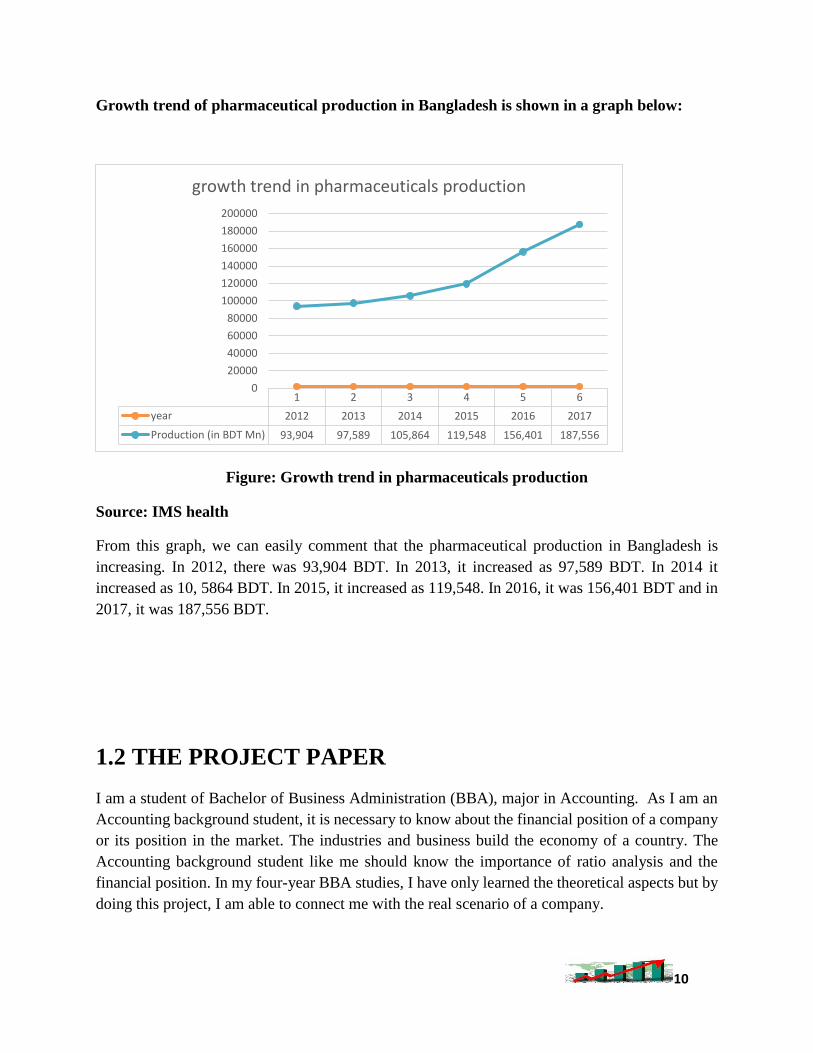
Growth trend of pharmaceutical production in Bangladesh is shown in a graph below:
Figure: Growth trend in pharmaceuticals production
Source: IMS health
From this graph, we can easily comment that the pharmaceutical production in Bangladesh is
increasing. In 2012, there was 93,904 BDT. In 2013, it increased as 97,589 BDT. In 2014 it
increased as 10, 5864 BDT. In 2015, it increased as 119,548. In 2016, it was 156,401 BDT and in
2017, it was 187,556 BDT.
1.2 THE PROJECT PAPER
I am a student of Bachelor of Business Administration (BBA), major in Accounting. As I am an
Accounting background student, it is necessary to know about the financial position of a company
or its position in the market. The industries and business build the economy of a country. The
Accounting background student like me should know the importance of ratio analysis and the
financial position. In my four-year BBA studies, I have only learned the theoretical aspects but by
doing this project, I am able to connect me with the real scenario of a company.
1 2 3 4 5 6
year 2012 2013 2014 2015 2016 2017
Production (in BDT Mn) 93,904 97,589 105,864 119,548 156,401 187,556
0
20000
40000
60000
80000
100000
120000
140000
160000
180000
200000
growth trend in pharmaceuticals production
11
University has provided me this type of opportunity to do something real life stuffs. There are
many private and multinational business organizations if we do not understand their market
position it will be a loss for us as we are business background student. The university provide us
opportunity to know any business organization by providing Internship or Project for 3-4 months.
I have chosen the project report as I think this theoretical knowledge will help me more to make a
report on this interesting subject “Financial Performance Analysis on Pharmaceuticals
companies”.
There are many industrial sectors in Bangladesh but most prominent growth is in the
pharmaceutical industry. I have gathered a lot of experience when doing this project report. I hope
this report will help others to know about the financial positions and importance of ratio analysis.
That is why I have chosen the topic “Financial Performance Analysis on Pharmaceuticals
companies”. I am very much thankful to my honorable faculty for giving me this opportunity.
1.3 ORIGIN OF THE REPORT
The project program is a particular report that is of “Financial Performance Analysis on
Pharmaceuticals Companies”. University provide the opportunity to the students to gain some
real-world knowledge. I have learned a lot when doing this report. I have gathered information of
how actual companies work. This project paper is required to complete for the students of BBA.
This is a four months project. When any student complete 120 credits out of 123 credits, he or she
is eligible for this. Student can choose internship or project any of this.
1.4 OBJECTIVE OF THE STUDY
The objective of the study is to gather real world business techniques and realize their market
position. Also, merge the four years theoretical knowledge with the real context. This project is
compulsory to make for any BBA graduating student. The objectives are:
To understand the overall strategy of the selected companies.
To analysis the ratios for five years.
To compare with the industry average.
To find the problems and recommend suggestions to overcome the problems.
To know the importance of pharmaceutical companies in Bangladesh that has vast impact
on economic growth.
12
1.5 SCOPE OF THE REPORT
The basic area for the report is to analysis the activities of ratio and performance of management for the
selected companies. The overall view and attention has given to understand each company’s financial
position, mechanism. The other important aspects are present with clarification along with the depth of
study.
1.6 METHODOLOGY
This report is prepared based on the experience gathered while doing the project. I have studied
about the pharmaceuticals industry of Bangladesh, selected some leading companies, studied their
annual reports and prepared this report. I have tried to apply my theoretical knowledge to find out
the ratios. I hope this will be enough to find out the real picture of the pharmaceutical industry of
Bangladesh based on the selected companies.
Primary Data:
There is no primary data used for preparing the report.
Secondary Data:
I have used the secondary data to prepare the report-
Annual report of Beximco Pharmaceuticals (2014-2018).
Annual report of Square Pharmaceuticals (2014-2018).
Annual report of ACME Laboratories Ltd (2014-2018).
Annual report of IBNE SINA (2014-2018).
Annual report of ACI Ltd (2014-2018).
Official website of the companies.
Other journals and web papers relating to the topic.
Product details of the companies.
13
1.7 LIMITATION OF THE STUDY
I have faced a lot of limitation while doing this project report. There was also time limitation. Four
months’ time is not enough to understand overall of any company. However, it helped me a lot to
understand about the pharmaceutical industry.
One of the limitations is shortage of time. I had to collect all information in this short time
and selected necessary information to complete the project.
I faced difficulties to gather information. Some information is incomplete or not present at
all.
Because of the limitation of information there is lacks of presentation of information. There
was some confidential data between the management and companies. Also, between banks
and stockholders for that I had trouble to find some data.
14
CHAPTER 2
2. INDUSTRY OVERVIEW
15
2.1 INDUSTRY OVERVIEW
The Pharmaceutical industry is one of the most advanced sectors with newest technologies in
Bangladesh. The pharmaceutical industry has grown in last two decades. The skilled human
resource and professionals are innovating new formulas and lifesaving medicine. Government is
focusing more in this sector and many companies get government incentives for their research and
development. This drug industry is helping to improve social problem by corporate social
responsibilities.
2.2 INDUSTRY BACKGROUND
The pharmaceutical industry is classified in two categories:
1. Patent medicine
2. Generic medicine
1. Patent medicine: The medicines, which are invented by the company, is called patent
medicine. The company invent those medicines in their laboratories by own research team.
They patent the formula and enjoy monopoly market. After that, they sell the patent in the
market so that other companies can go into mass production of that medicine.
2. Generic medicine: The medicines which are produced in a mass scale of production is
called generic medicine. Several company can produce such medicine in large scale. This
generic medicine market is more competitive. Sometimes its price is higher.
2.3 INDUSTRY SIZE
In 2018, the market size of pharmaceutical industry in Bangladesh is 20511.8 crore that is 15.6%
compound annual growth rate in previous five years. Only 3% of drugs are imported and 97%
comes from local companies. At present, there are 300 Pharmaceuticals Company is operating.
The positive development and good quality enabled Bangladesh to export local manufactured
medicines in global market.
2.4 LOCAL MARKET OVERVIEW
The pharmaceutical industry of Bangladesh’s market is the market place of generic medicines.
Companies sell medicines as private or Government Company. Both are bound to provide and
maintain the standard of healthcare facilities. The domestic companies have more control over the
16
drug industry and government encourage local companies very much. Bangladeshi local
pharmaceuticals cover and meet the demand of 98% and rest is fulfill by MNC’s. The Square and
Beximco hold 30% market together.
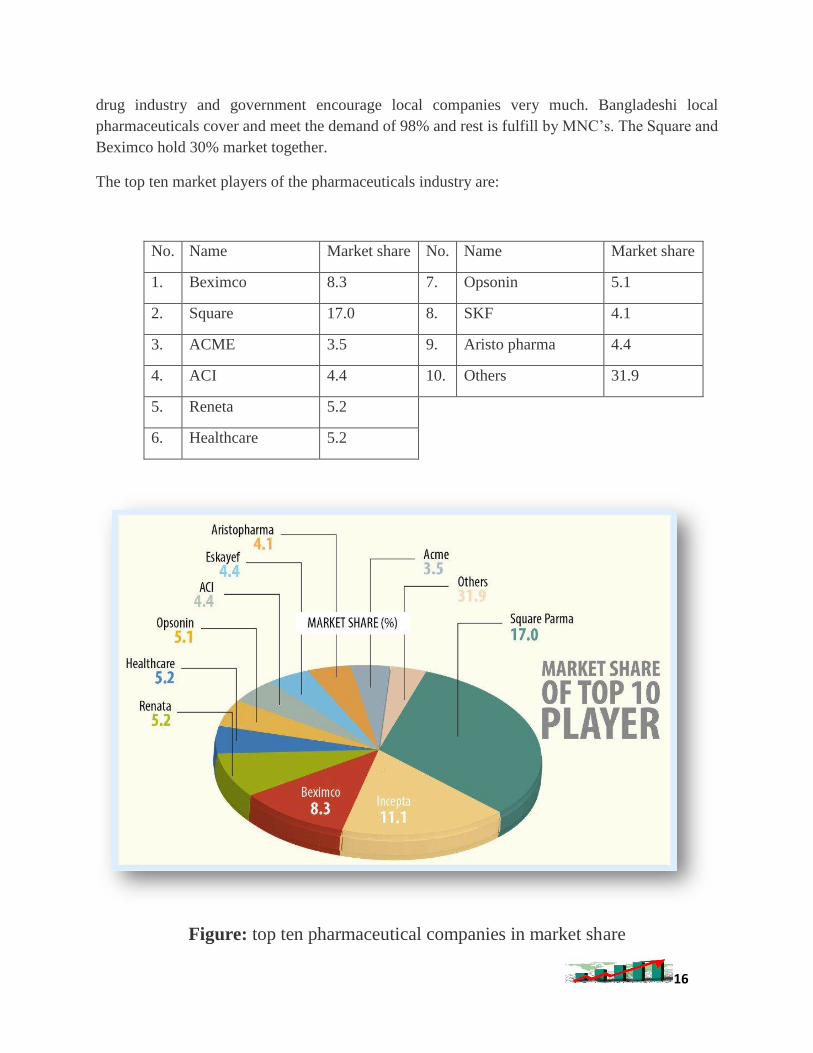
The top ten market players of the pharmaceuticals industry are:
No. Name Market share No. Name Market share
1. Beximco 8.3 7. Opsonin 5.1
2. Square 17.0 8. SKF 4.1
3. ACME 3.5 9. Aristo pharma 4.4
4. ACI 4.4 10. Others 31.9
5. Reneta 5.2
6. Healthcare 5.2
Figure: top ten pharmaceutical companies in market share
17
CHAPTER 3
3. COMPANY
OVERVIEW
18
3.1 Beximco pharmaceuticals
Beximco pharmaceuticals ltd is a leading manufacturer and exporter of medicine. They
incorporated in Bangladesh in late seventies. The Beximco started as a distributor. They imported
products from global Multi-National Companies (MNC) like Bayer’s, Germany and Upjohn, USA
and sold in the local markets. Later they started manufacturing and distributing under licensing
arrangement. Beximco pharmaceuticals is one of the largest exporters of medicine in Bangladesh.
Mission of Beximco pharma:
The mission of Beximco pharma is to enrich human health and well-being by providing new
contemporary and affordable medicines. Manufacturing in full compliance to maintain global
quality standards. They continuously strive to develop their core capabilities to meet the medical
needs of the patients. Also, try to deliver outstanding results for their shareholders.
Vision of Beximco Pharma:
The vision of Beximco pharma is to be the most trusted successful and admired pharmaceutical
company in Bangladesh. They have region focus on strengthening research and development
capabilities to create partnerships across the globe.
3.2 Square Pharmaceuticals
The Square pharmaceuticals Limited was establish in 1958. It is the largest pharmaceutical
company in Bangladesh. The Square pharmaceuticals is holding first position among all
multinational and national companies since 1985. It was enlisted in stock exchange as a public ltd
company in 1991.
Mission of Square Pharmaceuticals:
The mission of Square pharmaceuticals is to produce and provide new innovative and quality life
and healthcare products for people. They try to maintain strong ethical standards in operating
business. They also try to ensure benefit the stakeholders, shareholders and the society.
19
Vision of Square Pharmaceuticals ltd:
The square pharmaceuticals see the business as a mean material for wellbeing of the society. They
have vision of wellbeing of the investors, employees. They try to create and acceleration of wealth
through financial gains made moral gain as a part of human civilization.
Objective of Square Pharmaceuticals:
The objective of Square Pharmaceuticals is to fulfill their mission and vision by transparent
business operation using legal and social framework.
3.3 ACME Laboratories Ltd.
The ACME laboratories ltd was established and founded in 1954. It was a proprietorship firm and
situated in Narayangonj. The founder late Hamidur Rahman Sinha started it with noble and holistic
motto. He wanted to ensure healthy and happiness for all. ACME was convert into a private ltd in
1976.
Mission of ACME Ltd:
The mission of ACME Ltd is to ensure health, vigor and happiness for all. They try to manufacture
ethical drugs and medicines that are of highest quality. Also affordable for all class of people. They
try to expand their pharmaceutical business both in local and global market. They have a mission
of harmonizing employees with environmental issues.
Vision of ACME Ltd:
The mission of ACME is to ensure health, vigor and happiness for all.
3.4 IBN SINA Pharmaceuticals Industry Ltd.
The IBN SINA Pharmaceuticals Industry was establish in the year of 1983. They have
manufacturing unit in Gazipur. The manufacturing unit is develop with new technology. They have
high facilities
20
Vision of IBN SINA:
The vision of is to be the most trusted successful and admired pharmaceutical company in
Bangladesh
3.5 ACI Pharmaceuticals Ltd.
With almost three decades of collaborating life and engendering hope, ACI is one of the top
pharmaceutical companies in Bangladesh, employing more than 5,000 people all over the country.
As a progressive and forward-thinking company, ACI Pharma is dedicated to improve the health
of people of Bangladesh through introduction of innovative and reliable pharmaceutical product.
Mission of ACI Pharmaceuticals Ltd:
ACI’s mission is to ensure quality of life of people through advanced technology, skills and
knowledge. They are committed to ensure the pursuit of excellence by providing excellent
products and by innovative process. Customer satisfaction is also concern of ACI.
Vision of ACI Pharmaceuticals Ltd:
Encouraging and assisting in the qualitative improvement of services. Also establish harmonious
relation between customer and distributors.
21
Chapter 4
4. THEORETICAL
ANALYSIS
22
4.1 Ratio Analysis
4.1.1WHAT IS RATIO
Ratio: Ratio means the relationship among selected items that expresses the mathematical relation
between two quantities. In various ways like percentage, rate or simple proportion this relationship
has expressed. Ratio provide information about underlying condition of the company in
comparison with time or competitors. Therefore, in the discussion of ratios we will use the
following types of comparison.
4.1.2 LIQUIDITY RATIO
Current ratio: Current ratio is one of the best-known and widely used ratio formula. It is used to
measure the short-term liquidity. The more the current ratio is the better for the company.
Acid test ratio: Acid test ratio is used to measure the least liquid current asset. The firm may have
overestimated the sales value and overbought or overproduced for this circumstance company uses
to measure least liquid current assets. It is calculate by subtracting inventory from current liabilities
and that is divided by the current liabilities.
4.1.3 ACTIVITY RATIO
The receivables turnover ratio: The receivables turnover ratio is an activity ratio measuring how
efficiently a firm uses its assets Receivables turnover ratio can be calculate by dividing the net
value of credit sales during a given period by the average accounts receivable during the same
period.
Average collection period: Average collection period is refer to as the ratio of days to sales
outstanding. It is the average numbers of days it takes a company to collect its accounts receivable.
The inventory turnover ratio: The inventory turnover ratio is an efficiency ratio that shows how
effectively inventory is manage by comparing cost of goods sold with average inventory for a
period.
The asset turnover ratio: The asset turnover ratio is an efficiency ratio that measures a company's
ability to generate sales from its assets by comparing net sales with average total assets.
Fixed-asset turnover: Fixed-asset turnover is the ratio of sales to the value of fixed assets. It
indicates how well the business is using its fixed assets to generate sales.
4.1.4 PROFITABILITY RATIO
Profitability ratios are the most useful ratios to express the profit of an organization. It shows the
earnings of an organization compared to its expenses and other relevant costs. Stockholders mainly
examine the profitability ratios of a company when they decide to invest. Profit margin, Return on
23
Asset (ROA), Return on Equity (ROE) etc. here are some profitability ratios with graphical
formation.
Gross profit margin: Gross profit margin is a financial metric used to assess a company's financial
health and business model by revealing the proportion of money left over from revenues after
accounting for the cost of goods sold.
Net profit margin: Net profit margin is the percentage of revenue left after all expenses has
deducted from sales. The measurement reveals the amount of profit that a business can extract
from its total sales.
Return on assets (ROA): Return on assets is a financial ratio that shows the percentage of profit
a company earns in relation to its overall resources. It is commonly defined as net income divided
by total assets.
Return on equity (ROE): Return on equity is the amount of net income returned as a percentage
of shareholders equity. Return on equity measures a corporation's profitability by revealing how
much profit a company generates with the money shareholders have invested.
4.1.5 COVERAGE RATIO
Cash coverage ratio: The cash coverage ratio is useful for determining the amount of cash
available to pay for a borrower's interest expense. It expresses as a ratio of the cash available to
the amount of interest to be paid.
Interest coverage ratio: The interest coverage ratio it measures a company’s ability to make
interest payments on its debt in a timely manner. It calculates the firm’s ability to afford the interest
on the debt. The more the ratio, the more the more the firm’s ability to make interest payments on
its debt, and the less the financial risk the firm has to bear.
4.1.6 LEVERAGE RATIO
Debt to equity ratio: Debt to equity ratio used to measure a company’s financial leverage during
the year. This ratio is an important because it shows the company financing that is coming from
its investors and creditors. It is calculated by dividing the net income and total equity.
Debt to total asset ratio: The debt to total asset ratio is a coverage or solvency ratio. It measures
the percentage of assets and compares the total debt to asset needed to pay liquidity to its long-
term debt
24
Chapter 5
5. INDUSTRY RATIO
ANALYSIS
25
5.1 Industry Ratio Analysis
There are 50+ companies in Bangladesh for this health sector. However, for the project report I
took only five companies as industry combination. Those five companies already mentioned. Now
I present the industry average results. Note that these average results of each ratio of each
compared with all of five companies.
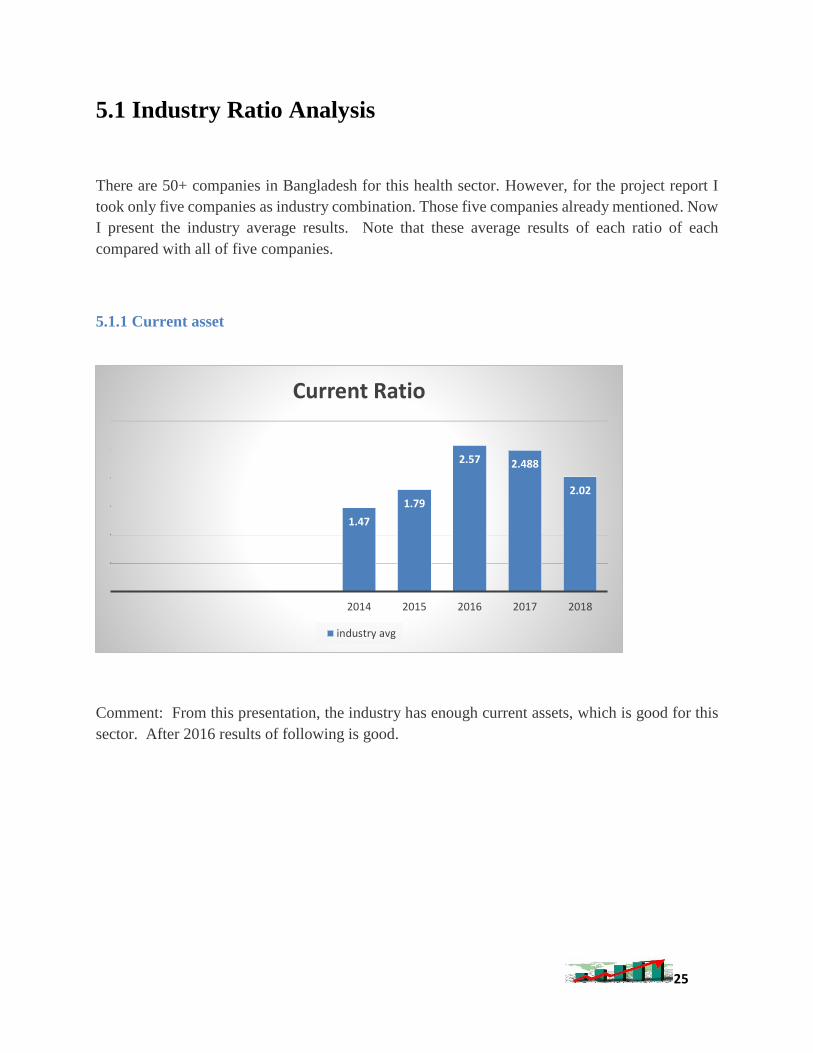
5.1.1 Current asset
Comment: From this presentation, the industry has enough current assets, which is good for this
sector. After 2016 results of following is good.
1.47
1.79
2.57 2.488
2.02
2014 2015 2016 2017 2018
Current Ratio
industry avg
26
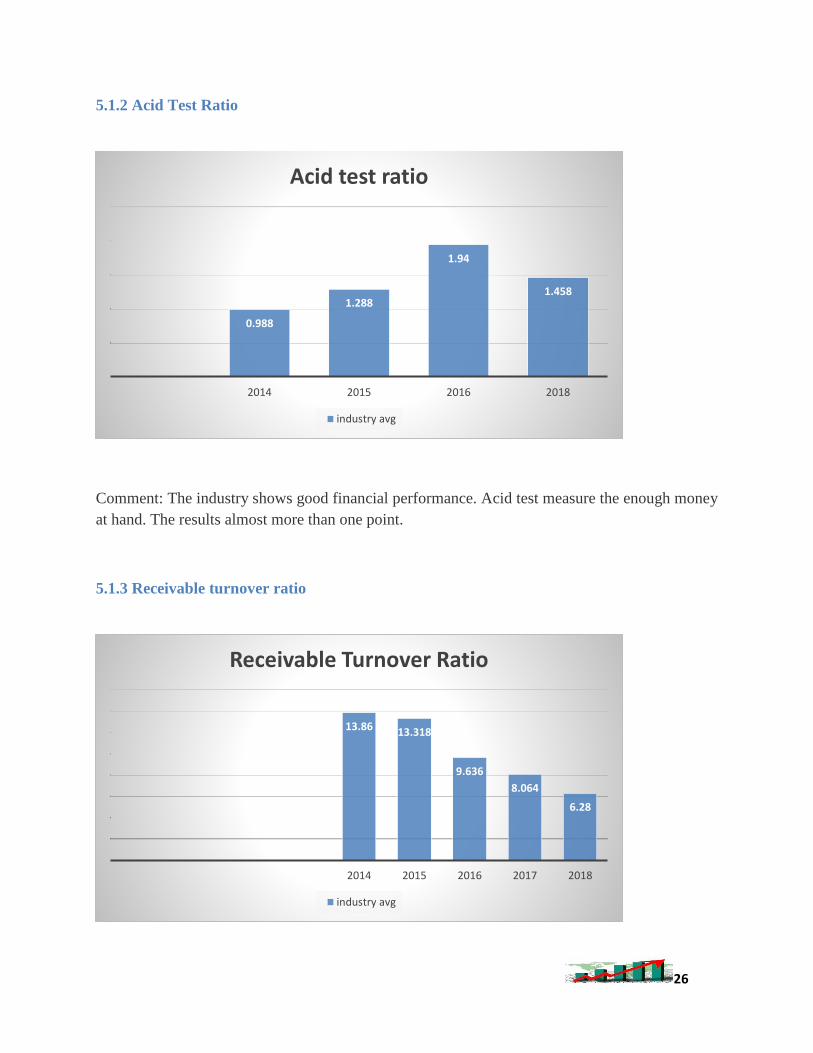
5.1.2 Acid Test Ratio
Comment: The industry shows good financial performance. Acid test measure the enough money
at hand. The results almost more than one point.
5.1.3 Receivable turnover ratio
0.988
1.288
1.94
1.458
2014 2015 2016 2018
Acid test ratio
industry avg
13.86 13.318
9.636
8.064
6.28
2014 2015 2016 2017 2018
Receivable Turnover Ratio
industry avg
27
Comment: In 2014 and 2015 the ratio, look higher. But the rest of the year it’s declining. Industry
should focus on it.
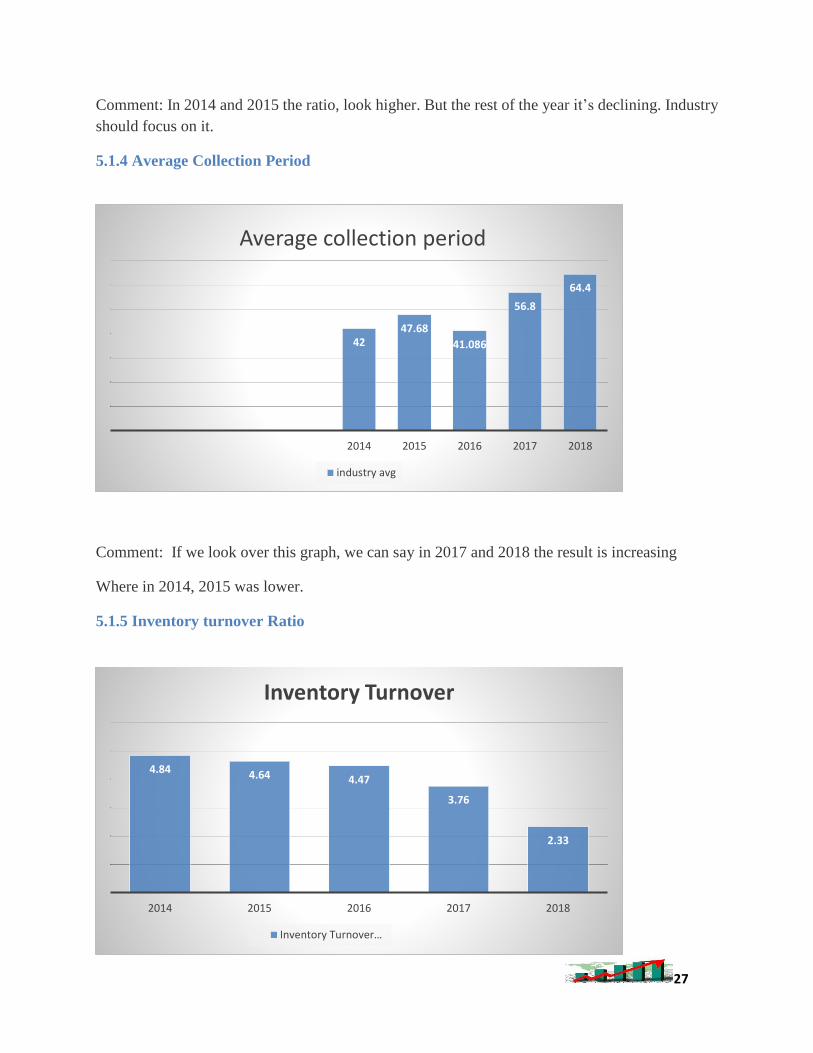
5.1.4 Average Collection Period
Comment: If we look over this graph, we can say in 2017 and 2018 the result is increasing
Where in 2014, 2015 was lower.
5.1.5 Inventory turnover Ratio
4247.68
41.086
56.8
64.4
2014 2015 2016 2017 2018
Average collection period
industry avg
4.84 4.64 4.47
3.76
2.33
2014 2015 2016 2017 2018
Inventory Turnover
Inventory Turnover…
28
Comment: The inventory turnover ratio is an efficiency ratio that shows how effectively inventory
is manage by comparing cost of goods sold with average inventory for a period. The graph shows
that the ratio is stable in these years.
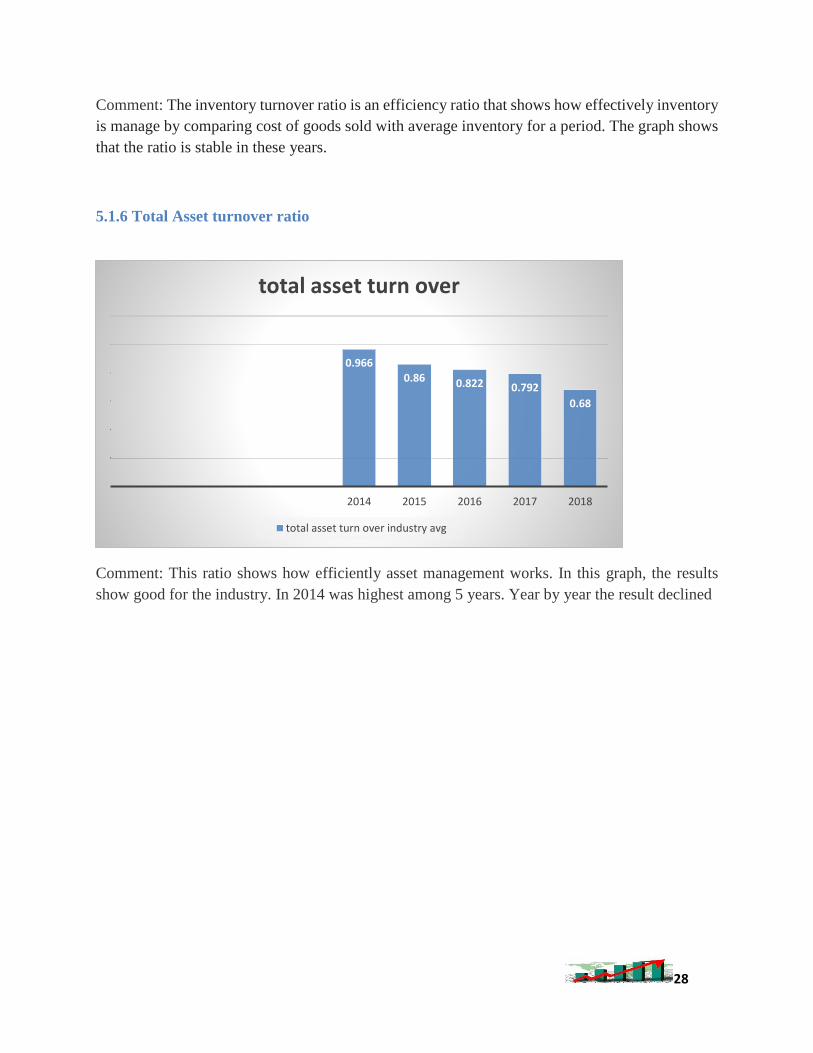
5.1.6 Total Asset turnover ratio
Comment: This ratio shows how efficiently asset management works. In this graph, the results
show good for the industry. In 2014 was highest among 5 years. Year by year the result declined
0.966
0.86 0.822 0.792
0.68
2014 2015 2016 2017 2018
total asset turn over
total asset turn over industry avg
29
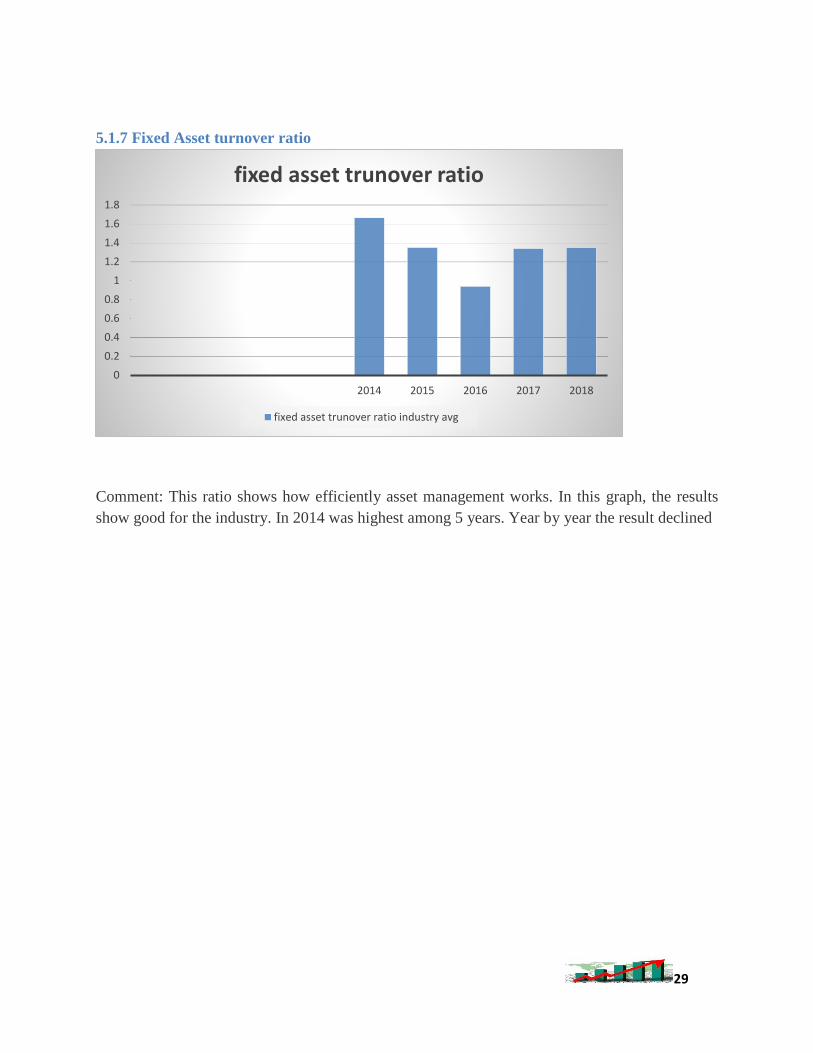
5.1.7 Fixed Asset turnover ratio
Comment: This ratio shows how efficiently asset management works. In this graph, the results
show good for the industry. In 2014 was highest among 5 years. Year by year the result declined
0
0.2
0.4
0.6
0.8
1
1.2
1.4
1.6
1.8
2014 2015 2016 2017 2018
fixed asset trunover ratio
fixed asset trunover ratio industry avg
30
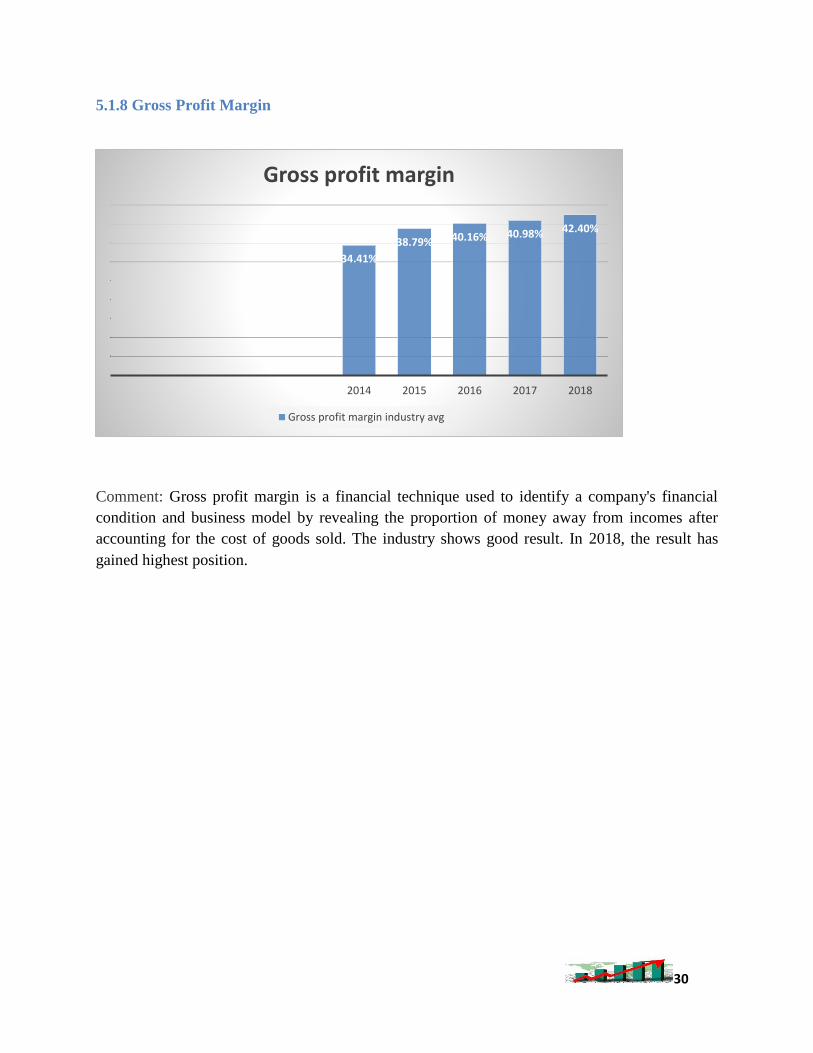
5.1.8 Gross Profit Margin
Comment: Gross profit margin is a financial technique used to identify a company's financial
condition and business model by revealing the proportion of money away from incomes after
accounting for the cost of goods sold. The industry shows good result. In 2018, the result has
gained highest position.
34.41%
38.79% 40.16% 40.98% 42.40%
2014 2015 2016 2017 2018
Gross profit margin
Gross profit margin industry avg
31
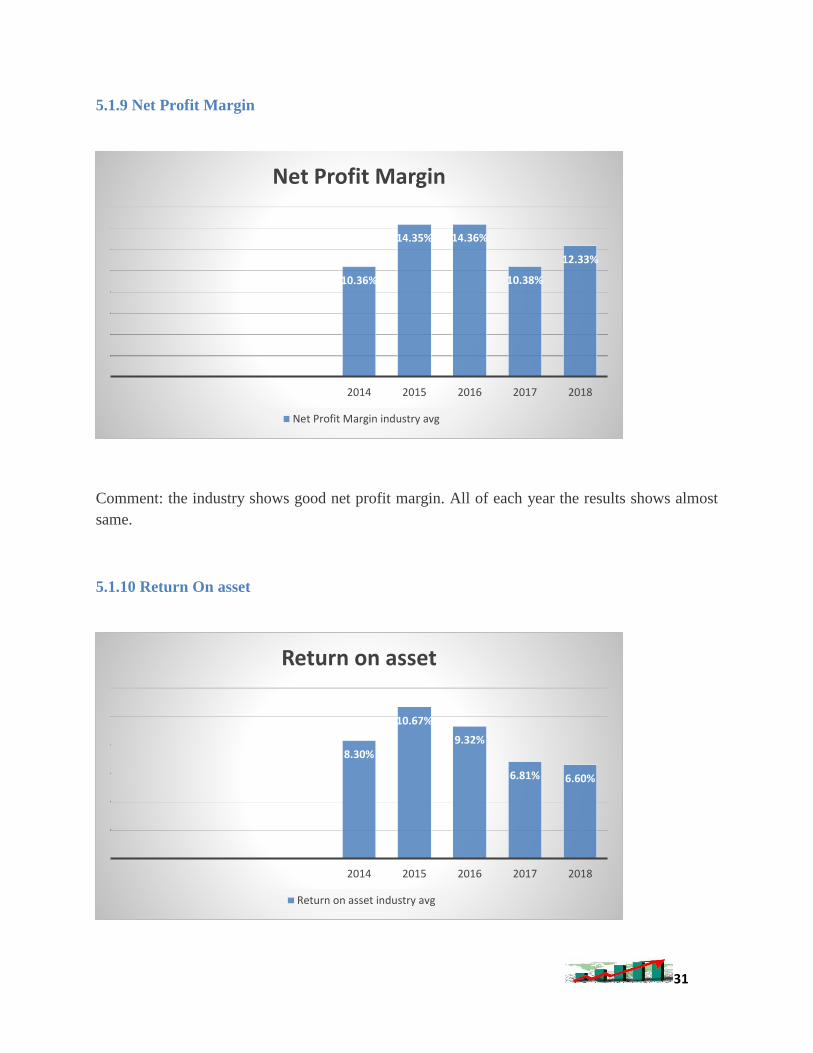
5.1.9 Net Profit Margin
Comment: the industry shows good net profit margin. All of each year the results shows almost
same.
5.1.10 Return On asset
10.36%
14.35% 14.36%
10.38%
12.33%
2014 2015 2016 2017 2018
Net Profit Margin
Net Profit Margin industry avg
8.30%
10.67%
9.32%
6.81% 6.60%
2014 2015 2016 2017 2018
Return on asset
Return on asset industry avg
32
Comment: Return on assets is a financial ratio that shows the percentage of profit a company earns
in relation to its overall resources. It is commonly defined as net income divided by total assets.
The industry shows moderate performance here
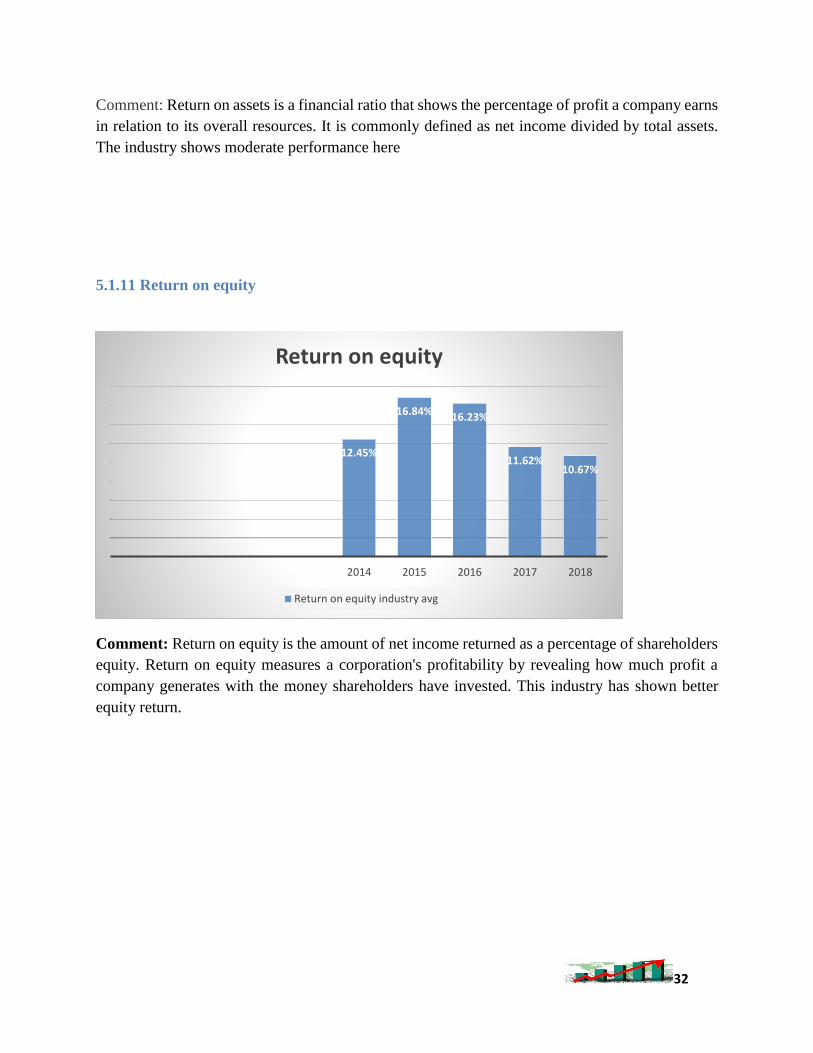
5.1.11 Return on equity
Comment: Return on equity is the amount of net income returned as a percentage of shareholders
equity. Return on equity measures a corporation's profitability by revealing how much profit a
company generates with the money shareholders have invested. This industry has shown better
equity return.
12.45%
16.84% 16.23%
11.62%10.67%
2014 2015 2016 2017 2018
Return on equity
Return on equity industry avg
33
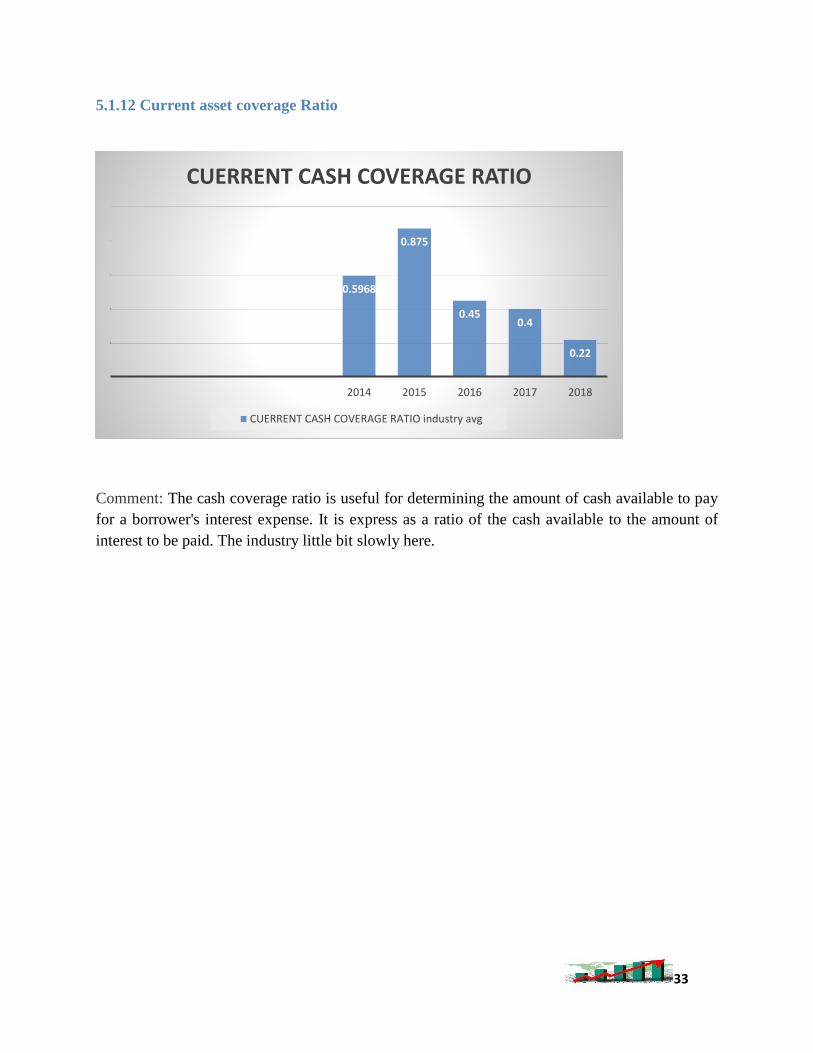
5.1.12 Current asset coverage Ratio
Comment: The cash coverage ratio is useful for determining the amount of cash available to pay
for a borrower's interest expense. It is express as a ratio of the cash available to the amount of
interest to be paid. The industry little bit slowly here.
0.5968
0.875
0.450.4
0.22
2014 2015 2016 2017 2018
CUERRENT CASH COVERAGE RATIO
CUERRENT CASH COVERAGE RATIO industry avg
34
5.1.13 Interest coverage Ratio
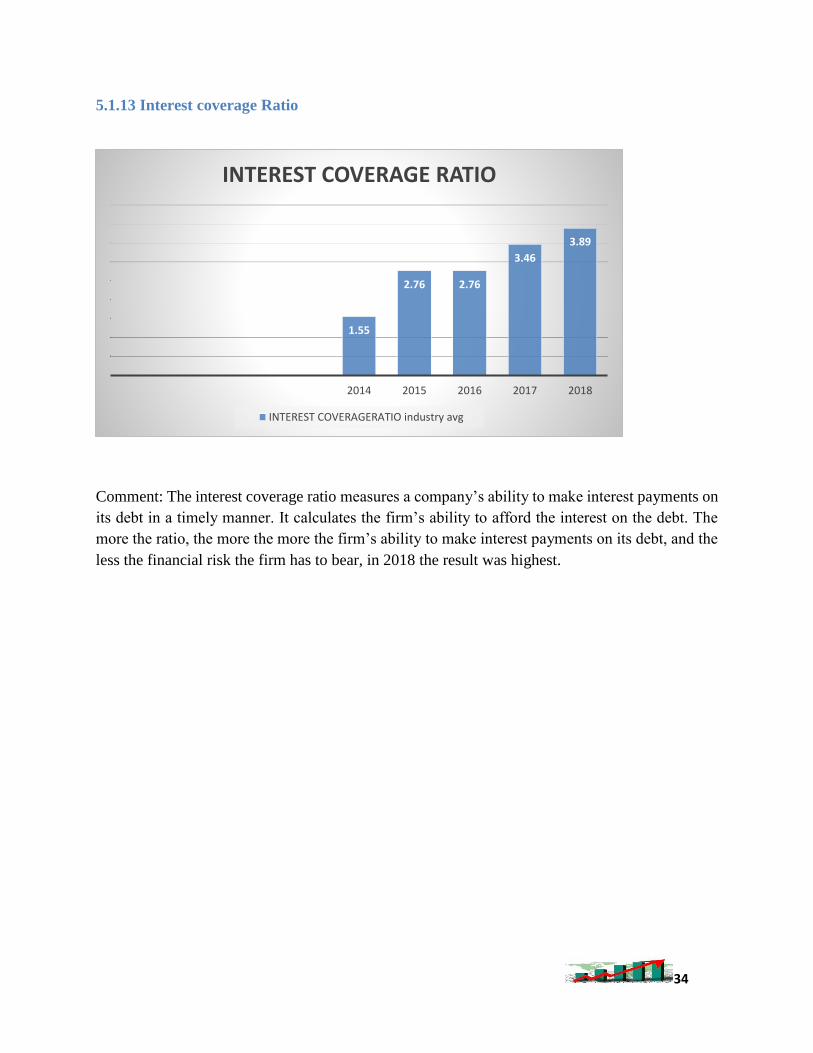
Comment: The interest coverage ratio measures a company’s ability to make interest payments on
its debt in a timely manner. It calculates the firm’s ability to afford the interest on the debt. The
more the ratio, the more the more the firm’s ability to make interest payments on its debt, and the
less the financial risk the firm has to bear, in 2018 the result was highest.
1.55
2.76 2.76
3.46
3.89
2014 2015 2016 2017 2018
INTEREST COVERAGE RATIO
INTEREST COVERAGERATIO industry avg
35
5.1.14 Debt to equity Ratio
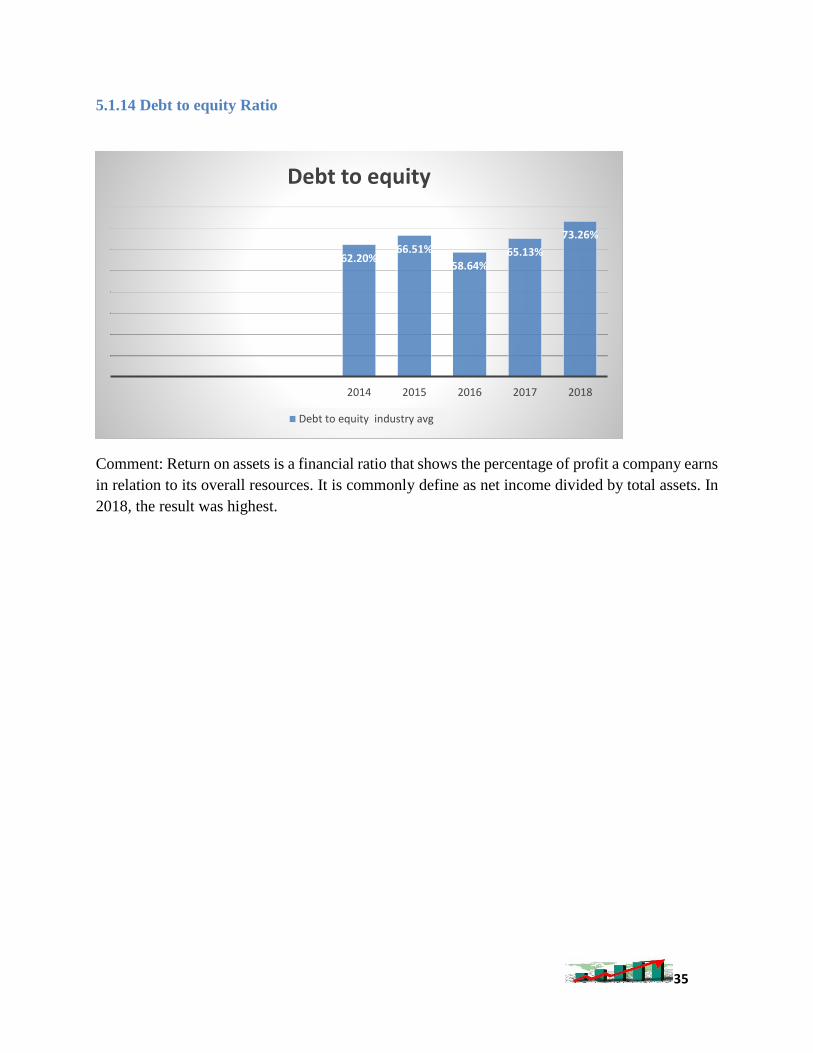
Comment: Return on assets is a financial ratio that shows the percentage of profit a company earns
in relation to its overall resources. It is commonly define as net income divided by total assets. In
2018, the result was highest.
62.20%66.51%
58.64%65.13%
73.26%
2014 2015 2016 2017 2018
Debt to equity
Debt to equity industry avg
36
5.1.15 Debt to Asset Ratio
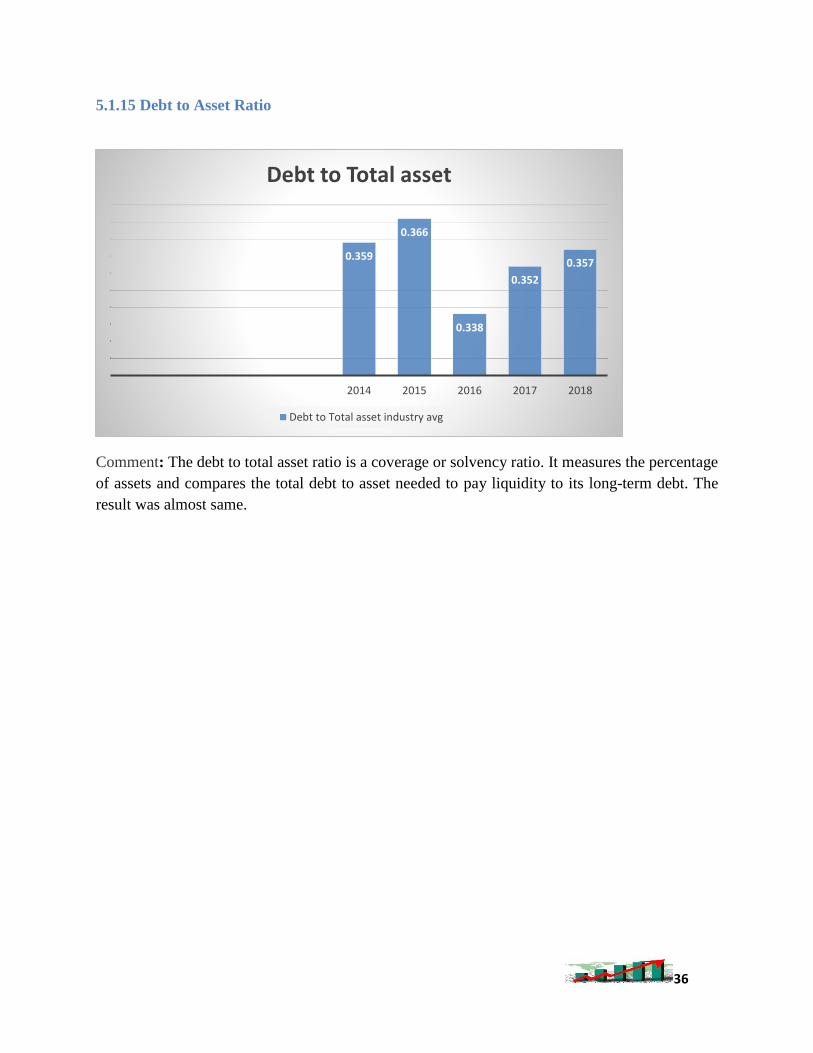
Comment: The debt to total asset ratio is a coverage or solvency ratio. It measures the percentage
of assets and compares the total debt to asset needed to pay liquidity to its long-term debt. The
result was almost same.
0.359
0.366
0.338
0.352
0.357
2014 2015 2016 2017 2018
Debt to Total asset
Debt to Total asset industry avg
37
Chapter 6
6. COMPANY’S RATIO
ANALYSIS AND
INTERPRETATION
38
6.1 Ratio analysis of Beximco Pharmaceuticals
CURRENT RATIO
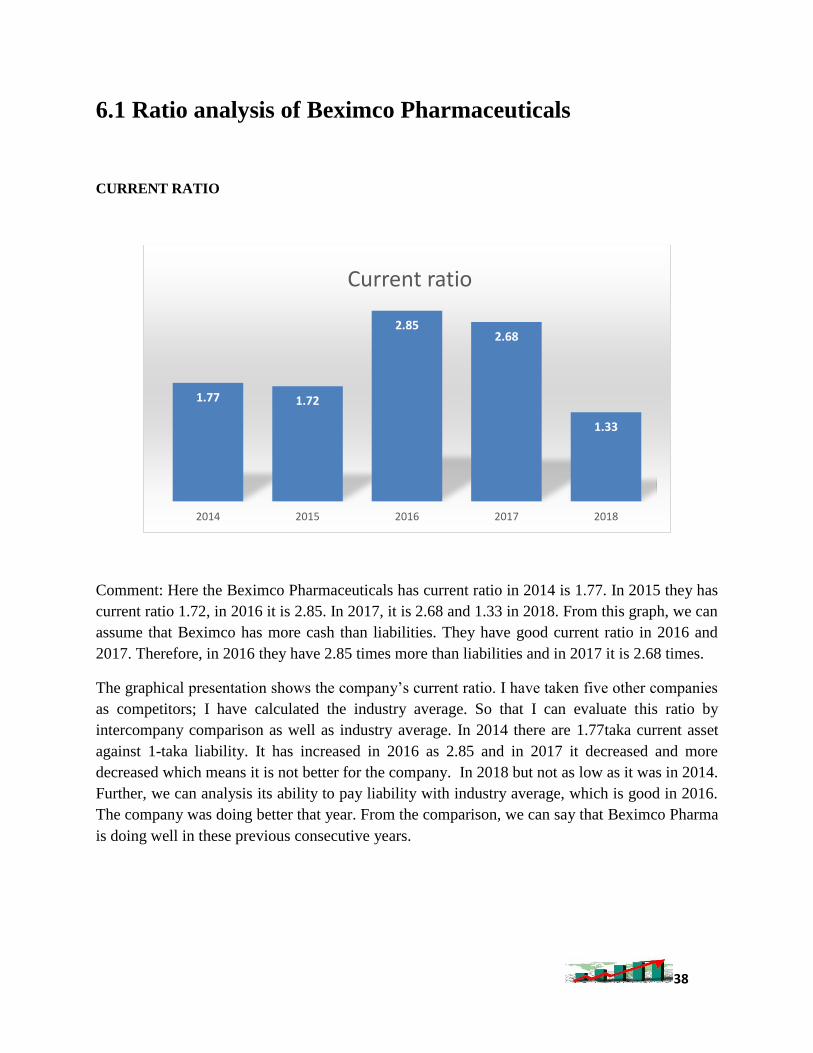
Comment: Here the Beximco Pharmaceuticals has current ratio in 2014 is 1.77. In 2015 they has
current ratio 1.72, in 2016 it is 2.85. In 2017, it is 2.68 and 1.33 in 2018. From this graph, we can
assume that Beximco has more cash than liabilities. They have good current ratio in 2016 and
2017. Therefore, in 2016 they have 2.85 times more than liabilities and in 2017 it is 2.68 times.
The graphical presentation shows the company’s current ratio. I have taken five other companies
as competitors; I have calculated the industry average. So that I can evaluate this ratio by
intercompany comparison as well as industry average. In 2014 there are 1.77taka current asset
against 1-taka liability. It has increased in 2016 as 2.85 and in 2017 it decreased and more
decreased which means it is not better for the company. In 2018 but not as low as it was in 2014.
Further, we can analysis its ability to pay liability with industry average, which is good in 2016.
The company was doing better that year. From the comparison, we can say that Beximco Pharma
is doing well in these previous consecutive years.
1.77 1.72
2.852.68
1.33
2014 2015 2016 2017 2018
Current ratio
39
ACID TEST RATIO
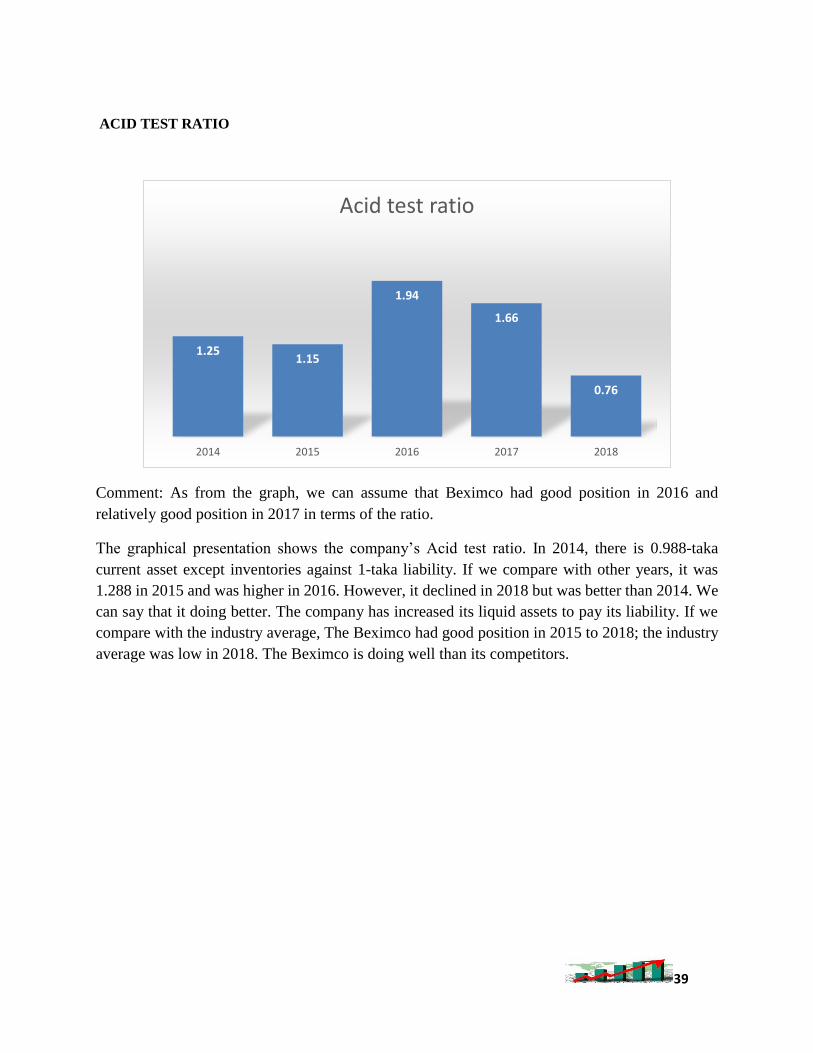
Comment: As from the graph, we can assume that Beximco had good position in 2016 and
relatively good position in 2017 in terms of the ratio.
The graphical presentation shows the company’s Acid test ratio. In 2014, there is 0.988-taka
current asset except inventories against 1-taka liability. If we compare with other years, it was
1.288 in 2015 and was higher in 2016. However, it declined in 2018 but was better than 2014. We
can say that it doing better. The company has increased its liquid assets to pay its liability. If we
compare with the industry average, The Beximco had good position in 2015 to 2018; the industry
average was low in 2018. The Beximco is doing well than its competitors.
1.251.15
1.94
1.66
0.76
2014 2015 2016 2017 2018
Acid test ratio
40
THE RECEIVABLES TURNOVER RATIO
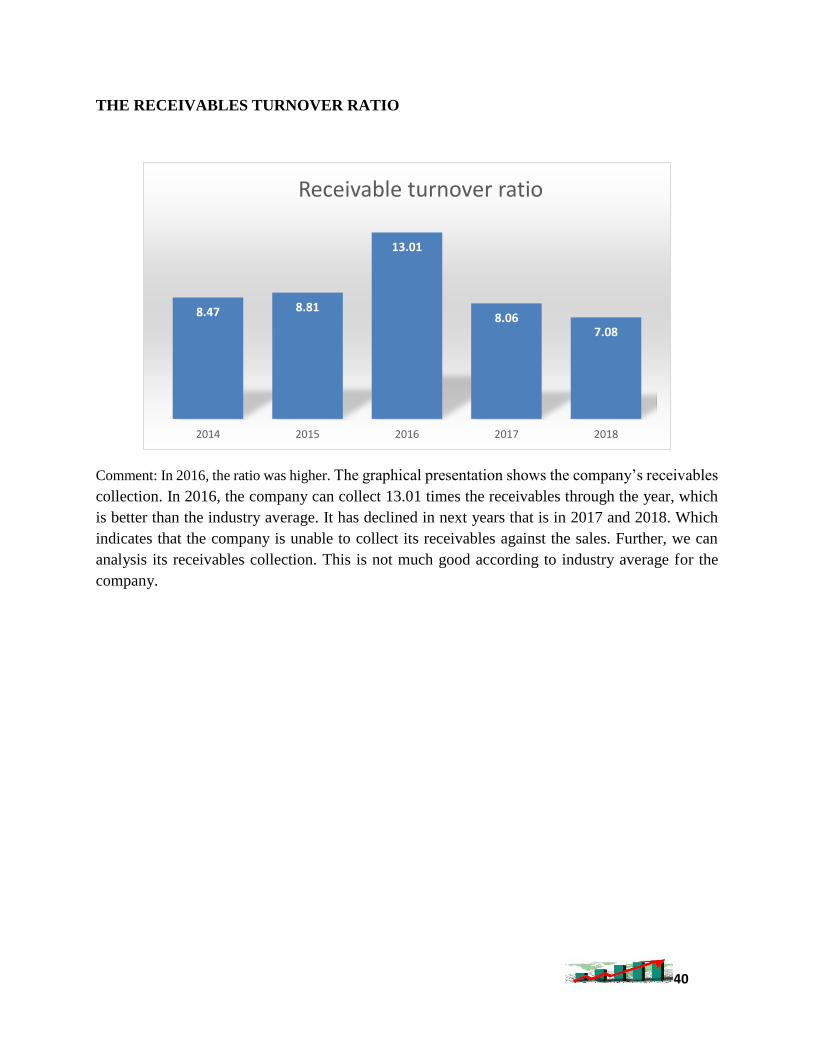
Comment: In 2016, the ratio was higher. The graphical presentation shows the company’s receivables
collection. In 2016, the company can collect 13.01 times the receivables through the year, which
is better than the industry average. It has declined in next years that is in 2017 and 2018. Which
indicates that the company is unable to collect its receivables against the sales. Further, we can
analysis its receivables collection. This is not much good according to industry average for the
company.
8.47 8.81
13.01
8.067.08
2014 2015 2016 2017 2018
Receivable turnover ratio
41
AVERAGE COLLECTION PERIOD
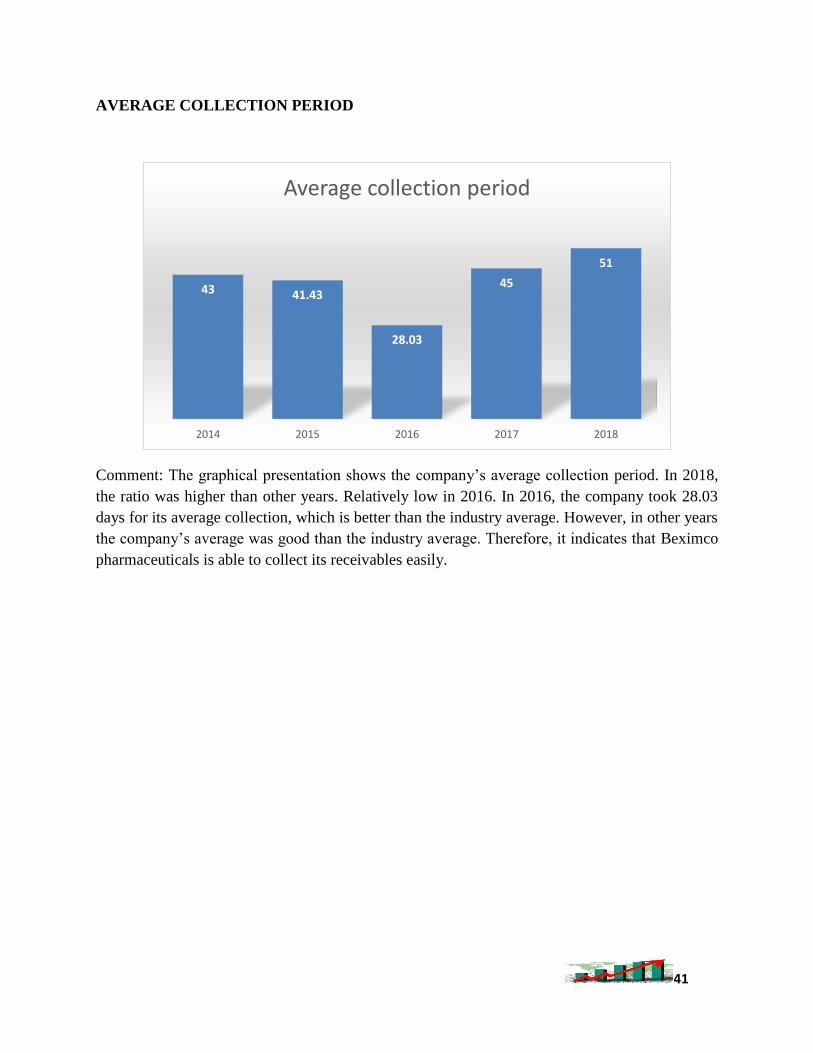
Comment: The graphical presentation shows the company’s average collection period. In 2018,
the ratio was higher than other years. Relatively low in 2016. In 2016, the company took 28.03
days for its average collection, which is better than the industry average. However, in other years
the company’s average was good than the industry average. Therefore, it indicates that Beximco
pharmaceuticals is able to collect its receivables easily.
43 41.43
28.03
45
51
2014 2015 2016 2017 2018
Average collection period
42
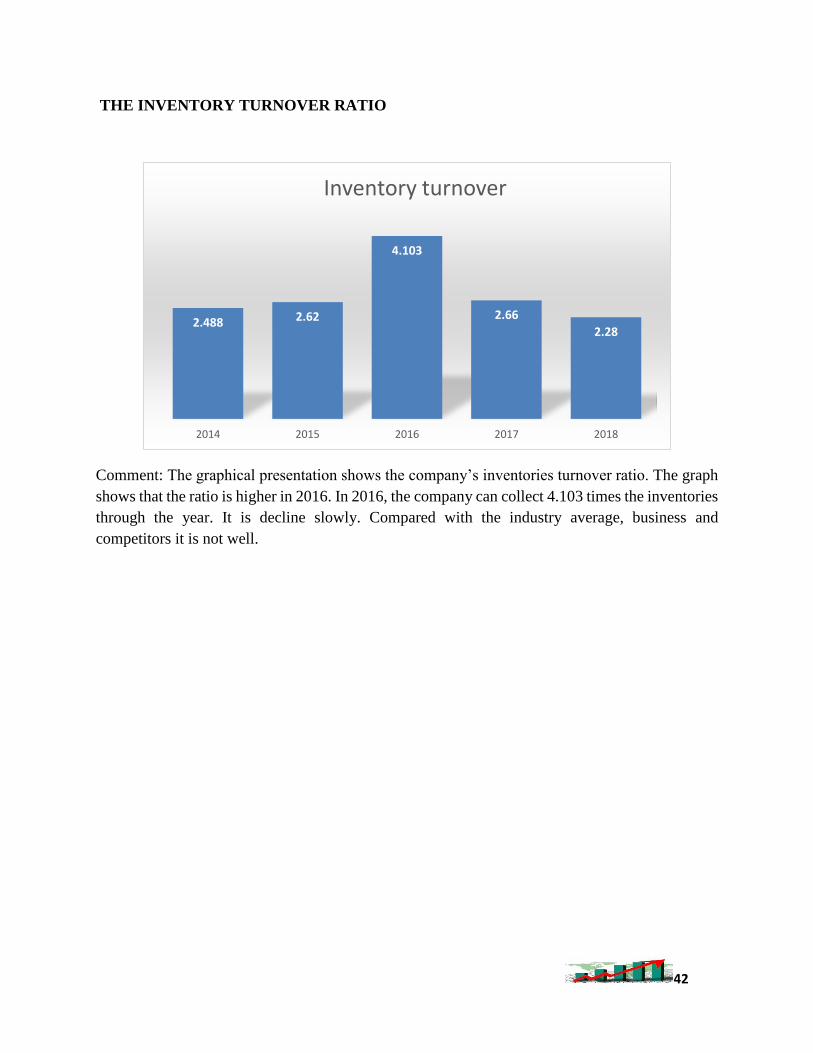
THE INVENTORY TURNOVER RATIO
Comment: The graphical presentation shows the company’s inventories turnover ratio. The graph
shows that the ratio is higher in 2016. In 2016, the company can collect 4.103 times the inventories
through the year. It is decline slowly. Compared with the industry average, business and
competitors it is not well.
2.488 2.62
4.103
2.66
2.28
2014 2015 2016 2017 2018
Inventory turnover
43
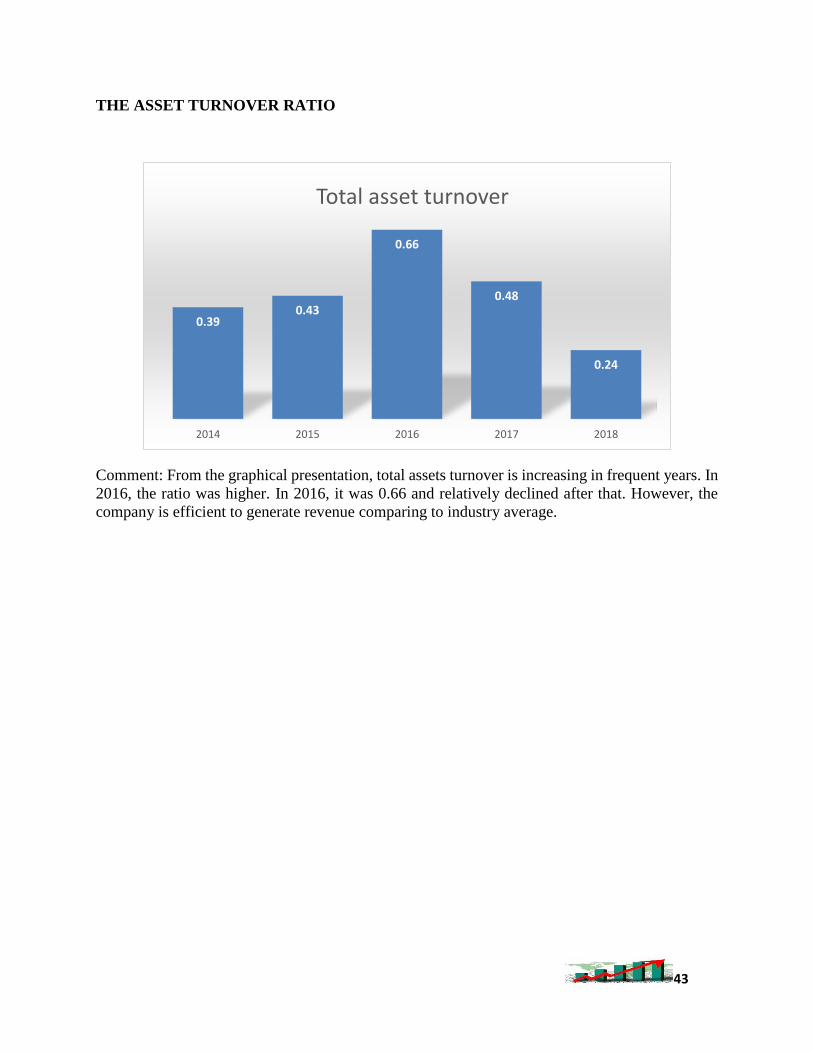
THE ASSET TURNOVER RATIO
Comment: From the graphical presentation, total assets turnover is increasing in frequent years. In
2016, the ratio was higher. In 2016, it was 0.66 and relatively declined after that. However, the
company is efficient to generate revenue comparing to industry average.
0.390.43
0.66
0.48
0.24
2014 2015 2016 2017 2018
Total asset turnover
44
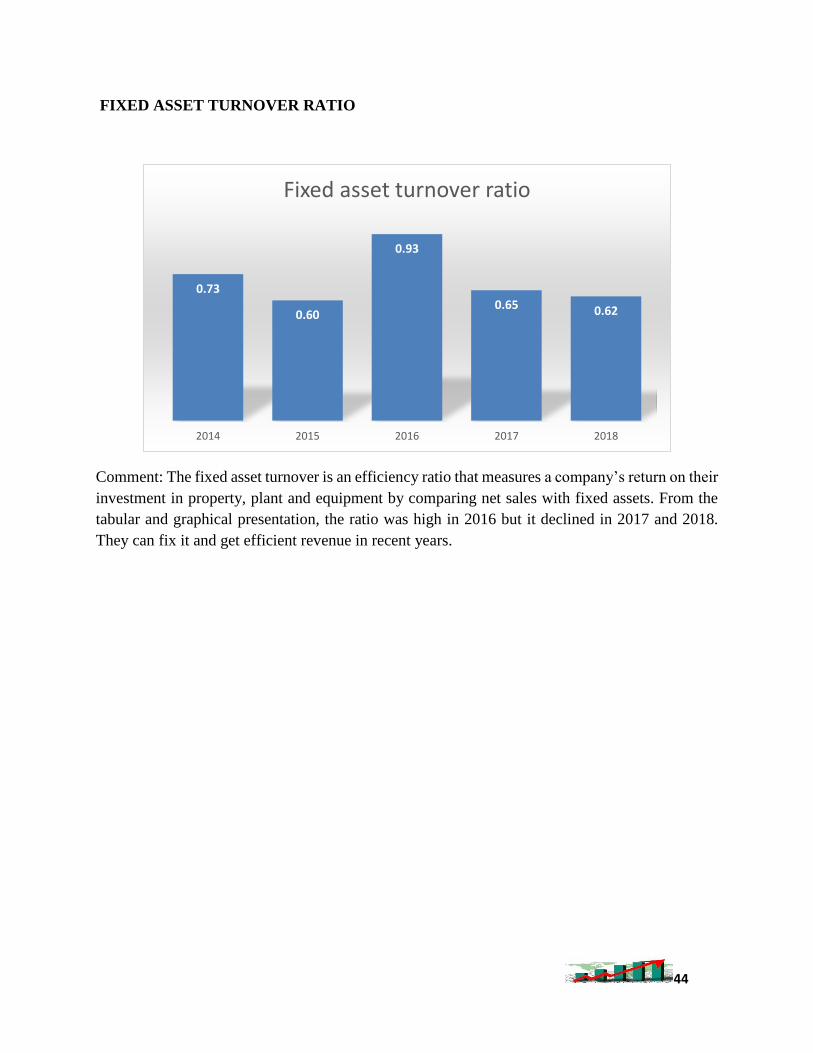
FIXED ASSET TURNOVER RATIO
Comment: The fixed asset turnover is an efficiency ratio that measures a company’s return on their
investment in property, plant and equipment by comparing net sales with fixed assets. From the
tabular and graphical presentation, the ratio was high in 2016 but it declined in 2017 and 2018.
They can fix it and get efficient revenue in recent years.
0.73
0.60
0.93
0.65 0.62
2014 2015 2016 2017 2018
Fixed asset turnover ratio
45
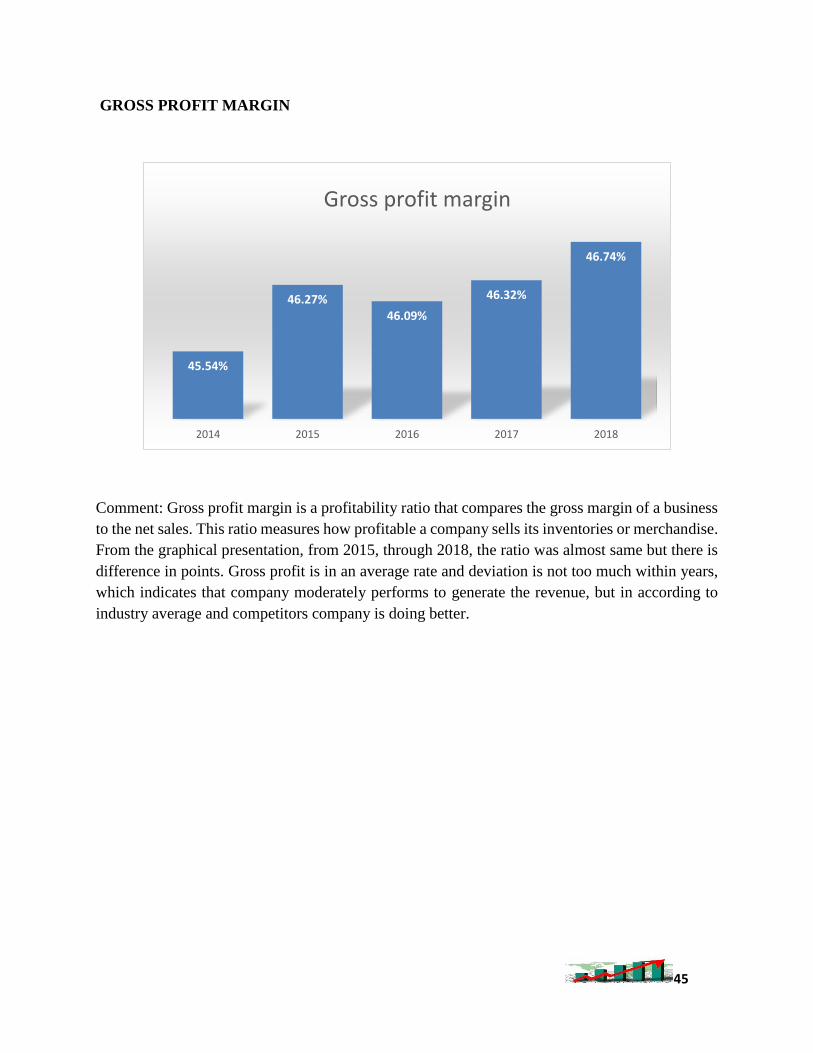
GROSS PROFIT MARGIN
Comment: Gross profit margin is a profitability ratio that compares the gross margin of a business
to the net sales. This ratio measures how profitable a company sells its inventories or merchandise.
From the graphical presentation, from 2015, through 2018, the ratio was almost same but there is
difference in points. Gross profit is in an average rate and deviation is not too much within years,
which indicates that company moderately performs to generate the revenue, but in according to
industry average and competitors company is doing better.
45.54%
46.27%46.09%
46.32%
46.74%
2014 2015 2016 2017 2018
Gross profit margin
46
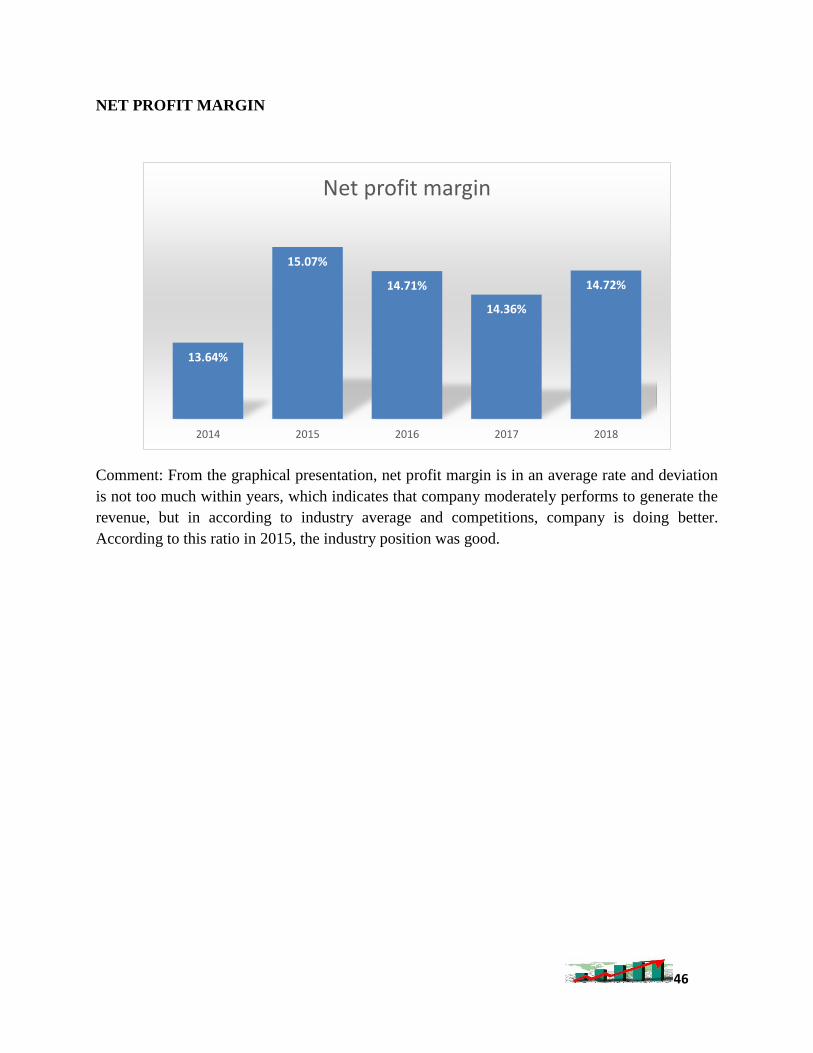
NET PROFIT MARGIN
Comment: From the graphical presentation, net profit margin is in an average rate and deviation
is not too much within years, which indicates that company moderately performs to generate the
revenue, but in according to industry average and competitions, company is doing better.
According to this ratio in 2015, the industry position was good.
13.64%
15.07%
14.71%
14.36%
14.72%
2014 2015 2016 2017 2018
Net profit margin
47
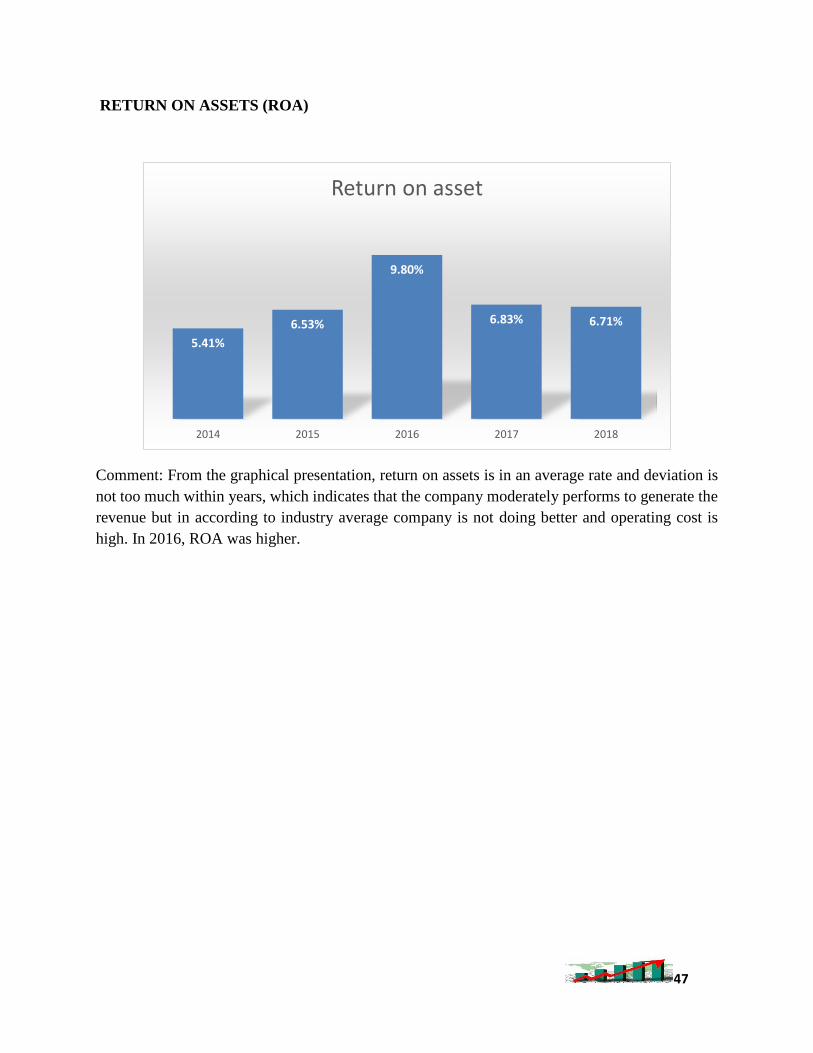
RETURN ON ASSETS (ROA)
Comment: From the graphical presentation, return on assets is in an average rate and deviation is
not too much within years, which indicates that the company moderately performs to generate the
revenue but in according to industry average company is not doing better and operating cost is
high. In 2016, ROA was higher.
5.41%
6.53%
9.80%
6.83% 6.71%
2014 2015 2016 2017 2018
Return on asset
48
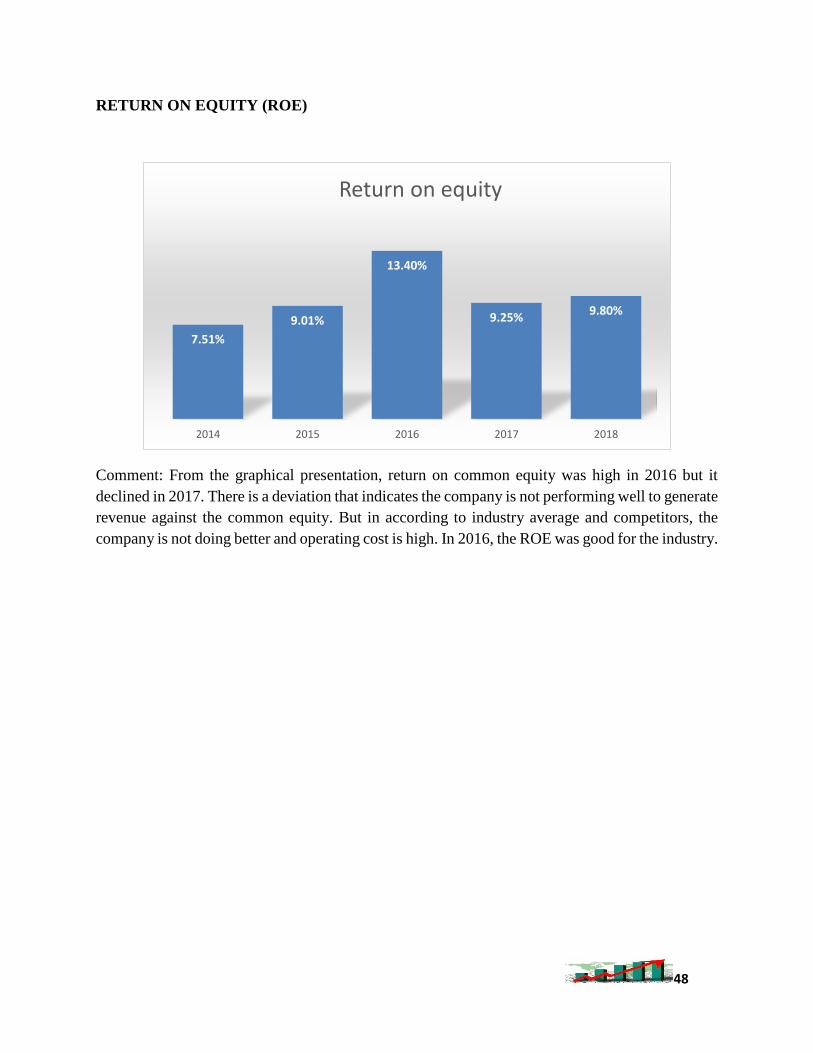
RETURN ON EQUITY (ROE)
Comment: From the graphical presentation, return on common equity was high in 2016 but it
declined in 2017. There is a deviation that indicates the company is not performing well to generate
revenue against the common equity. But in according to industry average and competitors, the
company is not doing better and operating cost is high. In 2016, the ROE was good for the industry.
7.51%
9.01%
13.40%
9.25%9.80%
2014 2015 2016 2017 2018
Return on equity
49
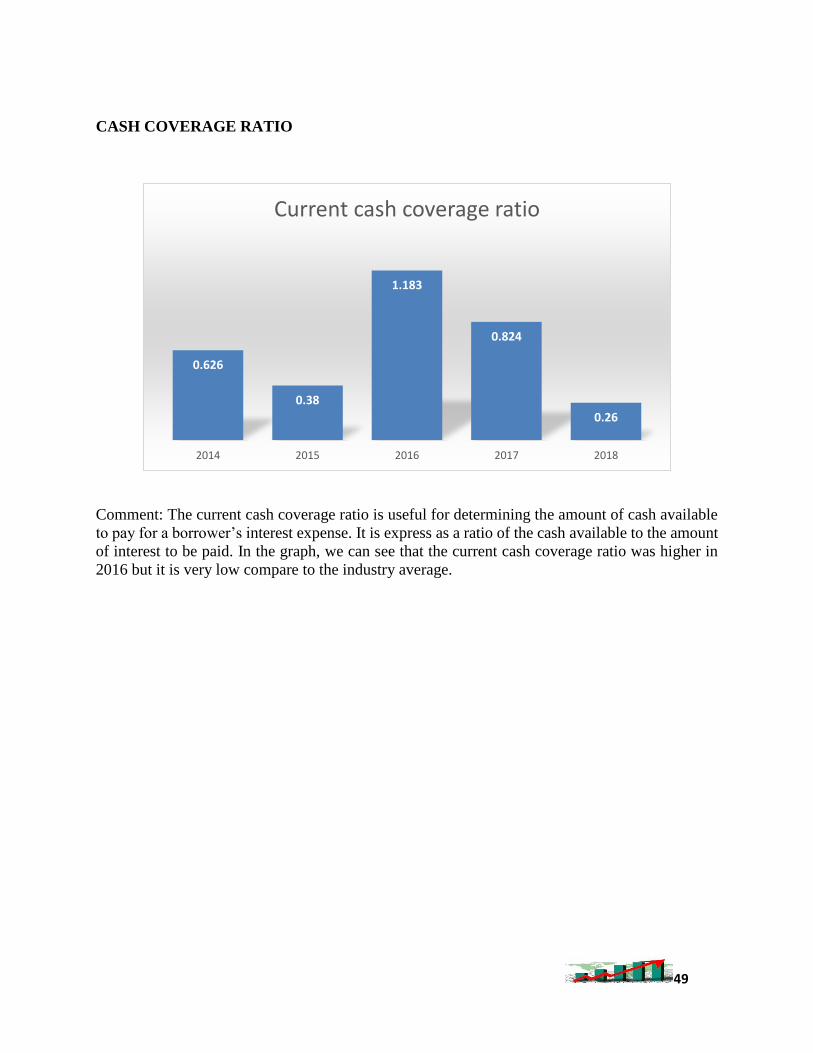
CASH COVERAGE RATIO
Comment: The current cash coverage ratio is useful for determining the amount of cash available
to pay for a borrower’s interest expense. It is express as a ratio of the cash available to the amount
of interest to be paid. In the graph, we can see that the current cash coverage ratio was higher in
2016 but it is very low compare to the industry average.
0.626
0.38
1.183
0.824
0.26
2014 2015 2016 2017 2018
Current cash coverage ratio
50
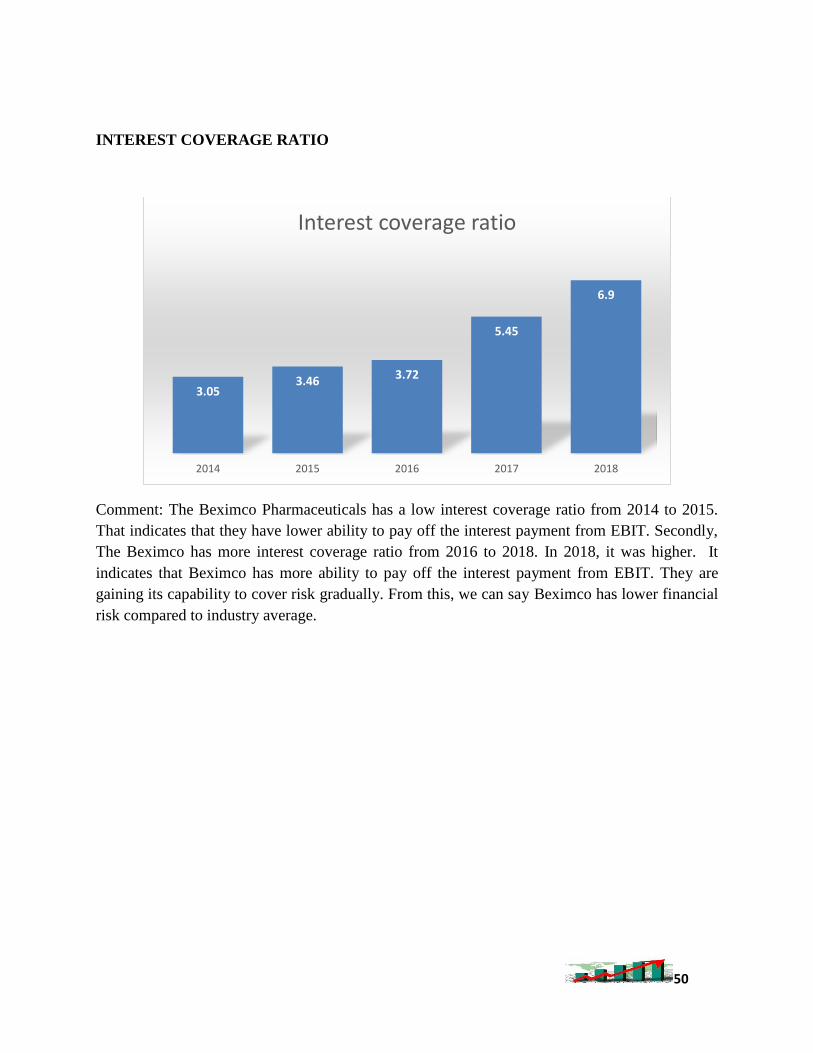
INTEREST COVERAGE RATIO
Comment: The Beximco Pharmaceuticals has a low interest coverage ratio from 2014 to 2015.
That indicates that they have lower ability to pay off the interest payment from EBIT. Secondly,
The Beximco has more interest coverage ratio from 2016 to 2018. In 2018, it was higher. It
indicates that Beximco has more ability to pay off the interest payment from EBIT. They are
gaining its capability to cover risk gradually. From this, we can say Beximco has lower financial
risk compared to industry average.
3.053.46 3.72
5.45
6.9
2014 2015 2016 2017 2018
Interest coverage ratio
51
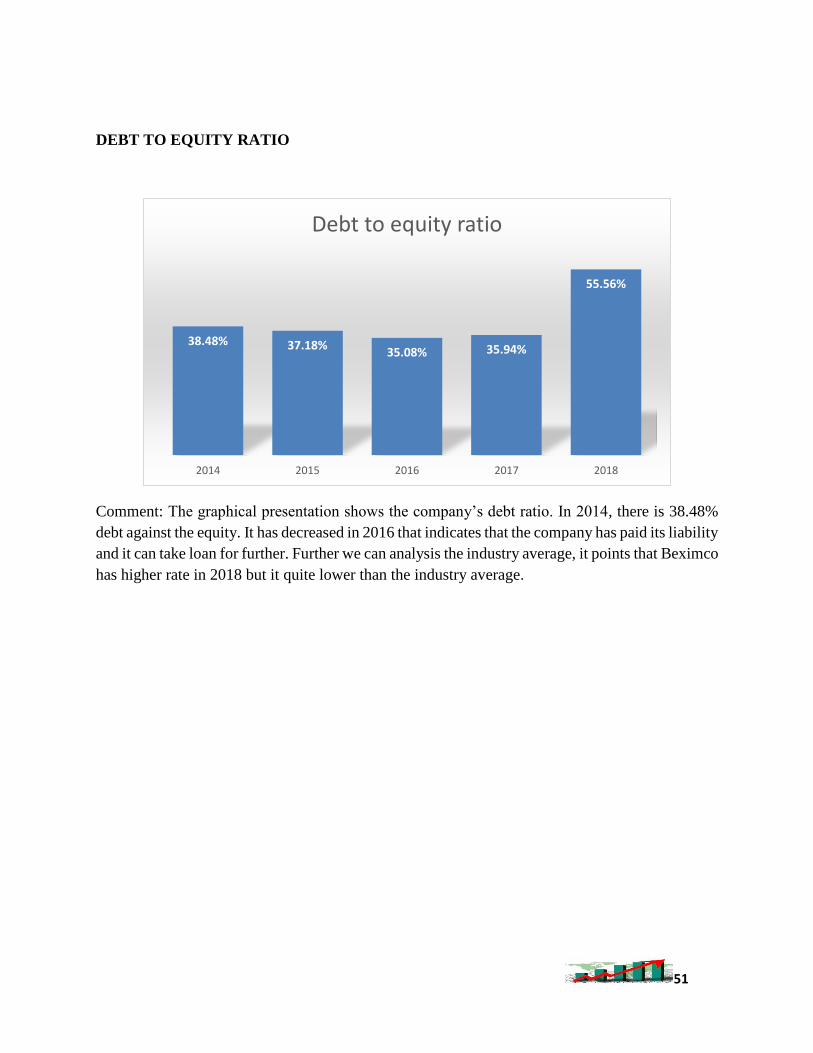
DEBT TO EQUITY RATIO
Comment: The graphical presentation shows the company’s debt ratio. In 2014, there is 38.48%
debt against the equity. It has decreased in 2016 that indicates that the company has paid its liability
and it can take loan for further. Further we can analysis the industry average, it points that Beximco
has higher rate in 2018 but it quite lower than the industry average.
38.48% 37.18%35.08% 35.94%
55.56%
2014 2015 2016 2017 2018
Debt to equity ratio
52
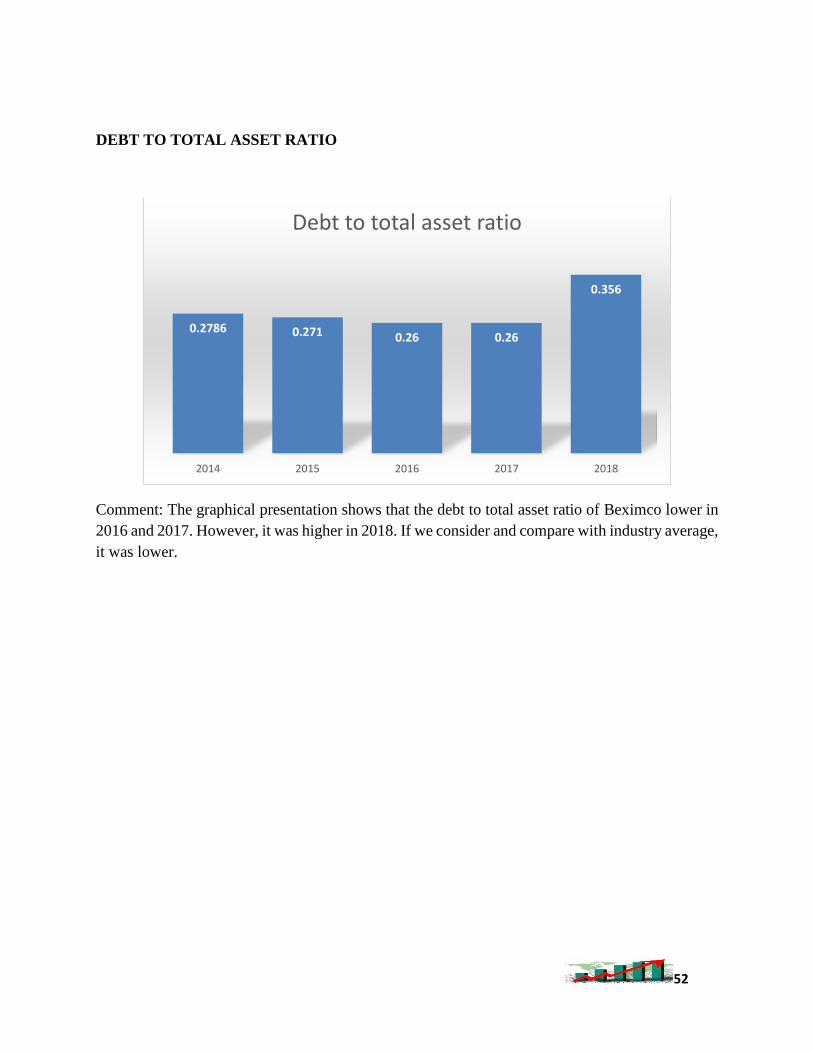
DEBT TO TOTAL ASSET RATIO
Comment: The graphical presentation shows that the debt to total asset ratio of Beximco lower in
2016 and 2017. However, it was higher in 2018. If we consider and compare with industry average,
it was lower.
0.2786 0.271 0.26 0.26
0.356
2014 2015 2016 2017 2018
Debt to total asset ratio
53
6.2 Ratio Analysis of Square Pharmaceuticals Ltd
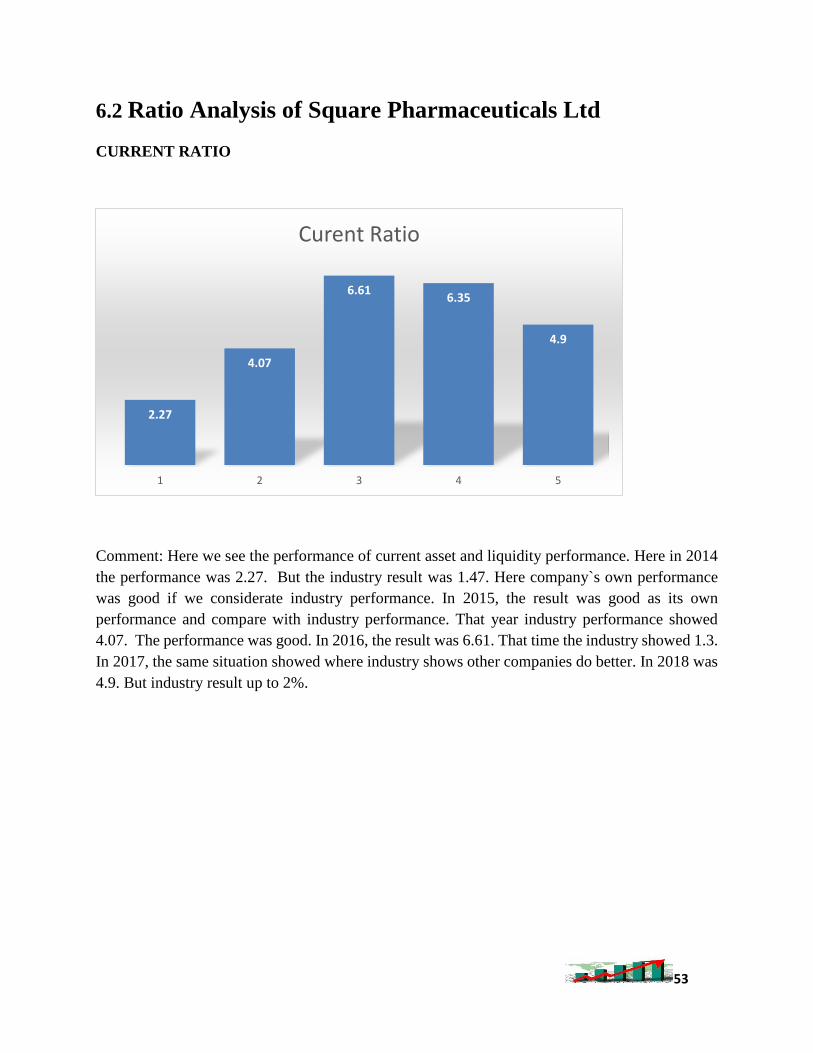
CURRENT RATIO
Comment: Here we see the performance of current asset and liquidity performance. Here in 2014
the performance was 2.27. But the industry result was 1.47. Here company`s own performance
was good if we considerate industry performance. In 2015, the result was good as its own
performance and compare with industry performance. That year industry performance showed
4.07. The performance was good. In 2016, the result was 6.61. That time the industry showed 1.3.
In 2017, the same situation showed where industry shows other companies do better. In 2018 was
4.9. But industry result up to 2%.
2.27
4.07
6.616.35
4.9
1 2 3 4 5
Curent Ratio
54
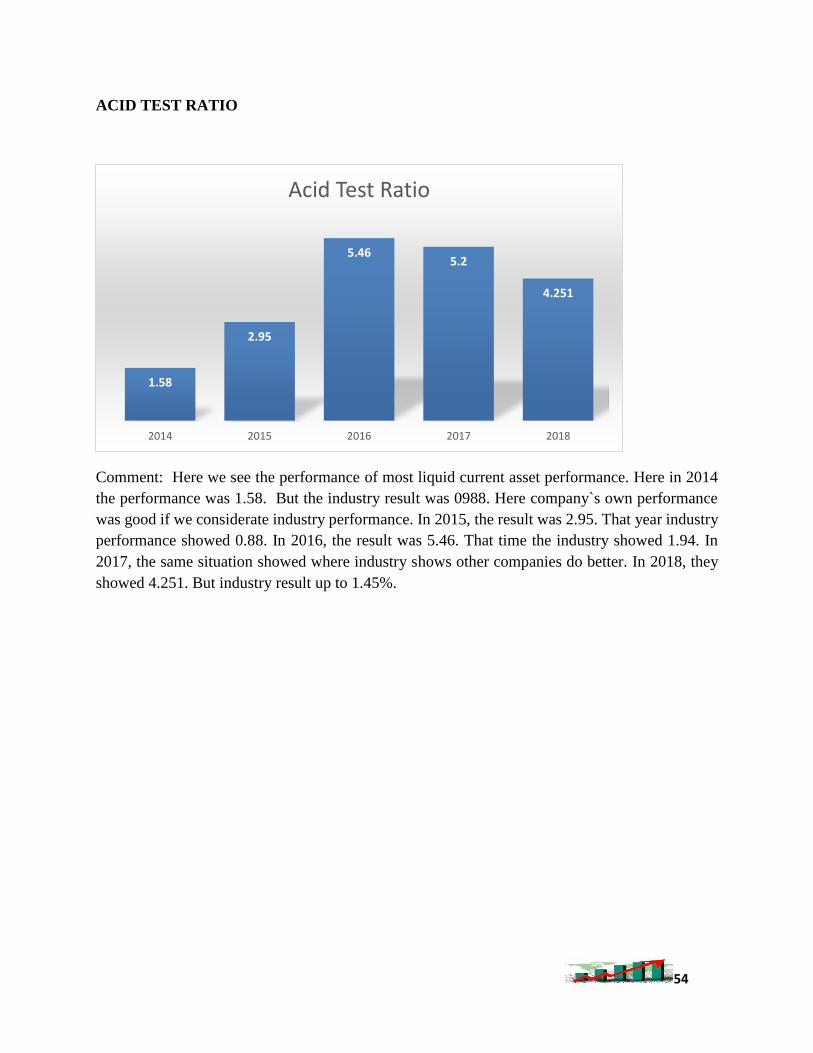
ACID TEST RATIO
Comment: Here we see the performance of most liquid current asset performance. Here in 2014
the performance was 1.58. But the industry result was 0988. Here company`s own performance
was good if we considerate industry performance. In 2015, the result was 2.95. That year industry
performance showed 0.88. In 2016, the result was 5.46. That time the industry showed 1.94. In
2017, the same situation showed where industry shows other companies do better. In 2018, they
showed 4.251. But industry result up to 1.45%.
1.58
2.95
5.465.2
4.251
2014 2015 2016 2017 2018
Acid Test Ratio
55
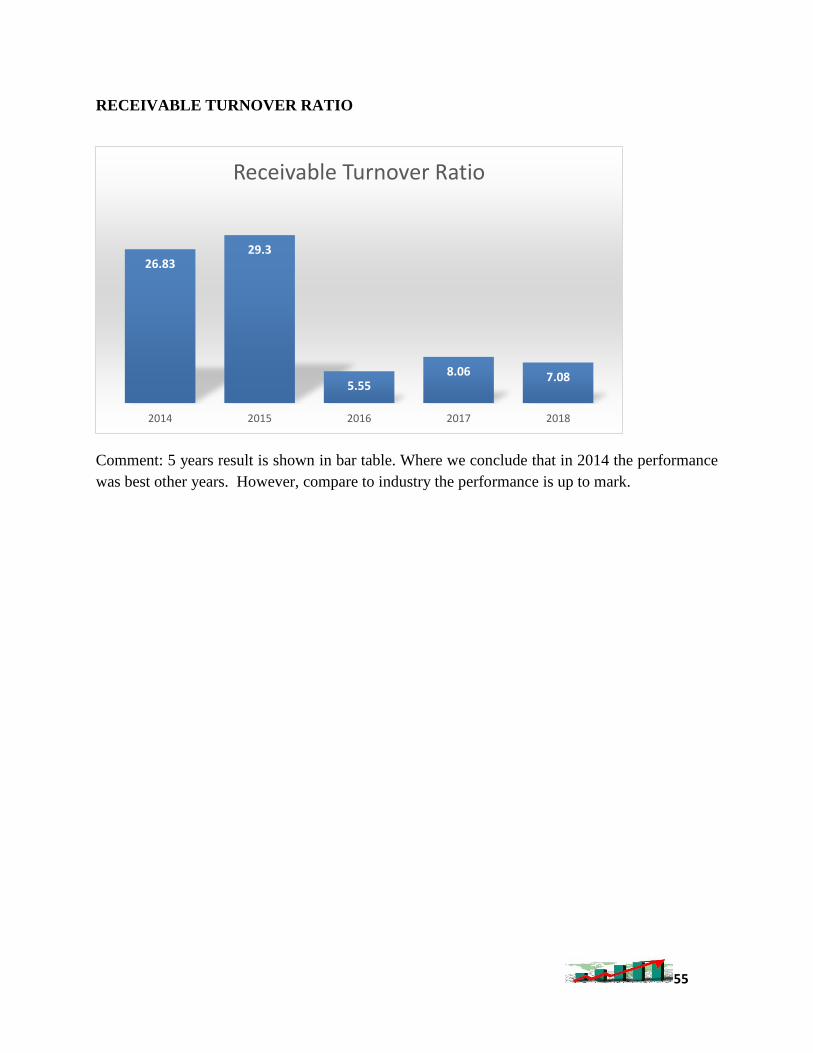
RECEIVABLE TURNOVER RATIO
Comment: 5 years result is shown in bar table. Where we conclude that in 2014 the performance
was best other years. However, compare to industry the performance is up to mark.
26.8329.3
5.558.06 7.08
2014 2015 2016 2017 2018
Receivable Turnover Ratio
56
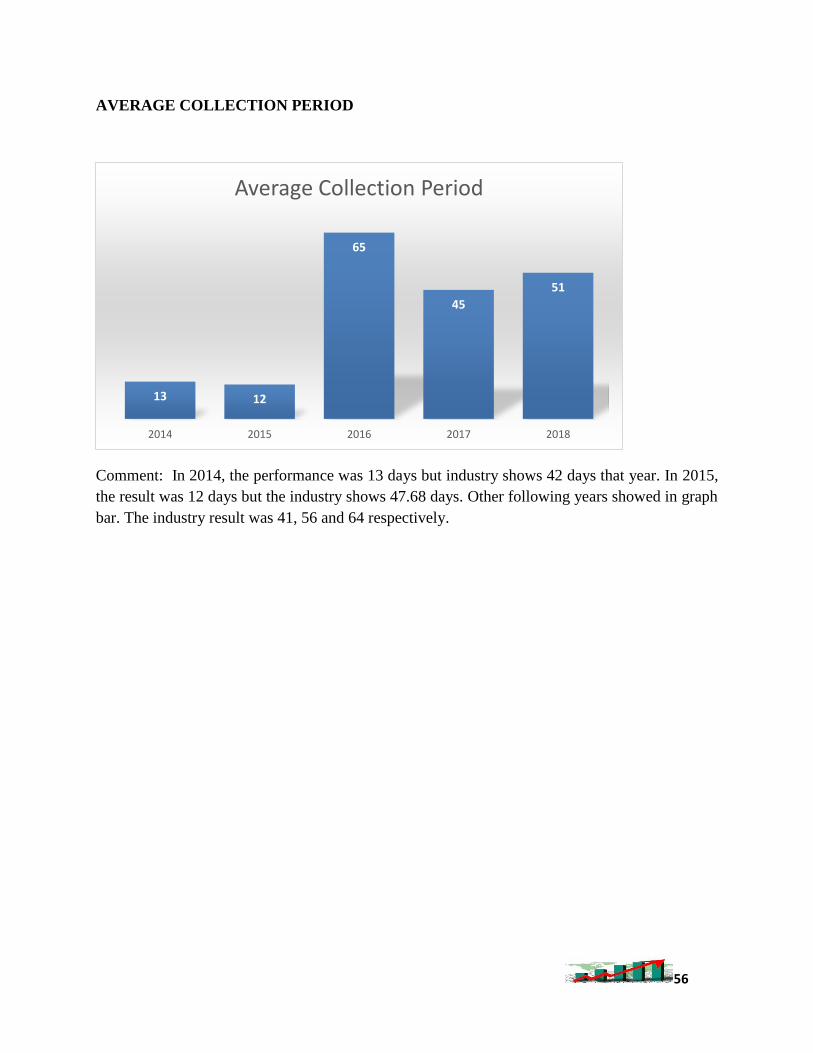
AVERAGE COLLECTION PERIOD
Comment: In 2014, the performance was 13 days but industry shows 42 days that year. In 2015,
the result was 12 days but the industry shows 47.68 days. Other following years showed in graph
bar. The industry result was 41, 56 and 64 respectively.
13 12
65
45
51
2014 2015 2016 2017 2018
Average Collection Period
57
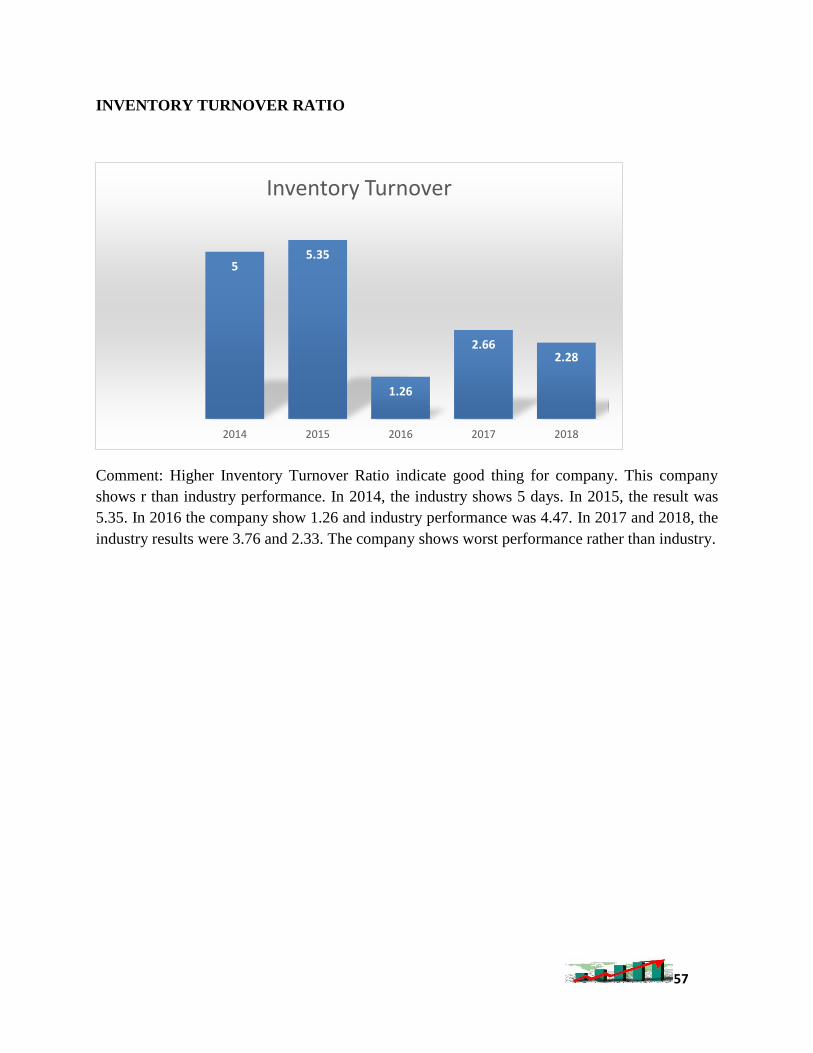
INVENTORY TURNOVER RATIO
Comment: Higher Inventory Turnover Ratio indicate good thing for company. This company
shows r than industry performance. In 2014, the industry shows 5 days. In 2015, the result was
5.35. In 2016 the company show 1.26 and industry performance was 4.47. In 2017 and 2018, the
industry results were 3.76 and 2.33. The company shows worst performance rather than industry.
55.35
1.26
2.662.28
2014 2015 2016 2017 2018
Inventory Turnover
58
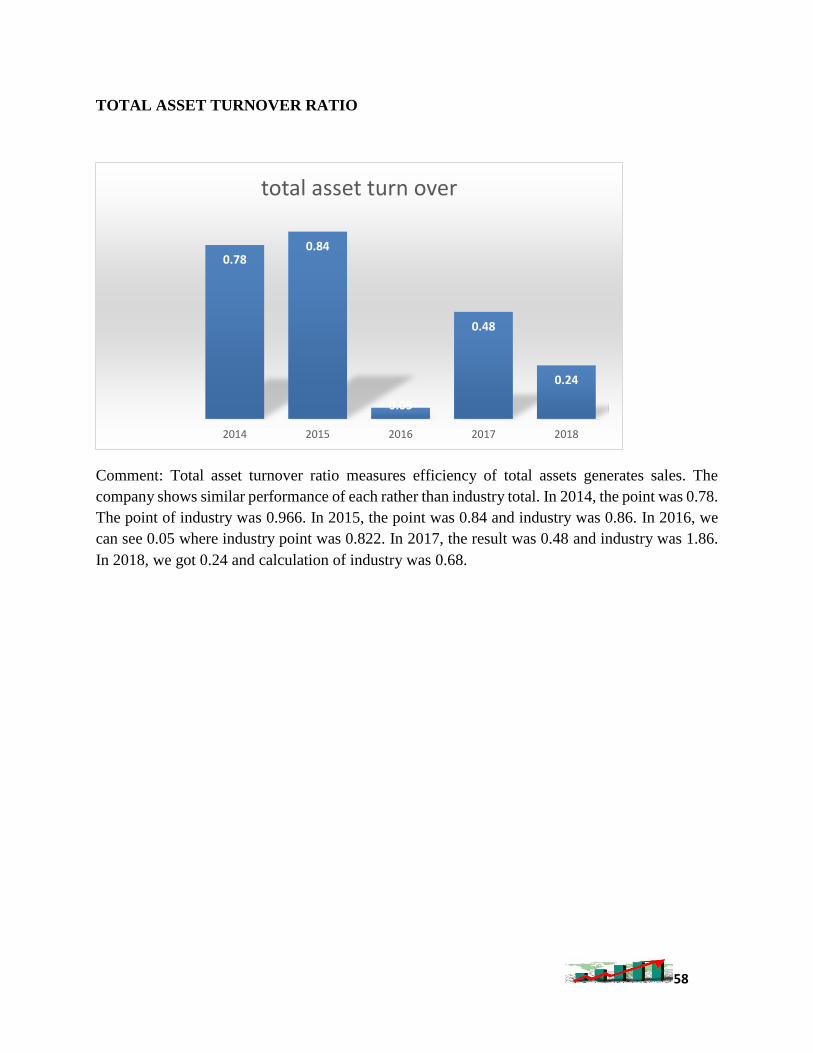
TOTAL ASSET TURNOVER RATIO
Comment: Total asset turnover ratio measures efficiency of total assets generates sales. The
company shows similar performance of each rather than industry total. In 2014, the point was 0.78.
The point of industry was 0.966. In 2015, the point was 0.84 and industry was 0.86. In 2016, we
can see 0.05 where industry point was 0.822. In 2017, the result was 0.48 and industry was 1.86.
In 2018, we got 0.24 and calculation of industry was 0.68.
0.780.84
0.05
0.48
0.24
2014 2015 2016 2017 2018
total asset turn over
59
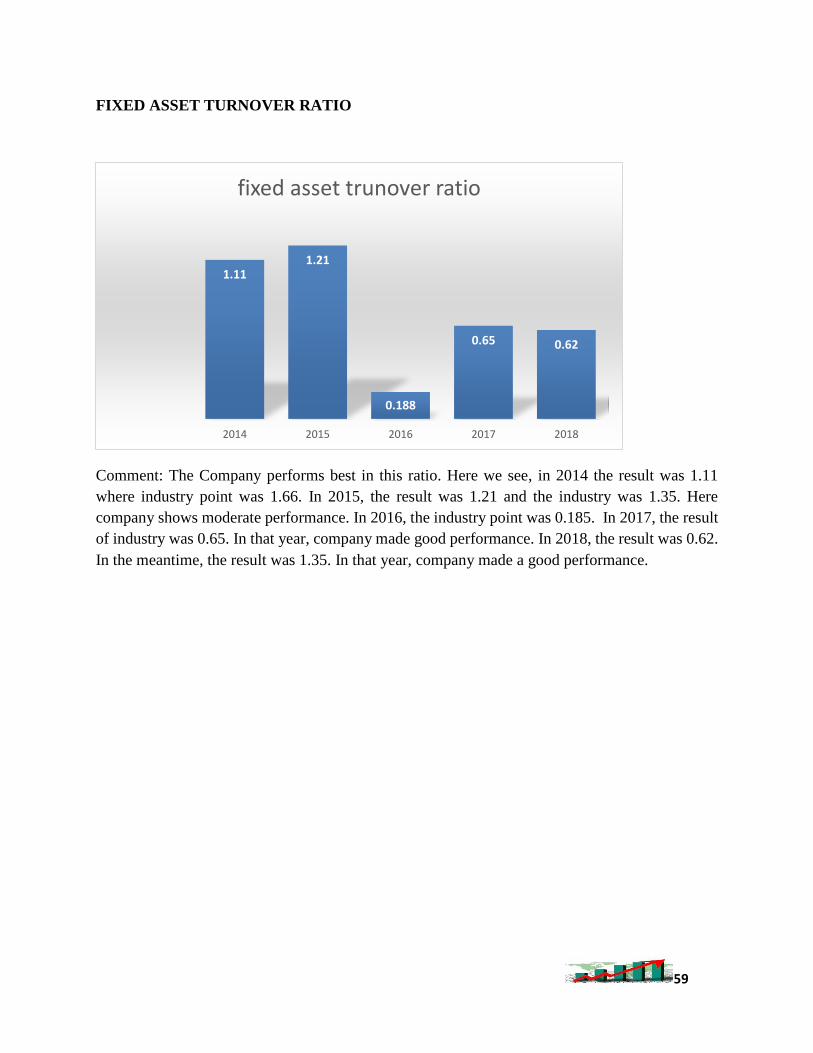
FIXED ASSET TURNOVER RATIO
Comment: The Company performs best in this ratio. Here we see, in 2014 the result was 1.11
where industry point was 1.66. In 2015, the result was 1.21 and the industry was 1.35. Here
company shows moderate performance. In 2016, the industry point was 0.185. In 2017, the result
of industry was 0.65. In that year, company made good performance. In 2018, the result was 0.62.
In the meantime, the result was 1.35. In that year, company made a good performance.
1.111.21
0.188
0.65 0.62
2014 2015 2016 2017 2018
fixed asset trunover ratio
60
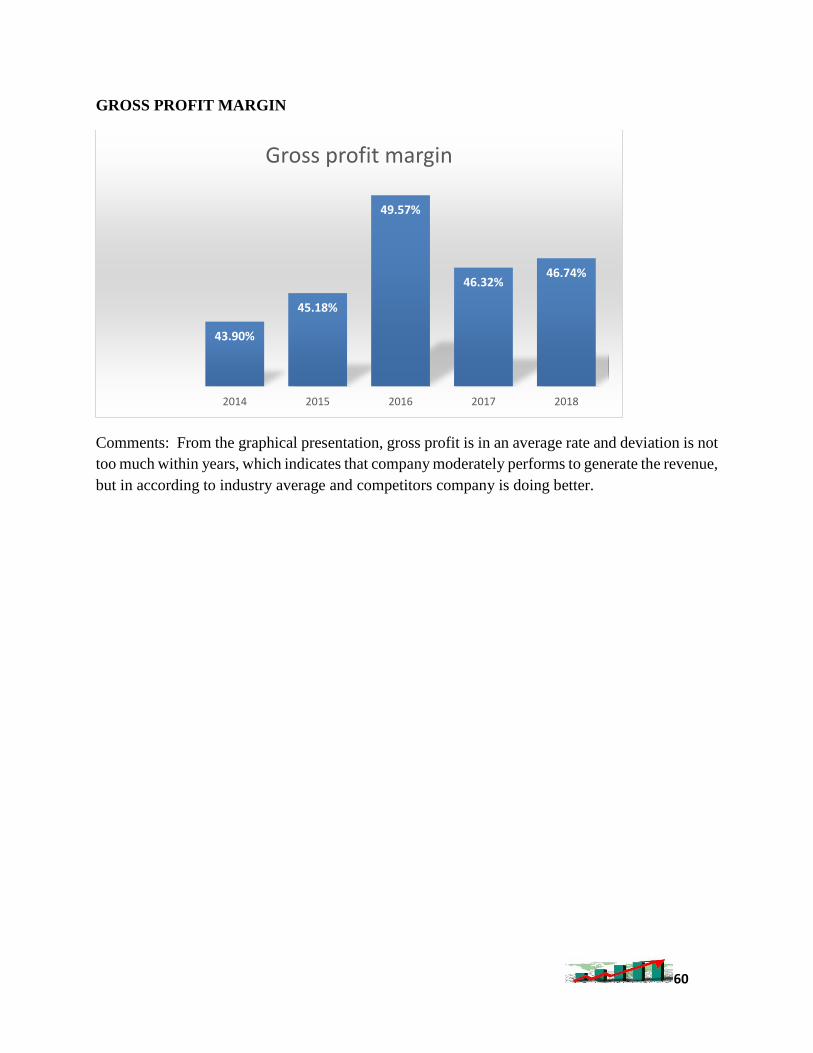
GROSS PROFIT MARGIN
Comments: From the graphical presentation, gross profit is in an average rate and deviation is not
too much within years, which indicates that company moderately performs to generate the revenue,
but in according to industry average and competitors company is doing better.
43.90%
45.18%
49.57%
46.32%46.74%
2014 2015 2016 2017 2018
Gross profit margin
61
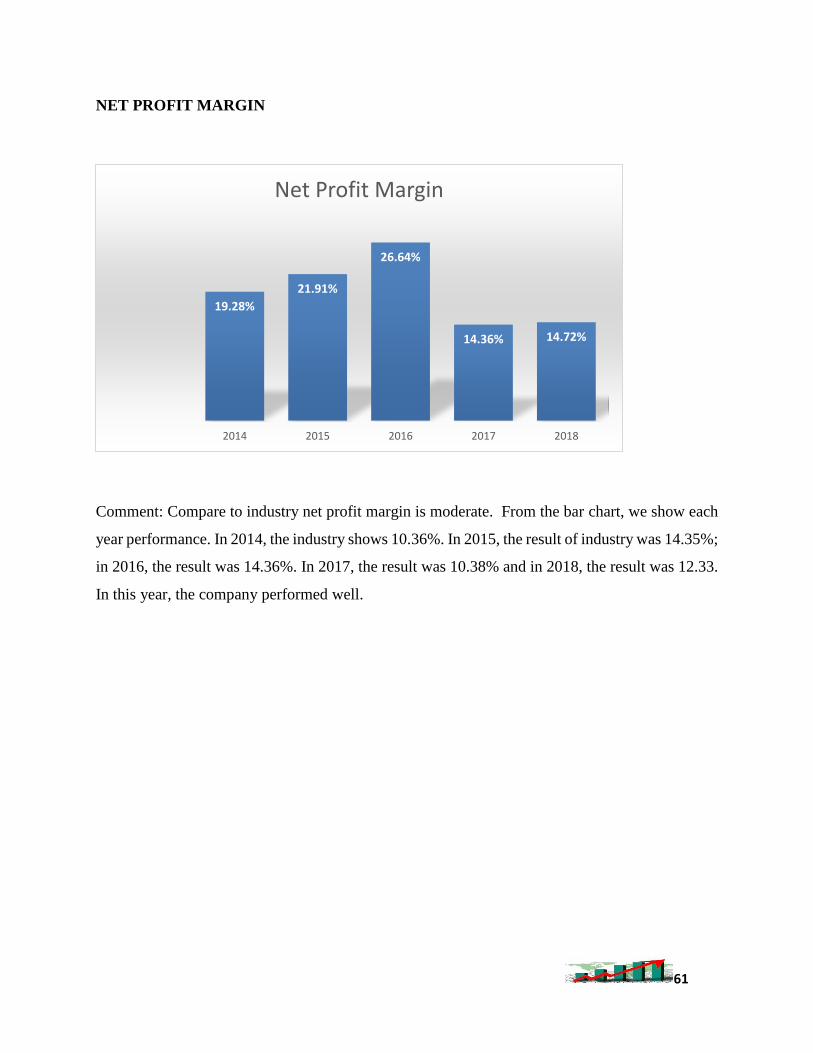
NET PROFIT MARGIN
Comment: Compare to industry net profit margin is moderate. From the bar chart, we show each
year performance. In 2014, the industry shows 10.36%. In 2015, the result of industry was 14.35%;
in 2016, the result was 14.36%. In 2017, the result was 10.38% and in 2018, the result was 12.33.
In this year, the company performed well.
19.28%
21.91%
26.64%
14.36% 14.72%
2014 2015 2016 2017 2018
Net Profit Margin
62
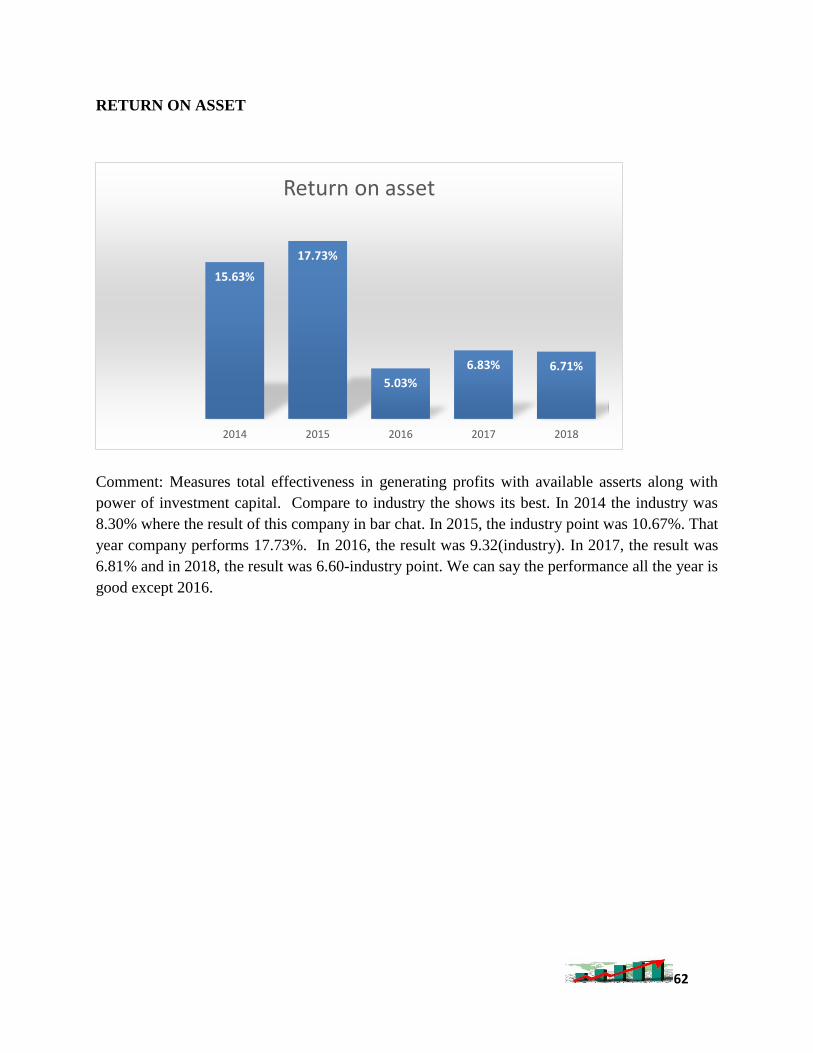
RETURN ON ASSET
Comment: Measures total effectiveness in generating profits with available asserts along with
power of investment capital. Compare to industry the shows its best. In 2014 the industry was
8.30% where the result of this company in bar chat. In 2015, the industry point was 10.67%. That
year company performs 17.73%. In 2016, the result was 9.32(industry). In 2017, the result was
6.81% and in 2018, the result was 6.60-industry point. We can say the performance all the year is
good except 2016.
15.63%
17.73%
5.03%
6.83% 6.71%
2014 2015 2016 2017 2018
Return on asset
63
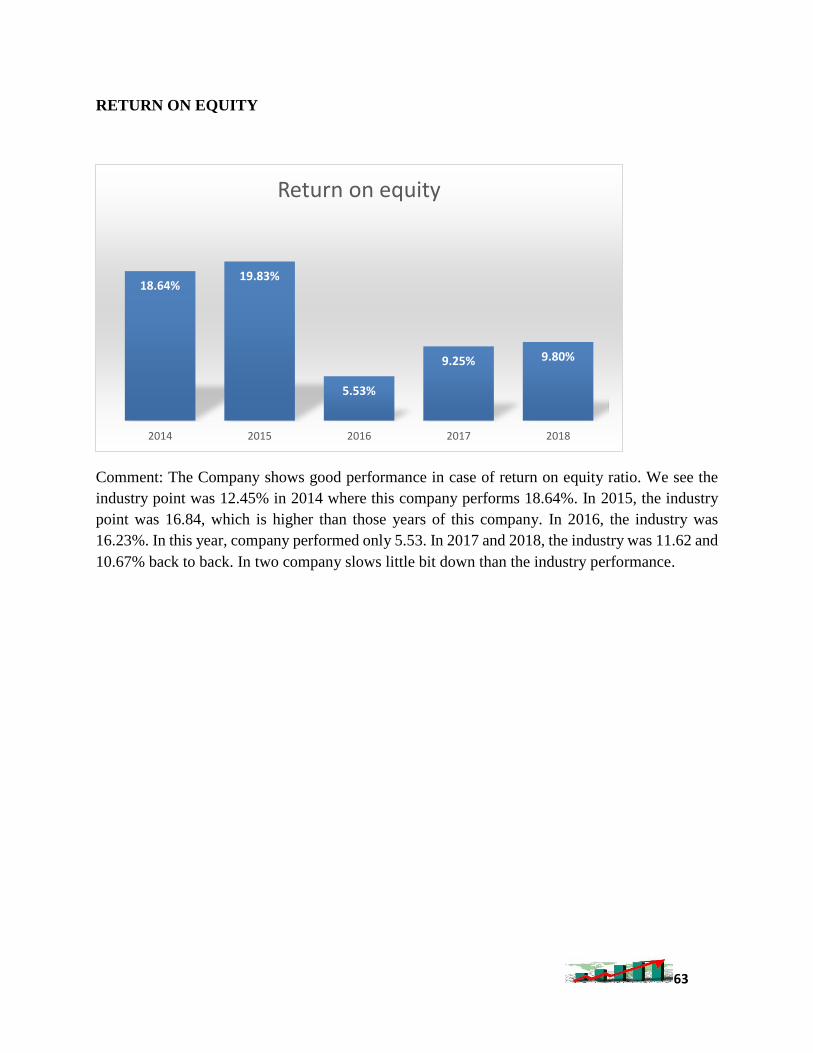
RETURN ON EQUITY
Comment: The Company shows good performance in case of return on equity ratio. We see the
industry point was 12.45% in 2014 where this company performs 18.64%. In 2015, the industry
point was 16.84, which is higher than those years of this company. In 2016, the industry was
16.23%. In this year, company performed only 5.53. In 2017 and 2018, the industry was 11.62 and
10.67% back to back. In two company slows little bit down than the industry performance.
18.64%19.83%
5.53%
9.25% 9.80%
2014 2015 2016 2017 2018
Return on equity
64
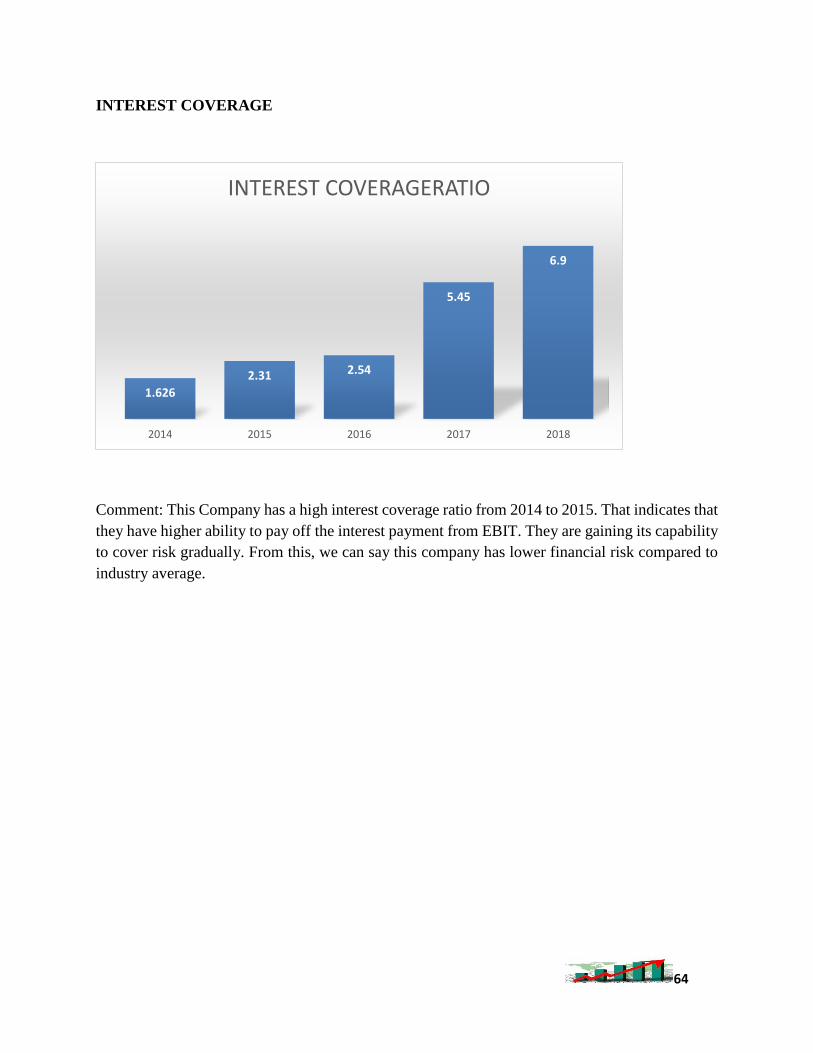
INTEREST COVERAGE
Comment: This Company has a high interest coverage ratio from 2014 to 2015. That indicates that
they have higher ability to pay off the interest payment from EBIT. They are gaining its capability
to cover risk gradually. From this, we can say this company has lower financial risk compared to
industry average.
1.626
2.31 2.54
5.45
6.9
2014 2015 2016 2017 2018
INTEREST COVERAGERATIO
65
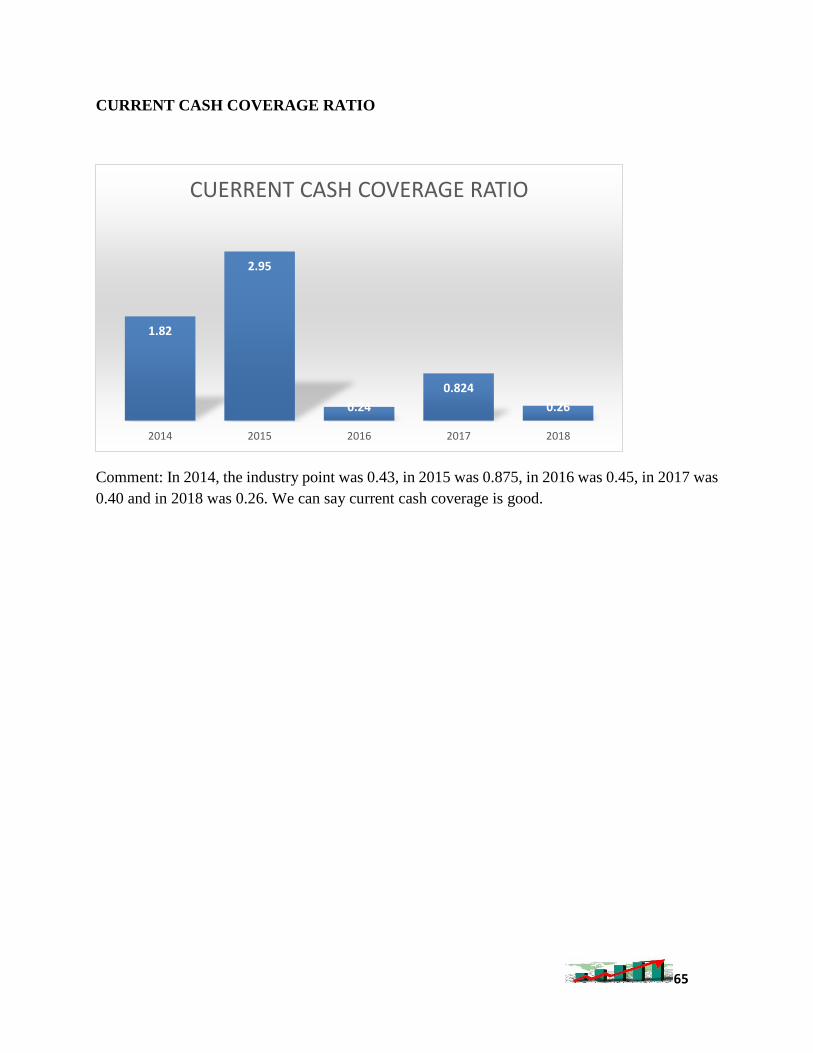
CURRENT CASH COVERAGE RATIO
Comment: In 2014, the industry point was 0.43, in 2015 was 0.875, in 2016 was 0.45, in 2017 was
0.40 and in 2018 was 0.26. We can say current cash coverage is good.
1.82
2.95
0.24
0.824
0.26
2014 2015 2016 2017 2018
CUERRENT CASH COVERAGE RATIO
66
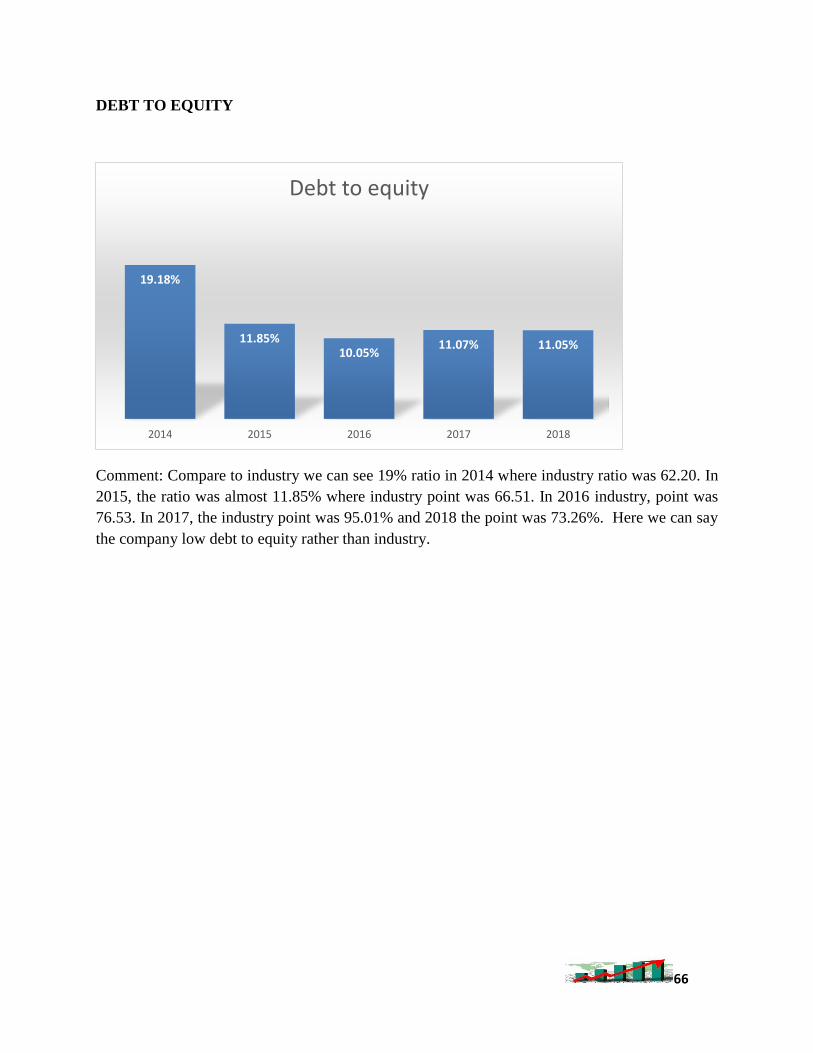
DEBT TO EQUITY
Comment: Compare to industry we can see 19% ratio in 2014 where industry ratio was 62.20. In
2015, the ratio was almost 11.85% where industry point was 66.51. In 2016 industry, point was
76.53. In 2017, the industry point was 95.01% and 2018 the point was 73.26%. Here we can say
the company low debt to equity rather than industry.
19.18%
11.85%10.05%
11.07% 11.05%
2014 2015 2016 2017 2018
Debt to equity
67
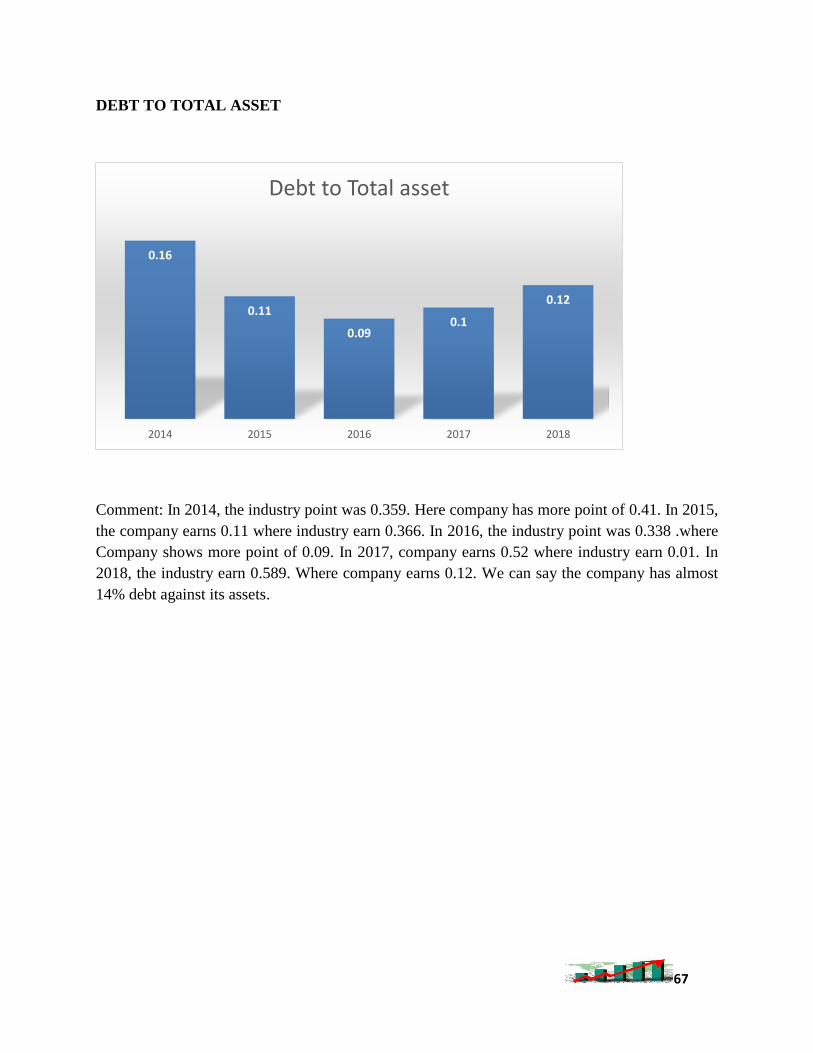
DEBT TO TOTAL ASSET
Comment: In 2014, the industry point was 0.359. Here company has more point of 0.41. In 2015,
the company earns 0.11 where industry earn 0.366. In 2016, the industry point was 0.338 .where
Company shows more point of 0.09. In 2017, company earns 0.52 where industry earn 0.01. In
2018, the industry earn 0.589. Where company earns 0.12. We can say the company has almost
14% debt against its assets.
0.16
0.11
0.090.1
0.12
2014 2015 2016 2017 2018
Debt to Total asset
68
6.3 Ratio analysis of ACME Laboratories Ltd
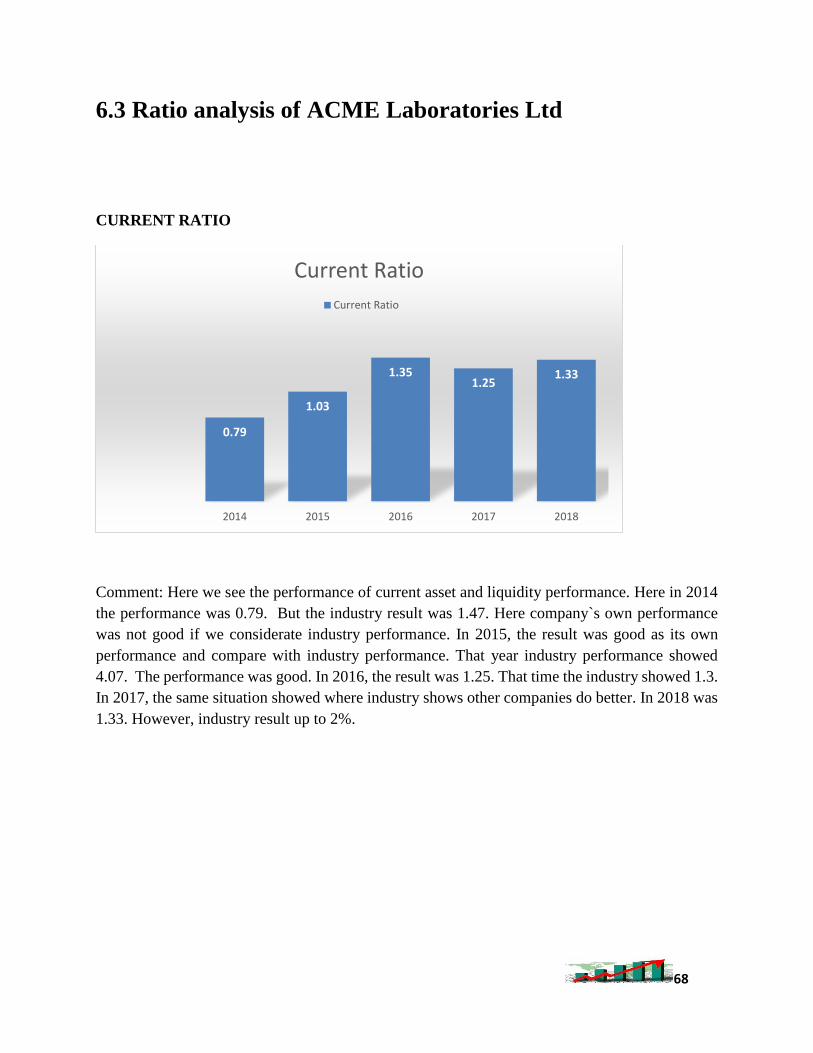
CURRENT RATIO
Comment: Here we see the performance of current asset and liquidity performance. Here in 2014
the performance was 0.79. But the industry result was 1.47. Here company`s own performance
was not good if we considerate industry performance. In 2015, the result was good as its own
performance and compare with industry performance. That year industry performance showed
4.07. The performance was good. In 2016, the result was 1.25. That time the industry showed 1.3.
In 2017, the same situation showed where industry shows other companies do better. In 2018 was
1.33. However, industry result up to 2%.
0.79
1.03
1.351.25
1.33
2014 2015 2016 2017 2018
Current Ratio
Current Ratio
69
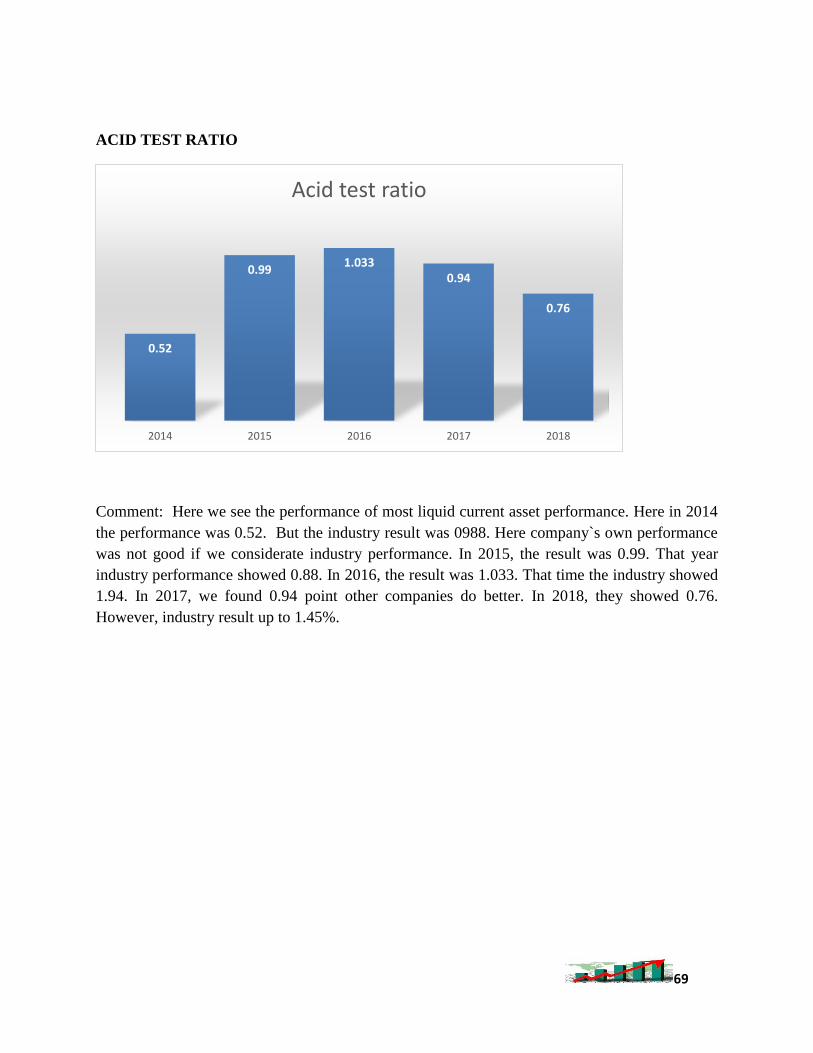
ACID TEST RATIO
Comment: Here we see the performance of most liquid current asset performance. Here in 2014
the performance was 0.52. But the industry result was 0988. Here company`s own performance
was not good if we considerate industry performance. In 2015, the result was 0.99. That year
industry performance showed 0.88. In 2016, the result was 1.033. That time the industry showed
1.94. In 2017, we found 0.94 point other companies do better. In 2018, they showed 0.76.
However, industry result up to 1.45%.
0.52
0.991.033
0.94
0.76
2014 2015 2016 2017 2018
Acid test ratio
70
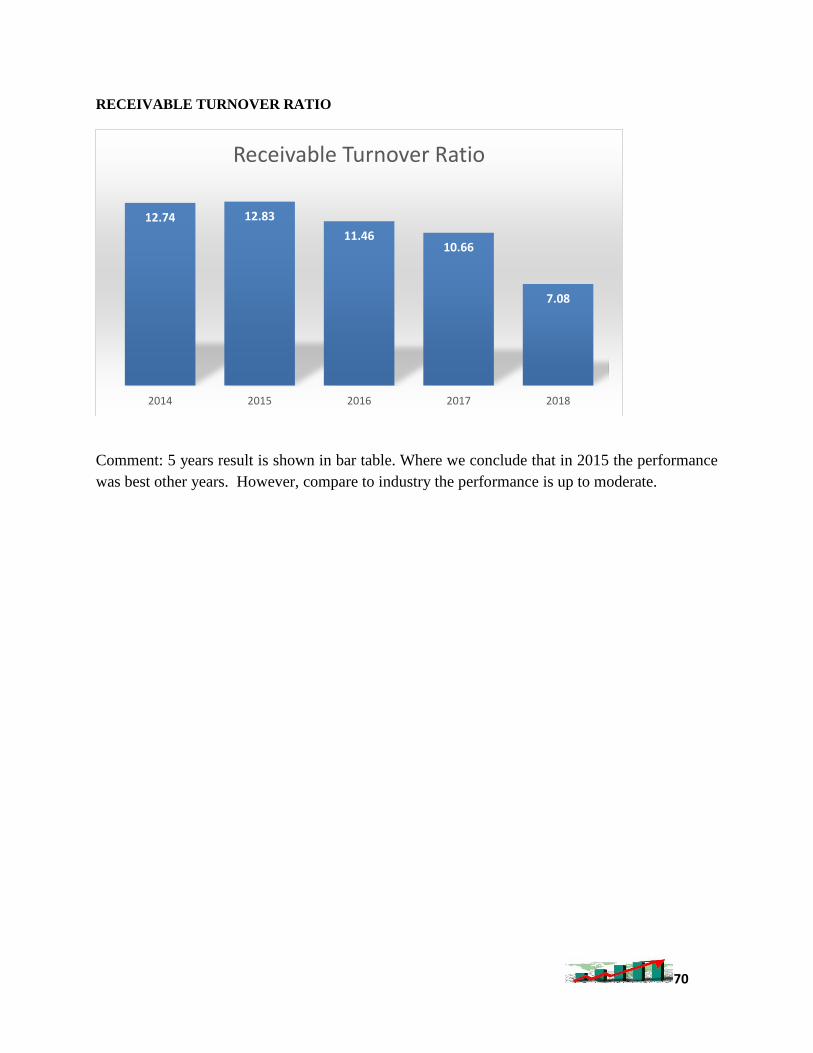
RECEIVABLE TURNOVER RATIO
Comment: 5 years result is shown in bar table. Where we conclude that in 2015 the performance
was best other years. However, compare to industry the performance is up to moderate.
12.74 12.83
11.4610.66
7.08
2014 2015 2016 2017 2018
Receivable Turnover Ratio
71
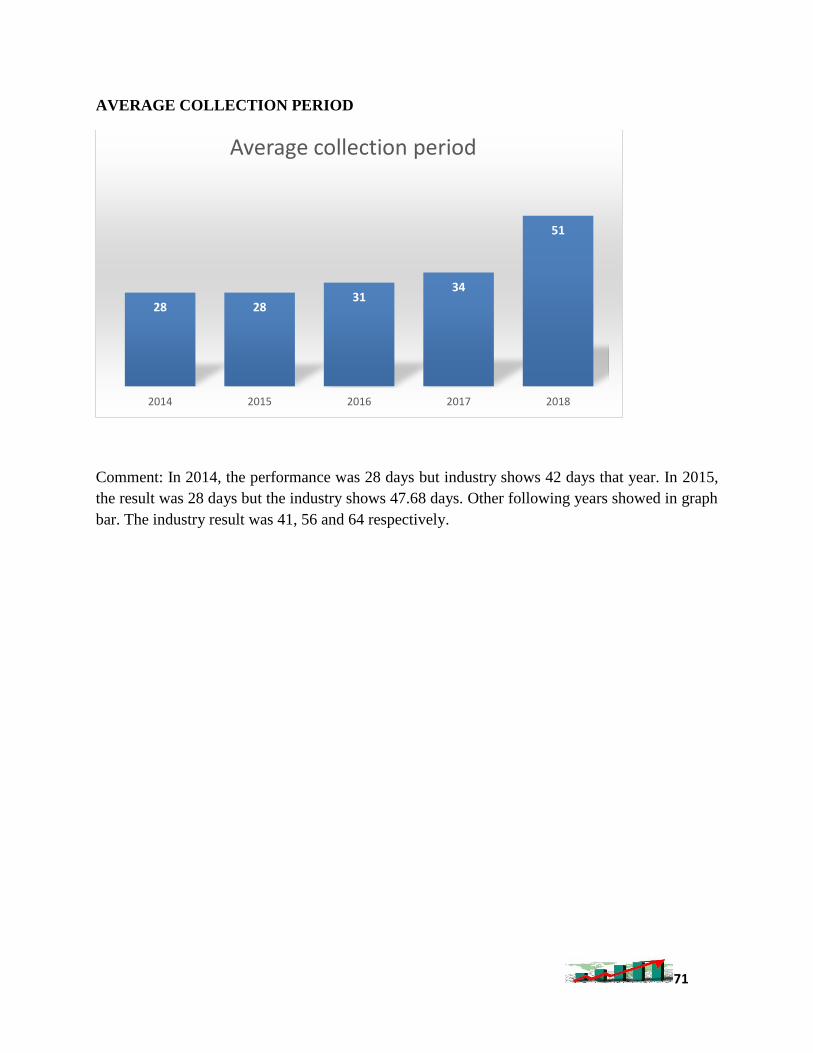
AVERAGE COLLECTION PERIOD
Comment: In 2014, the performance was 28 days but industry shows 42 days that year. In 2015,
the result was 28 days but the industry shows 47.68 days. Other following years showed in graph
bar. The industry result was 41, 56 and 64 respectively.
28 2831
34
51
2014 2015 2016 2017 2018
Average collection period
72
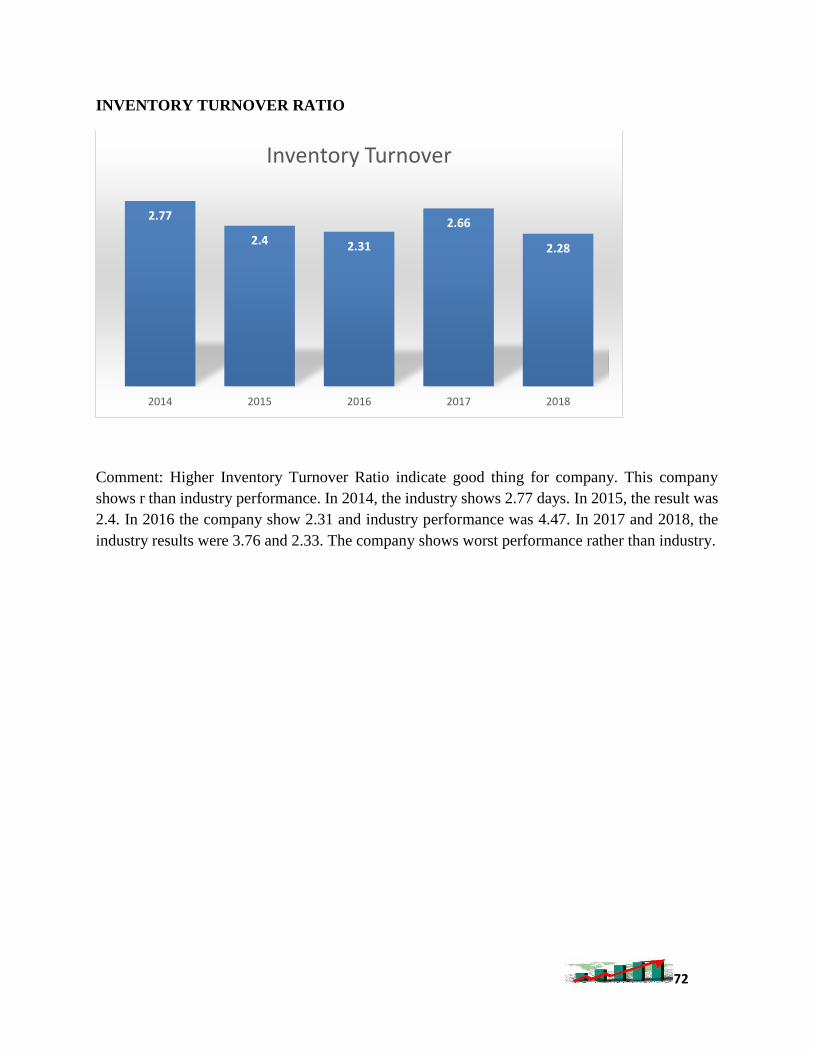
INVENTORY TURNOVER RATIO
Comment: Higher Inventory Turnover Ratio indicate good thing for company. This company
shows r than industry performance. In 2014, the industry shows 2.77 days. In 2015, the result was
2.4. In 2016 the company show 2.31 and industry performance was 4.47. In 2017 and 2018, the
industry results were 3.76 and 2.33. The company shows worst performance rather than industry.
2.77
2.4 2.31
2.66
2.28
2014 2015 2016 2017 2018
Inventory Turnover
73
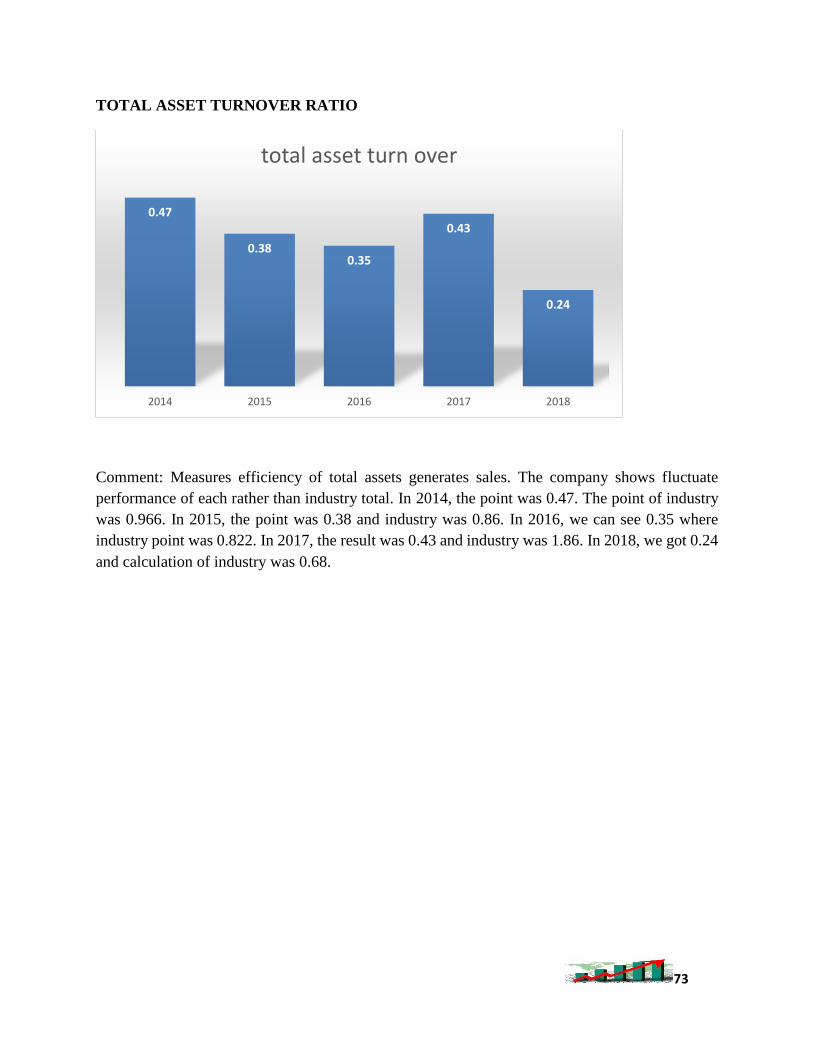
TOTAL ASSET TURNOVER RATIO
Comment: Measures efficiency of total assets generates sales. The company shows fluctuate
performance of each rather than industry total. In 2014, the point was 0.47. The point of industry
was 0.966. In 2015, the point was 0.38 and industry was 0.86. In 2016, we can see 0.35 where
industry point was 0.822. In 2017, the result was 0.43 and industry was 1.86. In 2018, we got 0.24
and calculation of industry was 0.68.
0.47
0.380.35
0.43
0.24
2014 2015 2016 2017 2018
total asset turn over
74
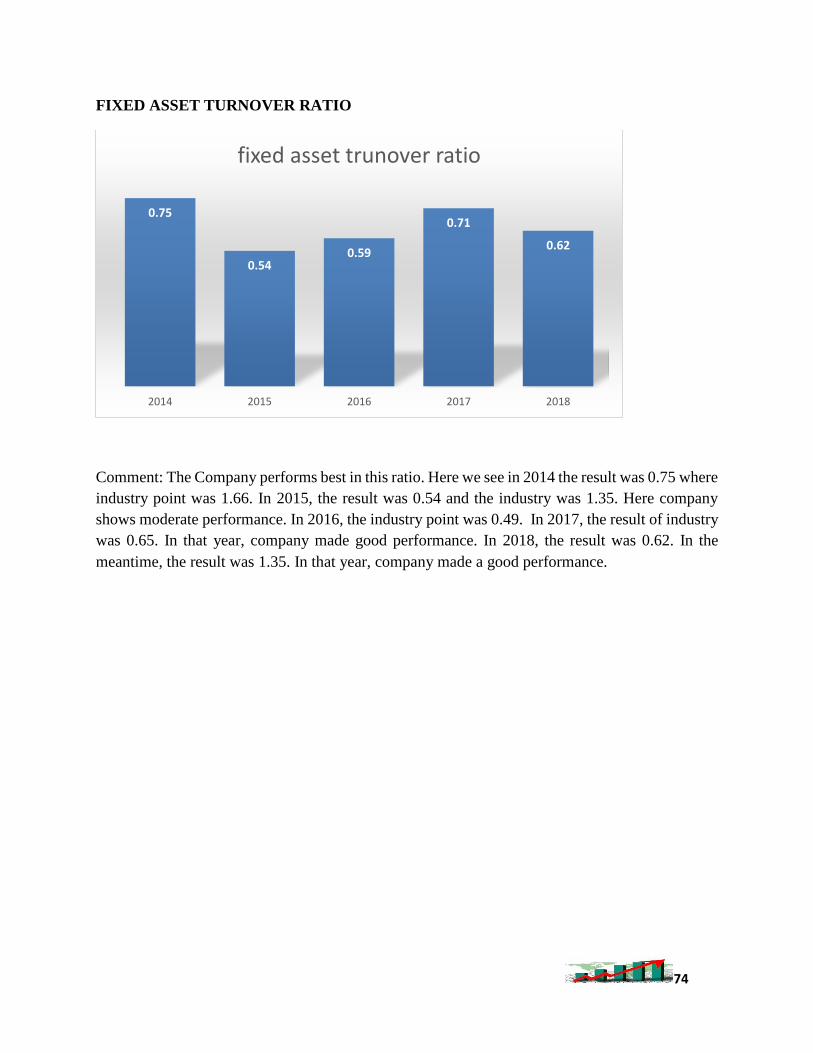
FIXED ASSET TURNOVER RATIO
Comment: The Company performs best in this ratio. Here we see in 2014 the result was 0.75 where
industry point was 1.66. In 2015, the result was 0.54 and the industry was 1.35. Here company
shows moderate performance. In 2016, the industry point was 0.49. In 2017, the result of industry
was 0.65. In that year, company made good performance. In 2018, the result was 0.62. In the
meantime, the result was 1.35. In that year, company made a good performance.
0.75
0.540.59
0.71
0.62
2014 2015 2016 2017 2018
fixed asset trunover ratio
75
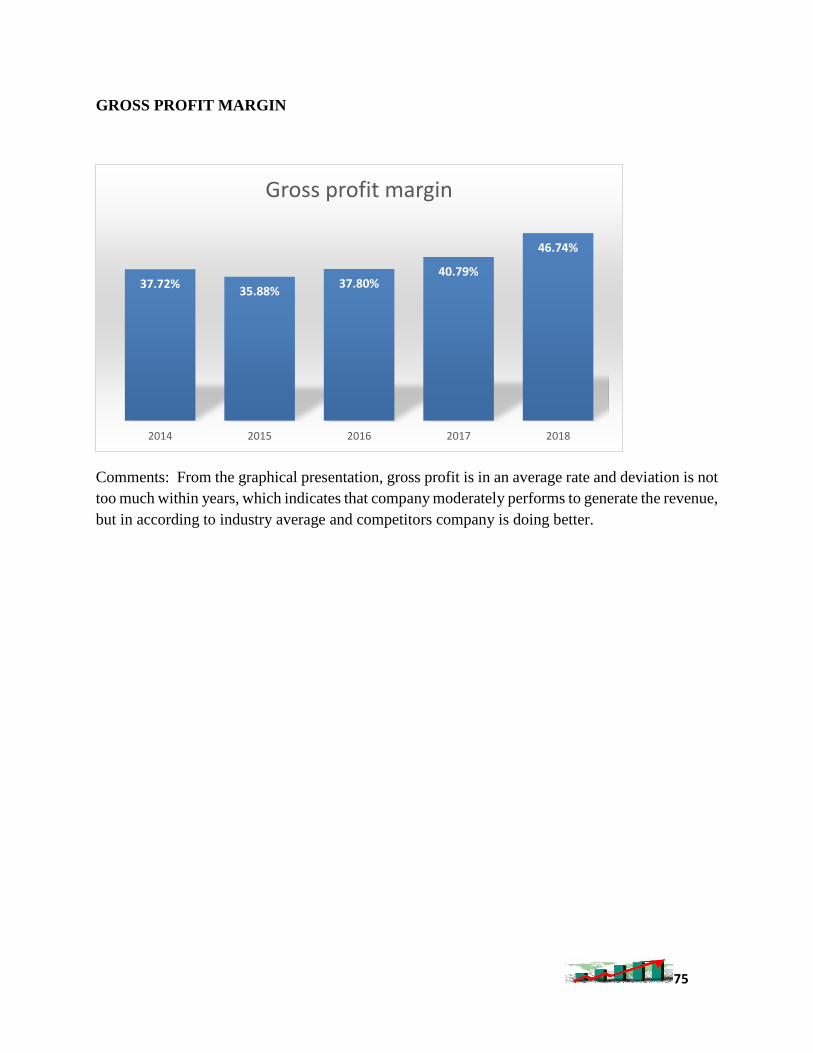
GROSS PROFIT MARGIN
Comments: From the graphical presentation, gross profit is in an average rate and deviation is not
too much within years, which indicates that company moderately performs to generate the revenue,
but in according to industry average and competitors company is doing better.
37.72%35.88%
37.80%40.79%
46.74%
2014 2015 2016 2017 2018
Gross profit margin

76
NET PROFIT MARGIN
Comment: Compare to industry net profit margin is moderate. From the bar chart, we show each
year performance. In 2014, the industry shows 10.36%. In 2015, the result of industry was 14.35%,
in 2016 the result was 14.36%. In 2017, the result was 10.38% and in 2018, the result was 12.33.
In this year, the company performed well.
7.70%6.52%
8.01%
10.16%
14.72%
2014 2015 2016 2017 2018
Net Profit Margin
77
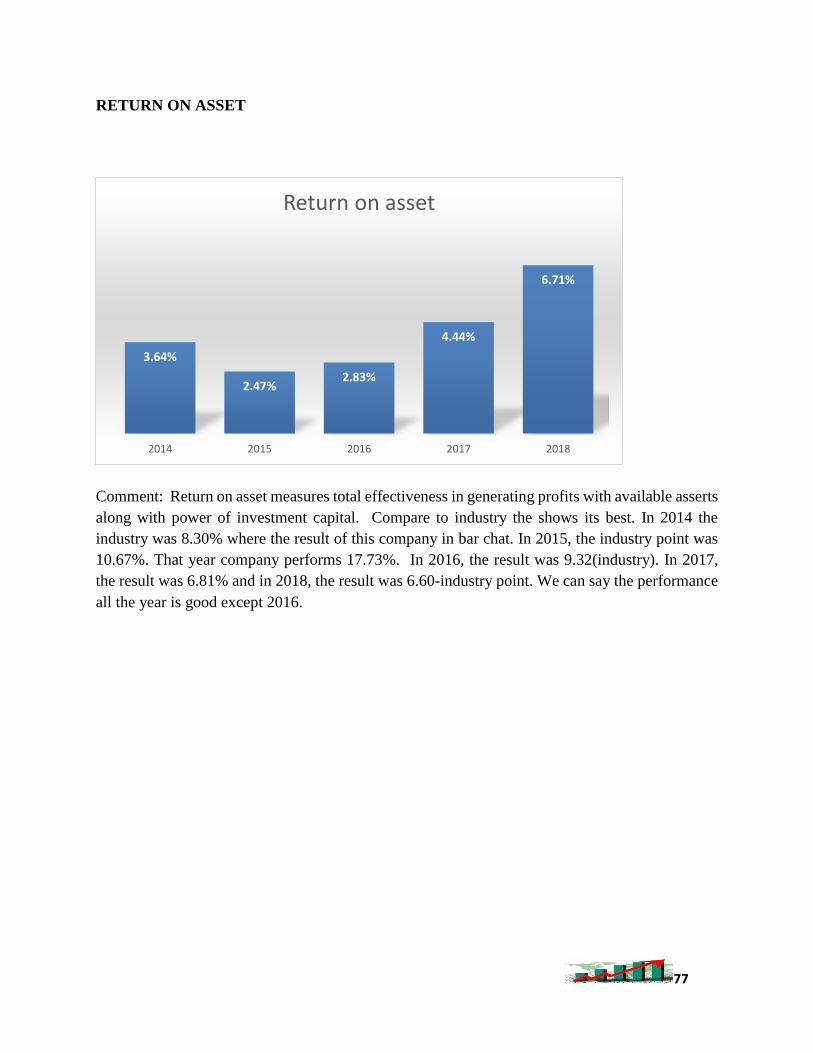
RETURN ON ASSET
Comment: Return on asset measures total effectiveness in generating profits with available asserts
along with power of investment capital. Compare to industry the shows its best. In 2014 the
industry was 8.30% where the result of this company in bar chat. In 2015, the industry point was
10.67%. That year company performs 17.73%. In 2016, the result was 9.32(industry). In 2017,
the result was 6.81% and in 2018, the result was 6.60-industry point. We can say the performance
all the year is good except 2016.
3.64%
2.47%2.83%
4.44%
6.71%
2014 2015 2016 2017 2018
Return on asset
78
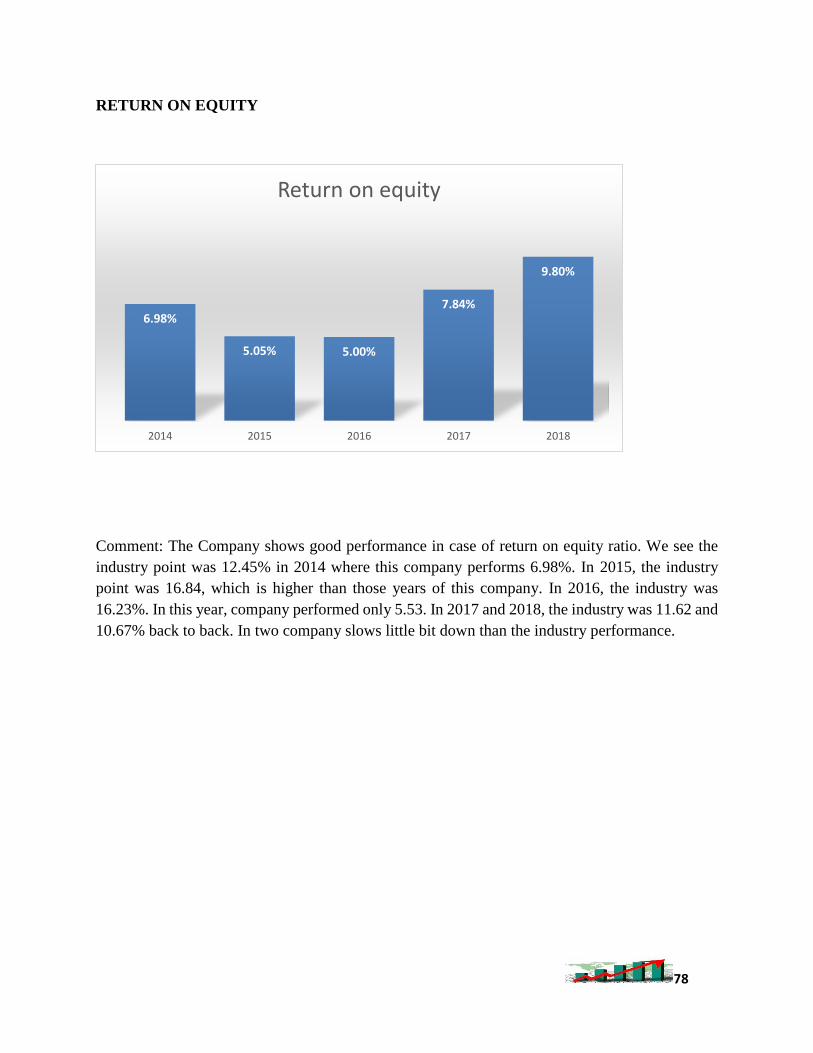
RETURN ON EQUITY
Comment: The Company shows good performance in case of return on equity ratio. We see the
industry point was 12.45% in 2014 where this company performs 6.98%. In 2015, the industry
point was 16.84, which is higher than those years of this company. In 2016, the industry was
16.23%. In this year, company performed only 5.53. In 2017 and 2018, the industry was 11.62 and
10.67% back to back. In two company slows little bit down than the industry performance.
6.98%
5.05% 5.00%
7.84%
9.80%
2014 2015 2016 2017 2018
Return on equity
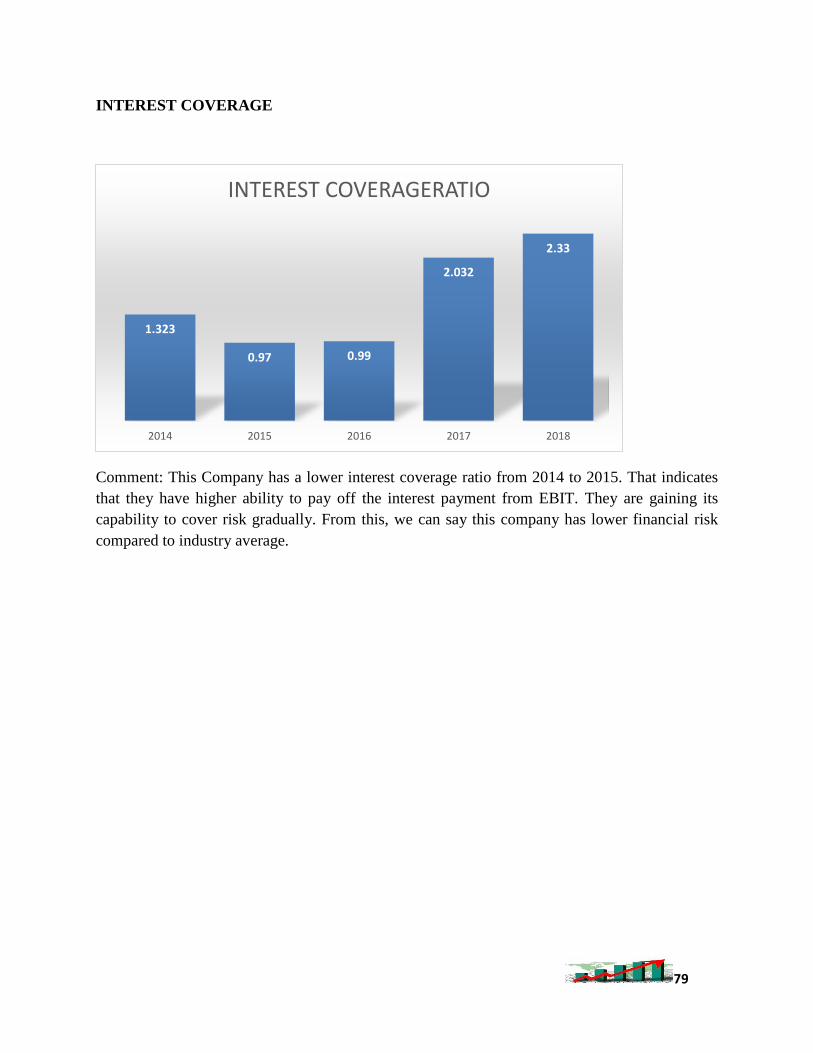
79
INTEREST COVERAGE
Comment: This Company has a lower interest coverage ratio from 2014 to 2015. That indicates
that they have higher ability to pay off the interest payment from EBIT. They are gaining its
capability to cover risk gradually. From this, we can say this company has lower financial risk
compared to industry average.
1.323
0.97 0.99
2.032
2.33
2014 2015 2016 2017 2018
INTEREST COVERAGERATIO
80
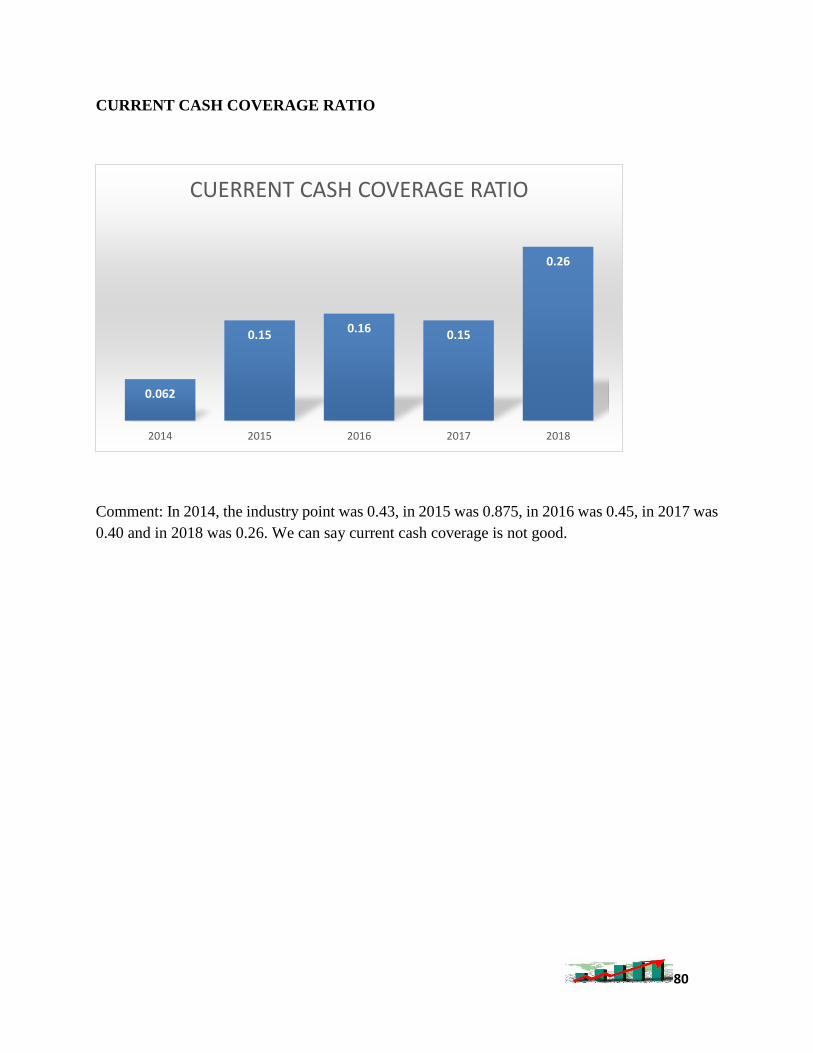
CURRENT CASH COVERAGE RATIO
Comment: In 2014, the industry point was 0.43, in 2015 was 0.875, in 2016 was 0.45, in 2017 was
0.40 and in 2018 was 0.26. We can say current cash coverage is not good.
0.062
0.150.16
0.15
0.26
2014 2015 2016 2017 2018
CUERRENT CASH COVERAGE RATIO
81
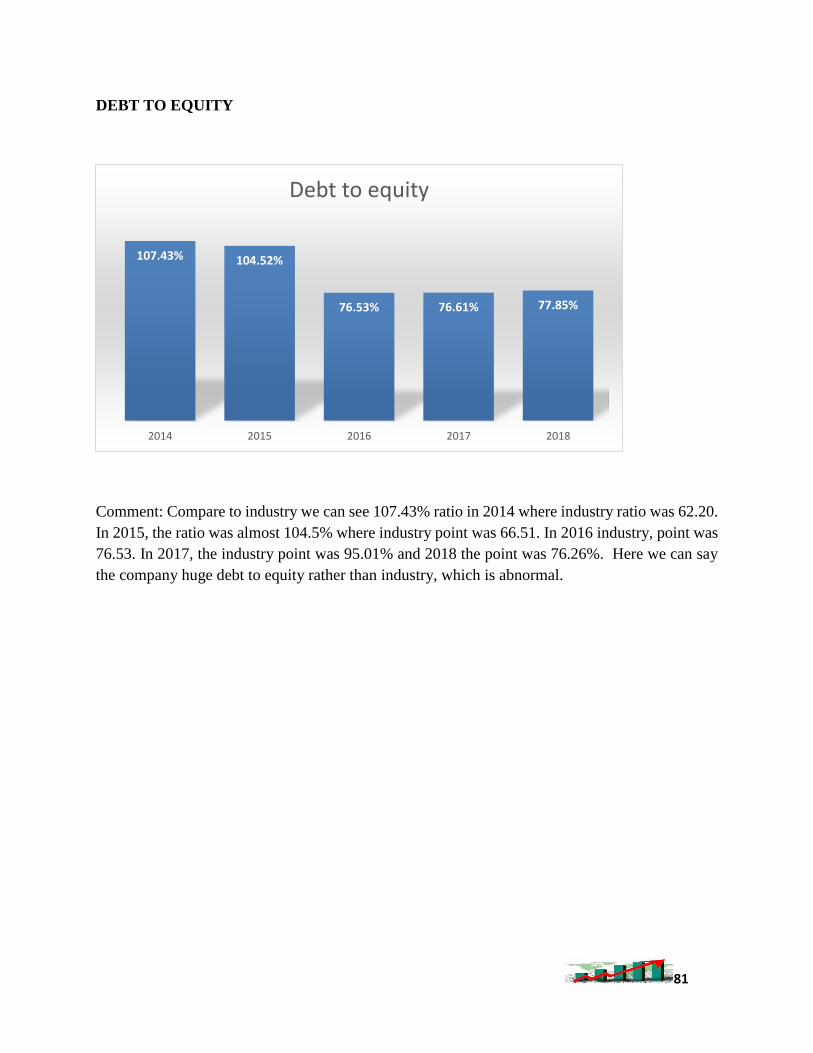
DEBT TO EQUITY
Comment: Compare to industry we can see 107.43% ratio in 2014 where industry ratio was 62.20.
In 2015, the ratio was almost 104.5% where industry point was 66.51. In 2016 industry, point was
76.53. In 2017, the industry point was 95.01% and 2018 the point was 76.26%. Here we can say
the company huge debt to equity rather than industry, which is abnormal.
107.43% 104.52%
76.53% 76.61% 77.85%
2014 2015 2016 2017 2018
Debt to equity
82
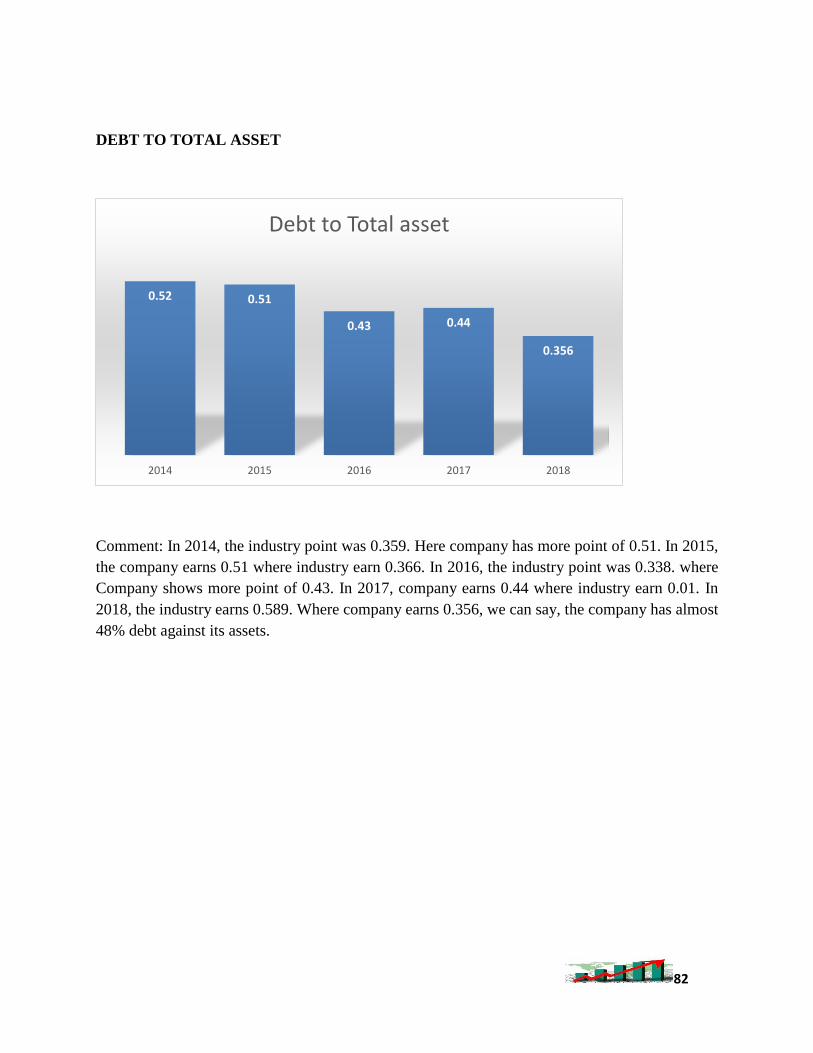
DEBT TO TOTAL ASSET
Comment: In 2014, the industry point was 0.359. Here company has more point of 0.51. In 2015,
the company earns 0.51 where industry earn 0.366. In 2016, the industry point was 0.338. where
Company shows more point of 0.43. In 2017, company earns 0.44 where industry earn 0.01. In
2018, the industry earns 0.589. Where company earns 0.356, we can say, the company has almost
48% debt against its assets.
0.52 0.51
0.43 0.44
0.356
2014 2015 2016 2017 2018
Debt to Total asset
83
6.4 Ratio Analysis of IBN SINA Pharmaceuticals Industry
Ltd
CURRENT RATIO
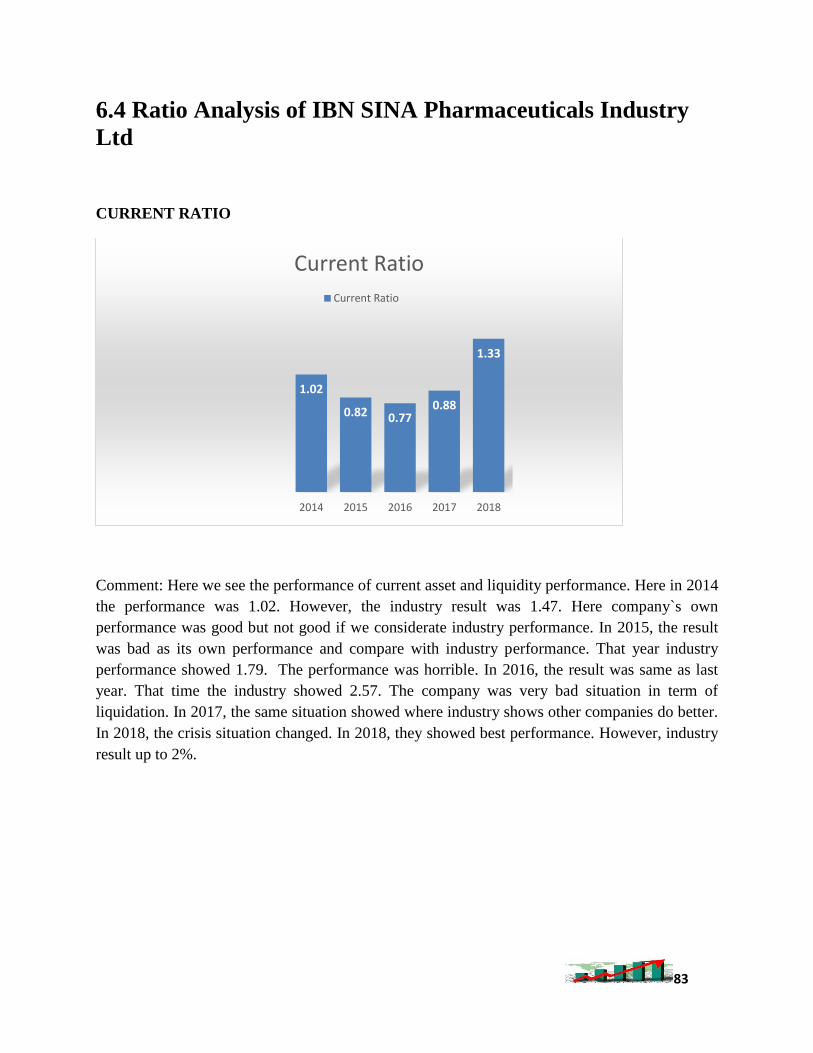
Comment: Here we see the performance of current asset and liquidity performance. Here in 2014
the performance was 1.02. However, the industry result was 1.47. Here company`s own
performance was good but not good if we considerate industry performance. In 2015, the result
was bad as its own performance and compare with industry performance. That year industry
performance showed 1.79. The performance was horrible. In 2016, the result was same as last
year. That time the industry showed 2.57. The company was very bad situation in term of
liquidation. In 2017, the same situation showed where industry shows other companies do better.
In 2018, the crisis situation changed. In 2018, they showed best performance. However, industry
result up to 2%.
1.02
0.82 0.770.88
1.33
2014 2015 2016 2017 2018
Current Ratio
Current Ratio
84
ACID TEST RATIO
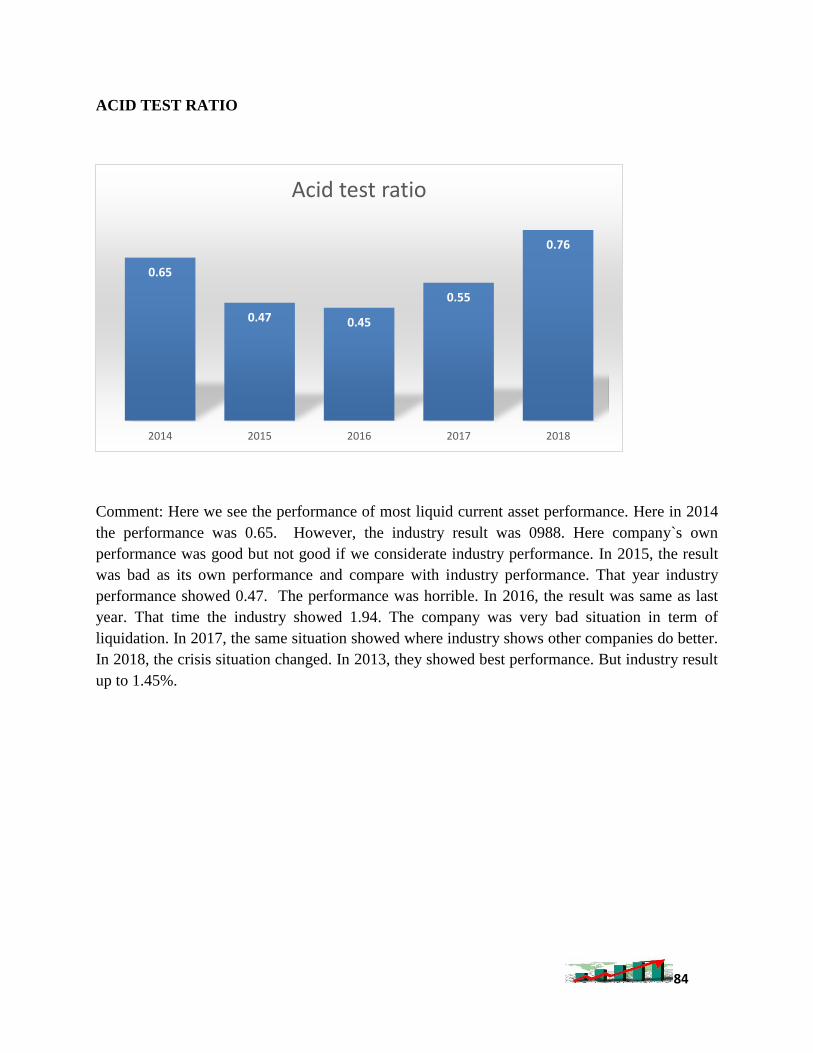
Comment: Here we see the performance of most liquid current asset performance. Here in 2014
the performance was 0.65. However, the industry result was 0988. Here company`s own
performance was good but not good if we considerate industry performance. In 2015, the result
was bad as its own performance and compare with industry performance. That year industry
performance showed 0.47. The performance was horrible. In 2016, the result was same as last
year. That time the industry showed 1.94. The company was very bad situation in term of
liquidation. In 2017, the same situation showed where industry shows other companies do better.
In 2018, the crisis situation changed. In 2013, they showed best performance. But industry result
up to 1.45%.
0.65
0.47 0.45
0.55
0.76
2014 2015 2016 2017 2018
Acid test ratio
85
RECEIVABLE TURNOVER RATIO
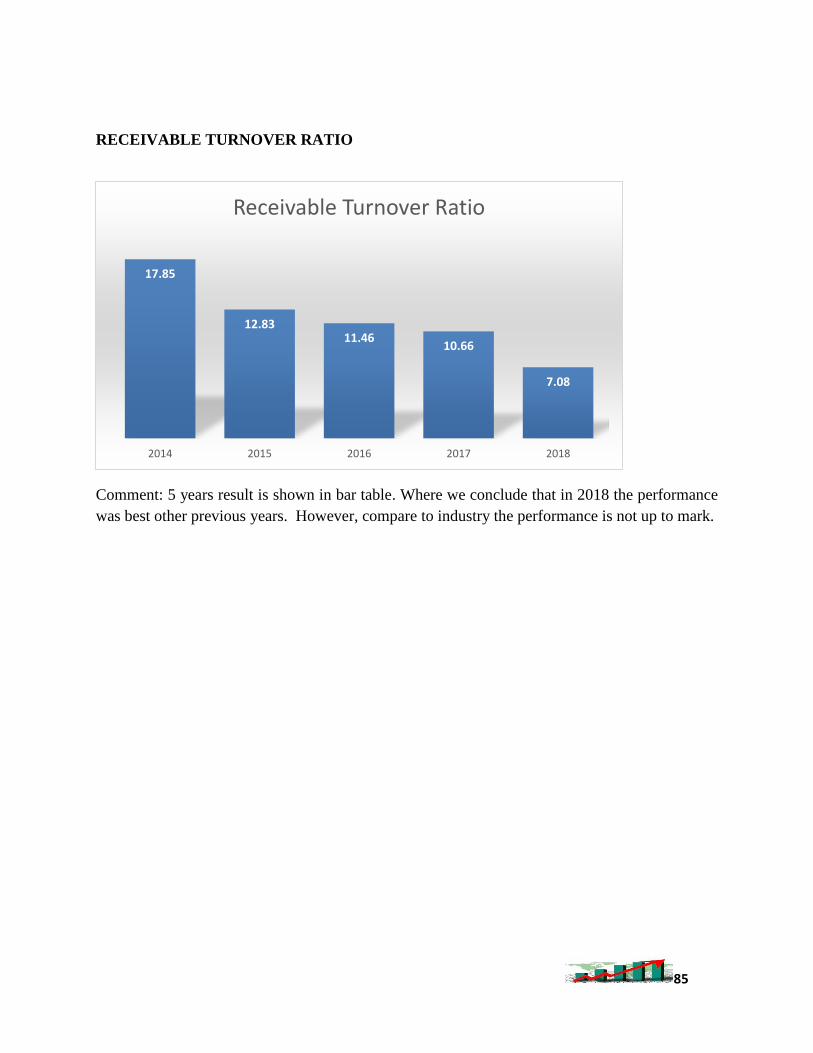
Comment: 5 years result is shown in bar table. Where we conclude that in 2018 the performance
was best other previous years. However, compare to industry the performance is not up to mark.
17.85
12.8311.46
10.66
7.08
2014 2015 2016 2017 2018
Receivable Turnover Ratio
86
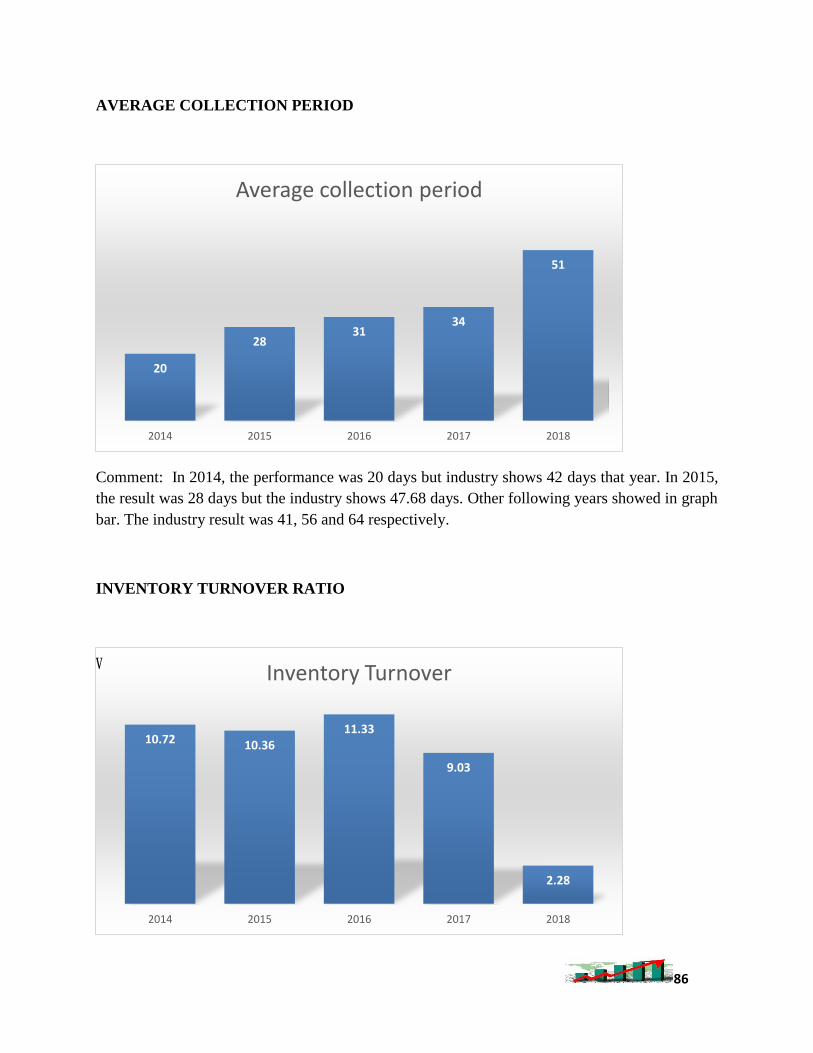
AVERAGE COLLECTION PERIOD
Comment: In 2014, the performance was 20 days but industry shows 42 days that year. In 2015,
the result was 28 days but the industry shows 47.68 days. Other following years showed in graph
bar. The industry result was 41, 56 and 64 respectively.
INVENTORY TURNOVER RATIO
20
2831
34
51
2014 2015 2016 2017 2018
Average collection period
10.72 10.3611.33
9.03
2.28
2014 2015 2016 2017 2018
Inventory Turnoverv
87
Comment: Higher Inventory Turnover Ratio indicate good thing for company. This company
shows better than industry performance. In 2014, the industry shows 4.84 days. In 2015, the result
was 4.64. In this year, company had better to 10.36 days. In 2016 the company show 11.33 and
industry performance was 4.47. In 2017 and 2018, the industry results were 3.76 and 2.33. The
company shows better performance rather than industry.
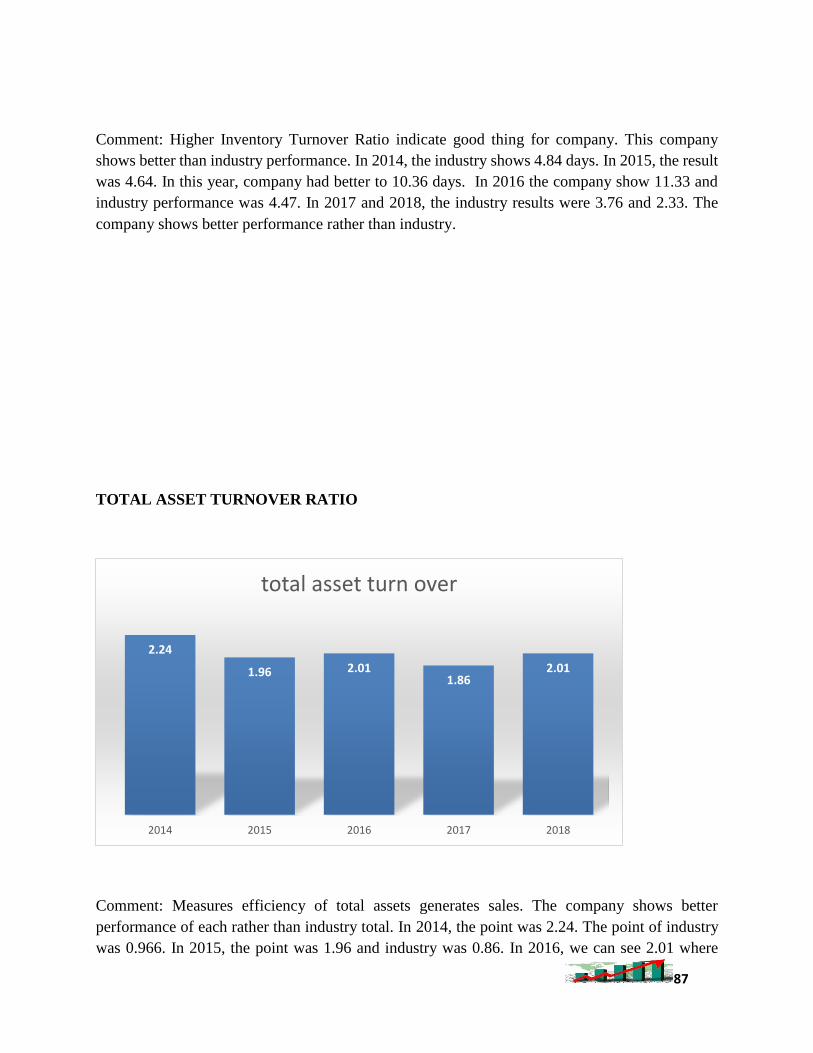
TOTAL ASSET TURNOVER RATIO
Comment: Measures efficiency of total assets generates sales. The company shows better
performance of each rather than industry total. In 2014, the point was 2.24. The point of industry
was 0.966. In 2015, the point was 1.96 and industry was 0.86. In 2016, we can see 2.01 where
2.24
1.96 2.011.86
2.01
2014 2015 2016 2017 2018
total asset turn over
88
industry point was 0.822. In 2017, the result was 1.86 and industry was 1.86. In 2018, we got 2.01
and calculation of industry was 0.68.
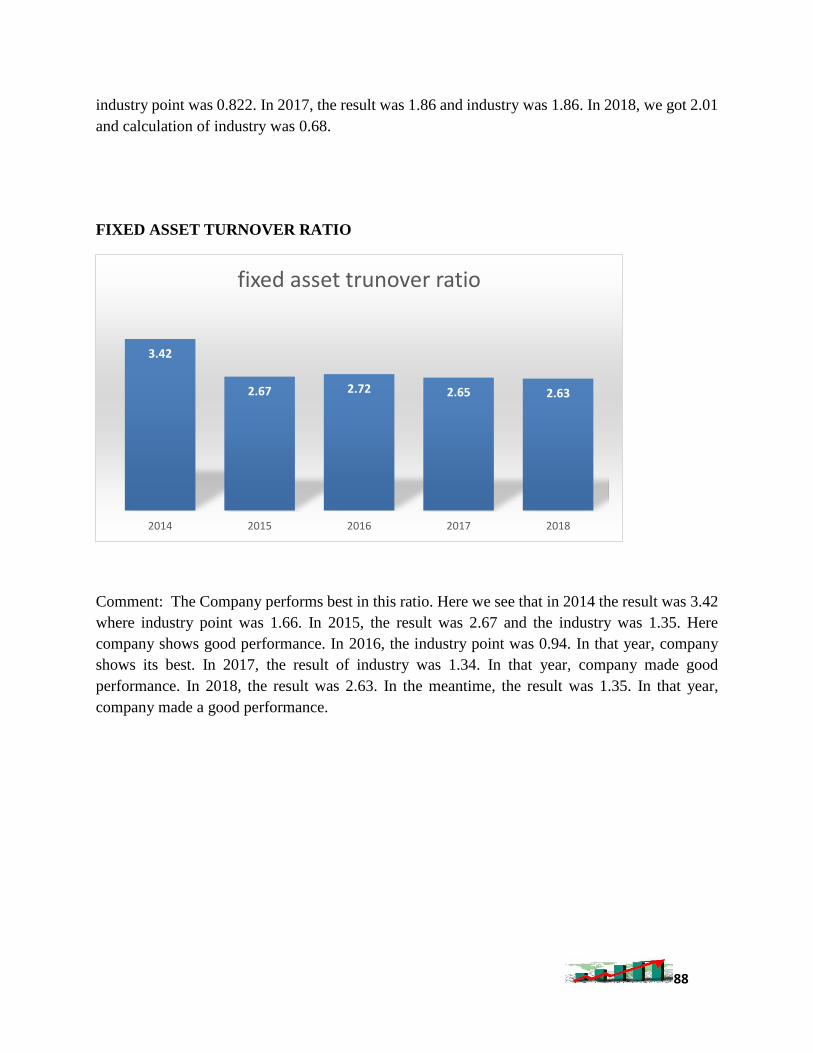
FIXED ASSET TURNOVER RATIO
Comment: The Company performs best in this ratio. Here we see that in 2014 the result was 3.42
where industry point was 1.66. In 2015, the result was 2.67 and the industry was 1.35. Here
company shows good performance. In 2016, the industry point was 0.94. In that year, company
shows its best. In 2017, the result of industry was 1.34. In that year, company made good
performance. In 2018, the result was 2.63. In the meantime, the result was 1.35. In that year,
company made a good performance.
3.42
2.67 2.72 2.65 2.63
2014 2015 2016 2017 2018
fixed asset trunover ratio
89
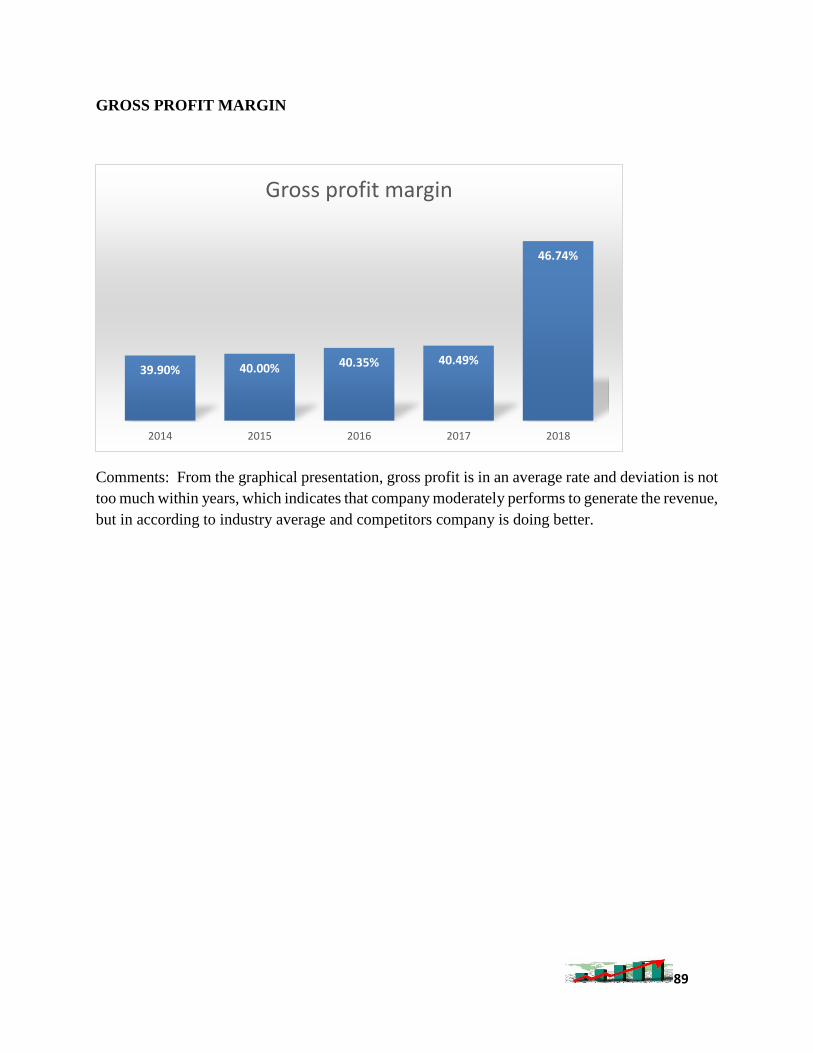
GROSS PROFIT MARGIN
Comments: From the graphical presentation, gross profit is in an average rate and deviation is not
too much within years, which indicates that company moderately performs to generate the revenue,
but in according to industry average and competitors company is doing better.
39.90% 40.00% 40.35% 40.49%
46.74%
2014 2015 2016 2017 2018
Gross profit margin
90
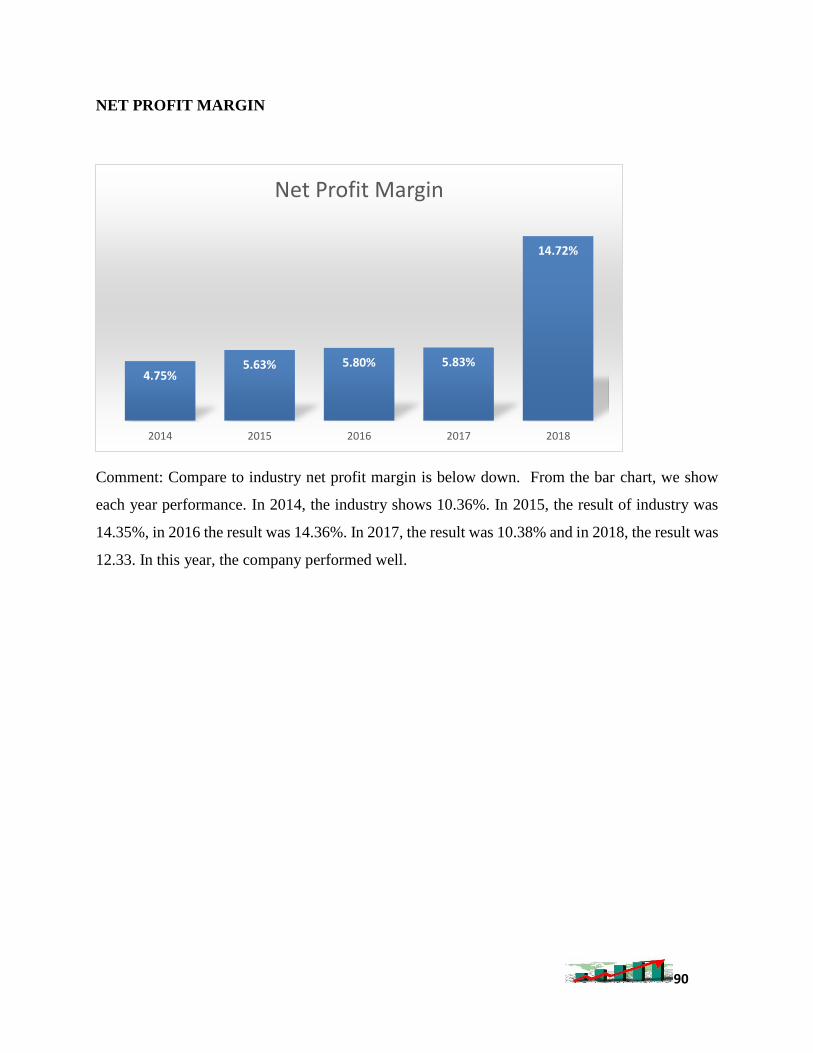
NET PROFIT MARGIN
Comment: Compare to industry net profit margin is below down. From the bar chart, we show
each year performance. In 2014, the industry shows 10.36%. In 2015, the result of industry was
14.35%, in 2016 the result was 14.36%. In 2017, the result was 10.38% and in 2018, the result was
12.33. In this year, the company performed well.
4.75%5.63% 5.80% 5.83%
14.72%
2014 2015 2016 2017 2018
Net Profit Margin
91
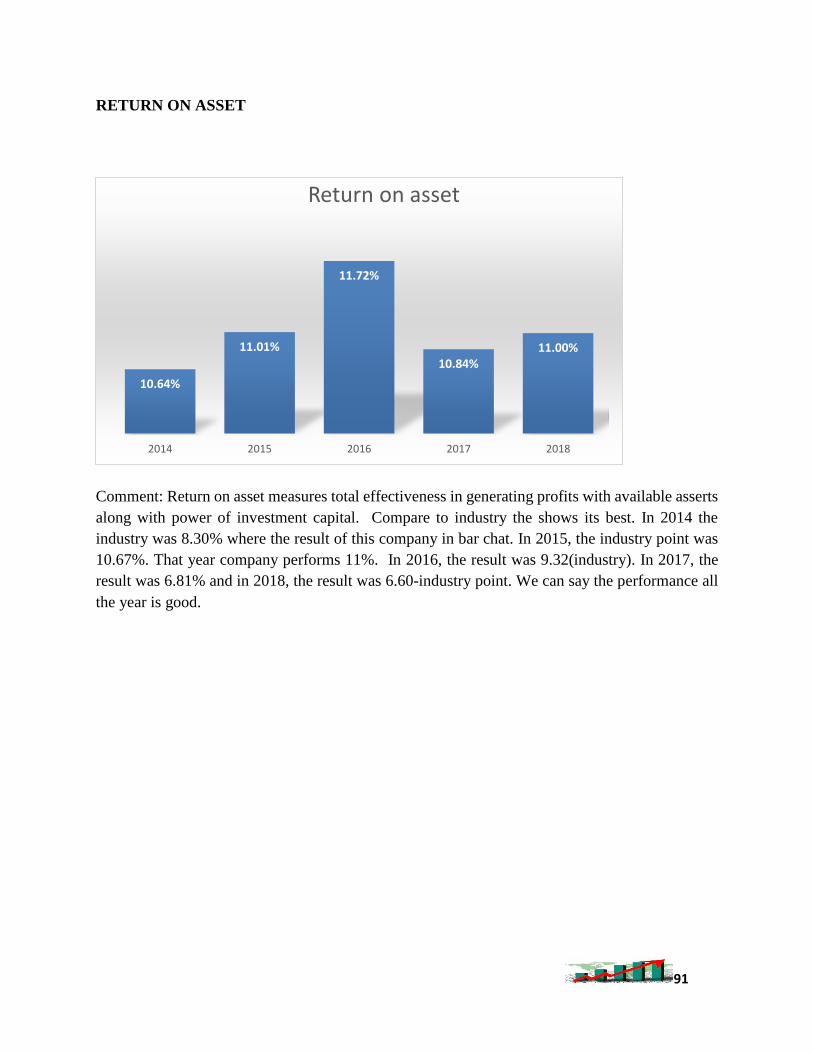
RETURN ON ASSET
Comment: Return on asset measures total effectiveness in generating profits with available asserts
along with power of investment capital. Compare to industry the shows its best. In 2014 the
industry was 8.30% where the result of this company in bar chat. In 2015, the industry point was
10.67%. That year company performs 11%. In 2016, the result was 9.32(industry). In 2017, the
result was 6.81% and in 2018, the result was 6.60-industry point. We can say the performance all
the year is good.
10.64%
11.01%
11.72%
10.84%11.00%
2014 2015 2016 2017 2018
Return on asset
92
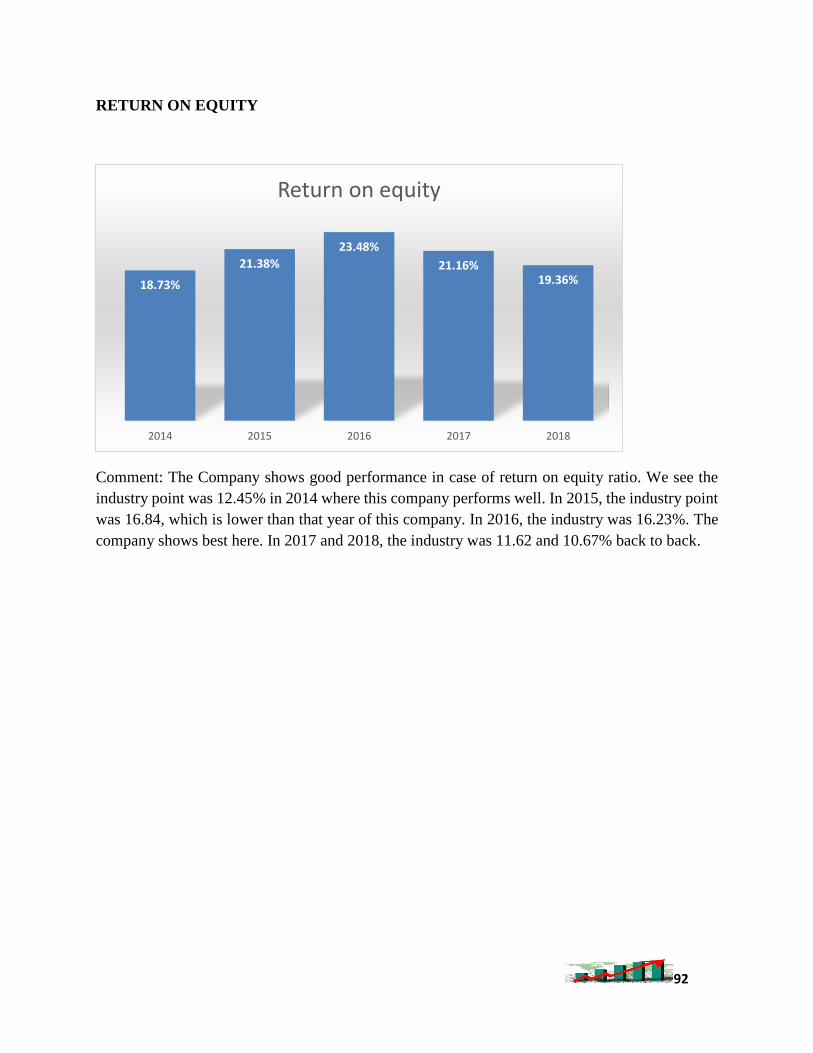
RETURN ON EQUITY
Comment: The Company shows good performance in case of return on equity ratio. We see the
industry point was 12.45% in 2014 where this company performs well. In 2015, the industry point
was 16.84, which is lower than that year of this company. In 2016, the industry was 16.23%. The
company shows best here. In 2017 and 2018, the industry was 11.62 and 10.67% back to back.
18.73%
21.38%
23.48%
21.16%19.36%
2014 2015 2016 2017 2018
Return on equity
93
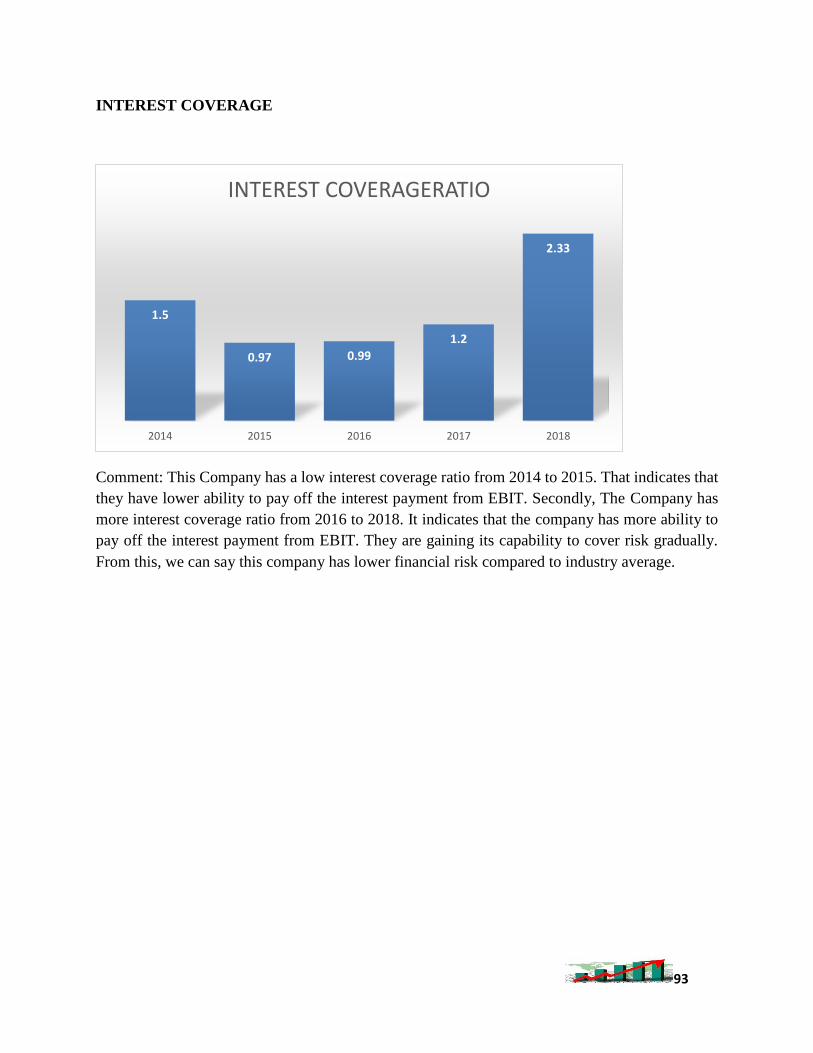
INTEREST COVERAGE
Comment: This Company has a low interest coverage ratio from 2014 to 2015. That indicates that
they have lower ability to pay off the interest payment from EBIT. Secondly, The Company has
more interest coverage ratio from 2016 to 2018. It indicates that the company has more ability to
pay off the interest payment from EBIT. They are gaining its capability to cover risk gradually.
From this, we can say this company has lower financial risk compared to industry average.
1.5
0.97 0.99
1.2
2.33
2014 2015 2016 2017 2018
INTEREST COVERAGERATIO
94
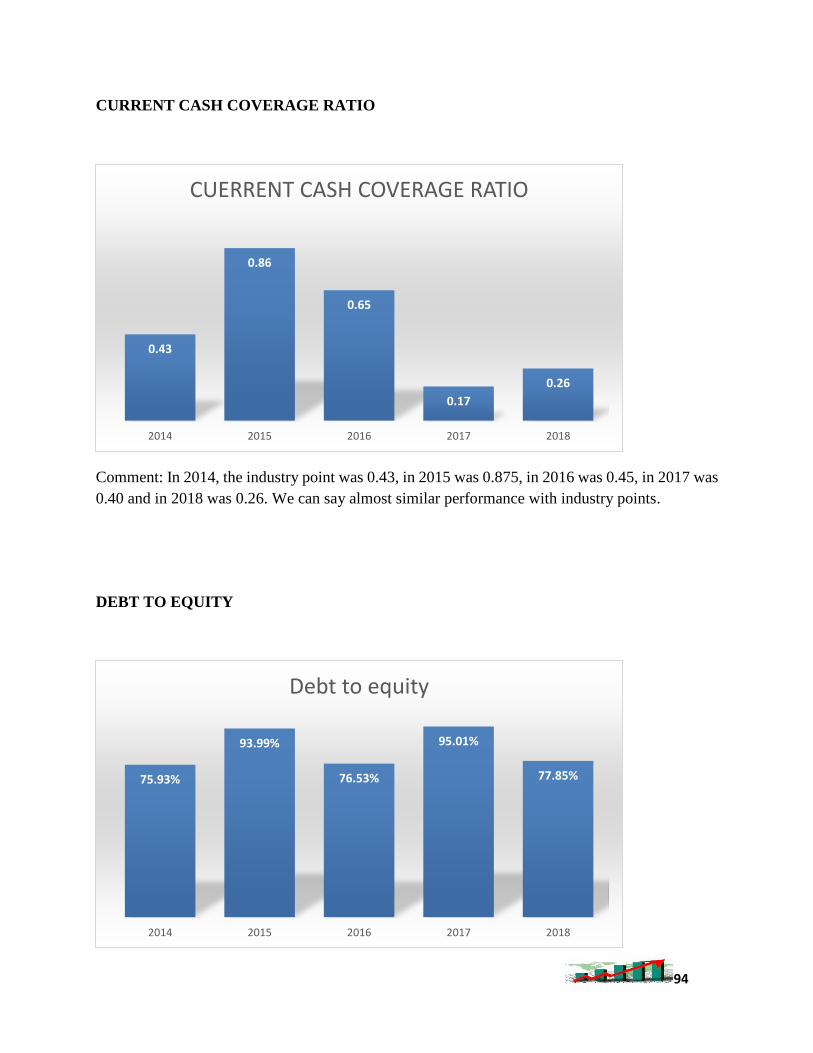
CURRENT CASH COVERAGE RATIO
Comment: In 2014, the industry point was 0.43, in 2015 was 0.875, in 2016 was 0.45, in 2017 was
0.40 and in 2018 was 0.26. We can say almost similar performance with industry points.
DEBT TO EQUITY
0.43
0.86
0.65
0.17
0.26
2014 2015 2016 2017 2018
CUERRENT CASH COVERAGE RATIO
75.93%
93.99%
76.53%
95.01%
77.85%
2014 2015 2016 2017 2018
Debt to equity
95
Comment: compare to industry we can see 75.93% ratio in 2014 where industry ratio was 62.20.
In 2015, the ratio was almost 94% where industry point was 66.51. In 2016 industry, point was
76.53. In 2017, the industry point was 95.01% and 2018 the point was 73.26%. Here we can say
the company much debt to equity rather than industry.
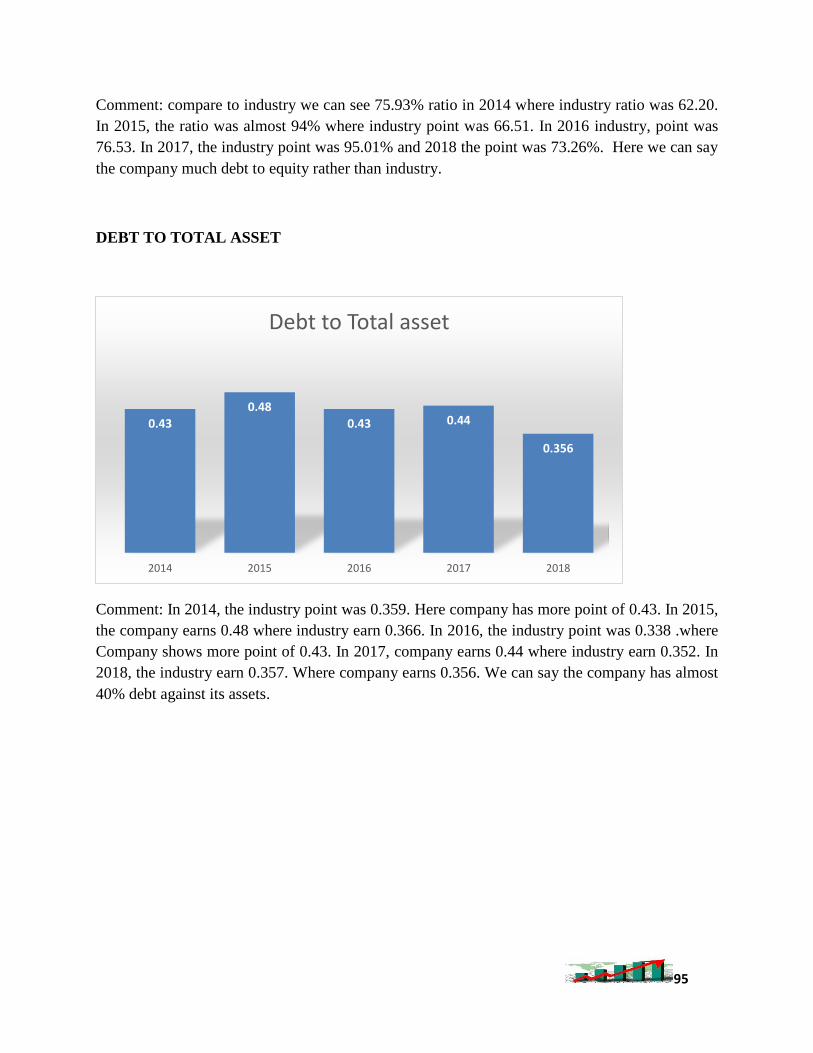
DEBT TO TOTAL ASSET
Comment: In 2014, the industry point was 0.359. Here company has more point of 0.43. In 2015,
the company earns 0.48 where industry earn 0.366. In 2016, the industry point was 0.338 .where
Company shows more point of 0.43. In 2017, company earns 0.44 where industry earn 0.352. In
2018, the industry earn 0.357. Where company earns 0.356. We can say the company has almost
40% debt against its assets.
0.43
0.48
0.43 0.44
0.356
2014 2015 2016 2017 2018
Debt to Total asset
96
6.5 Ratio analysis of ACI pharmaceuticals Ltd
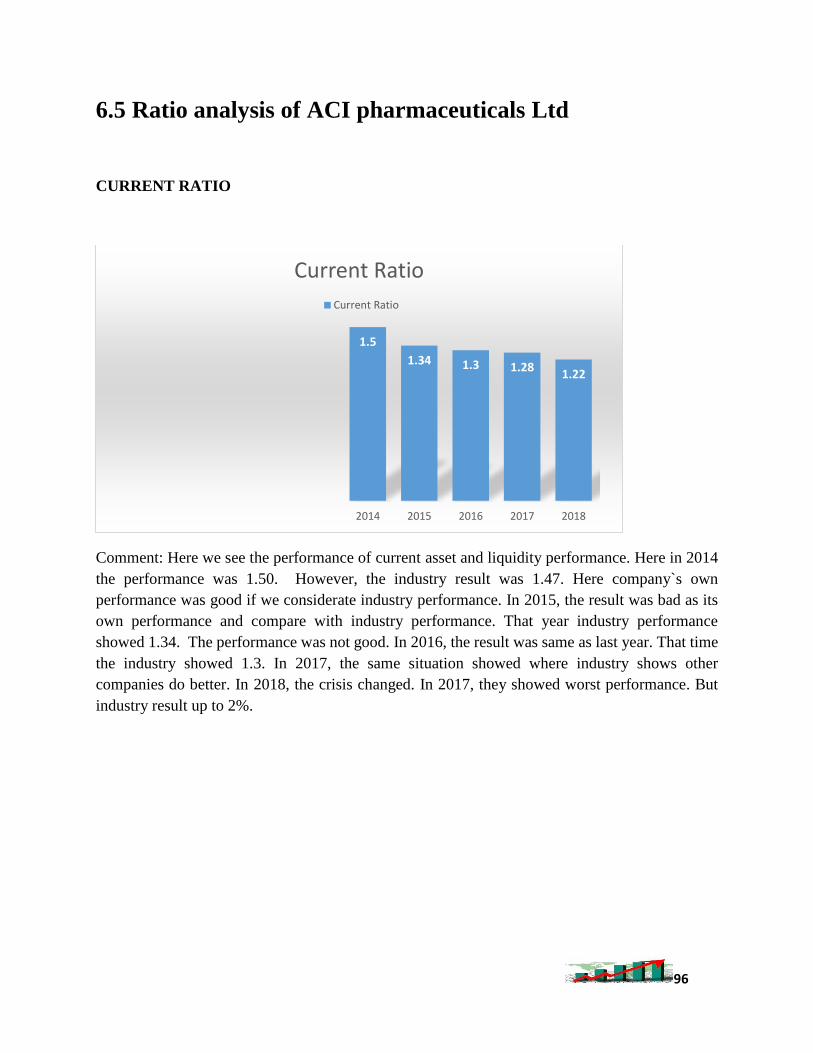
CURRENT RATIO
Comment: Here we see the performance of current asset and liquidity performance. Here in 2014
the performance was 1.50. However, the industry result was 1.47. Here company`s own
performance was good if we considerate industry performance. In 2015, the result was bad as its
own performance and compare with industry performance. That year industry performance
showed 1.34. The performance was not good. In 2016, the result was same as last year. That time
the industry showed 1.3. In 2017, the same situation showed where industry shows other
companies do better. In 2018, the crisis changed. In 2017, they showed worst performance. But
industry result up to 2%.
1.5
1.34 1.3 1.281.22
2014 2015 2016 2017 2018
Current Ratio
Current Ratio
97
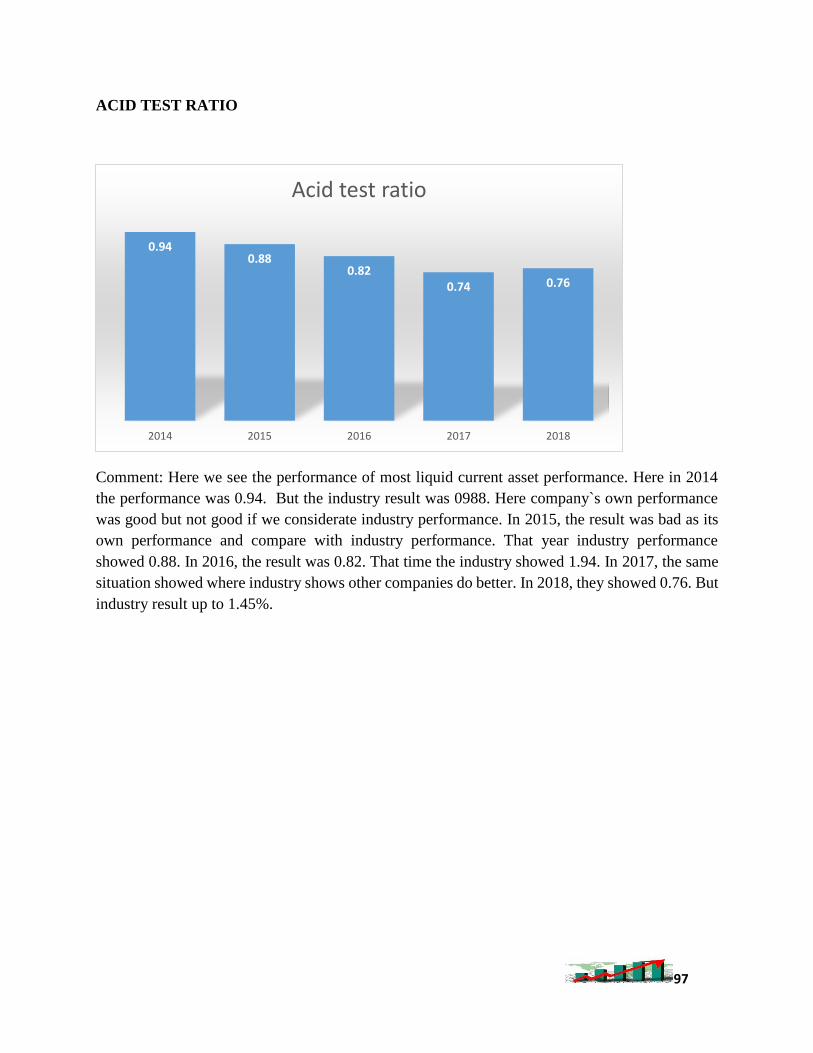
ACID TEST RATIO
Comment: Here we see the performance of most liquid current asset performance. Here in 2014
the performance was 0.94. But the industry result was 0988. Here company`s own performance
was good but not good if we considerate industry performance. In 2015, the result was bad as its
own performance and compare with industry performance. That year industry performance
showed 0.88. In 2016, the result was 0.82. That time the industry showed 1.94. In 2017, the same
situation showed where industry shows other companies do better. In 2018, they showed 0.76. But
industry result up to 1.45%.
0.940.88
0.820.74 0.76
2014 2015 2016 2017 2018
Acid test ratio
98
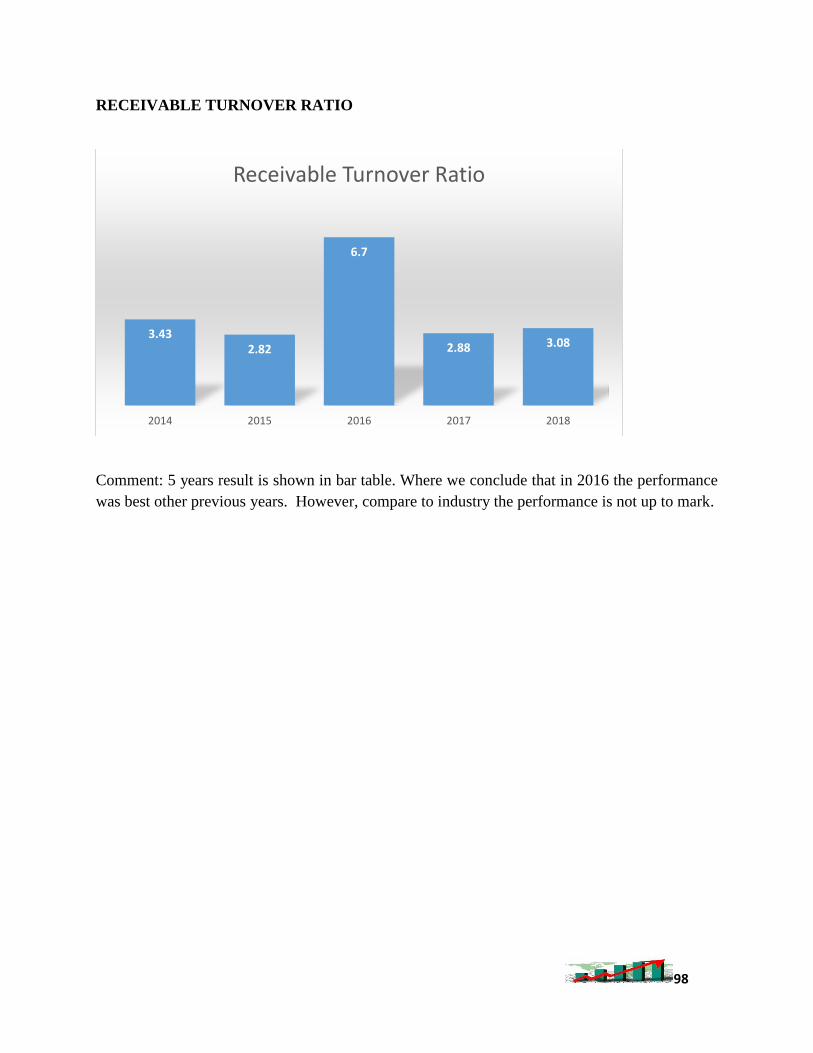
RECEIVABLE TURNOVER RATIO
Comment: 5 years result is shown in bar table. Where we conclude that in 2016 the performance
was best other previous years. However, compare to industry the performance is not up to mark.
3.432.82
6.7
2.88 3.08
2014 2015 2016 2017 2018
Receivable Turnover Ratio
99
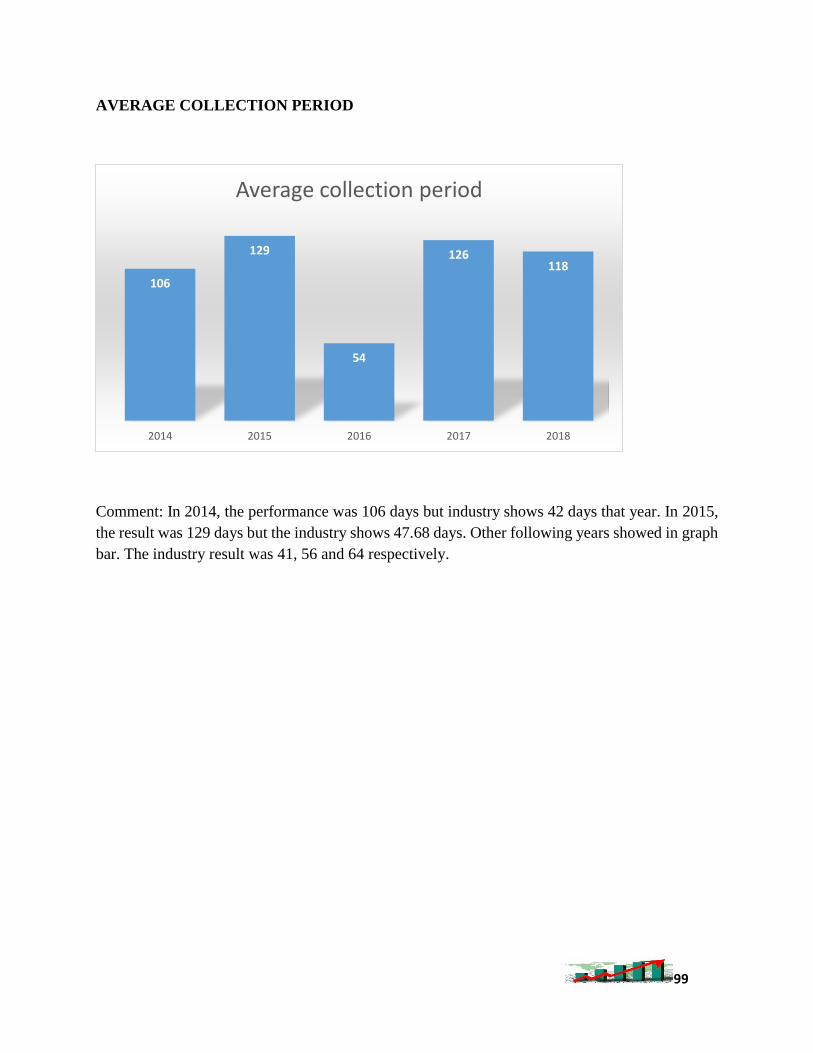
AVERAGE COLLECTION PERIOD
Comment: In 2014, the performance was 106 days but industry shows 42 days that year. In 2015,
the result was 129 days but the industry shows 47.68 days. Other following years showed in graph
bar. The industry result was 41, 56 and 64 respectively.
106
129
54
126118
2014 2015 2016 2017 2018
Average collection period
100
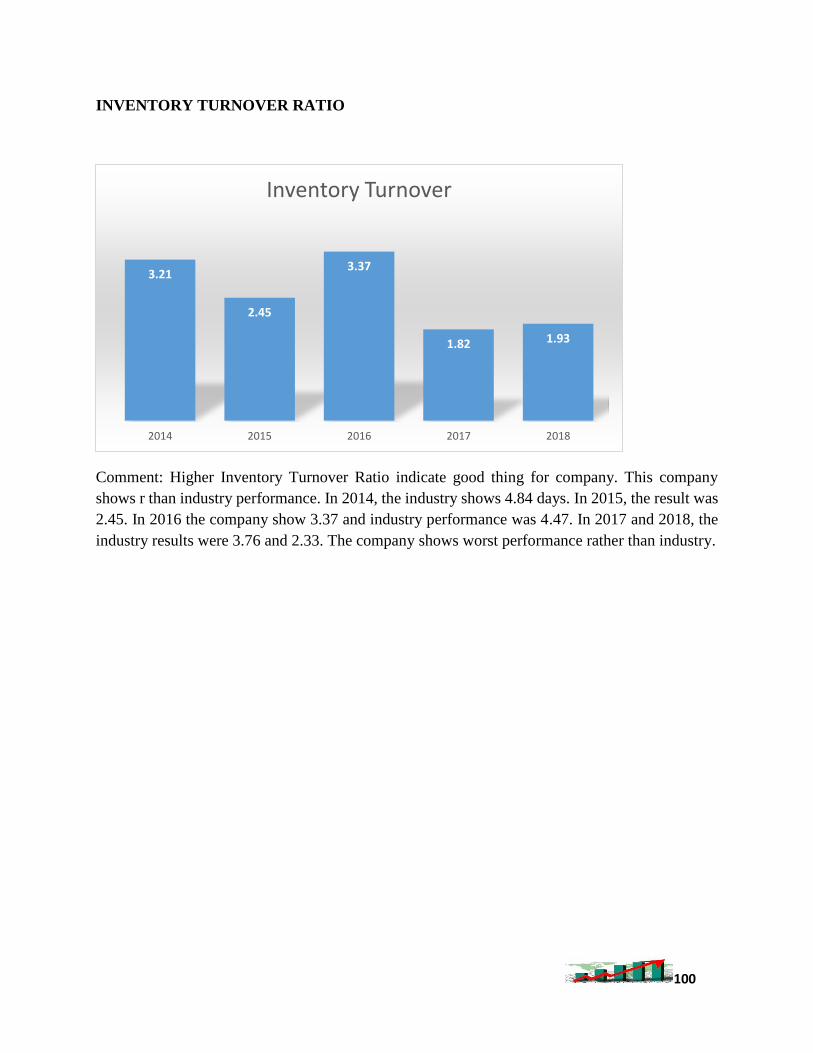
INVENTORY TURNOVER RATIO
Comment: Higher Inventory Turnover Ratio indicate good thing for company. This company
shows r than industry performance. In 2014, the industry shows 4.84 days. In 2015, the result was
2.45. In 2016 the company show 3.37 and industry performance was 4.47. In 2017 and 2018, the
industry results were 3.76 and 2.33. The company shows worst performance rather than industry.
3.21
2.45
3.37
1.82 1.93
2014 2015 2016 2017 2018
Inventory Turnover
101
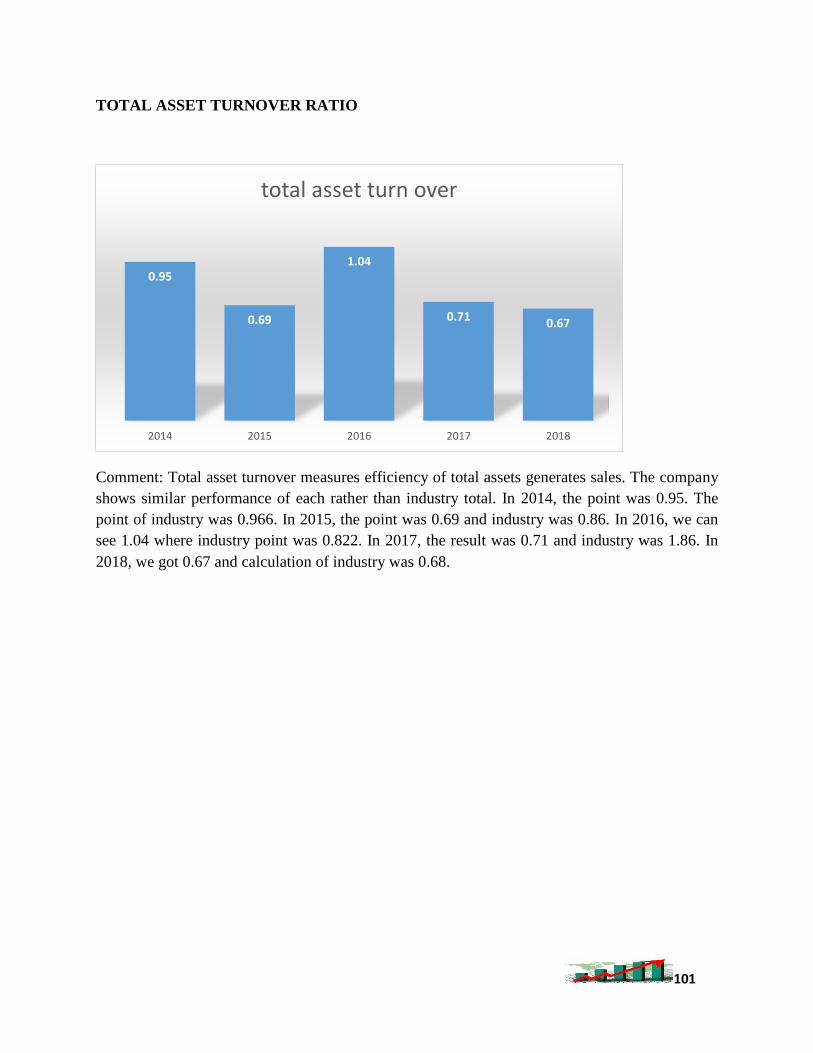
TOTAL ASSET TURNOVER RATIO
Comment: Total asset turnover measures efficiency of total assets generates sales. The company
shows similar performance of each rather than industry total. In 2014, the point was 0.95. The
point of industry was 0.966. In 2015, the point was 0.69 and industry was 0.86. In 2016, we can
see 1.04 where industry point was 0.822. In 2017, the result was 0.71 and industry was 1.86. In
2018, we got 0.67 and calculation of industry was 0.68.
0.95
0.69
1.04
0.710.67
2014 2015 2016 2017 2018
total asset turn over
102
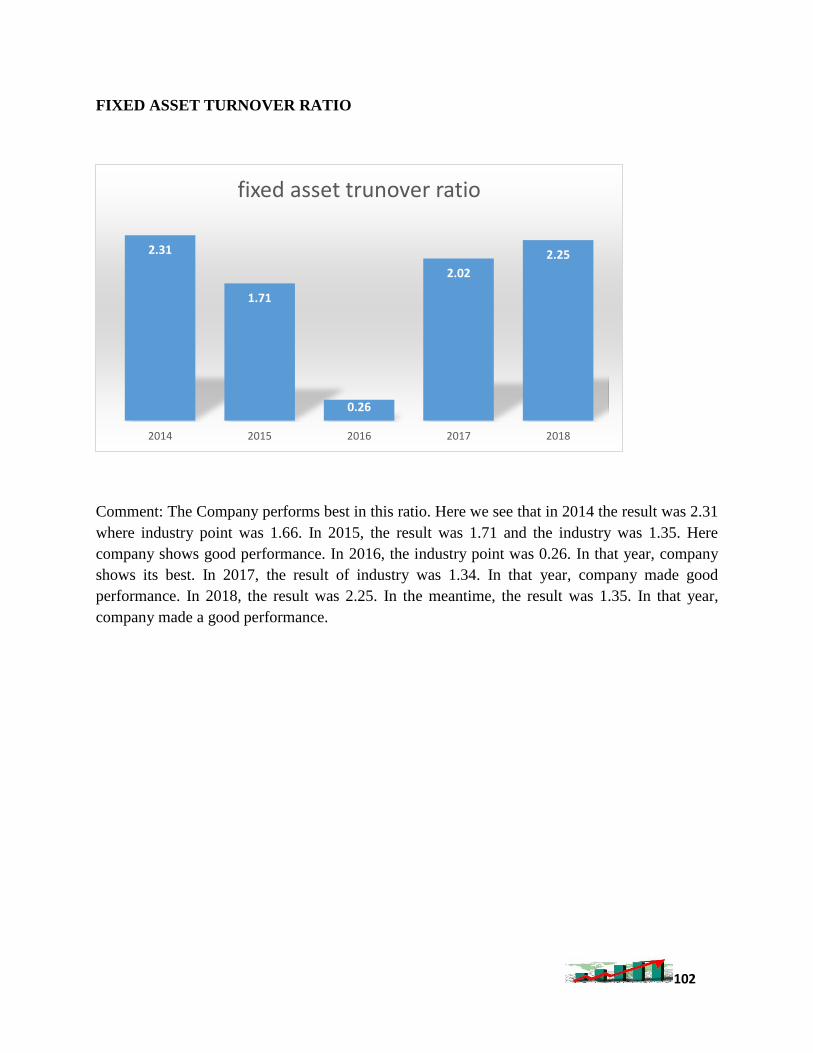
FIXED ASSET TURNOVER RATIO
Comment: The Company performs best in this ratio. Here we see that in 2014 the result was 2.31
where industry point was 1.66. In 2015, the result was 1.71 and the industry was 1.35. Here
company shows good performance. In 2016, the industry point was 0.26. In that year, company
shows its best. In 2017, the result of industry was 1.34. In that year, company made good
performance. In 2018, the result was 2.25. In the meantime, the result was 1.35. In that year,
company made a good performance.
2.31
1.71
0.26
2.02
2.25
2014 2015 2016 2017 2018
fixed asset trunover ratio
103
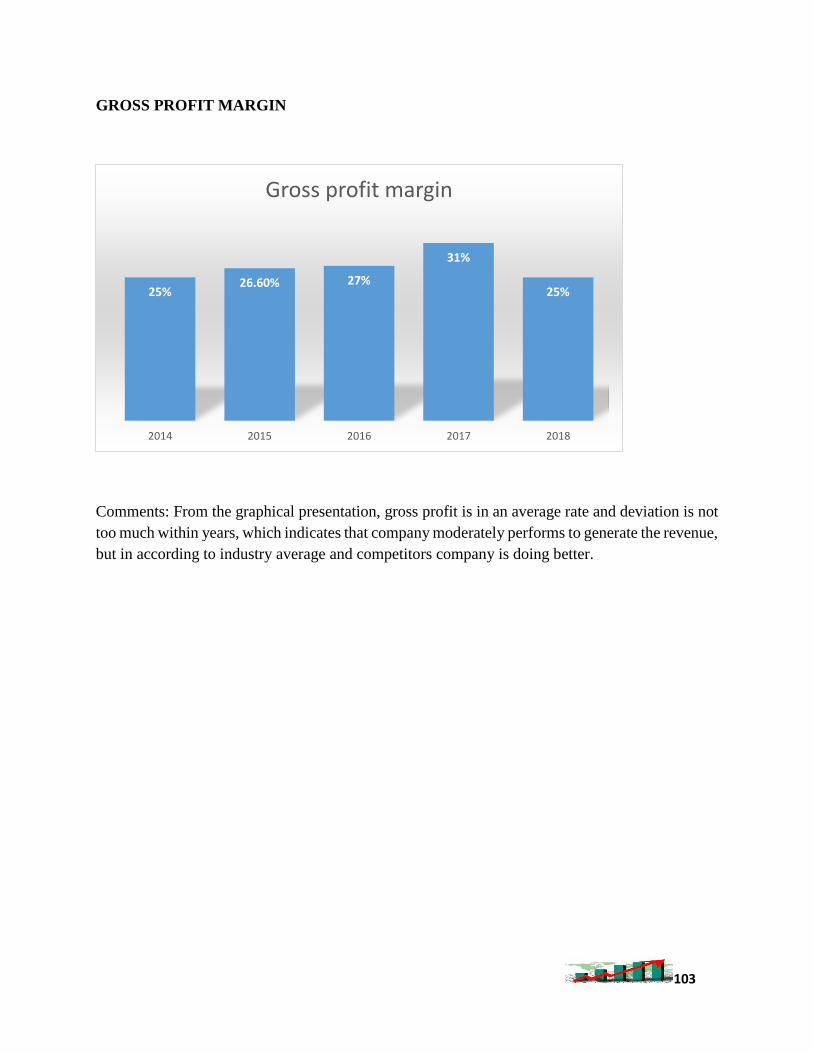
GROSS PROFIT MARGIN
Comments: From the graphical presentation, gross profit is in an average rate and deviation is not
too much within years, which indicates that company moderately performs to generate the revenue,
but in according to industry average and competitors company is doing better.
25%26.60% 27%
31%
25%
2014 2015 2016 2017 2018
Gross profit margin
104
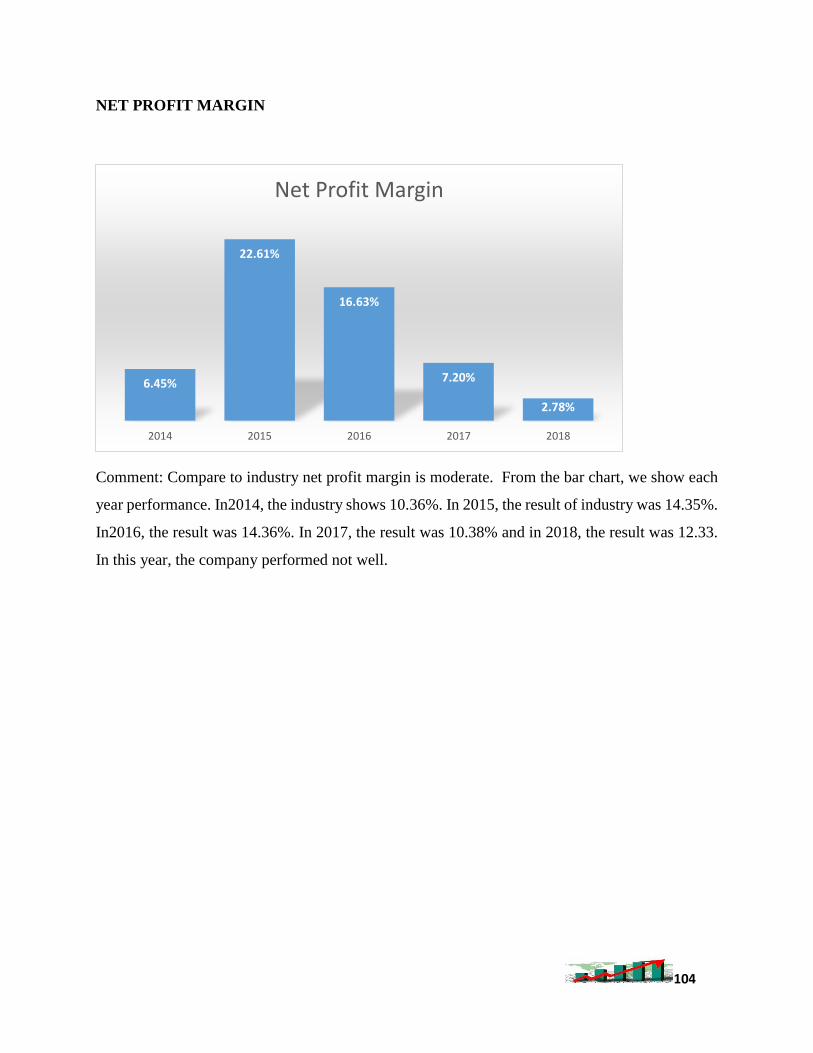
NET PROFIT MARGIN
Comment: Compare to industry net profit margin is moderate. From the bar chart, we show each
year performance. In2014, the industry shows 10.36%. In 2015, the result of industry was 14.35%.
In2016, the result was 14.36%. In 2017, the result was 10.38% and in 2018, the result was 12.33.
In this year, the company performed not well.
6.45%
22.61%
16.63%
7.20%
2.78%
2014 2015 2016 2017 2018
Net Profit Margin
105
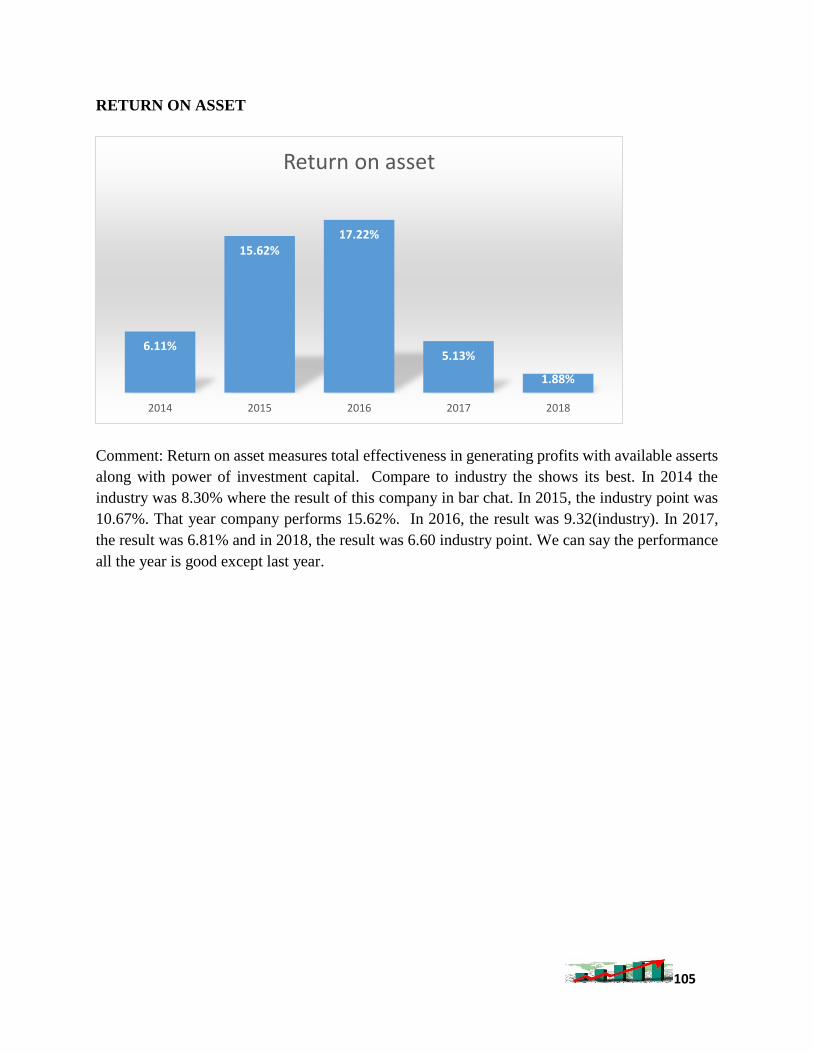
RETURN ON ASSET
Comment: Return on asset measures total effectiveness in generating profits with available asserts
along with power of investment capital. Compare to industry the shows its best. In 2014 the
industry was 8.30% where the result of this company in bar chat. In 2015, the industry point was
10.67%. That year company performs 15.62%. In 2016, the result was 9.32(industry). In 2017,
the result was 6.81% and in 2018, the result was 6.60 industry point. We can say the performance
all the year is good except last year.
6.11%
15.62%17.22%
5.13%
1.88%
2014 2015 2016 2017 2018
Return on asset
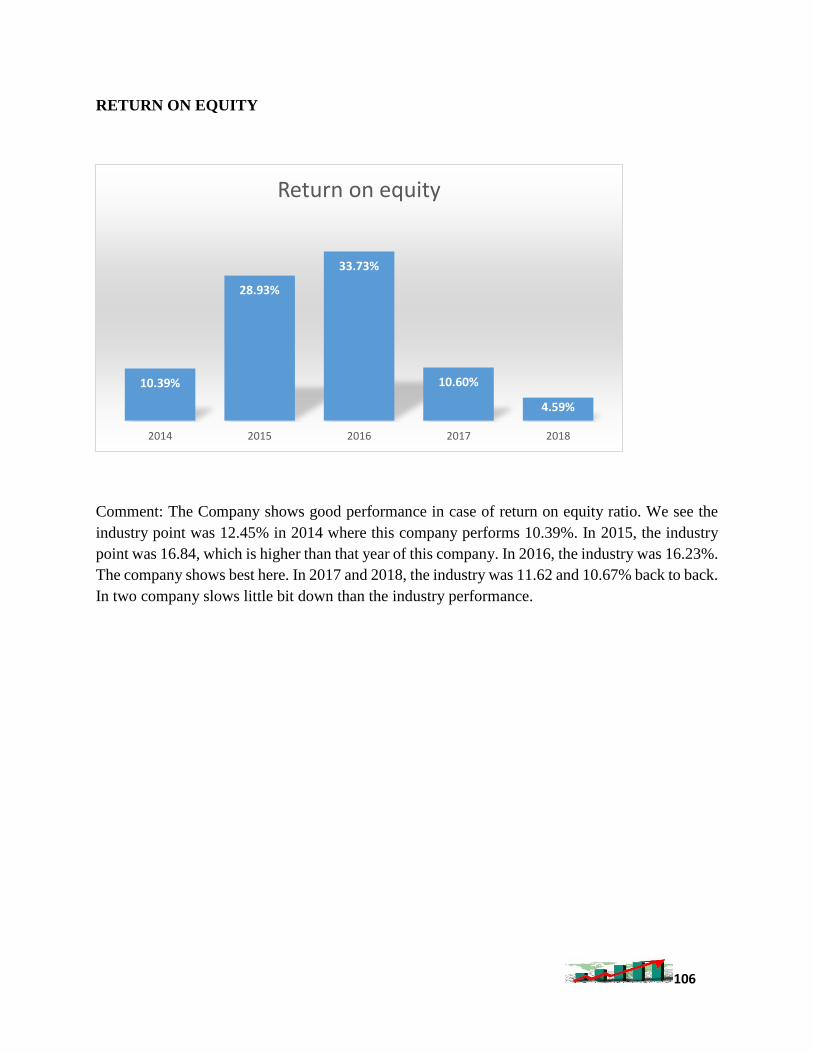
106
RETURN ON EQUITY
Comment: The Company shows good performance in case of return on equity ratio. We see the
industry point was 12.45% in 2014 where this company performs 10.39%. In 2015, the industry
point was 16.84, which is higher than that year of this company. In 2016, the industry was 16.23%.
The company shows best here. In 2017 and 2018, the industry was 11.62 and 10.67% back to back.
In two company slows little bit down than the industry performance.
10.39%
28.93%
33.73%
10.60%
4.59%
2014 2015 2016 2017 2018
Return on equity
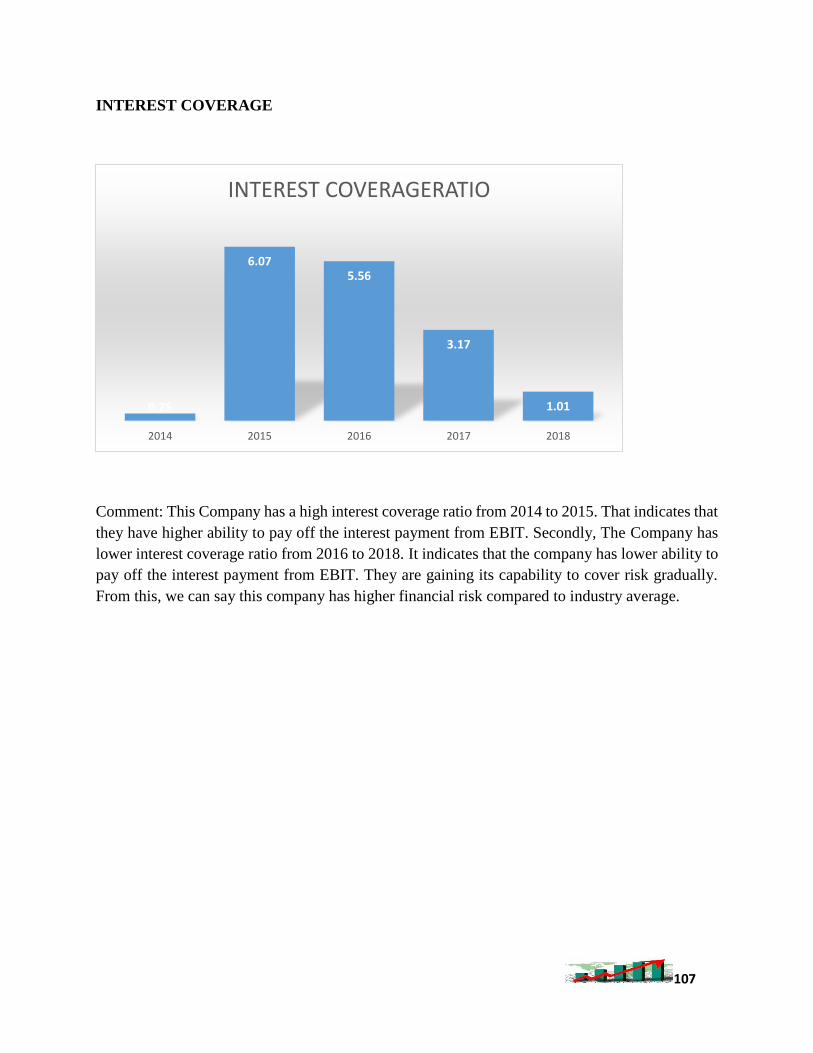
107
INTEREST COVERAGE
Comment: This Company has a high interest coverage ratio from 2014 to 2015. That indicates that
they have higher ability to pay off the interest payment from EBIT. Secondly, The Company has
lower interest coverage ratio from 2016 to 2018. It indicates that the company has lower ability to
pay off the interest payment from EBIT. They are gaining its capability to cover risk gradually.
From this, we can say this company has higher financial risk compared to industry average.
0.25
6.075.56
3.17
1.01
2014 2015 2016 2017 2018
INTEREST COVERAGERATIO
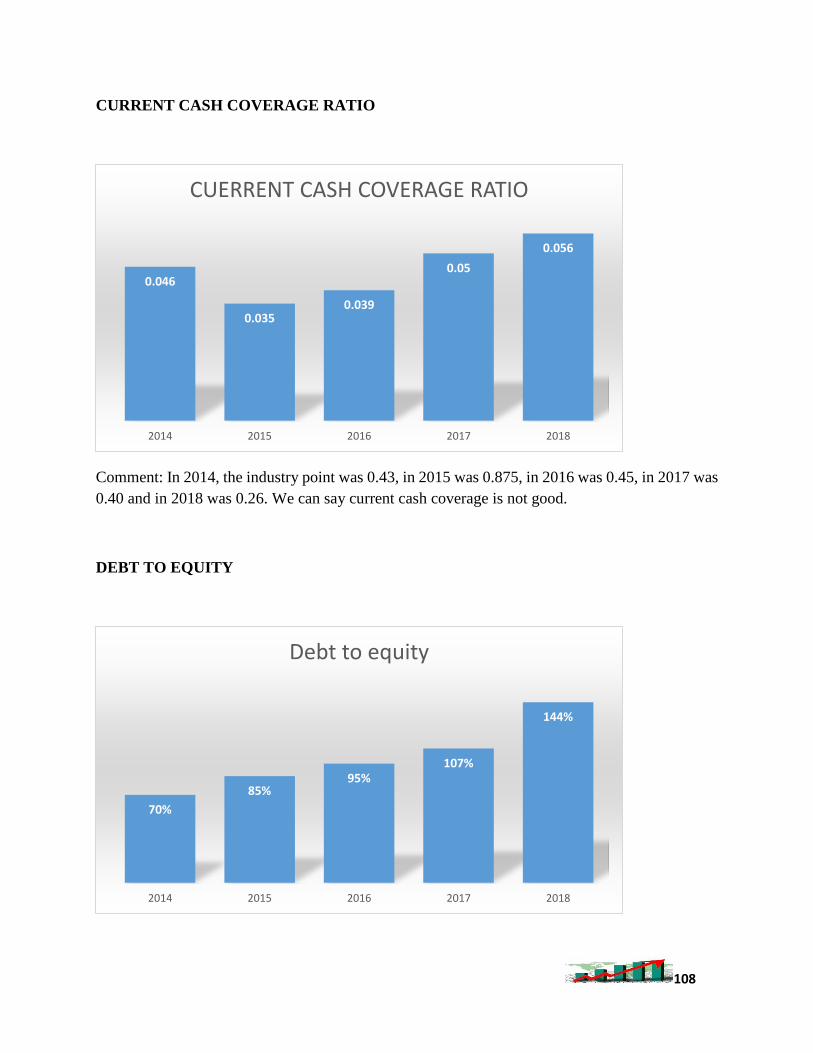
108
CURRENT CASH COVERAGE RATIO
Comment: In 2014, the industry point was 0.43, in 2015 was 0.875, in 2016 was 0.45, in 2017 was
0.40 and in 2018 was 0.26. We can say current cash coverage is not good.
DEBT TO EQUITY
0.046
0.0350.039
0.05
0.056
2014 2015 2016 2017 2018
CUERRENT CASH COVERAGE RATIO
70%
85%95%
107%
144%
2014 2015 2016 2017 2018
Debt to equity
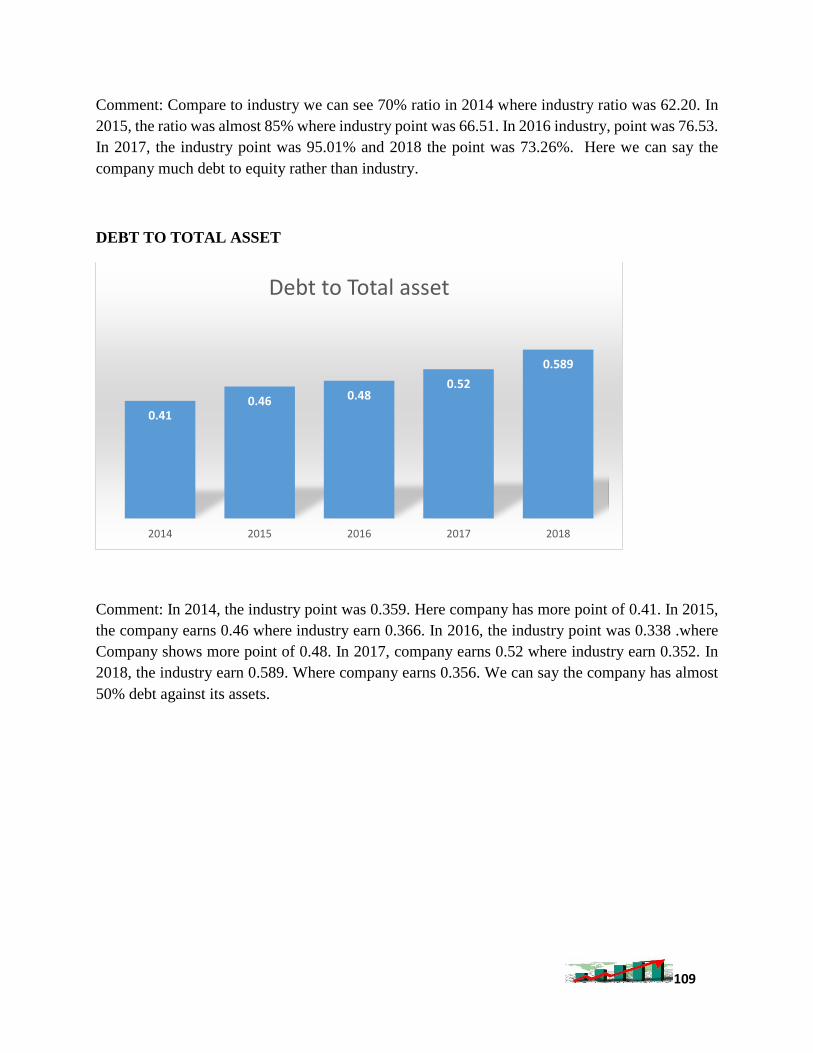
109
Comment: Compare to industry we can see 70% ratio in 2014 where industry ratio was 62.20. In
2015, the ratio was almost 85% where industry point was 66.51. In 2016 industry, point was 76.53.
In 2017, the industry point was 95.01% and 2018 the point was 73.26%. Here we can say the
company much debt to equity rather than industry.
DEBT TO TOTAL ASSET
Comment: In 2014, the industry point was 0.359. Here company has more point of 0.41. In 2015,
the company earns 0.46 where industry earn 0.366. In 2016, the industry point was 0.338 .where
Company shows more point of 0.48. In 2017, company earns 0.52 where industry earn 0.352. In
2018, the industry earn 0.589. Where company earns 0.356. We can say the company has almost
50% debt against its assets.
0.410.46 0.48
0.52
0.589
2014 2015 2016 2017 2018
Debt to Total asset

110
CHAPTER 7
7. CONCLUSION AND
RECOMMENDATION
111
7.1 Conclusion and Recommendations
Bangladesh's pharmaceutical industry has grown steadily over the past five years. From 2012 to
2017, CAGR was 15% for historical five years and 21% for historical three years from 2014 to
2017. The market size of pharmaceuticals could hit around BDT 3,30,000 million by 2024,
according to industry experts. According to the Bangladesh Association of Pharmaceutical
Industries (BAPI) and DGDA, approximately 257 licensed pharmaceutical manufacturers operate
in Bangladesh and approximately 150 are functional. Such manufacturing firms meet
approximately 97% of local demand. Specialized products such as vaccines, cancer drugs and
hormone medications were imported to meet these requirements. There is a high concentration of
the drug industry. The largest portion of the industry dominates the top 20 participants. For
different brands, each company has the same medication. Companies compete aggressively with
each other to win market share.
From the analysis, I can conclude that Bangladesh’s pharmaceutical industry is growing day by
day. The global generics market is estimated at around $1.06 trillion and is projected to grow by
$1.30 trillion by 2020. Generic drugs will continue to grow at a healthy rate of over $150 trillion
by 2020. Healthcare costs have risen, particularly medicine costs have become a global concern.
Pharmaceutical companies in Bangladesh are ideally positioned to provide high-quality contract
manufacturing services to companies from developed countries. These companies are trying to
expand geographical scope. Most facilities are licensed by international regulatory authorities.
Patent medicine industry has lower position. Therefore, the leading industry of our country should
focus on research and development sector. If the pharmaceuticals companies use this sector
effectively, they can get monopoly benefit. All over, the world is trying to invent more in patent
medicines. Our pharmaceuticals company has strong position in generic medicine sector.
However, the leading companies have some problems too. The government is supporting well but
the operating cost and import cost is high. As a result, their profit is decreasing. To overcome such
problems, this sector needs more incentives. Bangladesh exports to more than 100 nations,
including some developed countries, medicines and healthcare services. For Bangladesh, it is a
significant development that while being a member of the LDC countries, Bangladesh's
pharmaceutical products compete with the developing countries and some developed countries.
There is therefore no doubt about the ability to produce high-quality drugs. Growth in this sector
is gigantic. Therefore, immediate attempts by both government and non-governmental
organizations can make this industrial sector more likely to contribute to Bangladesh's economic
growth.
112
REFERENCES
1. https://www.dhakatribune.com/business/2019/08/22/bangladesh-pharmaceutical-industry-blooms-
bigger
2. https://www.dhakatribune.com/business/2019/08/22/bangladesh-pharmaceutical-industry-blooms-
bigger
3. http://www.beximcopharma.com/
4. https://www.aci-bd.com/aci-pharmaceuticals/
5. https://www.squarepharma.com.bd/
6. http://www.acmeglobal.com/
7. http://www.ibnsinapharma.com/
8. Annual report of:
Annual report of Beximco Pharmaceuticals (2014-2018).
Annual report of Square Pharmaceuticals (2014-2018).
Annual report of ACME Laboratories Ltd (2014-2018).
Annual report of IBNE SINA (2014-2018).
Annual report of ACI Ltd (2014-2018).