Embed Size (px)
Citation preview

1
FINANCIAL PERFORMANCE STATUS
OF
NEPAL SBI BANK AND EVEREST BANK LIMITED
A THESIS
Submitted By:
NIRASHORI SEN
T.U. Regd. No: 23296-95
Campus Roll No: 1526/062
Submitted To:
Office of the Dean
Faculty of Management
Tribhuvan University
In Partial Fulfillment of the Requirement for the Degree
Master’s of Business Studies (M.B.S.)
Kathmandu, Nepal
December, 2010

2
RECOMMENDATION
This is to certify that the thesis
Submitted By:
NIRASHORI SEN
Entitled:
FINANCIAL PERFORMANCE STATUS
OF
NEPAL SBI BANK AND EVEREST BANK LIMITED
Has been prepared and approved by this department in the prescribed format of
Faculty of Management. This thesis is forwarded for examination.
…………………………………… ……………………………………………. …………………………………………
Dr. Shilu M. Bajracharya Prof. Bisheshwor Man Shrestha Prof. Dr. Kamal Deep Dhakal
(Thesis Supervisor) (Head Research Department) (Campus Chief)

3
VIVA-VOCE SHEET
We have conducted the Viva-Voce examination of the thesis presented
Submitted By
NIRASHORI SEN
Entitled:
FINANCIAL PERFORMANCE STATUS
OF
NEPAL SBI BANK AND EVEREST BANK LIMITED
And found the thesis to be original work of the student and written in accordance to
the prescribed format. We recommend the thesis to be accepted as partial fulfillment of
the requirements for Master Degree of Business Studies (M.B.S)
Viva-Voce Committee:
Head, Research Department :…………………………………………………
Member (Thesis Supervisor) :…………………………………………………
Member (Thesis Supervisor) :…………………………………………………
Member (External Expert) :…………………………………………………

4
DECLARATION
I hereby declare that the work reported in this thesis entitled “Financial
Performance Status Of Nepal SBI Bank And Everest Bank Limited” submitted to
Shanker Dev Campus, Faculty of Management, Tribhuvan University, is my
original work done in the form of partial fulfillment of requirement for the
Master’s Degree in Business Studies (M.B.S) under the supervision of Dr. Shilu
M. Bajracharya of Shanker Dev Campus.
NIRASHORI SEN
Researcher
T.U. Regd. No: 23296-95
Campus Roll No: 1526/062

5
ACKNOWLEDGEMENT
I express my sincere gratitude to all the authors and learned personalities, whose
writings have been cited in this study. I also express my sincere gratitude to those
authors whose writings though are not cited but helped and inspired me in making my
vision clear and reaching on conclusion.
I extend my deep sense of indebtedness to my respected supervisor Dr. Shilu M.
Bajracharya for his precious guidelines, inspiration and suggestion thoroughly during
the period of this research. Without his valuable insight, I would not think of
accomplishment of this thesis. I acknowledge my profound gratitude to the personnel
of Nepal SBI Bank & Everest Bank Limited for the cooperation shown and providing
necessary data.
I want to give thanks for the staff members of T.U. Central Library, Shanker Dev
Campus Library who provided the reference and reading materials during the period
of research.
Finally, I would like to express my sincere gratitude to all my family members, all my
friends for their assistance, timely encouragement in every step.
Thank you.
NIRASHORI SEN
6
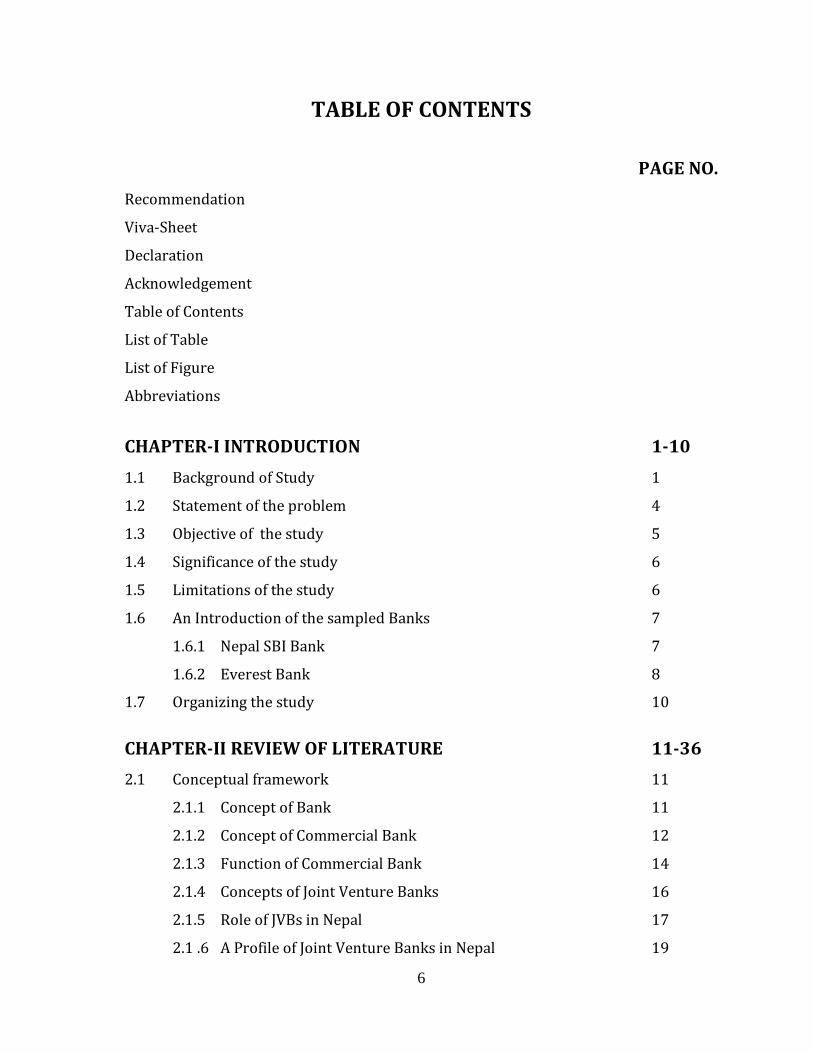
TABLE OF CONTENTS
PAGE NO.
Recommendation
Viva-Sheet
Declaration
Acknowledgement
Table of Contents
List of Table
List of Figure
Abbreviations
CHAPTER-I INTRODUCTION 1-10
1.1 Background of Study 1
1.2 Statement of the problem 4
1.3 Objective of the study 5
1.4 Significance of the study 6
1.5 Limitations of the study 6
1.6 An Introduction of the sampled Banks 7
1.6.1 Nepal SBI Bank 7
1.6.2 Everest Bank 8
1.7 Organizing the study 10
CHAPTER-II REVIEW OF LITERATURE 11-36
2.1 Conceptual framework 11
2.1.1 Concept of Bank 11
2.1.2 Concept of Commercial Bank 12
2.1.3 Function of Commercial Bank 14
2.1.4 Concepts of Joint Venture Banks 16
2.1.5 Role of JVBs in Nepal 17
2.1 .6 A Profile of Joint Venture Banks in Nepal 19

7
2.1.7 Financial Analysis 19
2.2 Review of related studies 23
2.3 Review of Previous Thesis 29
CHAPTER-III RESEARCH METHODLOGY 37-65
3.1 Research Design 37
3.2 Population and Sample 38
3.3 Sources of Data 38
3.3.1 Data Collection Procedure 38
3.4 Data Processing 40
3.5 Method of Data analysis 40
3.5.1 Financial tools 40
3.5.1.1 Ratio analysis 41
3.5.1. 1.1 Liquidity Ratios 42
3.5.1.1.2 Leverage Ratio 45
3.5.1.1.3 Capital Adequacy Ratio 47
3.5.1.1.4 Turnover Ratio 49
3.5.1.1.5 Asset Quality Ratio 52
3.5.1.1.6 Profitability Ratio 53
3.5.1.2 Other indicators 56
3.5.1.3 Income and Expenditure Analysis 59
3.5.2 Statistical Tools 59
3.5.2.1 Arithmetic mean 60
3.5.2.2 Variance 60
3.5.2.3 Standard deviation 60
3.5.2.4 Coefficient of variation 61
3.5.2.5 Student's T-test 61
3.5.2.6 Karl Person's coefficient of correlation 62
3.5.2.7 Probable error of correlation coefficient 62
3.5.2.8 Least square linear trend 63
3.6 Limitation of financial analysis 64

8
CHAPTER-IV ANALYSIS AND INTERPRETATION OF DATA 66-124
4.1 Ratio Analysis 66
4.1.1 Liquidity Ratios 67
4.1.2 Leverage ratios 71
4.1.3 Capital Adequacy ratio 74
4.1.4 Turnover ratios 76
4.1.5 Asset quality ratios 81
4.1.6 Profitability ratios 84
4.1.7 Others indicators 89
4.1.7.1 Earning per share (EPS 90
4.1.7.2 Dividend per share (DPS) 90
4.1.7.3 Tax per share (TPS) 91
4.1.7.4Dividend payout ratio (DPR) 92
4.1.7.5 Price-earnings ratio 92
4.1.7.6 Market value per share to book value per share (MVPS/BVPS) 93
4.2 Income and Expenditure Analysis 94
4.2.1 Income analysis 94
4.2.2 Expenses analysis 97
4.3 Correlation Analysis 100
4.4 Least Square liner Trend Analyses 106
4.5 Major Findings 119
CHAPTER – V SUMMARY, CONCLUSION AND RECOMMENDATION
125-128
5.1 Summary 125
5.2 Conclusion 125
5.3 Recommendation 126
BIBLOGRAPHY
APPENDIX

9
LIST OF TABLE
TABLE TITLE PAGE NO.
Table2.1 Brief profile of joint venture banks in Nepal 19
Table 4.1 Deposit Forecasting of NSBIBL & Everest Bank 108
Table 4.2 Forecasting of Loan and advance 110
Table 4.3 Trend value of Net worth 111
Table 4.4 Forecasting of Investment 113
Table 4.5 Forecasting of Net Profit 115
Table 4.6 Forecasting of EPS 116
Table 4.7 Forecasting of MVPS 118

10
LIST OF FIGURES
FIGURE TITLE PAGE NO.
Figure 4.1 Deposits Forecasting of NSBIBL & Everest Bank 108
Figure 4.2 Forecasting of Loan and advance 110
Figure 4.3 Trend Value of Net Worth 112
Figure 4.4 Forecasting of Investment 113
Figure 4.5 Forecasting of Net Profit 115
Figure 4.6 Forecasting of EPS 117
Figure 4.7 Forecasting of MVPS 118

11
ABBREVIATIONS
& : And
A/C : Account
A.D : Anno Domini
ADBL : Agriculture Development Bank
BIS : Bank for International Settlement
B.S : Bikram Sambat
BVPS : Book Value per Share
C.V : Correlation of Variation
DPS : Dividend per Share
DPR : Dividend Payout Ratio
EAC : Earning Available to Common Shareholder
EBL : Everest Bank Limited
EPS : Earning Per Share
FY : Fiscal Year
GON : Government of Nepal
HBL : Himalayan Bank Limited
i.e. : That is
JVBs : Joint Venture Banks
Ltd. : Limited
MBS : Master of Business Studies
MVPS : Market Value per Share
NGO : Non Government Organization
NO. : Number
NSBIBL : Nepal State Bank of India Bank Limited
NRB : Nepal Rastra Bank
NPAT : Net Profit after Tax
Pvt. : Private
% : Percentage

12
P/ER : Price-Earning Ratio
S.D : Standard Deviation
T.U : Tribhuvan University
TPS : Tax per Share
USA : United States of America
Vol. : Volume
Yrs. : Years

13
CHAPTER-I
INTRODUCTION
1.1 Background of Study
Nepal is located in between the latitude 26 22' north to 30 27' and longitude 80 4' east
to 5o 88 12' east and Average length 885 Km east to west and average breath is about
193 Km north to south and area is land-locked country and the nearest sea port is
locked at Bay of Bengal, Calcutta in India, 1126 Km to the south east of country, which
has greatly hindered it's foreign trade situation.
Surround by China and India the two regional super-powers. Nepal is still in the list of
the least developed countries in the world Majority of population is still much below
the poverty line. The agro-dominated economy is further worsened by the complete
geographical situation. Various factors like the landlocked situation, poor resource
mobilization, lack of entrepreneurs, lack of institution commitment erratic government
policies political instability, etc. are responsible for the slow pace of development in
Nepal.
Economic Development in Nepal, in real sense, started only after Rana regime in the
late period of Rana regime, some positive attempts were made. As result, 'Udyog
Parishad' got its existence in 1935 AD-Biratnagar Jute Mill in 1936 AD. Just before the
break of Second World War, a twenty year plan was announced and National planning
committee was set up in 1949 AD but plan never came to the notice of people and this
idea disappeared with the dissolution of National planning committee.
Nepal in early 1950 AD began the process of economic and social development in spite
of the lack of modern institutions and infrastructures. Budgetary system was
introduced in 1952 AD (2008BS) in the same year, a separate ministry for planned and
Development was established for uplifting the nation.
It is forty-seven years since the first five-year pain was executed up to now nine
successive plans has already been implemented. A cursory look at these plane shows

14
that the major focus has been laid on agro-sector, industrial sector and in the field of
infrastructure development.
Economic stabilization program, adopted in 2042 BS with the assistance of IMF can be
taken as the beginning of economic liberalization in Nepal. Structural adjustment
program brought in 2044 BS with the structural adjustment facility from IMF can be
considered as the continuation of same policy. After the restoration of multiparty
system the first elected government (2047 BS), encouraged the process of globalization
in order to accelerate the process of economic liberalization and globalization the
government enforced 'the Foreign investment and Technology Transfer Act-2049 and
'Foreign Investment and One Window Policy-2049' As per the arrangement in policies
license should be taken from the related department for technology transfer
Technology can be transferred in case of collage industries the fixed assets constituting
up to twenty million rupees. Foreign investors should pay 15% tax on earning.
Similarly, the government enforced 'Industrial Enterprises Act-2049 formulated new
'Industrial Policy-2049 and 'Commercial Policy-2049. The policies include one window
provision for internal and foreign investors, non-nationalization of new industries,
implementation of full convertibility of Nepalese currency on current account etc. Non-
requirement of license for the establishment of the industries other than having social
cost was another aspect of the policy.
In the similar way, the government enforced the 'Privatization Act-2050 including its
regulation and guidelines. The government developed various criteria for promoting
private sector organizations. They include management contract, Partial privatization,
and lease contract, asset selling and selling of shares. In case, the shares to the
employees of enterprise, 25% to the public and management shares to the competent
party or individuals.
Those policies have certainly contributed in the initial stage of globalization in the
country. Their effectiveness can be measured in near future in terms of economy
generating issues and enhancing overall GNP and GDP of the country. Since last decade,

15
there have been a considerable growth in service sector activities in Nepal including a
share increases in banking, Insurance, transportation, airlines, finance companies, co-
operative societies, hydropower centers etc. A growing number of NGOs and INGOs,
multinational companies are mushrooming in Nepal.
The concept of financial institutions in Nepal dates back more than sixty years. In
1994BS, first commercial bank, Nepal Bank Limited was established under the Banking
Act-1993'. The government provided 51% equity of the bank and the promoters
shared the rest Nepal Rastra Bank, the central bank emerged in 2013 BS under 'Rastra
Bank Act-2012'. Since then, it has been providing policies and guidance to the financial
sectors in one hand and is monitoring and controlling then in the other Realizing the
need of adequate banking services for the integrated and speedy development of
industrial sector, Rastriya Banijya Bank came into existence in 2022 Bs with 100%
government equity.
After the establishment of Agricultural Development Bank in 2024BS, growth of
banking institutions remained almost stagnant till 2040BS. No new banks opened in
this period though some branches of previously established bank were extended.
Liberalization policy of government formulated in 2038BS allowed private sectors to
open joint venture banks in foreign collaboration Nepal Arab Bank Limited became the
first commercial bank to register under new arrangement. The bank started its
operation since 2041BS. It is an associated of Dubai Bank Limited, UAE and Nepalese
promoters Nepal Indosuez Bank Limited and Nepal Grind lays Bank Limited were
other joint venture banks established afterwards.
After restoration of multiparty democracy in the country, the government formulated
new policies along with the amendment of existing policies. To accelerate the process
of economic liberalization and globalization. As consequence, other six JVBs came in
existence Nepal Bank of Ceylon Limited has been the youngest one until now Relation
to the commercial banks, they have been altogether fifteen in number. These banks
attempted to introduce foreign management skill technical knowledge and foreign

16
capital. The situation created an environment of healthy competition among the
existing financial institutions.
It evident that different nine joint venture banks were established in different dated
with their head office mainly at Kathmandu, except Bank of Ceylon (Siddhartha agar).
Therefore, the present study focuses on the comparative financial performance
analysis of Nepal SBI Bank Limited and Everest Bank Limited. For the purpose, the
study evaluates the position of the bank with respect to liquidity, Leverage capital
adequacy, turnover and profitability and tests the relationship between various
variable. The study assumes the hypothesis that the performance of sampled banks
does not differ significantly.
1.2 Statement of the problem
The number of joint venture banks is being increased in response to the economic
liberalization polices of the government besides joint venture banks, commercial banks
are also being registered by Nepalese promoters other institutions offering similar
nature of services like finance companies, co-operative societies and development
banks are growing in large number these institutions have the tendency to centralize
in major cities focusing the activities among the industrialists, traders and
entrepreneurs.
As per the economic survey of fiscal year 03/04. Nepalese economy witnessed mixed
trend. Total credit and investment of the bank grew by lower rate than that of the
previous year. The rate of resource utilization by commercial banks declined in the
year as compared to the previous year. Sluggish securities market could not show any
conspicuous sign of revival in the manufacturing sector banks have been facing the
considerable pressure to lower the commercial banks are competing for limited
opportunities narrow clientele base and barring investment in treasury bills. There are
hardly any other opportunities available for short-term investment. Because of
continued slackness in the economic activities in the country, the demand for credit

17
has not picked up besides, competition in the banking sector has turned more and
leading opportunities in good projects are very limited.
With the prevailing economic condition of the country. The investment in agriculture,
manufacturing and industrial sectors has not grown satisfactory. Hence, the joint
venture banks are also not succeeding perfectly to shift the deposit in profitable
sectors competition being the burning issues at present their eyes for the better
productive and growth.
The problem of the study lies on the issues related to the Nepal SBI Bank and Everest
Bank answer to the following question.
- How far have Nepal SBI Bank and Everest Bank been able to shift the monetary
resources from savers to users?
- How sound the operational result in relation to their profitability?
- What is the comparative position of two banks in terms of liquidity, leverage
capital adequacy and profitability?
1.3 Objective of the study
Main objective of this research is to examine and evaluate the financial performance to
two joint venture banks namely Nepal SBI Bank and Everest Bank. The specific
objectives of this research are as follow.
- To examine the financial position of selected joint venture banks.
- To analyze liquidity, leverage, capital adequacy and profitability position of
Nepal SBI Bank and Everest Bank.
- To examine the trend of total deposits, total investments, loan and advances, net
worth, net profit, earning per share and market value( per share of these banks
for coming five years)
- To analyze the financial strengths and weaknesses of the concerned banks and
offer suggestion for the improvement in performance.

18
1.4 Significance of the study
At present the joint venture bank are going a wide popularity through the efficient
management and professional service and playing an eminent role in the economy.
Regarding the economic structure of the country, the banks do not have sufficient
investment opportunities. Rapidly increasing financial instruction are creating threats
to the joint venture banks. In this context, the financial analysis would not analyze
strengths, weaknesses, opportunities and threats of selected joint venture banks. The
result of the research will be helpful for JVBs especially for sample to formulate
strategies to face the increasing competitions. The study no doubt will also have
multidimensional importance for various areas. These are mentioned below:
- Importance to shareholders
- Importance to policy formulators and academically professional.
- Importance to management bodies of these banks for the evaluation of the
performance of their banks and in comparison which others banks.
- Importance to government bodies and policymaker such as Central bank.
- Interested outside parties such as investors, customers (depositors, loan takers
as well others types of clients.), competitors, personnel of the banks stock
brokers, dealers and market makers etc.
- Significance to student and various groups those having interested in banking
sectors as well as the management bookies of these banks for the evaluation of
performance of their banks and in comparison which other bank.
- This study helps these banks to identify its hidden weakness regarding financial
administration and necessity of the present study is justified.
1.5 Limitations of the study
This reach will try it's almost care to cover most of the importance sector; it is still
subject to the following limitations in brief. Being a student, lack of the sufficient time
and resources are the major limitation therefore the study has been conducted as
partial fulfillment of the requirement for therefore the study has been conducted as
partial fulfillment of the requirement for the master of business studies of the
19
management faculty TU. of the nine JVBs, the study covers judgmentally selected two
small samples i.e. Nepal SBI Bank and Everest Bank which is based on secondary data
therefore the reliability of the study depends upon the accuracy of the provided
published audited general report documents such as balance sheet, profit and loss
account, statement which are circulated of the close of the financial year.
- The analysis period of research covers only five years i.e. the fiscal year
2004/2005 to 2008/2009
- It focuses on financial performance and does not cover other aspects.
- Relating to the literature review, only master level theses have been reviewed.
- In this study, only selected financial and statistical tools and techniques are
used.
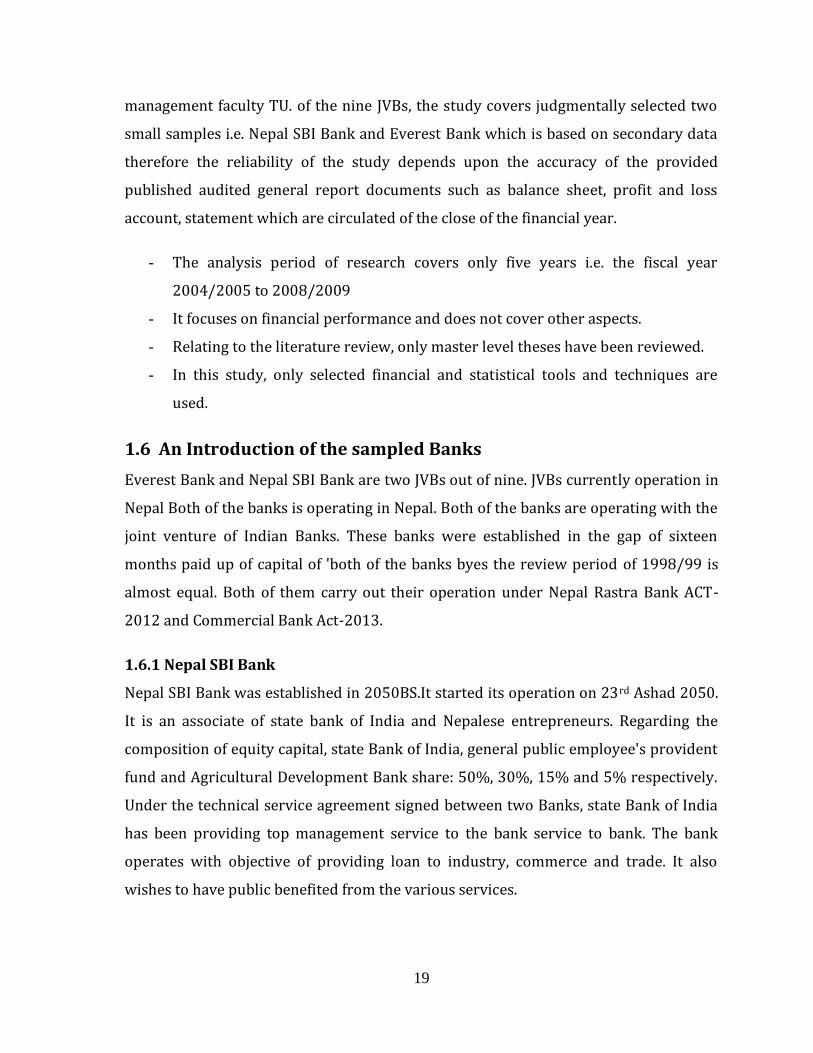
1.6 An Introduction of the sampled Banks
Everest Bank and Nepal SBI Bank are two JVBs out of nine. JVBs currently operation in
Nepal Both of the banks is operating in Nepal. Both of the banks are operating with the
joint venture of Indian Banks. These banks were established in the gap of sixteen
months paid up of capital of 'both of the banks byes the review period of 1998/99 is
almost equal. Both of them carry out their operation under Nepal Rastra Bank ACT-
2012 and Commercial Bank Act-2013.
1.6.1 Nepal SBI Bank
Nepal SBI Bank was established in 2050BS.It started its operation on 23rd Ashad 2050.
It is an associate of state bank of India and Nepalese entrepreneurs. Regarding the
composition of equity capital, state Bank of India, general public employee's provident
fund and Agricultural Development Bank share: 50%, 30%, 15% and 5% respectively.
Under the technical service agreement signed between two Banks, state Bank of India
has been providing top management service to the bank service to bank. The bank
operates with objective of providing loan to industry, commerce and trade. It also
wishes to have public benefited from the various services.

20
The bank has 12 branches in various parts of the kingdom. Its corporate office is
located in Hattisar, Kathmandu and main branch office in Durbarmarg, Kathmandu. It
has two other branches within the valley-new Road branch and Emboli of India
Extension counter. Eight branches outside the valley are in Birgunj, Biratnager,
Bairahawa, Rampur, Britamod, Sisuwa, Pokhara and Dharan.
The bank has utilized advanced computerized technique in its operation. The software
in the user is 'bancs-2000' developed by info sis technology, India. The branches within
the valley perform their routine works from Monday to Friday i.e. Five days a week.
Apart from the conventional facilities, other facilities made available by the bank are
listed below.
- It provides loan and advances by means of term loan as well as working capital.
- It provides its customers with letter of credit and guarantees.
- It provides remittance facility to various parts of the world.
- It is going to introduce 'Swift Transfer' System in near future.
- It provides merchant banking facilities like underwriting of public issues and
standing instructions.
Performance review of the bank depicts that the total deposits of the bank grew from
3744.50 million rupees in the fiscal year 2004/05 to 4380 million rupees in 2008/09,
recording a moderate growth of 16.97%. During the same period, total loans and
advance reached the level of 2963 million rupees from 2363 million rupees recording a
growth of 25.36% over the previous year. Accordingly total negative growth of 70.28%
the level of investment in government securities. Net profit, during the period declined
to 16.70million rupees from 58.90 million rupees showing the negative growth of
71.58%.
1.6.2 Everest Bank
Everest Bank was established in 2051BS. It started its operation on 1st Kartik 2051. In
the beginning, it had shared with United Bank of India Limited. But in 2053BS, United
Bank handed over its proportion of equity to Punjab National Bank Regarding the

21
composition of equity capital Nepalese promoters, General public and Punjab National
Bank share 50%,30% and 20% respectively, the technical service agreement signed
between two banks, Punjab National Bank has been providing top management service
and banking expertise to Everest Bank. Punjab National Bank has helped the bank
operates with the objective of providing full range of quality banking service to both
the business community and general people.
The bank has 25 branches in various parts of the country; its head office is located in
Baneswar, Kathmandu. Other branches located within Kathmandu valley are new
Road, Balaju, chabahil, Lamizpat, Stungal, Pulchowk, Gwarko teku Branch. Remaining
Branches outside the valley are in sunsari, Butwal, Birgunj, samara, Biratnagar,
mangalapur, Birtamod, Itahari, Janakpur, Simra, ICD Dry port, Dhangadhi, Bhairawa
etc.
The bank is using computerized baking technique. The software in the use is humor
Plus'. It is going to launch Anywhere Branch Banking System' through 'wide Area
Network, in near future. The branches within the valley provide their services from
Monday to Friday i.e. fifth days a week. However, the main branch in Baneshwar and
New Road Branch are providing service through additional counters on Sunday too.
Apart from the conventional services, attractive services made available by the bank
are listed below.
Apart from conventional deposit schemes, it has offered cumulative deposit scheme,
unfixed deposit scheme and recurring deposit plan.
- It provides credit on competitive terms by way of term loans as well as working
capital.
- It accepts foreign currency deposits at attractive rates and lends in competitive
rate.
- It provides its customers with letter of credit as well as guarantees.
- It has been providing remittance facility to various parts of the world by means
of swift transfer.

22
- It has been facilitation merchant banking facilities and standing instructions.
Performance review of Everest Bank shows that the total deposits of the bank reached
1949 million rupees in the fiscal year 2005/06 from 1125 million rupees in the
previous year indication an annual growth rate of 73.26%. During same period, total
loans and advances reached 1365 million rupees from 872 million rupees showing the
growth rate of 56.58%. According, total investment reached 283 million rupees from
218 million rupees showing the growth rate of 29.88%. Net profit during the period
reached 252 million rupees from 250 million rupees showing an annual growth of
0.78%.
1.7 Organizing the study
The study has broadly been dividing into five chapters:
Chapter1, Introduction- It deals about focus of the study, Statement of the problem,
objective of the study, research hypothesis, importance, limitations, introduction of
sampled banks and chapter schemes.
Chapter2, Review of Literature – This chapter is deals about concept of Bank,
concept of commercial bank, function of commercial bank, concept of joint venture
banks, role of joint venture bank, A profile of joint venture banks in Nepal, concept of
financial analysis, financial performance analysis of bank and relevant studies though.
Review of Relevant studies will include the objectives set by different researches in
similar field of study.
Chapter3, Research methodology- It includes with research design, Population and
sample, sources of data, data collection procedure, data processing and method of data
analysis used in the study.
Chapter4, Analysis and interpretation of data- This chapter analyzes the data and
interprets the result so obtained.
Chapter5, Summary- Conclusion and suggestions – It summarizes the result of
analysis and offers suggestive framework

23
CHAPTER-II
REVIEW OF LITERATURE
Review of literature is basic stocktaking of available literature in the field of research.
The textual constraints would help the researcher to support the area of research in
order to explore the relevant and true facts for the reporting purpose. While
conducting the research study, previous studies cannot be, ignore, as that information
would help to check the chances of duplication in the present study. Thus, one can find
what research study has been conduct and what remains to go with.
Therefore, this chapter is deals about concept of Bank, concept of commercial Bank,
function of commercial bank, concept of joint venture bank, role of joint venture bank.
A profile of joint venture banks in Nepal, concept of financial analysis performance
analysis of bank and review of school thought Review of school thought will include the
objective set by different researchers in the similar field of study.
2.1 Conceptual framework
2.1.1 Concept of Bank
A Bank is a financial institution, which plays significant role in the development of a
country. It facilitates the growth if trade and industry of national economy. However,
Bank is a resource for economic development, which maintains the self-confidence of
various segment of society and extends credit to the people.
"A bank is a business organization that receives and holds deposits of fund from other,
makes loans or extend credits and transfer funds by written orders of depositors".
(Encyclopedia, vol.3, 1981)
"The business of banking is one of collection funds from the community and extending
credit to people for useful purpose. Banks have played a pivotal role in making money
from lenders to borrowers. Banking is a profit seeking business, not a community

24
charity profit seeker it is expected to pay dividend and otherwise, add to the wealth of
shareholders (O' Edenuster, 1980).
In England, Goldsmiths were the bankers in an ancient period. They used to lend
money to the government and at the time of emergency to keep deposits for safety
purpose. The people used to keep their ornaments to goldsmiths because they had safe
box. In ancient time, the
Foreign exchange also used to be done by such goldsmiths, merchant and money
lender45s (Regmi, 1969 :16)
In Nepal, Banking transaction took place only after the establishment of Nepal Bank
Limited in 1994 B.S. being only bank at that time; it performed the activities of central
bank to some extent. The central bank was essential to establish but no activity was
done until 2007 AD. The country, then, realized to established under-Nepal Rastra
Bank Act2012. Before that, the credit need of people for commercial and other purpose
was mostly performed by the unorganized market of private moneylender. (Nepal
Rastra Bank, 1988 : 56)
In short, the term bank in the modern times refers to an institution having the
following features:-
1. It deals with money; it accepts deposits and advances loans.
2. It also deals with credit; it has the ability to credit; the ability to expand its
liability.
3. It is a commercial institution; it aims at earning profit.
4. It is a unique financial institution that creates demand deposits that serve as a
medium of exchange and as a result, the bank manages the payment system of
the country.
2.1.2 Concept of Commercial Bank
Commercial institutions are that financial institution, which deals in accepting deposits
of people and institution and giving loans against securities. They provide working
capital needs of trade industry and even to agricultural sector.

25
Moreover, commercial bank also provides technical and administrative assistance to
trade, industries and business enterprise.
"Commercial bank is corporation demand deposits, subject to check and makes short
term loans to business enterprises, regardless of the scope of its other service".
(Principle of Bank operation U.S.A.1972:345)
"A commercial banker is dealer in money such as cheques and bills of exchanges. He
also provides a variety of financial services". (The world Book, London, Vol14, 185,
:600)
Principally, commercial banks accept deposits and provide loans, primary to business
firms, thereby, facilitating the transfer of funds in the economy.
Commercial banks are the heart of the financial system. They hold the deposits of many
persons, government establishment, and business units. They make funds available
through their-lending and investing activities to borrowers, individuals, business firms
and government establishment units.
Therefore, commercial banks are those banks who pool together the savings of
community and arrange for their productive use .They supply the financial needs on
modern business by various means. Commercial banks are restricted to invest their
funds in corporate securities. Their business is confined to financing the short-term
needs of trade and industry, they cannot finance in fixed assets. A part from financing,
they also render service like collection of bill, and cheques, safekeeping of valuable,
financial advising, etc to their customers. (Shakespeare 1996:24)
The American institute of Banking has laid down the four major functions of
commercial bank such as receiving and handing of deposits, handing payments of its
clients making loans and investments and creating money by extension of credit.
(Principle of Bank operation 1972 U.S.A.)

26
Under Nepal commercial Bank 2031B.S.some roles and functions of commercial Bank
have been define and emphasized commercial Bank provide short term as well us long
term debt whenever necessary for trade and commerce. They except deposit form
public, and grants loans in different forms. They purchase and discount bills of
exchange, promissory notes, exchange foreign currency etc.
However, central bank is the main bank of the any nation that directs and controls all
the banks whose existence is in the country. In Nepal, Nepal Rasta Bank is the central
bank of the country. All the commercial bank performs their function under rules,
regulations and directives provided by Nepal Rastra Bank.
Nepal is poor least developed country having a low per capital income and GDP, As a
result, many economic problems such as inflation, devaluation of money trade, trade
deficit, budget deficit etc. arise. For4 the sake of removing these problems, many JVBs
are being incorporate in our country by sharing Nepali and foreign investment toward
making more profit by using the funds in profitable sector.
Meanwhile, under the free enterprise system like U.S.A., the interest of nation as well as
those of individuals and stockholders is supposed to be best served by vigorously
seeking profit. But the profit cannot be the sole objective of the any enterprise. It
should not be evaluated just on the ground of profit earned neither the bank nor the
community will be best served if the banker unreasonably sacrifices the safety of his
funds or the liquidity of his bank in an effort to increase income. (Principle of Bank
Operation, 1972:149)
2.1.3 Function of Commercial Bank
Commercial banks are the most important types of financial institution for the nation
in terms of aggregate assets. Traditional functions of commercial banks are only
concerned with accepting deposits and providing loans. However, modern commercial
banks work for overall development of trade commerce, services and agriculture also.
The business of banking is very broad in modem business age. The number and variety
of services provided by bank will probably expand. Recent innovation in banking

27
includes the introduction of credit cards, accounting services for business firms,
factoring leasing; participating in the Euro dollar market and lock-box is banking.
(Jersey, 1979). The main functions of commercials banks are as follows.
1) Accepting deposits:
According to Sir. Johan Padget.
"It is fair deduction that no persons or body, corporate or otherwise, can be banker
who does not
a. Take deposits A/C.
b. Issues and pay cheques
c. Collect cheques horn his customers.
Here, all functions are related with the acceptance of deposits; therefore, accepting
deposits by bank is the oldest function of bank. A bank accepts deposits in three forms
Viz current, saving and fixed A/C.
Saving deposit is one of the deposits collected from small depositors and low-income
depositors. The bank usually pays small interests to depositors against their deposits.
Current account is also known as demand deposits. Under this, any amount may be
deposits. There are no restriction regarding number and amount of withdrawals as
contrary to saving A/C. The bank does not pay any interest on such account but charge
small amount on the customers having current account.
A fixed deposit is one where a customer is requested to keep a fixed amount with the
bank for specific period, generally by those who do not need money for stipulated
period. The bank pays a higher rate on such deposits.
2) Advancing Loans:-
The second major-function of a commercial bank is to provide loans and advances form
the money which it receives by way of deposits for the development of industry, trade
and commerce, services and agriculture also. The main purpose of commercial bank is

28
to boost up the development pace of communities as well as that of economy as a
whole.
3) Agency Services:-
A bank also performs number of services on behalf of the customers. The following
bank under agency services:
- Dealing with (lie transaction of foreign exchange business.
- Serving as an agent of correspondent on behalf of the customer.
- Issuing letter of credit, circulate notes, bank notes, traveler's cheques etc.
- Purchase and sale of different kinds of securities, remittance of funds.
- Collection and payments of cheques, promising notes, coupons, dividend and
other type of bonds etc.
- Keeping valuable; articles in safe custody.
- Providing financial advising to various persons and bodies whenever required.
4) Creating money :-
The major function of commercial banks that separates it from other financial
institution is the ability to create and investing activities. The power of commercial
banking system to create money is a great economic significance as it results in the
elastic credit system that is necessary for economic progress at a relatively steady
growth rate.
2.1.4 Concepts of Joint Venture Banks
A joint venture is joining of forces between two or more enterprises for the purpose
carrying out a specific operation (industrial or commercial investment, production or
trade Gupta 1984: 15-25).
Joint venture bank are the mode of trading to achieve mutual exchange of goods and
services for sharing competitive advantage by performing joint investment schemes
between Nepalese investors, financial and no-financial institution as well as private
investors and their parents banks each supplying 50 percent of total investment. The
parent banks, which have experience in highly mechanized and efficient modern

29
banking services in many parts of the world, have come to Nepal with higher
technology, advanced management skills and international of banking institutions.
JBVs in Nepal are formed as full- fledged commercial bank under the company act 2021
B.S. and operated under Banijya Bank Act2031BS. The firms joint venture Bank Nepal
Arab Bank Limited was established in 1984, July12, before that, no bank were
established under the Joint venture principle when two or more independent firms
mutually decide upon to participate in a business venture to the total equity or more or
less capital and establish a new organization it will known as joint venture, JVBs are
established by joining different forces and with ability to achieve a common goal with
each of the partners. They are more efficient and effective monetary institution in
modern banking field than other old type of banks in Nepalese context.
Meanwhile, the Majesty's Government of Nepal has allowed VBs to operate in the
private sector, and has allowed finance company. Joint venture banks are already
playing on increasing dynamic and vital role in the economic development of country.
This will undoubtedly increase with the time to come .All Nepalese JVBs are
established and operated under the rules, regulation and lance of Nepal Rastra Bank.
HMO's deliberate policy of allowing foreign JVBs to operate in Nepal is basically
targeted to encourage local traditionally run commercially banks to enhance their
bankable capacity through competitive efficiency, modernization and mechanization
via computerization and prompt-customer service. (Shrestha2047-44-51). The main
objectives of JVBs are to grant banking facilities to the people by facilitating tele-
banking services to businessperson; Industrialists; and other professionals and to
grant loans and advances agriculture; commerce and industrial sector.
2.1.5 Role of JVBs in Nepal
Joint Venture banks pose a serious challenge to the existence of the efficient any very
traditional banks but the same challenge can be taken by the domestic banks as an
opportunity to modernize them and sharpen their competitive Zeal's. Murari R. Sharma

30
JVBs Nepal co-existing or crowding out Prashast Lalitpur, Nepalese journal public
Administration
It is undoubtedly true that JVBs are playing an increasing significant and dynamic role
in the economic development of the country. The main roles of JBVs can be explained
the following ways.
1) Introducing new methods and technology in banking services.
The JVBs have invited new era of banking in this remote Himalayan Kingdom by
introducing high technology and efficient methods in the banking business other area
of expertise are forward cover for foreign exchange transaction by importers and
exporters, merchant banking interbank market for money and securities, arranging
foreign currency loans. (Chopra, 204).
2) Creating a competitive environment:-
The JVBs have created a competitive environment in banking business in Nepal prior to
the arrival of JVBs, there was little competitive zeal between NBL and RBB as they had
almost set bunch of customers, working as services. This competitive environment will
benefit the common person, business and industry and the country as whole.
3) Providing now services:-
JVBs so far have not provided any phenomenon service that was not offered by
domestic bank, they have drawn a large number of customers who assume that they
will eventually benefit from their association with these banks when they introduce
new services. At present, a speedier than that of domestic bank is the hallmark of JVBs,
through their services is basically in traditional areas which could be highly educative
for domest6ic banks.
4) Providing more resources for investment:-
JVBs have played a significant role in channel zing the additional resources for
investment for the development of country. It is assumed that the JVBs have mobilized
net additional resources if they tap so far untapped resources in the local market.

31
5) Offering boiler links with International market:-
The JVBs are usually better placed to raise resources internationally for viable projects
in a developing country like Nepal. It is much easier for Nepalese business to provide
international linkage through the joint venture banks.
2.1 .6 A PROFILE OF JOINT VENTURE BANKS IN NEPAL
Brief profile of joint venture banks in Nepal
Bank Date of
Establish(BS)
Paid up capital as
on mid-July
1999AD(RS. in
million
Equity composition Head office
NABIL 2041-03-29 392.9 Dubai Bank Ltd-50%, General Public-30%,
NIDC-10%, Rastriya Beema Sansthan-
9.67%, Nepal Stock Exchange Ltd-0.33%
Kathmandu
NISBL 2042-11-16 135.6 Banquet Indoxuez-50%, General Public
20%, Rastriya Banijya Bank15%, Rastriya
Beema Sansthan 15%
Kathmandu
GNBL 2043-10-16 339.5 Australian & Newzeland banking group
(ANZ)-50%, Nepal Bank Limited-35%,
General Public-15%
Kathmandu
HBL 2049-10-05 192 Nepalese Promoters 51%, Habib Bank of
Pakistan-20%, General Public-15%, EPF-
14%
Kathmandu
NSBIBL 2050-03-23 119.90 State Bank of India-50%, General Public-
30%, EPF-15%, ADB/N-5%
Kathmandu
NBBL 2051-02-23 177.40 International Finance Investment &
Commercial Bank of Dhaka-50%, General
Public-30%, Nepalese Promoters-20%
Kathmandu
BOCL 2053-06-28 350 Ceylon Bank of Srilanka-45%, General
Public-30%, Nepalese Promoters-17%,
Nepal Insurance company Ltd.-8%
Kathmandu
BOKL 2051-11-28 90 Nepalese Promoters-50%, Siam
Commercial Bank, Thailand-30%, General
Public-20%
Kathmandu
2.1.7 Financial Analysis
Financial analysis involves the use of various financial statements the first is the
balance sheet, which represent a snapshot of the firm's financial position at a moment

32
in time and next is the income statement that depicts a summary of the firm's
profitability over time. (Van horn, Wachowicz, 1997).
Analysis and interpretation of financial statement is an attempt to determine the
financial performance of any organization so that a forecast may be made of the
prospects for future earning ability to pay interest, debts maturity and probability of a
sound dividend policy.
In the word of Myers, financial statement analysis is largely a study of relationship
among the various financial factors in a business as disclosed by a single set of
statement and a study of trends of these factors as shown in a series of statement.
(Myear, 1961)
It is the process of identifying the financial strength and weakness of the firm by
properly establishing relationships between the items of the balance sheet and the
profit and loss account.
It is a so the analytical and judgmental process that helps answer questions that been
posed. Therefore, it is means to end a part from the specific analytical answers, the
solutions to financial problems and issues depend significantly on the views of the
parties involved in the related issues and on the nature and reliability of the
information available (Helfert, 1992:2).
Besides, it can be taken as the starting point for making plans, before using any
sophisticated forecasting and planning procedures. Financial data can be use to
analyze a firm's past performance and assess its present financial strength.
Management of the firm would be particularly interested in knowing the financial
strengths make their best use and to spot out the financial weaknesses to take
corrective actions.
The analysis attempts to dissect the financial statements in to their components based
on the purpose on one hand and between individual components and total of these
items on the other. In course of studying and evaluation the financial position of the

33
organization, a study of trend of various important factors over the past several years
is also undertaken to have clear understanding of changing profitability and financial
conditional of the business organization (Shrivastav, 1993:56).
Financial statement analysis involves a comparison of a firm's performance with that
of other firms in the same line of business, which is often, identified by the firm's
industry classification (Western, Brighms, 1996:78).
With respect to the problems identified from the analysis, pertinent care should be
made to distinguish between the cause and symptom of problem (Hampton, 1998:99).
Through the application of analytical tools, profitability and financial health of a
concern is evaluated in a proper, critical and scientific manner (Jain1996:36).
The analysis of transaction determines the solvency of business and the measure of
efficiency of operations as compared to similar concerns. The analysis reveals now far
the dream and ambition of the top management have been convened into reality
during each financial year. The analysis, being a technique of x-raying the financial
position as well as progress of a concern, it enables managers and investors take
decision that will affect the company's future.
Financial Performance
It has already mentioned that this study relates to the analysis of financial performance
of EBL. Financial performance analysis focuses on financial statements and the
significant relationship that exists among the variables contained. In this regard
Metcalf and titard says, "Analyzing financial performance is a process of evaluating
financial statements to obtain a better understanding of a firm's position and
performance" (Metcalf and Tittard, 1976:56).
Profit is one of the basis indicators of sound financial performance. It is usually the
result of sound business management, cost control, credit risk management and
general efficiency of operation. Profit is essential for an enterprise for its survival,
growth and maintains capital adequacy profit retention.

34
Though profit is important for any business concern including joint venture banks but
profit cannot be the sole objective, for example neither the bank nor the community
will be best serve is the banker on reasonably sacrifice the safety of its fund or the
liquidity of the banking is an effort to increase income (American Institute of Banking,
:149).
Financial statements provide information about a firm's position as well as its
operation over same period. However, the real value of financial statement uses in the
fact that they can be use to predict the firm's financial position in the future, and to
determine expected earnings and dividends. From an investors stand points, predicting
the future is what financial statement analysis is all about, while managements stand
points financial statement is useful to anticipate future conditions and for planning
actions that will influence the future course of events (Weston and Brijham, 11th
edition :93)
Ratio analysis is used to compare a firm's financial performance and status to that of
other firms or to itself over time.
Financial ratios are the tools to analyze the financial conditions and performances. We
calculate ratio because in this way we get a comparison that may prove more useful
than the raw numbers by themselves (C, Van Horne, 9th edition: 96).
Ratio Analysis
Ratio analysis is a powerful tool of financial analysis. In financial analysis, a ratio is use
as an index or yardstick for evaluating the financial position and performance of a firm.
The absolute accounting figures reported in the financial statements do not provide a
meaningful understanding of the performance and the financial position of a firm. An
accounting figure conveys meaning when it is related to some other relevant
information (Pandey, 1992:10).

35
2.2 Review of related studies
Finance is a broad field and there are various books written in this subject. The book of
M.Y. Khan and P.K. Jain is considered a useful book in the financial management. The
modern approach of Khan and Jain views the term financial management in broad
sense and provides a conceptual and analytical framework for financial decision-
making. According to them," the finance function covers both acquisitions of funds as
well as their allocation; hence, apart from the issues of acquiring external funds, the
main concern of financial management is the efficient and wise allocation of funds to
various uses." The three major financial decisions according to khan and Jain are:
- The investment decision;
- The financing decision; and
- The dividend policy decision
Stresses on Risk- Return trade off as one of the major financial functions. They believe
that the maximization of the value of the firm can be achieved through maximizations
of returns in on hand and minimization of risk in the other. The relationship between
the expected future state of the economy and the performance of individual firms
enables a relation to be set forth between the state of the economy and the returns
from investment in firms (Weston and Brigham, 11th edition:29).
- Investment in assets new products;
- Determining the best mix of financing and dividends in relation to a company's
overall valuation.
According to him" Investment of funds in assets determines the size of the firm, its
profit from the operations, its business risk and its liquidity. Obtaining the best of mix
of financing and dividends determines the firm's financial charges and its financial risk;
it also affects its valuation. "He further incorporates other core financial are such as:
- Creation of value;
- Investment decision;
- Financing decision;

36
- Financial management
The objective of the company must be to create value for its shareholders. Market price
of company's stock represents its value and this can be maximizing by firm's optimum
investment, financing and dividend decisions.
The objective of the company must be to create value for its shareholder. Market price
of company's stock represents its value and this can be maximizing by firm's optimum
investment, financing and dividend decisions.
The capital investment decision is the capital to investment proposals whose benefits
are to be realized in the future. As the future benefits are not known with certainty,
investment proposals necessarily involve risk. Consequently, they should be evaluated
in relations to their expected return and risk.
In the financing decision, the financial manager is concerned with determining the best
financing mix or an optimum' capital structure.'
If a company can change its total valuation by varying its capital structure, an optimal
financing would exist, in which market price per share could be maximized.
Another important decision of the firm, according to Van Horne is its Dividend policy.
The dividend decision includes the percentage of earning paid to stockholders in cash
dividends. The dividend payout the ratio determines the amount of earning retained in
the firm and must be evaluated in the light of the objective of maximizing shareholder's
wealth.
The financial management involves the solution of the three major decisions. Together,
they determine the value of a company to its shareholders. Van Horne believes that the
objective of any firm is to maximize its value and therefore, the firm should strive for
optimal combinations of the three inter-related decision, solved jointly. The main thing
is that the financial managers relate each decision to its effect on the valuations of the
firm.

37
I. M. Pandey further identifies two kinds of finance functions:
a. Routine
b. Managerial finance functions.
The routine finance function do not require a great managerial ability to carry them
out and they are chiefly in nature. Managerial finance functions on the other hand are
so called because they require skillful planning, control and execution of financial
activities. There are, according to I.M. Pandey four important managerial finance
functions: (Pandey, Vikash publishing house, 1989: 39).
- Investment or long-term asset mix decision.
- Financing or capital –mix decision
- Dividend or profit allocation decision
- Liquidity or short- term asset- mix decision
A summary of what I have reviewed in various books of finance have been highlighted
below.
Finance is defined as the acquisition and investment of fund for enchanting the value
and wealth of an organization. The various finance areas include investment, public
finance, corporate finance and financial institutions. The basic function of finance is to
manage the firm's balance sheet in most efficient way. The balance sheet reflects how a
firm acquired financing through debt and equity resources, and it reflects the
disposition of acquired financing among the various asset accounts. The major financial
functions required for managing the bank’s balance sheet are summarizing below.
a. Analysis and planning
b. Financial structure management
c. Asset management
The first function financial analysis and planning is to understand the bank's current
financial condition and plan for its future financial requirement in different economic
scenarios.

38
After analyzing the financial needs, the second function is to manage the financial
structure of the bank, which can be done by optimizing the use of debt and equity in
the capital structure. While deciding about this optimum structure, a financial manager
must concentrate in minimization of cost of funds if one hand, and maximization of
value of the firm in the other. Moreover financial structure management for a banking
sector includes, a typical treasury function, which is also called 'funds management'.
This function contributes a significant portion in earned by banks.
The final function is the management of asset structure of the bank. Advance of credit
and investment in certain portfolios constitute the major portion of the bank's asset.
The major financial function related to assets management is to decide for the least
risky and most profitable alternatives of investments. This can be conducted by
determining returns and risks associated with the loans and advances made by bank.
All the above financial decision or functions as mentioned by different writers are
instrumental towards effective handling of financial management, which includes
activities beginning form raising of funds to efficient and effectives use of funds; no
matter either it is a banking or non-banking institution.
After reviewing the books, certain useful journals on domestic market, banking,
financial statement analysis and monetary credit situation of Nepal are studied.
An article written by Radha Krishna Paudel on banking challenges ahead 22 focuses in
the potential areas where banks should invest to fight the prevailing economic
recession. Currently growth in the profitability of JVBs has been mainly due to external
factors such of the foreign exchange rate but not to the growth in the real sector of the
economy. Therefore, to sustain enter new areas by marketing their credit in important
sub sectors such as hydro electricity, tourism, irrigation etc.
Mr. Poudel further writers that,-" Saving collection is another factor which is necessary
for banks to balance their operations and generate sufficient surplus in their cash-
flows. In recent years, growth rate of bank deposits has declined to about 16 percent

39
compared against 23 percent of the past. Mobilization of internal resources in the
country demands that banks attract more financial resources form the public."
According to Mr. Poudel, Balance sheet, profit and loss a/c and the accompanying notes
are the most useful aspects of the bank. We need to understand the major
characteristics of bank's balance sheet and profit and loss a/c. The bank’s balance
sheet is composed of financial claims as liabilities in the form of deposits and as assets
in the form of loans. Fixed assets accounts form a small portion of the total assets.
Financial innovations, which are generally contingent in nature, are considered as off-
balance sheet items (Poudel, 2053:27).
Interest received on loans, advances, and investment and paid on deposit liabilities are
the major components of profit and loss account. The other sources of income are fee,
commission, discount and service charges.
The users of the financial statement of a bank need relevant, reliable and comparable
information which assists them in evaluating the financial position and performance of
the banks and which us useful to then making economic decision. The disclosure
requirement of bank's financial statement has been expressly laid down in the
concerned act. Commercial banking act 1974 requires the audited balance sheet and
profit and loss account to be published in the leading newspaper for the information of
general public.
According to Poudel, the principal objectives of analyzing financial statements are to
identify:
-Financial adaptability (Liquidity)
- Financial performance (Profitability) and
- Financial Position of Banks (Solvency)
Most of the users of the financial statements are interested in assessing the bank's
overall performance i.e. Profitability, which is affected by the following factors:
a. The structure of balance sheet and profit and loss account.

40
b. Operating efficient and internal management system.
c. Managerial decision taken by top management regarding interest rate,
exchange rate, lending policies etc.
d. Environmental changes(technology, government, competition, economy)
According to Mr. Poudel, the other factors, to be considered analyzing the financial
statements of banks is to assess the capital adequacy ratio and liquidity position. In the
line of the norms set by bank for international settlement (BIS), capital adequacy of a
bank is assessed based on risk-weighted assets. It indicates a bank's financial strength
and solvency. Presently the capital funds of a bank should not be less than 8% (at least
4% should be in the form of tier-1capital or core capital) of its risk weighted assets as
capital funds. Banks facing with capital adequacy problem may increase capital, reduce
assets, or reallocate the existing assets structure in order to maintain the desired level
of capital base.
Liquidity is measured by the speed with which banks assets can be converted into cash
to meet deposit withdrawals and other current obligations. It is also important in view
of survival and growth of a bank.
He has laid down an approach to evaluate the bank's overall performance through
balancing between the risk and return components of the bank.
Dr. Shrestha in his work commercial Bank's comparative performance evaluation 24
stresses on a proper risk management. He believes in the appropriate classification of
loans under the performing and non-performing category. In the context he writes,
"Adequate provisioning is the surest way to get relief from sinking loan after careful
consideration of portfolio risk. A clear out criteria is necessary to treat interest
suspense account and it is advisable that all interest unpaid for more than six month
need to be treated and unearned income".

41
Regarding the risk management of the bank Dr. Shrestha's other suggestions include;
Any customer having overdue loan of two years or more in his account should not be
given other loan facilities.
Strong provisioning or reservations are required in restructuring portfolio relating to
overdub loans.
All credits including overdrafts should be given a maturity date and should be
subjected to revision at that date and consequently categorize as good, substandard or
doubtful loans.
Financial credit worthiness of the borrower must be evaluated properly before
granting the loans.
The above journals focus in the various aspects of the bank's economic environment.
NRB press communiqué shows the current domestic market scenario article by Radha
Krishna Poudel concentrates work stresses in effective's way of evaluating the financial
performance and Dr. Shrestha suggestions are focuses towards proper risk
management. Whatever, aspects of the bank the above journals target, they all have to
be combinable assessed and kept in strict consideration for effective and efficient
financial performance of the banks in the Nepalese economy (Shrestha, 2047:38).
2.4 Review of Previous Thesis
Various thesis works have been done in different aspects of commercial banks such as
lending policy, investment policy, financial performance analysis, resource
mobilization and capital structure. The review of some previous study, which is
relating to the Nepalese banking sector, is the most relevant sources and assistants for
this research.
Tuladhar (2000) conducted a study on “A study on investment policy of Nepal
Grindlays Bank Limited in comparison to other Joint venture Banks of Nepal” with the
objective of:

42
1. To study the fund mobilization and investment policy with respect to fee based
off – balance sheet transaction and fund based on balance sheet transactions.
2. To study the liquidity, efficiency of assets management and profitability
position.
3. To evaluate the growth ratios of loan and advances and total investment with
respective growth rate of total deposit and net profit.
4. To perform an empirical study of the customer’s views and ideas regarding the
existing services and adopted invested policy of the Joint venture banks.
The study is mainly based on secondary data and in some aspects of the study primary
data are also collected through questionnaire survey of 100 respondents.
The research findings of the study are as follows:
- From the analysis of primary data concerning in which sector should JVBs
invest; 28.37% respondents emphasized on educational sector to be invested by
these JVBs as the potential investment sector.
- Consequently poverty stricken and deprived sector was given second priority
(26.24), whereas industrial sector (18.44), tourism sector (16%), agricultural
sector (16%) , and construction sector (4.25) are given third, fourth, fifth and
sixth priority respectively.
From the analysis of secondary data, following conclusions were drawn:
Nepal Grindlays Bank Ltd. Has maintained consistent and successful liquidity than
NABIL Bank Ltd. and Himalayan Bank Ltd. The mean of total investment to total
deposits ratio of Nepal Grindlays Bank Ltd. Is higher than the other JVBs. The mean of
the loan and advances to total deposits ratio of Nepal Grindlays Bank Ltd. is less and
inconsistent than NABIL Bank Ltd. and Himalayan Bank Ltd.
Loan and advances to working fund ratio of Nepal Grindlays Bank Ltd. Was found less
than the mean ratio of other banks. Investment on government securities to working
fund ratio of Nepal Grindlays Bank Ltd. had the highest mean ratio than NABIL Bank

43
Ltd. and Himalayan Ltd. during the study period. It was found that total Off-balance
sheet operation to loan and advances ratio of Nepal Grindlays Bank Ltd. is found to be
of highest mean ratio than that of NABIL Bank Ltd., and Himalayan Bank Ltd. it means
Nepal Grindlays Bank Ltd. used to perform highest off-balance sheet operation than the
other two JVBs i.e., used to give priority to provide letter of credit, guarantee and
others (e.g. trade finance) excessively than to others. The mean of investment on
shares and debentures to total working fund ratio of Nepal Grindlays Bank Ltd. was
found less than NABIL Bank Ltd. but higher than Himalayan Bank Ltd.
The profitability position of Nepal Grindlays Bank Ltd. is higher than NABIL Bank Ltd.
and Himalayan Bank Ltd. as well as it use to provide interest to the customers for
different activities consistently. The volume of growth ratio of loan and advances of
Nepal Grindlays Bank Ltd. is found higher than that of NABIL Bank Ltd. but lower than
Himalayan Bank Ltd. It indicates that all the JVBs used to provide loan and advances in
increasing manner. From the analysis of growth ratio of total investment it is found
that Nepal Grindlays Bank Ltd. and NABIL Bank Ltd. have negative growth ratio i.e.,
they Used to reduce the investment during the study period. But it is increasing in the
case of Himalayan Bank Ltd.
The growth ratio of net profit of Nepal Grindlays Bank Ltd. seemed to be more
Satisfactory than NABIL Bank Ltd. but in case of Himalayan Bank it seemed to be very
high.
Regmi’s (2001), thesis "A comparative study of the financial performance of HBL and
NBBL" 30, he suggested NBBL to increase its current assets because the bank is not
maintaining adequate liquidity position in comparison with HBL. As capital structures
of both the bank are highly levered both the banks are recommended to maintain and
improve mix at debt and owner's equity by increasing equity share. He further
suggests to HBL to improve the efficiency in utilizing the deposits in loan and advance
for generating the profit NBBL should try to maintain present position on this regards.
Profitability position of HBL is comparatively better than the same of NBBL. So, NBBL
is recommended to utilize its resources more efficiently for generating more profit

44
margins. If resources held idle, bank faces high cost and causes the low profit margin.
An ideal dividend payout ratio is based upon shareholders expectations and the
growth requirement of the banks. NBBL is suggested to increase its dividend payout
ratio. (Regmi, 2001:29)
The two banks should extend their resources to rural areas and promote the
development of poor and disadvantaged group. In order to do so banks should open
their branches in the remote areas with objectives of providing cheaper banking
services especially HBL should initiated in this regard because it has few branches in
comparison to NBBL.
Because of the start competition between banking, sectors both the banks are suggest
to formulate and implement some sound and effective financial and non-financial
strategies to minimize operational expenses to meet required level of profitability. The
banks are further suggested to adopt modern banking technologies to enhance their
better and wide market.
Kapadi: (2002) has conduct research on "A Comparative Study on Performance of
NABIL Bank Ltd and Standard Chartered Bank Limited." The study of this thesis is the
descriptive analytical method. The core objective of this thesis is to analyze the
financial performance of NABIL bank and SCBNL this includes the examining of
liquidity capital structure and activity and profitability ratios of the ratio joint venture
sample banks.
The specific objectives of his research are:
1. To examine the trend of deposits and loan and advances of NABIL bank and
SCBNL.
2. To study the liquidity profitability capital structure activity and capital
adequacy position of NABIL bank and SCBNL.
3. To suggest and recommended some measures by evaluating and finding
financial performance of NABIL bank SCBNL on the basis of finding.

45
From the detail analysis the research finds the following findings of the study.
- He found that most of the capital structure ratios show that the capital structure
of both the banks is highly leveraged.
- Total debt to equity ratio of both the banks reveals that the claims of the
outsider exceeds mere than that of the owner’s over the bank asset. However
NABIL bank seems to be more leveraged than SCBNL.
- Total debt to total assets ratio of both the banks has always been over 88, which
indicates the excessively geared capital structure. Comparatively NABIL bank
has used a little more debt financial than SCBNL. Long-term debt to total assets
ratio of NABIL bank is seems to be greater as per mean, which shows more use
of long-term debt by NABIL bank than by SCBNL.
- Long-term debt to net worth ratio of both the banks is following the fluctuating
trend. The mean proportion of outsiders fund and owners fund employed in the
total capitalization of NABIL bank is higher than that of SCBNL. This implies that
it is following an aggressive strategy of higher risk higher return policy.
- The fixed asset to net worth ratio of NABIL bank is higher than that of SCBNL as
per mean ratio. But the investment of owners‟ equity in fixed assets for both the
banks are minimum as is commonly seen in various financial institutions.
Manandhar, (2005) in his thesis "Financial performance analysis of Nepal Bangladesh
bank ltd" In this study, various financial research and statistical tools have been used to
achieve the objective of the study. The analysis of data will be done according to the
pattern of data available. Likewise, some financial tools such as ratio analysis and trend
analysis have also been used for financial analysis.
The specific objectives of his research are:
1. To analyze the functions, objectives procedure and activities of the NB bank
2. To analyze the lending practices and resources utilizations of NB bank.
3. To determine the impact of growth in deposit on liquidity and lending practices.

46
4. To examine the lending efficiency and its contribution to profit.
5. To make suitable suggestions based on the findings of this study. The financial
and statistical tools are used.
The researcher found that NB bank has sufficient liquidity. It shows that bank has not
got investment sectors to utilize their liquid money. Now, in Nepal many banks and
other financial institution are functioning to collect deposits and invest money
somewhere in the investable sectors. Therefore, miniaturization has been increased
since liberalization policy taken by the government. Heavy remittance has also helps to
increase the amount of deposits in bank. On the other hand, due to political crisis,
economic sectors have been fully damaged.
The research findings of the study are summarized as:
- NB bank has utilized most funds in the form of credit and advances. More than
75% of total deposits of the bank have been forwarded to customers as a credit
and advances.
- The major part of utilizing deposits and income generating sectors. If the bank
has high deposits, bank can provide money to its customers as credit and
advances.
- Therefore, there is highly positive correlation between total deposits and credit
and advances of NB bank
- Bank is providing different schemes to attract good customers. After attracting
deposits from the customers, bank has issued the deposits to the needy area to
make profit for the bank.
Gautam: (2006) has conduct research on "A Comparative study on financial
performance of Standard Chartered Bank Limited and Nepal Bangledesh bank Limited"
Financial performance is analyzed with two important tools. The first most important
tools are the financial tools, which includes ratio analysis and other is a statistical tools,
which is bankruptcy score.

47
The objectives of his research are:
1. To study the existing capital structure of financial position of selected joint
venture commercial banks and to analyze its impact on the profitability.
2. To access the debt servicing of the joint venture commercial bank.
3. To examine the correlation and the signification of their relationship between
different ratios related to capital structure.
4. To provide suggestions and recommendations for the optimal capital structure
of the joint venture commercial bank.
5. To obtained the objectives, some financial, statistical and accounting tools.
He has found his study were the joint venture banks are operating in Nepal as
commercial merchant banks. The growth is still going on as so many new banks are
coming into existence after this study. Therefore, JVB‟s are operating with higher
technology and new efficient methods in banking sector. However, this study has been
undertaking only three JVB‟s viz. SCBNL and NBBL to examine and evaluation the
financial data.
The research findings of the study are as follows:
- The research sample JVB’s have used high percentage of total debt in raising the
assets. The higher ratio constitutes that the outsider’s claim in total assets of the
bank is owners claim.
- The on an average, NBBL bank constitutes 16.27 times of P/E ratio, which
should be reduce as quickly as possible.
- The financial risk of the banks NBBL average degree of finance leverage
constitutes 3.73 times which indicates the higher degree of financial risks 3.73
times which indicates the higher degree of financial risks.
- The average ROE of JVB‟s i.e. SCBL and NBBL area 37.36% and 21.75%
respectively.

48
- In Nepal many banks and other financial institution are functioning to collect
deposits and invest money somewhere in the investable sectors. Therefore,
efficiency has been increased since liberalization policy taken by the
government. Heavy remittance has also helps to increase the amount of
deposits in bank.
The review of the above mention bunch of research writes have definitely enriched my
vision to elaborate analysis to come to the meaningful conclusion in realistic term and
thereby come with some conclusion, few key suggestions that help in improvement of
commercial banks.
Previous researches on the basis of financial performance of commercial banks in
Nepal. But this research is about joint venture bank of Nepal with sample of Nepal SBI
Bank Limited and Everest Bank Limited. This research is about the financial
performance of selected two banks. In the previous research, there is no clear-cut
financial performance of joint venture banks. The research can help the people who
wanted to know about the overall financial performance of joint venture bank in Nepal.
There are two-selected bank to find out the comparative financial position of selected
bank. Therefore, this topic may not new but the researches efforts may be appreciable.

49
CHAPTER-III
RESEARCH METHODLOGY
The rationale behind the study is to evaluate and assess the financial position or
performance of the two newly operated joint venture banks visz. Nepal SBI Bank
Limited and Everest Bank Limited. Thus, this chapter includes those methods and
techniques used for finding out a fore said purpose.
Research methodology refers to the various sequential steps (a long with the rationale
of each step) to he adopted by a researcher in studying a problem with certain
objective in view. It is a way to systematic solve the research problem it may be
understood as a science of studying how search is done scientifically. Includes the
various steps that are generally adopted by a researcher studying his/ her research
problem along with the logic behind them, it would be appropriate to mention here
that research project are not meaningful to any one unless they are in sequential order
which will be determined by the particular problem at hand therefore, this study aims
at analyzing and interpreting the purpose of comparative financial performance or
appraisal of two JVBs. This chapter focuses and deals with the following aspects or
methodology.
- Research design
- Population and Sample
- Source of data
- Data collection procedure
- Method of Date analysis
3.1 Research Design
Research design is the task of defining the research problem. In other words, "A
research design is the arrangement of conditions, for collection and analysis of data in
a manner that aims to combine relevance to the research purpose with economy in

50
procedure. In fact, the research design is the conceptual structure within which the
research is conduct.
General objective; of this research study is to examine and evaluate the financial
performance of joint venture banks especially that of NSBIBL and EBL in order to
achieve the objective, both descriptive and analytical research design has been
followed. The study focuses on the examination of relationship between those
variables that influence- financial decisions of the sampled batiks hence; it is an ex-post
factor research.
3.2 Population and Sample
The population for this study comprises nine joint venture banks currently rating in
the country. All the joint venture banks perform the functions of commercial banks
under rules, regulations and directives of Nepal Rastra Bank. The sample consists of
two judgmentally selected banks- Nepal SBI Bank and Everest Bank. These units
represent 22.22% of the total population and are comparable to each other in various
aspects.
3.3 Sources of Data
Although present study is on secondary data. However, necessary suggestion are also
taken form various experts both inside the bank whenever required the necessary data
is obtained form the head office of the JVBs such as, published balance sheet, profit and
loss account and other related statement of accounts as well as the annual reports of
the respectively banks. Likewise, other related arid necessary information are also
obtained from the publication of security exchange centre, Nepal Rasta Bank and other
publications used for the purpose are book & booklets magazine journals, newspaper
school of thought etc.
3.3.1 Data Collection Procedure
The problem of the study lies on the issues related to the comparative strengths and
weaknesses of the banks. Because of liberal policy adopted by the government,
financial institution has been emerging in the country. The sampled banks have been

51
facing threats from such institutions. Therefore, the study has been ducted to examine
and evaluate the financial performance of the sampled units. This study is also
intended to fine the weaknesses and strengths so that appropriate suggestion can be
provided to enhance the performance of the banks in coming days.
For the purpose, various data are required. With the view of obtaining the data,
researcher made several visits of the sampled banks, in first visit, the researcher
consulted the concerned authority of the bank and explained about the above stated
problems and objectives of the study. He also explained why he is interested in these
two banks and what he wishes to analysis after keeping forth the view of researcher.
The authorities got convinced and appraised the effort. They assured that they would
have far as possible. Regarding the information needed, they said that they would
make them available up to the extended that does not affect the privacy and secrecy of
the bank. Researcher got pleased with the response shown by them arid started the
work.
In next visit, he approached share department and asked for the profit and loss account
and balance sheet of the bank of last five years. In the department after explaining the
need of such information the related staff the provided the necessary statement.
To acquire the primary data, researcher made some other visit in the bank due to the
increasing transactions and business of the employees in the bank; they could not
afford time to the researcher whenever he needed. After same efforts, they could
manage some time and hence, the researcher got the information through direct
interview with them.
In late visit, the researcher met the accounting expert in the bank for the clarification of
the component items of the statements so as avoid the ambiguity and confusion.
Similarly, researcher obtained economic surveys, annual and periodic reports and
banking directive from Nepal Rastra Bank, Baluwatar. There, he visited library and
banking operation department. In the department, he explained why he needed such
reports and hence, he became able to get those reports.

52
For the reference materials, the researcher visited Nepal Commerce Campus, Shanker
dev Campus and Central Department of Management, T.U. Many visits in management
department and various sections of central library, TU led the researcher lobe
successful in conducting this study.
3.4 Data Processing
Data obtained from the, various sources cannot be directly used in their original form
further they need to be verified and simplified for the purpose of analysis. Data
information, figure and facts so obtained need to be checke, rechecked edited and
tabulated for computation.
According to the nature of data, they have been inserted in meaningful tables, which
have been shown in Tables. Homogenous data have been sorted in one table and
similarly various tables have been prepared in understandable manner odd data
excluded form the table. Using financial and statistical tools data have been analyzed
and interpreted.
3.5 Method of Data analysis
Financial statement can provide information useful for the parties directly or indirectly
involved in the business. For the purpose of study, the data collected and obtained are
scanner and tabulated under various heads. The researcher has used two sorts of tools
has been used to achieve the results. Here is the brief discussion of both the tools,
which are used to analyze and interpret the financial performance of two JVBs i.e.
Nepal SBI Bank LTD. and Everest Bank LTD.
- Financial tools
- Statistical tools
3.5.1 Financial tools
Financial tools are those, which are used for the analysis and interpretation of financial
data. These tools can be used to get the precise knowledge of a business, winch in turn,
are fruitful in exploring the strengths and weaknesses of the financial policies and

53
strategies. For the sake of analysis following various financial tools have been used in
order to meet the purpose of the study.
3.5.1.1Ratio analysis
Ratio analysis helps to summarize the large quantities of financial data and to make
quantitative judgments about the firm's financial performance. Ratio is the expression
of one figure in terms of another. It is the expression of relationship between the
mutually independent figures, in financial analysis; ratio is use to as an index of
yardstick for evaluating the financial position and performance of firm. Ratio analysis
is very much powerful & widely used tool of financial analysis. It is define as the
systematic use of ratio to interpret the financial statements so that the strength and
weakness of a firm as well as its historical performance and current financial condition
can be determined. It helps the analysis to make qualitative judgment in about the
financial position and performance of the firm. Therefore, it is helps to establish
relationship among various ratios and interpret there on specially, based on
comparison between two or more firms or inters firm comparison and comparison
between present and past ratios for the same firm give enormous and fruitful results to
examine the financial performance.
The obsolete accounting figure reported in the financial statement does not provide a
meaningful understanding of the performance and financial position of the firm. An
accounting figure conveys meaning when it is related to some other relevant
information. Therefore, the ratio is the relationship between two accounting figures
expressed mathematically. It helps to summarize large quantitative relationship helps
to form a quality judgment. However, " A single ratio itself does not is indicate
favorable or unfavorable conditions. It should be compared with some standard.
A ratio is simply a number expressed in terms of another number and it expresses the
quantitative relation between any two variables.
Ratio can be calculated between any two items of financial statements. It means there
may be as many ratios as there are the numbers of items. However, under the ratio

54
analysis technique, it is not practical to work out all the ratios. Hence, only the required
ratios have been worked out.
There are numerous ratios to analyze and interpret the financial form once of the
enterprise or firm. However, for our purpose, only important and relevant ratios are
used to check the financial health of two JVBs in Nepal, which are as below;
3.5.1. 1.1 Liquidity Ratios:
Liquidity ratios are used to judge the firm's ability to moot short-term obligation.
These ratios give insights into the present cash solvency of the firms and its ability to
remain solvent in the event of adversities. It is the comparison between short-term
obligation and the short –term resources available to meet these obligations. These
ratios are calculated to find the ability of banks to meet their short-term obligation,
which are likely to mature in the short period. The following ratios are developed and
used for our purpose to find the liquidity positions of the two joint venture banks.
a) Current Ratio:
This ratio indicated the current short-term solvency position of a current ratio is the
relationship between current assets and current liabilities. It is calculated by dividing
the current liabilities by current assets, which is expressed as follows:
𝐶𝑢𝑟𝑟𝑒𝑛𝑡 𝑅𝑎𝑡𝑖𝑜 =𝐶𝑢𝑟𝑟𝑒𝑛𝑡 𝐴𝑠𝑠𝑒𝑡𝑠
𝐶𝑢𝑟𝑟𝑒𝑛𝑡 𝐿𝑖𝑎𝑏𝑙𝑖𝑡𝑖𝑒𝑠
Current assets refer in those assets, which are convertible in cash within a year or so.
They includes, cash and Bank Balance, investment in treasury bills, money at short call,
or placement, loans and advances, bills purchased and discounted, overdrafts. Other
short-term loans, foreign currency loans, bills for collection, customer's acceptance
liabilities, pre-payment expenses, and other receivable. Similarly, current- liabilities
refer to those obligations maturing within a year. It includes, current account deposits,
saving account deposits, margin deposits, call deposits, intra-bank reconciliation A/c,
bills payable, bank over-draft, provisions, accrued expenses, bill for collection, and
customer's acceptance liabilities etc.

55
A higher ratio indicates better liquidity position. However, "A very high ratio of current
assets to current liabilities may be indicative of slack management practice, as it might
signals excessive inventories for the current requirement and poor credit management
in terms of over-expanded account receivable.
Current ratio is a measure of firm's solvency. It indicates the availability of the current
assets in rupees for every one rupee of current liability. As a conventional rule, a
current ratio of 2 to 1 in considered satisfactory. However, these rules should not be
blindly followed, as it is the test of quantity not quality. In spite of its shortcoming, it is
a crude-and quick measure of the firm's liquidity.
b) Cash and bank balance to current & saving deposit ratio.
The ratio shows the ability of banks immediate funds to cover their (current Margin,
call and saving) deposit. Higher the ratio shows higher liquidity position and ability to
cover the deposits and vice versa. The ratio is compute by dividing and bank balance
by current and saving deposits. Cash and bank balance to current and saving deposits
ratio.
Cash & 𝐵𝑎𝑛𝑘 𝐵𝑎𝑙𝑎𝑛𝑐𝑒
Current & 𝑆𝑎𝑣𝑖𝑛𝑔 𝐷𝑒𝑝𝑜𝑠𝑖𝑡
Cash and bank balance comprises cash in hand, foreign cash in hand, cheques and
other cash items, balance with domestic bank and balance held in foreign banks
current and saving deposit consists of all types of deposits excluding fixed deposits.
The ratio measures the ability of banks to meet its immediate up to total deposit
legations. The bank should maintain adequate cash and bank balance to meet the
unexpected as well as heavy withdrawal of deposits. High ratio indicates sound
liquidity position of the bank; however, too high ratio is not enough as it reveals the
under utilization of fund.
c) Cash and Bank balance to total deposit ratio
The ratio is calculated using following formula,

56
Cash & Bank Balance to Total Deposit Ratio=Cash & 𝐵𝑎𝑛𝑘 𝐵𝑎𝑙𝑎𝑛𝑐𝑒
Total Deposit
Total deposit consists of current deposit, saving deposit, fixed deposit, money at call
and short notice and other deposits.
The ratio shows the proportion of total deposits held as most liquid assets. High ratio
shows the strong liquidity position of the bank. Too high ratio is not favorable for the
bank because it produces adverse effect on profitability due to idleness of high-interest
bearing fund.
d) NRB balance to current and saving deposit ratio
The ratio is computed by dividing the balance held with Nepal Rastra Bank by saving
deposits,
NRB Balance to Current Saving Deposit Ratio=NRB Balance
Current & 𝑆𝑎𝑣𝑖𝑛𝑔 𝐷𝑒𝑝𝑜𝑠𝑖𝑡
Commercial banks are required to hold certain portion of current and saving deposits
in Nepal Rastra Bank's account. It is to ensure the smooth functioning and sound
liquidity position of the bank. As per the directive of Nepal Rastra Bank, the required
ratio is 8% therefore the ratio measures whether the bank is following the direction of
NRB or not.
e) NRB balance to fixed deposits ratio
The ratio is computed by dividing the balance held with Nepal Rastra Bank by fixed
deposits accepted.
NRB Balance NRB Balance to Fixed Deposit Ratio =NRB Balance
Fixed Deposit
It shows the percentage of amount deposited by the bank in Nepal Rastra Bank as
compared to the fixed deposits. According to the direction of NRB, this ratio should be
maintained 6%. Hence, the ratio so calculated finds whether the bank has obeyed the
direction of central bank or not.

57
f) Fixed deposit to total deposit ratio
It is calculated as follow:
=Fixed Deposit
Total Deposit
The ratio shows what percentage of total deposit has been collected in form of fixed
deposit. High ratio indicates better opportunity available to the bank to invest in
sufficient profit generating long-term loans. Low ratio means bank should invest the
fund of low cost in short-term loans.
3.5.1.1.2 Leverage Ratio
Leverage or capital structure ratios are used to judge the long-term financial position
of the firm. It evaluates the financial risk of long-term creditors greater the proportion
of the owner's capital structure, lesser will be the financial risk borne by supplier of
credit funds.
Debt is more risky from the firm's point of view. The firm has legal obligation to pay
interest to deft holders irrespective of the profit made or losses incurred by the firm.
However, use of debt is advantageous to shareholders in two ways:
They can retain control on the firm with a limited stake
Their earning in magnified when rate of return of the firm on total capital is
higher than the cost of debt.
However, the earning of shareholders reduces if the cost of debt becomes more than
the overall rate of return. In case, there is the threat of insolvency. Thus, the debt has
two folded impact-increases shareholder earning-increase risk. Therefore, a firm
should maintain optimal mix of investors and outsiders fund for the benefit owners
and its stability.
Under this group, following ratios are calculated to test the optimality capital
structure;

58
Debt-Equity ratio
Debt-Asset ratio
Debt to total capital ratio
Interest coverage ratio
a) Debt –Equity ratio
The ratio is calculated by dividing total debt by shareholder's equity.
We calculate
=Total Debt
Shareholder′s Equity
Total debt consists of all interest bearing long-term and short-term debts. These
include loans and advances taken from other financial institutions, deposits, carrying
interest etc. Shareholder's equity includes paid-up capital, reserves and surplus and
undistributed profit.
The ratio shows the mix of debt and equity in capital. It measures creditors' claims
against owners. A high ratio shows that the creditors' claims are greater than those of
owners are. Such a situation introduces inflexibility in the firms operation due to the
increasing interference and pressures from creditors' low ratio imply a greater claim of
owners than creditors. In such a situation, shareholders are less benefited if economic
activities are good enough. Therefore, the ratio should be neither too high nor too low.
b) Debt-Asset ratio
The ratio can be calculated by dividing total debt by total assets
=Total Debt
Total Assets
The ratio shows the contribution of creditors in financing the assets of the bank. High
ratio indicates that the greater portion of the bank's assets has been financed through
outsider's fund. The ratio should be too high per too low.

59
c) Debt to total capital ratio
The ratio is obtained by dividing total debt by total capital of the firm.
=Total Debt
Total Capital
Total capital refers to the sum of interest- bearing debt and net worth/shareholder's
equity.
It shows the proportion of debt in total capital employed by the bank. High ratio
indicates greater claim of creditors. Contrary to it, low ratio is the indication of lesser
claim of outsiders. For the sound solvency position, the ratio should not be too high or
too low.
d) Interest coverage ratio
The ratio is calculated by dividing net profit before deduction of interest and tax by
interest charges.
=-Net Profit After Tax
Interest Charges Ratio
The ratio, also known as times interest-earned ratio is used to test the debt servicing
capacity of the bank. It shows the number of times the interest charges are covered by
funds that are ordinarily available for their payment. It indicates the extent to which
the earning may fall without causing any embarrassment to the firm regarding the
payment of interest. Higher ratio is desirable, but too high a ratio indicates the firm is
very conservative in using debt. A lower ratio indicates excessive use of debt or
insufficient operation.
3.5.1.1.3 Capital Adequacy Ratio
Capital adequacy ratio measures whether the firm has maintained sufficient capital or
not. In other words, it helps to decide whether the existing capital is adequate or there
is the not need or reforms. The ratio is tested to ensure the safety and stability of the
firm in long run.

60
Over capitalization and under capitalization both have adverse effect on profitability of
the firm. If the capital is excess, it remains idle, if the capital is insufficient, the firm may
not be able to grasp the opportunity from potential profitable sectors. Therefore, the
commercial banks have been directed to retain sufficient ratio by the central bank. As
per the directive this ratio should be 10 % of their total risk, weighted assets and total
off-balance sheet transitions, Here, capital fund refers to the core capital and
supplementary capital commercial banks cannot declare and distribute dividend until
they meet capital adequacy ratio under this group, following ratios are tested.
Net worth to total deposit ratio
Net worth to total assets ratio
Net worth to total credit ratio
a) Net worth to total deposit ratio
The ratio is calculated by dividing net worth by total deposit = Net Worth
Total Deposit
The ratio measures the percentage of net worth in relation to the total deposits
collection in the bank. The ratio is a yardstick to see whether the bank has maintained
the capital fund according to the direction of Nepal Rastra Bank.
b) Net worth to total assets ratio
The ratio is calculated by dividing the net worth by total assets of the bank.
=Net Worth
Total Assets
The ratio measure what is the percentage of shareholders' fund is relation to the total
assets owned by the bank. High ratio means greater contribution of investors fund and
strong capital adequacy position.
c) Net worth to total credit ratio
The ratio is obtained when not worth is divided by the total credit of the bank.

61
=Net Worth
Total Credit
Total credit refers to the total of loans and advances granted, cash credit overdrafts,
bill purchased and discounted.
It measures the relative proportion of the shareholders fund with respect to the credit.
High ratio shows that the firm has adequate capital, which is the index of safety.
Moreover, a bank with higher ratio is less affect by the instability of the financial
market.
3.5.1.1.4 Turnover Ratio
Turnover ratios, also known as utilization ratios or activity ratios are employed to
evaluate the efficiency with which the firm manages and utilizes its assets. They
measure how effectively the firm uses investment and economic resources at its
command. Investments are made in order to produce profitable sales. Unlike other
manufacturing concerns, the bank produces loans, advance and other innovation. So it
sells the same High ratio depicts the managerial efficiency in utilizing the resources
they show the sound profitability position off the bank low ratio is the result of
insufficient utilization of resources. However, too high ratio is also not good enough as
it may be due to the insufficient liquidity.
Depending upon special nature of assets and sales made by the bank, following ratios
are tested;
- Loans and advances total deposits ratio
- Loans and advances to fixed deposits ratio
- Loans and advances to saving deposit ratio
- Investment t to total deposit ratio
- Performing assets to total assets ratio
- Performing assets to total debt ratio

62
a) Loan and advanced to total deposit ratio
The ratio is computed by dividing total loans and advances by total deposit liabilities.
=Loan & 𝐴𝑑𝑣𝑎𝑛𝑐𝑒𝑠
Total Deposit
Loan and advanced consist of loans, advances, cash credit overdraft, foreign bills
purchased and discounted.
The ratio indicates the proportion of total deposits invested in loans and advances.
High ratio means the greater use of deposits for investing in loans and advances.
However, very high ratio shows poor liquidity position and risk in loans on the
contrary; too low ratio may be the causes of idle cash or use of fund in less productive
sector.
b) Loan and advances to fixed deposit ratio
The ratio is calculated by dividing loans and advances by fixed deposit liabilities
=Loan & 𝐴𝑑𝑣𝑎𝑛𝑐𝑒𝑠
Fixed Deposit Ratio
The ratio indicates what proportion of fixed deposit has been used of loans and
advances. Since fixed deposits carry high rate of interest, fund so collected need to be
invested in such sectors, which yield at least sufficient return to meet the obligation.
High ratio means utilization of the fixed deposit in form of loans.
c) Loan and advances to saving ratio
The ratio is calculated using following formula
=Loan & 𝐴𝑑𝑣𝑎𝑛𝑐𝑒𝑠
Saving Deposit
The ratio measures what extent of saving deposit has been turned over to loans and
advances. Saving deposit also, being an interest bearing liability needs to be invested in
productive sector. High ratio indicates greater utilization of the saving deposit in
advancing loans.

63
d) Investment to total deposit ratio
The ratio obtained by dividing investment by total deposits collection in the bank.
=Investment
Total Deposit Ratio
Investment comprises investment its HMG treasury bills development bonds, company
shares and other type of investment.
The ratio shows how efficiently the major resources of the bank have been mobilized.
High ratio indicates managerial efficiency regarding the utilization of deposits. Low
ratio is the result of less efficiency in use of funds.
e) Performing assets to total assets ratio
It is calculated by dividing performing assets by total assets =Performing Assets
Total Assets Ratio
Performing assets to total assets include those assets, which are invested for income
generating purpose. These consist of loans, advances; bills purchased and discounted
investment and money at call or short notice.
The ratio measures what percentage of the assets has been funded for income
generation. High ratio indicates greater utilization of assets and hence sound
profitability position.
f) Performing assets to total debt ratio
It is calculated as follows
=Performing Assets
Total Debt
It shows the pattern of use of the fund collected from the outsiders High ratio
represents the success of bank in utilization of creditors fund in productive areas low
ratio indicates idleness of the cost bearing resources.

64
3.5.1.1.5 Asset Quality Ratio
As explained earlier, turnover ratios measure the turnover of economic resource in
terms of quantity. Only the investment is not of great significance, but the return from
them with minimum default in payment by debtors is significant. A firm may be in a
state of enough profit and though unable to meet liability. Therefore, asset quality
ratios are intended to measure the quality of assets contained by the bank. Following
ratios are computed in this group:
a) Loan loss coverage ratio
b) Loan loss provision to total income ratio
c) Loan loss provision to total deposit ratio
d) Accrued interest to total interest income ratio
a) Loan loss coverage ratio
The ratio is calculated by dividing provision for loans loss by total risk assets.
=Loan Loss Provision
Total Risk Assets
For the purpose, risk assets constitute loans and advances, bills purchased and
discounted.
Nepal Rastra Bank has directed commercial banks to maintain provision for loan loss
based on category of loans and risk grade. The ratio, therefore, measures whether the
provision is sufficient to meet the possible loss created by defaulted in payment of loan
or not. High ratio indicates that the major portion of loan is risky.
b) Loan loss provision to total income ratio
The ratio is obtained by dividing loan loss provision by total income.
Loan Loss Provision
Total Income Ratio
The ratio shows what portion of total income has been held as safety cushion against
the possible bad loan. Higher ratio indicates that the greater portion of loan advanced

65
by the bank is inferior in quality. Low ratio means that the bank has provided most of
its loans and advance in secured sector.
c) Loan loss provision to total deposit ratio
The ratio is obtained by dividing the provision for loan loss by total deposit in the bank.
Loan Loss Provision
Total Deposit Ratio
It shows the proportion of bank's income held as loan loss provision in relation to the
total deposit collected. Higher ratio means quality of assets contained by the bank in
form of loan is not much satisfactory. Low ratio is the index of utilization of resources
in healthy sector.
d) Accrued interest to total interest income ratio
The ratio is obtained by dividing accrued interest by total interest income.
Accured Interest
Total Interest Income
Accrued interest refers to the interest that is accrued but not collected. Total interest
income includes the interest received from the investment in various sectors.
The ratio shows the percentage of accrued interest with respect to total income in form
of interest. High ratio indicates the larger portion interest remained to be collected.
Lower ratio reflects the better quality of assets in the bank.
3.5.1.1.6 Profitability Ratio
Profitability ratios are designed to highlight the end-result of the business activities,
which in the imperfect world of ours, is the sole criterion of cover all efficiency of
business unit.
A company should earn profit to survive and grow over a long period. It is a fact that
sufficient profit must be earned to sustain the operations of the business, to able to
obtain funds from investors for expansion and growth; and to contribute towards the
social overheads for the welfare of society. The profitability ratios are calculated to

66
measure the operating efficiency of the company. Management of the company,
creditors and owners are interested in the profitability of the firm. Creditors want to
get interest and repayment of principal regularly. Owners want to get a reasonable
return from their investment.
To meet the objective of study, following ratios are calculated in this group;
- Return on total assets
- Return on net deposit
- Return on total deposit
- Total interest expenses to total interest income ratio
- Interest earned to total assets ratio
- Staff expenses to total income ratio
- Office operation expenses to total income ratio
a) Return on total asset
The ratio is calculated by dividing net profit after tax by total on asset on the bank.
Net Profit After Tax
Total Assets
Net profit refers to the profit deduction of interest and tax. A total asset means the
assets that appear in asset of balance sheet.
It measures the efficiency of bank in utilization of the overall assets. High ratio
indicates the success of management in overall operation. Lower ratio means
insufficient operation of the bank.
b) Return on net worth
The ratio is computed by dividing net profit after tax by net worth.
Net Profit After Tax
Net Worth
The ratio is tested to see the profitability of the owner's investment "reflects the extent
to which the objective of business is accomplished". The ratio is of great interest to

67
present as well as prospective shareholders and of great significance to management,
which has the responsibility of maximizing the owner's welfare, so higher ratio is
desirable.
C) Return on total deposit
The ratio is computed by dividing net profit after tax by total deposit.
Net Profit After Tax
Total Deposit
The ratio shows the relation of net profit earned by the bank with the total deposit
accumulated. High ratio is the index of strong profitability position.
d) Total interest expenses to total interest income ratio
The ratio is obtained by dividing total interest expenses by total interest income.
Total Interest Expenses
Total Interest Income
Total interest expenses consist of interest expense incurred for deposit, borrowing and
loans taken by the bank. Total interest income includes interest income received from
loans, advance, cash credit, overdrafts and government securities, interbank and other
investment. The ratio shows the percentage of interest expenses incurred in relation to
the interest income realized. Lower ratio is favorable from profitability point of view.
e) Interest earned to total assets ratio
The ratio is calculated by dividing interest income by total asset of the bank.
Interest Earned
Total Assets
The ratio shows percentage of interest income as compared to the assets of the bank.
High ratio indicates the proper utilization of bank's assets for income generating
purpose. Low ratio represents unsatisfactory performance.

68
f) Staff expenses to total income ratio
The ratio is obtained by dividing the staff expenses by total income.
Staff Expenses
Total Income
Staff expenses include the salary and allowances, contribution to the provident fund &
gratuity fund, staff training expenses and other allowance and expenses made for staff.
The ratio measures the proportion of income spent for the staff, whose contribution is
of great significance in the success of the bank. High ratio indicates that the major
portion of income is used for staff. From the firm's point of view, low ratio is
advantages. However, the staffs prefer high ratio, as it is the result of higher level of
facilities and benefits provided to them.
g) Office operation expenses to total income ratio.
The ratio is obtained by dividing office operation expenses by total income.
Office Operation Expenses
Total Income
Office operation expenses comprise expenses incurred in house rent, water, electricity,
repair, maintenance, legal expenses, audit expenses and other miscellaneous expenses
made in course of operation.
It shows the percentage of income spent for day-to-day operation of the bank. High
ratio shows that large amount of income is spent for the operating activities of the
bank. Lower ratio is favorable to the bank, as it is the reflection of operational
efficiency.
3.6.1Other indicators
Above stated ratios, throw light on various aspects of bank. Management investors and
creditors can get information regarding their interest. Some indicators are dealt here
which provide more knowledge about the performance of the bank. They are listed
below.

69
Earning per share(EPS)
Dividing per share(DPS)
Tax per share (TPS)
Dividend payout ratio(DPR)
Price earning ratio (P/E Ratio)
Market value per share to book value per share(MVPS/BVPS)
a) Earnings per share(EPS)
It is obtained by dividing earning available to common shareholders by number of
equity shares out-standing.
Earning Available to Common Shareholders
No. of Equity shares Outstanding
Earnings per share refers to the income available to the common shareholders on per
share basis, it enables us to compare whether the earning based on per share basis has
changed over past period or not. The investors favour high EPS. It reflects the sound
profitability of the bank.
b) Divided per share(DPS)
It is obtained by dividing earning paid to shareholder by number of equity shares
outstanding.
Earning Paid to Shareholder
No.of Equity shares Outstanding
The net profit after the deduction of preference dividend belongs to equity
shareholders. However, the income that really receives is the amount of earning
distributed as dividend. Dividend may be distributed in form of cash or bonus share.
Dividend distribution affects the price of share. Shareholders prefer high dividend.
However, it may sometimes be wise to distribute less amount of profit in investment
opportunities are available.
70
c) Tax per share (TPS)
It is obtained by dividend tax paid to the government by number of outstanding equity
shares.
Tax Paid to the Government
No.of Equity shares Outstanding
Tax is paid to the government after the deduction of interest income. Tax is paid only if
profit is earned.
The ratio measures the contribution of shareholders for the development of the
country as tax acts as a source of income for government. High TPS represents better
profitability position of the bank, as it is the result of high profit.
d) Dividend payout ratio (DPR)
It is obtained by dividing dividend per share by earning per share.
Dividend Per Share
Earning Per Share
It shows the percentage of earning distributed to the shareholder. High ratio indicates
less retention of earning in the bank. Low ratio means higher portion of income is held
in the bank to grasp the profitable opportunities. Generally, the shareholder prefers
high DPS.
e) Price-earnings ratio( P/E Ratio)
Market Value Per Share
Earning Per Share
P/E ratio is widely used to evaluate the bank's performance as expected by investors. It
represents the investors' judgment or expectation about the growth in the banks
earning. In other words, it measures how the market is responding towards the
earning performance of the concerned institution. High ratio indicates greater
expectation of the market towards the achievement of firm.

71
f) Market value per share to book value per share( MVPS/BVPS)
It is the ratio of market value per share to book value per share.
MVPS
BVPS
BVPS is net worth divided by the number of shares outstanding.
The ratio measures the value that the financial market attaches to the management and
organization of the bank as a growing concern high ratio is indication of strong
management and organization.
3.6.1.1 Income and Expenditure Analysis
This is a tool with the help of which the components of income and expenditure can be
compared between two competitive firms. By this analysis, one is able to conclude
which sources of income& expenditure are dominant in the related concern. Under
income analysis, overall income is split up into major headings. Interest income,
commission & discount, foreign exchange income and other income. Under
expenditure analysis, entire operating expenses are split up into four major headings-
interest expenses, staff expenses, office operation expenses and bonus facility.
3.6.2 Statistical Tools
Various statistical tools can be used to analyze the data available to the researcher.
These tools are used in research in order to draw the reliable conclusion through the
analysis of financial data.
Following tools are used for are purpose.
- Arithmetic mean
- Coefficient of variation
- Student's T-test
- Coefficient of correlation
- Probable error of correlation coefficient
- Least-square line trend

72
3.6.2.1 Arithmetic mean
An average is a single value selected from a group of values to represent them in same
way, which is supposed to stand for whole group of which it is a pare, as typical of all
the values in the group (Waugh A.E.), Out of various measures of the central tendency,
arithmetic mean is one of the useful tools applicable here, it is easy to calculate and
understand and based on all observations.
Arithmetic mean of a given set of observations is their sum divided by the number of
observation. In general, if X1, X2, X3...............Xn are the given observations, then
arithmetic mean usually denoted by X is given by,
𝑋 =𝑋1+𝑋2+𝑋3………………………𝑋𝑛
𝑛 =
𝑋
𝑛
Where, n = number of observation
3.6.2.2 Variance
It is a statistical measure of the variability of s set of observations. The symbol is
pronounced "Sigma Square". It is the measure of total risk. The smaller the variance,
the lower the risk ness of the stock and vice versa.
62x =
𝑇=1 (𝑋1−𝑋1)2
𝑛
Where,
N = No. of observation
𝑋1 = Average rate of return
3.6.2.3 Standard deviation
It is the square root of the variance standard deviation
62x = ∑ √(𝑋1−𝑋1)2
𝑛
𝑛𝑇=1

73
Where,
N = No. of observation
𝑋1= Average rate of return
3.6.2.4 Coefficient of variation
According to Prof. Karl Pearson, coefficient of variation is the percentage variation in
mean, standard deviation being considered as the total variation in the mean. It is one
of the relative measures of dispersion that is useful in comparing the amount of
variation in data groups with different mean.
Coefficient of variation, denoted by C.V. is given by;
Where, a = Standard Deviation
i.e.
√𝑥
𝑁×𝑑2
𝑁
For comparing the variability o two distributions, we compute the coefficient of
variation for each distribution. A distribution with smaller CV is said to more
homogeneous or uniform or less variable than other, conversely a series with greater
CV is said to be more variable or heterogeneous than the other.
3.6.2.5 Student's T-test
Student's t-test is a useful statistical tool to see the significance of the difference
between two sample means, the population variances being equal but unknown (Gupta
S.C.). Student's t-test is based on the assumption that the present population from
which the sample is drowning is normal, the sample observations are independent and
the population standard deviation is unknown. The test is applied for the sample less
than 30.
If X1,X2,X3 ------ Xn and Y1, Y2, Y3 .......Yn be two independent random samples from the
given normal population, null hypothesis is set as; i.e. the sample means X and Y do not
differ significantly under the assumption that of population variance are equal but
unknown. The test statistic under Ho is i.e. S2 is in unbiased estimate of the common

74
population variance c3 based on both samples. By comparing the value of /t/ with the
tabulated value of t for iii +rv-2 degree of freedom and at 5% level o significance, null
hypothesis is accepted or rejected. If the calculated value of t came to be less than the
tabulated value, null hypothesis is accepted otherwise, rejected.
3.6.2.6. Karl Person's coefficient of correlation
It is a statistical tool for measuring the intensity or the magnitude of linear relationship
between two series. Karl Pearson's measure, known as Pearson's correlation
coefficient between two variable and series X and Y is usually denoted by 'i' and can be
obtained as
Where,
r = 𝑛𝑋𝑌−𝑋𝑌
[{𝑋2−(𝑋)2}{𝑛𝑌2−(𝑌)2]21
Where,
N= number of observation in series x and y
X = Sum of observations in series x
Y = Sum of observations in series y
X2 = Sum of squared observation in series X
Y2 = Sum of squared observation in series Y
XY sum of the product of observation in series X and Y value of r lies between -1 and +
1. r = 1 implies that there is a perfect positive correlation between the variable, r = 1
implies that there is a perfect negative correlation between the variable r = 0 means
the variable are uncorrelated. But r = 0 does not always mean that the variables are
uncorrelated; they may be related in some other form such as logarithm, quadratic,
exponential etc.
3.6.2.7 Probable error of correlation coefficient
Probable error of correlation coefficient is a measure of testing the reliability of an
observed value of correlation coefficient. It is calculated to find the extent to which

75
correlation coefficient is dependable as it depends upon the condition of random
sampling.
As,
P.E. (r ) = 1−𝑟2
√𝑛
= 0.6745
Where, r = Standard error
Reason for taking 0.6745 is that in a normal distribution 50% of observations lie in the
range 0.6745 where, u and a denote the population mean and standard deviation.
E (R) is used to test it an observed value of sample correlation coefficient is significant
of any correlation in the population. If r<P.E., correlation is not at all significant. If
r>P.E., r is definitely significant.
3.6.2.8 Least square linear trend
Trend analysis is a very useful and commonly applied tool to forecast the future event
in quantitative term, based on the tendencies in the dependent variable in the past
period.
The straight-line trend implies that irrespective of the seasonal and cyclic as well as
irregular fluctuation, the trend value increases or decreases by absolute amount per
unit of time. The linear trend values mathematically,
Y = a + bx
Where, Y = the value of dependent variable
a = Y- intercept
b = Slope of the trend line
x = Value of the independent variable
i.e. time = Year- 2003/04(with regard to the data used in the study)
Normal equations fitting above equation are:

76
3.7 Limitation of financial analysis
From the above discussion, it has been evident that financial performance analysis is of
great significance for investor, creditor, management, economist and other parties
having interest in business. It helps management to evaluate its efficiency in past
performance and take decision relating to the future. However, it is not free from
drawbacks. Their limitations are listed below.
a) Historical nature of financial statements
The basic nature of statements is historical. Past can never be a precise and
infallible index of the future and can never be perfectly for the future forecast and
planning.
b) No substitute for judgment
Reliability of financial analysis is a tool to be used by expert analyst to evaluate the
financial performance of a firm. That is why; it may lead to faculty conclusion if
used by unskilled analyst.
c) Reliability of figures
Reliability of analysis depends on reliability of the figures of the financial
statements under scrutiny. The entire working of analysis will be vitiated by
manipulating in the income statement, window dressing in the balance sheet
questionable procedure adopted by the accountant for the valuation of fixed assets
and such other facts.
d) Single year analysis is not much valuable
The analysis of these statements relating to single year only will have limited use
and value. From this, one cannot draw meaningful conclusion.
e) Result may have different interpretation
Different users may differently interpret the result derived from the analysis. For
example, a high current ratio may suit the banker but it may be the index of
insufficiency of the management due to under- utilization of fund.

77
f) Changes in accounting methods
Analysis will be effective it the figures derived from the financial statements is
comparable. Due to change in accounting method, the figures of current period may
have no comparable base, and then the whole exercise of analysis will become futile.
g) Pitfall in inter-firm comparison
When different ferns are adopting different procedures, records, objectives, policies
and different items under similar heading, comparison will be more difficult. If done, it
will not provide reliable basis to assess the performance, efficiency, profitability and
financial condition of the firm as compared to whole industry.
h) Price level change reduces the validity of analysis
The continuous and rapid changes in the value of money, in the present day,
economically also reduces the validity of the analysis. Acquisition of assets at different
levels of prices make comparison useless as no meaningful conclusion can be drawn
from a comparative analysis of such items relating to several accounting period.
i) Selection of appropriate tool
There are different tools of analysis available to the analyst. The tools to be used in a
particular situation depend on skill, training, intelligence and expertise of the analyst. If
wrong toll is used, it may give misleading results and may lead to wrong conclusion,
which may be harmful to the interest of business.

78
CHAPTER-IV
ANALYSIS AND INTERPRETATION OF DATA
This chapter deals with the analysis and interpretation of data following the researcher
methodology dealt in the chapter. In the course of analysis, data gathered from the
various sources have been inserted in the tabular form according to 'heir' homogenous
nature. The various tables prepared for the analysis purpose have been shown in
annexes. Using financial and statistical tools, the data have been analyzed the result of
the analysis has been interpreted keeping in mind the conventional standard with
respect to ratio analysis, directives of NRB and other factors while using other tools.
Moreover, financial performance of the sampled banks has especially been analyzed in
cross-sectional manner. Specifically, the chapter includes analysis and interpretation of
the following.
- Ratios analysis
- Income and expenditure analysis
- Correlation Analysis
- Lest Square liner trend analysis
4.1 Ratio Analysis
Ratio analysis has been adapted to evaluate the financial health, operating result and
growth of the sampled banks. In order to analyze and interpret the tabled data, the
following ratios have been used.
- Liquidity ratio
- Leverage ratio
- Capital adequacy ratios
- Turnover ratios
- Asset quality ratios
- Other indicators

79
4.1.1 Liquidity Ratios
Liquidity ratios have been employed to test the ability of the banks to pay immediate
liabilities. These include current ratio, cash and bank balance to total deposit ratio,
NRB balance to current and saving deposit ratios, NRB balance to fixed deposit ratio
and fixed deposit ratio and fixed deposit to total deposit ratio.
a) Current ratio
Current Ratio = Current Assets
Current Liablities
Annex 1 show that current ratio of NSBIBL for the study period remained 1.15:1,
1.07:1, 1.06:1, 1.05:1 and 1.06:1 respectively form the year 2004\2005 to 2008/2009.
Mean of the ratios appeared 1.08:1 and CV appeared 3.39%. Similarly the ratios of EBL
for the corresponding period remained 1.07:1, 1.07:1, 1.03:1, 1:1 and 0.98:1 means of
the ratios came 1.04:1 whereas CV came 4.26%.
The ratio of both the banks showed slightly decreasing trend. In NSBIBL the ratio did
not fall below 1:1 whereas with respect to EBL, it declined in as against non-
decreasing trend in other years. Mean of the ratios in NSBIBL was slightly greater than
that of EBL which depicts that both of the banks could riot maintain the conventional
standard of 2:1. Having a glance at the nature of assets and liabilities of the commercial
banks, the ratio below the stated standard may be accepted as satisfactory, but it
signifies that the bank have the poor liquidity position banks may face the problem of
working capital if they need to pay the current liabilities at demand. Delay in payment
of the liabilities may lead the banks to lose their goodwill. They will have the problem
in winning the confidence of current depositors and short-term lenders. Between the
two banks, NSBIBL seems to be slightly in the better position. The ratios remained
more consistent in NSBIBL then in EBL.
The calculated value of t (1.4666) remained less than the tabulated value (2.306) at 5%
level of significance. Hence, the null hypothesis has been accepted i.e. the mean of the
current ratios of the sampled banks does not differ significantly.

80
b) Cash and Bank balance to current and saving deposit ratio
Cash and Bank balance to
Current & Saving Deposit Ratio = Cash & 𝐵𝑎𝑛𝑘 𝐵𝑎𝑙𝑎𝑛𝑐𝑒
Current & 𝑆𝑣𝑖𝑛𝑔 𝐷𝑒𝑝𝑜𝑠𝑖𝑡
Annex 2 shows that, the ratio remained 83.97%, 32.01%, 38.73, 55.96% and 59.56% in
NSBIBI in the respective years of the period. Mean and CV of the ratios were 54.05%
and 33.61%, respectively. Similarly, the ratio remained 32.57%, 105.81%, 62.11%,
63.23%and 56.4%in corresponding years of study period in EBL. Mean of the ratios
appeared 64.02% whereas CV appeared 36.96%.
The ratios of both the banks revealed fluctuation trend over the period, of NSBIBL
remained highest in the year 2004/2005and then it declined in consecutive years, the
ratio appeared in increasing trend, it remained highest in EBL in the year 2005/2006 (
above 100%). The means ratio of EBL appeared greater than that of NSBIBL, which
indicates that the former is more efficient in paying the immediate obligation. Higher
CV of ratio in EBL as compared to NSBIBL signifies greater variation in the ratios.
The calculated value of t was less than the tabulated value at 5% level of significance
(0.669<2.306). Hence null hypothesis has been accepted i.e. there is no significant
difference between the ratios of two banks.
c) Cash and bank balance to total deposit ratio
= Cash & 𝐵𝑎𝑛𝑘 𝐵𝑎𝑙𝑎𝑛𝑐𝑒
Total Deposit
Annex 3 depicts that the ratios were 28.35%, 13.57%, 13.57% 20.34% and 31% in
NSBIBL in the respective years of study period. Mean and CV of the ratios came 21.37%
and 34.02% respectively. In the similar way, the ratio in EBI remained 32.57%,
25.63%, 18.52%, 22.68% and 23.64% in the corresponding years. Mean and CV of the
ratios came 24.14% and 15.83% respectively.

81
Glancing at the nature of ratios, trend of cash and bank, balance to total deposit of both
the banks appeared fluctuating. In NSBIBL, the ratio reached highest in the year
2007/2008. Mean ratio of EBL came higher than that of NSBIBL which means that EBL
has the greater ability to repay the deposit i.e. EBL is more efficient to serve the
customers from liquidity point vive. CV the ratios remained lower in EBL, which
signifies greater consistency in it.
Calculated value of t appeared less than the tabulated value at 5% level of significance
i.e. 0.6746<2.306. Hence, null hypothesis has been accepted i.e. the difference appeared
in the mean value of the ratio is not significant.
d) NRB balance to current and saving deposit ratio
NRB balance to current and saving deposit ratio
NRB Balance
Current Saving Deposits
From the annex 4, the ratios of NSBIBL were found to be 59.17%, 20.93%, 28.50%,
42.19% and 30.40% in the respective years of study period. Mean and CV of the ratios
seemed 36.24% and 36.81% respectively. Similarly the ratios EBL remained 4.83%,
50.96%, 33.61%, 30.10% and 20.58% in the corresponding years. Mean of the ratios
came 28.02% and CV came 54.25%.
The calculated ratios did not show particular direction of change in NSBIBL the ratio
remained highest in the first year whereas in EBL, it remained highest in the second. In
NSBIBL the ratio, in none of the years dropped below the minimum standard of 10%
prescribed by NRB. But it declined below the standard in 2007/2008 in EBL. In both of
the banks, mean ratio lay at significant level above the standard. Comparatively, it is
greater in NSBIBL, which indicates that NSBIBL is stronger in liquidity position than
EBL. NSBIBL has deposited excess cash in NRB, which may affect the profitability
adversely because idle cash earns nothing, from the CV analysis, it can be concluded
that the ratio of EBL varied to a greater extent than that of NSBIBL.

82
The calculated value of t was less than the tabulated value at 5% level of significance
(0.8132<2.306). Therefore null hypothesis has been accepted i.e. two banks do not
differ significantly with respect to this ratio.
e) NRB balance to fixed deposit ratio
NRB balance to fixed deposit ratio
= NRB Balance
Fixed Deposits
Annex 5 Depicts that the ratios of NSBIBL reached 30.16%, 15.54%, 15.37%, 24.09%
and 33.33% in the respective years under the study. Mean of the ratios appeared
23.63% and CV appeared 30.77%. Similarly, the ratios of EBL were 61.94%, 16.29%,
14.28%, 16.84% and 14.85% respectively loan of the ratios remained 28.84% and CV
remained 74.77%.
The ratio of NSBIBL showed fluctuating trend in the period of review. It ranged form
the minimum of 15.37% in the year 2006/2007 to maximum of 33% in the year
2008/2009. In all of the years, the ratio remained higher than 6%, the minimum
standard set by NRB. In EBL, the ratio was highest in the year 2004/2005. In the latter
years, it remained almost stagnant around 15%. In all the years of study period, it
remained higher than the standard. Mean ratio of EBL came nominally greater than
that of NSBIBL. It reveals that EBL has slightly thicker cushion against, the fixed
deposit to be repaid than that of NSBIBL. Furthermore, CV of the ratios remained
significantly higher in EBL, which reflects the greater fluctuation in the ratio.
The calculated value of t i.e. 0.1211 appeared less than the tabulated value at 5% level
of significance i.e. 2.306. So, null hypothesis has been accepted i.e. mean ratio of two
banks does not differ significantly.
f) Fixed deposit to total deposit ratio
= NRB Balance
Fixed Deposits

83
Annex 6 Highlights that the ratios of NSBIBL remained 66.23%, 57.07%, 64.97%,
63.66% and 47.65% in the respective years of study period. Mean and CV of the ratios
were 59.98% and 11.33% respectively. Similarly the ratios of EBL were 7.24%,
75.78%, 70.19%, 75.78% and 58.09% in the corresponding years Mean and CV of the
ratios appeared 55.09% and 44.74% in the order mentioned.
The ratio of NSBIBL fluctuated every year during the study period it was highest in the
first year but the lowest in the last. The ratio in EBL was least in the first year. It
abundantly rose in the second year and then it started to decline. Mean ratio of NSBIBL
came higher than that of EBL. It suggests that greater portion of total deposit in NSBIBL
has boon occupied by fixed deposit in contrast to EBL. It can grasp the opportunity of
investing the fund in more profitable loans. On the other hand, EBL has the opportunity
to invest in current assets so as to strengthen its liquidity position. CV analysis depicts
that the ratios in NSBIBL in the past years of research period remained more uniform
then that of EBL. The calculated value of t remained less than the tabulated value at 5%
level of significance (0.3826<2.306). Therefore null hypothesis has been accepted i.e.
there is no significant difference between the mean ratios of two banks.
Overall liquidity position of the sampled banks appeared almost similar. In
comparison, EBL seemed slightly stronger than NSBIBL. But the mean ratio of the
banks did not differ significantly.
4.1.2 Leverage ratios
Leverage ratios have been analyzed and interpreted to judge the long-term financial
health of the sampled banks. These include dept-equity ratios, debt-asset ratio, debt to
total capital ratio and interest coverage ratio.
a) Debt-equity ratio
Debts Equity Ratio= Total Deposit
Shareholdet′s Equity
Annex 7 depicts that the debt–equity ratios of NSBIBL were 4.35, 7.60, 9.77, 11.37, and
9.02 in the respective years of study period. Mean and CV of the ratios appeared 8.42

84
and 28.16% respectively. Similarly the ratios of EBL remained 5.49, 4.34, 11.44, 7.51
and 11.21 in the corresponding years. Mean of the ratios came 8.00 whereas CV came
36.29%.
The ratio of NSBIBL revealed rising trend up to the fourth year and then declined in the
last. In case of EBL, it clearly showed the fluctuating trend. Average of the ratios
appeared slightly greater in NSBIBL as compared to that in EBL. Both of the banks
seem levered but in comparison, NSBIBL seems more levered in other words, capital
structure of NSBIBL is riskier than that of EBI CV of the ratios remained lower in
NSBIBL, which clarifies that the ratios of EBL were less consistent.
The calculated value of t i.e.0.2235 was less than the tabulated value i.e. 2.306 at 5%
level of significance. Hence, null hypothesis has been accepted i.e. two banks do not
differ significantly with respect to this ratio.
b) Debt-asset ratio
Debt-asset ratio = Total Debt
Total Assets
Annex 8 depicts that the ratios for NSBIBL remained 67.82%, 63.86%, 71.44%, 75.35%
and 60.15% in the respective years of study period form the years 2004/05 to
2008/2009. Average and CV of the ratios were 67.12% and 68.5% in that order. In the
similar way, the ratios of EBL were 75.50%, 68.67%, 73.79%, 67.36% and 71.00% in
the corresponding years. Mean of the ratio seemed 71.26% and CV seemed 4.27%.
The ratio reflected inconsistent policy of the banks in financing the assets proportion
of interest- bearing debt for the purpose. Mean of the ratio came greater in NSBIBL as
compared to that in EBL, which signifies that the former followed more aggressive
policy in raising the capital. ON the other hand capital structure of EBL seems less
risky. Form the CV analysis, it can be noticed that the ratios of NSBIBL varied
considerably throughout the review period.

85
The calculated value of t was less than the table value at 5% level of significance
(1.3092<2.306). Hence null hypothesis has been accepted i.e. two banks do not differ
significantly with respect to the debt-asset ratio maintained by them in immediate past
five years.
c) Debt to total capital ratio
= Total Debt
Total Capital
Annex 9 highlights that the ratios of NSBIBL remained 81.31%, 88.37% and 90.72%,
91.92% and 90.02% in the respective years of study period. Mean of the ratios came
88.47% and CV came 4.25%. In the similar way, the ratios of EEL for the corresponding
years remained 84.59%, 81.28%, 91.96%, 88.24% and 91.81%. Average of ratios was
87.58% and CV was 4.74%.
Up to the third year of the period, the ratio of NSSBIBL showed rising trend and them,
remained almost constant. But the ratios did not follow any particular trend in EBL.
The analysis makes it obvious that debt capital i.e. outsider’s fund was dominant in the
capital structure of both of the banks. NSBIBL seems ahead of EBL in rising the capital
through debt as per the higher mean ratio CV of the ratio remained nominally lower in
NSBIBL. Which indicates greater uniformity in the ratios of different years?
The calculated value of t came 0.3086, which is less than fable value i.e. 2.306 at 5%
level of significance. That’s why null hypothesis has been accepted i.e. the mean ratio of
two banks does not differ significantly.
d) Interest coverage ratio
= Net Profit before Interest & 𝑇𝑎𝑥
Interest Charge
Annex 10 reveals that the ratios of NSBIBL remained 1.33, 1.53, 1.4, 1.35 and 1.08 in
the respective year of review period. Mean and CV of the ratios seemed 1.34 and
10.96% respectively. Accordingly, the ratios in EBL were maintained -1.74, -0.13, 0.49,

86
1.34 and 1.33 in the corresponding years. Mean of the ratios in the bank was 0.26
whereas CV was 442.48%.
The ratio in NSBIBL depicted increasing trend up to the second year and then declined
gradually in the latter years. In all the years of study period, the fund available for the
payment of interest remained more than the requirement; however the margin was
not satisfactorily high. It remained negative in EBL for first two year. In the third year,
it became positive but less than one. In last two years it remained greater than one and
showed almost static nature. Mean ratio of NSBIBL came much higher than that of EBI,
which reveals the better debt servicing capacity of NSBIBL. By comparing the CV of the
ratio, it can be concluded that the ratio of EBL for different five years varied
considerably.
The calculated value of t remained less than the table value 5% level of significance
(2.0982<20306). That’s why, null hypothesis has been accepted i.e. debt-servicing
capacity of the sampled banks does not differ significantly.
From the analysis of leverage ratios, both of the banks seemed levered. But in
comparison, NSBIBL appeared more levered than EBL. Debt servicing capacity of EBL
remained poor in the beginning years. However, the difference in the position of two
banks did not appear significant.
4.1.3 Capital Adequacy ratio
Capital adequacy ratios of the banks have been tested to find whether they are
successful to reassure the depositors and creditors about their soundness; and also to
maintain general confidence in the banking system. These include net worth to total
deposit ratio, net worth to total asset ratio and net worth to total credit ratio.
a) Net worth to total deposit ratio
= Net Profit
Total Deposit

87
Annex 11 reveals that the ratios of NSBIBL were 19.46%, 9.67%, 8.33%, 7.00% and
7.33% in the respective years of study period. Mean of the ratios appeared 10.36% and
CV appeared 44.84%. Accordingly, the ratios for EBL remained 17.70%, 20.89%,
8.12%, 11.33% and 7.45% in the corresponding years. Mean CV of the ratio were
13.10% and 40.64% in that order.
The ratio of NSBIBL showed sharp decline in the second year and then gradual decline
up to the fourth year and fifth year, it slightly grew from the level of proceeding year.
But the ratio of EBL showed fluctuation over the period, it ranged from 20.89% in the
year 2005/06 to 7.45% in 2008/2009. Average ratio of EBL appeared higher than that
of NSBIBL, which means the former is better with respect to the capital adequacy
position. Higher CV of the ratios in NSBIBL shows less consistency in maintaining net
worth with respect to deposits.
The calculated value of t (0.8673) was less than the tabulated value at 5% level of
significance (2.306). Therefore, null hypothesis has been accepted that is average ratio
of two banks does not differ significantly.
b) Net worth to total assets ratio
= Net Profit
Total Deposit
Annex 12 demonstrates that the ratios in NSBIBL remained 15.59%, 8.40, 7.31%,
6.36% and 6.67% form 2004/2005 respectively. Mean and CV of the ratios came 8.87%
and 38.73% respectively. In EBL, the ratios were maintained 13.67%, 15.82%, 6.45%,
8.98% and 6.33% in the respective years. Average ratio appeared 10.25% whereas CV
appeared 37.57%.
The ratio in NSBIBL remained highest in the last year. It drastically decreased in the
second year and then decreased gradually up to the fourth year whereas it showed a
nominal use in last year. In EBL, it depicted fluctuating trend, which appeared
maximum in second year and minimum in last year. Mean ratio in EBL seemed higher
which indicates that net worth in it has covered comparatively greater portion of total

88
assets in other words, EBL is superior to NSBIBL to check the possible risk that might
arise due to high leverage. CV of the ratios remained slightly greater in NSBIBL. Which
means that the ratios in the bank highly as against EBL.
The calculated value of t was less than the table value at 5% level of significance
(0.5422<2.306). Therefore, null hypothesis has been accepted i.e. sampled banks do
not differ significantly regarding this ratio.
c) Net worth to total credit ratio
Net worth
Total Credit
Annex 13 demonstrates that the ratios of NSBIBL remained 22.87%, 13.37%, 11.43%,
11.10% and 11.03 in the respective year of study period. Mean and CV of the ratios
appeared 13.96% and 32.5% respectively. Similarly the ratios in EBL seemed 129.25%,
72.5%, 12.68%, 14.62% and 10.64% in the corresponding years. Mean of the ratios
came 47.94% and CV came 10.64%.
The ratios of NSBIBL revealed decreasing trend throughout the review period it
declined to 11.03% in last year form 22.87% in the base year, in EBL, it declined
drastically to 10.64% in the final year form 129.25% in the base year. The ratio showed
declining trend in EBL in spite of little rise in the fourth year. Mean ratio of EBL
appeared abundantly higher which signifies that the capital adequacy position of EBL
is far better than that of NSBINL. But uniformity in maintaining the ratio of different
years seems higher in NSBIBL as per the lower CV.
The calculated value of t i.e. 1.4447 came less than the tabulated value at 5% level of
significance i.e. 2.306. That is why, null hypothesis has been accepted i.e. there is no
significant difference between the two banks with respect to tins ratio.
In totality, capital adequacy position of EBL appeared stronger than that of NSBIBL. In
tins sense, EBL is more successful to reassure creditors and depositor about its

89
soundness. However, the banks did not differ significantly with respect to capital
adequacy position.
4.1.4 Turnover ratios
Turnover ratios have been used to evaluate the efficiency with have managed and
utilized their assets. These, include loans and advances to total deposit ratio, loans and
advances to fixed deposit ratio, loans and advances saving deposit ratio, investment
total deposit ratio, performing assets to total ratio and performing assets to total debt
ratio.
a) Loans and advances to total deposit ratio
= Loan & 𝐴𝑑𝑣𝑎𝑛𝑐𝑒𝑠
Total Deposit
Annex 14 exhibits that the ratio of NSBIBL remained 85.1%, 72.35%, 72.86%, 63.12%
and 67.65% in the respective years of study period. Mean and CV of the ratios
appeared 72.22% and 10.18% in that order. The ratios of EBL were 13.7%, 28.81%,
64.07%, 77.49% and 70.03% in the corresponding years. Mean of the ratios came
50.82% and CV came 49.14%.
The ratio in NSBIBL fluctuated throughout the study period. It descended to 67.55% in
the last year form 85.01% in the base year. It depicted increasing trend in EBL up to
the fourth year of review period and marginally declined in the last year. Mean ratio of
NSBIBL appeared considerably higher which signifies that NSBIBL is more successful
in utilizing the resources in profitable sectors than EBI “The trend of the ratio in EBI
showed that in spite of decrease in the final year, there remained higher utilization
capacity in each succeeding year. In last year, fall in the ratio could be noticed due to
the increase in the amount of deposit by large volume than the volume of loans and
advances. CV of the ratios depicted that the ratio remained more consistent in NSBIBL
as compared to EBL.

90
The calculated value of t i.e. 1.6438 remained less than the tabulated value at 5% level
of significance i.e. 2.306. So that null hypothesis has been accepted i.e. two banks do
not differ to the significantly with respect to this ratio.
b) Loans and advances to fixed deposit ratio
= Loan & 𝐴𝑑𝑣𝑎𝑛𝑐𝑒𝑠
Fixed deposit
Annex 15 highlights that the ratio in NSBIBL arrived 128.48%, 126.76%, 112.15%,
99.16% and 141.08% in respective order from fiscal year 2004/2005 to 2008/2009.
Mean of the ratio appeared 121.53%, and CV appeared 11.9%. Similarly, the ratios of
EBI remained 189.22%, 38.02%, 91.28%, 120.83% and 120.56% in the corresponding
years. Average and CV of the ratios appeared 111.98% and 43.78% respectively.
The ratio of NSBIBL revealed decreasing trend up to the fourth year and in fifth year of
review period, it increased sharply. It showed fluctuating trend in EBL for the period.
The ratio in EBL ranged form 189.22% in the first year to 91.28% in the third year.
With respect to this ratio, both of the banks have shown good performance in other
words, both of these banks have well utilized the high interest bearing fixed deposit in
the sector yielding satisfactory return. NSBIBL seems more efficient in utilizing the
fixed deposit between two banks as revealed by higher mean ratio CV analysis showed
the lesser uniformity of ratios in it EBL as against the Nabil Bank.
The calculated value of t came less than the tabulated value at 5% level significance
(0.3734<2.306). Therefore; null hypothesis has been accepted i.e. the difference
noticed in the mean ratio of two banks is not significant.
c) Loan and advance to saving deposit ratio
= Loan & 𝐴𝑑𝑣𝑎𝑛𝑐𝑒𝑠
Saving Deposit
Annex 16 depicts that the ratios in NSBIBL remained 824.95%, 624.39%, 497.3%,
448.29% and 376.64% in the respective years of study period. Mean and CV of the

91
ratios appeared 566.31% and 29.07%, respectively. According to the ratio in EBL came
162.8%, 193.37%, 382.37%, 400.15% and 304.66% in the corresponding years. Mean
of the ratios came 288.67% and CV came 33.37%.
The ratio in NSBIBL obviously showed decreasing trend whereas with respect to EBI, is
showed increasing trend up to the fourth year and then dropped in the last year
average of the ratios in NSBIBL seemed almost double the same in EBL which indicates
that NSBIBL has more successfully utilized the interest bearing deposit in terms of
loans and advances moreover, turnover position of NSBIBL is better than that EBL with
respect to this ratio. The consistency in the ratio was found higher in NSBIBL from the
CV analysis.
The calculated value of t i.e. 2.9111 remained greater than the tabulated value i.e. 2.306
at 5% level of significance. Hence null hypothesis has been rejected i.e. turnover of
saving deposit in terms of loans and advances significantly differ between two banks. II
indicates insufficient utilization of saving deposit in form of loans and advance in EBL.
But it necessarily does not mean that the turnover position of the bank is really poor
because the portfolio management of the bank depends upon its lending policy, risk
analysis and diversification. The bank might have allocated its most of the deposits in
other assets with low risk.
d) Investment to total deposit ratio
= Investment
Total Deposit
Annex 17 exhibits that the ratio of NSBIBL remained 4.53%, 23.04%, 16.82%, 18.2%
and 4.63% respectively. Mean of the ratios appeared 13.44%, and CV appealed 55.98%.
In the similar way the ratios of EBL were 61.82%, 55.87%, 28.05%, 19.38% and
14.52% in the corresponding years of the review period. Mean ratio appeared 35.93%
and CV appeared 53.72% in the bank.

92
The ratio showed fluctuating pattern in NSBIBL. It ascended to 23.04% in 2005/2006
from 4.63% in 2008/2009. After some ups and downs up to the fourth year, tin ratio
dropped to 4.63%, very close to that of first year in the year 2008/2009. In EBL it
showed declining trend. It arrived to 14.52% in the last year from 61.82% beginning
year of the review period. Mean ratio came much higher in EBL, which signifies that
EBL has more successfully allocated its deposit in investment portfolio. Conversely,
EBL has given less importance to this issue. CV of the ratios appeared slightly greater in
NSBIBL, which indicates lesser uniformity in its ratios.
The calculated value of t came less than the tabulated value is 5% level of significance
(2.1708<2.306). Hence, null hypothesis has been accepted which means the difference
noticed in the mean ratio of two banks for the study period is not significant.
e) Performing assets to assets ratio
Annex 18 exhibits that the ratio of NSBIBL remained 71.8%, 82.88%, 78.68%,
73.87%and 65.79% respectively. Mean of the ratios appeared 74.6%, and CV appealed
7.84%. In the similar way the ratios of EBL were 58.68%, 64.14%, 72.11%, 76.74% and
71.84% in the corresponding years of the period. Mean of the ratios appeared 68.91%
whereas CV appeared 9.52%.
The ratio in NSBIBL increased in the second year as compared to the base year and
then, it declined in the latter years. The ratio showed rising trend in EBL up to the
fourth year and then decreased fell in last. Mean of the ratio appeared greater in
NSBIBL, which means it has used more proportion of the assets for income generating
purpose. Throughout the study period, NSBIBL utilized its assets in terms of loans and
advances, investment and bill discounting and purchasing more effectively than EBL.
CV of the ratios in EBL exceeded the same in NSBIBL which clarifies that the ratios
remained less consistent in the former.
The calculated value of t remained less than the tabulated value at 5% level of
significance (1.314<2.306). Hence, null hypothesis has been accepted i.e. turnover
position of two banks with respect to tins ratio is not significantly different.

93
j) Performing assets to total debt ratio
= Performing assets
Total Debt
Annex, 19 depicts that the ratios to NSBIBL remained 105.86%, 129.78%, 110.15%,
102.09% and 109.36% in the respective years of study period. Mean and CV of the
ratios appeared 111.45% and 8.61% respectively. In the similar way, the ratios in EBI
were 77.71%, 93.40%, 99.07%, 113.92% and 101.22% in the corresponding years.
Mean and CV of the ratios came 97.06% and 12.13% in that order.
The ratio in NSBIBL showed fluctuating trend throughout the review period whereas it
remained in rising trend in EBL up to the fourth year and decreased in the final year.
Mean of the ratios came greater in NSBIBL than in EBL, which indicates that NSBIBL
remained more successful regarding the use of the cost bearing debt in profitable
sectors. In other words, NSBIBL seemed at upper level with respect to the wise and
beneficial use of outsiders fund CV analysis showed that the variation in the
performing assets to total debt of NSBIBL was more uniform than that of EBL.
The calculated value of t was less than the tabulated value at 5% level of significance
(1.893<2.306). Therefore, null hypothesis has been accepted i.e. the difference in the
mean ratios of the sampled banks is not significant. In totality, NSBIBL seemed more
efficient to utilize the resources in profitable sectors. But the performance of the banks
did not appear significantly different except in mobilizing saving deposit in terms of
loans and advances.
4.1.5 Asset quality ratios
Asset quality ratios intend to measure the quality of assets owned by the banks. These
include loan loss coverage ratio, loan loss provision to total income ratio, loan
provision to total deposit ratio and accrued interest to total interest income ratio.
a) Loan loss coverage ratio
= Loan Loss Provision
Total Risk Assets

94
Annex 20 exhibits that the ratios for the different year of the review period remained
1.46%, 0.61%, 1.1%, 1.34% and 1.22% respectively in NSBIBL. Mean of the ratios came
1.15% whereas CV came 25.62%. Accor4dingly, the ratios of EBL remained 1.00%,
1.59%, 0.58%, 0.66% and 0.61%, in the corresponding year. Mean of the ratios
appeared 0.89% and CV 43.01%.
The ratio in both of the banks showed fluctuation over the period of study. It reached
maximum in the first year and reduced in the second in NSBIBL. But with respect to
EBL, it reached highest in the second year and fell the lowest in third. Mean ratio of
NSBIBL exceeded that of EBL. It indicates that EBL has been more successful to foresee
the quality of loans lent. Conversely, the asset possessed by NSBIBL has higher degree
of risk as compared to that of EBL. That’s why, the former bank has maintained
comparatively higher ratio to prevent itself from possible default in payment by
borrowers. CV of the ratio seemed less in NSBIBL, which reveals to lat the consistency
in ratios greater in NSBIBL.
The calculate value of t i.e. 1.071 came less than the tabulated value i.e. 2.306% at 5%
level of significance therefore, null hypothesis has been accepted, that is , the mean
ratio of the sampled banks does not differ significantly.
a) Loan loss provision to total income ratio
= Loan Loss Provision
Total Income
Annex, 21 highlights that the ratios in NSBIBL for the respective years of the analysis
period remained 10.46%, 3.54%, 6.42%, 7.61% and 7.19%. Mean and CV of the ratios
came 7.04% and 31.54% respectively. Similarly, the ratios in EBL were 8.05%, 5.62%,
5.31%, 4.11% and 3.8% in the corresponding years. Mean is the ratios seemed 5.38%
and CV seemed 27.95%.
The ratio in NSBIBL decreased in the second year and slightly increased in the
succeeding year. In fourth and fifth year, it showed almost static nature and remained
below the level of first year. In EBL, it depicted the decreasing trend. Mean ratio

95
remained higher in NSBIBL than in EBL, which signifies that NSBIBL held
comparatively greater portion of risky assets. Moreover, NSBIBL has been forced to
retain greater portion of its income idle as the cushion against loans of inferior quality.
CV analysis signifies that the ratios of NSBIBL remained less uniform throughout the
period of study.
The calculated value of t remained less than the tabulated value at 5% level of
significance (1.0421<2.306). Therefore, null hypothesis has been accepted i.e. the
average of the ratios does not significantly between the sampled banks.
b) Loan loss provision to total deposit ratio
= Loan Loss Provision
Total Deposit
Annex 22, highlight that the ratios of NSBIBL were 1.24%, 0.44%, 0.8%, 0.85% and
0.74% in the respective years of review period. Mean and CV of the ratios came 0.81%
and 31.48% respectively. Similarly, the ratios in EBL were 0.14%, 0.46%, 0.37%,
0.51% and 0.43% in the corresponding years. Mean is the ratio seemed 0.38 and CV
seemed 33.83%.
The ratio in both of the banks showed fluctuation over the period of study, the ratio in
NSBIBL. Declined to 0.44 in the year 2005/2006 from 1.24% in the previous year
whereas it ranged from 0.14% in the first year to 0.51% in fourth in EBL. Average ratio
in NSBIBL in oilier words, NSBIBL has lent greater portion of the loans in riskier sector.
Lower CV of the ratios in NSBIBL means that the consistency in the loan loss provision
with respect to the deposits as higher in NSBIBL.
The calculated value of t is 3.0106 remained greater than the tabulated value i.e. 2.306
at 5% level of significance. So, null hypothesis has been rejected i.e. the mean ratio of
the sampled banks differs significantly from each other in the portfolio management,
NSBIBL might have given more preference to loans and advances because they yield
higher return. Due to the greater default in payment of loans by borrowers, the bank

96
needed to hold higher portion of its income in form of loan loss provision. Therefore,
loans and advances of the bank were not effectively operated.
c) Accrued interest to total interest income ratio
Accrued Interest
Total interest income
Annex 23 shows that the ratios in NSBIBL remained 29.07%, 23.7%, 25.16%, 35.79%
and 36.62% in the respective years of the review period. Mean and CV of the ratios
came 30.07% and 17.68% respectively. In EBL, the ratios were 0%, 19.01%, 7.57%,
31.35% and 26.28% in the corresponding years. Mean of the ratios appealed 16.84%
and CV appeared 68.93%.
The ratio in NSBIBL descended in the second year as compared to that in first year and
then increased gradually in later years whereas it revealed fluctuating trend in EBL.
Mean of the ratios appeared greater in NSBIBL, which signifies that comparatively
more portion of total interest income in the bank remained accrued. Moreover, the
loans advanced by NSBIBL seemed less effective higher CV of the ratios in EBL
indicates greater variability of the ratios in it.
The calculated value of t was less than the tabulated value at 5% level of significance
(2.0716<2.306). Therefore, null hypothesis has been accepted average ratio of two
banks does not differ significantly.
In totality, the assets possessed by NSBIBL seemed less effective in the sense that the
greater default in payment occurred in them. However, sampled banks did not differ
significantly except in the case of loan loss provision to total deposit.
4.1.6 Profitability ratios
Profitability ratios have been employed to measure the operating efficiency of the
sampled banks. For the purpose return on asset, return on net worth return on total
deposit total interest expenses to total interest income ratio interest earned to total

97
asset ratio, staff expenses to total income ratio and office operation expenses to total
income ratio have been analyzed and interpreted.
a) Return on asset
Return on Net Worth = Return on Net Worth
Total Income
Annex 24 demonstrates that the ratio in NSBIBL remained 0.83%, 2.03% and 1.67%,
1.43% and 0.35% in the respective years of review period. Mean and CV of the ratios
appeared 1.26% and 47.66% respectively. Accordingly, the ratios of EBL in the
corresponding years were -2.08%, -4.27%, -1.86%, 1.76% and 1.1%. Mean of the ratios
came -1.07% and CV came -207.31%.
In NSBIBL, the ratio showed fluctuating trend. It rose astonishingly in the second year
but declined gradually and reached least i.e. 0.35% in the final year of the review
period. It means profitability position of NSBIBL remained quite poor in the last year.
In EBL it remained negative up to the third year and then tended to positive later on.
The reason of the loss in first three years may be insufficient operation or poor
utilization of the resources. Anyway, the banks made improvement in its position in the
fourth year but there appeared little slackness in the fifth year. Mean ratio was
considerably higher in NSBIBL, which signifies that the profitability position of the
bank in relation to this ratio is far better than that of EBL. CV of the ratios in EBL
exceeded the same in NSBIBL by a large amount, which indicates that the variability of
the ratios in EBL was much higher.
The calculated value of t i.e. 2.0295 was found less than tabulated value at 5% level of
significance. Hence, null hypothesis has been accepted i.e. observed difference in the4
mean ratio of the sampled banks is not significant.
b) Return on net worth
Return on Net Worth = Net Profit after Tax (NPAT)
Net Worth

98
Annex 25 depicts that the ratios in NSBIBL for the respective years of the study period
were 0.83%, 2.03%, 1.67%, 1.43% and 0.35%. Mean ratio appeared 1.26% and CV
appeared 47.66%. Om the similar way, the ratios of EBL remained -2.08%, -----4.27%, -
1.86%, 1.76 and 1.1% in the corresponding year. Mean and CV of the ratios seemed -
1.07% and -207.31% respectively.
The ratio in NSBIBL ascended dramatically in the second year as compared to that in
the first year and then slightly declined in the following dropped even low the level of
the base year. In EBL, it remained negative, for first three years of the study period and
increases satisfactorily in fourth year. But it declined slightly in the last year. Mean
ratio of NSBIBL appeared much more than that of EBL. Which indicates that the
earning of tine former with respect to the shareholder's fund is appreciably high?
Contrary to it, return on net worth of EBL appears unsatisfactory as per the mean ratio.
Higher CV of the ratios in EBL signifies that lesser uniformity in the ratio.
The computed value of t came less than the tabulated value at 5% level of significance
(2.0295<2.306). Hence, null hypothesis has been accepted profitability position of two
banks with respect to this ratio is not significantly different.
c) Return on total deposit
Return on total deposit = Net Profit after Tax (NPAT)
Total Deposit
Annex 26 exhibits that the ratios in NSBIBL remained 1.03%, 2.34%, 1.9%, 1.58% and
0.38% for the respective years of research period. Mean and CV of the ratios appeared
1.45% and 47.24% respectively in EBL, the ratios were -2.68%, -5.63,-2.34% , 2.23 and
1.29% in the corresponding years. Mean of the ratios came -1.43% and CV came -
200.38%.
The ratios in NSBIBL followed increasing trend up to the second year arid then
decreased in the coming years. The ratio in the final year arrived even below the level
of base year. In EBL, it remained negative with little fluctuation up to the third year and
then went positive later on. It declined in the last year as a compared to the preceding

99
year. Mean of the ratio was higher in NSBIBL than in EBL. It signifies that the
profitability of EBL is unsatisfactory with respect to NSBIBL the ratio is seems better in
spite of sharp decline in the final year. Future more, EBL has made noticeable
improvement in its position in the last two years. As depicted by CV analysis, the ratios
widely varied in EBI than NSBIBL.
The calculated value of t i.e. 1.9551 came less than the tabulated value i.e. 2.306 at 5%
level of significance. So, null hypothesis has been accepted, that is, there is no
significant difference between the positions of sampled banks as far this ratio is
concerned.
d) Total interest expenses to total interest income ratio
Total interest expenses
Total Interest Income
Annex 27 Highlights that the ratio of NSBIBL for the respective years of study period
remained 53.48%, 57.76%, 62.15%, 65.95 and 77.03%. Mean and CV of the ratios
appeared 63.27% and 12.72% respectively. In EBL, the ratios were 59.15%, 74.71%,
77.47%, 71.28% and 67.47% in the corresponding years means of the ratio came
70.04% and CV came 8.86%. The ratios in NSBIBL reflected rising trend, which readied
77.03% in the final year from 52.48% in the base year in EBL, it depicted increasing
trend up to the third year and then decreased in the following years. Lower mean ratio
in NSBIBL indicates better profitability position as compared to EBL. Overall picture
shows that NSBIBL is more successful in allocating the interest bearing debt in
profitable sectors. On the other hand, it is also obvious that interest spread rate is high
in the bank CV of the ratios appeared greater5 in NSBIBL, which mean that were
relatively less uniform throughout the review period.
The computed value of t i.e. 1 remained less than the tabulated value i.e. 2.306 at 5%
level of significance. Hence null hypothesis has been occupied accepted i.e. mean ratio
of the sampled banks does not differ significantly.

100
e) Interest earned to total assets ratio
= Interest Earned
Total Assets
Annex 28 exhibits that the ratios of NSBIBL remained 7.34%, 9.34%, 9.73%, 8.85% and
8.39% in the respective years of review period. Mean of the ratios appeared 8.73% and
CV appeared 9.49%. In EBL, the ratios were maintained 1.28%, 5.08%, 4.75%, 7.34%
and 7.67% in the corresponding years. Mean and CV of the ratios came 5.22% and
43.87% respectively.
In NSBIBL, the ratio showed slight fluctuation whereas in EBL, it followed rising trend
except in the third year of the study period. In NSBIBL, the ratio ranged from 7.34% in
the base year to 9.73% in the third year. In EBL, it ranged from 1.28% in the base year
to 7.67% in the last year. Mean ratio was higher in NSBIBL, which loads us to the
conclusion that NSBIBL managed the assets more effectively to earn interest.
Furthermore, interest earned to the total assets in different years of the study period
remained more uniform in NSBIBL as revealed by lower CV.
The calculated value of t appeared greater than the tabulated value at 5% level of
significance i.e. 2.8773>2.306. That's why, null hypothesis has been rejected i.e.
profitability position of two banks with respect to this ratio differs significantly it
means that the earning in form of interest in relation to the total assets remained really
poor in EBL. In other words, EBL could not manage the assets of the bank efficiently in
form of loans, advances and investment.
f) Staff expenses to total income ratio
= Staff expenses
Total Income
Annex 29 demonstrates that the ratios of NSBIBL were 2.40%, 2.2%, 2.01%, 2.46% and
3.12% in (the respective years of the study period). Mean and CV of the ratios
appeared 2.43% and 15.47% respectively. In the similar way, the ratios of EBL for the

101
corresponding years remained 70.27%, 18.22%, 13.11%, 5.52% and 10.34%. Mean of
the ratios seemed 23.49% whereas the CV seemed 107.19%.
On examining the ratios of different year in NSBIBL, it seems that staff expenses to total
income remained almost constant. But it showed sharp decrease in EBL despite slight
increase in the final year with respect to the preceding years. Mean ratio appeared
significantly higher in EBL, from this, it can be concluded that considerably large
portion of the income was spent for staff in EBL which might have affected the
profitability position of the bank adversely. In another angle, it deems more successful
to attract the efficient manpower and take the advantage of their talent. Higher level of
facilities and incentive provided to the employees raise their moral; and confidence
which reduces the labor absenteeism and turn over. On the others hand, NSBIBL
seemed to personnel. Higher CV of the ratios in EBL signifies lesser uniformity in
maintaining this ratio.
The calculated value of t i.e. 1.6651 was less than the tabulated value 2.306 at 5% level
of significance. Hence null hypothesis has been accepted i.e. observed difference in the
mean; ratio of the sampled banks is not significant.
g) Office operation expenses to total income ratio
Office operation expenses
Total Income
Annex 30 demonstrates that the ratios of NSBIBL were 26.59%, 13.98%, 11.59%,
9.67% and 9.89% in the respective years of the study period. Mean and CV of the ratios
appeared 14.34% and 44.02% respectively. The ratios of EBL remained 121.83%,
65.60%, 36.62%, 12.55% and 13.28% in the corresponding years. Mean of the ratios
came 49.98% and CV came 81.69%.
The ratios of NSBIBL seemed to decline every year up the fiscal year 2004/2005 and
rise nominally in the final year. In EBL, it sharply decreased each year except in the
final year. The ratio in the base year remained even greater than 100%. Mean ratio of
NSBIBL was considerably less than that of EBL, which means that the profitability

102
position of the bank is sound enough in comparison to EBL conversely almost half of
the total income in average was spent for office operation in EBL. It might have affected
the profitability of the bank adversely. CV analysts showed that the ratio in EBL were
less consistent as compared to that in NSBIBL.
The calculated value of t i.e. 1.7252 remained less than the t i.e. 2.306 at 5% level of
significance. Therefore, null hypothesis has been accepted i.e. mean ratio of two banks
does not differ significantly.
Overall position of NSBIBL appeared better than that of EBL. NSBIBL is more successful
in utilizing the resources effectively. But the banks did not differ significantly except in
earning interest with respect to the assets.
4.1.7 Others indicators
Besides the above- analyzed ratios, some indicators have been tested to have the
broader knowledge of financial performance of the banks. For this, EPS, DPS, TPS, DPR,
P/E ratio and MVPS to BVPS have been analyzed.
4.1.7.1 Earning per share (EPS)
= Earning Available to Common Shareholder (EAC)
No.of Equity shares Outstanding
Annex 31 depicts that the ratios in NSBIBL were 6.15, 31.58, 37.45, 49.17 and 13.97 in
the respective years of review period. Mean of the ratios was 27.66 and CV was 56.56%
similarly the ratios in EBL remained -6.58, -10.01, -9.21, 21.29 and 21.3 in the same
period. Mean of the ratios appeared 3.36 and CV appeared 437.45%.
EPS in NSBIBL depicted rising trend up to the fourth year of review period but it
dropped in the final year. The ratio remained negative in EBL for the first three years
and then remained almost same in ending years. The negative ratio in EBL is the result
of loss suffered by the bank for the period. Mean ratio was much higher in NSBIBL is
contrast to EBL, which indicates that the profitability position of the formed is far
better than that of the latter. In this sense, NSBIBL seems more successful to attract the

103
investors. CV of the ratio in EBL exceeded the same in NSBIBI by a large amount, which
shows lack of consistency in EBL in the different years.
The calculated value of t remained less than the tabulated value 2.2651<2.306 at 5%
level of significance. Hence null hypothesis has been accepted i.e. noticed difference in
average EPS of the sampled banks is not significant.
4.1.7.2 Dividend per share (DPS)
= Earning paid to Shareholder
No.of Equity shares Outstanding
Annex 32 highlights that the ratio of NSBIBL remained 0.00, 20.00, 20.01, 20.01 and 10
in the respective years of the study period. Mean and CV of DPS came 14.00 and
57.15% respectively. Accordingly, the ratios in EBL were nil for first four years and
15.00 in the final year. Mean of the ratios 3.00 and CV appeared 200%.
NSBIBI paid no dividend in the first year. Dividend per share in following three years
remained constant and in the final year it declined to almost hall of in preceding year.
But EBL did not pay dividend for first four years and in the last year it paid RS 15 per
share. Mean DPS of NSBIBL came remarkably higher in NSBIBL which signifies that
NSBIBI is more successful to win the confidence of the investors. As dividend is the
direct return received by the shareholders, they evaluate the organization paying high
dividend as the better one. This means NSBIBL can sell its shares more easily than EBL
Higher CV of the ratios in EBL depicts that income not pay dividend in the consistent
manner.
The calculated value of i.e. 2.2003 appeared less than the tabulated value i.e. 2.306 at
5% level of significance. That's why, null hypothesis has been accepted i.e. average DPS
does not differ significantly between the sampled banks.

104
4.1.7.3 Tax per share (TPS)
Tax paid to the Government
No. of Equity shares Outstanding
Annex 33 depicts that the IPS of NSBIBL in the respective years of the analysis period
remained 3.37, 12.87, 16.53, 21.36 and 7.29. Mean and CV of the ratios came 12.28 and
52.14% respectively. In the similar way, the ratios in EBL were nil for first three years
and then 0.16 and 11.37. Mean of the ratios appeared 2.31 and CV appeared 196.55%.
The ratios in NSBIBI followed increasing trend for first four years and then it declined
in the final year. In EBL, it remained nil up to the third year and it considerably
ascended in the final year. Mean ratio in NSBIBL was much higher which indicates that
it might have realized sufficiently good return from investment in contrast to EBL. As a
result, shareholders of NSBIBI have contributed more in the revenue of the country as
compared to those of EBI; CV analysis signifies that investors of NSBIBL have
contributed for the welfare of the nation more ultimately throughout the study period.
The calculated value of t was greater than the tabulated value i.e. 2.5132 >2.5132 at 5%
level of significance. Hence null hypothesis has been rejected i.e. mean ratio of the
sampled banks with respect to this indicator significantly differs. The reason behind
the significant difference might be the loss suffered by EBL for first three years of the
study period. As tax per share is the consequence of the profit, shareholders of NSBIBL
seemed to contribute more than the shareholders of EBL.
4.1.7.4Dividend payout ratio (DPR)
= DPS
EPS
Annex 34 highlight that the ratios in NSBIBL remained 0.00%, 63.33%, 53.43%, 40.7
and 71.58% in respective years of the study period. Mean DPR and CV appeared
45.81% and 54.83% respectively. Same indicator in EBL were nil for first three years
and then 0.16 and 11.37. Mean of the ratios appeared 14.08 and CV appeared 200%.
105
The indicator in NSBIBL remained nil in the beginning year and showed decreasing
trend from second to the fourth year. In the last year, it reached highest. In EBL, the
indicator was nil for first four years and 70.42% in the final year Mean DPR appeared
greater in NSBIBL, which signifies that it distributed comparatively more proportion of
dividend out of its earning. In other words, it remained more successful of attract the
investors. CV of the indicators came much higher in FBI, which indicates that dividend
payout for different years of the period was more variable.
The calculated value of t remained less than the tabulated value at 5% level of
significance i.e. 1.6813<2.306. Therefore, null hypothesis has been accepted i.e. mean
DPR of two banks does not differ significantly.
4.1.7.5Price-earnings ratio
MVPS
EPS
Annex 35 depicts that P/E ratios of NSBIBL for the respective year of the study period
were 83.25, 13.05, 11.00, 8.95 and 40.23 Mean of the ratio: came 31.3 and CV came
90.64%. Similarly, the ratios of EBL were 0.00, -12.19, -13.79, 8.64 and 19.11 in the
corresponding years of the period Mean of the ratios appeared 0.35 and CV appeared
3526.64%.
The ratios in NSBIBL did not reveal particular direction of change. The ratios in the
first year remained very high as compared to the rest of the years. In EBL, it remained
negative up to the third year of the study period. Then it went positive and increased
gradually later on. Mean ratio of NSBIBL appeared significantly higher which mean the
investors are well satisfied with the performance of the bank. In other words, market
has positively judged the performance of NSBIBI higher CV of the ratios in EBI
indicates that the ratio varied widely in the bank.
The calculated value of t war, loss than time tabulated value at 5% level of significance
i.e. 1.997<2.306. So, null hypothesis has been accepted i.e. mean P/E ratio of the
sampled banks does not differ significantly.
106
4.1.7.6Market value per share to book value per share (MVPS/BVPS)
MVPS
BVPS
Annex 36 exhibits that the indicators in NSBIBL for the respective years of the study
period arrived 4.41, 3.15, 2.51, 2.01 and 2.1. Mean and CV of the indicators appeared
2.84 and 31.17 respectively. Same indictors of EBL were 0.00, 3.38, 3.98, 1.70 and 3.32
for the corresponding years. Mean of the ratio came 2.48 and CV come 58.6%.
The indicator in NSBIBL depicted decreasing trend up to the fourth year of study
period and then slightly rose in the final year. In EBL, it did not reveal any particular
direction of change. Mean value of the indicators appeared greater in NSBIBL, which
indicates comparatively stronger management and organization in NSBIBL than in
EBL. CV of the indicators came less in NSBIBL, which means me indicator, varied less
over the period of study.
The calculated value of t war, loss than time tabulated value at 5% level of significance
i.e. 1.997<2.306. So, null hypothesis has been accepted i.e. mean MVPS/BVPS ratio of
the sampled banks does not differ significantly.
Hence, null hypothesis has been accepted mean value of the indicators does not differ
significantly between the sampled banks. Other indicators show that the performance
of NSBIBI is better than that of EBL But the banks did not seem to differ significantly
except in the; case to tax per share.
4.2 Income and Expenditure Analysis
Income and expenditure analysis evaluates major sources of income and expenses.
Tines help the analyst to conclude the areas to be focused for investment and tin
possibilities for affective control over expenses. The analysis cover is the followings.
Income analysis
Expenditure analysis

107
4.2.1 Income analysis
Commercial banks generate income form the investment made in various sectors. The
banks, being service-oriented organizations, do not produce physical goods they
produce loans and advances and innovations and sell the same. In the courses of
carrying out their functions, they receive income form various sources which been split
up into the following major headings.
- Interest
- Commission and discount
- Foreign exchange fluctuation income
- Other income
a) Interest income
Interest is the main and major source of income in the commercial banks. These banks
charge interest on loan and advances provided by thorn they also receive interest form
investment made in government securities, debentures and inter- bank lending.
Annex 37 shows that interest income in NSBIBL remained 77.03%, 86.41%, 89.18%,
87.76% and 89.18% in the respective years of study period. Interest income ranged
from 77.03% in the first year to 89.18% in the last. In each year, more than three-
fourth of the income was occupied by the interest.
Annex 38 depicts that the interest income in EBL registers 96.62%, 82.55%, 85.72%,
74.83% and 80.17% over the study period form the fiscal year 2004/2005 to
2008/2009 respectively. Interest income ranged from 74.83% in the fourth year of the
study period to 96.62% in the beginning year. It showed slightly fluctuating trend. In
each year, interest income seemed to cover almost four-fifth of the total income. Hence,
interest income remained dominant in the total income.
Average of the income appeared 85.91% and 83.91% in NSBIBL and EBL respectively.
It indicates that the average interest covered slightly greater proportion in NSBIBL. In
other words, NSBIBL might have focused more of its activities towards the lending and
the investment in government securities. Due of interest income came 5.31% in

108
NSBIBL and 8.64% in EBL. It signifies that interest income remained more uniform in
NSBIBL.
b) Commission and discount
Commercial banks render various types of services to their customers. They provide
remittance facility, guarantees, standing instructions, open letter of credit, purchase
and discount bill of exchange along with other agency functions for making such
facilities available, they receive certain charges in form of commission in and discount.
It also covers significant portion of total income.
Annex 37 depicts that commission and discount earned by NSBIBL in the respective
years of the study period remained 9.98%, 5.48%, 6.64%, 5.31%, 6.01%. In the first
year it stood slightly more as compare to the references ranged between 5% and 10%
in all the year of the period.
Annex 38 deposits that the commission and discount earned by EBL in the respective
years of the study period remained 2.45%, 4.35%, 5.36%, 10.58% and 10.74%
respectively form 2004/2005 to 2008/2009. It ranged form 2.45% in the first year to
10.74% in the final year. It revealed increasing trend throughout the study period.
Average of the income in NSBIBL and EBL remained 6.68% and 6.7% respectively. It
signifies that commission and discount covered almost same proportion in the total
income of both of the banks. CV of the incomes in NSBIBL came 25.64% whereas it
came 50.32% in EBL. This shows that the proportion commission and discount in total
income remained less uniform in EBL.
c) Foreign exchange fluctuation income
One of the major functions of the commercial bank is transaction of foreign currency.
Joint venture banks are allowed to purchase and sell foreign currencies under the
directives of NRB and rules, regulations and laws in effect. Income under this heading
encompasses them trading gain derived form the exchange of foreign currencies due to
the fluctuations in the exchange rate.

109
Annex 37 depicts that the foreign exchange fluctuation income shared 0.34%, 2.19%,
0.02, 5.05% and 4.41% of total income of NSBIBL in the respective year of the study
period. Proportion of this income remained least in the year 2006/2007 and most in
2007/2008. In the latter years, this income seemed to contribute more as compared to
the previous years.
From the annex 38, the income of EBL appeared 0.66%, 4.91%, 1.80%, 1.72% and 1.44
from the year 2004/05 to 2008/2009 respectively. The percentage of income showed
fluctuation over the years. Minimum percentage of income was noticed in the year
2004/2005, whereas the maximum percentage in 2005/2006.
On the average, income remained 2.40% in NSBIBL and 2.11% in EBI. From this result,
it can be concluded that foreign exchange fluctuation income occupied comparatively
greater portion in NSBIBL. The income in various years remained more uniform in EBL
as depicted by lower CV i.e. 69.27 %< 85.35%.
d) Other income
Income not included in any of the above heading comes under this heading. Other
income comprises revaluation gain and non-operating income such as dividend.
Annex 37 highlight that other income in NSBIBL in the respective years of the study
period recorded 12.65%, 5.92%, 5.62%, 1.88% and 0.40%. The income in different
years of the study period revealed declining trend. It sharply decreased from 12.65%
in the first year to 0.40 in the last year.
From the Annex 38, other income in EBL appeared 0.27%, 8.19%, 7.12%, 12.05% and
7.65% in the respective years of the period. It remarkably rose in the second year and
then slightly fluctuated in the latter years. In the bank, income under this heading has
also covered significant portion.
Mean of the incomes in NSBIBL came 5.02% and 7.22 in EBL. Greater mean in EBL
signifies that other income contributed slightly more portion of total income. CV of the

110
incomes remained higher in NSBIBL (85.22%>55.83).EBL in the income received turn
this source appeared less consistent in NSBIBL.
4.2.2 Expenses analysis
Expenses are the cost incurred in course of operating various activities the banks need
to pay interest for the deposits and borrowings to handle all other resources, there is a
term of per4sonnel whom the bank pays lagans and provide other facilities. Besides, a
significant portion of income is spent for daily operation. For the study purpose
evaluation of the following form of expenses been made.
Interest expenses
Staff expenses
Office operation expenses
Bonus facility
a) Interest expenses
It is one of the major parts of operation expenses. Commercial banks pay interest on
various types of deposit, loans and advances taken from other banking and financial
institution, government etc. Since transfer of the money from the excess units to the
deficit units is the significant function of the commercial banks, interest occupies more
than three fourth of the total operating expenses.
Annex 39 depicts that interest expenses remained 56.57%, 72.31%, 77.55%, 80.17%
and 89.18% in the respective years of the study period in NSBIBL. Interest expenses
showed rising trend over the period. It ranged from 56.57% in the first year to 89.18%
in the last. It shows the increasing success of the bank, to attract the deposit loans and
advances.
AS observed in Annex 40, the interest expenses out of total expenses in EBI recorded
22.05%, 42.29%, 57.17%, and 72.76% respectively from 2004/05 to 2008/2009. The
proportion of expenses showed increasing trend up to the fourth year and slightly
declined in the final year of study period. In each year, it remained dominant and the
highest percentage reached in the fourth year.

111
Mean of the interest expenses in NSBIBL and EBL appeared 75.34 % and 53.08%
respectively. This shows that interest expenses covered more portions in NSBIBL as
compared to that in EBL and CV of the expenses came 12.77% in NSBIBL, whereas it
came 35.21% in EBL. It signifies that interest expenses in the total mix of the operation
expenses remained more consistent in NSBIBL.
b) Staff expenses
In any organization, manpower plays vital role in the success of failure so that
organization. Well-motivated staffs are the ornaments of the organization. In return of
the service provided by them, they need to be paid remuneration which is included
under this heading. Staff expenses; include salary, different, forms of allowances
incentives, fringes benefits etc.
Annex 39 reveals that the staff expenses in NSBIBL remained 3.27%, 3.19%, 2.81%,
3.41% and 5.32% in the respective years of the study period. It ranged from 2.81% in
the third year to 5.32% in the final year of the study period. It showed declining trend
up to the third year and then increased later on.
From the Annex 40 it is seen that the staff expenses in EBL were 28.15%, 12.55%,
11.29%, 7.49% and 8.08% respectively form the year 2004/05 to 2008/2009 it
occupied significantly high portion of total expenses in the first year and the mean
gradually up to the fourth year. In the final year, it slightly grows on.
Average of the staff expenses came 26.5% and 13.51% in NSBIBL and EBL respectively
it means the proportion of staff expenses in EBL, was more than four times the same in
NSBIBL. From the staff point of view, EBL seems more attractive but NSBIBL seems
more efficient in its operation. CV of the expenses appeared 25.64% and 55.96% in
NSBIBL and EBL respectively. Hence, the ratio of staff expenses to total expenses
varied more in EBL.
c) Office operation expenses
For the routine work of the commercial banks, considerable amount of expenses in
incurred. All the expenses made for the operation of the bank such as rent, hire,

112
telephone charge, electricity charge, administrative expenses etc come under this
heading. Generally, these expenses occupy second major portion in the composition of
total expenses.
Annex 39 reveals that the office operation expenses in NSBIBL remained 36.52%,
20.25%, 46.22%, 43.40% and 49.35% in the respective years of the study period. It
showed increasing trend over the period. It increased to 49.35% in the last year from
36.52% in the beginning year. In other words, the efficiency of the bank increased
latter year.
Annex 40 shows that the office operation expenses covered 48.8%, 45.16%, 31.54%,
17.02% and 17.59% in the respective years of the review period in EBL. In the first
year, it reached almost half of the total expenses. But, in the latter years, it gradually
decreased in spite of the marginal increase in the last year. The trend of the expenses
shows that the bank gradually improved its operational efficiency.
Mean expenses came 16.5% and 32.02% in NSBIBL and EBL respectively. Lower mean
expenses in NSBIBL signifies that it is more successful to perform its operation
efficiently, CV of the expenses appeared higher in NSBIBL (85.35%>41.61%) which
means it maintained less consistency in making office operation expenses over the
study period.
d) Bonus facility
When the bank earns profit, dividend is paid to the owners. Similarly, a part of the
profit is paid to the staff as bonus, which is as the rewar4d for their service. Generally,
staffs prefer that bank which pays greater percentage of bonus. It acts as the motivator
for them but it increases the volume of operating expenses.
Annex 39 shows that NSBIBL spent 3.64%, 4.25%, 3.42%, 3.02% and 5.2% respectively
for staff bonus. The bonus showed fluctuating trend in the period, it ranged from
3.02% in the fourth year to 5.2% in the last year. The bonus expenses dropped to low
level in the final year because of decreased profit in the year.

113
Annex 40 depicts that expenses for bonus in EBL remained 0%, 0.75%, 1.50%, 2.73%
and 3.2% in the respective years of the study period. The bank could not pay bonus for
first years because loss suffered by it. In the last four years its expenses came 912.5%
and 1.08% in NEBIBL and EBL respectively. It reveals that NSBIBL is more efficient in
updating and encouraging its staff CV of the expenses appeared 85.22% in NSBIBL
whereas it appeared 122.50% in EBL. It signifies that NSBIBL paid bonus to its staffs
more consistently as compared to EBL.
4.3 Correlation Analysis
It is a useful statistical for measuring the intensity of the magnitude of linear
relationship between two series. Karl Pearson's coefficient of correlation is most
common and useful tool to measure the relationship between two variables in the
bank. The correlation coefficient (r) between two variables X and Y can be obtained by
using following formula.
r = √𝑛𝑋𝑌−𝑋𝑌
𝑛𝑋2− (𝑋)2 √𝑌2−(𝑌)2
Where,
n = Number of observations in series X and Y
∑X= Sum of observations in series X
∑Y = Sum of squared observations in series Y
∑X² = Sum of squared observations in series X
∑Y² = Sum of squared observations in series Y
∑XY = Sum of the product of observations in series in X and Y
Here, r = 1 implies that two variable are positively and perfectly correlated.
r = -1 implies that two variable are negatively and perfectly correlated
r = 0 does not necessarily mean that the variable are independent. They may,
however, be related in some other form such as quadratic, logarithm or exponential.
Under the correlation analysis, the intensity of linear relation between the following
variables has been measured.

114
Total deposit and net profit
Performing assets and net profit
Net worth and net profit
Total deposit and investment
Total deposit and loans and advance
EPS and MVPS
DPS and MVPS
DPR and MVPS
a) Correlation analysis between deposit and net profit
Annex 41 shows that the coefficient of correlation and probability distribution of
correlation coefficient between total deposit and net profit in NSBIBL 0.3295 and
0.2689 in the review period respectively correlation coefficient less than six times the
probable error4 i.e. 0.3295<6 x 0.2689. It deposit and net profit of the bank are
positively correlated but the correlation is not highly significant.
Annex 42 depicts that the coefficient of correlation and probable error of the
coefficient between the same variables in EBL were 0.8847 and 0.0655 respectively.
Correlation coefficient came greater than six times the probable error i.e. 0.8847>6 x
0.0655, 11 implies that the total deposit and net profit in the bank are highly and
positively correlated in other word, net profit of the bank increases almost to the same
degree with increase in the amount of deposit.
Between two banks, EBL seems more efficient regarding the utilization of the deposit
for income generating purpose as revealed by greater coefficient of correlation in EBI.
In the review period, net profit of EBL seemed to increase in line with increase in
deposit that's why; it retains potentiality of increasing net profit by accumulating more
despite.
b) Correlation between performing assets and net profit
Annex 43 highlights that the coefficient of correlation and probable error of the
coefficient between performing assets and net profit in NSBIBL remained 0.4754 and

115
0.2335 respectively correlation coefficient came less than six times the probable error
i.e 0.4754>0.2335. It signifies that the net profit and performing assets of the bank are
positively related, however, the correlation is not much significant. Band can raise its
net profit by investing the fund in performing assets but the increase in the profit will
mot is proportionate to the increase in the performing assets.
Annex 44 depicts that the coefficient of correlation and probable error of the
coefficient between performing assets and net profit in EBL were 0.9081 and 0.0529
respectively. Correlation coefficient appeared greater the six times the probable error
i.e. 0.9081<0.0529. It indicates that the net profit and performing assets of the bank are
highly and positive related. Furthermore, the bank can raises its net profit by
increasing the performing assets.
From the above analysis, there seems a significant correlation between the performing
assets and net profit in EBL whereas a low degree of correlation in NSBIBL. It means
EBL can gear its profitability in greater speed by raising ice volume of performing
assets.
c) Correlation between net worth and net profit
Annex 45 shows that the correlation coefficient and probable error of correlation
coefficient between net worth and net profit in NSBIBL remained 0.0504 and 0.2948
respectively. Correlation coefficient appeared less than probable error. Hence it
implies that the relation between net worth and net profit the bank is very poor i.e.
there does not seem specific relationship.
From the Annex 46 the correlation coefficient and probable error of correlation
coefficient between net worth and net profit in EBL, seems 0.9695 and 0.0181
respectively. Coefficient of correlation appeared greater than six times the probable
error i.e. 0.9695>6 x 0.0181 it implies that the correlation between the stated
components is positive at significant level. Net profit in the bank seems to rise almost
to the same degree as rise in the net worth.

116
On comparing two banks, net profit in EBL seemed two rises continuously with
increase in the amount of net worth. In other words, EBL is successful to utilize the
investors fund more prudently and effectively to realize the return. Therefore EBL
retains the capacity of uplifting the net profit by increasing the net worth contrast,
poor relation is observed between net worth and net profit in NSBIBL.
d) Correlation between total deposit and investment
Annex 47 depicts that the coefficient of correlation and probable error of correlation
coefficient between total deposit and investment in EBL remained 0.993 and 0.0042 in
the study period. Correlation coefficient came less than six times the probable error
i.e.0.993< 6 x 0.0042. It signifies that a positive relation occurs between the two
components but the degree of relation is not much significant.
From the Annex 48, the coefficient of correlation and probable error of coefficients
between the variable in NSBIBL are seen 0.9968 and 0.0019 respectively. Coefficient of
correlation came greater than six times the probable error i.e. 0.9968<6 x 0.0019. It
indicates that the correlation between total deposit and investment of the bank are
correlated at significant level. With the increase in the amount of deposit, investment
of the bank seems to increase between the two banks, it seems that NSBIBL allocated
greater portion of the fund collected form depositors in investment. In contrast, it
seems that investment of EBL increased or decreased in slow pace with respect to the
increase or decrease in the deposit.
e) Correlation between total deposit and loans and advances
Annex 49 depicts that the coefficient of correlation between the total deposits and
loans and advances in EBL remained 0.9964 whereas the probable error of coefficient
remained 0.0022 Correlation coefficient appeared greater than six times the probable
error i.e. 0.9964> 6 x 0.0022 It implies that the correlation between deposit and loans
and advances of the bank is highly positively. Loans and advance seem to rise with the
rise with the rise in the volume of total deposit.

117
Annex 50 shows that coefficient of correlation between the total deposits and loans
and advances in NSBIBL remained 0.941, whereas the probable error of coefficients
remained 0.030 correlation coefficient came greater than six times; the probable error
i.e. 0.941> 6 x 0.030. It signifies that the deposit and loans and advance of the bank are
positively correlation at significant. The bank may raise the volume of loans advances
with rise in the volume of total deposit.
From the above analysis, high degree of correlation seems to occur between loans and
advance and total deposit in both of the banks. Both other seems increase or decreases
the investment. In loan and advances portfolio with increase and decrease in the
deposit.
f) Correlation between EPS and MVPS
Annex 51 highlight that lays correlation coefficient and probable error of coefficient
between EPS and MVPS in NSBIBL were -0.7701 and 0.1228 respectively throughout
the study period. Correlation coefficient appeared greater than six times the probable
error I .e -0.7701 >6 x 0.1228 It means MVPS and EPS of the bank are negatively
correlated at significant level. In other words, market price of share seems to fall with
increase in the earning per share.
Annex 52 depicts that the correlation coefficient and probable error of the correlation
coefficient between EPS and MVPS in EBL were 0.75682 and 0.1236 in the respective
order. It signifies that EPS and MVPS of the bank are positively correlated moreover;
market price of the share seems to increase with the increase in earnings per share
thought the degree.
The result of correlation seems contradictors between the two banks, the correlation
between EPS and MVPS seemed negative in NSBIBL, which is quiet illogical and absurd.
This is purely mechanical interpretation and does not consider other influencing
factors. But various other factors are affecting in the real market. Besides, market price
of the share changes because of signaling factors. On the other hand, market price of
this share in NSBIBL seems to increase with increase in EPS.

118
g) Correlation between DPS and MVPS
Annex 53 shows that coefficient of correlation and probable error of the coefficient
between DPS and MVPS in NSBIBL were -0.7682 and 0.1236 respectively. Coefficient of
correlation came greater than six times the probable error i.e. 0.7682>6 x 0.1236. From
the result, it can be concluded that correlation between DPS and MVPS is highly
negative with the decrease in DPS, MVPS seems to increase.
Annex 54 shows that correlation coefficient and probable error coefficient between the
stated variable remained respectively -0.1175 and 0.2975. in EBL. Correlation
coefficient came greater than six times the probable error i.e. -0.1175 > 0.2975. It
implies that correlations between DPS and MVPS are highly positive in the bank.
Moreover, market price per share per share seems to increase with respect to the
increase in dividend per share.
From the above analysis, the relation between DPS and MVPS seems completely
conflicting between two banks. In EBL, MVPS appears to use along with increase in
DPS. Present and potentials investors of the bank are responding positively for the
dividend per share. But MVPs seems to fall with rise in DPS of NSBIBL, which is
generally illogical. The result observed in NSBIBL may simply be confidential or the
result of signaling factors.
h) Correlation between DPR and MVPS
Annex 55 depicts that the coefficient of correlation between DPR and MVPS in NSBIBL
remained -0.1175 whereas probable error of the correlation coefficient remained
0.2975. Correlation coefficient came to less than the probable error i.e. 0.1175<0.2075,
which indicates that the calculated value of coefficient is not significant. Hence market
value of the share seems to change independently with DPR.
Annex 56 depicts that the coefficient of correlation and probable error of coefficient
between DPR and MVPS in EBL remained 0.5629 and 0.2061 respectively. The result
indicates that DPR and MVPS are positively correlated but the degree of correlation is
not highly significant.
119
Above analysis signifies that DPR seems to render no effect on the market price of the
share in NSBIBL whereas it seems to affect the MVPS of EBL to some extent. In other
words, potential shareholders of NSBIBL seem to invest in the shares of NSBIBL
without considering dividend payout ratio but the investor of the EBL seem to consider
DPR to some extent at the time of investment.
4.4 Least Square liner Trend Analyses
Trend analysis is very useful to predict the future events on the basis of the past
tendencies. This method is based on the assumption that past tendency continues in
the future.
The future trend of any variable is forecasted using the equation,
Where,
Yc = the dependent variable
a = Y-intercept
b = the slope of trend hue
X = Year-2002/2003 (with regard to the date used in the study). The normal
equations on fitting the trend equation are;
∑Y = Na + b∑X
∑XY = a ∑X + b∑X²
∑X = 0, a = Y
N , b =
XY
X2
With the help of trend equation, future value of the following variable for coming five
year, have been predicated.
Total deposit
Net worth
Total investment
Loans and advance
EPS

120
MVPS
a) Least square linear trend of total deposit
Annex 57 depicts that a i.e. y-intercept and b i.e. slope of the trend line of the total
deposit in NSBIBL appeared Rs 2564774.88 and 944825.99 thousands respectively.
Throughout the review period, total deposit showed increasing trend on an average,
total deposit increased by Rs 944825.99 per year in the past period.
Therefore, trend equation of the total deposit is.
Yc = 2564774.88 + 944825.99 X
On the basis of trend equation, forecasted total deposit for coming five years would be
Rs 4500252.85, 5600178.84, 7288904.83, 8100730.82 and 9178510 thousand
respectively.
Table, 4.1
Deposit Forecasting of NSBIBL & Everest Bank
Year NSBIBL Everest Bank Average
2009/2010 4500252.85 2112002.95 3306127.9
2010/2011 5600178.84 2511532.84 4055855.84
2011/2012 7288904.83 3051564.73 5170234.78
2012/2013 8100730.82 3507346.62 2158710.22
2013/2014 9178510 3063128.51 6120819.25
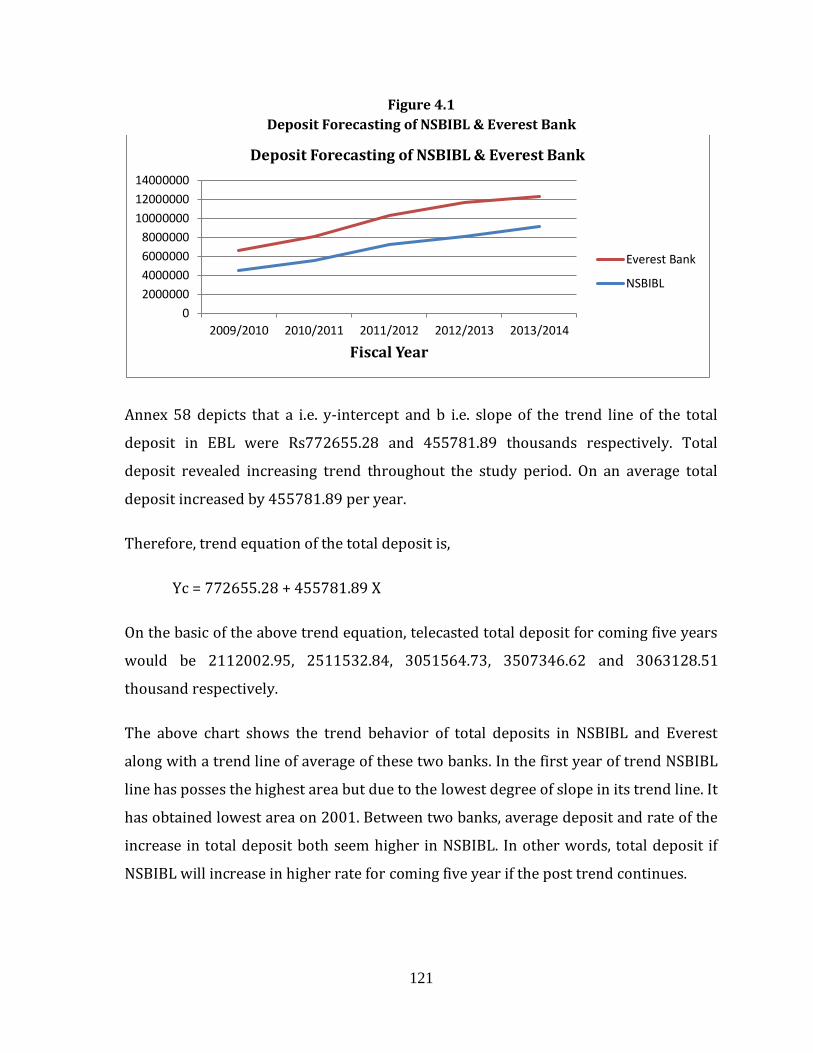
121
Figure 4.1
Deposit Forecasting of NSBIBL & Everest Bank
Annex 58 depicts that a i.e. y-intercept and b i.e. slope of the trend line of the total
deposit in EBL were Rs772655.28 and 455781.89 thousands respectively. Total
deposit revealed increasing trend throughout the study period. On an average total
deposit increased by 455781.89 per year.
Therefore, trend equation of the total deposit is,
Yc = 772655.28 + 455781.89 X
On the basic of the above trend equation, telecasted total deposit for coming five years
would be 2112002.95, 2511532.84, 3051564.73, 3507346.62 and 3063128.51
thousand respectively.
The above chart shows the trend behavior of total deposits in NSBIBL and Everest
along with a trend line of average of these two banks. In the first year of trend NSBIBL
line has posses the highest area but due to the lowest degree of slope in its trend line. It
has obtained lowest area on 2001. Between two banks, average deposit and rate of the
increase in total deposit both seem higher in NSBIBL. In other words, total deposit if
NSBIBL will increase in higher rate for coming five year if the post trend continues.
0
2000000
4000000
6000000
8000000
10000000
12000000
14000000
2009/2010 2010/2011 2011/2012 2012/2013 2013/2014
Fiscal Year
Deposit Forecasting of NSBIBL & Everest Bank
Everest Bank
NSBIBL

122
1) Lest square linear trend of loans and advances
Annex 59 highlights that a i.e. o y-intercept and b i.e. slope of the trend line of the loans
and advances in NSBIBL were Rs 1755578.28 and Rs 579192.07 thousands
respectively. Throughout the review period, loans and advance revealed increasing
trend. On an average, loans and advances increased by Rs 579192.07 thousands per
year in the past period.
Therefore, trend equation of the loans and advances is
Yc = 1755578.28 + 579192.07 X
As per the trend equation obtained above, forecasted loans and advances for coming
five years would be Rs 3493154.49, 4072346.56, 4651538.63, 5230730.70 and
5809922.77 thousands respectively.
As shown by Annex 60, a i.e. Y- Intercept and b i.e. slope of the trend line of loan and
advances are EBL were Rs. 521606.90 and 351199.62 thousands respectively. In the
study period loans and advances revealed increasing trend and the rate of increase was
Rs 351199.62 thousands per year.
Therefore, trend equation of the loans and advances is,
Yc = 5216606.90 + 351199.62
On the basic of the above trend equation, forecasted loans and advances for coming
five years would be Rs 1575205.76, 1926405.38, 2277605.00, 2628804.62 and
2980004.24 respectively.

123
Table 4.2
Forecasting of Loan and advance
(Amount in Rs .)
Years NSBIBL Everest Bank Average
2009/2010 3382040.49 1575205.76 2534180.26
2010/2011 4072346.56 1926405.38 2999375.97
2011/2012 4651538.63 2227605 346571.815
2012/2013 5230730.7 2628804.62 3929767.66
2013/2014 5809922.77 2980004.24 4394962.505
Figure 4.2
Forecasting of Loan and advance
The above chart shows the trend behaviors of loans and advances in NSBIBL Everest
bank along with a trend line of average of these two banks. Between two banks average
loans and advances and rate on increase the increase both seem higher in NSBIBL. In
other words, loan and advances will increase with higher rate in NSBIBL for coming
five years if the past trend continues.
b) Lest square linear trend of investment
As depicted by Annex 61 a i.e. y-intercept and b i.e. slope of trend line of investment in
NSBIBL remained Rs 337554.89 and 64755.00 respectively. Throughout the study
period, investment of the bank showed increasing trend. It increased by an average
amount of Rs 64755.03 thousand per year.
0
2000000
4000000
6000000
8000000
10000000
2009/2010 2010/2011 2011/2012 2012/2013 2013/2014
Fiscal Year
Forecasting of Loan and advance
Everest Bank
NSBIBL

124
Therefore, trend equation of investment is,
Yc = 337554.98 + 64755.03 X
On the basis of above trend equation, forecasted investment of NSBIBL for coming five
years would be Rs. 531820.07, 596575.10, 661330.13, 726085.16 and 790840.19
thousands respectively.
Annex 62 depicts that a i.e. y-intercept and b i.e. slope of trend line of investment in
EBL were Rs 163924.61 and 50681.87 thousands respectively. Investment of the bank
showed increasing trend throughout the study. It increased by an average amount of
Rs 50681.87 thousand per year.
Therefore, trend equation of investment is,
Yc = 163924.61 + 50681.87 X
As per the trend equation obtained above, forecasted investment of the bank for
coming five years would be Rs 315970.22, 366652.09, 417332.00, 468015.83 and
518697.70 thousand respectively.
Table 4.3 Trend value of Net worth
(Amount in Rs.) Year NSBIBL Everest Bank Average
2009/2010 355856.27 173522.7 264689.985
2010/2011 402724.65 206524.41 304624.53
2011/2012 449559.03 239526.12 2367561.075
2012/2013 496461.41 272527.83 384494.62
2013/2014 540332.79 305529.54 179931.165

125
Figure No. 4.3 Trend Value of Net Worth
The above chart shows the trend behaviors of Investment in NSBIBL and Everest bank
along with a trend line of average these two banks. On comparing two banks average
investment and rate of the increase in total investment both appear higher in NSBIBL.
It means investment will increase in higher rate in NSBIBL for coming years if past
trend continues
c) Lest square linear trend of net worth
Annex 63 highlights that a i.e. y-intercept and b i.e. slope of trend line of net worth in
NSBIBL remained Rs 215251.18 and 468683.38 thousands respectively. Net worth
revealed increasing trend in review period. Average rate of increase in the amount of
net worth came Rs 46868.38 thousands per year.
Hence, trend equation of net worth is
Yc = 21525.13+46868.38X
From the trend equation obtained above, forecasted net worth for coming five years
would be Rs 355856.27, 402724.65, 449559.03, 496461.41 and 540332.79
respectively.
0
200000
400000
600000
800000
1000000
2009/2010 2010/2011 2011/2012 2012/2013 2013/2014
Fiscal Year
Trend value of Net worth
Everest Bank
NSBIBL

126
From the Annex 64 a i.e. y-intercept and b i.e. slope of trend line of net worth in EBL
seems Rs 74517.57 and 33001.71 thousand respectively. Net worth amount of Rs.
33001.71 thousand per year.
Therefore, trend equation of net worth is,
Yc = 74517.57 + 33001.71 X
On the basic of trend equation obtained above, the forecasted net worth of EBL for
coming five years would be Rs 173522.7, 206524.41, 239526.12, 272527.83 and
305529.54 respectively.
Table 4.4 Forecasting of Investment
(Amount in Rs.) Year NSBIBL Everest Bank Average
2009/2010 531820.07 315970.22 423895.145
2010/2011 596575.10 366652.09 481612.95
2011/2012 661330.13 417332.00 539331.565
2012/2013 726085.16 468015.83 597050.495
2013/2014 790840.19 518697.70 654768.945
Figure No. 4.4 Forecasting of Investment
0
500000
1000000
1500000
2009/2010 2010/2011 2011/2012 2012/13 2013/2014
Fiscal Year
Forecasting of Investment
Everest Bank
NSBIBL

127
The above chart shows the trend behaviors of net worth in NSBIBL and Everest bank
along with a trend line of average of these two banks. On observing the past trend, both
average and rate of increase of net worth seems higher in NSBIBL. Therefore, net
worth of NSBIBL will increase in higher speed for coming year of trend of past trend
continues. Least square linear trend of net profit
Annex 65 depicts that a i.e. y-intercept and b i.e. slope of trend line of net profit in
NSBIBL were Rs 33182.05 and 3986.91 thousands respectively. Throughout the study
period, net profit showed increasing trend. It increased by the rate of Rs 3986.91
thousands per year.
Therefore, trend equation of net profit is
Yc = 33182.05+ 3986.61 X
On the basis of trend equation obtained above, the forecasted net profit for coming five
years would be Rs 45142.78, 40130.69, 53117.60, 57104.51 and 61051.42 thousands
respectively.
As shown by Annex 66 a i.e. y-intercept and b i.e. slope of trend line net profit in EBL
were Rs 5131.75 and 9299.63 thousands respectively. Net profit showed increasing
trend throughout the study period. It increased by Rs 9299.63 per year.
Therefore, trend equation of net profit is,
Yc = 5131.75+9299.63 X
As per the trend equation obtained above, forecasted net profit of the bank coming five
year would be Rs 33030.64, 42330.27, 51629.90, 60929.53, 70229.16 thousands
respectively.

128
Table 4.5 Forecasting of Net Profit
(Amount in Rs.) Year NSBIBL Everest Bank Average
2009/2010 45142.78 33030.64 39087.21
2010/2011 40130.69 42330.27 41230.48
2011/2012 53117.60 51629.90 52372.75
2012/2013 57104.51 60929.53 59017.02
2013/2014 610501.42 70229.16 340365.29
Figure No. 4.5 Forecasting of Net Profit
The above chart shows the trend behaviors of net profit in NSBIBL and Everest bank
along with a trend line of average of these two banks. Between two banks, average of
net profit appeared higher in NSBIBL but the rate of increase appeared higher more in
EBL. If this trend continues, net profit of EBL will exceed that of NSBIBL after three
years i.e.2005/2006 onwards.
d) Least square linear trend of EPS
Annex 67 shows that a i.e. y-intercept and b i.e. slope of trend line of EPS in NSBIBL
were Rs 27.66 and 3.32 respectively. EPS revealed increasing trend throughout the
study period. It increased with the rate of Rs 3.32 per year.
0
20000
40000
60000
80000
100000
120000
140000
2009/2010 2010/2011 2011/2012 2012/2013 2013/2014
Fiscal Year
Forecasting of Net Profit
Everest Bank
NSBIBL

129
Hence, trend equation of EPS is
Yc = 27.66+ 3.32X
On the basic of trend equation obtained above, forecasted EPS of NSBIBL for coming
five years would be Rs 37.62, 40.94, 44.26, 47.58 and 50.90 respectively.
As shown by Annex 68 a i.e. y-intercept and b i.e. slope of trend of EPS in EBL were Rs
3.378 and 3.72 respectively. EPS revealed increasing mean and the period of study. It
increased with the rate of Rs 2.72 per year.
Therefore, trend equation of EPS is
Yc= 3.378+ 3.72X
As per the trend equation obtained above, forecasted EPS of EBL for coming five years
would be Rs 14.54, 18.26, 21.98, 25.70 and 29.42 respectively.
Table 4.6 Forecasting of EPS
(Amount in Rs.) Year NSBIBL Everest Bank Average
2009/2010 37.62 14.54 26.08
2010/2011 40.94 18.26 29.6
2011/2012 44.26 21.98 32.12
2012/2013 47.58 25.70 36.64
2013/2014 50.90 29.42 40.16

130
Figure No. 4.6 Forecasting of EPS
The above chart shows the trend behaviors of earning per share in NSBIBL and Everest
Bank along with a trend line of average of these two banks. Between two banks,
average EPS appeared much higher in NSBIBL but rate of increase was slightly greater
in EBL. Therefore, EPS of NSBIBL will be higher in coming five years if past trend
continues.
e) Lest square linear trend of MVPS
Annex 69 depicts that a i.e. y- intercept and b i.e. slope of trend line of MVPS in NSBIBL
remained Rs 467.60 and 12.80 respectively. MVPS revealed increasing trend
throughout the period of study. It increased with the rate of Rs 12.8 per year.
Therefore, trend equation of MVPS is,
Yc = 467.60 + 12.80X
On the basic of trend equation obtained above, forecasted MVPS of NSBIBL for coming
five years would be Rs 506, 518.8, 531.6, 544.40 and 557.2 respectively.
As depicted by Annex 70, a i.e. y-intercept and b i.e. slope of trend line of MVPS in EBL
were Rs. 168 and 87.6 respectively. MVPS showed increasing trend over the period of
study. It increased by the amount is Rs 87.6 per year.
0
20
40
60
80
100
2009/2010 2010/2011 2011/2012 2012/2013 2013/2014
Fiscal Year
Forecasting of EPS
Everest Bank
NSBIBL
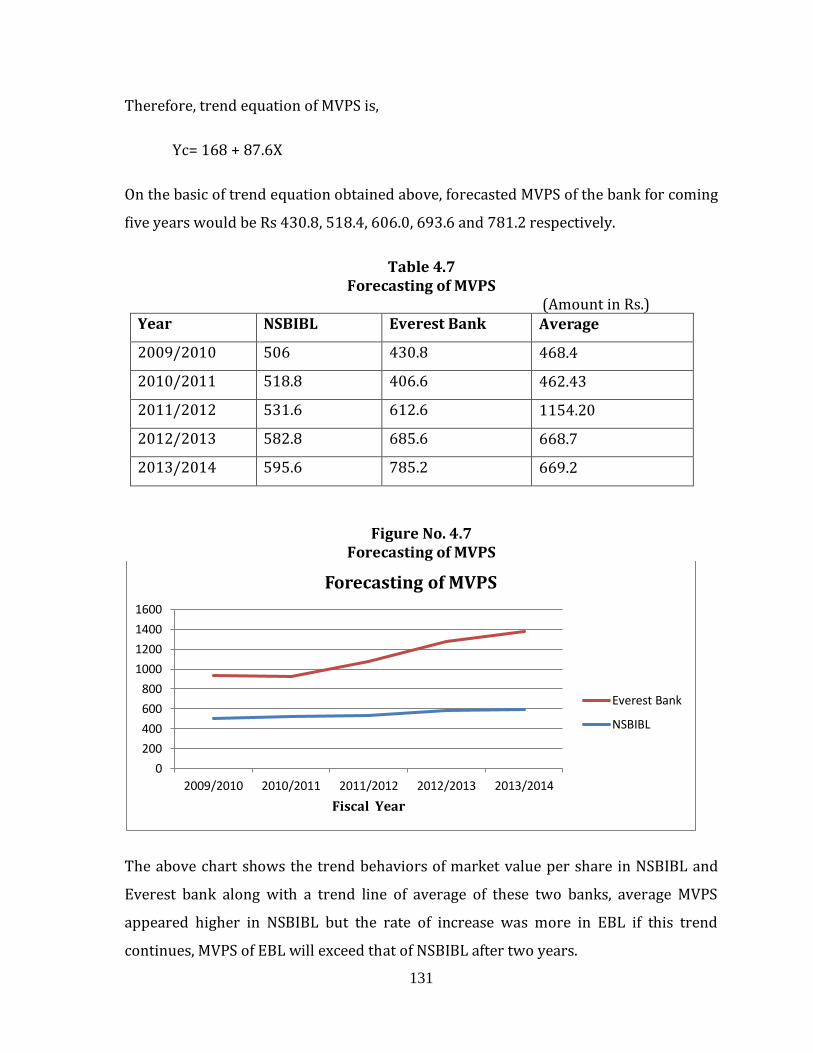
131
Therefore, trend equation of MVPS is,
Yc= 168 + 87.6X
On the basic of trend equation obtained above, forecasted MVPS of the bank for coming
five years would be Rs 430.8, 518.4, 606.0, 693.6 and 781.2 respectively.
Table 4.7 Forecasting of MVPS
(Amount in Rs.) Year NSBIBL Everest Bank Average
2009/2010 506 430.8 468.4
2010/2011 518.8 406.6 462.43
2011/2012 531.6 612.6 1154.20
2012/2013 582.8 685.6 668.7
2013/2014 595.6 785.2 669.2
Figure No. 4.7 Forecasting of MVPS
The above chart shows the trend behaviors of market value per share in NSBIBL and
Everest bank along with a trend line of average of these two banks, average MVPS
appeared higher in NSBIBL but the rate of increase was more in EBL if this trend
continues, MVPS of EBL will exceed that of NSBIBL after two years.
0
200
400
600
800
1000
1200
1400
1600
2009/2010 2010/2011 2011/2012 2012/2013 2013/2014
Fiscal Year
Forecasting of MVPS
Everest Bank
NSBIBL

132
4.5 Major Findings
The following findings have been derived from the analysis and interpretation of date.
1) Current ratio of both of the banks showed slightly fluctuating trend. Both of the
banks could not maintain the conventional standard of 2.1. However, the
average of the ratios appeared higher in NSBIBL, which signifies that NSBIBL is
more capable of meeting immediate liabilities in contrast to EBL. The ratio was
found more consistent in NSBIBL. Hypothesis test showed that the mean ratio of
two banks did not differ significantly.
2) Average cash and bank balance to current and saving deposits ratios of ERL
appeared greater than that NSBIBL. It indicates that of EBL is better than that of
NSBIBL. Conversely, EBL seems less successful to utilize the fund raised from
the current ad saving deposits that may ultimately affect the profitability
adversely. The ratio appeared less uniform in EI- 3L.Hypothesis test showed
that the sampled bank does not differ significant with respect to tins ratio.
3) Mean cash and bank balance to total deposit ratio remained higher in EBL
which reveals that the greater portion of the deposit was held for immediate
payment in EBL. The ratio remained more consistent in EBI. Hypothesis test
showed that the mean ratio of the sampled bank does not differ significantly.
4) MRB balance to current and saving deposit ration remained sufficiently review
above the standard set by NRB i.e. 8% in each year of the review period in both
of the bank average of ratios appeared higher in NSBIBI which indicates that
NSBIBL has thicker cushion of liquidity against the possible deposit withdrawal.
The ratio remained more consistent in NBL. Hypothesis test showed that the
bank do not differ significantly with respect to this ratio.
5) Both of the bank maintained NRB balance to fixed deposits ratios above the
standards prescribed by NRB i.e. 6% in each year of the study that EBI has
maintained greater portion of fixed deposit as liquid asset. The ratio showed
less consistency in EBL. Hypothesis test showed that the mean ratio of two
banks does not differ significantly.

133
6) Mean fixed deposit to the total deposit ratio came higher in NSBIBL. It means
that NSBIBL can grasp the opportunity of investing the fund in more profitable
sectors like long-term loans. On the other hand, EBL can utilize less cost bearing
fund in current assets and hence to strengthen the liquidity position.
7) Debt-equity ratio in both of the banks depicted the employment of debt to tie
greater extent in their capital comparatively, capital financial market and nature
of competitions.
8) The banks have employed considerably greater portions of debt in their capital.
Therefore, they should be aware of the possible risk that may arise due to
slackness in the business activities. In this regard, NSBIBL should adopt more
precaution so as to check the risk factors.
9) Debt servicing capacity of EBL appears poor. So, it is better to search for the
profitable sectors for investment and utilization of the deposits collected.
10) Turnover of the fund raised form the outsider's appears less satisfactory in EBL.
So, EBL has a challenge to allocate the deposit in income generation sectors. It
will be better for both of the banks, especially for EBL to open the branches in
other cities and rural areas in order to find the profitable opportunities.
11) The quality of assets owned by NSBIBL seems poorer in comparison to EBL.
Therefore, NSBIBL is suggested to advance the loans only after the proper
analysis of customers.
12) Greater portion of the income has been spent for staff and office operation in
EBL. Through the use of capacity building programs, seminars, conferences,
training etc. staff's can be made more efficient. It is also suggested to minimize
the office operation expenses by searching the loopholes.
13) In NSBIBL, earning compared to the total deposit accumulated could not grow
proportionately. Therefore, NSBIBL is suggested to invest in other current
assets rather than in the low yielding Treasury bill on which interest has
significantly declined at present. If the liquidity position does not appear
weaker, it will be better for the bank to increase the investment in long- term
loans after analyzing risk.

134
14) Both of the banks are suggested to review their investment portfolio to see if
there is any better mix than the present one.
15) Although, Profit needs to be earned for survival and growth of any institution,
it should not be the one and only one goal. The country has expected service
form the financial sectors in such a way that it encompasses the balanced
development. Economic level of the country can be raised only when the level
of the people depending upon the agriculture increases. So the banks are
suggested to diversify their loans in priority and deprived sectors as per the
directive of NRB. Structure of NSBIBL seemed more leveled i.e. more risky. The
ratio remained more consistent in NSBIBL. Hypothesis test showed that the
sampled banks do not differ significantly respect to this ratio.
16) Debt asset ratio remained higher EBL than in NSBIBL which reveals that the
greater portion of asset in EBL was financed through the outsider cost bearing
fund the ratio appeared more uniform in EBL. Hypothesis test showed that the
mean ratio of the banks does not differ significantly.
17) Interest coverage ratio in EBL remained embarrassing in first three years of
study period. In later years, it remained satisfactory. The ratio in NSBIBL
appeared satisfactory in ill the years of study period. The ratio widely
fluctuated in EBL throughout the study period and showed rising trend.
Hypothesis test showed that the sampled banks do not differ significantly with
respect to this ratio.
18) Average net worth to total deposit ratio was higher in EBL and above 8% in
both of the banks. The ratio showed loss consistency in EBL. Hypothesis test
showed that the mean ratio of two banks does not differ significantly.
19) Net worth to total asset ratio was greater in EBL than in NSBIBL. It means that
EBL is more successful to build up confidence among creditors. The ratio
remained more consistent in EBL. Hypothesis test showed that the mean ratio
of two banks does not differ significantly.
20) Net worth to total credit ratio appeared much higher in EBL, which signifies
that EBL, has used significantly larger extent of net worth for credit creation
but ratio widely dispersed in EBL as compared to that in NSBIBL.

135
21) Loans and advances to fixed deposit ratio were higher in NSBIBL. Which
indicates that turnover of fixed deposit in form of loan and advances is better in
NSBIBL. The ratio varied less in the same bank.
22) Loans and advances to saving deposit ratio appeared significantly higher in
NSBIBL. It indicates the better utilization of saving deposits NSBIBL than in
EBL. The ratio remained more uniform in NSBIBL. As depicted by higher
investment to total deposit in EBL. EBL seems more successful to utilize the
deposits fund in investment. The slightly to greater extent in NSBIBL
23) NSBIBL utilize the resources more efficiently and prudently for income
generation as shown by higher performing assets to total assets ratio of the
bank. The ratio seemed to vary less in the same bank.
24) Performing assets to total debt ratio of NSBIBL exceeded the same of EBL on
the average. From this, it can be concluded that NSBIBL allocated the cost-
bearing fund more successfully than EBL. The ratio of this utilization remained
more uniform in NSBIBL.
25) Loan loss coverage ratio of EBL over the period remained lesser which
indicates that asset financed by the bank are superior in contrast to NSBIBL but
the consistency in maintaining the quality of asset appeared better in NSBIBL.
26) With respect to loan loss provision to total income ratio, EBL seems more
aware in quality while advancing loans as the ratio is less in the bank. Portion
of loan loss provision in total income varied less in the same bank.
27) Loan loss provision to total deposit ratio came to be less in EBL and hence it
can be concluded that loan and advances granted by the bank are less risky. In
consistency of the ratios, NSBIBL came to b e better.
28) Accrued interest to total interest income ratio was lower in EBL. It implies that
EBL granted the loans and advance in more secured sector. But the greater
variability in the ratio of the EBL indicates less consistent policy.
29) Average return on assets in NSBIBL was much higher than in EBL. It implies
that the profitability position of EBL in the study period proved to be weaker in
spite of improvement in latter two years. The ratio varied adequately in EBL
form 2004/05 to 2008/2009.
136
30) Return as total deposit was considerably higher in NSBIBL, which signifies that
NSBIBL is more successful to utilize deposit for making profile. The ratio in the
past five years showed almost no consistency in EBL.
31) Interest expenses to interest income ratio, on an average was lower in NSBIBL.
This reveals that NSBIBL invested the fund rouse from more successfully to
earn the interest rather paying the interest for the debt.
32) As revealed by higher interest earned to total asset ratio in NSBIBL, NSBIBL
seemed to be in better position for income generation. The ratio fluctuated
minimum in NSBIBL as shown by less CV.
33) Staff expenses to total income ratio remained significantly lower in NSBIBL. It
indicates that NSBIBL carried out its operation more efficiently with lesser
expenses on staff. On the other hand EBL spent more for staff so as to motivate
them. The ratio varied considerably in EBL.
34) NSBIBL was found to perform its day today operation more efficiently as
revealed by lower office operation expenses to total income ratio in NSBIBL the
EBL. Almost half of the total income was spent for office operation in EBL. The
ratio showed greater variation in EBL.
35) Greater EPS in NSBIBL shows that earning on per share basis is much higher in
NSBIBL than in EBL. EPS greatly varied in the latter.
36) NSBIBL seemed more successful to win the confidence of investors as depicted
by higher DPS. DPS remained more consistent in NSBIBL than in EBL.
37) Tax per share is considerably higher in NSBIBL and hence the shareholders of
NSBIBL have contributed more for the welfare of the nation. It has greatly
fluctuated in EBL.
38) NSBIBL distributed greater portion of its earnings to share holders as depicted
by higher DPR. EBL distributed dividend only in the year 2004/2005.
39) Income analysis shows that interest income remained dominant in both of the
banks. More than three-fourth of the income was occupied by interest.
Commission and discount occupied second major portion of the income in.
NSBIBL whereas other income occupied this portion in EBL. In both of the
banks, interest expenses remained dominant and then overhead expenses.

137
40) Total deposit and net profit, performing assets and net profit, net worth and
net profit, total deposit and investment, total deposit and loans and advances
and DPS and EPS seemed positively correlated at significant level in EBL
throughout the study period.
41) Total deposit and loans and advances were found positively correlated at
significant level in NSBIBL but poor degree of correlation existed between
following variable in the bank total deposit and net profit. Pert run assets and
net profit, total deposits and investment.
42) There did not appear significant relation between net worth and net profit and
DPR and MVPS in NSBIBL. Correlation between EPS and MVPS was found
significantly negative in the bank. But it is illogical and unreliable. Such a
relation might have appeared because of merely mechanical interpretation. In
practice, these two variables are related positively.
43) Total deposit loan and advances, investment, net worth, net profit, EPS and
MVPS showed the increasing trend in both of the banks over the study period.

138
CHAPTER - V
SUMMARY, CONCLUSION AND RECOMMENDATION
5.1 Summary
Joint venture banks have played significant role in the economic development of
country. They have introduced new technology in the banking system mobilized the
saving of community. They have focused their services on commerce, tread and
industry along with general public. But the intense competition and lack of sufficient
investment opportunities have created threats to the bank. Therefore the study has
been conducted to evaluate the performance of joint venture banks especially, that of
Nepal SBI Bank and Everest Bank in order to find out their strengths and weakness.
Null hypothesis for the purpose of study is "there is no significant difference between
the financial performance of Nepal SBI and Everest Bank.
5.2 Conclusion
To avoid the chances of duplication in the study and confirm whether the study is in
accordance with the principles and doctrines, supportive text and the previous
dissertation have been reviewed. For analyzing the financial data of the sampled banks
the financial tools- ratio analysis, income and expenditure analysis and the statically
tool-mean, CV correlation, least square liner trend analysis have been used. From the
analysis and interpretation of the data, the investor arrives at following conclusion.
Liquidity position of both of the banks seems satisfactory. Overall liquidity position of
EBL appears slightly stronger that of NSBIBL. It shows that EBL can meet its current
liabilities more efficiently that NSBIBL. However, looking up more funds in form of
current assets in also not wise because it has negative impact on profitability. Both of
the banks have used higher proportion of debt in their capital structure. Overall capital
structure of NSBIBL appears more levered that of EBL. Hence, NSBIBL follows this
strategy can yield fair return to shareholders. Debt servicing capacity of EBL appears
poor. Capital adequacy position of EBL appears stronger than that of NSBIBL. NSBIBL
is found more successful to utilize its deposit in profitable sector. Turnover of deposits,

139
debt and assets in performing assets seems better in NSBIBL. On analyzing the assets
owned by the banks. EBL is found superior because assets possessed by EBL are less
risky than that of NSBIBL.
Income and expenses is how rising trend in both of th4e banks. Interest seems to
occupy major part of the both income and expenses. Comparatively, interest remained
more dominant in the total income and expenses of NSBIBL than that of EBL.
Correlation analysis reveals that the coefficient of correlation between total deposit
and net profit; performing assets and net profit; net worth and net profit, total deposit
and investment; total deposits and loans and advances remained highly significant in
EBL. It signifies that EBL is successful to utilize its resources more efficiently than
NSBIBI as strong positive relation did not appeal between above stated components in
NSBIBL. DPS and DPR do not seem to render strong effect on MVPS of NSBIBL but they
have affected the MVPS of EBL to some extent.
Trend analysis depicts that total deposit, total investment, loans and advances and net
worth have been growing in faster pace in NSBIBL than in EBL. Therefore, estimated
amount of the above variable for coming five years will be higher in NSBIBI. But the
growth late of net profit seems faster in EBI, which made net profit of EBL will exceed
than that of NSBIBL after three years if the past trend continues, the higher growth rate
of EPS and MVPS will make MVPS of EBL exceed than that of NSBIBL after three years.
5.3 Recommendation
On the basis of major findings some important suggestions have been forwarded so
that they will help the sampled banks to strengthen weaker aspects of financial
activities.
a) Both of the banks have maintained NRB balance to deposit ratio remarkably
higher than the standard prescribed by NRB. The fund tied up in NRB balance
cannot yield good return. So, both of the banks are suggested to lower this ratio
and invest the surplus fund in other current assets such as loans and advances,
bills purchase and discount, money at call and short notice.

140
b) It is suggestive that these banks should hold the fund in form of cash or cash
equivalent items only to the extent of requirement. Though it is difficult to know
the exactly suitable liquidity ratio, estimation can be done on the basis of past
experience, nature of depositors, situation of financial market and nature of
competition.
c) The banks have employed considerably greater portion of debt in their capital
therefore, they should be aware of the possible risk that may arise due to
slackness in the business activities. In this regard, NSBIBL should adopt more
precaution so as to check the risk factors.
d) Debt servicing capacity of EBL appears poor. So, it is better to search for the
profitable sectors for investment and utilization of the deposits collected.
e) Turnover of the fund raised form the outsiders appears less satisfactory in EBL.
So, EBL has a challenge to allocate the deposit in income generating sectors. It
will be better for both of the banks, especially for EBL to open the branches in
other cities and rural areas in order to find the profitable opportunities.
f) The quality of assets owned by NSBIBL seems poorer in comparison to EBL.
Therefore, NSBIBL is suggested to advance the loans only after the proper
analysis of customers.
g) Greater portion of the income has been spent for staff and office operation in
EBL. Through the use of capacity building programmers, seminars, conference,
training etc. staffs can be made more efficient. It is also suggested to minimize
the office operation expenses by searching the loopholes.
h) In NSBIBL, earning, compared to the total deposit accumulated could not grow
proportionately. Therefore, NSBIBL is suggested to invest in other current
assets rather than in the low yielding Treasury bill on which interest has
significantly declined at present. If the liquidity position does not appear
weaker, it will be better for the bank to increase the investment in long-term
loans after analyzing risk.
i) Both of the banks are suggested to review their investment ponies to see if
there is any better mix than the present one.

141
j) Although, profit needs to be earned for survival and growth of any institution, it
should not be the one and only one goal. The country has expected services
from the financial sectors in such a way that it encompasses the balanced
development. Economic level of the country can be raised only when the level of
the people depending upon the agriculture increases. So the banks are
suggested to diversify their loans in priority and deprived sectors as per the
directive of NRB.

142
BIBLIOGRAPHY
A. BOOKS.
Bhalla, V.K. (2003), Investment Management, Security Analysis and portfolio
Management Mumbai, India, S. Chanda publishing Company
Chandra (1994), Prasanna Financial Management Theory and Practice: NewDelhi,
Tata Mc Graw-Hill Publishing Co. Ltd.
Chenney, and Moses, Edward A. (1995), Fundamentals of Investment: New York: St.
Paul West Publishing Company.
Fischer, Donald E. Nad Jordan, (2000) Security Analysis of Portfolio Management:
New Delhi, India, Prentices Hall of India
Francis (1986), Investment analysis and Management: New York, Mc Graw- Hill
publication.
Gupta, O.P (1985), Behavior of share Prices in India: New Delhi, A Test of Market
Efficiency, National Publishing House.
Gupta, S.P. (1991), Statistical Methods: New Delhi, India, Sultan Chand and sons
Publications.
Hampton, John J., Financial Decision Making: New Delhi, Prentice Hall of India Private
Ltd.
Kene, Simon M., (1983), Stock Market Efficiency Theory, Evidence and Implication. :
New Delhi, India, heritage Publisher.
Khan, M.Y. and Jain P.K. (1986), Management Accountancy: New Delhi, India, Mc
Graw- Hill publishing company Ltd.
Kothari, C.P., (1994), Quantitative Techniques: New Delhi, Vikas Publishing House Pvt.
Ltd.
Kuchhal, S.C., (1974), Financial Management: New Delhi, Chaitanya Publishing House
Pvt. Ltd.
Panday, I.M. (2000), Financial Management: New Delhi, India, Vikas Publishing House
Pvt. Ltd.

143
Pradhan, I.M., (1994), Financial Management Practices in Nepal: New Delhi, India,
Vikas Publishing House Pvt. Ltd.
Pradhan, Surendra, (1992), Basic Management: Kathmandu Educational enterprises
Pvt. Ltd.
Raghu Palat, (1991), Share for Investment and Wealth, A Guide to Investing Wisely:
New Delhi, India, India Book Distributor.
Ragmi, M.C., (1969), Growth of Banking in Developing Economy: Agra, India, Sahity
Bhawan.
Sharp, William F., Alexander and Bailey, (2001), Investment: New Dehil, Prentice Hall
of India.
Shrestha, Manohar Krishna, (1980), Financial Management Theory and practice:
Kathmandu, Curriculum Development Centre.
Van Horne, James C, (1998), Financial Management Policy: New Delhi, 10th Edition,
Prentice- Hall of India Private Ltd.
Van Horne, James C, (2000), Financial Management & Policy: New Dehli, 11th edition,
Prentice Hall India Pvt. Ltd.
Weston, J.F and Copeland, T.E., (1989), Managerial Finance: New York, The Dryden
press.
Weston, J Fred and Brigham, Eugence F., (1972), Managerial Finance: New York,
America, Holt Saunders, International Editions.
B. THESIS
Tuladhar, B.R. (2000) “A study on investment policy of Nepal Grindlays Bank
Limited in comparison to other Joint venture Banks of Nepal” Kathmandu:
unpublished Master's Thesis, CDM, Tribhuvan University, Kirtipur
Regmi, M.C. (2001), "A comparative study of the financial performance of HBL and NBBL”
Kathmandu: unpublished Master's Thesis, CDM, Tribhuvan University, Kirtipur
Kapadi, D. (2002) “A Comparative Study on Performance of NABIL Bank Ltd and
Standard Chartered Bank Limited." Kathmandu: unpublished Master's Thesis,
CDM, Tribhuvan University, Kirtipur

144
Manandhar, N. (2005) “Financial performance analysis of Nepal Bangladesh bank
ltd" Kathmandu: unpublished Master's Thesis, CDM, Tribhuvan University, Kirtipur
Gautam, D.K (2006) "A Comparative study on financial performance of Standard
Chartered Bank Limited and Nepal Bangladesh bank Limited" Kathmandu:
unpublished Master's Thesis, CDM, Tribhuvan University, Kirtipur
C. JOURNALS REPORTS AND ARTICLES
- NSB (2007), Annual Report 2007, Kathmandu
- Annual Report of Everest Bank Ltd. 2007
- Sharm, Murari R. Jobs in Nepal, Coexisting or Crowing out: 1980, Lalitpur Prakash,
the Nepalese Journal of Public Administration.
- Chorpra, Sunil, Role of Foreign Banks in Nepal: 2046NRB Samachar, 34th
Anniversary.
- Shrestha, M.K., Nepal Bank Limited, an Appraisal of Financial, Position, KTM.
- HMG/N The Ninth Plan: 1998, Kathmandu, National Planning Commission.
- HMG/N The Tenth Plan: 2003, Kathmandu, National Planning Commission.
- Pradhan, Radhe S., Stock Market Behavior in a small Capital market: 1993, A
Case of Nepal. The Nepalese Management Review, No9 Central Department of
Management, Kathmandu.
- Sharma, Bhaskar, Nepal's only secondary market in shambles: Kathmandu (June
2007), Business age vol.3.
- Tiwari, Gopal, Nepalese propose market and its efficiency: (Jan 6th 2005).
- The Rising Nepal, Feb 2005 Kathmandu, Gorkhapatra Sansthan.
- The Rising Nepal Jan 25th 2007 Kathmandu, Gorkhapatra Sansthan.
- The Himalayan Times, 8th oct. 2007 Kathmandu, APCA House publication.
- The Kathmandu Post 22th Dec. 2007 Kathmandu, Kantipur publication.

145
ANNEX 1
Current Ratio
Amount in Rs. Million
Bank NSBIBL EBL
Year Current Assets Current Liabilities Ratio Current Asset Current liabilities Ratio
2004/2005 866 751.43 1.15:1 165.33 153.52 1.07:1
2005/2006 1818.4 1695.35 1.07:1 193.34 175.43 1.07:1
2006/2007 2594.17 2439.74 1.06:1 547.2 530.11 1.03:1
2007/2008 4053.53 3851.69 1.05:1 1282.26 1287.61 1:1
2008/2009 4747.21 4487.67 1.06:1 2277.32 2127.09 0.98:1
MEAN 1.08:1 1.04:1
S.D 0.04 0.04
C.V 3.39 4.26
COMBINED S.D 0.04528
CALCULATED VALUE OF t 1.4666
ANNEX 2
Cash and Bank Balance to Current and Saving Deposit Ratio
Amount in Rs. Thousand
Bank NSBIBL EBL
Year
Cash & Bank
balance
Current and Saving
Deposit Ratio(%)
Cash & Bank
balance
Current and Saving
Deposit Ratio(%)
2004/2005 20294.31 241705.35 83.97 44469.57 136557.38 32.57
2005/2006 220396 688554.43 32.01 43696.47 41298.48 105.81
2006/2007 320021 826258.72 38.73 87329.94 140605.71 62.11
2007/2008 761558.06 1360884.26 55.96 255150.35 403524.21 63.23
2008/2009 1357797.23 2279800.29 59.56 460719.04 816864.04 56.4
MEAN 54.05 64.02
S.D 18.16 23.66
C.V 33.61 36.96
COMBINED S.D 23.578
CALCULATED VALUE OF t 0.669
ANNEX 3
Cash and Bank Balance to total Deposit Ratio
Amount in Rs. Thousand
Bank NSBIBL EBL
Year
Cash & Bank
balance Total Deposits Ratio(%)
Cash & Bank
balance Total Deposits Ratio(%)
2004/2005 202948.31 715844.35 28.35 44469.57 147212.38 32.57
2005/2006 220396 162595.93 13.57 43696.47 170522.63 25.63
2006/2007 320021 2358908.4 13.57 87329.94 471661.67 18.52
2007/2008 761558.06 3744506.86 20.34 255150.35 1124903.12 22.68
2008/2009 1357797.23 4380018.84 31 460719.04 1948946.58 23.64
MEAN 21.37 24.14
S.D 7.27 3.82
C.V 34.02 15.83
COMBINED S.D 6.4926
CALCULATED VALUE OF t 0.6746

146
ANNEX 4
NRB Balance to Current and Saving Deposit Ratio
Amount in Rs. Thousand
Bank NSBIBL EBL
Year NRB balance
Current and Saving
Deposit Ratio(%) NRB balance
Current and Saving
Deposit Ratio(%)
2004/2005 143018.15 241705.35 59.17 6599.52 136557.38 4.83
2005/2006 144107.26 688554.43 20.93 21044.6 41298.48 50.96
2006/2007 235505.03 826258.72 28.5 47260.02 140605.71 33.61
2007/2008 574125.66 1360884.26 42.19 121474.05 403524.21 30.1
2008/2009 693064.21 2279800.29 30.4 168150.35 816864.04 20.58
MEAN 36.24 28.02
S.D 13.34 15.2
C.V 36.81 54.25
COMBINED S.D 15.9865
CALCULATED VALUE OF t 0.8132
ANNEX 5
NRB Balance for Fixed Deposit Ratio
Amount in Rs. Thousand
Bank NSBIBL EBL
Year NRB balance Fixed Deposit Ratio(%) NRB balance Fixed Deposit Ratio(%)
2004/2005 143018.15 474139 30.16 6599.52 10655 61.94
2005/2006 144107.26 927205.85 15.54 21044.6 129224.15 16.29
2006/2007 235505.03 1532649.69 15.37 47260.02 331055.96 14.28
2007/2008 574125.66 2383622.6 24.09 121474.05 721378.91 16..84
2008/2009 693064.21 2100218.55 33.33 168150.35 1132082.54 14.85
MEAN 23.63 28.84
S.D 7.27 18.57
C.V 30.77 74.77
COMBINED S.D 15.7684
CALCULATED VALUE OF t 0.1211
ANNEX 6
Fixed Deposit to Total Deposit Ratio
Amount in Rs. Thousand
Bank NSBIBL EBL
Year Fixed Deposit Total Deposit Ratio(%) Fixed Deposit Total Deposit Ratio(%)
2004/2005 474139 715844.35 66.23 10655 147212.38 7.24
2005/2006 927205.85 1624595.93 57.07 129224.15 170522.63 75.78
2006/2007 1532649.69 2358908.4 64.97 331055.96 471661.67 70.19
2007/2008 2383622.6 3744506.86 63.66 721378.91 1124903.12 75.78
2008/2009 2100218.55 4380018.84 47.65 1132082.54 1948946.58 58.09
MEAN 59.98 55.09
S.D 6.79 24.64
C.V 11.33 44.74
COMBINED S.D 20.2087
CALCULATED VALUE OF t 0.3826

147
ANNEX-7
Dept-Equity Ratio
Amount in Rs. Thousand
Bank NSBIBL EBL
Year Total Dept Equity Ratio(%) Total Dept Equity Ratio(%)
2004/2005 606064.29 139309.10 435.05 14039.08 26057.58 548.93
2005/2006 1194133.26 157088.54 760.17 154631.76 35617.43 434.15
2006/2007 1920714.52 196527.33 977.33 438554.25 38320.17 1144.45
2007/2008 2982824.56 262270.85 1137.31 956496.41 127435.67 750.57
2008/2009 2894575.8 321059.82 901.57 1628031.96 145157.02 1121.57
MEA 842.29 799.93
S.D 237.22 290.3
C.V 28.16 36.29
COMBINED S.D 296.729
CALCULATED VALUE OF t 0.2235
ANNEX 8
Dept-Assets Ratio
Amount in Rs. Thousand
Bank NSBIBL EBL
Year Total Dept Total Assets Ratio(%) Total Dept Total Assets Ratio(%)
2004/2005 606064.29 833590.85 67.82 14039.08 189441.23 75.5
2005/2006 1194133.26 1869814.49 63.86 154631.76 225171.2 68.67
2006/2007 1920714.52 2688734.31 71.44 438554.25 594306.31 73.79
2007/2008 2982824.56 4122575.7 75.35 956496.41 1419981.95 67.36
2008/2009 2894575.8 4812000.97 60.15 1628031.96 2293136.58 71
MEAN 1.08:1 1.04:4
S.D 0.04 0.04
C.V 3.39 4.26
COMBINED S.D 4.36
CALCULATED VALUE OF t 1.3092
ANNEX 9
Dept to Total Capital Ratio
Amount in Rs. Thousand
Bank NSBIBL EBL
Year Total Dept Total Capital Ratio(%) Total Dept Total Capital Ratio(%)
2004/2005 606064.29 745373.39 81.31 14039.08 169096.66 84.59
2005/2006 1194133.26 1351221.8 88.37 154631.76 190249.19 81.28
2006/2007 1920714.52 2117241.85 90.72 438554.25 476874.42 91.96
2007/2008 2982824.56 3245095.41 91.92 956496.41 1083932.08 88.24
2008/2009 2894575.8 3215635.62 90.02 1628031.96 1773188.98 91.81
MEAN 88.47 87.58
S.D 3.76 4.15
C.V 4.25 4.74
COMBINED S.D 4.427
CALCULATED VALUE OF t 0.3086

148
ANNEX 10
Interest Coverage Ratio
Amount in Rs. Thousand
Bank NSBIBL EBL
Year EBIT Interest Ratio(%) EBIT Interest Ratio(%)
2004/2005 46500.07 35087.51 1.33 (2507.41) 1440.5 -1.74
2005/2006 154201.18 100875.23 1.53 (1089.88) 8515.58 -0.13
2006/2007 227116.23 162646.26 1.4 10824.96 21875.86 0.49
2007/2008 324278.85 240745.68 1.35 99938.51 74721.13 1.34
2008/2009 335810.49 310795 1.08 157395.27 118702.2 1.33
MEAN 1.34 0.26
S.D 0.15 1.14
C.V 10.96 442.48
COMBINED S.D 0.9099
CALCULATED VALUE OF t 2.0982
ANNEX 11
Net Worth to Total Deposit Ratio
Amount in Rs. Thousand
Bank NSBIBL EBL
Year Net Worth Total Deposits Ratio(%) Net Worth Total Deposits Ratio(%)
2004/2005 139309.1 715844.35 19.46 26057.58 147212.38 17.7
2005/2006 157088.54 1624595.93 9.67 35617.43 170522.63 20.89
2006/2007 196527.33 2358908.4 8.33 38320.17 471661.67 8.12
2007/2008 262270.85 3744506.86 7 127435.67 1124903.12 11.33
2008/2009 321059.82 4380018.84 7.33 145157.02 1948946.58 7.45
MEAN 10.36 13.1
S.D 4.65 5.32
C.V 44.84 40.64
COMBINED S.D 5.5854
CALCULATED VALUE OF t 0.8673
ANNEX 12
Net Worth to Total Assets Ratio
Amount in Rs. Thousand
Bank NSBIBL EBL
Year Net Worth Total Assets Ratio(%) Net Worth Total Assets Ratio(%)
2004/2005 139309.1 893590.85 15.59 26057.58 189441.23 13.76
2005/2006 157088.54 1869814.49 8.4 35617.43 225171.2 15.82
2006/2007 196527.33 2688734.31 7.31 38320.17 594306.31 6.45
2007/2008 262270.85 4122575.7 6.36 127435.67 1419981.95 8.98
2008/2009 321059.82 4812000.97 6.67 145157.02 2293136.58 6.33
MEAN 8.87 10.25
S.D 3.43 3.85
C.V 38.73 37.57
COMBINED S.D 4.0883
CALCULATED VALUE OF t 0.5422

149
ANNEX 13
Net Worth to Total Credit Ratio
Amount in Rs. Thousand
Bank NSBIBL EBL
Year Net Worth Total Credit Ratio(%) Net Worth Total Credit Ratio(%)
2004/2005 139309.1 609194.07 22.87 26057.58 20127.18 129.25
2005/2006 157088.54 11753140.83 13.37 35617.43 49127.93 72.5
2006/2007 196527.33 1718791 11.43 38320.17 302183.18 12.68
2007/2008 262270.85 2363559.15 11.1 127435.67 871677.98 14.62
2008/2009 321059.82 2911.32.29 11.03 145157.02 13648840.23 10.64
MEAN 13.96 47.94
S.D 4.54 46.82
C.V 32.5 10.64
COMBINED S.D 37.1857
CALCULATED VALUE OF t 1.4447
ANNEX 14
Loan and Advances to Total Deposit Ratio
Amount in Rs. Thousand
Bank NSBIBL EBL
Year
Loan And
Advances Total Deposits Ratio(%)
Loan And
Advances Total Deposits Ratio(%)
2004/2005 69194.07 715844.35 85.1 20161.18 147212.38 13.7
2005/2006 117531483 1624595.93 72.35 49127.93 170522.63 28.81
2006/2007 1718791 2358908.4 72.86 302183.18 471661.67 64.07
2007/2008 2363559.29 3744506.86 63.12 871677.98 1124903.12 77.49
2008/2009 2963032.29 4380018.84 67.65 1364884.23 1948946.58 70.03
MEAN 72.22 50.82
S.D 7.35 24.97
C.V 10.18 49.14
COMBINED S.D 20.5798
CALCULATED VALUE OF t 1.6438
ANNEX 15
Loan and Advances to Fixed Deposit Ratio
Amount in Rs. Thousand
Bank NSBIBL EBL
Year
Loan And
Advances Fixed Deposit Ratio(%)
Loan And
Advances Fixed Deposit Ratio(%)
2004/2005 69194.07 474139 128.48 20161.18 10655 189.22
2005/2006 117531483 927205.85 126.76 49127.93 129224.15 38.02
2006/2007 1718791 1532649.69 112.15 302183.18 331055.96 91.28
2007/2008 2363559.29 2383622.6 99.16 871677.98 721378.91 120.83
2008/2009 2963032.29 2100218.55 141.08 1364884.23 1132082.54 120.56
MEAN 121.53 111.98
S.D 14.47 49.02
C.V 11.9 43.78
COMBINED S.D 40.4085
CALCULATED VALUE OF t 0.3734

150
ANNEX 16
Loan and Advances to Saving Deposit Ratio
Amount in Rs. Thousand
Bank NSBIBL EBL
Year
Loan And
Advances Saving Deposit Ratio(%)
Loan And
Advances Saving Deposit Ratio(%)
2004/2005 69194.07 73846.39 824.95 20161.18 12384.08 162.8
2005/2006 117531483 181732.37 624.39 49127.93 25407.61 193.36
2006/2007 1718791 345623.24 497.3 302183.18 79029.47 382.37
2007/2008 2363559.29 527237.24 448.29 871677.98 217839.8 400.15
2008/2009 2963032.29 786711.25 376.64 1364884.23 1364884.23 304.66
MEAN 566.31 288.67
S.D 164.62 96.32
C.V 29.07 33.37
COMBINED S.D 150.787
CALCULATED VALUE OF t 2.9111
ANNEX 17
Investment to Total Deposit Ratio
Amount in Rs. Thousand
Bank NSBIBL EBL
Year Investment Total Deposit Ratio(%) Investment Total Deposit Ratio(%)
2004/2005 32408.84 715844.35 4.53 20161.18 147212.38 61.82
2005/2006 374378.04 1624595.93 23.04 49127.93 170522.63 55.87
2006/2007 396820.3 2358908.4 16.82 302183.18 471661.67 28.05
2007/2008 681589.15 3744506.86 18.2 871677.98 1124903.12 19.38
2008/2009 202578.3 4380018.84 4.63 1364884.23 1948946.58 14.52
MEAN 13.44 35.93
S.D 7.53 19.3
C.V 55.98 53.72
COMBINED S.D 16.3765
CALCULATED VALUE OF t 2.1708
ANNEX 18
Performing Assets to Total Assets Ratio
Amount in Rs. Thousand
Bank NSBIBL EBL
Year
Performing
Assets Total Assets Ratio(%)
Performing
Assets Total Assets Ratio(%)
2004/2005 641602.91 833590.85 71.8 111161.18 189441.23 58.68
2005/2006 1549692.87 1869814.49 82.88 144422.52 225171.2 64.14
2006/2007 2115611.3 2688734.31 78.68 434477.57 594306.31 73.11
2007/2008 3045148.56 4122575.7 73.87 1089632.86 1419981.95 76.74
2008/2009 3165610.59 4812000.97 65.79 1647963.83 2293136.58 71.84
MEAN 74.6 68.91
S.D 5.85 6.56
C.V 7.84 9.52
COMBINED S.D 7.335
CALCULATED VALUE OF t 1.314

151
ANNEX 19
Performing Assets to Total Dept. Ratio
Amount in Rs. Thousand
Bank NSBIBL EBL
Year
Performing
Assets Total Dept
Ratio(
%) Performing Assets Total Dept Ratio(%)
2004/2
005 641602.91 606064.29 105.86 111161.18 14039.08 77.71
2005/2
006 1549692.87 1194133.26 129.78 144422.52 154631.76 93.4
2006/2
007 2115611.3 1920714.52 110.15 434477.57 438554.25 99.07
2007/2
008 3045148.56 2982824.56 102.09 1089632.86 956496.41 113.92
2008/2
009 3165610.59 2894575.8 109.36 1647963.83 1628031.96 101.22
MEAN 111.45 97.06
S.D 9.6 11.78
C.V 8.61 12.13
COMBINED S.D 12.0121
CALCULATED VALUE OF t 1.893
ANNEX 20
Loan Loss Coverage Ratio
Amount in Rs. Thousand
Bank NSBIBL EBL
Year
Loan Loss
Provision
Total Risk
Assets
Ratio(
%)
Loan Loss
Provision
Total Risk
Assets Ratio(%)
2004/2
005 8907.46 609194.07 1.46 201.53 20161.18 1
2005/2
006 7161.65 1175314.83 0.61 779.95 49127.93 1.59
2006/2
007 18830.23 1718791 1.1 1750.38 302183.18 0.58
2007/2
008 31659.24 2363559.15 1.34 5720.38 871677.98 0.66
2008/2
009 35521.05 2911023.29 1.22 8333.78 1364884.23 0.61
MEAN 1.15 0.89
S.D 0.29 0.38
C.V 25.62 43.01
COMBINED S.D 0.3809
CALCULATED VALUE OF t 1.071
ANNEX 21
Loan Loss provision to Total Income Ratio
Amount in Rs. Thousand
Bank NSBIBL EBL
Year
Loan Loss
Provision Total Income
Ratio(
%)
Loan Loss
Provision Total Income Ratio(%)

152
2004/2
005 8907.46 85173.74 10.46 201.53 2503.53 8.05
2005/2
006 7161.65 202100.11 3.54 779.95 13866.33 5.62
2006/2
007 18830.23 293457.53 6.42 1750.38 32944.67 5.31
2007/2
008 31659.24 415929.58 7.61 5720.38 139247.6 4.11
2008/2
009 35521.05 452415.33 7.19 8333.78 129457.65 3.8
ME3N 7.04 5.38
S.D 2.22 1.5
C.V 31.54 27.95
COMBINED S.D 2.1207
CALCULATED VALUE OF t 1.0421
ANNEX 22
Loan Loss provision to Total Deposit Ratio
Amount in Rs. Thousand
Bank NSBIBL EBL
Year
Loan Loss
Provision Total Deposits
Ratio(
%)
Loan Loss
Provision Total Deposits
Ratio(
%)
2004/2
005 8907.46 715844.35 1.24 201.53 147212.38 0.14
2005/2
006 7161.65 162595.93 0.44 779.95 170522.63 0.46
2006/2
007 18830.23 2358908.4 0.8 1750.38 471661.67 0.37
2007/2
008 31659.24 3744506.86 0.85 5720.38 1124903.12 0.51
2008/2
009 35521.05 4380018.84 0.74 8333.78 1948946.58 0.43
MEAN 0.81 0.38
S.D 0.26 0.13
C.V 31.48 33.83
COMBINED S.D 0.2269
CALCULATED VALUE OF t 3.0106
ANNEX 23
Accrued Interest to Total Interest Income Ratio
Amount in Rs. Thousand
Bank NSBIBL EBL
Year Accrued Interest
Total Interest
Income
Ratio(
%)
Accrued
Interest
Total Interest
Income Ratio(%)
2004/2
005 19072 65612.98 29.07 0 241.91 0
2005/2
006 41381.69 174640.99 23.7 2175.48 413.56 19.01
2006/2
007 65848 261697.93 25.16 2137.01 161.77 7.57
2007/2 130646.55 365030.3 35.79 32662.57 10239.71 31.35

153
008
2008/2
009 147752.15 403488.62 36.62 46233.82 12150.24 26.28
MEAN 30.07 16.84
S.D 5.32 11.61
C.V 17.68 68.93
COMBINED S.D 10.0945
CALCULATED VALUE OF t 2.0716
ANNEX 24
Return on Total Assets
Amount in Rs. Thousand
Bank NSBIBL EBL
Year
Net Profit After
Tax Total Assets
Ratio(
%)
Net Profit After
Tax Total Assets Ratio(%)
2004/2
005 7370.83 833590.85 0.83 (3947.91) 189441.23 -2.08
2005/2
006 37886.58 1869814.49 2.03 (9606.47) 225171.2 -4.27
2006/2
007 44920.94 2688734.31 1.67 (11050.9) 594306.31 -1.86
2007/2
008 58976.52 4122575.7 1.43 25033.9 1419981.95 1.76
2008/2
009 16760.39 4812000.97 0.35 25230.3 2293136.58 1.1
MEAN 1.26 -1.07
S.D 0.6 2.22
C.V 47.66 -207.31
COMBINED S.D 1.8168
CALCULATED VALUE OF t 2.0295
ANNEX 25
Return on Net Worth
Amount in Rs. Thousand
Bank NSBIBL EBL
Year
Net Profit After
Tax Net Worth
Ratio(
%)
Net Profit After
Tax Net Worth
Ratio(
%)
2004/2
005 7370.83 139309.1 0.83 3947.91 26057.58 -2.08
2005/2
006 37886.58 157088.54 2.03 9606.47 35617.43 -4.27
2006/2
007 44920.94 196527.33 1.67 11050.9 38320.17 -1.86
2007/2
008 58976.52 262270.85 1.43 25033.9 127435.67 1.76
2008/2
009 16760.39 321059.82 0.35 25230.3 145157.02 1.1
MEAN 1.26 -1.07
S.D 0.6 2.22
C.V 47.66 -207.31
COMBINED S.D 1.8168
CALCULATED VALUE OF t 2.0295

154
ANNEX 26
Return on Total Deposits
Amount in Rs. Thousand
Bank NSBIBL EBL
Year
Net Profit After
Tax Total Deposits
Ratio(
%)
Net Profit After
Tax Total Deposits Ratio(%)
2004/2
005 7370.83 715844.35 1.03 3947.91 147212.38 -2.68
2005/2
006 37886.58 1624595.93 2.34 9606.47 170522.63 -5.63
2006/2
007 44920.94 2358908.4 1.9 11050.9 471661.67 -2.34
2007/2
008 58976.52 3744506.86 1.58 25033.9 1124903.12 2.23
2008/2
009 16760.39 4380018.84 0.38 25230.3 1948946.58 1.29
MEAN 1.45 -1.43
S.D 0.68 2.86
C.V 47.24 -200.38
COMBINED S.D 2.3226
CALCULATED VALUE OF t 1.9551
ANNEX 27
Total Interest Income to Total Interest Expenses Ratio
Amount in Rs. Thousand
Bank NSBIBL EBL
Year
Total Interest
Expenses
Total Interest
Income
Ratio(
%)
Total Interest
Expenses
Total Interest
Income Ratio(%)
2004/2
005 35087.51 65612.98 53.48 1440.5 2419.05 59.55
2005/2
006 100875.23 174640.99 57.76 8516.58 19.01 74.41
2006/2
007 162646.26 261697.93 62.15 21875.86 7.57 77.47
2007/2
008 240745.68 365030.3 65.95 74721.13 31.35 71.28
2008/2
009 310795 403488.62 77.03 118702.2 26.28 67.47
MEAN 63.27 70.04
S.D 8.05 6.2
C.V 12.72 8.86
COMBINED S.D 8.0348
CALCULATED VALUE OF t 1
ANNEX 28
Total Interest Income to Total Assets Ratio
Amount in Rs. Thousand
Bank NSBIBL EBL
Year
Total Interest
Income Total Assets
Ratio(
%)
Total Interest
Income Total Assets Ratio(%)
2004/2
005 65612.98 833590.85 7.34 2419.05 189441.23 1.28
2005/2 174640.99 1869814.49 9.34 19.01 225171.2 5.08

155
006
2006/2
007 261697.93 2688734.31 9.73 7.57 594306.31 4.75
2007/2
008 365030.3 4122575.7 8.85 31.35 1419981.95 7.34
2008/2
009 403488.62 4812000.97 8.39 26.28 2293136.58 7.67
MEAN 8.73 5.22
S.D 0.83 2.29
C.V 9.49 43.87
COMBINED S.D 1.9266
CALCULATED VALUE OF t 2.8773
ANNEX 29
Staff Expenses to Total Income Ratio
Amount in Rs. Thousand
Bank NSBIBL EBL
Year Staff Expenses Total Income
Ratio(
%) Staff Expenses Total Income Ratio(%)
2004/2
005 2046.45 85173.74 2.40 1759.32 2503.53 70.27
2005/2
006 4446.61 202100.11 2.2 2526.92 13866.33 18.22
2006/2
007 5901.08 293457.53 2.01 4320.33 32944.67 13.11
2007/2
008 10231.33 415929.58 2.46 7689.51 139247.6 5.52
2008/2
009 14123.53 452415.33 3.12 13389.6 129457.65 10.34
MEAN 2.43 23.49
S.D 0.38 24.27
C.V 15.47 107.19
COMBINED S.D 19.191
CALCULATED VALUE OF t 1.6651
ANNEX 30
Office Operation Expenses(Exp.) to Total Income Ratio
Amount in Rs. Thousand
Bank NSBIBL EBL
Year
Office Operation
Exp. Total Income
Ratio
(%)
Office Operation
Exp. Total Income
Ratio
(%)
2004/2
005 22648.68 85173.74 26.59 3050.09 2503.53 121.83
2005/2
006 28257.27 202100.11 13.98 9096.15 13866.33 65.6
2006/2
007 34016.02 293457.53 11.59 12064.8 32944.67 36.62
2007/2
008 40234.46 415929.58 9.67 17481.87 139247.6 12.55
2008/2
009 44750.13 452415.33 9.89 29145.77 129457.65 13.28
MEAN 14.34 49.98
S.D 6.31 40.82

156
C.V 44.02 81.69
COMBINED S.D 32.6576
CALCULATED VALUE OF t 1.7252
ANNEX 31
Earning Per Share-EPS
Amount in Rs.
Bank NSBIBL EBL
Year EAC
No. of Ordinary
Shares Ratio(%) EAC
No. of Ordinary
Shares Ratio(%)
2004/2005 7370.83 1199.71 6.15 3947.91 600 -6.58
2005/2006 37886.58 1199.77 31.58 9606.47 960 -10.01
2006/2007 44920.94 1199.46 37.45 11050.9 1200 -9.21
2007/2008 58976.52 1199.46 49.17 25033.9 1175.65 21.29
2008/2009 16760.39 1199.46 13.97 25230.3 1184.27 21.3
MEAN 27.66 3.36
S.D 15.65 14.69
C.V 56.56 437.45
COMBINED S.D 16.9664
CALCULATED VALUE OF t 2.2651
ANNEX 32
Dividend Per Share-DPS
Amount in Rs.
Bank NSBIBL EBL
Year
Earning Paid
to Share
holder
No. of Ordinary
Shares Ratio(%)
Earning Paid to
Share holder
No. of
Ordinary
Shares Ratio(%)
2004/2005 0 1199.71 0.00 0 600 0
2005/2006 24000 1199.77 20.00 0 960 0
2006/2007 24000 1199.46 20.01 0 1200 0
2007/2008 24000 1199.46 20.01 0 1175.65 0
2008/2009 12000 1199.46 10 17764.05 1184.27 15
MEAN 14 3
S.D 8 6
C.V 57.15 200
COMBINED S.D 7.9076
CALCULATED VALUE OF t 2.2003

157
ANNEX 33
Tax Per Share-TPS
Amount in Rs.
Bank NSBIBL EBL
Year Tax Paid
No. of Ordinary
Shares Ratio(%) Tax Paid
No. of
Ordinary
Shares Ratio(%)
2004/2005 4041.73 1199.71 3.37 0 600 0
2005/2006 15439.36 1199.77 12.87 0 960 0
2006/2007 19830.41 1199.46 16.53 0 1200 0
2007/2008 8744.58 1199.46 21.36 183.63 1175.65 0.16
2008/2009 12000 1199.46 7.29 13462.78 1184.27 11.37
MEAN 12.28 2.31
S.D 6.41 4.53
C.V 52.14 196.55
COMBINED S.D 6.2031
CALCULATED VALUE OF t 2.5132
ANNEX 34
Dividend Payout Ratio
Amount in Rs.
Bank NSBIBL EBL
Year DPS EPS Ratio (%) DPS EPS Ratio (%)
2004/2005 0 6.15 0.00 0 -6.58 0
2005/2006 20 31.58 63.33 0 -10.01 0
2006/2007 20.01 37.45 53.43 0 -9.21 0
2007/2008 20.01 49.17 40.7 0 21.29 0.16
2008/2009 10 13.97 71.58 15 21.3 11.37
MEAN 45.81 14.08
S.D 25.11 28.17
C.V 54.83 200
COMBINED S.D 29.8349
CALCULATED VALUE OF t 1.6813
ANNEX 35
Price Earnings Ratio-P/E Ratio
Amount in Rs. Thousand
Bank NSBIBL EBL
Year MVPS EPS Ratio (%) MVPS EPS Ratio (%)
2004/2005 512 6.15 83.25 0.00 -6.58 0
2005/2006 412 31.58 13.05 122 -10.01 -12.19
2006/2007 412 37.45 11 127 -9.21 -13.79
2007/2008 440 49.17 8.95 184 21.29 8.64
2008/2009 562 13.97 40.23 407 21.3 19.11
MEAN 31.3 0.35
S.D 28.37 12.47
C.V 90.64 3526.64
COMBINED S.D 24.498
CALCULATED VALUE OF t 1.997

158
ANNEX 36
Market Value Per Share to Book Value Per Share-MVPS/BVPS
Amount in Rs.
Bank NSBIBL EBL
Year MVPS BVPS Ratio(%) MVPS BVPS Ratio(%)
2004/2005 512 116.19 4.41 0 43.43 0
2005/2006 412 130.93 3.15 122 36.08 3.38
2006/2007 412 163.84 2.51 127 34.93 3.39
2007/2008 440 218.65 2.01 184 108.4 1.7
2008/2009 562 267.66 2.1 407 122.57 3.32
MEAN 2.84 2.48
S.D 0.88 1.45
C.V 31.17 58.6
COMBINED S.D 24.498
CALCULATED VALUE OF t 1.997
ANNEX 37 Income Analysis
NSBIBL Year
Income
2004/2005
2005/2006 2006/2007 2007/2008
2008/2009 Mean % S.D.% C.V.%
Interest income
RS.
%
665612.98
77.03
174640.99
86.41
261697.30
89.18
365030.30
87.76
403488.62
89.18
85.91
4.56 5.34
Commission & discount
RS.
%
8503.75
9.98
11073.94
5.48
19482.51
6.64
22073.95
5.31
27199.76
6.01
6.68 1.71 25.64
Foreign Exchange income
RS.
%
287.53
0.34
4432.12
2.19
70.79
0.02
20997.80
5.05
19931.29
4.41
2.4
20.5 85.35
Other income Rs.
%
10769.48
12.65
11953.07
5.92
12206.30
5.62
7827.53
1.88
1795.66
0.40
5.02 4.27 85.22
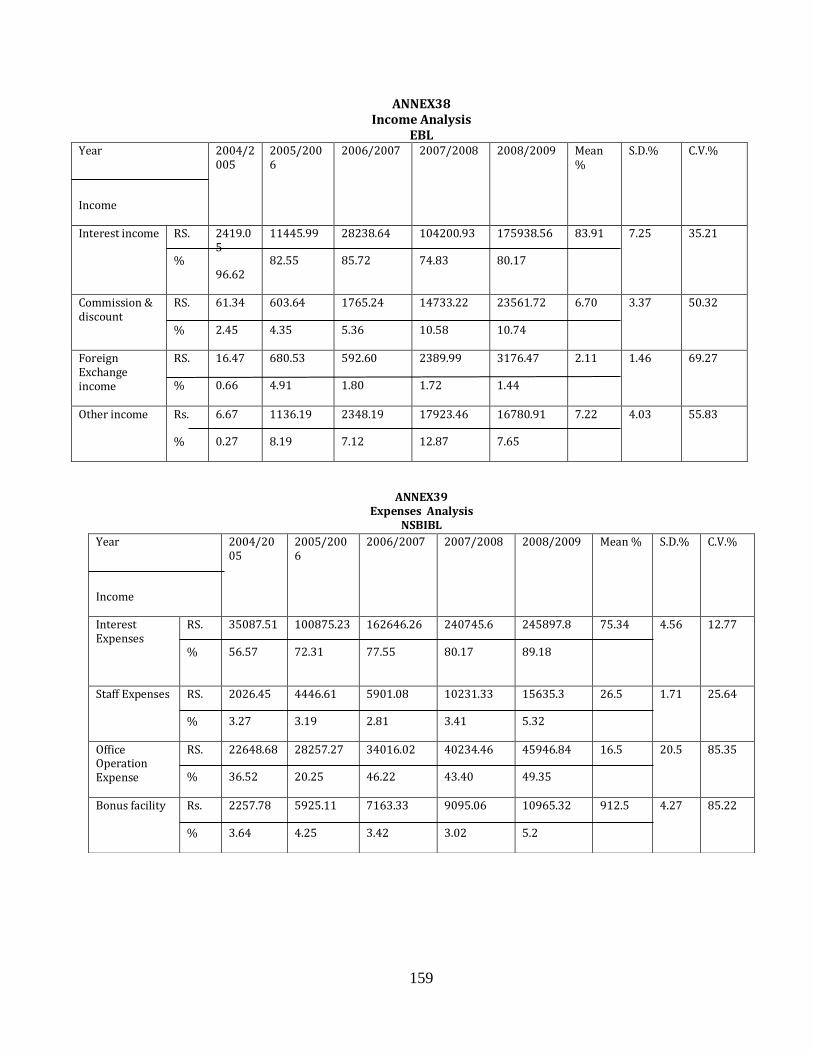
159
ANNEX38 Income Analysis
EBL Year
Income
2004/2005
2005/2006
2006/2007 2007/2008 2008/2009 Mean %
S.D.% C.V.%
Interest income
RS.
%
2419.05
96.62
11445.99
82.55
28238.64
85.72
104200.93
74.83
175938.56
80.17
83.91
7.25 35.21
Commission & discount
RS.
%
61.34
2.45
603.64
4.35
1765.24
5.36
14733.22
10.58
23561.72
10.74
6.70 3.37 50.32
Foreign Exchange income
RS.
%
16.47
0.66
680.53
4.91
592.60
1.80
2389.99
1.72
3176.47
1.44
2.11
1.46 69.27
Other income Rs.
%
6.67
0.27
1136.19
8.19
2348.19
7.12
17923.46
12.87
16780.91
7.65
7.22 4.03 55.83
ANNEX39 Expenses Analysis
NSBIBL
Year
Income
2004/2005
2005/2006
2006/2007 2007/2008 2008/2009 Mean % S.D.% C.V.%
Interest Expenses
RS.
%
35087.51
56.57
100875.23
72.31
162646.26
77.55
240745.6
80.17
245897.8
89.18
75.34
4.56 12.77
Staff Expenses RS.
%
2026.45
3.27
4446.61
3.19
5901.08
2.81
10231.33
3.41
15635.3
5.32
26.5 1.71 25.64
Office Operation Expense
RS.
%
22648.68
36.52
28257.27
20.25
34016.02
46.22
40234.46
43.40
45946.84
49.35
16.5 20.5 85.35
Bonus facility Rs.
%
2257.78
3.64
5925.11
4.25
7163.33
3.42
9095.06
3.02
10965.32
5.2
912.5 4.27 85.22

160
ANNEX40 Expenses Analysis
EBL Year
Income
2004/2005
2005/2006
2006/2007 2007/2008 2008/2009 Mean % S.D.% C.V.%
Interest Expenses
RS.
%
1060.475
22.05
5609.5
42.29
10477.92
57.17
20353.38
72.76
33395.56
71.13
53.08
21.26 452.27
Staff Expenses
RS.
%
1759.32
28.15
2526.92
12.55
4320.33
11.29
7689.51
7.49
13389.00
8.08
13.51 7.56 55.96
Office Operation Expense
RS.
%
3050.09
48.80
9096.15
45.16
12064.80
31.54
17481.87
17.02
29145.77
17.59
32.02 13.32 41.61
Bonus facility Rs.
%
0.000
0.00
1641.48
0.75
1942.52
1.50
2801.93
2.73
4415.27
3.2
1.08 1.33 122.50
ANNEX41
Correlation analysis between total deposit and net profit
NSBIBL
Year Deposit (X) Net profit(Y) ∑XY=46700000000
2004/2005 715844 7370.83
2005/2006 1624595.93 37886.58 ∑ X² = 41900000000000 2006/2007 2358908.40 44920.94
2007/2008 3744506.86 58976.52 ∑ Y² =7270000000 2008/2009 4380018.8 16760.39
∑X=12820000.00 ∑Y=165915.26
R 0.3295
P.E.(R) 0.2689
ANNEX42
Correlation analysis between Total deposit and net profit
EBL
Year Deposit (X) Net profit(Y) ∑XY=69900000000
2004/2005 147212 -3947.91
2005/2006 170552.63 -9606.47 ∑ X² = 5337000000000 2006/2007 471661.67 44920.94
2007/2008 1124903.12 25033.74 ∑ Y² =1493000000 2008/2009 19489.58 25230.30
∑X=3863000 ∑Y=25660
R 0.8847
P.E.(R) 0.0655

161
ANNEX43
Correlation analysis between Performing assets and net profit
NSBIBL
Year Performing assets (X) Net profit(Y) ∑XY=391100000000
2004/2005 641602.91 7370.83
2005/2006 1549692.87 37886.58 ∑ X² = 26580000000000 2006/2007 2115611.30 44920.94
2007/2008 3045148.56 58976.32 ∑ Y² =1493000000 2008/2009 3165610.59 16760.39
∑X=10518000 ∑Y=165900
R 0.4754
P.E.(R) 0.2335
ANNEX44
Correlation analysis between Performing assets and net profit
EBL
Year Performing assets (X) Net profit(Y) ∑XY=62230000000
2004/2005 111161.18 -3947.91
2005/2006 14444422.52 -9606.47 ∑ X² = 412500000000 2006/2007 434477.57 -11050.90
2007/2008 1089632.86 25033.74 ∑ Y² =1493000000 2008/2009 1128564.23 26042.7
∑X=3428000 ∑Y=25660
R 0.9081
P.E.(R) 0.0529
ANNEX45
Correlation analysis between Net Worth and net profit
NSBIBL
Year Net worth (X) Net profit(Y) ∑XY=36660000000
2004/2005 139309.10 7370.83
2005/2006 157088.54 37886.58 ∑ X² =
254600000000 2006/2007 196527.33 44920.94
2007/2008 262270.85 58976.52 ∑ Y² =7267000000 2008/2009 283478.20 63254.98
∑X=1076000 ∑Y=165900
R 0.0504
P.E.(R) 0.2948
ANNEX46
Correlation analysis between Net worth and net profit
EBL
Year Net worth (X) Net profit(Y) ∑XY=3521450000
2004/2005 26057.58 -3947.91
2005/2006 35617.43 -9606.47 ∑ X² =
412500000000 2006/2007 38320.17 -11050.90
2007/2008 127435.67 25033.74 ∑ Y² =
1493000000 2008/2009 14157.02 26042.7
∑X=372600 ∑Y=25660
R 0.9695
P.E.(R) 0.0181

162
ANNEX47
Correlation analysis between Total Deposit and Investment
EBL
Year Deposit (X) Investment(Y) ∑XY=88890000000
2004/2005 147212.38 91000.00
2005/2006 170552.63 95294.59 ∑X² = 533700000000 2006/2007 471661.67 132294.40
2007/2008 1124903.12 217954.88 ∑ Y² = 1625000000000 2008/2009 1565478.34 254642.65
∑X=3863000 ∑Y=819600
R 0.993
P.E.(R) 0.0042
ANNEX48
Correlation analysis between Total Deposit and Investment
NSBIBL
Year Deposit(X) Investment(Y) ∑XY=282300000000
2004/2005 715844.35 609194.07
2005/2006 1624595.93 11753140.83 ∑X² = 419200000000 2006/2007 2358908.4 1718791.00
2007/2008 3744506.86 2363559.15 ∑ Y² = 1907000000000 2008/2009 4065478.34 254642.65
∑X=12820000 ∑Y=8830000
R 0.9968
P.E.(R) 0.0019
ANNEX49
Correlation analysis between total deposits and loans and advances
EBL
Year Deposit (X) Loan& advance(Y) ∑XY=37950000000
2004/2005 147212.37 202161.18
2005/2006 170552.63 49127.93 ∑X² = 533700000000 2006/2007 471661.67 302183.18
2007/2008 1124903.12 871677.98 ∑ Y² = 2717000000000 2008/2009 1948946.58 1364884.23
∑X=3863000 ∑Y=2608000
R 0.9964
P.E.(R) 0.0022
ANNEX50
Correlation analysis between total deposits and loans and advances
NSBIBL
Year Deposit (X) Loan& advance(Y) ∑XY=
32628527131222.90 2004/2005
715844.35 20161.18
2005/2006 1624595.93 49127.93 ∑X² = 12509333.88 2006/2007 2358908.4 302483.18
2007/2008 3744506.86 871677.98 ∑ Y² =
6803408863890.25 2008/2009 4065478.34 1364884.23
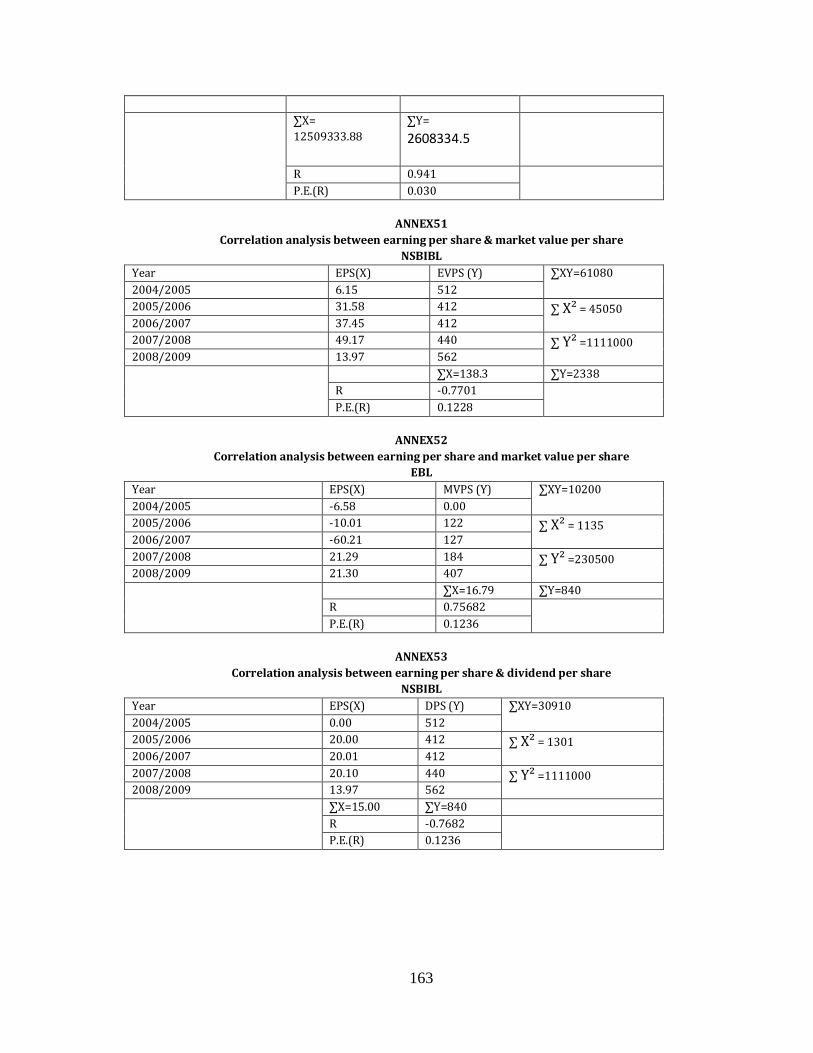
163
∑X=
12509333.88
∑Y=
2608334.5
R 0.941
P.E.(R) 0.030
ANNEX51
Correlation analysis between earning per share & market value per share
NSBIBL
Year EPS(X) EVPS (Y) ∑XY=61080
2004/2005 6.15 512
2005/2006 31.58 412 ∑ X² = 45050 2006/2007 37.45 412
2007/2008 49.17 440 ∑ Y² =1111000 2008/2009 13.97 562
∑X=138.3 ∑Y=2338
R -0.7701
P.E.(R) 0.1228
ANNEX52
Correlation analysis between earning per share and market value per share
EBL
Year EPS(X) MVPS (Y) ∑XY=10200
2004/2005 -6.58 0.00
2005/2006 -10.01 122 ∑ X² = 1135 2006/2007 -60.21 127
2007/2008 21.29 184 ∑ Y² =230500 2008/2009 21.30 407
∑X=16.79 ∑Y=840
R 0.75682
P.E.(R) 0.1236
ANNEX53
Correlation analysis between earning per share & dividend per share
NSBIBL
Year EPS(X) DPS (Y) ∑XY=30910
2004/2005 0.00 512
2005/2006 20.00 412 ∑ X² = 1301 2006/2007 20.01 412
2007/2008 20.10 440 ∑ Y² =1111000 2008/2009 13.97 562
∑X=15.00 ∑Y=840
R -0.7682
P.E.(R) 0.1236

164
ANNEX54
Correlation analysis between earning per share & dividend per share
EBL
Year EPS(X) MVPS (Y) ∑XY=6105
2004/2005 0.00 0.00
2005/2006 0.00 122 ∑ X² = 225 2006/2007 0.00 127
2007/2008 0.00 184 ∑ Y² =230500 2008/2009 15 407
∑X=15.00 ∑Y=840
R 0.893
P.E.(R) 0.03
ANNEX55
Correlation analysis between dividend per ratio & market value per share
NSBIBL
Year DPR(X) MVPS (Y) ∑XY=106200
2004/2005 0.00 512
2005/2006 63.33 412 ∑ X² = 13650 2006/2007 53.43 412
2007/2008 40.70 440 ∑ Y² =1111000 2008/2009 71.58 562
∑X=229 ∑Y=2338
R -0.1175
P.E.(R) 0.2975
ANNEX56
Correlation analysis between Performing assets and net profit
NSBIBL
Year DPS(X) MVPS (Y) ∑XY=28660
2004/2005 0.00 512
2005/2006 0.00 122 ∑ X² = 4959 2006/2007 0.00 127
2007/2008 0.00 184 ∑ Y² =230500 2008/2009 70.42 407
∑X=70.42 ∑Y=840
R 0.5629
P.E.(R) 0.2061

165
ANNEX57
Least Square liner trend of total deposit
NSBIBL
Year Deposit(y) YEAR- Yc=a+bx Year Yc=a+bx
2004/2005 715844.35 -2 675122.89 2003/2004 5399252.85
2005/2006 1624595.93 -1 1619948.89 2004/2005 6344078.84
2006/2007 2358908.40 0 2564774.88 2005/2006 7288904.83
2007/2008 3744506.86 1 3509600.87 2006/2007 823373.82
2008/2009 4380018.84 2 4454426.86 2007/2008 9178556.81
∑Y=12823874.38 ∑X=0 ∑ X² = 10 ∑XY=944825991
A=256774.876 b=944825.991
ANNEX58
Least Square liner trend of total deposit
EBL
Year Deposit(y) YEAR- Yc=a+bx Year Yc=a+bx
2004/2005 147212.38 -2 -138908.5 2003/2004 214000.95
2005/2006 170552.63 -1 316873.39 2004/2005 2595782.84
2006/2007 471661.67 0 772655.28 2005/2006 8051564.73
2007/2008 1124903.12 1 1228437.13 2006/2007 35073346.62
2008/2009
∑Y=3863276.38 ∑X=0 ∑ X² = 10 ∑XY=45578818.891
a=772655.28 b=455781.89
Year NSBIBL EVEREST
2008/2009 5399252.85 214000.95
2009/2010 6344078.84 2595782.84
2010/2011 7288904.83 8051564.73
2011/2012 823373.82 35073346.62
2012/2013 9178556.81 214000.95
ANNEX59
Least Square liner trend of loans and advances
NSBIBL
Year Deposit(y) YEAR- Yc=a+bx Year Yc=a+bx
2004/2005 609194.07 -2 597194.14 2003/2004 3493154.49
2005/2006 1175314.89 -1 1176386.21 2004/2005 4072346.56
2006/2007 1718791.00 0 1755578.28 2005/2006 4651538.63
2007/2008 2363559.15 1 23344770.35 2006/2007 5230730.70
2008/2009 2911032.29 2 2913962.42 2007/2008 5809922.77
∑Y=87778910.40 ∑X=0 ∑ X² = 10 ∑XY=5791920.70
a=1755578.28 b=579192.07
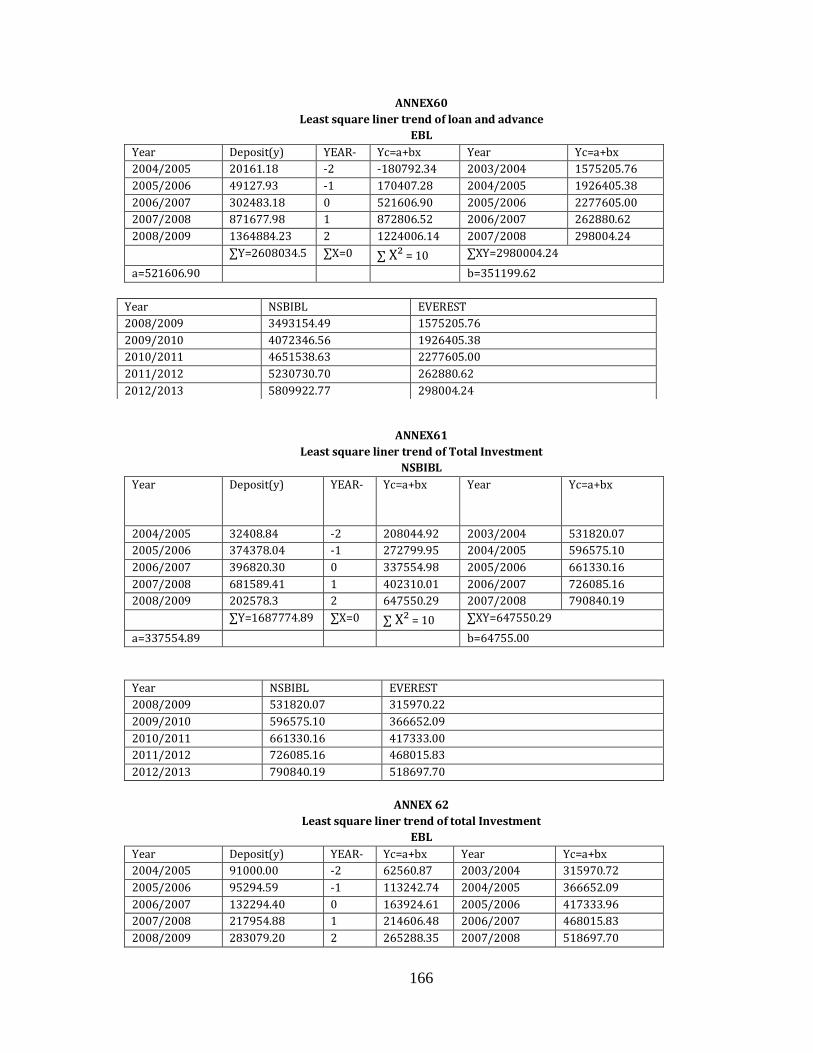
166
ANNEX60
Least square liner trend of loan and advance
EBL
Year Deposit(y) YEAR- Yc=a+bx Year Yc=a+bx
2004/2005 20161.18 -2 -180792.34 2003/2004 1575205.76
2005/2006 49127.93 -1 170407.28 2004/2005 1926405.38
2006/2007 302483.18 0 521606.90 2005/2006 2277605.00
2007/2008 871677.98 1 872806.52 2006/2007 262880.62
2008/2009 1364884.23 2 1224006.14 2007/2008 298004.24
∑Y=2608034.5 ∑X=0 ∑ X² = 10 ∑XY=2980004.24
a=521606.90 b=351199.62
ANNEX61
Least square liner trend of Total Investment
NSBIBL
Year Deposit(y) YEAR- Yc=a+bx Year Yc=a+bx
2004/2005 32408.84 -2 208044.92 2003/2004 531820.07
2005/2006 374378.04 -1 272799.95 2004/2005 596575.10
2006/2007 396820.30 0 337554.98 2005/2006 661330.16
2007/2008 681589.41 1 402310.01 2006/2007 726085.16
2008/2009 202578.3 2 647550.29 2007/2008 790840.19
∑Y=1687774.89 ∑X=0 ∑ X² = 10 ∑XY=647550.29
a=337554.89 b=64755.00
Year NSBIBL EVEREST
2008/2009 531820.07 315970.22
2009/2010 596575.10 366652.09
2010/2011 661330.16 417333.00
2011/2012 726085.16 468015.83
2012/2013 790840.19 518697.70
ANNEX 62
Least square liner trend of total Investment
EBL
Year Deposit(y) YEAR- Yc=a+bx Year Yc=a+bx
2004/2005 91000.00 -2 62560.87 2003/2004 315970.72
2005/2006 95294.59 -1 113242.74 2004/2005 366652.09
2006/2007 132294.40 0 163924.61 2005/2006 417333.96
2007/2008 217954.88 1 214606.48 2006/2007 468015.83
2008/2009 283079.20 2 265288.35 2007/2008 518697.70
Year NSBIBL EVEREST
2008/2009 3493154.49 1575205.76
2009/2010 4072346.56 1926405.38
2010/2011 4651538.63 2277605.00
2011/2012 5230730.70 262880.62
2012/2013 5809922.77 298004.24

167
∑Y=819623.07 ∑X=0 ∑ X² = 10 ∑XY=506818.69
a=163924.61 b=50681.87
ANNEX63
Least square liner trend of Net Worth
NSBIBL
Year Deposit(y) YEAR- Yc=a+bx Year Yc=a+bx
2004/2005 139309.10 -2 121514.37 2003/2004 355856.27
2005/2006 157088.54 -1 168382.75 2004/2005 402724.65
2006/2007 196527.33 0 215251.13 2005/2006 449593.03
2007/2008 262270.85 1 262119.51 2006/2007 496461.41
2008/2009 321059.82 2 308987.89 2007/2008 543329.70
∑Y=1076255.64 ∑X=0 ∑X2= 10 ∑XY=468693.75
a=215251.18 b=468683.38
Year NSBIBL EVEREST
2008/2009 355856.27 173522.70
2009/2010 402724.65 206524.41
2010/2011 4495593.03 239526.12
2011/2012 496461.41 272327.83
2012/2013 543329.7 305529.54
ANNEX64
Least square liner trend of Net Worth
NSBIBL
Year Deposit(y) YEAR- Yc=a+bx Year Yc=a+bx
2004/2005 26057.58 -2 8514.15 2003/2004 173522.70
2005/2006 35617.43 -1 41515.86 2004/2005 206524.41
2006/2007 38320.17 0 74517.57 2005/2006 239526.12
2007/2008 127435.67 1 107519.28 2006/2007 272527.83
2008/2009 145157.02 2 140520.99 2007/2008 305529.54
∑Y=273587.87 ∑X=0 ∑ X² = 10 ∑XY=330017.12
a=74517.57 b=33001.71
ANNEX65
Least square liner trend of Net Profit
NSBIBL
Year Net Profit(y) YEAR- Yc=a+bx Year Yc=a+bx
2004/2005 7370.83 -2 25209.23 2003/2004 45143.78
2005/2006 37886.58 -1 29196.14 2004/2005 49130.69
2006/2007 44920.94 0 33186.05 2005/2006 53117.60
2007/2008 58976.52 1 34169.96 2006/2007 57104.51
2008/2009 16760.39 2 41156.87 2007/2008 61091.42
∑Y=273587.87 ∑X=0 ∑ X² = 10 ∑XY=39869.06
a=33183.05 b=3986.91

168
Year NSBIBL EVEREST
2008/2009 45143.78 33030.64
2009/2010 40130.69 42330.27
2010/2011 53117.60 51629.90
2011/2012 57104.51 60929.53
2012/2013 61051.42 70229.16
ANNEX66
Least square liner trend of Net Profit
EBL
Year Net Profit(y) YEAR- Yc=a+bx Year Yc=a+bx
2004/2005 (3947.91) -2 (13467.51) 2003/2004 33033.64
2005/2006 (9606.47 -1 (4167.88) 2004/2005 42330.27
2006/2007 (11050.90) 0 5131.75 2005/2006 51629.90
2007/2008 25033.74 1 14434.01 2006/2007 60920.53
2008/2009 25230.30 2 23721.01 2007/2008 70229.16
∑Y=25658.78 ∑X=0 ∑ X² = 10 ∑XY=92996.63
a=5131.75 b=9299.63
ANNEX67
Least square liner trend of EPS
NSBIBL
Year EPS(y) YEAR- Yc=a+bx Year Yc=a+bx
2004/2005 6015 -2 21.02 2003/2004 37.62
2005/2006 31.58 -1 24.34 2004/2005 40.94
2006/2007 37.45 0 27.66 2005/2006 44.26
2007/2008 49.17 1 30.98 2006/2007 47.58
2008/2009 13.97 2 34.30 2007/2008 50.90
∑Y=138.32 ∑X=0 ∑ X² = 10 ∑XY=33.23
a=27.66 b=3.32
Year NSBIBL EVEREST
2008/2009 37.62 14.54
2009/2010 40.94 18.26
2010/2011 44.26 21.98
2011/2012 47.58 25.70
2012/2013 50.90 29.42
ANNEX68
Least square liner trend of EPS
EBL
Year EPS(y) YEAR- Yc=a+bx Year Yc=a+bx
2004/2005 -6.15 -2 -4.06 2003/2004 14.54
2005/2006 -10.01 -1 -0.34 2004/2005 18.26
2006/2007 -9.21 0 3.38 2005/2006 21.98
2007/2008 21.29 1 7.10 2006/2007 25.70
2008/2009 21.30 2 10.82 2007/2008 29.42

169
∑Y=138.22 ∑X=0 ∑ X² = 10 ∑XY=87.16
a=3.378 b=3.72
ANNEX69
Least square liner trend of MVPS
NSBIBL
Year MVPS(y) YEAR- Yc=a+bx Year Yc=a+bx
2004/2005 512 -2 442 2003/2004 506.00
2005/2006 412 -1 454.80 2004/2005 518.80
2006/2007 412 0 467.60 2005/2006 531.60
2007/2008 440 1 480.40 2006/2007 544.60
2008/2009 562 2 493.20 2007/2008 557.20
∑Y=2338 ∑X=0 ∑ X² = 10 ∑XY=128
a=467.6 b=12.80
Year NSBIBL EVEREST
2008/2009 506 430.8
2009/2010 518.8 518.4
2010/2011 531.6 606.0
2011/2012 644.40 693.6
2012/2013 504.2 781.2
ANNEX 70
Least square liner trend of Market value per share
EBL
Amount in Rs.
ANNEX 71
Calculation of Mean, Coefficient of variation, Combined Standard Deviation and 't'
Amount in thousand
Year MVPS (Y) Year-2002/2003 Yc= a+bx Year Yc= a+bx
2004/2005 0 -2 -7.2 2002/2003 430.8
2005/2006 122 -1 80.4 2003/2004 518.4
2006/2007 127 0 168.0 2004/2005 606.0
2007/2008 184 1 255.6 2005/2006 693.6
2008/2009 407 2 343.2 2006/2007 781.2
∑Y = 840 ∑X= 0 ∑X2= 10 ∑XY= 876
a= 168 b= 87.6
Year Ratio of
NSBIBL
X
(X- ) (X-X )2 Ratio of EBL Y (Y-Y‾) (Y- Y‾)²
2004/2005 83.97 29.9 895.21 32.57 -31.45 989.10
2005/2006 32.01 -22.05 486.20 1105.81 -41.49 1476.4
2006/2007 38.73 -15.32 234.7 62.11 -1.91 3.65
2007/2008 55.96 1.91 3.36 63.23 -0.79 0.62
2008/2009 59.56 5.51 30.36 56.4 -7.62 58.06

170
Arithmetic Mean (𝑋) = 𝑋
𝑛1 =
270
5 = 54.05
Arithmetic Mean (𝑌) = 𝑌
𝑛2 =
320.12
5 = 64.02
Standard Deviation (S.D.) ,
6 = √X2−(X)2
n= √
X−X)2
n1= √
1650.12
5= 18.16
Standard Deviation (S.D.) 62 = √ (Y−Y)2
n1= √
2797.83
5= 23.66
Coefficient of Variation,
CV1 = 61
𝑋× 100% =
18.16
54.05 = 33.61%
Coefficient of Variation,
CV1 = 62
𝑌× 100% =
23.66
64.02 = 36.99%
Combined standard Deviation (Combined SD),
S = √ (𝑋−𝑋)2+ (𝑌−𝑌)
𝑛1+𝑛2−2= √
1650.12+2797.83
5+5−2
Test Statistic,
T = 𝑋−𝑋
√1
𝑛1+
1
𝑛2
=54.05−64.02
√23.58 1/5+1/5
/t/ = 0.669
ANNEX 72
Calculation of Karl Pearson's Coefficient of Correlation and Probable error of Coefficient of Correlation,
n=5 ∑X= 270.23 ∑(X-X‾ )2
=1650.12
∑Y =320.12 ∑(Y-Y‾)²= 2797.83
Year EPS(X) MPVS (Y) XY X² Y²
2004/2005 6.15 512 3148.8 37.83 430.8
2005/2006 31.58 412 13010.96 997.30 518.4
2006/2007 37.45 412 15429.4 1402.50 606.0
2007/2008 49.17 440 21634.8 21634.8 693.6
2008/2009 13.97 562 7851.14 7851.14 781.2
n=5 ∑X = 138.3 ∑Y= 2338 ∑XY= 61080 ∑X² = 5050 ∑Y²= 1111000

171
Karl Perarson's Coefficient of correlation
= 𝑛𝑋𝑌−𝑋
√𝑛𝑋2−(𝑋)2 √𝑌2 (𝑌)2
= 5×61080−138.3×2338
√5×5050−(138.3)2 √1111000−(2338)2
= −17945.4
23340 = 0.7701
Probable error of coefficient of correlation,
P.E. = 0.6745 0.6745×1−(−0.7701)2
√5
ANNEX 73
Least Square Linear trend of EPS
Here,
A = 𝑌
𝑁 =
138
5=27.66
B= 𝑋𝑌
𝑋2 = 138
5 = 27.66
Year EPS(Y) Year-X X² XY Yc = a+ bx
2004/2005 6.15 -2 -12.30 262144
2005/2006 31.58 -1 -31.58 169744
2006/2007 37.45 0 0 169744
2007/2008 49.17 2 49.17 193600
2008/2009 13.97 1 27.94 315844
n=5 ∑Y = 138.3 ∑X = 0 ∑X² = 10
2009/2010 3 9 37.62
2010/2011 4 16 40.94
2011/2012 5 25 44.26
2012/2013 6 36 47.58
2013/2014 7 39 50.90