Embed Size (px)
Citation preview

Financial Financial PlanningPlanning

Financial Financial PlanningPlanning
Portions taken from Emery and Finnerty: Corporate Financial Management – Chapter 22
Edited and expanded by Del Hawley

The Financial Planning ProcessThe Financial Planning Process
LiquidityLiquidity Working CapitalWorking Capital InventoriesInventories Capital BudgetingCapital Budgeting Capital StructureCapital Structure DividendsDividends
A firm’s financial plan involves decisions about:
3 Rules of Financial Management3 Rules of Financial Management
What are the three primary rules of successful financial management?

3 Rules of Financial Management3 Rules of Financial Management
1.1. Get the cashGet the cash
2.2. Get the cashGet the cash
3.3. Get the cashGet the cash
What are the three primary rules of successful financial management?

The Cash Plumbing SystemThe Cash Plumbing System
Equity
LT Debt
Taxes
Dividends

The Cash Plumbing SystemThe Cash Plumbing System
Equity
LT Debt
Taxes
Dividends

The Cash Plumbing SystemThe Cash Plumbing System
Equity
LT Debt
Taxes
Dividends

The Cash Plumbing SystemThe Cash Plumbing System
Equity
LT Debt
Taxes
Dividends

The Cash Plumbing SystemThe Cash Plumbing System
Equity
LT Debt
Taxes
Dividends

The Cash Plumbing SystemThe Cash Plumbing System
Equity
LT Debt
Taxes
Operating
Expenses
Dividends

The Cash Plumbing SystemThe Cash Plumbing System
Equity
LT Debt
Taxes ST Debt
Mkt’l Sec
Operating
Expenses
Dividends

The Cash Plumbing SystemThe Cash Plumbing System
Equity
LT Debt
Taxes ST Debt
Mkt’l Sec
Operating
Expenses
Dividends
Fixed
Assets
Materials/Inventory
Finished Goods
Accts Pay’l
Labor

The Cash Plumbing SystemThe Cash Plumbing System
Equity
LT Debt
Taxes ST Debt
Mkt’l Sec
Operating
Expenses
Dividends
Fixed
Assets
Materials/Inventory
Finished Goods
Accts Pay’l
Labor

The Cash Plumbing SystemThe Cash Plumbing System
Equity
LT Debt
Taxes ST Debt
Mkt’l Sec
Operating
Expenses
Dividends
Fixed
Assets
Materials/Inventory
Finished Goods
Accts Pay’l
Labor

The Cash Plumbing SystemThe Cash Plumbing System
Equity
LT Debt
Taxes ST Debt
Mkt’l Sec
Operating
Expenses
Dividends
Fixed
Assets
Materials/Inventory
Finished Goods
Accts Pay’l
Labor

The Cash Plumbing SystemThe Cash Plumbing System
Equity
LT Debt
Taxes ST Debt
Mkt’l Sec
Operating
Expenses
Dividends
Fixed
Assets
Finished Goods
Accounts Rec’l
Materials/Inventory
Accts Pay’l
Labor
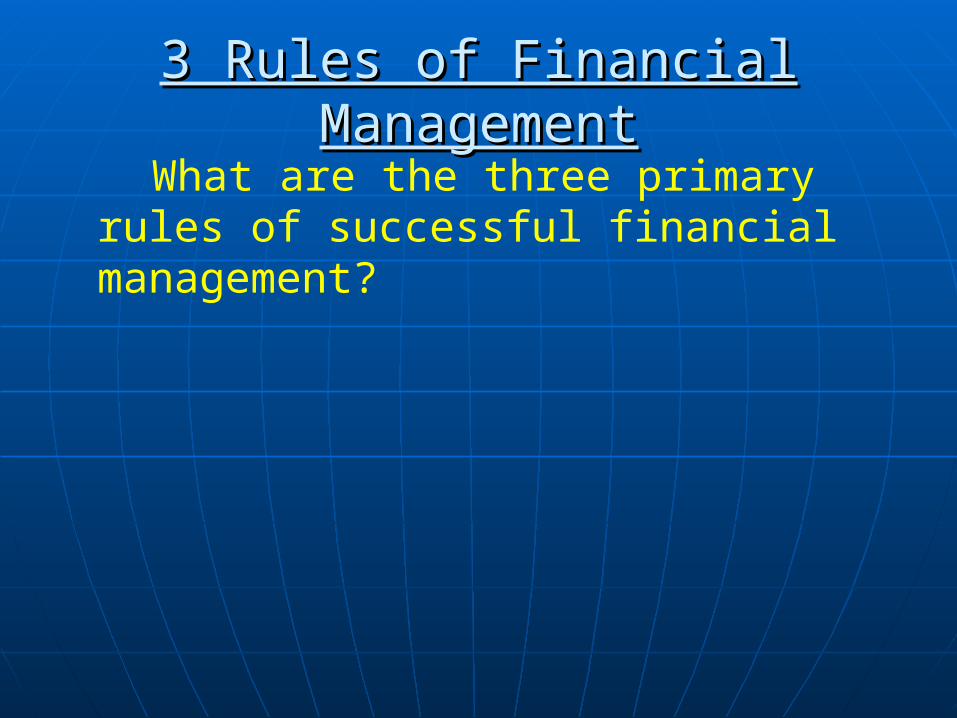
The Cash Plumbing SystemThe Cash Plumbing System
Equity
LT Debt
Taxes ST Debt
Mkt’l Sec
Operating
Expenses
Dividends
Fixed
Assets
Finished Goods
Accounts Rec’l
Materials/Inventory
Accts Pay’l
Labor
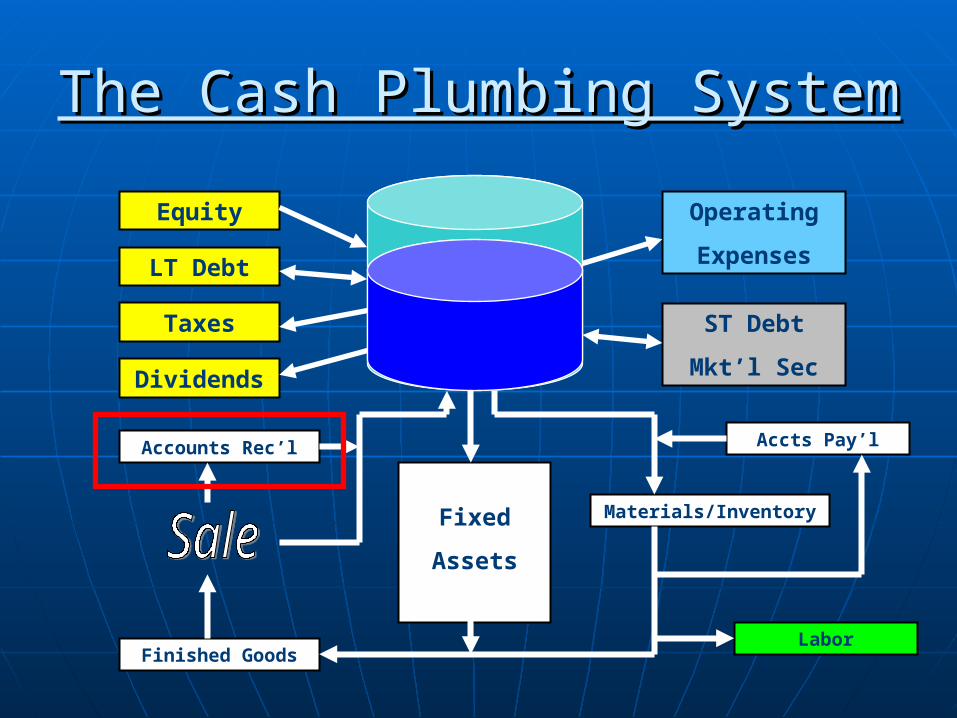
Cash Conversion CycleCash Conversion CyclePurchase Inventory
Sale on Credit
Collect Acct. Receivable
Payment of Accts. Payable
Inventory Conversion Period
Receivables Collection Period
Cash Conversion Cycle
Payables Deferral Period
Time

Cash Conversion CycleCash Conversion CyclePurchase Inventory
Sale on Credit
Collect Acct. Receivable
Payment of Accts. Payable
Inventory Conversion Period
Receivables Collection Period
Cash Conversion Cycle
Payables Deferral Period
Time

Cash Conversion CycleCash Conversion CyclePurchase Inventory
Sale on Credit
Collect Acct. Receivable
Payment of Accts. Payable
Inventory Conversion Period
Receivables Collection Period
Cash Conversion Cycle
Payables Deferral Period
Time

Cash Conversion CycleCash Conversion CyclePurchase Inventory
Sale on Credit
Collect Acct. Receivable
Payment of Accts. Payable
Inventory Conversion Period
Receivables Collection Period
Cash Conversion Cycle
Payables Deferral Period
Time

Cash Conversion CycleCash Conversion CyclePurchase Inventory
Sale on Credit
Collect Acct. Receivable
Payment of Accts. Payable
Inventory Conversion Period
Receivables Collection Period
Cash Conversion Cycle
Payables Deferral Period
Time

The Financial PlanThe Financial Plan
Financial planning Financial planning is the process of is the process of evaluating the impact of alternative evaluating the impact of alternative investing and financing decisions of investing and financing decisions of the firm.the firm.
Every financial plan has three Every financial plan has three components:components:• A modelA model• InputsInputs• OutputsOutputs

The Financial PlanThe Financial Plan
The The modelmodel is a set of mathematical is a set of mathematical relationships between the inputs and relationships between the inputs and the outputs.the outputs.
InputsInputs to the model may include: to the model may include:• Projected salesProjected sales• CollectionsCollections• CostsCosts• Interest ratesInterest rates• Exchange ratesExchange rates
The Financial PlanThe Financial Plan
The The outputsoutputs of the financial plan are: of the financial plan are:• Cash BudgetCash Budget• Pro forma (projected) financial Pro forma (projected) financial
statementsstatements• Projections for external funding Projections for external funding
requirementsrequirements

Components of the Financial PlanComponents of the Financial Plan
Every financial plan should have:Every financial plan should have:
Clearly stated strategic, operating and Clearly stated strategic, operating and financial financial objectivesobjectives..
AssumptionsAssumptions on which the plan is on which the plan is based.based.
DescriptionDescription of underlying strategies. of underlying strategies. Contingency plansContingency plans to deal with the to deal with the
variances from expectations.variances from expectations.

Benefits of Financial PlanningBenefits of Financial Planning
Future (strategic) orientationFuture (strategic) orientation Identify and quantify assumptionsIdentify and quantify assumptions Prepare for contingencies (risk Prepare for contingencies (risk
analysis)analysis) Identify funding requirementsIdentify funding requirements Assess performanceAssess performance

Cash BudgetsCash Budgets
Cash budgetsCash budgets• project and summarize cash inflows and project and summarize cash inflows and
outflowsoutflows• show monthly cash balancesshow monthly cash balances• show any short-term borrowing needed show any short-term borrowing needed
to cover cash shortfallsto cover cash shortfalls Are based on Are based on sales forecastssales forecasts.. Are usually constructed on a monthly Are usually constructed on a monthly
basis.basis.

Preparing a Cash BudgetPreparing a Cash Budget
Prepare a cash budget for Tyler Paints Prepare a cash budget for Tyler Paints for the months of April, May and June, for the months of April, May and June, given the information in the given the information in the information provided in the following information provided in the following slides.slides.

Sales – Recent and ForecastSales – Recent and Forecast
The recent and The recent and projected sales for projected sales for the company are:the company are:
FebFeb $500,000$500,000
MarMar $600,000$600,000
AprApr $1,200,000$1,200,000
MayMay $1,000,000$1,000,000
JunJun $1,000,000$1,000,000

Sales – Recent and ForecastSales – Recent and Forecast
The recent and The recent and projected sales for projected sales for the company are:the company are:
FebFeb $500,000$500,000
MarMar $600,000$600,000
AprApr $1,200,000$1,200,000
MayMay $1,000,000$1,000,000
JunJun $1,000,000$1,000,000For your project,
the sales projections are the culmination of the
marketing analysis.

Collections ForecastCollections Forecast
On average, 20% of the company’s On average, 20% of the company’s sales are for cash and the rest is sales are for cash and the rest is carried as accounts receivable with carried as accounts receivable with 45% of a given month’s sales 45% of a given month’s sales collected one month following the collected one month following the sale and the remainder collected two sale and the remainder collected two months following the sale.months following the sale.

Collections on SalesCollections on Sales
Collections in April are:Collections in April are:20% of April Sales20% of April Sales
45% of March Sales45% of March Sales
35% of February Sales35% of February Sales
20%($1,200,000) = $240,00020%($1,200,000) = $240,000
45%($600,000) = $270,00045%($600,000) = $270,000
35%($500,000) = 35%($500,000) = $175,000 $175,000
$685,000$685,000

Collections on SalesCollections on Sales April May June
Sales $1,200,000 $1,000,000 $1,000,000
t: 20% t-1: 45% t-2: 35%
$240,000 $270,000 $175,000
$200,000 $540,000 $210,000
$200,000 $450,000 $420,000
Total $685,000 $950,000 $1,070,000

Collections on SalesCollections on Sales April May June
Sales $1,200,000 $1,000,000 $1,000,000
t: 20% t-1: 45% t-2: 35%
$240,000 $270,000 $175,000
$200,000 $540,000 $210,000
$200,000 $450,000 $420,000
Total $685,000 $950,000 $1,070,000
For your project, you will need to think about the
timing of collections. You may sell everything for
cash, or you may give your customers payment terms.

Pro-Forma Accounts ReceivablePro-Forma Accounts Receivable
Uncollected sales at the end of April Uncollected sales at the end of April (Accounts Receivable) will be:(Accounts Receivable) will be:
= 35%(March Sales) + (80% of April Sales)= 35%(March Sales) + (80% of April Sales)
= 35%($600,000) + 80%($1,200,000)= 35%($600,000) + 80%($1,200,000)
= $1,170,000= $1,170,000
A/R for May = $1,220,000A/R for May = $1,220,000
A/R for June = $1,150,000A/R for June = $1,150,000

Payment ForecastsPayment Forecasts
• The cost of production materials averages The cost of production materials averages 50% of sales. Payment is made for the 50% of sales. Payment is made for the materials one month after purchase.materials one month after purchase.
• Wages average 20% of sales.Wages average 20% of sales.• Fixed costs are $120,000 per monthFixed costs are $120,000 per month• A quarterly tax payment of $200,000 is due A quarterly tax payment of $200,000 is due
in Aprilin April

Cash PaymentsCash Payments
Cash Payments in April =Cash Payments in April =
Materials 50%(March Sales)Materials 50%(March Sales)
+ Wages 20%(April Sales)+ Wages 20%(April Sales)
+ Other Fixed Expenses of $120,000+ Other Fixed Expenses of $120,000
50% x $600,00050% x $600,000
+ 20% x $1,200,000+ 20% x $1,200,000
+ + $120,00 $120,00
$920,000$920,000

Cash PaymentsCash Payments
APR MAY JUN
Materials 300,000$ 600,000$ 500,000$
Wages 240,000 200,000 200,000
Fixed Costs 120,000 120,000 120,000 Tax Payment 200,000 - -
Total Payments 860,000$ 920,000$ 820,000$

Cash PaymentsCash Payments
APR MAY JUN
Materials 300,000$ 600,000$ 500,000$
Wages 240,000 200,000 200,000
Fixed Costs 120,000 120,000 120,000 Tax Payment 200,000 - -
Total Payments 860,000$ 920,000$ 820,000$ Here’s where you will have LOTS of fun! You have to think of all of the ways that money will need to be
spent, list and justify all assumptions, and project it all out
for at least three years.
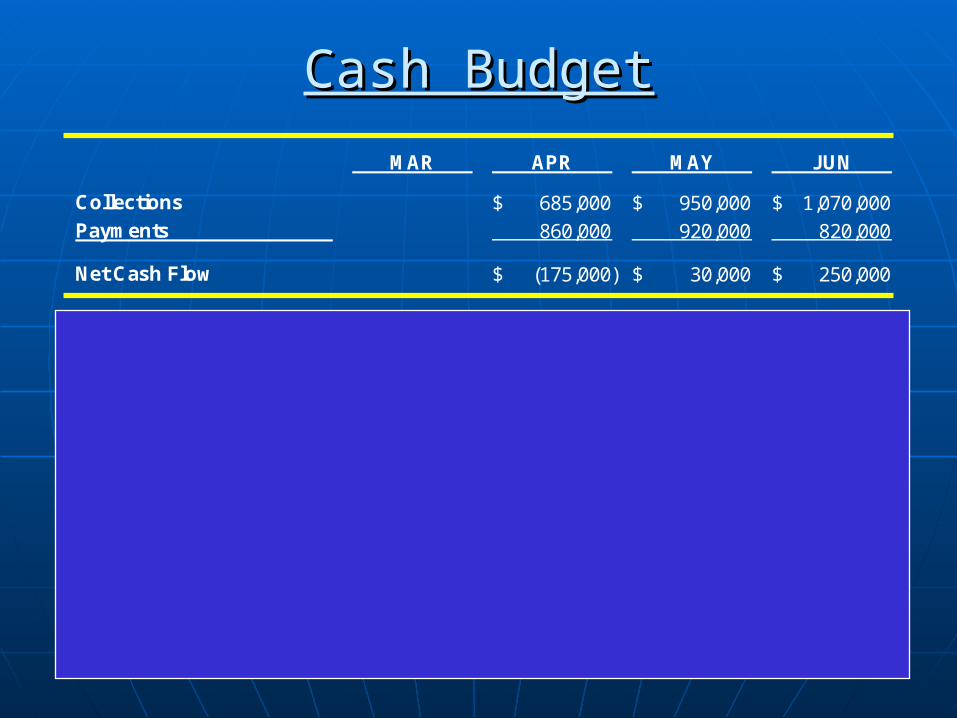
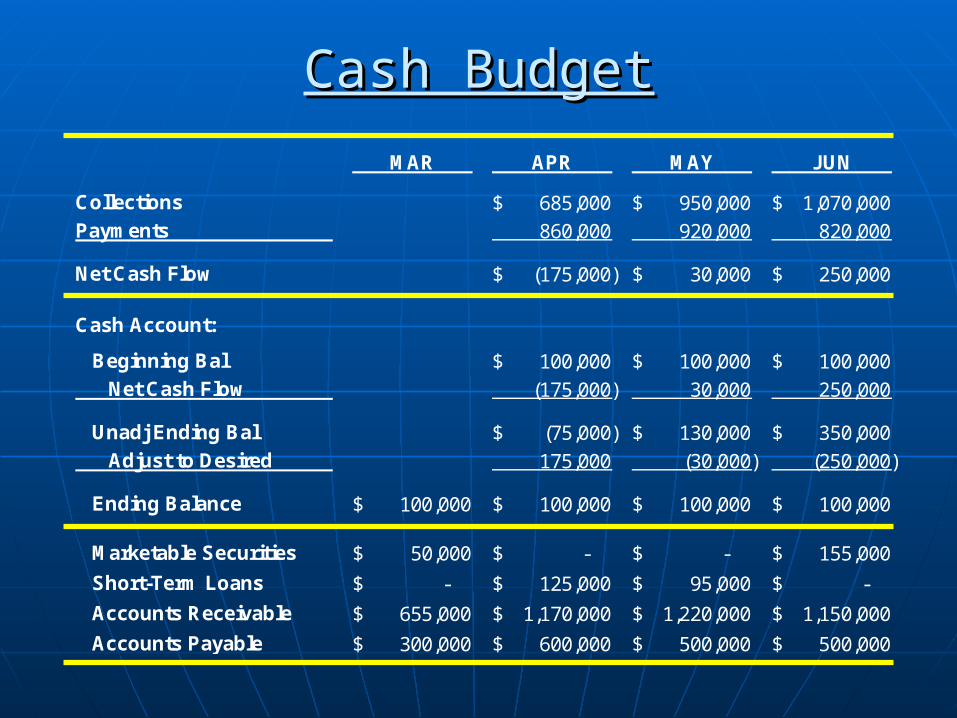
MAR APR MAY JUN
Collections 685,000$ 950,000$ 1,070,000$ Payments 860,000 920,000 820,000
Net Cash Flow (175,000)$ 30,000$ 250,000$
Cash Account:
Beginning Bal 100,000$ 100,000$ 100,000$ Net Cash Flow (175,000) 30,000 250,000
Unadj Ending Bal (75,000)$ 130,000$ 350,000$ Adjust to Desired 175,000 (30,000) (250,000)
Ending Balance 100,000$ 100,000$ 100,000$ 100,000$
Marketable Securities 50,000$ -$ -$ 155,000$
Short-Term Loans -$ 125,000$ 95,000$ -$
Accounts Receivable 655,000$ 1,170,000$ 1,220,000$ 1,150,000$
Accounts Payable 300,000$ 600,000$ 500,000$ 500,000$
Cash BudgetCash Budget

Cash BudgetCash Budget
Tyler will have to Tyler will have to borrow $125,000 in borrow $125,000 in AprilApril..
Tyler can Tyler can repay $30,000 in Mayrepay $30,000 in May, , leaving an outstanding loan balance leaving an outstanding loan balance of $155,000.of $155,000.
The short-term loan can be The short-term loan can be fully fully repaid in Junerepaid in June..

SPREADSHEETSPREADSHEET
The next lesson is on creating a The next lesson is on creating a spreadsheet model for the Tyler spreadsheet model for the Tyler Paints cash budget. Intstructions Paints cash budget. Intstructions are on the class web page.are on the class web page.
Cash BudgetCash Budget
We will also work with Problem C-1 We will also work with Problem C-1 (linked on the web page) in a (linked on the web page) in a spreadsheet to build a model that spreadsheet to build a model that produces a cash budget, an income produces a cash budget, an income statement, and a balance sheet statement, and a balance sheet that are all integrated.that are all integrated.

Pro Forma Financial StatementsPro Forma Financial Statements
Pro Forma Statements:Pro Forma Statements:
• Show the effect of the firm’s decisions Show the effect of the firm’s decisions on its future financial statements.on its future financial statements.
• Effects of alternative decisions and Effects of alternative decisions and sensitivity to changes in assumptions sensitivity to changes in assumptions can be examined.can be examined.

Percent of Sales Forecasting MethodPercent of Sales Forecasting Method
Assumes that some IS/BS items stay Assumes that some IS/BS items stay constantconstant as a percent of sales as sales as a percent of sales as sales varyvary..
In general, In general, Accounts Receivable, Inventory, Accounts Receivable, Inventory, Accounts PayableAccounts Payable (on the balance sheet), and (on the balance sheet), and cost of goods sold and some operating cost of goods sold and some operating expensesexpenses (on the income statement) vary with (on the income statement) vary with sales (maintain the same percentage of sales) sales (maintain the same percentage of sales) or cost of goods sold.or cost of goods sold.
Other items are either fixed with respect to Other items are either fixed with respect to changes in sales or they are “plug” figures.changes in sales or they are “plug” figures.
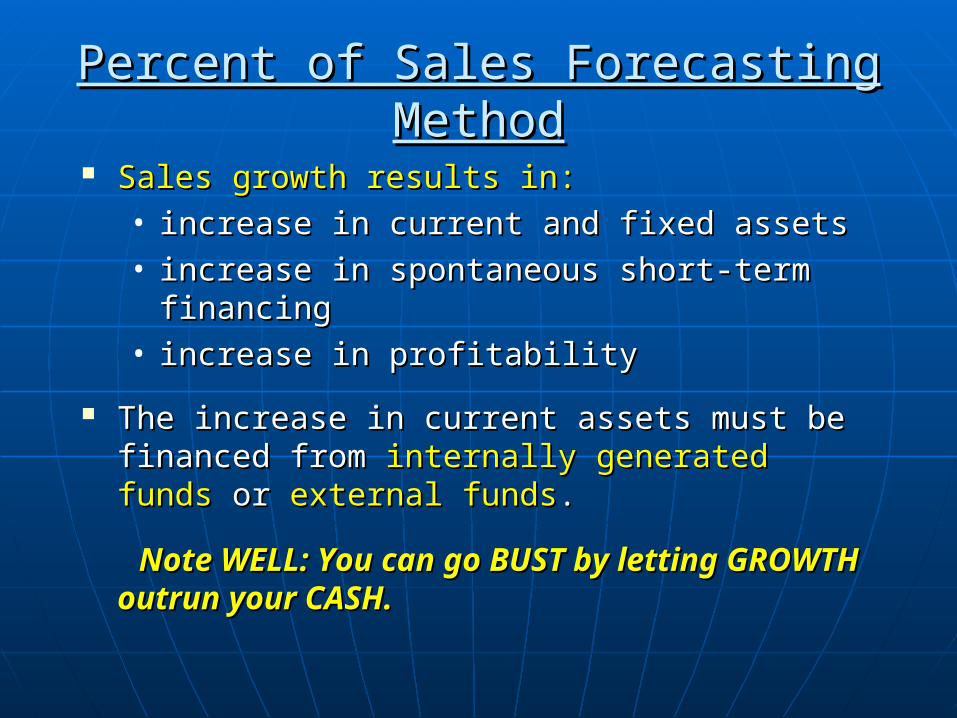
Percent of Sales Forecasting MethodPercent of Sales Forecasting Method
Sales growth results in:Sales growth results in:• increase in current and fixed assetsincrease in current and fixed assets• increase in spontaneous short-term increase in spontaneous short-term
financingfinancing• increase in profitabilityincrease in profitability
The increase in current assets must be The increase in current assets must be financed fromfinanced from internally generated funds internally generated funds or or external fundsexternal funds. .
Note WELL: You can go BUST by letting Note WELL: You can go BUST by letting GROWTH outrun your CASH.GROWTH outrun your CASH.
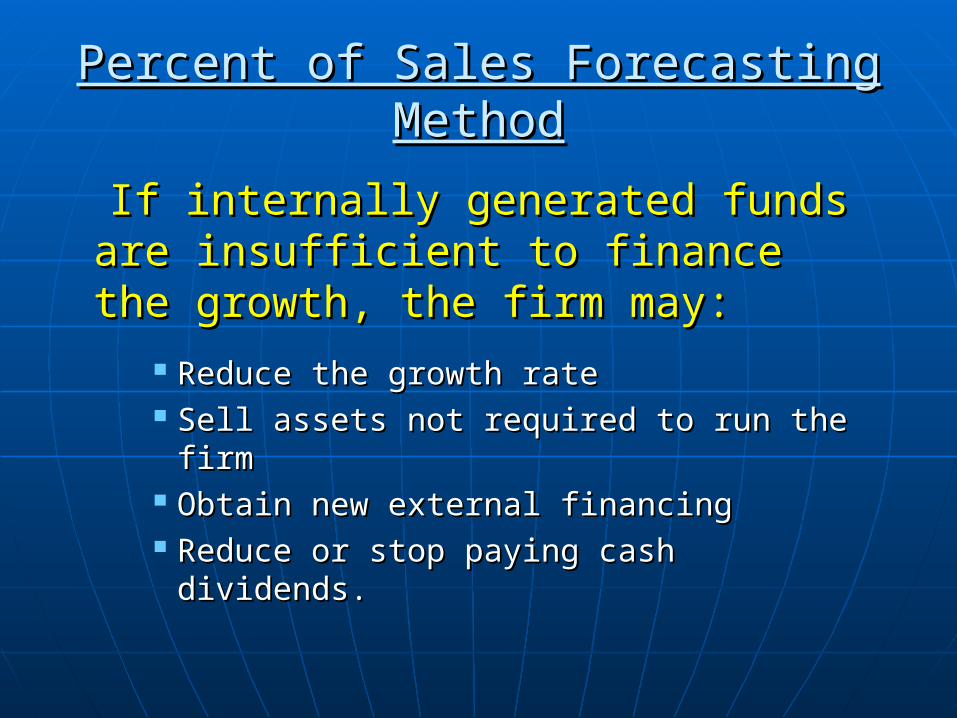
Percent of Sales Forecasting MethodPercent of Sales Forecasting Method
If internally generated funds are If internally generated funds are insufficient to finance the growth, insufficient to finance the growth, the firm may:the firm may:
Reduce the growth rateReduce the growth rate Sell assets not required to run the firmSell assets not required to run the firm Obtain new external financingObtain new external financing Reduce or stop paying cash dividends.Reduce or stop paying cash dividends.
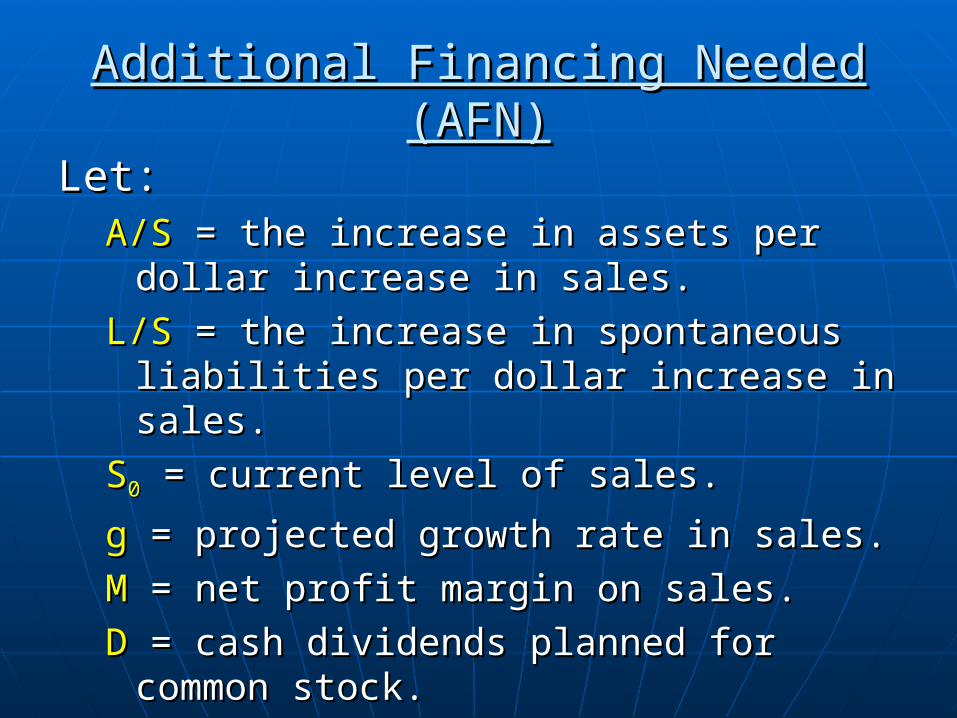
Additional Financing Needed (AFN)Additional Financing Needed (AFN)
Let: Let: A/SA/S = the increase in assets per dollar = the increase in assets per dollar
increase in sales.increase in sales.
L/SL/S = the increase in spontaneous = the increase in spontaneous liabilities per dollar increase in sales.liabilities per dollar increase in sales.
SS00 = current level of sales.= current level of sales.
g g = projected growth rate in sales.= projected growth rate in sales.
MM = net profit margin on sales. = net profit margin on sales.
DD = cash dividends planned for common = cash dividends planned for common stock. stock.

Additional Financing Needed (AFN)Additional Financing Needed (AFN)
Additional Financing Needed (AFN) =Additional Financing Needed (AFN) =
Required increase in assetsRequired increase in assets
- Increase in (spontaneous) liabilities- Increase in (spontaneous) liabilities
- Increase in retained earnings- Increase in retained earnings
NOTE: This a NOTE: This a PERMANENTPERMANENT increase increase in the funding requirement.in the funding requirement.
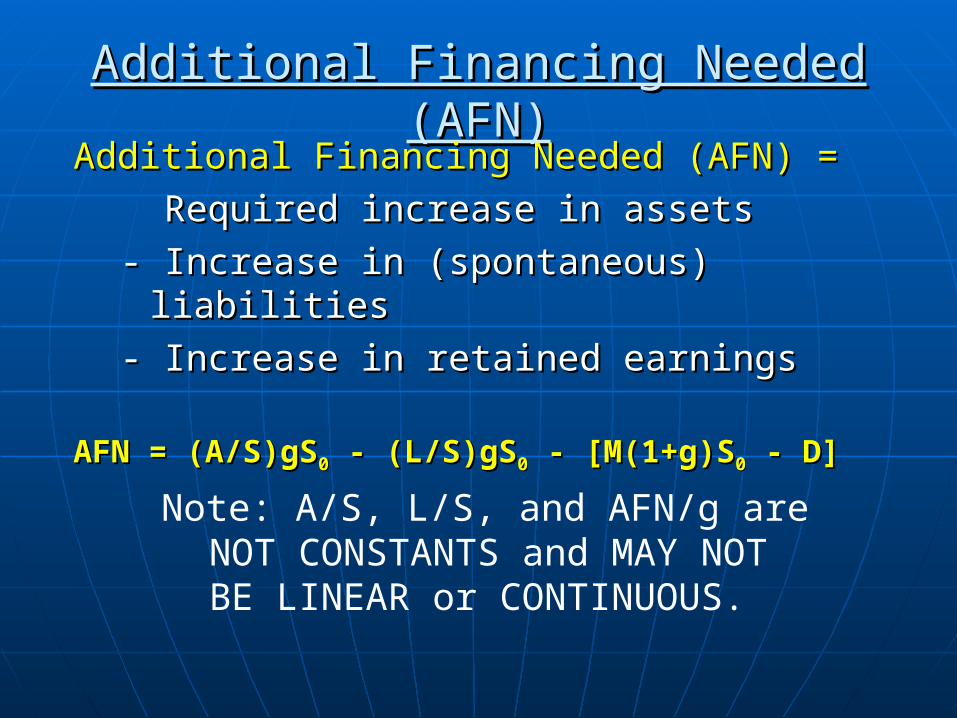
Additional Financing Needed (AFN)Additional Financing Needed (AFN)Additional Financing Needed (AFN) =Additional Financing Needed (AFN) =
Required increase in assetsRequired increase in assets
- Increase in (spontaneous) liabilities- Increase in (spontaneous) liabilities
- Increase in retained earnings- Increase in retained earnings
AFN = (A/S)gSAFN = (A/S)gS00 - (L/S)gS - (L/S)gS00 - [M(1+g)S - [M(1+g)S00 - D] - D]
Note: A/S, L/S, and AFN/g are NOT CONSTANTS and MAY NOT BE LINEAR or CONTINUOUS.

Additional Financing NeededAdditional Financing Needed
Peak Plastics expects rapid sales growth next year. Peak Plastics expects rapid sales growth next year. Sales for the current year were $4 million, and are Sales for the current year were $4 million, and are expected to grow by 20% next year. Peak wants to expected to grow by 20% next year. Peak wants to estimate the external capital that will be required to estimate the external capital that will be required to finance this growth. The firm estimates that finance this growth. The firm estimates that additional assets equal to 50% of the increase in additional assets equal to 50% of the increase in sales will be required. Liabilities will increase by sales will be required. Liabilities will increase by 18% of sales. The net profit margin is 6% and Peak 18% of sales. The net profit margin is 6% and Peak expects to pay $84,000 in dividends to its common expects to pay $84,000 in dividends to its common stockholders.stockholders.

Additional Financing NeededAdditional Financing Needed
(A/S)gS0 = $400,000
(L/S)gS0 = $144,000
M(1+g)S0 - D = $204,000
AFN = $52,000

Additional Financing Needed (AFN)Additional Financing Needed (AFN)
Note: Your book calls this Note: Your book calls this EFR for External Funds EFR for External Funds Required. Same thing – Required. Same thing – Different name.Different name.

Sustainable Growth RateSustainable Growth Rate
How fast can a company’s sales grow before it runs out of financing, assuming that it can raise additional long term debt in the same proportion to equity that it currently has. New equity will come from retained earnings (net income less dividends paid).

Sustainable Growth RateSustainable Growth Rate Specifically, the assumptions are:
1. The firm has only common stock (no preferred) and will issue no new shares.
2. S/A will remain constant
3. DPO (d) remains constant
4. A/E remains constant, implying that Total Liabilities (including LTD) can grow with Equity
5. Net Profit Margin (m) remains constant.

Sustainable Growth RateSustainable Growth Rate
EA
dmSA
EA
dmg
)1(
)1(*

Financial Financial PlanningPlanning
Portions taken from Emery and Finnerty: Corporate Financial Management – Chapter 22
Edited and Expanded by Del Hawley