Embed Size (px)
Citation preview
Financial Policies and FDI Aram Adami
Supervisor: Fredrik Sjöholm Lund University 2012 School of Economics and Managment
1
Abstract
The major force nowadays behind economic globalization is Foreign Direct Investment. Countless
studies have examined the determinants behind this phenomena and how countries can attract it.
Mainstream literature often point at classic determinants such as country characteristics as the main
source behind drawing Foreign Direct Investment but newer findings show that financial policies also
have an quit significant impact. The work tries to find if the latter has an impact and if it’s significant
in determining Foreign Direct Investment.
Keywords: Financial policies, FDI, Interest, Inflation and Exchange rate.
2
Abbreviations
ADB Asian Development Bank
AUD Australian Dollar
ECB European Central Bank
EU European Union
FDI Foreign Direct Investment
G3 US, Japan and EU
GDP Gross Domestic Product
GNP Gross National Product
IMF International Monetary Fund
IPA Investment Promotion Agency
MNE Multi National Enterprise
OECD Organization for Economic Co-operation and Development
R&D Research and Development
UN United Nations
UNCTAD United Nations Commerce and Trade Development
USD United States Dollar
WB World Bank
3
Table of Contents
1. Introduction……………………………………………………....4
1.1 Aim & Research Question..…………………….…………..…4
1.2 Disposition………………………………………………….…5
2. Theory……………………………………………………………..6
2.1 FDI………………………….………………………………….6
2.2 Determinants of FDI…..……………………………….............7
3. Previous Studies………………………………………………….10
3.1 Classical determinants...……..………………………………...10
3.2 Financial determinants………………………………………...13
4. Results and Analysis…………………………………………….18
4.1 Method and Data………....……..………………….………....18
4.2 Findings and Analysis...….……………………….…………..22
5. Conclusion…………………………………………………..……28
Appendix…………………………………………………………30
4
1. Introduction
1.1 Aim & Research Question
This paper examines the effect of financial policies on Foreign Direct Investment, FDI. More precisely
it covers the impact the various financial instruments such as interest rates, inflation and currency
exchange rates have on inward FDI. Shedding light on a less mainstream perspective on what the
determinants of FDI could be.
Foreign Direct Investment is an economic activity that has taken speed the last decades resulting in a
hot topic across the world. Often portrayed as a source of development and economic growth this has
led to an ever-growing research about the determinants of FDI. What factors that attracts FDI and in
which ways. This literature has evolved through the years as the phenomena itself which today is the
major force behind economic globalization. The main outlines in the literature concerning the
determinants of FDI are often focused on the classic determinants compromised of country
characteristics and natural resources of that specific country. Albeit still valid there have been a surge
in newer literature that shed light on more financial sense of matters. Financial policies as inflation,
exchange rates and interest rates have much in common and intertwined in the same context. Some
argue their major impact in drawing FDI. Thus, the interesting question here is if these determinants
actually do impact as some scholars state or not. This could develop into an interesting field for policy
makers around the world for trying to attract FDI. By not being stuck to classical determinants of FDI,
this more recent area can be an evolution for the framework in how to best draw FDI. Undoubtedly
important for many countries lacking the vital foreign engagement for developing their economy.
Furthermore this work should be interesting for not only policymakers looking to draw inward FDI but
also for MNE managers or policy makers for outward FDI, trying to locate their activities. By
analyzing more recent studies about financial aspects it delivers valuable insight to the more common
notion behind locating FDI. The work analyzes if the newer literature that stresses the impact of
financial policies effect on FDI holds and in which way. Implying if and how financial determinants
such as interest, inflation and exchange rates impact FDI. This to complement the mainstream
literature on more common ‘classic’ determinants. Both for giving a more variance framework but also
insight in a more unexplored area, hopefully resulting in a running board for further research within
the same or relating field. Then combining both the classical and more recent literature to get the
whole frame. The work glance the theory behind both parts of determinants for grasping the literature,
then retrieving panel data from OECD countries for trying to examine the research question with fixed
effect regressions in STATA including the specific determinants as variables in our models. Hopefully
5
reaching an answer to our research question and clarify some of the newer questions concerning
determinants of FDI. Hence to the research question;
Do financial policies impact FDI?
Implying if financial determinants such as exchange rate, interest rate and inflation affect FDI and if
significant.
1.2 Disposition
Starting with the introduction chapter highlighting the work, the aim, research question, methodology
and the works contribution for the field of financial policies and FDI could further be developed and
how readers can make the most of this paper. Next chapter is theory, describing why FDI is
interesting, why there is FDI, OLI paradigm and briefly about determinants of FDI. The third chapter
concerns previous studies in this field by categorizing FDI into classical and financial parts, to
underline the focus in this work, the financial part. This categorization is for more easy grasping the
context of the determinants and for distinguishing our research problem later on. The fourth chapter is
about explaining data, methodology with the help of STATA, results and analysis. Likewise analyzing
the results, explaining them together with the previous theory chapter.
The main aim is to analyze results with theory and observe interesting findings. Finally, the work ends
with the conclusion, picking out the most important findings and of course answering the research
problem and giving further ideas for further works in this field.
6
2. Theory
2.1 FDI
”Foreign Direct Investment, or FDI, is a measure of foreign ownership of domestic productive assets
such as factories, land and organizations. Foreign direct investments have become the major
economic driver of globalization, accounting for over half of all cross-border investments.”
(EconomyWatch 2010)
The last decades have meant a speedy process of globalization and forefronts of these international
investments have been Foreign Portfolio Investment and Foreign Direct Investment. According to The
Asian Development Bank, ADB the FDI has grown tremendously in recent years due to technological
progression, international integration of production, marketing networks, increase in bilateral treaties,
and encouragement of multilateral banks which have led to beneficial effects. (Dermihan & Masca
2008:357) The differences between these two ways of free capital flows between countries is that
Foreign Portfolio investment is capital investment into equities, bonds and other financial instruments
with no management control over firms in the host countries, countries which receives the investment.
FDI on the other hand has the definition that the investor, often a MNE from the home country, needs
to at least own ten percent of the equity of a firm to exercise management control, this to obtain voting
right within the firm. Also it has to be tangible assets which the equity involves, therefore not FPI
assets but land, machineries, equipment etc. Thus, FDI is a more long-term and secure way of
conducting economic relationships while FPI is more indirect and volatile phenomenon, explaining the
explosion of FDI the last decade.
There are two different ways of FDI; horizontal and vertical. Horizontal FDI is when the foreign
investing firm duplicates its activities in the host countries, reproducing same product in the new host
country. Vertical FDI is as the name signals when the firm splits up its value chain activities to
different countries. By locating up- or downstream activities the firm can benefit from various factors
such as cheap labor, larger market or natural resources. This manner of FDI is widely known as
offshoring or outsourcing.
“Direct investment is the category of international investment that reflects the objective of obtaining a
lasting interest by a resident entity in one economy in an enterprise entity in another
economy…(it)…compromises not only the initial transaction but also all subsequent transactions
between affiliated enterprises.” (IMF 1993)
7
2.2 Determinants of FDI
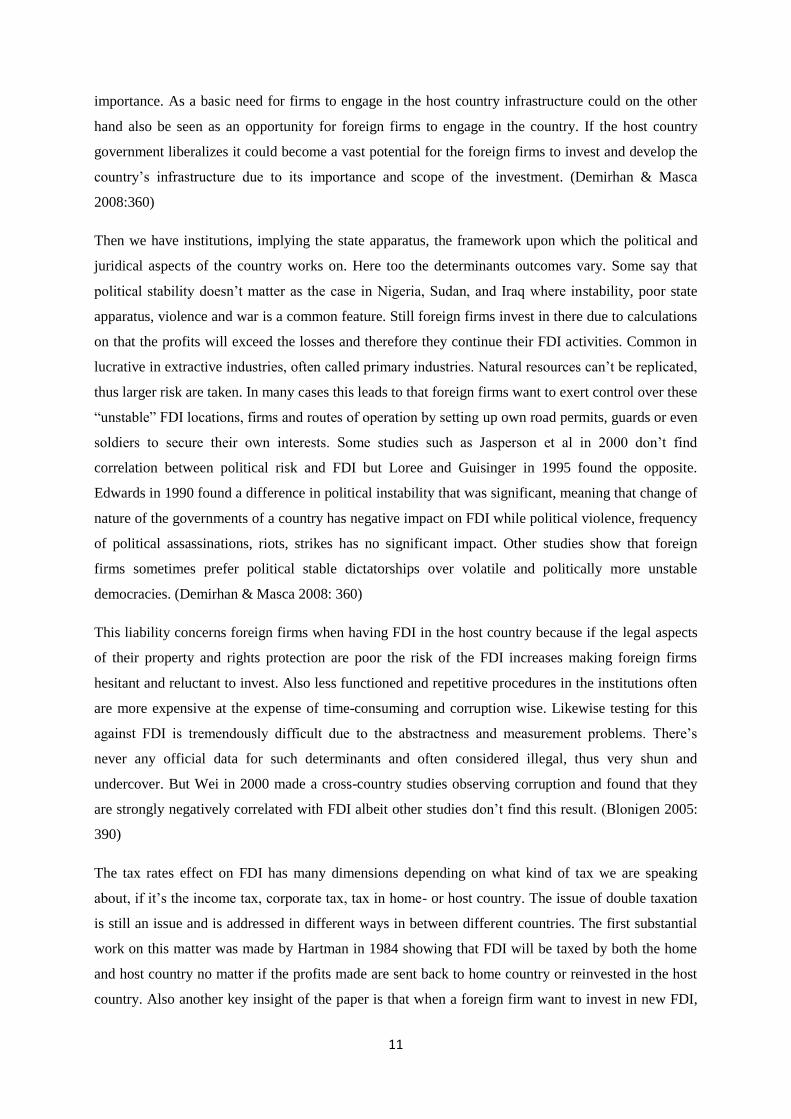
The OLI paradigm is the main framework to describe the determinants of FDI in the context of
international trade. The three letters consists of three different advantages, ownership, location and
internalization.
“These three concepts describe different aspects of international production and trade. They tried to
explain why firms undertake international production, where the production would take place and how
and why multinational firms could earn better profits than domestic producers in the host countries
could.” (Cleeve 2009:236)
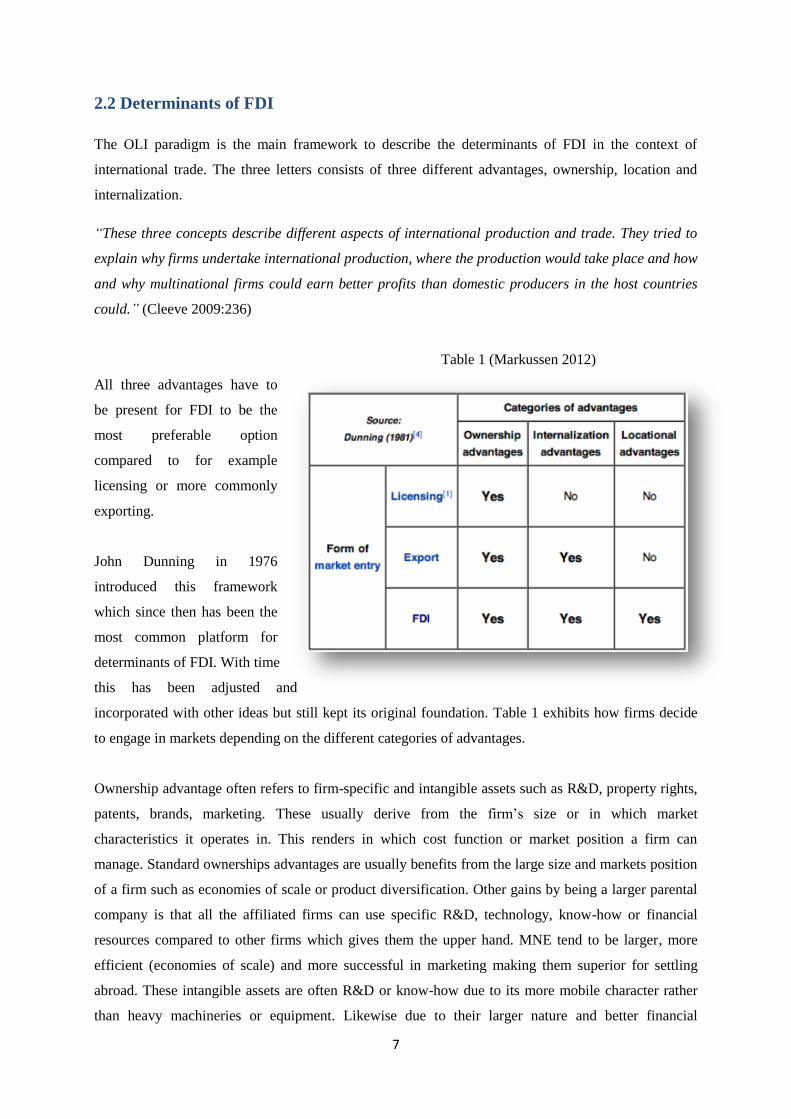
Table 1 (Markussen 2012)
All three advantages have to
be present for FDI to be the
most preferable option
compared to for example
licensing or more commonly
exporting.
John Dunning in 1976
introduced this framework
which since then has been the
most common platform for
determinants of FDI. With time
this has been adjusted and
incorporated with other ideas but still kept its original foundation. Table 1 exhibits how firms decide
to engage in markets depending on the different categories of advantages.
Ownership advantage often refers to firm-specific and intangible assets such as R&D, property rights,
patents, brands, marketing. These usually derive from the firm’s size or in which market
characteristics it operates in. This renders in which cost function or market position a firm can
manage. Standard ownerships advantages are usually benefits from the large size and markets position
of a firm such as economies of scale or product diversification. Other gains by being a larger parental
company is that all the affiliated firms can use specific R&D, technology, know-how or financial
resources compared to other firms which gives them the upper hand. MNE tend to be larger, more
efficient (economies of scale) and more successful in marketing making them superior for settling
abroad. These intangible assets are often R&D or know-how due to its more mobile character rather
than heavy machineries or equipment. Likewise due to their larger nature and better financial
8
background MNE can afford strategic pricing when entering markets. Implying loss in the short-term
in order to eliminate competitors and then by profiting with larger future markets shares. Also taking
full advantage of bureaucratic and tax regulations by funding their FDI affiliated with either host
country or home country funds depending on the most preferable option. (Cleeve 2009:237-239)
Locational advantage describes in short efficiencies or savings gained from avoiding transport costs
from e.g. exporting. Natural resources specific to the host country such as oil, natural gas, minerals,
and rivers for building dams etc. The resources don’t necessarily need to be natural but could be
human such as skilled labor, lower wages or access to industrial clusters/agglomerations. Moreover for
circumventing various trade barriers as tariffs, red tape or time-consuming bureaucracy. Political
stability is somewhat vital for deciding where to engage due to that institutions and the whole state
apparatus is built upon this. Furthermore firms in FDI many times prefer being located in proximity to
large home country markets. The majority of the inward FDI to the developing countries are often
redirected there due to this advantage but on the other hand the negative effect is that due to its
connection to natural resources leaves little or no room for reaping the positive side effects and
linkages which come with the FDI due to its narrow scope. (Cleeve 2009:241) (Blanton, R. & S.
Blanton 2007:144)
The last advantage, internalization, is to maintain possession of benefits rather than needing to export,
license to or joint venture. It’s considerably about having assets or managing operations within the
firm rather than doing it at an arms-length with the host country market. Let it be transactions,
cooperating, and production. Market failure can greatly affect FDI in a negative way. Loopholes in
contracts together with a weak legal system gives room for difficulties. Also ambiguousness in valuing
know-how deter firms to further engage outside the firm. These insecurities give an advantage to
internalize the firms’ activities due to the transaction cost effectiveness. Firms often consider this
advantage so important that even though costly they continue monitor the internalization. (Erderner
and Shapiro 2005:419)
Assume a firm operating on a domestic market having ownership advantage but none of the other
advantages and wants to enter the foreign market by any of these three routes. Then it’s forced to
licensing due to that ownership advantage is the only advantage it has compared to the host country
firms when there aren’t any benefits to extract from either location or internalization. Suppose it
additionally would have internalization advantage too. Implying it should engage in exports due to the
leverage it has compared to competitors but has no need to enter the market due to lack of locational
advantages. If the last one too is fulfilled then there’s no reason not to enter the foreign home country
and engage in FDI as the market should be ripe for gains. (Cleeve 2009:236)
9
“To explain the difference in the FDI performance among countries, it is necessary to understand
how foreign investors choose their investment locations. The FDI usually goes to the countries where
it is possible to combine the ownership advantages with the location specific advantages of the host
countries through internalization advantages of foreign investment.” (Botric and Skuflic 2012:3)
UNCTAD for example divides the determinants into three different categories, policy framework,
economic determinants and business facilitation. The first focuses on different government or
multilateral policies conducted by politicians for trade and FDI in general. The second part is more the
host country characteristics such as the market, labor, resources etc. The last part is more about how
well a country markets these two above and how well the country facilitates and organizes commerce
in general. For most appropriate research for the work we choose the main economic determinants
together with financial policies determinants from the first part for answering our research question.
Thus, we will review main determinants of FDI plus focusing on the financial determinants of FDI.
(UNCTAD 2009:8)
The last decades have resulted into stiff competition between different countries in attracting FDI and
this part has experience increased competition almost to the verge of bidding competition, often
resulting into paying overprice for the benefits of FDI. These determinants can be having an
investment promotion agency conducting the marketing of a country explaining why firms should
invest in the specific country and how. Thus, guiding and facilitating foreign firms into investing in
their country with streamlining procedures and quick examination of the proposed FDI ideas before
actually proceeding investing.
Other aspects can be giving foreign firms direct monetary incentives such as reducing or abolishing
corporate or income taxes. Streamlining and favoring legal and juridical aspects. Also designing
special free trade areas or tax free zones solely for building certain areas for drawing FDI. Placing
them strategically, often to main industrial areas or border areas, with suitable business environment,
could be close to resources, labor pools and matching down and up streams companies, for tightly
notching the FDI into the host country economy. Hence, incorporating the foreign firm best into the
domestic economy and for retrieving the most of the spillovers. (Adami 2012:9-10) The financial
determinants are important as they are a combination in the same context within the economy in whole
and not only for attracting FDI. It would’ve been interesting measuring other aspects of determinants
of FDI such as investment promotion or facilitation but it’s very to put numbers on how well an
investment promotion agency works or how much a government bids to attract FDI. The variables
here are often abstract and more qualitative than quantitative making the research far more complex
although not impossible for a further research for example.
10
3. Previous studies
3.1 Classical determinants
Studies have shown that market size as GDP, GDP per capita and population are the main classic
determinants of horizontal FDI. Explaining firm’s interest in larger and richer markets for their
products. Reaping the benefits of larger market sizes for increased sales and therefore profits. Hence,
utilizing the economies of scale uttermost, explaining the determinants popularity. The reason why
one uses GDP per capita could be to see the income level of the country. Other studies have shown
that the GDP growth have been significant compared to only GDP. Summing, most studies have
shown correlation between market size and FDI inflows. As the OLI paradigm previously described
firms are interested in exploiting new markets.
“A classic reason for FDI is the search for new markets. FDI is positively influenced by the size of the
host economy measured by its GDP or population (Kobrin, 1976). Large markets provide a
reasonable scope for investment and hence influence market-seeking.” (Habib and Zurawicki
2002:297)
Same work by Habib and Zurawicki states the importance of GDP per capita as they underline its
significance due to the host country’s high consuming potential.
Trade openness is another important aspect of FDI inflows. Trade openness is easily calculated as
export plus imports divided over GDP, explaining how much trade a country have as a share of the
economy. Very common determinant due to that trade and FDI often go in accordance. Showing the
government’s willingness for globalization in both aspects. But there is a contradiction here in tariff
jumping, explaining that the more restrictive a government is on exports with higher tariffs and
customs the higher are the incentives to FDI in that country. This due to higher fixed costs for FDI
than exports. So the basic idea for including this variable is that most of the FDI which we mentioned
in the horizontal FDI for example is made in often sectors with a lot of trade, often intra industrial
trade within multinational enterprises, MNE’s. (Demirhan & Masca 2008: 358)
“Countries open to international trade provide a good platform for global business operations. Also, a
country's international orientation reflects its competitiveness.” (Habib and Zurawicki 2002:297)
Infrastructure is an interesting determinant. Partly due to its extensiveness and partly for its mixed
incentives for FDI. Infrastructure has a wide meaning of society binding components binding together
a society or country together with one medium. One can explain infrastructure with transport ways
such as railroads, highways, airports or communication mediums as telephone/mobile lines, internet.
Many studies point at infrastructure as a main failure for not being able to attract FDI due to its
11
importance. As a basic need for firms to engage in the host country infrastructure could on the other
hand also be seen as an opportunity for foreign firms to engage in the country. If the host country
government liberalizes it could become a vast potential for the foreign firms to invest and develop the
country’s infrastructure due to its importance and scope of the investment. (Demirhan & Masca
2008:360)
Then we have institutions, implying the state apparatus, the framework upon which the political and
juridical aspects of the country works on. Here too the determinants outcomes vary. Some say that
political stability doesn’t matter as the case in Nigeria, Sudan, and Iraq where instability, poor state
apparatus, violence and war is a common feature. Still foreign firms invest in there due to calculations
on that the profits will exceed the losses and therefore they continue their FDI activities. Common in
lucrative in extractive industries, often called primary industries. Natural resources can’t be replicated,
thus larger risk are taken. In many cases this leads to that foreign firms want to exert control over these
“unstable” FDI locations, firms and routes of operation by setting up own road permits, guards or even
soldiers to secure their own interests. Some studies such as Jasperson et al in 2000 don’t find
correlation between political risk and FDI but Loree and Guisinger in 1995 found the opposite.
Edwards in 1990 found a difference in political instability that was significant, meaning that change of
nature of the governments of a country has negative impact on FDI while political violence, frequency
of political assassinations, riots, strikes has no significant impact. Other studies show that foreign
firms sometimes prefer political stable dictatorships over volatile and politically more unstable
democracies. (Demirhan & Masca 2008: 360)
This liability concerns foreign firms when having FDI in the host country because if the legal aspects
of their property and rights protection are poor the risk of the FDI increases making foreign firms
hesitant and reluctant to invest. Also less functioned and repetitive procedures in the institutions often
are more expensive at the expense of time-consuming and corruption wise. Likewise testing for this
against FDI is tremendously difficult due to the abstractness and measurement problems. There’s
never any official data for such determinants and often considered illegal, thus very shun and
undercover. But Wei in 2000 made a cross-country studies observing corruption and found that they
are strongly negatively correlated with FDI albeit other studies don’t find this result. (Blonigen 2005:
390)
The tax rates effect on FDI has many dimensions depending on what kind of tax we are speaking
about, if it’s the income tax, corporate tax, tax in home- or host country. The issue of double taxation
is still an issue and is addressed in different ways in between different countries. The first substantial
work on this matter was made by Hartman in 1984 showing that FDI will be taxed by both the home
and host country no matter if the profits made are sent back to home country or reinvested in the host
country. Also another key insight of the paper is that when a foreign firm want to invest in new FDI,
12
the firm rather won’t invest with capital received from the parental firm in the home country due to the
host country taxes, but rather to earn that capital in the FDI country. Thus reinvest those money into
the new FDI, this to avoid double taxation. He then tests this empirically with US firms behavior in
FDI and finds significant positive results concerning the host country tax rates. Studies about this topic
boomed after the US tax reforms in 1986 on inward US FDI. Implying FDI made by MNE in the US.
Scholes & Wolfson in 1990 made a hypothesis that the FDI in the US would increase if taxes
increased. This counterintuitive notion was built upon the idea of that if the corporate taxes in the US
increased and were more leveled and similar with worldwide taxes then the tax liability for the foreign
firms compared to domestic US firms would disappear. But due to the tax reform and the more or less
standardization of the tax rates in the US compared to worldwide taxes then the US domestic firms
don’t have the advantage compared to foreign firms. The results confirmed this hypothesis albeit not
so strong. Swenson built upon this hypothesis in 1994 by examine industries. Same results aroused,
that FDI rose with increased tax rates. Hence, hasn’t been any consensus on the corporate taxes effect
on FDI. (Blonigen 2005: 387-390)
The labor force in a country can be considered as a determinant to FDI in different senses that resource
sourcing firms seek. The different aspects of the labor force are the size of it, wages and the level of
skills they behold. There are of course various sources of wages and skills but a cross-country study
looking at determinants of FDI and when observing education they couldn’t find any nexus between
that and FDI inflows. (Ram & Zhang 2002:1)
This counterintuitive result was explained by an example from China’s trade and FDI liberalization in
its beginning which didn’t attract directly attract FDI to its more high skilled sectors/laborers. In the
same study they found out that wages did affect the FDI inflows negatively. Backing up this claim is a
work about FDI to China. A significant negative correlation was found between wage costs and FDI
inflows. Albeit both studies concerning wages have built upon studies which have shown that wage
costs can be considered negligible, contradicting their outcomes. (Braconier et al. 2005:466)
Another study maintains the notion that human skills which in essence is mostly dependent on higher
education such as tertiary education is a powerful ownership advantage for the FDI in fields such as
R&D, marketing and their manager and labor skills.
“The higher the skill content in employment is expected to be, and so a positive relation is suggested
between the variable and FDI.” (Kyrkilis and Pantelidis 2003:830)
13
3.2 Financial determinants
Now we move onto the financial aspects of the determinants. Mechanisms which can attract FDI with
minor adjustment but nonetheless important and vital aspects. These determinants often reflect the
general state of the economy or how well the fiscal and financial plans of the state are managed and
provides an indication on the business climate.
The exchange rate has been a determinant of subject lately. As firms often are risk averse they often
enjoy spreading their business across the world to benefit from business diversification. This to engage
in different markets around the world that are non-correlated in terms of economic volatility for trying
to avoid excessive shocks, not putting all eggs in the same basket mentality. Dampening the highs and
lows of different markets interest rates or currency exchange rates. This notion was primarily initiated
by Rugman in 1975 with the “risk diversion hypothesis” were he claimed that MNE diversified with
FDI because of diversification and to reduce variance in profits. Kopits in 1979 further evaluated this
idea by measuring on how much firms used FDI to spread risks and how much exchange rate and
interest rates determined FDI location for US companies. The results showed that 14% of the major
conglomerate firms assets were diversified abroad in 1962 and that figure rose to 22% in 1969.
Concerning diversification, this was backed up by even more studies showing MNE from the US
determined location of FDI depending on exchange rate and interest rate. Hughes et al. 1975, Miller &
Pras 1980, Thompson 1985, Michel and Shaked 1986, all found evidence supporting this case. Hughes
et al. work showed that MNE in the US compared to similar domestic operating firms had larger
returns but at the same time lower risk than their domestic rivals, backing the notion of benefiting
from establishing affiliates abroad. Miller & Pras observed 246 US firms and came to the conclusion
that standard deviation of net income became less volatile when one included geographical
diversification and export sales as a share of sales, while the first was more important than the latter.
Meaning that geographical diversification is a very important factor in stabilizing a firms profits.
“Since FDI could also be seen as a diversification of real assets by MNEs, exchange rates (reflecting
market risk for foreign affiliates) should affect FDI flows.” (Faeth 2009:182)
A common wisdom at the time is that exchange rates doesn’t impact FDI with the assumption of if for
example the home country’s exchange rate appreciates then the foreign investors can buy assets or
invest much cheaper but at the same time this is equalized by the lesser worth of future revenues and
profits. Crushman in 1988 examined inward FDI into the US and looked at the correlation on
exchange rate liability and FDI. Outcome showed that volatilely in expected future changes in real
price of foreign exchange, US real GNP and real US interest rates went hand in hand with volatility of
the inwards FDI stock to the US. Caves in 1989 and Froot and Stein in 1991 both looked at the
correlation between exchange rate movements and FDI in USA and the results showed that the
14
exchange rates significantly affected the inward FDI to the US. Exchange rate deprecation decreased
the FDI and vice versa due to the risk this inflicts upon foreign firms to invest in the US. The worth of
their assets will be lowered and reduced to the brink of loss which greatly impacts on their willingness
to FDI. Also, when depreciation for the host country’s exchange rate then the foreign firms will have a
great advantage in being able to fund their investment by their now stronger currency back home
compared to local firm in host country which now have seen their credit costs relatively increased.
These finding were supported by Dewenter in 1995 who’s study showed links between US dollar
depreciation and higher foreign acquisitions of American firms due to the “cheapness” it results in.
(Faeth 2009:181-183)
The same pattern concerning the currency exchange rate level and inflows of FDI is found by Klein
and Rosengren (1994) where as they say has been a ‘striking’ connection between the inflows of FDI
to the US and the USD exchange rate. (Klein and Rosengren 1994:373-374)
Barrel and Pain in 1996 stressed this outcome by finding that there is a lag between investors
speculating in investing to maximize their future profit by buying assets in the host country when that
country’s exchange rate is depreciating. So that there is a significant time lap between exchange rate
and FDI flows. Campa in 1993 and Erramilli and D’Souza in 1995 ads to this notion by introducing
the exchange rate volatility as a sign of macro economical instability and thus therefore deterring FDI.
Likewise FDI is one of few stabilizing signs for foreign investors to go by when there is lack of
information together with the lack of stability portfolio investment has. (Kiat 2008: 11-12)
Takagi and Shi (2011) wrote an article about Japanese FDI in Asia the last decades by focusing on
three exchange rate aspects; firstly exchange rate level, secondly exchange rate volatility and third
exchange rate expectations. The first aspect is about capital market imperfections which we mentioned
above. That makes the parental firm in the home country relatively richer compared to the local host
firms when it comes to investing in existing FDI or in a new acquisition. Much of the literature in this
area points at this direction where depreciation of the host country currency increases the inflows of
FDI and vice versa. The second aspect has more dimensions regarding the FDI inflows. One side is
that exchange rate volatility will decrease the FDI inflows due to the risk aversion from risk avert and
risk neutral investors. The other side is that the sunk and adjustment costs will increase and especially
heavy industries with longer lifecycles may postpone their investment. The third side emphasize on
the difference between horizontal and vertical FDI. Explaining that vertical FDI, more intra industrial
trade, will react negatively if the volatility is high due to the distortion in balances it will make
compared to horizontal FDI which is more independent in that sense and less affected. Numerous
works on the other hand show that exchange rate volatility actually increases FDI, due to that it gives
the foreign firm which invests FDI stability compared to the local firms. The last aspect is the least
studied one concerning exchange rate expectations. The ambiguous results found is that firms involved
15
in FDI either don’t take future expectations into consideration or that they have cyclic expectations
depending on the current direction of the currency exchange rates. (Shi & Takagi 2011:266-267)
“In summary, empirical studies showed that risk factors including market-based risk, exchange rate
and interest rate, could determine FDI and should thus be incorporated into the theoretical models
explaining FDI.” (Faeth 2009:183)
However there are some contrary beliefs within this issue. Faeth (2005) wrote a paper about FDI in
Australia and the determinants of it. She found unexpected positive signs when regressing for
exchange rate for the Australian Dollar. This she found surprising and tried to explain in a different
way than the mainstream notion. She found the result more complex than though as she looked at the
lagged results too. What she found out was that a stronger AUD increased the inflows of FDI but
decreased when observing the lagged observations. Another dynamic was explained as:
“A strong Australian dollar makes investing more expensive and thus discourages FDI. However, a
positive sign was also found after two lags, indicating that a strong Australian dollar encourages FDI
and affects the investment decision earlier on. This could be explained by assuming that a strong
Australian dollar reflects Australia’s sound economic environment, making it a good place to invest.
There may also be prospects of growth and higher net returns, as intermediate goods can be bought
more cheaply in the international market place.” (Faeth 2005: 19)
As previously mentioned any source of economic instability or volatility will deter foreign firms from
investing due to the risk it contains. Hence, it will decrease foreign firm’s outlook on the FDI profits.
High inflation is seen as a sign of instability for a country as it will be received by the foreign firms as
unableness from the central bank to stabilize and contain the monetary and financial indicators of the
country in check. As if it can’t balance its budgets due to the change in prices. Thus, low inflation is
preferred and signals long-term stability. Although studies have shown this consensus there haven’t
been made any proper works on what level of inflation that’s worrisome. Rogoff and Reinhart in 2002
underline that high level of inflation seldom comes by itself endogenously but rather with or deriving
from a package of macro-economic problems in the specific country. They also found out that
country’s economic growth is hit hard with inflation levels exceeding 40% also below those level
countries but with less impact. (Kiat 2008:13)
“A high rate of inflation is a sign of internal economic tension and of the inability or unwillingness of
the government and the central bank to balance the budget and to restrict the money supply. As a rule,
the higher the rate of inflation, the less are foreign direct investment decision-makers inclined to
engage in the country.” (Frey & Schneider 1985: 165)
16
Sound macro-economic stability is a vital and sound ground on building a healthy economy on and
thus attracting FDI but without stable and transparent financial policies this business environment will
take damage in the way that the risks and unpredictability will increase massively and hence averting
business in general, including FDI.
Inflation is a prime example of a financial determinant which if volatile destroy businesses due to its
impact on checks and balances of firms. Long-term expectation will be adventured and the willingness
of taking risks and long term agreements between financial mediators and firms will decrease
considerably. The market can’t have a stable inflation rate as a ground or guarantee for future
revenues. Therefore the mistrust will grow and backfire on the market with less business opportunities,
likewise leading to only the largest and profitable markets coping with the unstable market reaping
even larger market shares and profits, hurting the competition effect and efficiency on the market.
Therefore financial mediators such as banks and other creditors will need stable inflation for thriving
and giving firms the opportunity to expand with lending. Consequently, countries, especially in the
developing world, has come to grasp this notion by trying to suppress their high levels of inflation to
lower inflation rates and if not possible at least to more stable rates giving the market the necessary
constancy it needs for trust and growth. The industrialized world has been able to execute this task
successfully with the help of transparent and fairly independent central banks in cooperation with their
respective government or in the Euro zone their common central bank. The developing world has tried
to follow but their higher degree of political instability and poor record of state building compared to
the developed world haven’t let their central banks to act independently and thus tightly operating
under the behalf of governments or regimes. Hence, acting more politically motivated rather than
financially. An interesting finding of the work which focuses on Africa is that the countries with the
absolute highest inflation rate were the countries with the absolute highest probability of war too,
connected with the instability factor of high inflation aforementioned.
17
“Whether this low inflation is attained through appointing skilled, highly competent central bankers
who are known to be committed to price stability – the most common approach – or through a more
complex institutionalized system of checks and balances – or both, is second order is second order
compared to maintaining true central bank independence.” (Rogoff & Reinhart 2003:4)
On to interest rate which is tightly involved and interacted with the above two determinants. Reinhart
and Reinhart (2011) took a look on interest rates between the G3 (US, Euro and Japan) and emerging
market economies. Nowadays governments and central banks often use their interest rates as kind of
market mechanism to steer the economy. If there is an economic slowdown or recession the central
banks move to lower their interest rates in order to increase consumptions and spending while if the
opposite is true that the economy is on a high then usually central banks raise the interest rates to
increase savings and cool down spending. This connection was found on an international level, with
the US interest rates affecting the worlds capital flows. Whenever the US decreased their interest rates
then for example the South American central banks experienced increased capital inflows, thus leading
to accumulation in foreign currency reserves and appreciation of the currency exchange rate.
Developing countries often face high interest rates and therefore both foreign and local firms obtain
loan/credits from abroad for investing in their home country. They found that volatile and less
predictable interest rates would make the debt-servicing balances more uncertain and therefore less
attractive for the G3 to do business with the emerging market.
“G-3 exchange rate and interest rate volatility would seem a priority to have a negative effect on
economic growth in the developing world. Higher interest rate volatility may hamper investment,
while higher G-3 exchange rate volatility may retard emerging market trade.” (Reinhart C. &
Reinhart V. 2001:10)
After the empirics they observe that the FDI inflow from the G3 to the developing world is correlated
to their economic state. When the economy is upbeat the FDI inflows to the developing world
increases and the other way around when there’s an economic slowdown. Another interesting note is
that when the economic growth is low and the same with the interest rates in the G3 then obviously the
banks lend out less domestically but internationally they increase their lending due to their relatively
lower lending rates compared to the developing world. This increases capital flows and FDI in the
developing world.
The same notion is found when Groenewold et al. (2000) examined the FDI inflows to Australia. The
interest rate and the inflows of FDI were positively correlated and significant.
18
4. Results and Analysis
4.1 Method and Data
For trying to assess the role of the determinants of FDI the Fixed Effect method is used for the linear
regressions, where independent variables trying to explain a dependent variable through their
respective coefficients and whether they are significant or not. Why this method is preferred is
explained later on in this part. The regressions are then run in STATA, a statistical analysis computer
tool used for similar researches.
The different data for the variables was retrieved through different databases. Where the bulk of it is
from trusted sources like the World Bank, OECD and UNCTAD. Collecting data for all countries in
the world was impossible as variables for many countries and years were missing and not available.
STATA won’t regress an observation even if only one data cell is missing. Therefore, the amount of
variable for years, countries and variables were shortened down to only include the 34 OECD member
countries spanning from 2000 to 2009 with ten variables. The reason for limiting to only OECD
countries is for the simple reason that when it comes to data no other set of countries, in that
magnitude, can compare with OECD.
The ten variables in the regression are, starting with the dependent variable, FDI, the independent
ones, GDP, GDPCAP, TO, INFR, EDU, TAX, EXCH, INFL and INTE.
FDI is the stock of foreign direct investment. The core variable which will be studied with the help of
the other determinant variables. In an initial regression the FDI inflows was used instead of FDI stock.
This led to some negative values for some countries different years. This contradictive intuition of
having negative values for net FDI inflows is explained by the disinvestment of FDI for that year. For
example if Iceland one year experienced 100m USD in FDI but at the same time foreign firms
disinvested, maybe sold property or went bankrupt for let say 200m USD, then the net inflow of FDI
for Iceland that year would be -100m USD. Thus, when having negative values one can’t log it and
hence we get missing data and lost observations as a result of this. Therefore FDI stock was preferred
as dependent variable instead. This shows how much total FDI there is in a country and not only the
inflows. Thereby circumventing the initial problem of having negative values for the log variables.
Heading to the independent variables. GDP and GDPCAP. These two variables are the easiest to find
and spanning the furthest back. The same goes for TO, implying trade openness. Trade openness is
trade, exports plus imports, as a share of total GDP. When assessing the INFR variable it became
trickier. How can one quantify infrastructure with a simple variable. It can be roads, railroads or
highways. Likewise, how can the length of these determinants be equal for countries. Larger countries
19
usually have lower network of highways than smaller countries even though the smaller country has
way better infrastructure. Even with two similar sized countries one country’s terrain can make it
uneven to compare this. Therefore percent of e.g. paved roads could be more fair but the data for this
variable was not available sufficient. Hence, a more fitting variable was found from a work from Choi
(2008) where internet usage is used as explaining increase of inward FDI. Criticizing its
appropriateness can be that some countries have come further in the IT development but at the same
time it can incorporate the level of infrastructure. It’s seldom that a country has many broadband users
but at the same time underdeveloped infrastructure otherwise.
The next variable is EDU, education. Choosing the percentage of share of population which studies on
tertiary level. Simply put, the percentage of population studying at university level. Rather than
secondary or primary level but due to that the data limitation on OECD countries there might be
marginal difference between the two other options due to the already high levels of education in these
countries. Hence, this variable is more appropriate for distinction. On to TAX, where focus is on
corporate tax income. This was found on the OECD website. The problem is the few changes over the
ten years for the majority of countries, resulting in many observations with zeroes in the log change of
these values. Meaning that the coefficients won’t have anything to say or any relationships to report.
Moving onto the three financial policy instruments which the work focuses on. Starting with EXCH,
the currency exchange rate. Choosing between the nominal and the real version of the exchange rate
on the WB website. The choice for the latter fell on the reason for the deduction of inflation one could
say in the real version. With real currency exchange rate the value does consider the price increases in
the society. So one could say it’s the nominal currency exchange rate divided by price deflator,
thereby giving more accurate and realistic picture of the exchange rate. A side note is that year 2005
was set as 100 when counting the rate. INFL, the inflation rate is given by the most common way in
majority of the countries. Statistical agencies of countries count the inflation in a country by
comparing the price changes of a basket of daily consumer goods.
The last determinant is INTE, interest rate. Short-term interest rate compiled from quarterly data and
then on an average rate on an annual basis. The interest rate here is the rate between banks. This might
not be fair when comparing with FDI seeking credits or loans as the rates are undoubtedly much more
favorably. On the other hand we observe the log changes, circumventing much of this dilemma and
therefore wanting to see the narration of this. That’s one reason to log the variables and afterwards see
the log When doing a regression one have to have the variables in same units for them to be
comparable. Else, the result will be misleading and un-useful by comparing dollars in absolute terms
with percentage. For creating same base and unilateral values we log the differences. Thereby getting
the difference of log year 2000 minus log year 1999 to get the log for 2000 (e.g. =LN(y2000) –
LN(y1999)).
20
Due to missing data especially in the latter variables in the regression some of the observations are
gone missing when running some of the regressions. As mentioned before it only needs one missing
data cell for the whole row/observation to be excluded from the regression.
The dimension of dataset is as follows:
34 countries
10 years
10 variables
Implying 340 different observations. Likewise, when missing data and some cells are empty you lose
out on regressions.
The regressions are run with fixed effect method. The intuition behind this method is that it “clears”
the regressions from additional effects the different variables may have upon each other. This for not
letting unidentifiable reasons, for which can’t be recognized, will be impacting the data. Instead this
fixed effect in a way ‘frees’ the results from eventually being more wrong specified. Implying that it
tackled heterogeneity that can arouse over time between variables. In essence flattening it out on the
expense of the coefficients. It’s preferable to use when having panel data spanning over many years.
The time series can albeit have random walk effects but as we don’t suspect any we rather choose
fixed effect instead.
21
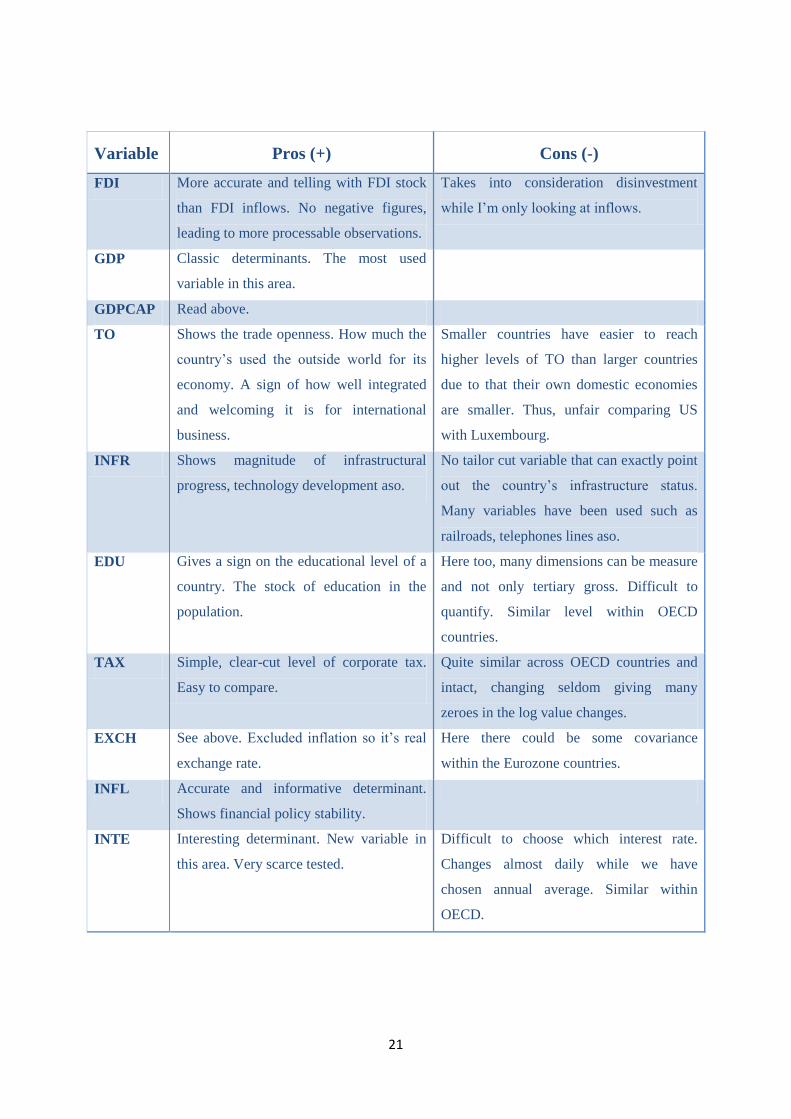
Variable
Pros (+)
Cons (-)
FDI More accurate and telling with FDI stock
than FDI inflows. No negative figures,
leading to more processable observations.
Takes into consideration disinvestment
while I’m only looking at inflows.
GDP Classic determinants. The most used
variable in this area.
GDPCAP Read above.
TO Shows the trade openness. How much the
country’s used the outside world for its
economy. A sign of how well integrated
and welcoming it is for international
business.
Smaller countries have easier to reach
higher levels of TO than larger countries
due to that their own domestic economies
are smaller. Thus, unfair comparing US
with Luxembourg.
INFR Shows magnitude of infrastructural
progress, technology development aso.
No tailor cut variable that can exactly point
out the country’s infrastructure status.
Many variables have been used such as
railroads, telephones lines aso.
EDU Gives a sign on the educational level of a
country. The stock of education in the
population.
Here too, many dimensions can be measure
and not only tertiary gross. Difficult to
quantify. Similar level within OECD
countries.
TAX Simple, clear-cut level of corporate tax.
Easy to compare.
Quite similar across OECD countries and
intact, changing seldom giving many
zeroes in the log value changes.
EXCH See above. Excluded inflation so it’s real
exchange rate.
Here there could be some covariance
within the Eurozone countries.
INFL Accurate and informative determinant.
Shows financial policy stability.
INTE Interesting determinant. New variable in
this area. Very scarce tested.
Difficult to choose which interest rate.
Changes almost daily while we have
chosen annual average. Similar within
OECD.
22
4.2. Findings and Analysis
Initially the regressions had inflows of FDI from the WB database as the dependent variable. This
showed the yearly inflows of FDI plus disinvestment, for example if a MNE decided to sell their assets
or if they go bankrupt, therefore in times of recession like the major global crisis in 2008-2009 there
were many cells showing negative figures due to the high load of disinvestment.
Due to the negative numbers it wasn’t possible to log the data leading to lost observations. This notion
made us forced to find the FDI stock instead of FDI inflows. FDI stock is the total amount of FDI in
the country, thus the aggregate level of inward FDI in the specific country. Retrieving this data from
UNCTAD database. This variable in a way catches both the aggregate level of inward FDI and also
the first FDI variable used, the change in inflows due to the change in FDI stock. Due to that we
include the total amount we no more need to omit negative observations. Due to this change one could
now find a more fitting variable and taking into consideration many more observations. Rightfully this
major change brought the R2 to an acceptable level of 24%.
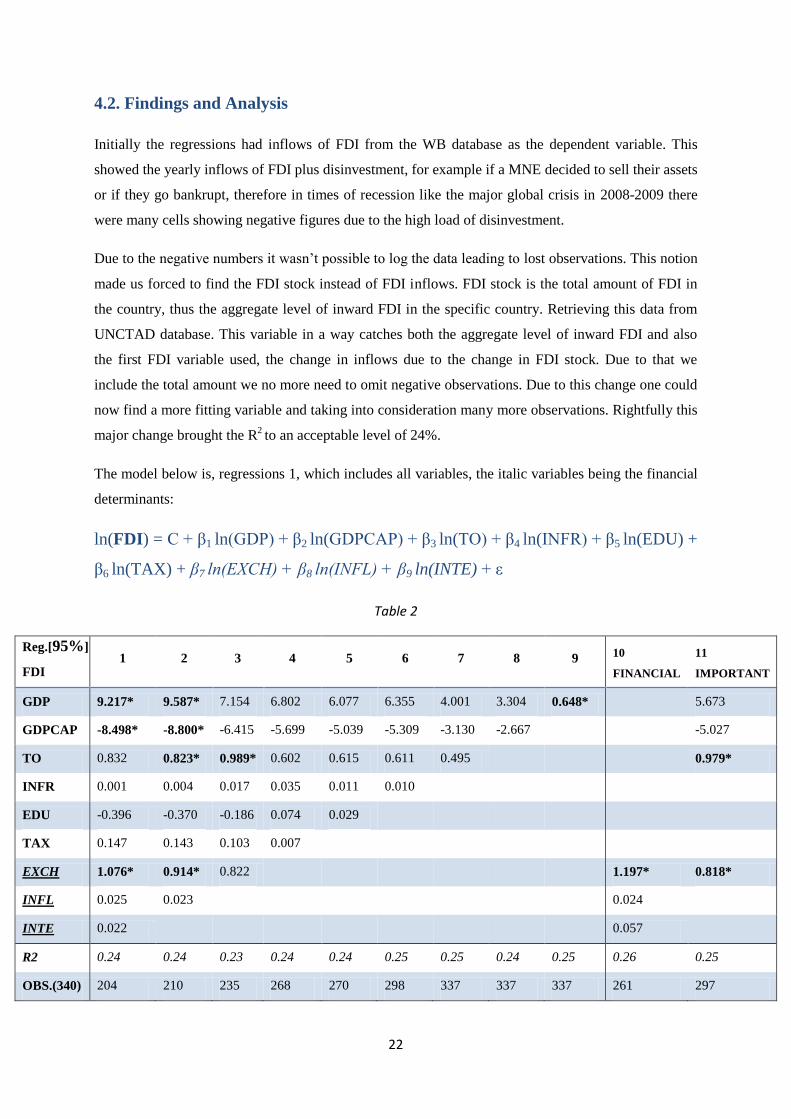
The model below is, regressions 1, which includes all variables, the italic variables being the financial
determinants:
ln(FDI) = C + β1 ln(GDP) + β2 ln(GDPCAP) + β3 ln(TO) + β4 ln(INFR) + β5 ln(EDU) +
β6 ln(TAX) + β7 ln(EXCH) + β8 ln(INFL) + β9 ln(INTE) + ε
Table 2
Reg.[95%]
FDI 1 2 3 4 5 6 7 8 9 10
FINANCIAL
11
IMPORTANT
GDP 9.217* 9.587* 7.154 6.802 6.077 6.355 4.001 3.304 0.648*
5.673
GDPCAP -8.498* -8.800* -6.415 -5.699 -5.039 -5.309 -3.130 -2.667
-5.027
TO 0.832 0.823* 0.989* 0.602 0.615 0.611 0.495
0.979*
INFR 0.001 0.004 0.017 0.035 0.011 0.010
EDU -0.396 -0.370 -0.186 0.074 0.029
TAX 0.147 0.143 0.103 0.007
EXCH 1.076* 0.914* 0.822
1.197* 0.818*
INFL 0.025 0.023
0.024
INTE 0.022
0.057
R2 0.24 0.24 0.23 0.24 0.24 0.25 0.25 0.24 0.25 0.26 0.25
OBS.(340) 204 210 235 268 270 298 337 337 337 261 297
23
Above is a chart incorporating eleven different regressions with the first nine being a classic procedure
to distinguish effects or changes, dropping one variable at a time and do a regression after, ladder-like,
dropping one at a time. The last two being tailor cut regressions Hence, illustrating the changes into a
chart below with (*) indicating significance at a 95% confidence interval.
Analyzing the first regression we observe that it’s only three variables being significant on a 95%
confidence interval, GDP, GDPCAP and EXCH. The first two aren’t any surprises significant wise as
they are often mentioned as the most common determinants of FDI. Although a big surprise is the
negative effect of GDPCAP. One major reason could be the countries which have been taken into
consideration. The OECD member countries are very common in economic level and progress. By
only using the most industrialized countries we may have a excessively similar group of countries.
Therefore major determinants as GDPCAP can’t be used or more likely can’t be used to distinguish
the countries. Another reason can be that within this category of countries, the richer countries within
the ‘already’ rich countries are as a result exploited with FDI that there isn’t room for increase while
less developed countries like Turkey, South Korea, Chile have larger scope to increase FDI inflows as
well as their often much higher economic growth rate than their richer OECD counterparts. This was a
reason why the global economic crisis 2008-2009 hit the more developed countries more, thus more
disinvestment could also be a factor .
Another interesting point is the exchange rate and the positive impact it has on the FDI stock. This
result obviously goes against the theory and the former notion that appreciation makes the inward FDI
decrease. Here we have the opposite according to the regression results. That appreciation of the
exchange rate currency make the country experience more inflows of FDI and the opposite then of
course, depreciation would mean less FDI. This result was a bit trickier to analyze. A cause behind this
could very well be that a stronger currency exchange rate could foster a stronger purchasing power
domestically and therefore increasing the purchasing parity compared to the MNE country of origin.
Hence, making it more lucrative for the FDI to invest in the country was the currency appreciates.
Another side note can be that the firms that engage in FDI prefer profits in a stronger currency
compared to their country of origin, due to the currency exchange rate effect which comes positive
into hand. But also here we have a group of countries that are tightly notched together and this of
course affects each other well integrated currencies with many of them dependent on each other.
Therefore we can have the same issue as GDPCAP that due to the similarity of the countries the
exchange rate isn’t well fitted enough to distinguish the exchange rate effect. Plus, the last decade
almost half of the countries, the Euro members have had the same currency and therefore decreasing
the actual scope of observations that we really observe with the dataset due to similar currency rates.
24
Regression four only consists of the classic determinants, thus rejecting the financial determinants.
Although our number of observation increases from 204 to 268 the R2 is still at similar level and now
no significant determinants affect the FDI. Plainly this didn’t fit in with the classic frame of
determinants of FDI. This non-significant effect can be attributed to the same logical issue as before,
the similarity of the OECD countries. Resulting to that the figures we have in our database is too alike
for STATA to make any clear-cut distinctions.
Regression ten is obviously to only make use of our financial determinants which the paper focuses on
to look at the effects they have on the FDI. Here the R2 has experienced a minor increase. The
attention-grabbing finding here is the positive effect the exchange rate has on FDI. As the first, second
and last regression, this regression shows a significant value for EXCH, underlining the effect of this
variable.
Along the way there’s only four determinants being significant in a 95% confidence interval. In
addition the R2
is pretty similar along the way spanning from 0.26 to 0.23. What can be distinguished
is that the five other determinants, EDU, INFR, TAX, INFL and INTE, don’t have any significance
across any of the regressions. Likewise these five determinants are the five most similar determinants
within the nine independent variables used. The OECD member countries have in the last decade have
quite akin data on infrastructure, education, tax rates, inflation and interest rates. Logically the four
other ones, the significant variables are the ones with the most varying figures.
When only using financial policy determinants in regression ten the same pattern appears, exchange
being highly significant while inflation and interest rates not being noteworthy at all. Instead in the last
regression, compromised by the four most significant determinants, GDP, GDPCAP, TO and EXCH,
according to the ten previous ones into one regression and the result shows that TO and EXCH still
yield largest effect while GDP and GDPCAP lose their significance. Thus, EXCH proves its
significance in four out of five regressions it is included in, displaying highly determining.
25
Table 3
Reg. [99%]
FDI 1 2 3 4 5 6 7 8 9 10
FINANCIAL
11
IMPORTANT
GDP 9.217* 9.587* 7.154 6.802 6.077 6.355 4.001 3.304 0.648*
5.673
GDPCAP -8.498*
-
8.800* -6.415 -5.699 -5.039 -5.309 -3.130 -2.667
-5.027
TO 0.832* 0.823* 0.989* 0.602 0.615 0.611 0.495
0.979*
INFR 0.001 0.004 0.017 0.035 0.011 0.010
EDU -0.396 -0.370 -0.186 0.074 0.029
TAX 0.147 0.143 0.103 0.007
EXCH 1.076* 0.914* 0.822*
1.197* 0.818*
INFL 0.025 0.023
0.024
INTE 0.022
0.057
R2 0.24 0.24 0.23 0.24 0.24 0.25 0.25 0.24 0.25 0.26 0.25
OBS. (340) 204 210 235 268 270 298 337 337 337 261 297
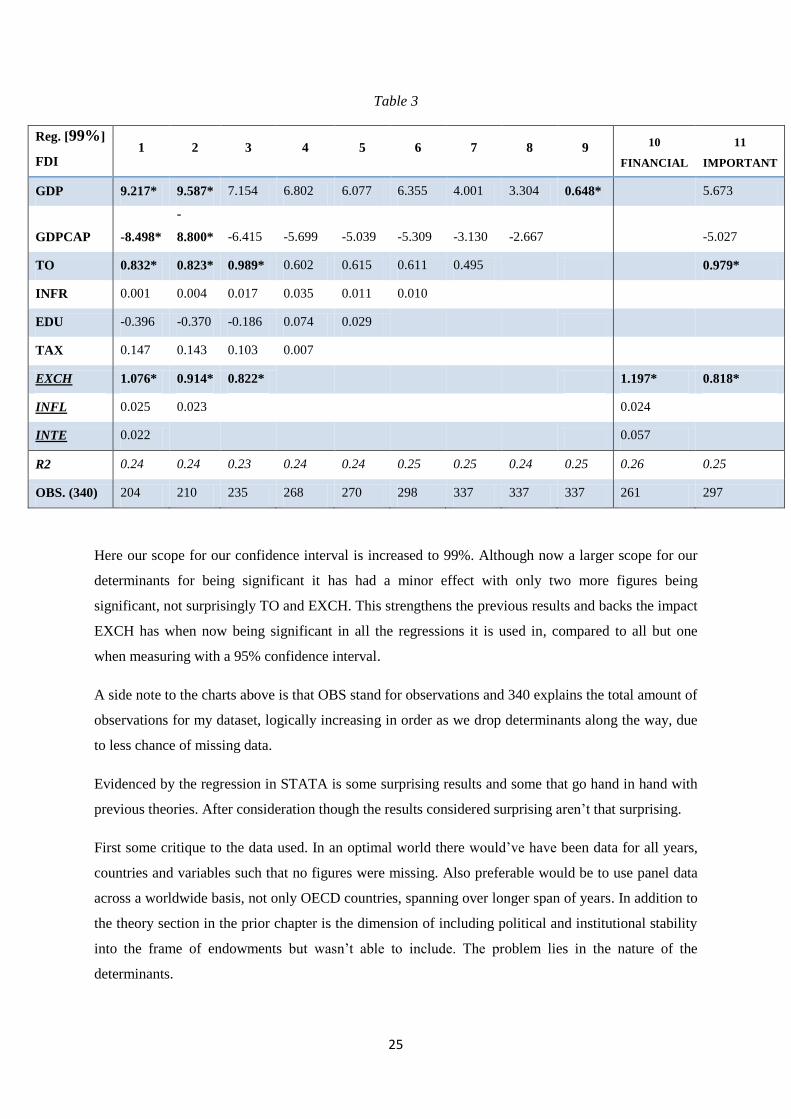
Here our scope for our confidence interval is increased to 99%. Although now a larger scope for our
determinants for being significant it has had a minor effect with only two more figures being
significant, not surprisingly TO and EXCH. This strengthens the previous results and backs the impact
EXCH has when now being significant in all the regressions it is used in, compared to all but one
when measuring with a 95% confidence interval.
A side note to the charts above is that OBS stand for observations and 340 explains the total amount of
observations for my dataset, logically increasing in order as we drop determinants along the way, due
to less chance of missing data.
Evidenced by the regression in STATA is some surprising results and some that go hand in hand with
previous theories. After consideration though the results considered surprising aren’t that surprising.
First some critique to the data used. In an optimal world there would’ve have been data for all years,
countries and variables such that no figures were missing. Also preferable would be to use panel data
across a worldwide basis, not only OECD countries, spanning over longer span of years. In addition to
the theory section in the prior chapter is the dimension of including political and institutional stability
into the frame of endowments but wasn’t able to include. The problem lies in the nature of the
determinants.
26
It’s almost impossible to grasp the scope of political stability with numbers and figures as a
measurement. Political and institutional stability is by nature a complex and subjective issue making it
almost impossible to quantify. Concerning institutions which is undoubtedly very intertwined with the
political environment of the country, the WB has made an wholeheartedly effort in quantifying
measures as public sector management, institution cluster average and corruption on a scale from one
being worst and six being best. Although very comprehensive the data only covers the last five years
with more than half the countries in the world (many of the OCED countries) missing.
The most striking part of this work is the impact EXCH has on FDI. When being significant in almost
all the regressions made one can evolve on this matter in different dimensions. Clearly the overall
literature mentions that the role of exchange rate has a significant impact it mostly points out that a
depreciation of the host country currency exchange rate increases the inflows of FDI. But as we clearly
see in the results it goes against the main literature. One analysis of this twisting result is that the cause
behind this could be the stronger purchasing power the domestic host market has with an appreciating
currency compared with the home country. Therefore the local market now can buy more for less
money if the value of the domestic currency increases. This of course yields more foreign firms to
engage in FDI in that market for retrieving higher profits even if they sell the same amount. In
addition to that the OECD countries tend to be way larger economies and therefore gives incentives
for firms engaging in FDI to reap larger markets with the advantage of economies to scale when
focusing on currency exchange rate. Another cause could be as mentioned by Faeth (2005) in our
theory part that a stronger stable currency signals that the state of the economy is stable and strong.
This sound and robust economic indicator hints that the economic environment suits FDI.
As currency exchange rate did impact FDI then surely the other two financial policies didn’t. Inflation
didn’t produce any significant result in any of the tests. This goes against the main literature about
inflation and FDI where it’s often proved that high and volatile inflation distracts FDI as it resembles a
shaky and unstable economy. While a low and more robust inflation indicates a healthy and stable
economy. Although repeating, one can’t ignore the fact that we only have incorporated the OECD
countries, making our set of countries very homogenous, especially in the area of financial policy
determinants. Not only the similarities, but as aforementioned many of the countries, namely the Euro
countries, actually have the same monetary and financial headquarters. The ECB in Germany is now
the central bank of all Euro Zone countries. In addition the EC also highly influence other EU
members financial policies even though not having the Euro as currency. This interconnection makes
the inflation rates fairly alike and therefore when doing regression there isn’t enough of differences to
retrieve any significant results as the coefficients exhibits. Surely with a worldwide panel data
including at least countries on different levels of economic development the results would be more
“fair” and resounding, as the inflation could be singled out with level of economic development and
therefore explaining the inflows of FDI.
27
Another theory when analyzing could be that due to the global economic crisis the last decade many of
the inflation figures have been very low, making log difference very small and they have due to the
global scope of the crisis followed the same pattern in almost all the countries, making them more
homogenous. Another interesting point is that besides education, the inflation determinant is the
variable missing most observations, 40 in total, out of 340. Most of the explanation above can be
applied for the interest too as they in many senses are bound together and have much in common.
They generally resemble the financial and economic state of an economy and suggest in which
condition a country is in. It’s often with this policy a central bank or government decides which
direction they want to steer the economy to. The literature about interest rate and FDI is quite rare and
clear-cut results are difficult to find. The few serious works in this area show that there can be some
impact. Even though this field is in its foster state there was an example of that the higher interest rate
the more FDI due to the return of the FDI. Likewise inflation and interest rates in the regressions were
found insignificant. That interest rates don’t impact FDI but that there has to be done more complex
studies in this area to really be able to distinguish its real effect. For example with the inclusion of
more countries and years.
28
5. Conclusion
The reason behind the work was to continue on the unanswered questions from previous works
concerning FDI. Especially confronted with the interesting issue of financial policies impact on FDI.
Implying if financial determinants such as exchange rate, inflation and interest rate actually do have an
effect on FDI or not and if significant. Thus, for answering the question panel data from the 34 OECD
countries spanning over the last decade, 2000 to 2009, was used. Six ‘classic’ determinants have been
chosen, widely used determinants by mainstream literature. In addition three financial policy
determinants have been used which the work focuses on, exchange rate, inflation and interest rate for
examining their effects on FDI. Together these nine variables are used in various modeled regressions
in STATA.
The results retrieved were quite similar across the different models even if different determinants or
different confidence intervals were taken into consideration. Out of the ‘classical’ determinants it was
as presumed the GDP, GDPCAP and TO that showed significant impact throughout most of the
regressions. While GDP and TO lived up to their expectations GDPCAP didn’t. It showed a negative
effect quite opposite to theories. An assumption can be that due to the common economic level of the
OECD countries the high income countries within this set of countries may experience close to
maximum FDI involvement while the lesser developed countries still has plenty of scope to reach
same levels.
Out of the financial policies determinants it was the exchange rate that surprisingly stood out as they
sole determinant having an effect on FDI Implying that real exchange rate appreciation have an
positive effect on drawing FDI. It was significant throughout all but one regression. Interestingly it
had the opposite effect as ventured by most scholars. The most popular notion is when exchange rate
depreciates it becomes cheaper for foreign firms to engage in FDI due to that the home country’s
currency now is relatively stronger. However some few newer literature dismisses this with the
argument that during depreciation it’s true that it becomes cheaper for MNE to engage in FDI but at
the same time their profits from the market they engage in becomes less worth, hence cancelling out
each other in a zero sum game. Therefore an idea behind the result could be that an exchange rate
appreciation could in fact lead to higher profits due to stronger currency in the FDI market. Another
reason in the theory is that a strong exchange rate signals a stable and sound economy, therefore
drawing FDI in that sense.
The other two financial determinants INFL and INTE didn’t have any significant impact, as well as
the three other ‘classical’ determinants EDU, INFR and TAX. These five determinants are the five
most similar determinants when it comes to the figures they behold spanning over the ten years.
Likewise the OECD countries are a homogenous economic set of countries. These two factors make
29
the scope for difference narrow, thus making it impossible to yield any significant distinguishing with
the help of the variables. For example the OECD countries have very similar high levels of education,
infrastructure or on the other hand very similar low levels of interest rates, making them too close to
each other for the best of analyzing the data.
If one would have panel data for the whole world or more diverse set of countries and maybe spanning
for more than ten years then surely there would be more significant results for these determinants.
Hence, these possible causes behind this set of interesting results could very well bode for future
works within this area.
Hence, the answer to the research question can be summarized as financial policies both do and don’t
impact FDI. The exchange rate had a quite significantly positive effect on determining FDI while the
other two, inflation and interest rate, have no significant effect. Thus, the results of the recent literature
concerning FDI and financial policies shows us interesting findings but likewise leaves interesting
questions and hence plenty of room for further research within the area.
30
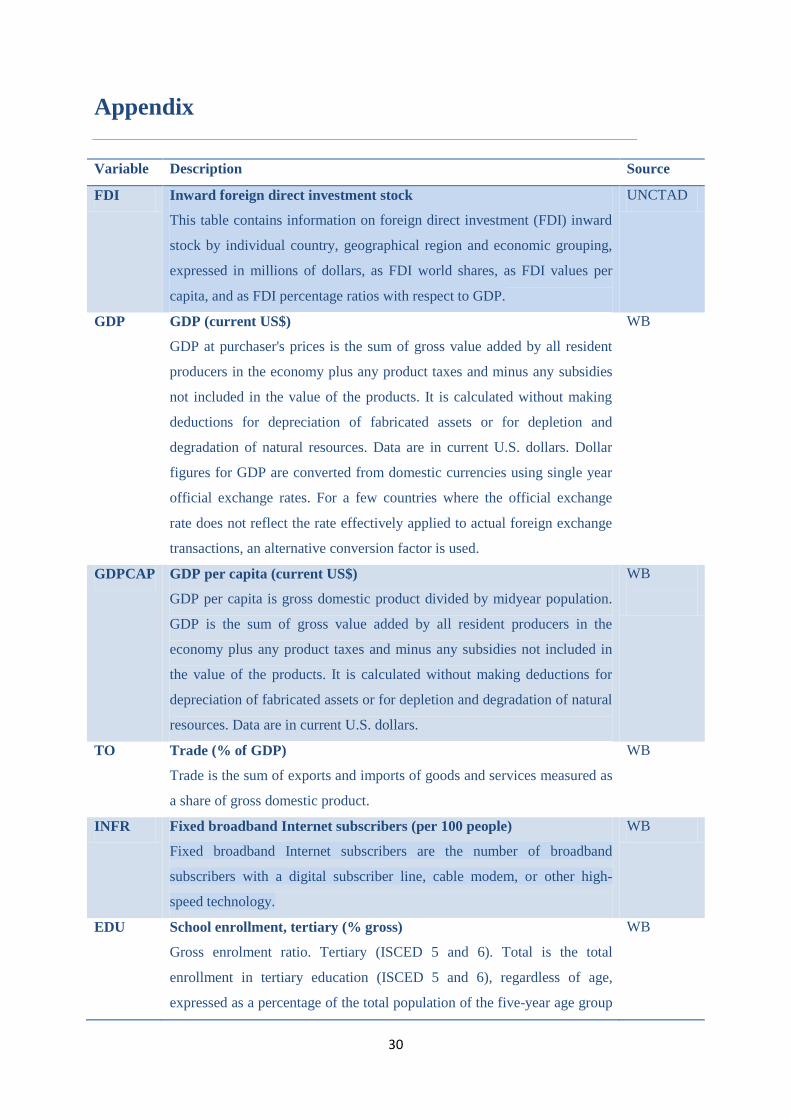
Appendix
Variable Description Source
FDI Inward foreign direct investment stock
This table contains information on foreign direct investment (FDI) inward
stock by individual country, geographical region and economic grouping,
expressed in millions of dollars, as FDI world shares, as FDI values per
capita, and as FDI percentage ratios with respect to GDP.
UNCTAD
GDP GDP (current US$)
GDP at purchaser's prices is the sum of gross value added by all resident
producers in the economy plus any product taxes and minus any subsidies
not included in the value of the products. It is calculated without making
deductions for depreciation of fabricated assets or for depletion and
degradation of natural resources. Data are in current U.S. dollars. Dollar
figures for GDP are converted from domestic currencies using single year
official exchange rates. For a few countries where the official exchange
rate does not reflect the rate effectively applied to actual foreign exchange
transactions, an alternative conversion factor is used.
WB
GDPCAP GDP per capita (current US$)
GDP per capita is gross domestic product divided by midyear population.
GDP is the sum of gross value added by all resident producers in the
economy plus any product taxes and minus any subsidies not included in
the value of the products. It is calculated without making deductions for
depreciation of fabricated assets or for depletion and degradation of natural
resources. Data are in current U.S. dollars.
WB
TO Trade (% of GDP)
Trade is the sum of exports and imports of goods and services measured as
a share of gross domestic product.
WB
INFR Fixed broadband Internet subscribers (per 100 people)
Fixed broadband Internet subscribers are the number of broadband
subscribers with a digital subscriber line, cable modem, or other high-
speed technology.
WB
EDU School enrollment, tertiary (% gross)
Gross enrolment ratio. Tertiary (ISCED 5 and 6). Total is the total
enrollment in tertiary education (ISCED 5 and 6), regardless of age,
expressed as a percentage of the total population of the five-year age group
WB
31
following on from secondary school leaving.
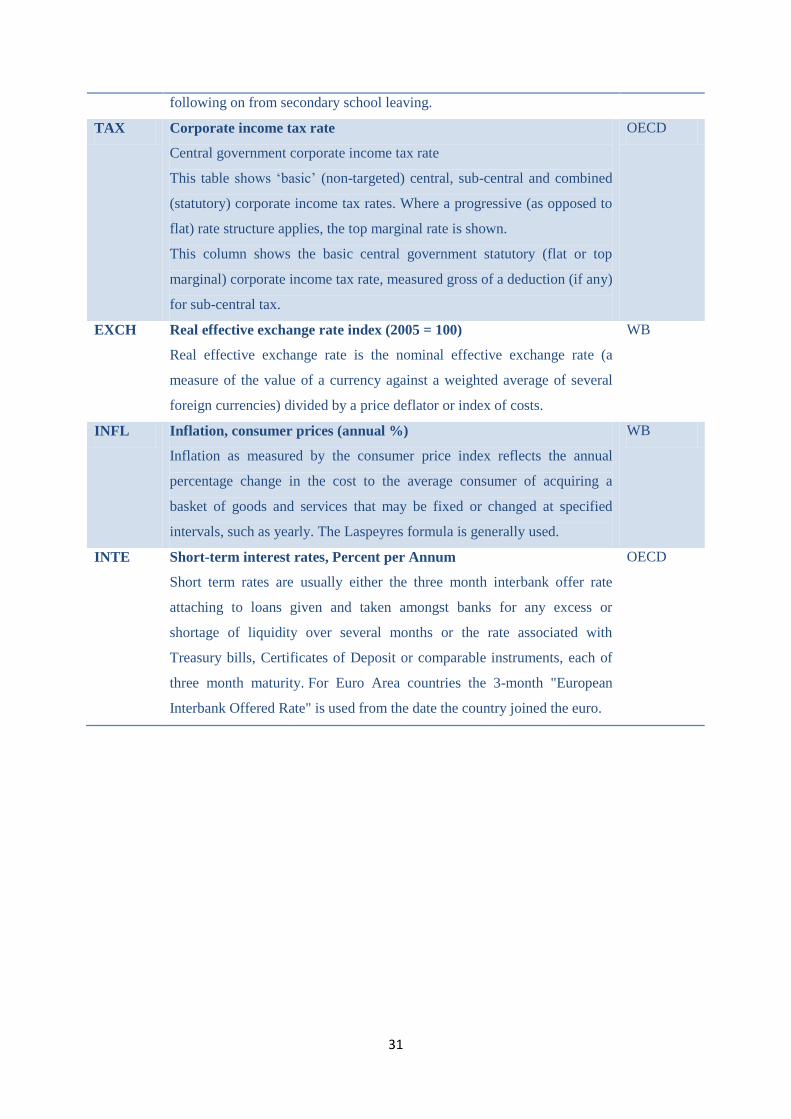
TAX Corporate income tax rate
Central government corporate income tax rate
This table shows ‘basic’ (non-targeted) central, sub-central and combined
(statutory) corporate income tax rates. Where a progressive (as opposed to
flat) rate structure applies, the top marginal rate is shown.
This column shows the basic central government statutory (flat or top
marginal) corporate income tax rate, measured gross of a deduction (if any)
for sub-central tax.
OECD
EXCH Real effective exchange rate index (2005 = 100)
Real effective exchange rate is the nominal effective exchange rate (a
measure of the value of a currency against a weighted average of several
foreign currencies) divided by a price deflator or index of costs.
WB
INFL Inflation, consumer prices (annual %)
Inflation as measured by the consumer price index reflects the annual
percentage change in the cost to the average consumer of acquiring a
basket of goods and services that may be fixed or changed at specified
intervals, such as yearly. The Laspeyres formula is generally used.
WB
INTE Short-term interest rates, Percent per Annum
Short term rates are usually either the three month interbank offer rate
attaching to loans given and taken amongst banks for any excess or
shortage of liquidity over several months or the rate associated with
Treasury bills, Certificates of Deposit or comparable instruments, each of
three month maturity. For Euro Area countries the 3-month "European
Interbank Offered Rate" is used from the date the country joined the euro.
OECD
32
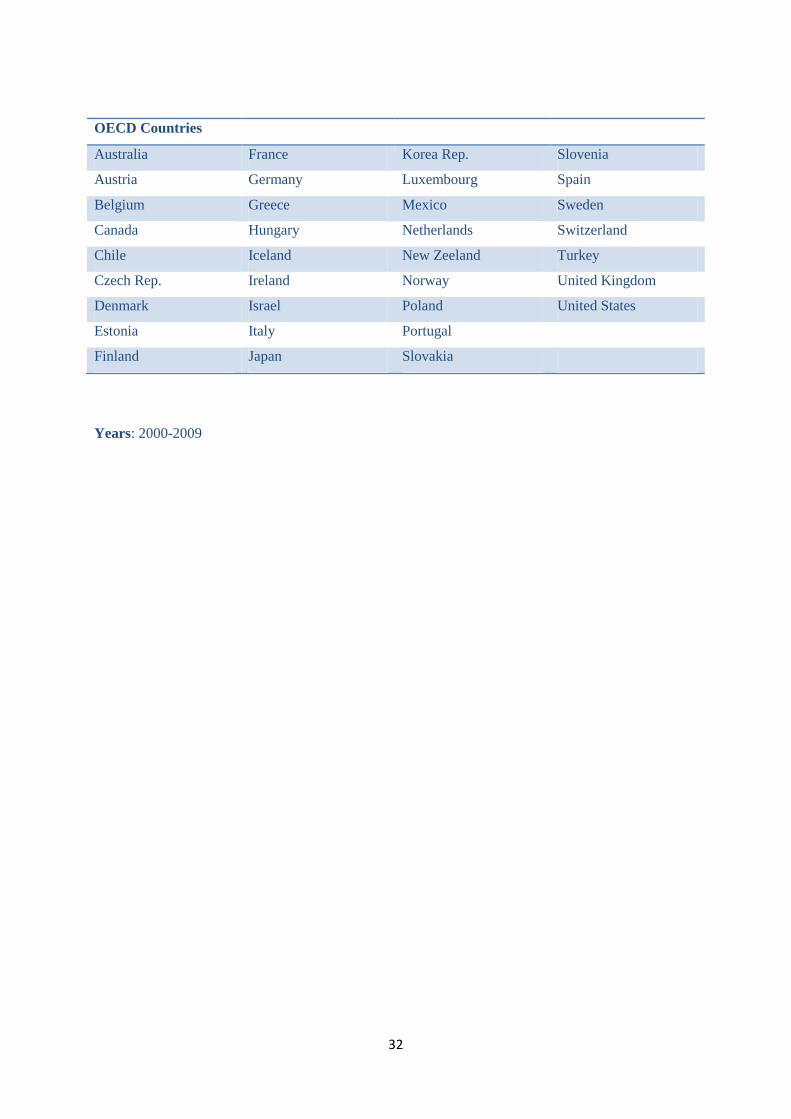
OECD Countries
Australia France Korea Rep. Slovenia
Austria Germany Luxembourg Spain
Belgium Greece Mexico Sweden
Canada Hungary Netherlands Switzerland
Chile Iceland New Zeeland Turkey
Czech Rep. Ireland Norway United Kingdom
Denmark Israel Poland United States
Estonia Italy Portugal
Finland Japan Slovakia
Years: 2000-2009
33
List of Resources
Adami, Aram. (2012) “FDI in Tajikistan” Lund University, Sweden
Blanton, Robert G. & Blanton, Shannon L. (2007) ” What Attracts Foreign Investors? An
Examination of Human Rights and Foreign Direct Investment”, The Journal of Politics, The
University of Memphis.
Blomström, Magnus. (2002) “The Economics of International Investment Incentives” OECD
Blonigen, Bruce A. (2005) ”A review of the empirical literature on FDI determinants”,
University of Oregon and National Bureau of Economic Research, USA
Botric, Valerija. & Skuflic, Lorena. (2012) ”Main determinants of Foreign Direct Investment
in the South East European Countries” Paper prepared for the 2nd Euroframe Conference on
Economic Policy Issues in the European Union “Trade, FDI and Relocation: Challenges for
Employment and Growth in the European Union?”, Vienna, Austria
Braconier, Henrik. Norbäck, Pehr-Johan. & Dieter, Urban. (2005) “Multinational enterprises
and wage costs: vertical FDI revisited”, Journal of International Economics, Volume 67, Issue
2, December 2005
Choi, Changkyu. (2008) “Does the Internet stimulate inward Foreign Direct Investment”,
Department of Economics, Myongji University, 50-3, Namgajwadong, Seodaemungu, Seoul
Cleeve, Emmanuel. (2009) “The Eclectic Paradigm and Foreign Direct Investment in Sub
Saharan Africa”, Manchester Metropolitan University, UK
Demirhan, Erdal. & Masca, Mahmut. (2008) “Determinants of foreign direct investment flows
to developing countries: A cross-sectional analysis”, Afyon Kocatepe University, Turkey
EconomyWatch (2010) “Foreign Direct Investment” http://www.economywatch.com/foreign-
direct-investment/ (2012-06-16)
Erdener, Carolyn. & Shapiro, Daniel. (2005) “The Internationalization of Chinese Family
Enterprises and Dunning’s Eclectic MNE Paradigm”
Faeth, Isabel. (2005) “Determinants of FDI in Australia: Which Theory can explain it best?”,
Department of Economics, The University of Melbourne
Faeth, Isabel. (2009) “Determinants of FDI – A Tale of Nine Theoretical Models”,
Department of Economics, The University of Melbourne
Frey, Bruno S. & Schneider, Friedrich. (1985) “Economic and Political Determinants of
Foreign Direct Investment”, World Development, Vol. 13, No. 2
Going Global http://www.going-
global.com/articles/understanding_foreign_direct_investment.htm (2012-06-19)
Habib, Mohsin. & Zurawicki, Leon. (2002) “Corruption and Foreign Direct Investment”,
Journal of International Business Studies, Palgrave Macmillan Journals
34
IMF (1993) http://www.imf.org/external/np/sta/bop/BOPman.pdf (2012-06-19)
Investments&Income http://www.investmentsandincome.com/investments/oli-paradigm.html
(2012-06-19)
Kiat, Jason. (2008) ”The effect of exchange rate and inflation on foreign direct investment and
its relationship with economic growth in South Africa”, University of Pretoria, South Africa
Klein, Michael W. & Rosengren, Eric. (1994) “The real exchange rate and foreign direct
investment in the United States: Relative wealth vs. relative wage effects”, The Fletcher
School of Law and Diplomacy, Tufts University
Knowledgebase (2011) http://guidewhois.com/2011/01/what-is-foreign-direct-investment-
horizontal-and-vertical/
Kokko, Ari. (1992) “Foreign Direct Investment, Host Country Characteristics, and Spillovers”
EFI, Stockholm School of Economics, Stockholm
Kyrkilis, Dimitrios & Pantelidis, Pantelis. (2003) “Macroeconomic Determinants of outward
foreign direct investment”, International Journals of Social Economics, Emerald Article.
Markussen, Martin. (2012) “OLI Paradigm” http://prezi.com/ksx_yt8tum82/oli-paradigm/
Prezi
Ram, Rati. & Zhang, Kevin H. (2002) ”Foreign Direct Investment & Economic Growth:
Evidence from cross-country Data for the 1990s” The University of Chicago Press, US.
Reinhart, Carmen M. & Reinhart Vincent R. (2001) “What Hurts Most? G-3 Exchange Rate or
Interest Rate Volatility”, University of Chicago Press for the NBER
Rogoff, Kenneth & Reinhart, Carmen. M. (2003) “FDI to Africa”, IMF
Shi, Zongying . & Takagi, Shinji . (2011) “Japan and the World Economy”, Graduate School
of Economics, Osaka University
UNCTAD (2009) “The Role of International Investment Agreements in Attracting Foreign
Direct Investments to Developing Countries.” UNCTAD, New York and Geneva.


![The impact of FDI and Financial markets on growth Version Thesis.docx · Web viewThe impact of FDI and Financial markets on growth [2012] We analyze the link between FDI, financial](https://img.pdfslide.net/doc/110x75/5e545f69e3aa55504554dfd3/the-impact-of-fdi-and-financial-markets-on-growth-version-thesisdocx-web-view.jpg)


![KOREA INVESTMENT IN VIETNAM & FDI POLICIES - …7].pdf · KOREA INVESTMENT IN VIETNAM & FDI POLICIES 1 PRESENTER: NGUYEN THI MINH HIEN- DEPUTY DIRECTOR ... Phu Bai – Hue; …](https://img.pdfslide.net/doc/110x75/5a72d7577f8b9aac538df8c9/korea-investment-in-vietnam-fdi-policies-7pdf-korea-investment-in.jpg)