Embed Size (px)
Citation preview

Financial Presentation to Senate April 25, 2015
Financial Presentation to SenateApril 25, 2015

Financial Presentation to Senate April 25, 2015
Questions posed by Council1. What was the origin of the
previously projected $44.5M deficit?
2. What is the present actual deficits and the future projected deficits?
3. How and why was the $44.5M projected deficit adjusted to reflect the actual and future projected deficits?

Financial Presentation to Senate April 25, 2015
2013-14 annual financial report: usask.ca/reporting
Focus on operating budget

Financial Presentation to Senate April 25, 2015
Question 1:What was the origin of the previously
projected $44.5M deficit?

Financial Presentation to Senate April 25, 2015
Original multi-year operating budget framework 2012-2016 (early March 2012)
200
250
300
350
400
450
500
550
600($ millions)
Expenses
Revenue
Forecast
Projecteddeficit$10M
Built upon decades of sound financial management
Question 1: What was the origin of the previously projected $44.5M deficit?
Actual
Financial Presentation to Senate April 25, 2015
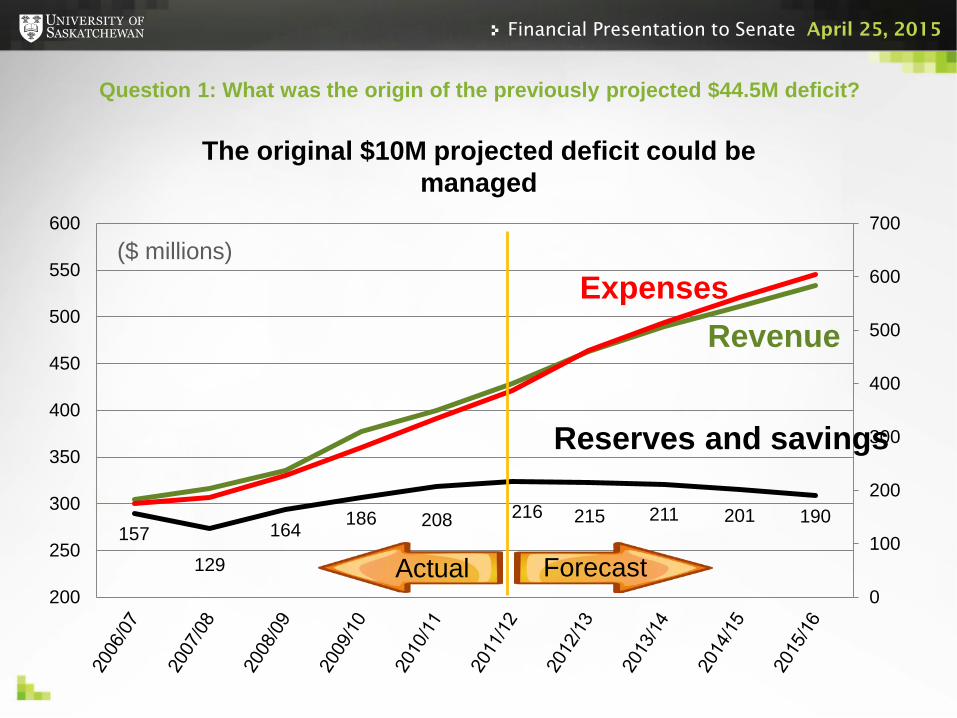
The original $10M projected deficit could be managed
157129
164 186 208 216 215 211 201 190
0
100
200
300
400
500
600
700
200
250
300
350
400
450
500
550
600($ millions)
Revenue
Reserves and savings
Expenses
Forecast
Question 1: What was the origin of the previously projected $44.5M deficit?
Actual

5.8% 4.0%
5.8% 4.0% 4.0%
4.0%4.5%
4.5%
(1,175) (4,003)
(9,461)
(10,523)0
RevenueProvincial base operating grant
Other government (WCVM)
Surplus / (Deficit)
Expenses Annual rate of increase
of provincial grantYEAR % change in provincial
operating grant (net)
2008-09 8.72009-10 7.32010-11 5.22011-12 5.4Average 6.7
2015-16
2014-15
2013-14
2012-13

Financial Presentation to Senate April 25, 2015
And then one of our biggest assumptions changed…
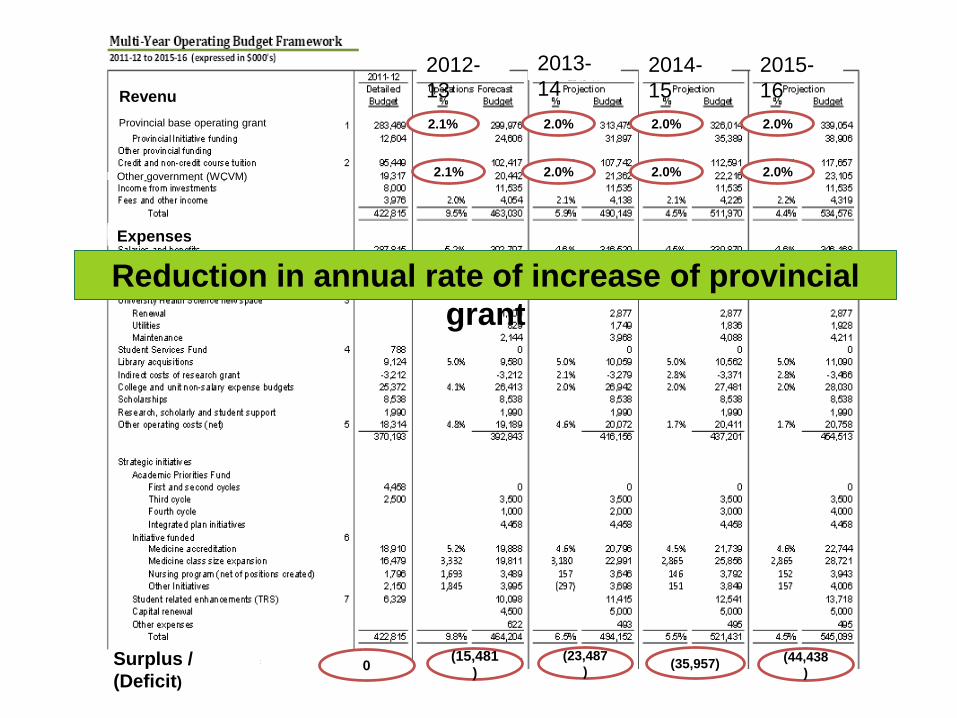
2.1% 2.0%
2.1% 2.0% 2.0%
2.0%2.0%
2.0%
(15,481)
(23,487) (35,957) (44,438
)0
RevenueProvincial base operating grant
Other government (WCVM)
Surplus / (Deficit)
Expenses
Reduction in annual rate of increase of provincial grant
2012-13
2013-14
2014-15
2015-16

Financial Presentation to Senate April 25, 2015
157129
164186
208 216 204 180 14398
0
100
200
300
400
500
600
700
200
250
300
350
400
450
500
550
600
Expenses 4.6%
Revenue 3.2%Reserves and savings
$44.5
Forecast
10
Question 1: What was the origin of the previously projected $44.5M deficit?
Revised multi-year operating budget framework 2012-2016 (May 2012)

Financial Presentation to Senate April 25, 2015
Question 2:What is the present actual deficits and the
future projected deficits?

Financial Presentation to Senate April 25, 2015
Actions taken from 2012-2014: $32M narrowing of the gap
Question 2: What is the present actual deficits and the future projected deficits?
8.0
6.67.6
9.8
12.5
0.0
5.0
10.0
15.0
20.0
25.0
30.0
35.0
40.0
45.0
50.0
Mill
ion
dolla
rs
Distance to target
Workforce planning
Net faculty incentive plan for retirement(gross savings of $12.4M in 15/16)
Changes in investment strategy
Changes in institutional practice (non-salary, 2 up 1 down, other)
University Council meeting (June 19, 2014): usask.ca/secretariatUniversity finances blog (June 20, 2014):

Financial Presentation to Senate April 25, 2015
Additional impact of actions taken $37M narrowing of the gap
Question 2: What is the present actual deficits and the future projected deficits?
8.0
6.6
7.6
9.8
5.0
0.0
5.0
10.0
15.0
20.0
25.0
30.0
35.0
40.0
Mill
ion
dolla
rs
Additional effects (pension, LTD,travel, supplies, etc.)
Workforce planning
Net faculty incentive plan forretirement(gross savings of $12.4M in 15/16)
Changes in investment strategy
Changes in institutional practice (non-salary, 2 up 1 down, other)
Financial Presentation to Senate April 25, 2015
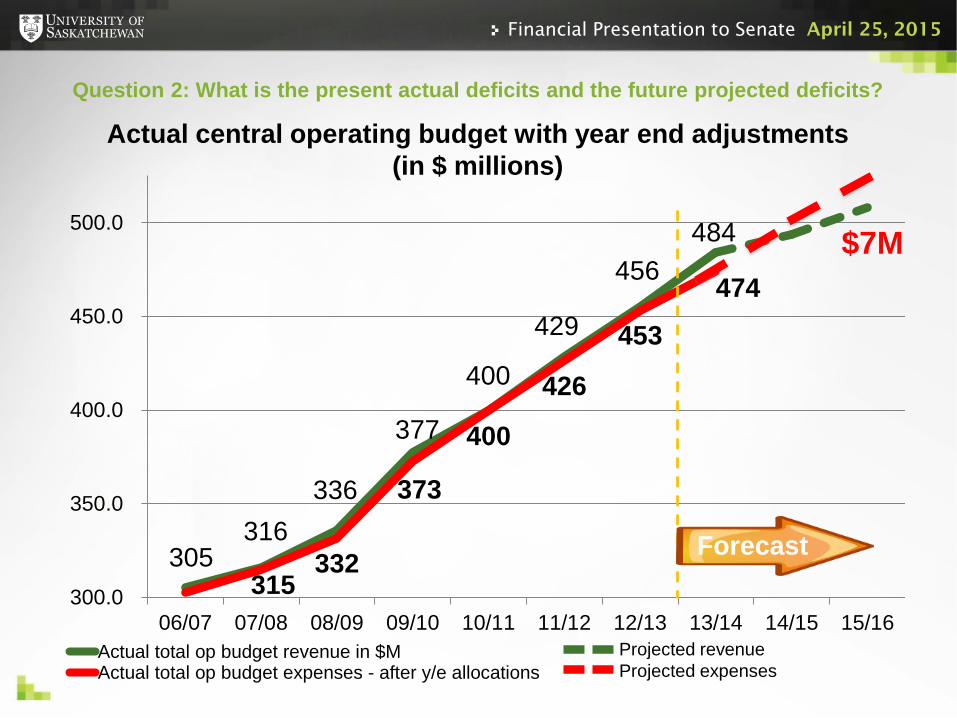
305316
336
377
400
429
456484
315332
373
400
426
453
474
300.0
350.0
400.0
450.0
500.0
06/07 07/08 08/09 09/10 10/11 11/12 12/13 13/14 14/15 15/16Actual total op budget revenue in $MActual total op budget expenses - after y/e allocations
$7M
Projected revenueProjected expenses
Actual central operating budget with year end adjustments(in $ millions)
Forecast
Question 2: What is the present actual deficits and the future projected deficits?

Financial Presentation to Senate April 25, 2015
Question 3:How and why was the $44.5M projected deficit adjusted to reflect the actual and
future projected deficits?

Financial Presentation to Senate April 25, 2015
A swift response to the projected deficit was required
No deficit was realized Communication
Opportunities to submit ideas, comments and questions
Public town hall meetings Meetings with stakeholders Communication via blogs, websites, newspaper
articles
Labelling the projected deficit Both intended and unintended consequences
Question 3: How and why was the $44.5M projected deficit adjusted toreflect the actual and future projected deficits?

Financial Presentation to Senate April 25, 2015
305316
336
377
400
429
456
484
315332
373
400
426
453474
300.0
350.0
400.0
450.0
500.0
06/07 07/08 08/09 09/10 10/11 11/12 12/13 13/14 14/15 15/16Actual total op budget revenue in $M
If the actions had not been taken expenses would have continued to rise at the same rate
… and the revenue growth rate would have fallen
Revenue
Expenses
Operating budget ($millions)
A swift response - actual central operating budget
17
Forecast
Question 3: How and why was the $44.5M projected deficit adjusted toreflect the actual and future projected deficits?
Projected revenueProjected expenses
Financial Presentation to Senate April 25, 2015
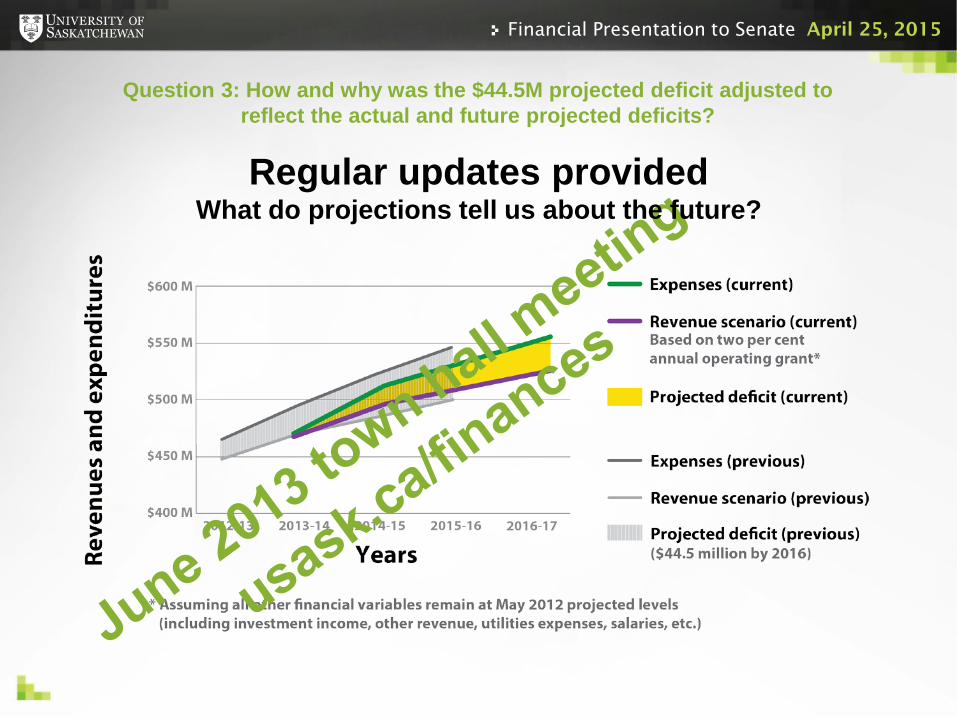
Regular updates providedWhat do projections tell us about the future?
Question 3: How and why was the $44.5M projected deficit adjusted toreflect the actual and future projected deficits?
Financial Presentation to Senate April 25, 2015
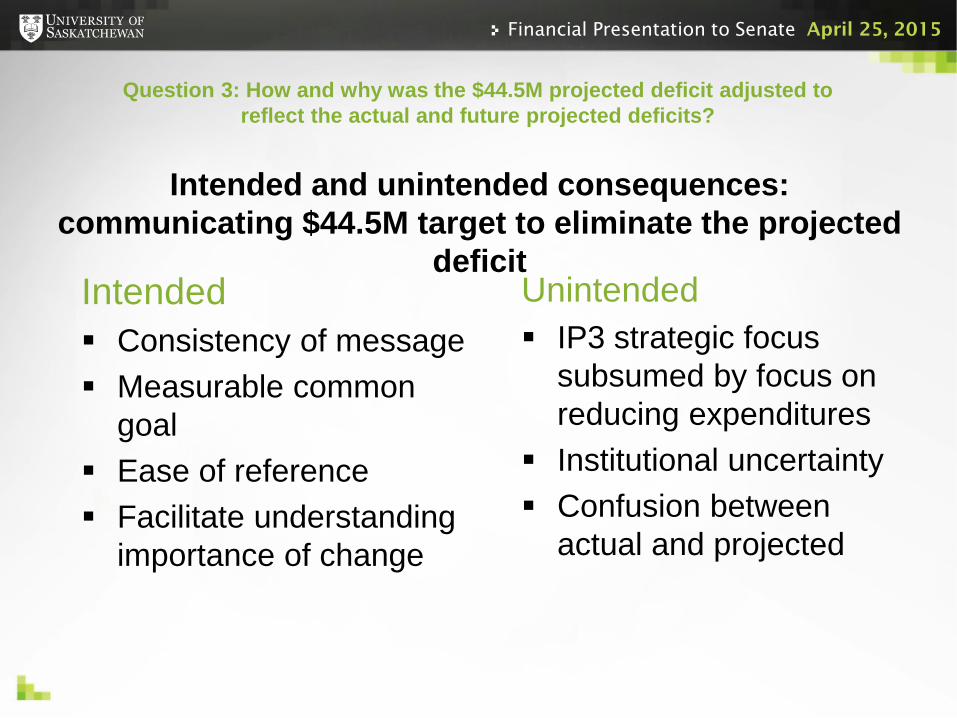
Intended and unintended consequences:communicating $44.5M target to eliminate the projected
deficitIntended Consistency of message Measurable common
goal Ease of reference Facilitate understanding
importance of change
Unintended IP3 strategic focus
subsumed by focus on reducing expenditures
Institutional uncertainty Confusion between
actual and projected
Question 3: How and why was the $44.5M projected deficit adjusted toreflect the actual and future projected deficits?

Financial Presentation to Senate April 25, 2015
$44.5 projected deficit Based on IP3 multi-year operating budget
forecast Estimated the impact of 2% growth in provincial
grant (changed nothing else)
Actions and actuals closed gap by $37 million No deficit realized to date Expenses growing faster than revenues Intended and unintended consequences
In summary
Let’s continue the discussion and dig a bit deeper…

Financial Presentation to Senate April 25, 2015
Budget discussion item #1:Does the U of S currently have both a surplus and a
deficit?
We don’t! Let’s explore this further as there may be confusion…

Financial Presentation to Senate April 25, 2015
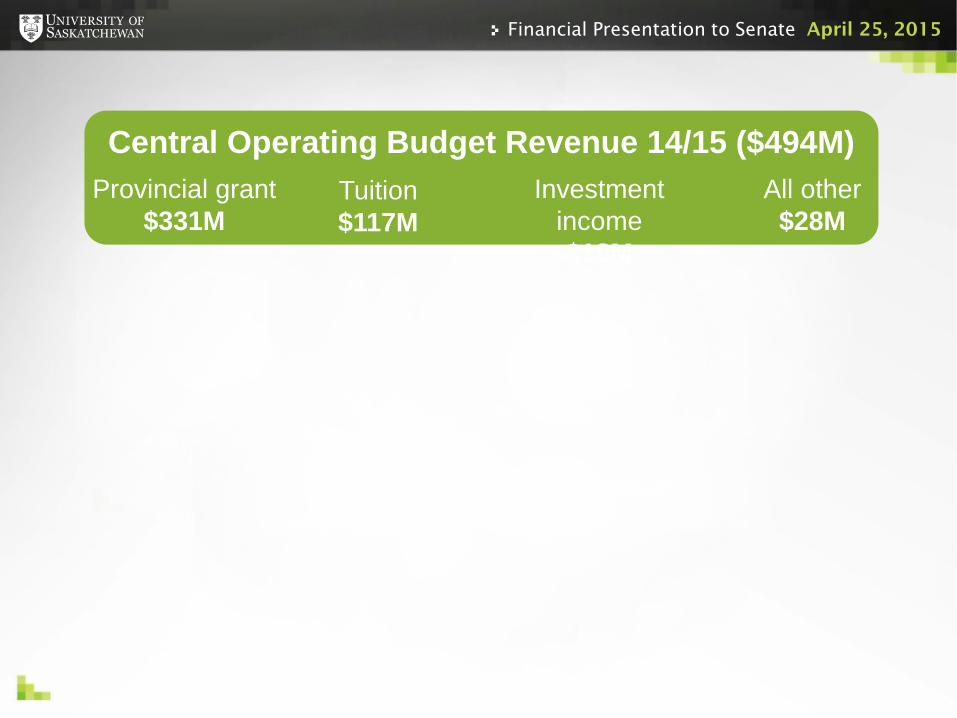
Central Operating Budget Revenue 14/15 ($494M)Provincial
grant$331M
Central Operating Budget Revenue 14/15 ($494M)Provincial grant
$331M

Financial Presentation to Senate April 25, 2015
Central Operating Budget Revenue 14/15 ($494M)
Provincial grant
$331M
Tuition$117M
Central Operating Budget Revenue 14/15 ($494M)Provincial grant
$331MTuition$117M

Financial Presentation to Senate April 25, 2015
Central Operating Budget Revenue 14/15 ($494M)
Provincial grant
$331M
Tuition$117M
Investment income$18M
Central Operating Budget Revenue 14/15 ($494M)Provincial grant
$331MTuition$117M
Investment income$18M
Financial Presentation to Senate April 25, 2015
Central Operating Budget Revenue 14/15 ($494M)Provincial grant
$331MTuition$117M
Investment income$18M
All other$28M

Financial Presentation to Senate April 25, 2015
Central Operating Budget Revenue 14/15 ($494M)
Provincial grant
$331M
Tuition$117M
Investment income$18M
All other$28M
Central Operating Budget Revenue 14/15 ($494M)Provincial grant
$331MTuition$117M
Investment income$18M
All other$28M
Academicunits
$322M
Support units$93M
Central academic
$49M

Financial Presentation to Senate April 25, 2015
Central Operating Budget Revenue 14/15 ($494M)
Provincial grant
$331M
Tuition$117M
Investment income$18M
All other$28M
Central Operating Budget Revenue 14/15 ($494M)Provincial grant
$331MTuition$117M
Investment income$18M
All other$28M
Academicunits
$322M
Support units$93M
Utilities$18M
Student aid$10M
Central academic
$49M

Financial Presentation to Senate April 25, 2015
Central Operating Budget Revenue 14/15 ($494M)
Provincial grant
$331M
Tuition$117M
Investment income$18M
All other$28M
Academicunits
$322M
Support units$93M
Utilities$18M
Student aid$10M
General
$5M
Central academic
$49M
Central Operating Budget Revenue 14/15 ($494M)Provincial grant
$331MTuition$117M
Investment income$18M
All other$28M

Financial Presentation to Senate April 25, 2015
Central Operating Budget Revenue 14/15 ($494M)
Tuition$117M
Investment income$18M
All other$28M
Support units$93M
Utilities$18M
Student aid$10M
Total allocations($497M)
Central academic
$49M
Academicunits
$322M
General
$5M
2014/15projecteddeficit$3M
Provincial grant
$331M

Financial Presentation to Senate April 25, 2015
2014/15projectedsurplus$21M
Combined surplus$18M
Distributed net expenditures ($476M)
Central Operating Budget Revenue 14/15 ($494M)
Tuition$117M
Investment income$18M
All other$28M
Support units$93M
Utilities$18M
Student aid$10M
Central academic
$49M
Academicunits
$322M
General
$5M
Provincial grant
$331M
2014/15projecteddeficit$3M
Total allocations($497M)

Financial Presentation to Senate April 25, 2015
Fund balances – U15 median
0.00%
5.00%
10.00%
15.00%
20.00%
25.00%
30.00%
U15 accumulated fund balances 2013/14as a % of total expenditures
(deficit balances have been excluded)
Unrestricted Funds as % of total expenditures median

Financial Presentation to Senate April 25, 2015
Reserves and savings 4,800 funds across university Managed by individuals,
departments, college/support units, institutional and central committees
Reserves Risk reserves (20%) Academic priority (12%)
Savings APEFs & DSAEs (3%) Specific projects (65%)
Budget discussion item #1 (cont.):Why did the reserves and savings grow?
University fund balances

Financial Presentation to Senate April 25, 2015
Institutional uncertainty Filling vacancies Launching new
projectsand programs
Discretionary spending
Debt avoidance Special project
i
Reserves: $98MRisk reserves (20%)Academic priority funds (12%)
Savings: $211MAPEFs and DSAEs (3%)Specific projects (65%)
Budget discussion item #1 (cont.): Why did the reserves and savings grow?

Financial Presentation to Senate April 25, 2015
Budget discussion item #2:Who manages the reserves and savings?
The owners of each of the 4,800+ funds!

Financial Presentation to Senate April 25, 2015
Fund allocation process is generally one way Surpluses go into reserves and savings Funds have been returned to central:
Transition funding – $20M in 2012
Fund balance policy / guideline under development
Future allocations may consider college and unit fund balance levels
Budget discussion item #2 (cont.):Who manages the reserves and savings?

Financial Presentation to Senate April 25, 2015
Budget discussion item #3:How do we balance the budget going forward?
There are lots of options to explore…

Financial Presentation to Senate April 25, 2015
Centre / institute(2014-15 in millions)
U of S funding
Other funding Total
Canadian Light Source/ Synchrotron $1.1 $33.7 $34.8
VIDO-InterVac $1.6 $20.3 $21.9Sylvia Fedoruk Centre $ - $9.8 $9.8 Global Institute for Food Security $ - $2.4 $2.4 Global Institute for Water Security $1.7 $4.5 $6.2Total $4.4 $70.7 $75.1
Fact: U of S contribution represents about 1% of the university operating budget
Budget discussion item #3 (cont.):Leveraging research

Financial Presentation to Senate April 25, 2015
Budget discussion item #3 (cont.):Leveraging research
Examples of benefits:
Synchrotron $33M in economic impact
for SK 600 U of S faculty and
students 500 high school students Medical isotope
production
VIDO-InterVac Two world first vaccines Hundreds of patents Opportunities for research
and vaccine production $140M inflow of capital
investment

Financial Presentation to Senate April 25, 2015
33% 31% 34% 34% 34% 34% 35% 35%
67% 69% 66% 66% 66% 66% 65% 65%
0%
10%
20%
30%
40%
50%
60%
70%
80%
Percent of Total Staff (# FTE in Budget)
Academic Administrative
49% 48% 50% 48% 48% 48% 49% 48%
51% 52% 50% 52% 52% 52% 51% 52%
0%
10%
20%
30%
40%
50%
60%
70%
Percent of Total Staff Cost ($ in Budget)
Academic Administrative
Budget discussion item #3 (cont.):Efficiency gains
Admin staff have grown at the same rate as academic staffStaffing costs overall have grown as a percentage of total
budget

Financial Presentation to Senate April 25, 2015
Workforce planning reduced administrative complement by 150 (net) FTE in 2012-13,10 FTE since
Administrative and support position posting review process implemented Emphasis on retention and reassignment
Continue to optimize staff structure and complement
Budget discussion item #3 (cont.):Efficiency gains

Financial Presentation to Senate April 25, 2015
Current state Proactive financial
management = no actual deficit
We are financially sound Able to fund one-time
enhancements and projects (e.g. College of Medicine)
Better able to diversify revenue streams
Ongoing risks Economic shocks (oil
price impact on provincial grant)
Lack of diversity in funding sources
Expenses projected to grow faster than revenue but no longer a
solvency threat in the near term
Conclusion

Financial Presentation to Senate April 25, 2015
Actions Transition to a budget model where college
and unit leaders have more authority over resource management
A policy that better helps us manage our savings and reserves
Strengthen our financial management and allocation
Continue to optimize staff structure and complement
Enhanced communication on financials
Conclusion

Financial Presentation to Senate April 25, 2015
Financial Presentation to Senate April 25, 2015

Financial Presentation to Senate April 25, 2015
($ millions) .
General fund balance (p. 24 of the 13/14 annual financial report) $268.6Add back
a) Ancillary internal loans (residences) $26.6b) Risk management liabilities (swaps) $3.6c) Future employee benefits (Actuarial adjustment) $25.6
Lessa) Subsidiaries ($15.3)
Unadjusted general fund balance $309.1
Tying it back to the financial statements
2013-14 annual financial report: usask.ca/reporting
Financial Presentation to Senate April 25, 2015
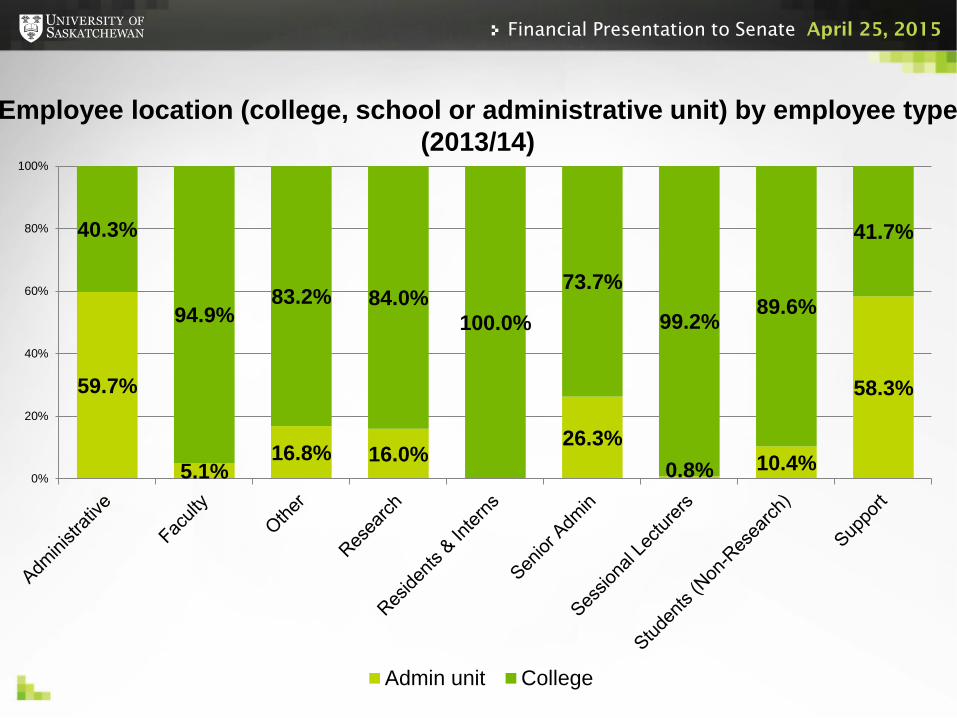
59.7%
5.1%16.8% 16.0%
26.3%0.8% 10.4%
58.3%
40.3%
94.9%83.2% 84.0%
100.0%
73.7%
99.2%89.6%
41.7%
0%
20%
40%
60%
80%
100%
Admin unit College
Employee location (college, school or administrative unit) by employee type(2013/14)