Embed Size (px)
Citation preview
Financial Project Metrics in Feasibility Study
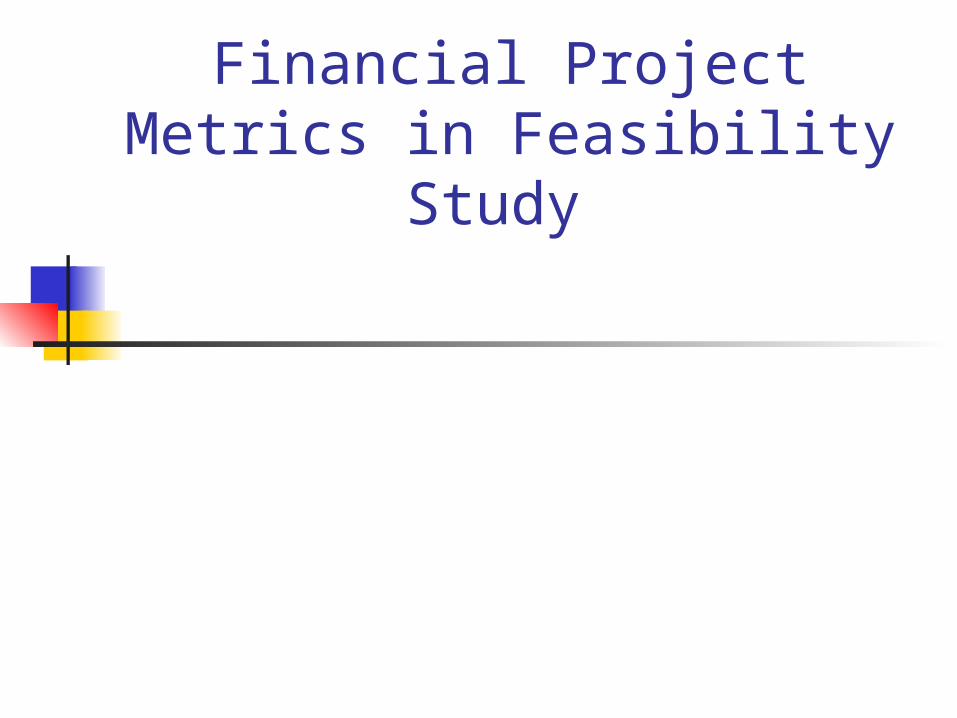
Cost Estimation - Factors Hardware and Software costs
including maintenance Travel and Training costs Effort costs (costs of paying SW engineers)
Heating lighting and office space Support staff (accountants, cleaners etc) Infrastructure (network + communications) Facilities (library, refreshments, recreation) Social security, employee benefits, pensions
etc
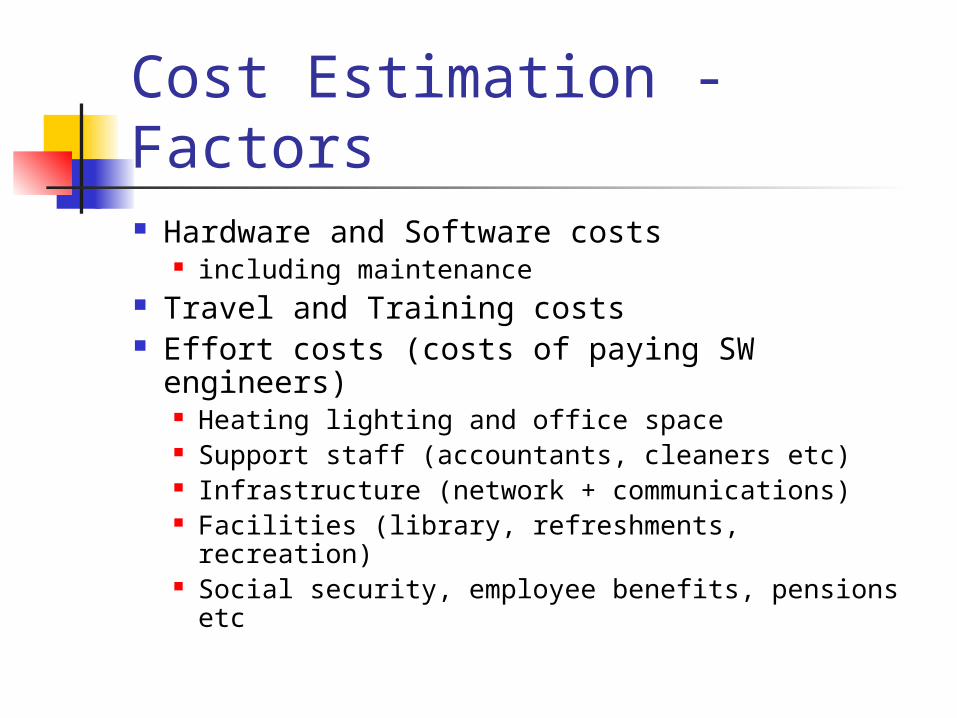
Cost Benefit Analysis Compare the costs of carrying out
a project with the estimated benefits
Identify all costs Development Costs Running Costs – annual costs
Cost Benefit Analysis Include all direct benefits of the project
Will normally accrue on completion – but not always
May be annual benefits/savings
Express costs and benefits in a common unit
£, €, $ etc
What about intangible benefits?
Cost Benefit Analysis Example layout
Project Costs Direct Costs – Costs that can be
directly attributed to a project task (labour, materials etc.)
Indirect Costs – Overheads that do not directly contribute to the project (rent, heating, lighting, admin)
Pricing vs. Costing Price to charge for software
= Cost + Profit Other factors may effect the pricing e.g. competitive environment, loss
leader project Pricing therefore involves:
project managers for costing senior management for pricing
strategies
Costs vs. Budget Cost = how much it will cost to
produce system Budget = how much you will be
allowed to spend on producing system
Top Down Budget High level management set budget
against high level tasks This is then divided amongst lower
level tasks – by lower levels of management
Generally results in: Inaccurate low level budgets Competition for available funds
Bottom up Budget Estimates are made on resource costs
etc. for low level tasks (WBS) These are aggregated to provide direct
costs for the project PM adds indirect costs – admin, etc. and
reserve (and profit figures)
Senior management then cut the budget!
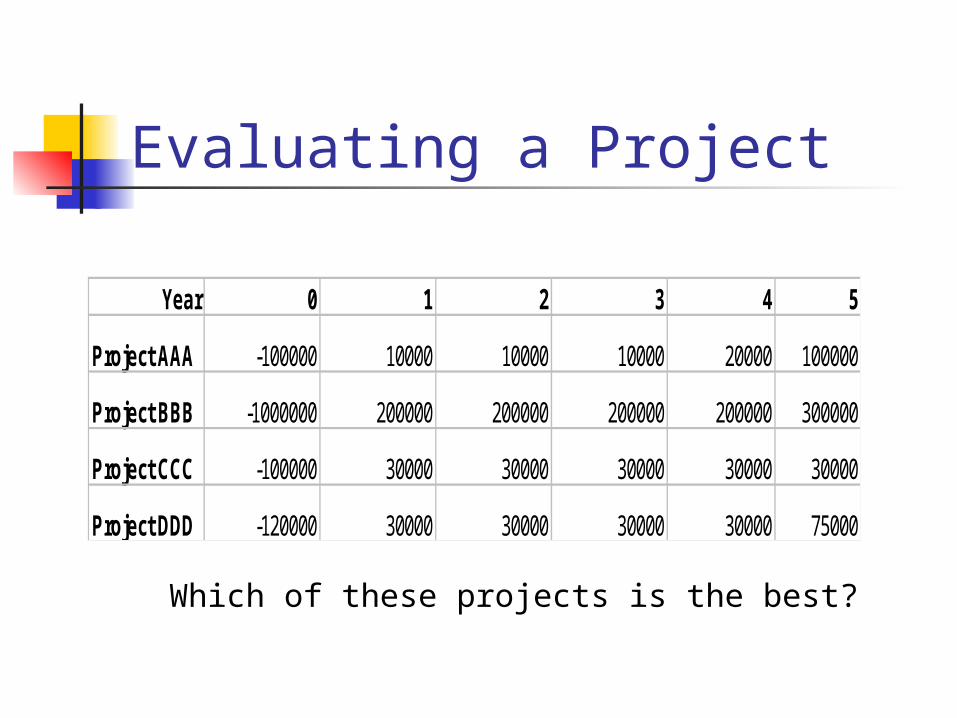
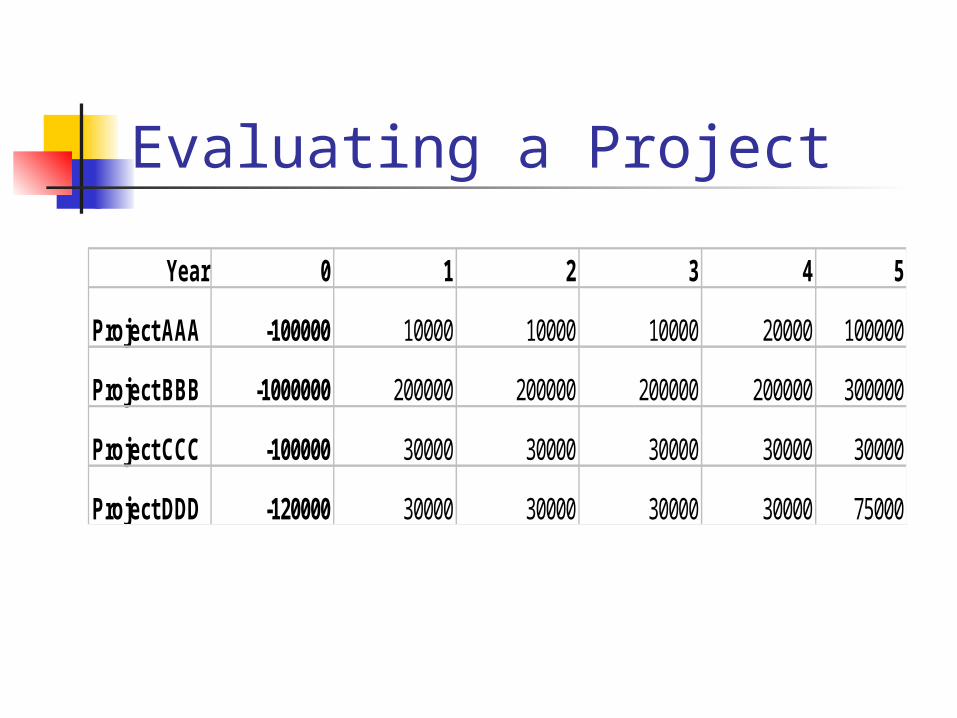
Evaluating a Project
Year 0 1 2 3 4 5
Project AAA -100000 10000 10000 10000 20000 100000
Project BBB -1000000 200000 200000 200000 200000 300000
Project CCC -100000 30000 30000 30000 30000 30000
Project DDD -120000 30000 30000 30000 30000 75000
Which of these projects is the best?
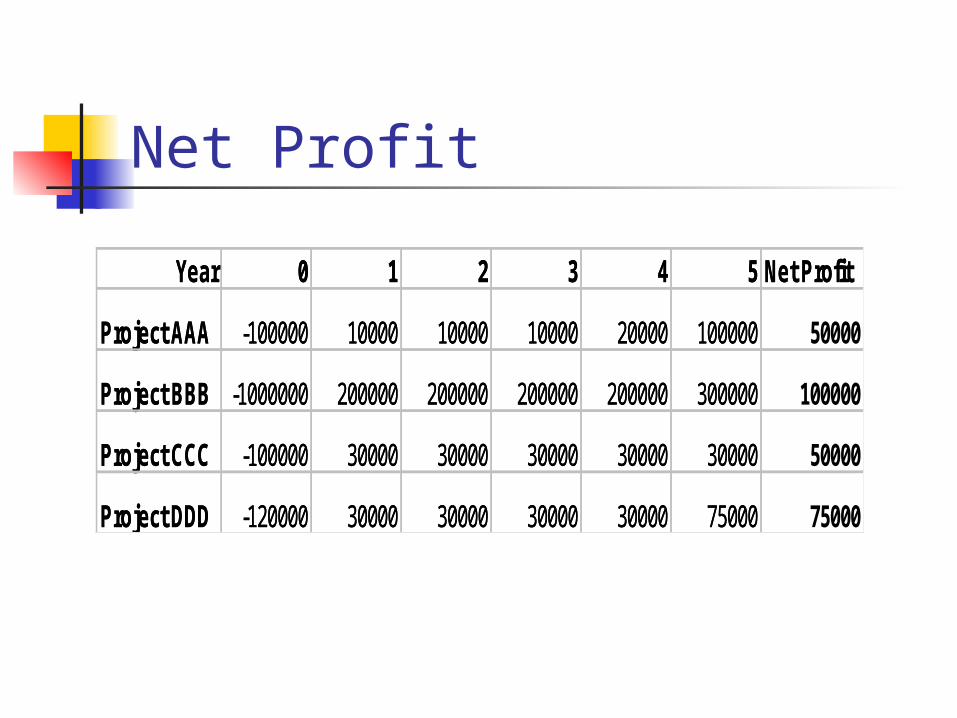
Net Profit
Year 0 1 2 3 4 5 Net Profit
Project AAA -100000 10000 10000 10000 20000 100000 50000
Project BBB -1000000 200000 200000 200000 200000 300000 100000
Project CCC -100000 30000 30000 30000 30000 30000 50000
Project DDD -120000 30000 30000 30000 30000 75000 75000
Year 0 1 2 3 4 5 Net Profit
Project AAA -100000 10000 10000 10000 20000 100000
Project BBB -1000000 200000 200000 200000 200000 300000
Project CCC -100000 30000 30000 30000 30000 30000
Project DDD -120000 30000 30000 30000 30000 75000
Net Profit The most obvious criteria for
comparison Does not give the full picture
regarding the viability of the project
Cash Flow Can the organisation afford the –ve
cash flow required for the development of the project e.g. Project BBB requires an initial
outlay of £1000,000
Cash Flow We need to spend money during
the development of a product We hope to get it back once the
product is finished Therefore projects will have a –ve
cash flow during their development This should become +ve once the
project is complete
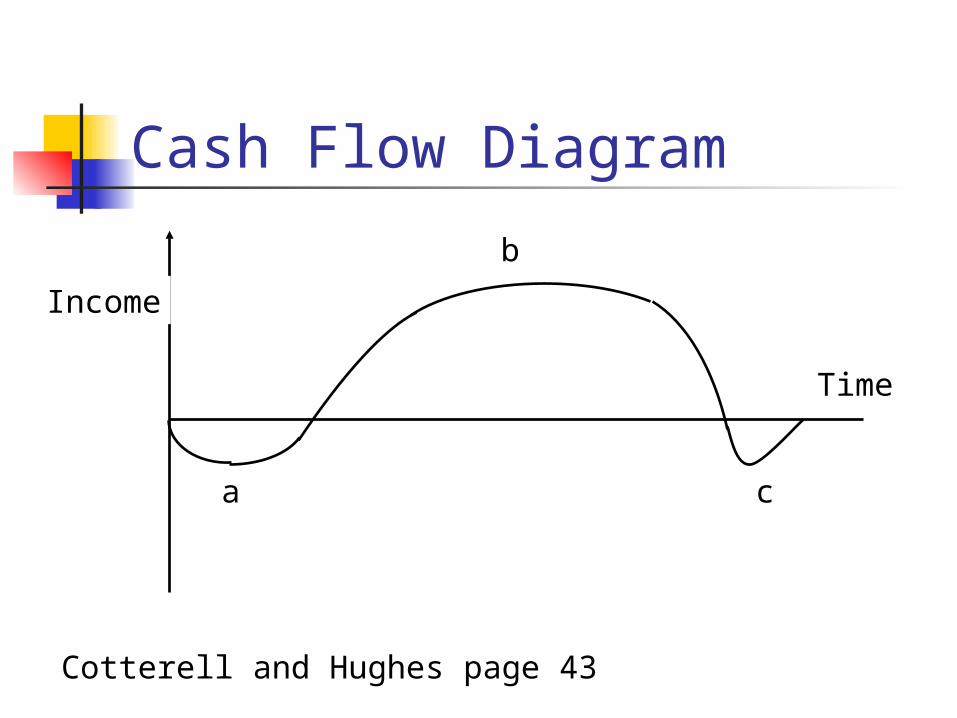
Cash Flow Diagram
Cotterell and Hughes page 43
Income
Time
a
b
c
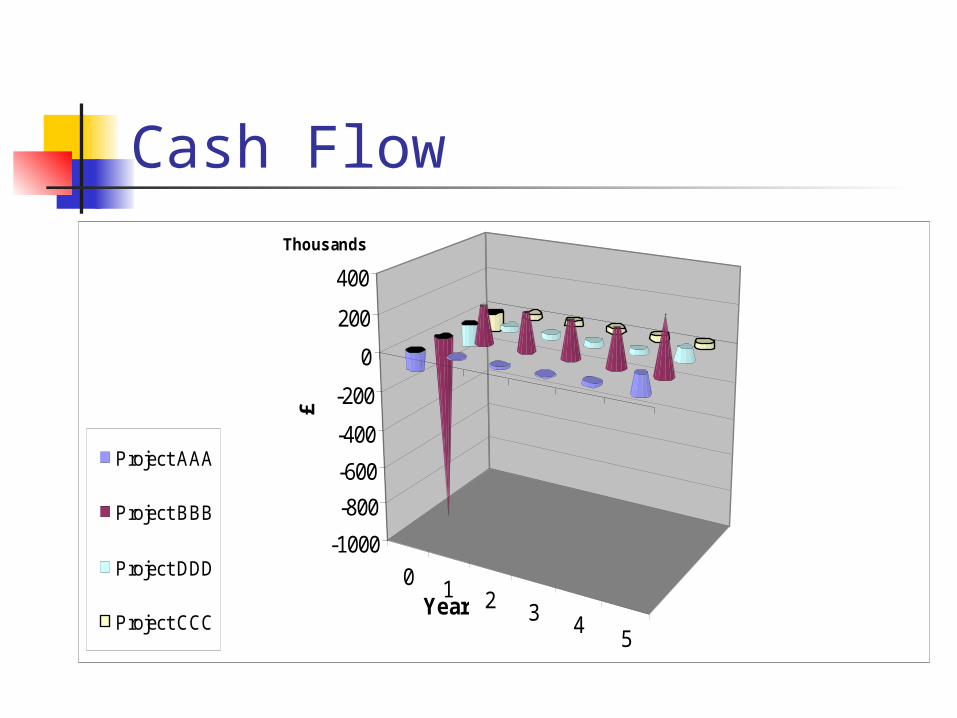
Cash Flow
0 1 2 3 45
-1000
-800
-600
-400
-200
0
200
400£
Thousands
Year
Project AAA
Project BBB
Project DDD
Project CCC
Evaluating a Project
Year 0 1 2 3 4 5
Project AAA -100000 10000 10000 10000 20000 100000
Project BBB -1000000 200000 200000 200000 200000 300000
Project CCC -100000 30000 30000 30000 30000 30000
Project DDD -120000 30000 30000 30000 30000 75000
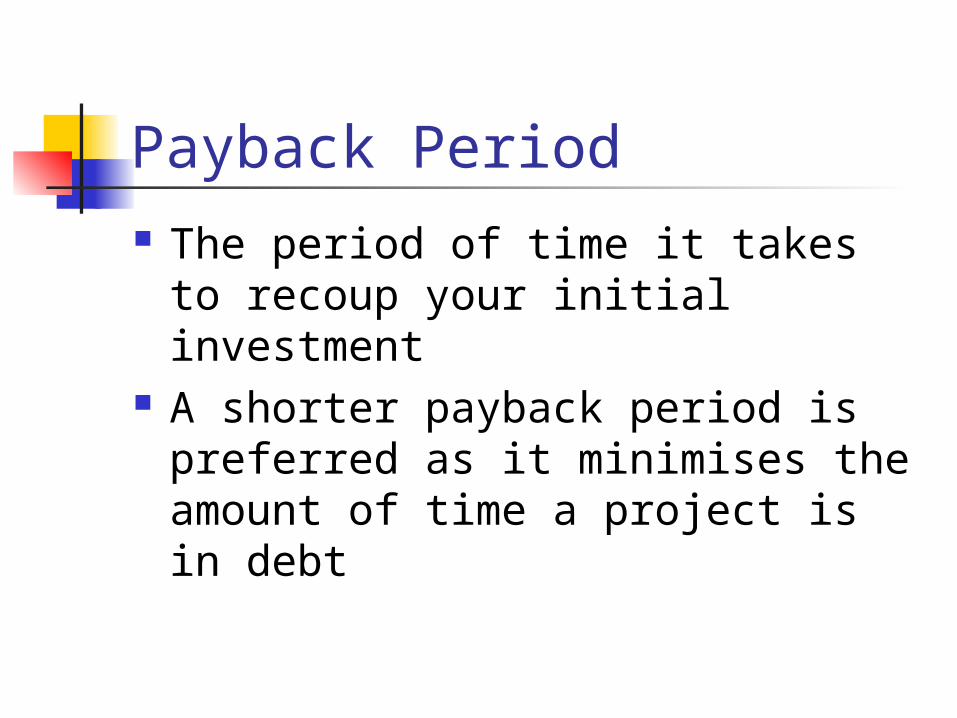
Payback Period The period of time it takes to
recoup your initial investment A shorter payback period is
preferred as it minimises the amount of time a project is in debt
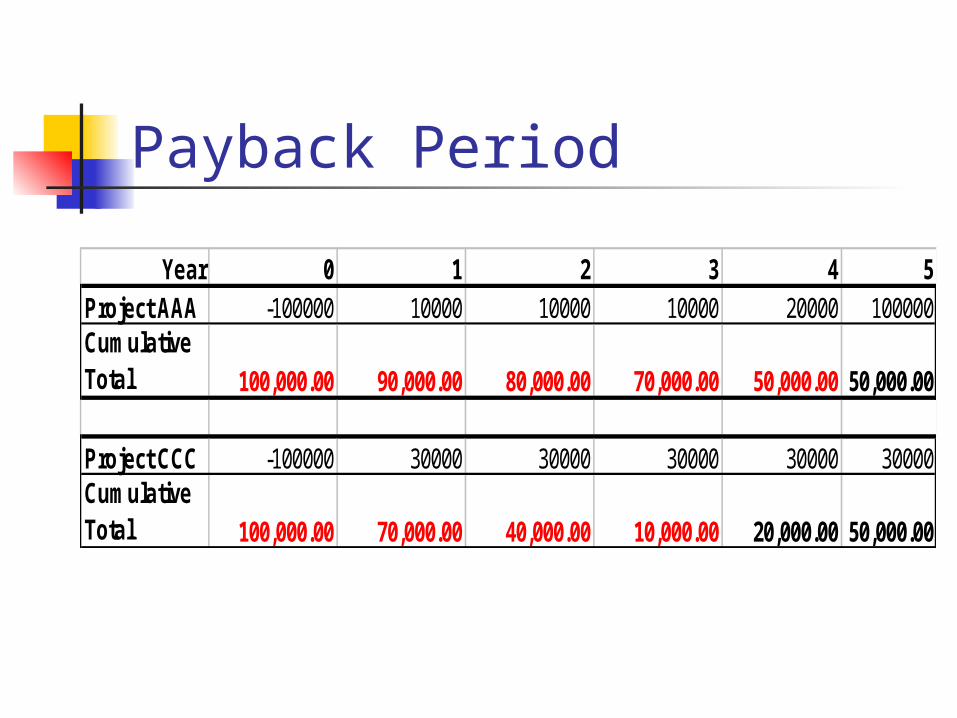
Payback Period
Year 0 1 2 3 4 5Project AAA -100000 10000 10000 10000 20000 100000Cumulative Total 100,000.00 90,000.00 80,000.00 70,000.00 50,000.00 50,000.00
Project CCC -100000 30000 30000 30000 30000 30000Cumulative Total 100,000.00 70,000.00 40,000.00 10,000.00 20,000.00 50,000.00
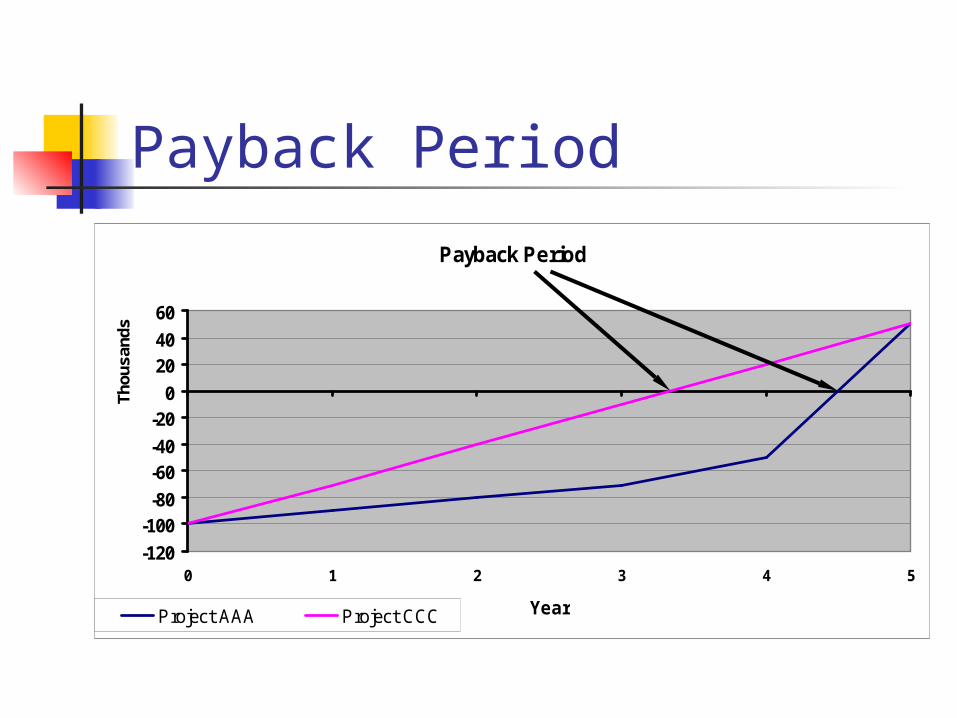
Payback Period
Payback Period
-120
-100-80
-60-40
-200
2040
60
0 1 2 3 4 5
Thou
sand
s
YearProject AAA Project CCC
Payback Period Find the payback period for
projects BBB and DDD
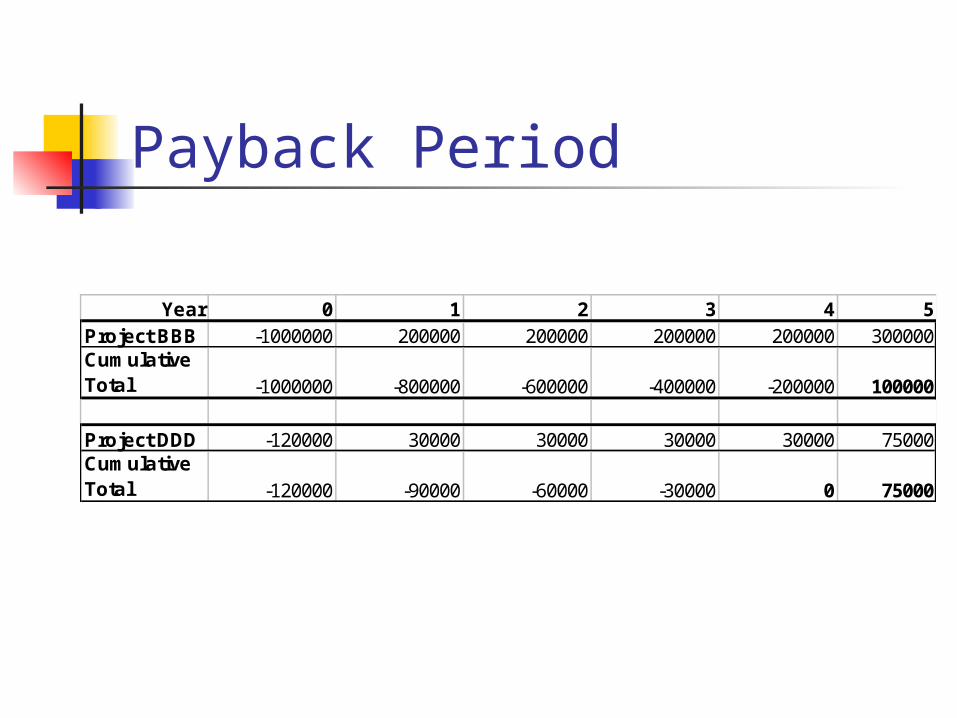
Payback Period
Year 0 1 2 3 4 5Project BBB -1000000 200000 200000 200000 200000 300000Cumulative Total -1000000 -800000 -600000 -400000 -200000 100000
Project DDD -120000 30000 30000 30000 30000 75000Cumulative Total -120000 -90000 -60000 -30000 0 75000
Return on Investment Is it really worth investing all that
time, money and effort into the project?
To help make that decision we use the return on investment
The investment will be the initial development costs of the project
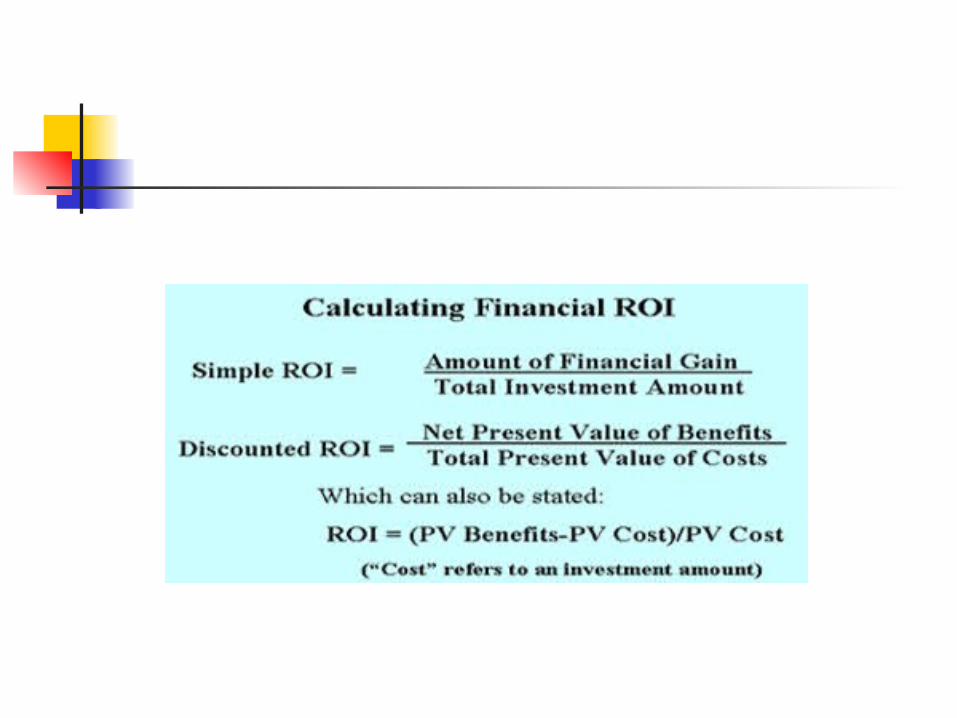
Return on Investment Used to discover the percentage of
return on the original project investment
ROI = average annual profit x 100 total investment
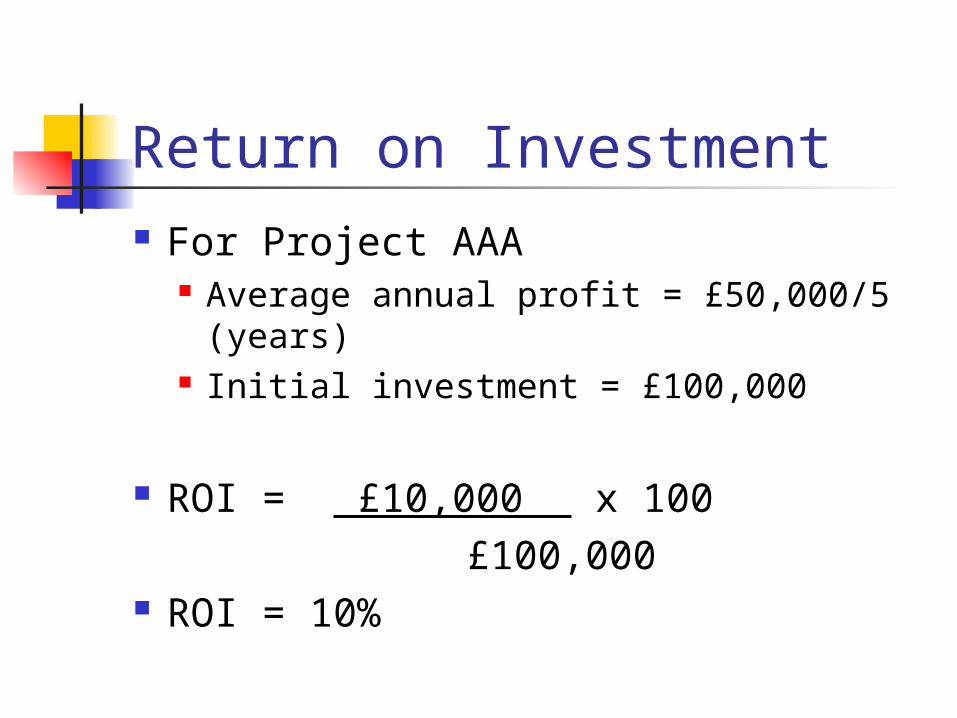
Return on Investment For Project AAA
Average annual profit = £50,000/5 (years)
Initial investment = £100,000
ROI = £10,000 x 100 £100,000 ROI = 10%
Return on Investment Calculate the ROI for the remaining
projects and show which one provides the best return
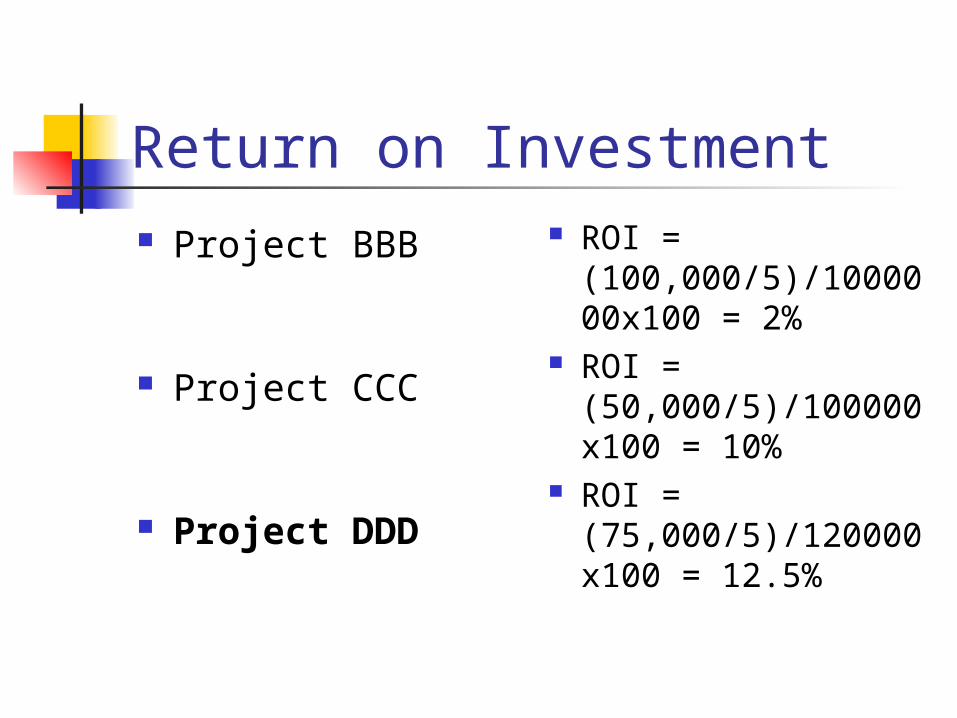
Return on Investment Project BBB
Project CCC
Project DDD
ROI = (100,000/5)/1000000x100 = 2%
ROI = (50,000/5)/100000x100 = 10%
ROI = (75,000/5)/120000x100 = 12.5%
Project BBB
Project CCC
Project DDD
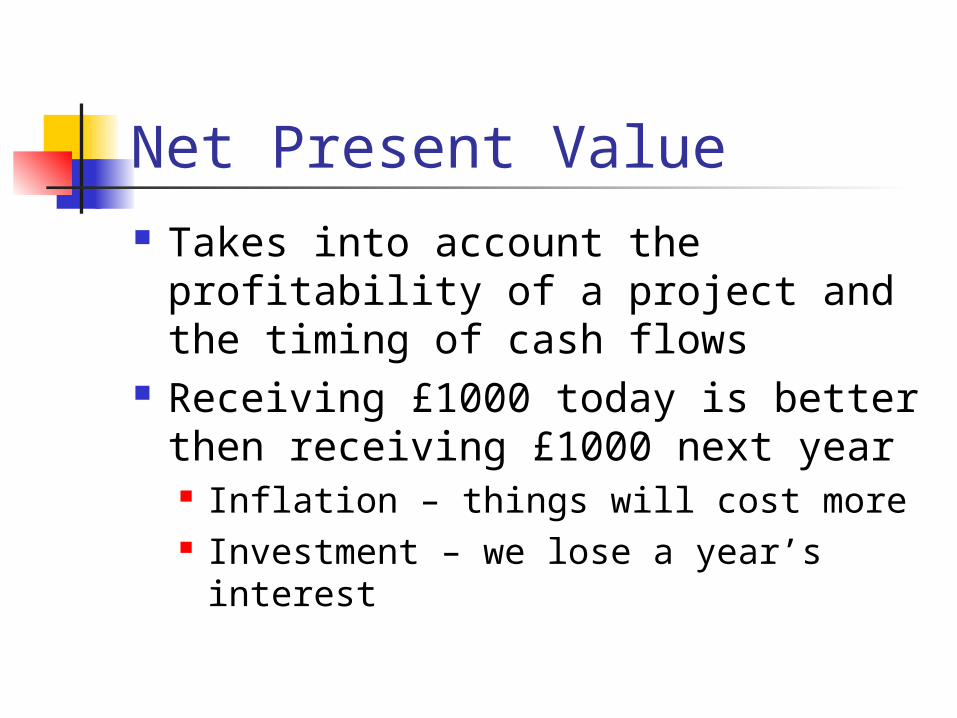
Net Present Value Takes into account the profitability
of a project and the timing of cash flows
Receiving £1000 today is better then receiving £1000 next year Inflation – things will cost more Investment – we lose a year’s interest
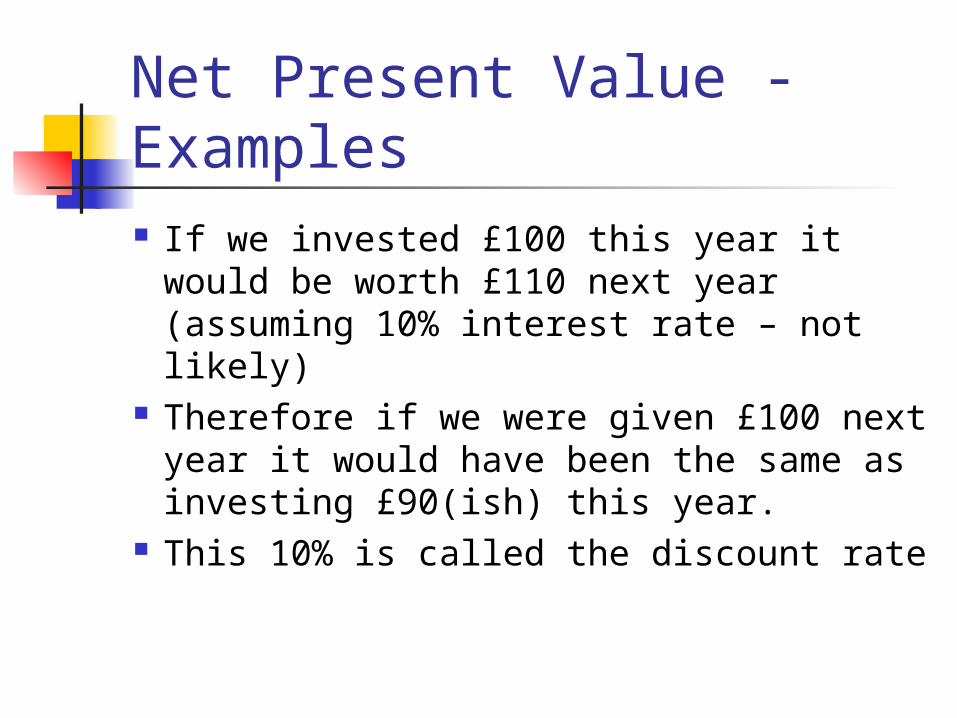
Net Present Value - Examples If we invested £100 this year it would
be worth £110 next year (assuming 10% interest rate – not likely)
Therefore if we were given £100 next year it would have been the same as investing £90(ish) this year.
This 10% is called the discount rate
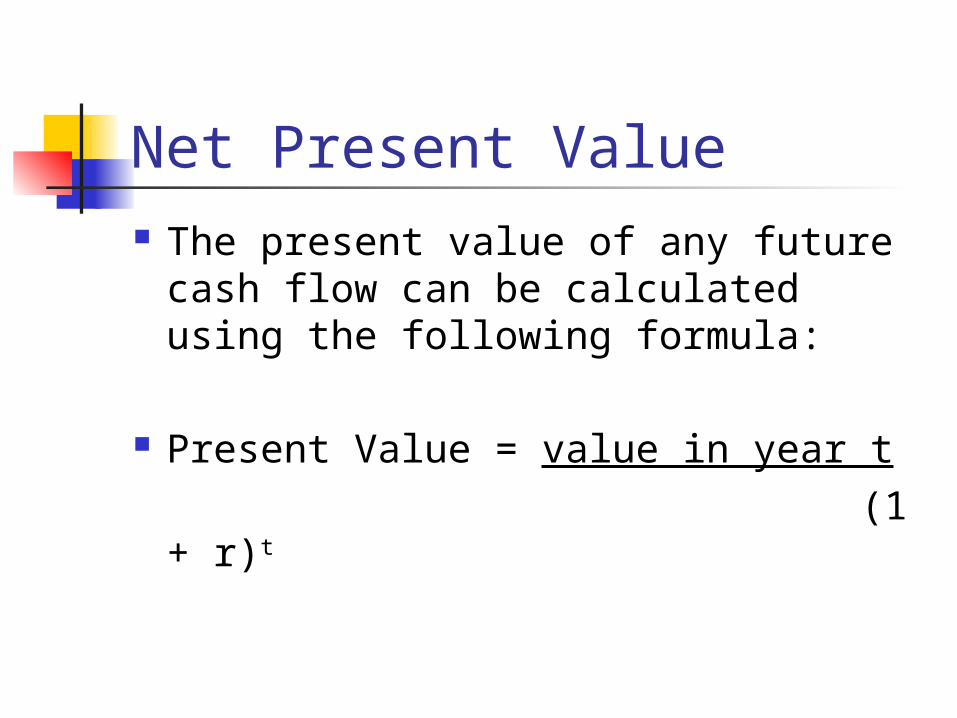
Net Present Value The present value of any future
cash flow can be calculated using the following formula:
Present Value = value in year t (1 + r)t
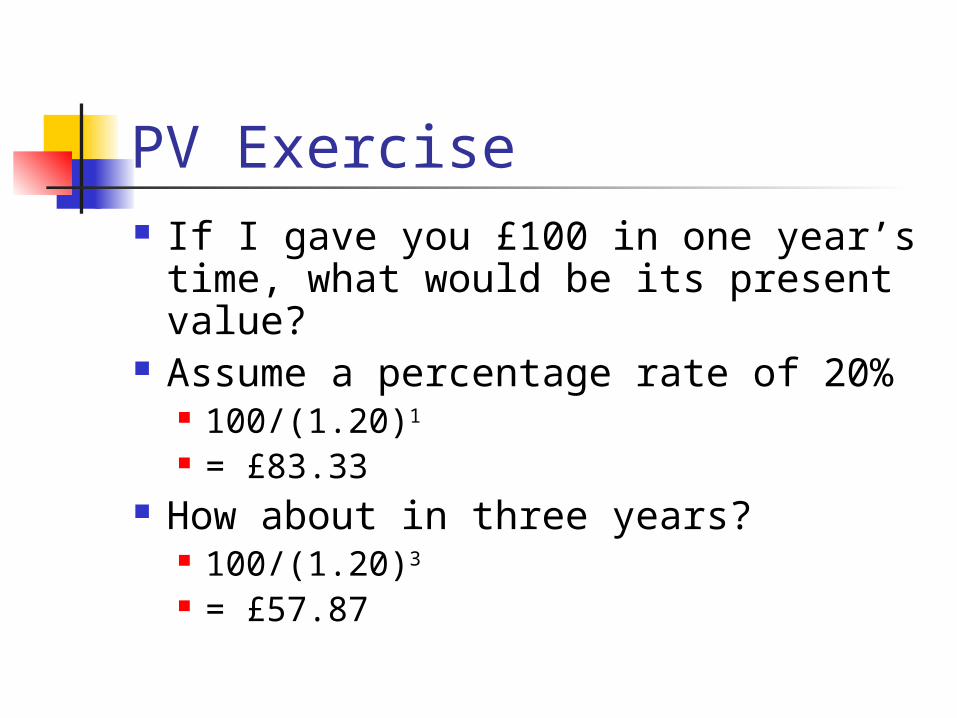
PV Exercise If I gave you £100 in one year’s
time, what would be its present value?
Assume a percentage rate of 20% 100/(1.20)1
= £83.33 How about in three years?
100/(1.20)3
= £57.87
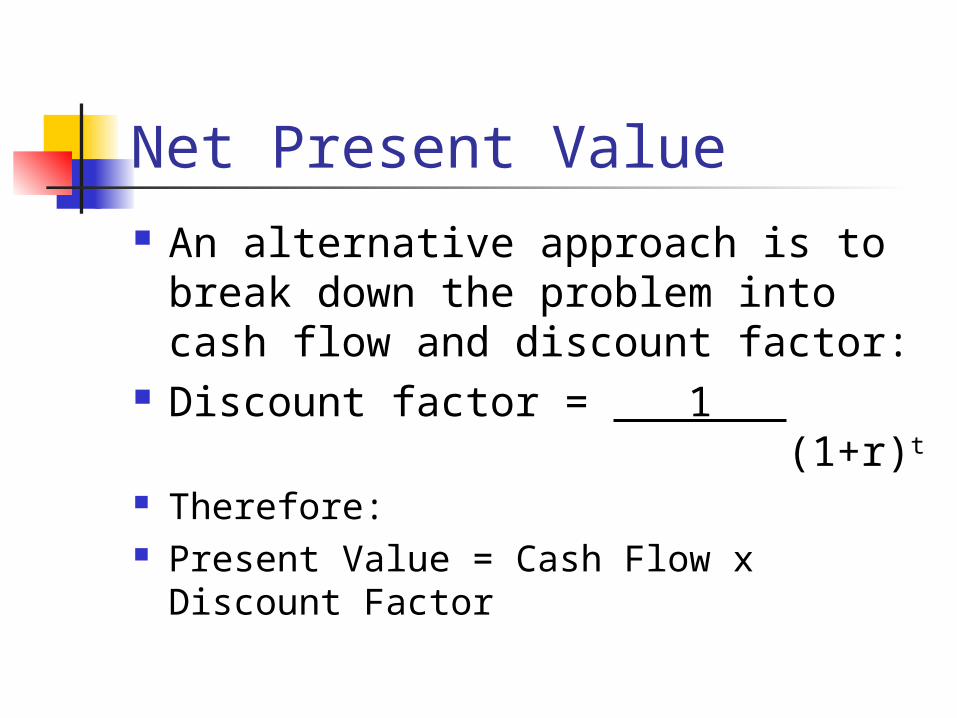
Net Present Value An alternative approach is to break
down the problem into cash flow and discount factor:
Discount factor = 1 (1+r)t
Therefore: Present Value = Cash Flow x Discount
Factor
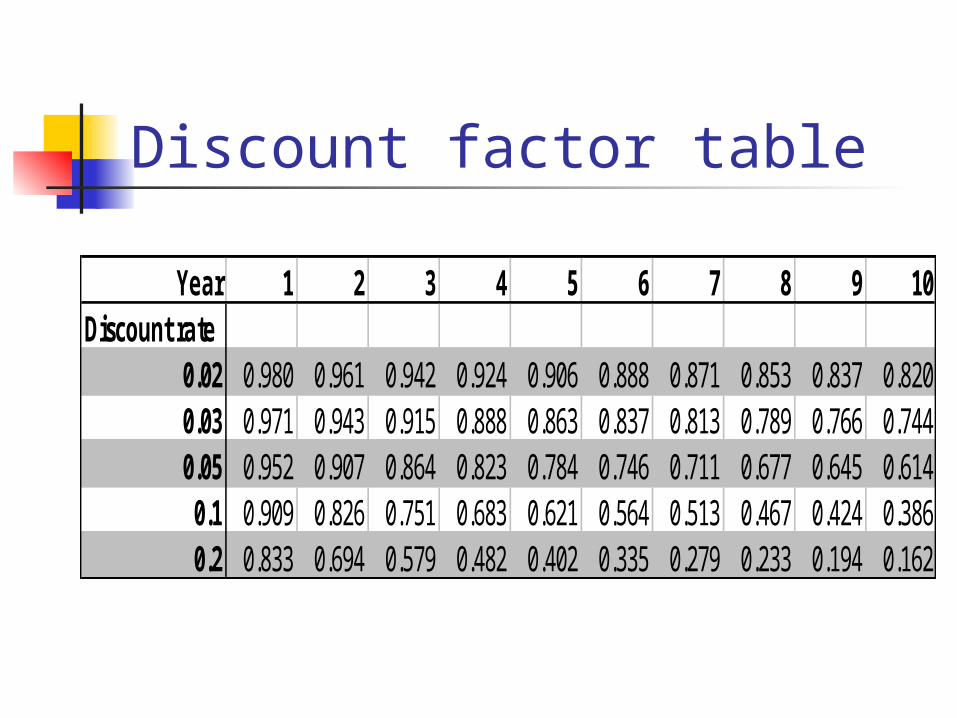
Discount factor table
Year 1 2 3 4 5 6 7 8 9 10Discount rate
0.02 0.980 0.961 0.942 0.924 0.906 0.888 0.871 0.853 0.837 0.8200.03 0.971 0.943 0.915 0.888 0.863 0.837 0.813 0.789 0.766 0.7440.05 0.952 0.907 0.864 0.823 0.784 0.746 0.711 0.677 0.645 0.6140.1 0.909 0.826 0.751 0.683 0.621 0.564 0.513 0.467 0.424 0.3860.2 0.833 0.694 0.579 0.482 0.402 0.335 0.279 0.233 0.194 0.162
Net Present Value Net Present Value is the sum of the
present values (aka discounted cash flows)
As can be seen on the next slide, the profit figures can differ significantly using Net PV instead of Net Profit
The payback period may also be effected
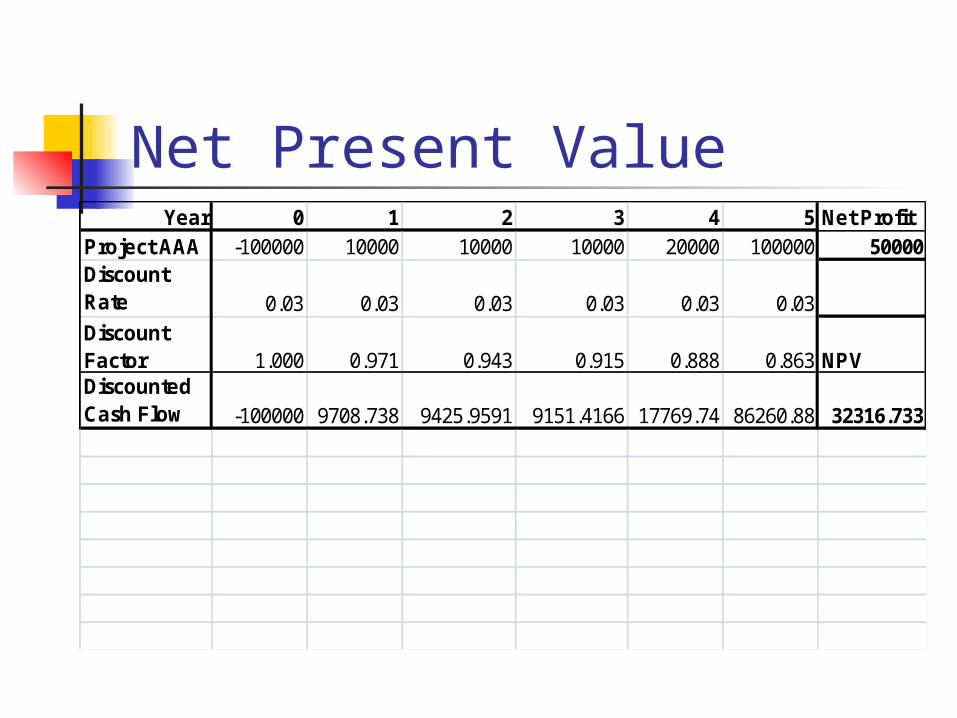
Net Present ValueYear 0 1 2 3 4 5 Net Profit
Project AAA -100000 10000 10000 10000 20000 100000 50000Discount Rate 0.03 0.03 0.03 0.03 0.03 0.03Discount Factor 1.000 0.971 0.943 0.915 0.888 0.863 NPVDiscounted Cash Flow -100000 9708.738 9425.9591 9151.4166 17769.74 86260.88 32316.733
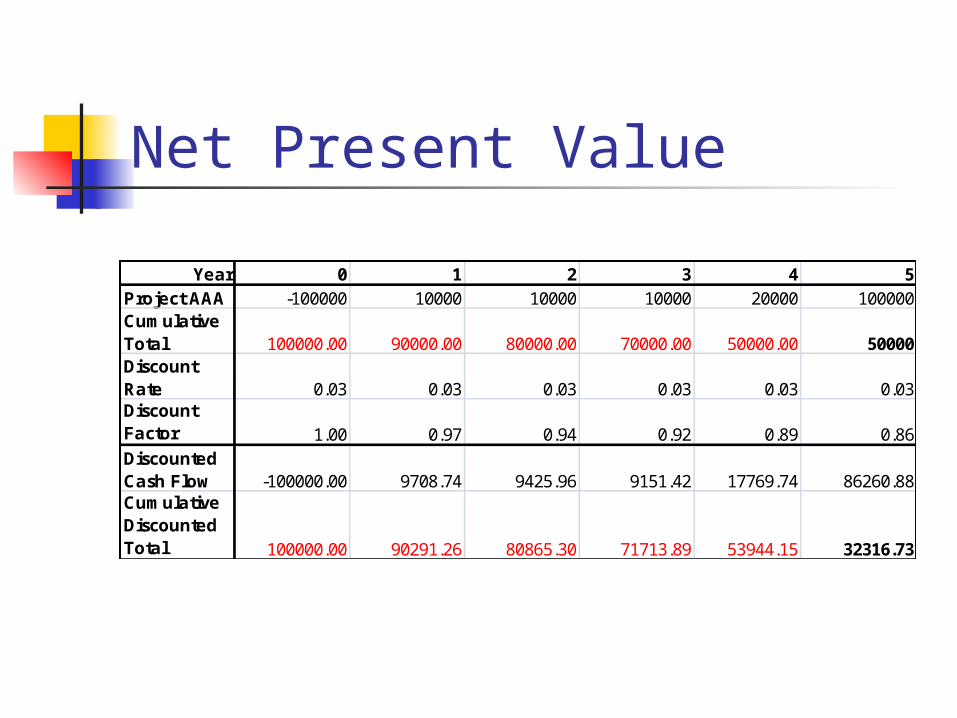
Net Present Value
Year 0 1 2 3 4 5Project AAA -100000 10000 10000 10000 20000 100000Cumulative Total 100000.00 90000.00 80000.00 70000.00 50000.00 50000Discount Rate 0.03 0.03 0.03 0.03 0.03 0.03Discount Factor 1.00 0.97 0.94 0.92 0.89 0.86Discounted Cash Flow -100000.00 9708.74 9425.96 9151.42 17769.74 86260.88Cumulative Discounted Total 100000.00 90291.26 80865.30 71713.89 53944.15 32316.73
Have a look Again: Simple ROI vs Discounted ROI The simple ROI calculation is commonly used for short-term (e..g., less than one year) investments and benefits.
For example, say $1,000 is invested and it earns $1,250. This is a gain of $250. Divide the $250 by $1,000 (the amount invested) gives an ROI of 25%.
However, the simple ROI calculation is less accurate when the investments and/or benefits involve future years because future dollars are worth less than current dollars.The general rule for greater accuracy is to use the discounted ROI calculation method when the investments and/or the benefits involve future years.
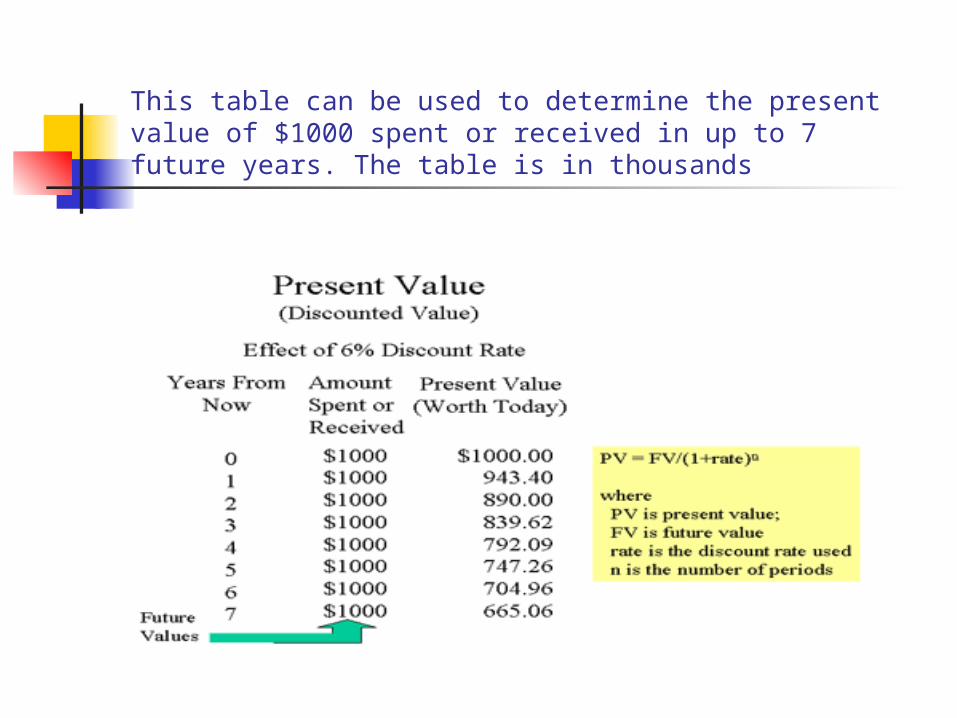
This table can be used to determine the present value of $1000 spent or received in up to 7 future years. The table is in thousands
Year 1
PV of Benefits: $1,000,000 received at end of year 1 = $943,400
PV of Investment: $1,000,000 paid at the end of year 1 = $943,400
(PV benefits less PV cost) divided by PV cost = ($943,400 less $943,400) divided by $943,400 = 0% This is same as for the Simple ROI calculation because both all of the investment and all of the savings occurred at the same time in the first year.
Year 2
PV of Benefits: $1,000,000 received at the end of year 1 ($943,400) and PV of another $3,000,000 received at the end of year 2 ($2,670,000) =
$3,613,400
PV of Investments: $1,000,000 made at the end of year 1 = $943,400
(PV benefits less PV cost) divided by PV cost = ($3,613,400 minus $943,400) divided by $943,400 = 2.830, or a cumulative ROI at the end of year 2 of 283%
Notice that the calculation for the Simple ROI shows 300%, which overstates the true (discounted) cumulative ROI by 17 percentage points.