Embed Size (px)
Citation preview
100
FINANCIAL REPORT
101
University Council’s responsibility for financial reporting 102
Independent auditor’s report to the Council of Stellenbosch University 103–104
Accounting policies 105–110
Consolidated statement of financial position 111
Consolidated income statement 112
Consolidated statement of comprehensive income 113
Consolidated statement of changes in funds 114
Consolidated statement of cash flows 115
Notes to the consolidated annual financial statements 116–141
CONTENTS
102
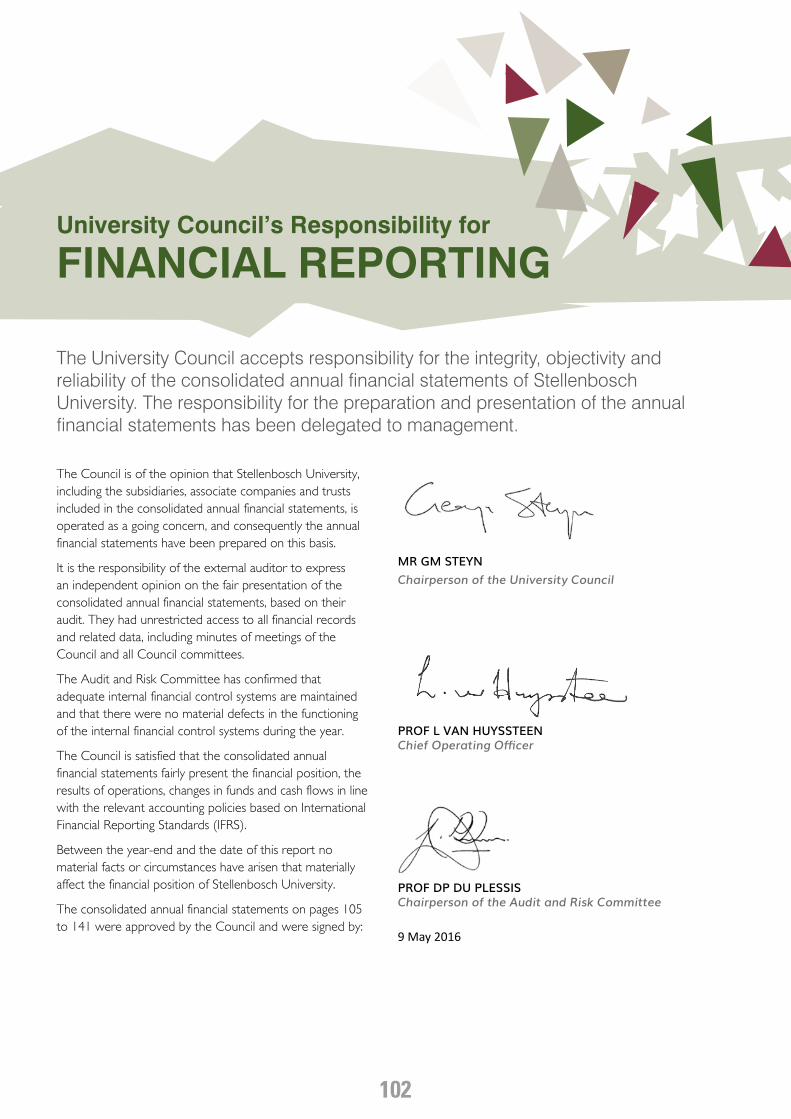
The University Council accepts responsibility for the integrity, objectivity and reliability of the consolidated annual financial statements of Stellenbosch University. The responsibility for the preparation and presentation of the annual financial statements has been delegated to management.
University Council’s Responsibility for FINANCIAL REPORTING
The Council is of the opinion that Stellenbosch University, including the subsidiaries, associate companies and trusts included in the consolidated annual financial statements, is operated as a going concern, and consequently the annual financial statements have been prepared on this basis.
It is the responsibility of the external auditor to express an independent opinion on the fair presentation of the consolidated annual financial statements, based on their audit. They had unrestricted access to all financial records and related data, including minutes of meetings of the Council and all Council committees.
The Audit and Risk Committee has confirmed that adequate internal financial control systems are maintained and that there were no material defects in the functioning of the internal financial control systems during the year.
The Council is satisfied that the consolidated annual financial statements fairly present the financial position, the results of operations, changes in funds and cash flows in line with the relevant accounting policies based on International Financial Reporting Standards (IFRS).
Between the year-end and the date of this report no material facts or circumstances have arisen that materially affect the financial position of Stellenbosch University.
The consolidated annual financial statements on pages 105 to 141 were approved by the Council and were signed by:
MR GM STEYNChairperson of the University Council
PROF L VAN HUYSSTEENChief Operating Officer
PROF DP DU PLESSISChairperson of the Audit and Risk Committee
9 May 2016
103
We have audited the consolidated financial statements of Stellenbosch University set out on pages 105 to 141, which comprise the consolidated statement of financial position as at 31 December 2015, and the consolidated income statement, statements of comprehensive income, changes in funds and cash flows for the year then ended, and the notes, comprising a summary of significant accounting policies and other explanatory information.
Council’s Responsibility for the Financial Statements
The Council of Stellenbosch University is responsible for the preparation and fair presentation of these consolidated financial statements in accordance with International Financial Reporting Standards and the requirements of the Higher Education Act of South Africa, and for such internal control as the Council determines is necessary to enable the preparation of consolidated financial statements that are free from material misstatement, whether due to fraud or error.
Auditor’s Responsibility
Our responsibility is to express an opinion on these consolidated financial statements based on our audit. We conducted our audit in accordance with International Standards on Auditing. Those standards require that we comply with ethical requirements and plan and perform the audit to obtain reasonable assurance about whether the consolidated financial statements are free from material misstatement.
An audit involves performing procedures to obtain audit evidence about the amounts and disclosures in the financial statements. The procedures selected depend on the auditor’s judgement, including the assessment of the risks of material misstatement of the financial statements, whether due to fraud or error. In making those risk assessments, the auditor considers internal control relevant to the entity’s preparation and fair presentation of the financial statements in order to design audit procedures that are appropriate in the circumstances, but not for the purpose of expressing an opinion on the effectiveness of the entity’s internal control. An audit also includes evaluating the appropriateness of accounting policies used and the reasonableness of accounting estimates made by management, as well as evaluating the overall presentation of the financial statements.
We believe that the audit evidence we have obtained is sufficient and appropriate to provide a basis for our audit opinion.
Opinion
In our opinion, the consolidated financial statements present fairly, in all material respects, the consolidated financial position of Stellenbosch University as at 31 December 2015, and its consolidated financial performance and its consolidated cash flows for the year then ended in accordance with International Financial Reporting Standards and the requirements of the Higher Education Act of South Africa.
Independent Auditor’s Report to the Council
OF STELLENBOSCH UNIVERSITY
104
Report on other Legal and Regulatory Requirements
In accordance with the Public Audit Act of South Africa, 2004 (Act No. 25 of 2004) and the general notice issued in terms thereof, we have a responsibility to report findings on the reported performance information against predetermined objectives for the selected objectives presented in the annual report, non-compliance with legislation and internal control. We performed tests to identify reportable findings as described under each subheading but not to gather evidence to express assurance on these matters. Accordingly, we do not express an opinion or conclusion on these matters.
Predetermined objectives
We performed procedures to obtain evidence about the reliability of the reported performance information in the column “SU in 2015” in the table “Ministerial enrolment and effectiveness targets for 2019 and Stellenbosch University’s (SU) performance, 2013-2015” set out on page 26 of the annual report for the year ended 31 December 2015.
We evaluated the reported performance information against the overall criteria of reliability.
We assessed the reliability of the reported performance information to determine whether it was valid, accurate and complete.
We did not identify any material findings on the reliability of the reported performance information for the selected objectives.
Achievement of planned targets
Refer to the annual performance report on page 26, table “Ministerial enrolment and effectiveness targets for 2019 and Stellenbosch University’s (SU) performance, 2013-2015”, for information on the achievement of the planned targets for the year.
Compliance with legislation
We performed procedures to obtain evidence that Stellenbosch University had complied with legislation regarding financial matters, financial management and other related matters.
We did not identify any instances of material non-compliance with specific matters in the Higher Education Act of South Africa.
Internal control
We considered internal control relevant to our audit of the financial statements, the information in the column “SU in 2015” in the table “Ministerial enrolment and effectiveness targets for 2019 and Stellenbosch University’s (SU) performance, 2013-2015” on page 26 and compliance with legislation. We did not identify any significant deficiencies in internal control.
Other Reports
Audit-related services and special audits123 Agreed-upon procedures engagements reports have been issued during the year under review on donor funding, Department of Higher Education and Training funding, Department of Trade and Industry funding, internal fund transfers and a confirmation of a donation. These reports covered periods ranging from 1 January 2005 to 31 March 2016. Five reports were in progress at the date of signing of this report covering periods ranging from 1 February 2015 to 31 March 2016.
23 Donor funding audit and non-audit assurance reports have been issued during the year under review, covering periods ranging from 1 January 2013 to 31 December 2015. Eleven reports were in progress at the date of signing of this report covering periods ranging from 1 January 2011 to 31 December 2015.
At the request of the South African Reserve Bank, a limited assurance audit was performed on imports. The report covered the period 1 January 2014 to 31 December 2014, and was issued on 24 April 2015.
PRICEWATERHOUSECOOPERS INC.Director: D AdriaansRegistered AuditorStellenbosch
20 MAY 2016
105
The principal accounting policies applied in the preparation of these consolidated annual financial statements are set out below. The policies are applied consistently for all periods covered by these consolidated annual financial statements.
1. Basis of preparation
The consolidated annual financial statements of Stellenbosch University are prepared in accordance with International Financial Reporting Standards (IFRS). The consolidated annual financial statements are prepared on the historical cost basis, as amended by the revaluation of investments available for sale, endowments and investment properties.
In the preparation of these consolidated annual financial statements in accordance with IFRS a number of critical accounting estimates are relied upon. Application of the University’s accounting policies is at management’s discretion. Areas requiring greater discretion, and areas involving significant assumptions and estimates, are discussed in note 1 to the consolidated annual financial statements.
Standards, interpretations and amendments to published standards applied for the first time during the yearCertain new standards, amendments and interpretations relating to existing standards that have become compulsory for the financial year starting on 1 January 2015 and that the University has applied for the first time have been published. The amendments to and interpretations of the standards are as follows:
Amendment to IAS 19 ‘Employee benefits’, regarding defined benefit plans.
Standards, interpretations and amendments to published standards not yet effectiveCertain new standards, amendments and interpretations relating to existing standards that have become compulsory for accounting periods commencing on or after 1 January 2016 or later and that the University has not yet applied have been published. The University will apply these amendments in the applicable period, if relevant. The amendments to and interpretations of the standards are as follows:
Amendments to IFRS 10and IAS 28
'Consolidated financial statements' and 'Investments in associates and joint ventures' on sale or contribution of assets (effective date postponed)
Amendments to IFRS 10 and IAS 28
'Consolidated financial statements' and 'Investments in associates and joint ventures' on applying the consolidation exemption (effective date of 1 January 2016)
Amendment to IFRS 11 ‘Joint arrangements’ on acquisition of an interest in a joint operation (effective date of 1 January 2016)
IFRS 14 Regulatory deferral accounts (effective date of 1 January 2016)
Amendment to IAS 1 ‘Presentation of financial statements’ disclosure initiative (effective date of 1 January 2016)
Amendments to IAS 16 and IAS 38
‘Property, plant and equipment’ and ’Intangible assets’, on depreciation and amortisation (effective date of 1 January 2016)
Amendments to IAS 16 and IAS 41
‘Property, plant and equipment’ and ‘Agriculture’ on bearer plants (effective date of 1 January 2016)
Amendment to IAS 27 ‘Separate financial statements’ on equity accounting (effective date of 1 January 2016)
Amendment to IAS 12 Income taxes (effective date of 1 January 2017)
Amendment to IAS 7 Cash flow Statements (effective date of 1 January 2017)
IFRS 15 Revenue from contracts with customers (effective date of 1 January 2018)
IFRS 9 Financial Instruments (2009 & 2010) (effective date of 1 January 2018)
Amendment to IFRS 9 ’Financial instruments’, on general hedge accounting (effective date of 1 January 2018)
IFRS 16 Leases (effective date of 1 January 2019)
Management is of the opinion that amendments to the above standards, amendments and interpretations will not have a material impact on the consolidated annual financial statements of the University in the following year.
ACCOUNTING POLICIES
106
2. Basis of consolidation
SubsidiariesAll entities in which the University, directly or indirectly, has an interest of more than half of the voting rights, or otherwise is able to exercise control over activities, are included in the consolidated annual financial statements. The purchase method is used to bring the acquisition of subsidiaries to book. The cost of an acquisition is measured as the fair value of assets transferred and liabilities assumed at the date of the transaction, including any transaction costs. Identifiable assets acquired and liabilities and contingent liabilities assumed in a business combination are measured initially at fair value.
The surplus of the cost of acquisition over the fair value of the group’s share of identifiable net assets is accounted for as goodwill. The results of subsidiaries acquired during the year are included from the date on which effective control has been obtained. Subsidiaries are deconsolidated from the date on which effective control ends.
SU recognises any non-controlling interest in the acquiree on an acquisition-by-acquisition basis, either at fair value or at the non-controlling interest’s proportionate share of the recognised amounts of acquiree’s identifiable net assets.
Intergroup transactions, balances and unrealised profits on transactions between the University and its subsidiaries are eliminated. Unrealised losses are also eliminated and are treated as a potential indicator of impairment of the underlying asset. The accounting policies of subsidiaries are adjusted during consolidation, where necessary.
Associate companiesAn associate company is a company, other than a subsidiary, in which the University holds an investment and on which it can have a significant influence due to the nature and size of its investment. The results of associates have been accounted for by using the equity method. The equity method involves the recognition of the interest of the University and its subsidiaries in the postacquisition profits and losses of associate companies in the consolidated income statement and the postacquisition movements in reserves in the consolidated statement of comprehensive income.
The cumulative postacquisition movements are adjusted against the carrying amount of the investment in the associate company. The recognition of the share of the University and its subsidiaries in losses of associate companies is limited to the interest in the associate company. Additional losses are only recognised to the extent that the University and its subsidiaries have guaranteed the debt of the associate company.
Intergroup transactions, balances and unrealised profits on transactions between the University and its associate
companies are eliminated to the extent of the University’s interest in the associate companies. Unrealised losses are also eliminated and are treated as a potential indicator of impairment of the underlying asset. The accounting policies of associate companies are adjusted, where necessary, in applying the equity method.
3. Foreign exchange
Functional and presentational currencyItems included in the consolidated annual financial statements are measured by using the currency of the primary economic environment in which the University operates (the functional currency). The consolidated annual financial statements are presented in South African rand, the functional and presentational currency of the University.
Transactions and balancesForeign exchange transactions are accounted for at the exchange rate ruling on the date of the transaction. Profits and losses arising from the settlement of such transactions and the conversion of monetary assets and liabilities denominated in foreign currency are recognised in the consolidated income statement. These balances are converted at exchange rates ruling at year-end.
4. Property, books and equipment
Land and buildings mainly consist of stands, lecture halls, laboratories, residences and administrative buildings. Land and buildings are shown at historical cost less accumulated depreciation, excluding donations of land and buildings valued at fair value by sworn valuers at the date of donation. The University has applied the IFRS 1 exemption in terms of which the fair market value of buildings at the date of conversion (1 January 2004) is the deemed cost.
Historical cost includes direct costs associated with the acquisition of the item. Postacquisition costs are added to the original cost, or recognised as a separate asset, only when it is probable that future economic benefits associated with the item will flow to the University and the cost can be measured reliably. All other repair and maintenance costs are recognised in the income statement in the period in which they are incurred.
Books and equipment are shown at cost, excluding donations of books and equipment that are valued at fair value by sworn valuers at date of donation.
Government grants received for infrastructure are recognised by subtracting the grant from the value of the asset.
Land is not depreciated, as it has an unlimited useful life. Other assets are depreciated by using the straight-line method to write off cost or revalued amounts to residual values over their useful life.
107
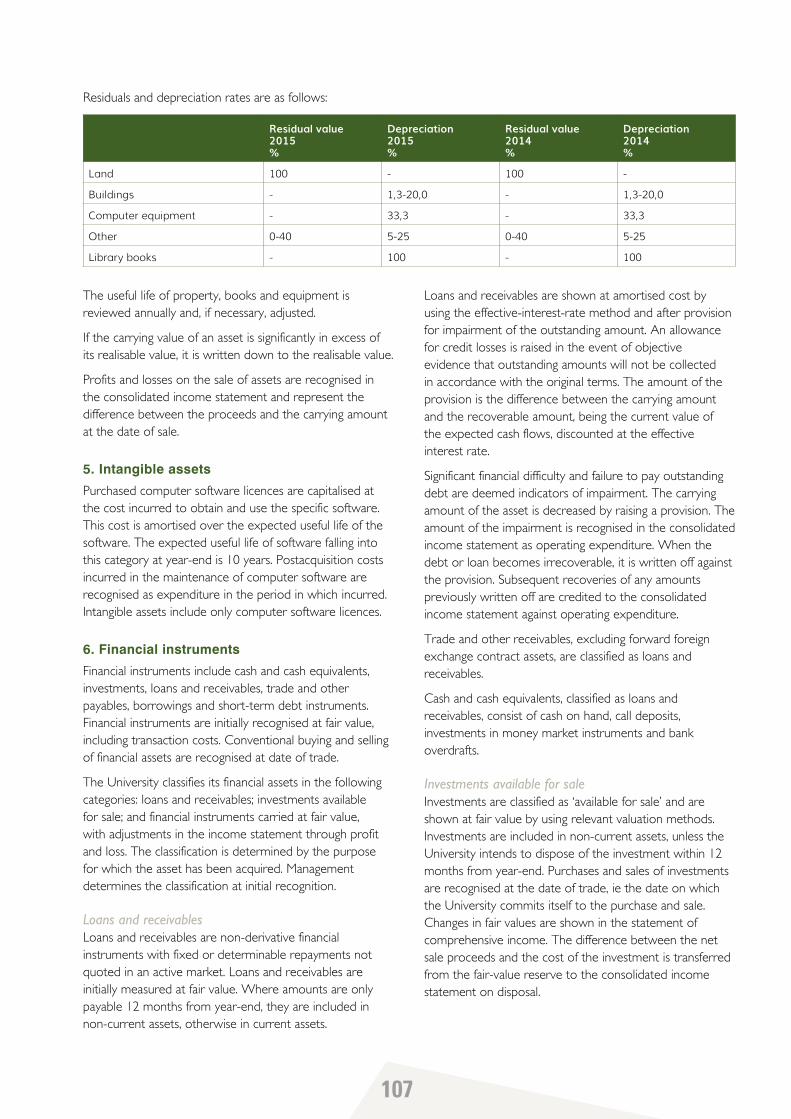
The useful life of property, books and equipment is reviewed annually and, if necessary, adjusted.
If the carrying value of an asset is significantly in excess of its realisable value, it is written down to the realisable value.
Profits and losses on the sale of assets are recognised in the consolidated income statement and represent the difference between the proceeds and the carrying amount at the date of sale.
5. Intangible assets
Purchased computer software licences are capitalised at the cost incurred to obtain and use the specific software. This cost is amortised over the expected useful life of the software. The expected useful life of software falling into this category at year-end is 10 years. Postacquisition costs incurred in the maintenance of computer software are recognised as expenditure in the period in which incurred. Intangible assets include only computer software licences.
6. Financial instruments
Financial instruments include cash and cash equivalents, investments, loans and receivables, trade and other payables, borrowings and short-term debt instruments. Financial instruments are initially recognised at fair value, including transaction costs. Conventional buying and selling of financial assets are recognised at date of trade.
The University classifies its financial assets in the following categories: loans and receivables; investments available for sale; and financial instruments carried at fair value, with adjustments in the income statement through profit and loss. The classification is determined by the purpose for which the asset has been acquired. Management determines the classification at initial recognition.
Loans and receivablesLoans and receivables are non-derivative financial instruments with fixed or determinable repayments not quoted in an active market. Loans and receivables are initially measured at fair value. Where amounts are only payable 12 months from year-end, they are included in non-current assets, otherwise in current assets.
Loans and receivables are shown at amortised cost by using the effective-interest-rate method and after provision for impairment of the outstanding amount. An allowance for credit losses is raised in the event of objective evidence that outstanding amounts will not be collected in accordance with the original terms. The amount of the provision is the difference between the carrying amount and the recoverable amount, being the current value of the expected cash flows, discounted at the effective interest rate.
Significant financial difficulty and failure to pay outstanding debt are deemed indicators of impairment. The carrying amount of the asset is decreased by raising a provision. The amount of the impairment is recognised in the consolidated income statement as operating expenditure. When the debt or loan becomes irrecoverable, it is written off against the provision. Subsequent recoveries of any amounts previously written off are credited to the consolidated income statement against operating expenditure.
Trade and other receivables, excluding forward foreign exchange contract assets, are classified as loans and receivables.
Cash and cash equivalents, classified as loans and receivables, consist of cash on hand, call deposits, investments in money market instruments and bank overdrafts.
Investments available for saleInvestments are classified as ‘available for sale’ and are shown at fair value by using relevant valuation methods. Investments are included in non-current assets, unless the University intends to dispose of the investment within 12 months from year-end. Purchases and sales of investments are recognised at the date of trade, ie the date on which the University commits itself to the purchase and sale. Changes in fair values are shown in the statement of comprehensive income. The difference between the net sale proceeds and the cost of the investment is transferred from the fair-value reserve to the consolidated income statement on disposal.
Residuals and depreciation rates are as follows:
Residual value2015%
Depreciation2015%
Residual value2014%
Depreciation2014%
Land 100 - 100 -
Buildings - 1,3-20,0 - 1,3-20,0
Computer equipment - 33,3 - 33,3
Other 0-40 5-25 0-40 5-25
Library books - 100 - 100
108
Investments are derecognised when the right to cash flow expires or is transferred or the University has transferred the significant associated risks and benefits of ownership.
A distinction is made between changes in value resulting from exchange rate changes and fair-value changes in instruments denominated in foreign currency and classified as ‘available for sale’. Exchange rate gains and losses are recognised in the consolidated income statement. Movements in the fair values of these investments are recognised in the statement of comprehensive income.
The fair values of listed investments are based on current market prices. The University determines the value of unlisted investments and investments in respect of which there is no active market by using relevant valuation techniques.
The University determines at each year-end whether a financial asset has been impaired, provided objective evidence can be provided. A significant decline in the fair value of the investment below its cost over a period is indicative of impairment. If there is such evidence for investments available for sale, the cumulative loss is transferred from the fair-value reserve to the consolidated income statement.
The cumulative loss is calculated as the difference between the acquisition cost and the current fair value net of any impairments recognised in previous periods. Impairment losses recognised in the consolidated income statement are not reversed on later recovery.
Derivative instrumentsDerivative instruments, including forward foreign exchange contracts, are classified as ‘at fair value with adjustments through the income statement’. These instruments are recognised at fair value at the date the derivative contract has been entered into. In subsequent periods it is revalued at fair value. Profits and losses on derivative instruments are recognised in the consolidated income statement.
Trade and other payables and short-term debt instrumentsTrade and other payables, excluding forward foreign exchange contract liabilities, are initially recorded at fair value. Thereafter they are shown at amortised cost by using the effective-interest-rate method.
Interest-bearing borrowingsBorrowings are initially recognised at fair value, taking into account any transaction costs incurred. After initial recognition borrowings are carried at amortised cost. Differences between the initially recognised amount and the redemption amount are recognised in the consolidated income statement over the term of the borrowings by
using the effective-interest-rate method. Borrowings are shown as current liabilities, except where the University has an unconditional right to defer payment for at least 12 months after year-end, in which case these are shown as non-current liabilities.
7. Research and development costs
Research and development costs are recognised as expenditure in the year in which incurred, since both are inherent in the normal operations of a university.
8. Donations
Donations are recognised at fair value at the date of the donation, based on external valuations.
9. Inventories
Inventories, mainly comprising consumer goods and stationery, are shown at the lower of cost, on the basis of average cost, or net realisable value.
Cost excludes finance charges. Net realisable value is the estimated selling price in the normal course of business, less selling costs.
10. Impairment of non-financial assets
Assets with an indefnite useful life are not depreciated or amortised and are subject to annual testing for impairment. Assets subject to depreciation or amortisation are tested for potential impairment if an event or change in circumstances indicates that the carrying amount of the asset may not be recoverable. An impairment loss is recognised for the amount by which the carrying amount of the asset exceeds its recoverable amount. The recoverable amount is the higher of the fair value of an asset, less any selling costs, or its value in use. In the test for impairment assets are grouped at the lowest level for which there is a separate identifiable cash flow (cash-generating units). Non-financial assets previously impaired are reviewed at every year-end for potential reversal of previously recognised impairments.
11. Revenue recognition
Income is recognised at the fair value of the amounts or goods received.
Donation income is accounted for when it accrues.
Student and accommodation fees are recognised as and when the service is provided.
Central government grants are recognised in the period for which they are received. Government grants are recognised where there is reasonable certainty that the grant will be received and that the University will meet all
109
the associated conditions. Government grants received for infrastructure are included in liabilities as deferred government grants and are credited to the asset when the asset becomes availabe for use, resulting in a decrease in the depreciation recognised in the consolidated income statement over the expected lives of related assets.
Research grants are recognised over the term of the research and based on the terms of the individual contracts.
Interest income is recognised on a time apportionment basis by using the effective-interest-rate method. On impairment of a debtor the University reduces the carrying amount to the recoverable amount. The recoverable amount represents the future cash flow, discounted at the original effective interest rate. This discount is recognised as interest over time. Interest income on loans in respect of which an impairment has been recognised is recognised at the original effective interest rate.
Interdepartmental income is eliminated.
Other income earned by the University is recognised on the following bases:
` Dividend income – when the shareholder’s rights to receive a dividend vest, ie on the last day for registration in respect of listed shares, and when declared in the case of unlisted shares.
` Rental income – receipts in respect of operating leases are recognised in the consolidated income statement on a straight-line basis over the period of the lease.
` Accidental sales and services – are recognised in the period in which they accrue.
12. Leases
If the lessor retains the significant risks and benefits associated with ownership of a leased item, the item is classified as an operating lease. Payments in respect of operating leases are recognised in the consolidated income statement on a straight-line basis over the period of the lease.
The University leases property and equipment. Lease agreements where the University, as lessee, receives all the significant risks and benefits of ownership, are classified as leases. Finance leases are capitalised at the beginning of the lease term at the lower of the market value of the leased property and the current value of the minimum lease payments. Each lease payment has a liability and finance charges element and is apportioned accordingly. The corresponding lease liability, net of finance charges, is recognised in the statement of financial position. Property and equipment acquired by means of finance leases are depreciated over the shorter of the useful life or the lease term of the asset.
13. Investment properties
Investment properties are held to generate rental income and to achieve capital growth. Owner-occupied properties are held for administrative, tuition and research purposes. Differences in use distinguish owner-occupied properties from investment properties.
Investment properties are deemed long-term investments and are carried at fair value determined annually by external sworn valuers. Investment properties are not depreciated. Any change in value is recognised directly in the consolidated income statement.
Owner-occupied properties are recognised and measured in accordance with the accounting policy for property, books and equipment.
14. Provisions
Provisions are recognised when the University has a current statutory or constructive liability as a result of a past binding occurrence that will probably lead to an outflow of resources in the form of economic benefits to meet the liability, and a reasonable estimate of the amount of the liability can be made. Provisions are measured at the current value of the expected future expenditure to meet the liability, discounted at the market-related rate for similar provisions. Changes in the value of provisions due to passage of time are recognised as interest.
15. Staff benefits
Postretirement medical benefits and group life insurance schemeRetired employees receive postretirement medical benefits. Access to this benefit is restricted to employees appointed prior to 1 June 2002. All employees are required to participate in the group life insurance scheme. The expected costs of these benefits are recognised over the period of employment. The liability in respect of postretirement medical benefits is the present value of the liability at year-end less the fair value of plan assets and any adjustments for actuarial profits or losses and past-service costs. The liability is calculated actuarially by independent actuaries at least once every three years. Actuarial profits and losses are recognised immediately in the consolidated statement of comprehensive income.
Pension liabilities Contributions are made monthly to the US Retirement Fund, a defined-contribution plan for permanent employees of the University. A defined-contribution plan is a pension plan in terms of which the University makes fixed contributions to an external fund.

110
Long-service benefitsAfter 25 years’ service employees qualify for a gratuity valued at 50% of the employee’s monthly salary (with a minimum value of R400 and a maximum value of R5 000). The University recognises a liability and the concomitant expenditure as and when the liability accrues.
16. Deferred taxation
Deferred tax is provided by using the liability method. Deferred tax represents the tax effect of temporary differences between the tax bases of assets and of liabilities and their carrying values for financial reporting purposes. Current tax rates are used to determine deferred tax. Deferred tax assets are only recognised to the extent of their recoverability. Deferred tax is not provided if it arises from the initial recognition of assets and liabilities from transactions other than business combinations and at the date of the transaction does not impact accounting profits or losses or taxable income or determined losses.
111
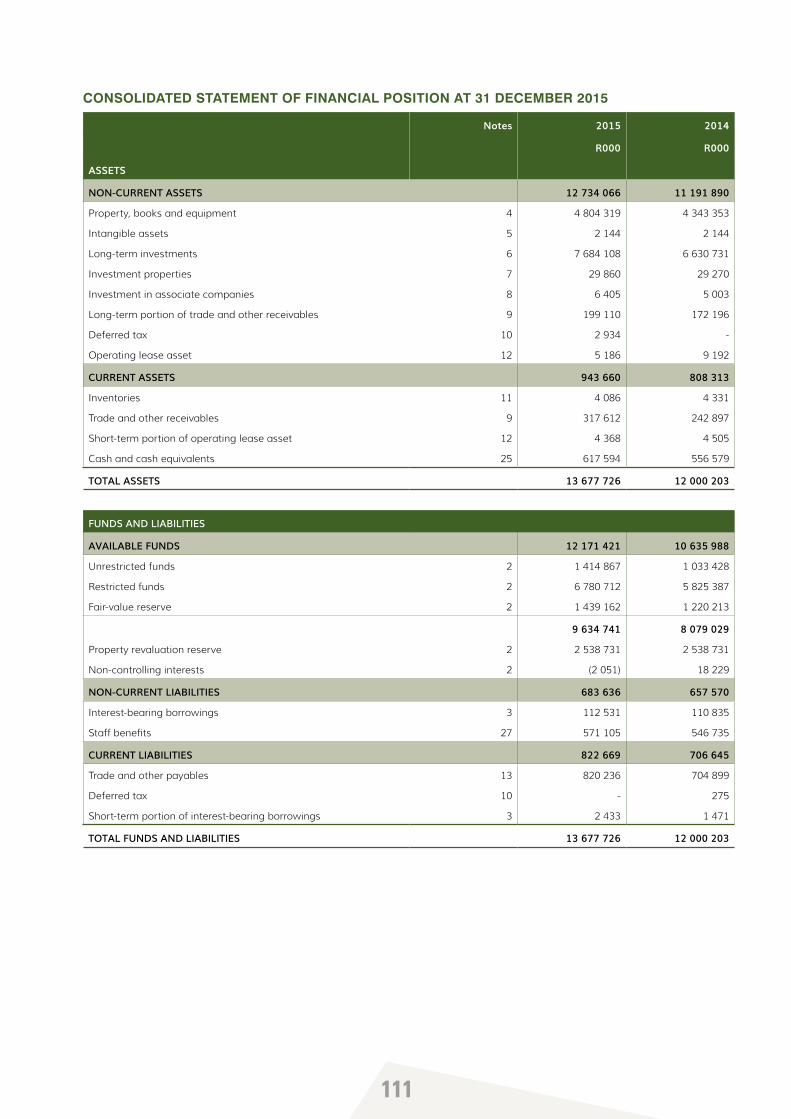
CONSOLIDATED STATEMENT OF FINANCIAL POSITION AT 31 DECEMBER 2015
Notes 2015 2014
R000 R000
ASSETS
NON-CURRENT ASSETS 12 734 066 11 191 890
Property, books and equipment 4 4 804 319 4 343 353
Intangible assets 5 2 144 2 144
Long-term investments 6 7 684 108 6 630 731
Investment properties 7 29 860 29 270
Investment in associate companies 8 6 405 5 003
Long-term portion of trade and other receivables 9 199 110 172 196
Deferred tax 10 2 934 -
Operating lease asset 12 5 186 9 192
CURRENT ASSETS 943 660 808 313
Inventories 11 4 086 4 331
Trade and other receivables 9 317 612 242 897
Short-term portion of operating lease asset 12 4 368 4 505
Cash and cash equivalents 25 617 594 556 579
TOTAL ASSETS 13 677 726 12 000 203
FUNDS AND LIABILITIES
AVAILABLE FUNDS 12 171 421 10 635 988
Unrestricted funds 2 1 414 867 1 033 428
Restricted funds 2 6 780 712 5 825 387
Fair-value reserve 2 1 439 162 1 220 213
9 634 741 8 079 029
Property revaluation reserve 2 2 538 731 2 538 731
Non-controlling interests 2 (2 051) 18 229
NON-CURRENT LIABILITIES 683 636 657 570
Interest-bearing borrowings 3 112 531 110 835
Staff benefits 27 571 105 546 735
CURRENT LIABILITIES 822 669 706 645
Trade and other payables 13 820 236 704 899
Deferred tax 10 - 275
Short-term portion of interest-bearing borrowings 3 2 433 1 471
TOTAL FUNDS AND LIABILITIES 13 677 726 12 000 203
112
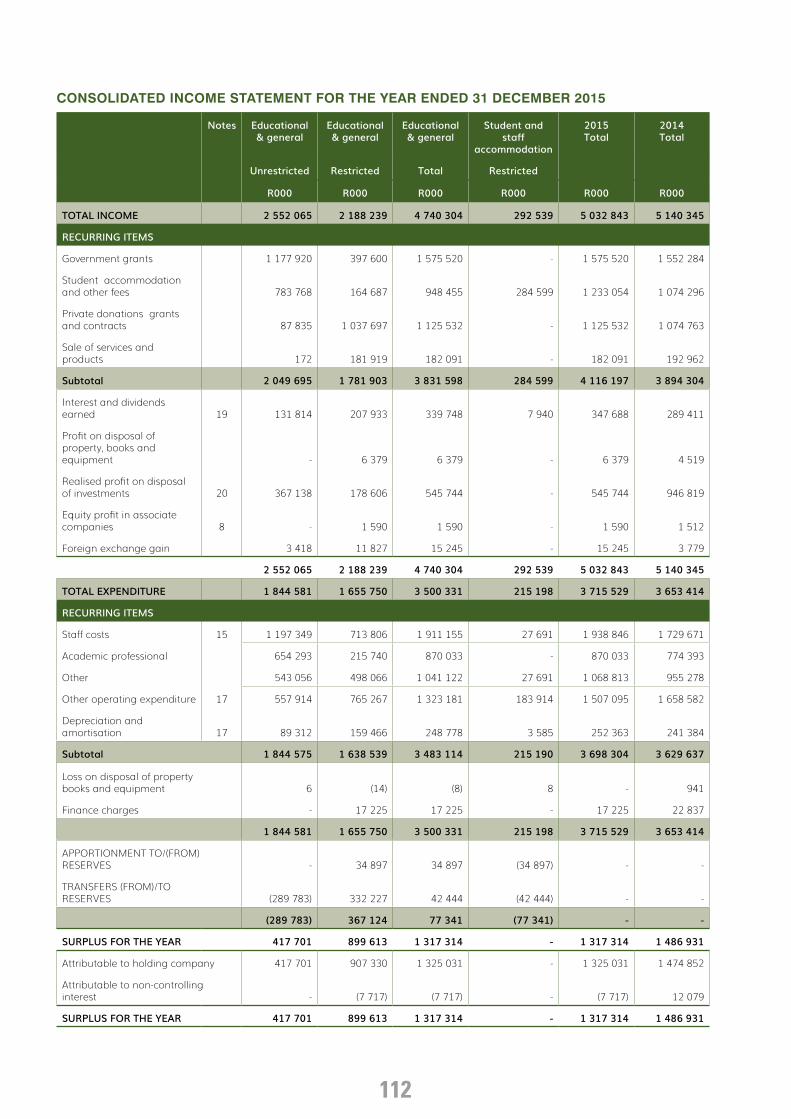
CONSOLIDATED INCOME STATEMENT FOR THE YEAR ENDED 31 DECEMBER 2015
Notes Educational& general
Educational& general
Educational& general
Student andstaff
accommodation
2015Total
2014Total
Unrestricted Restricted Total Restricted
R000 R000 R000 R000 R000 R000
TOTAL INCOME 2 552 065 2 188 239 4 740 304 292 539 5 032 843 5 140 345
RECURRING ITEMS
Government grants 1 177 920 397 600 1 575 520 - 1 575 520 1 552 284
Student accommodation and other fees 783 768 164 687 948 455 284 599 1 233 054 1 074 296
Private donations grants and contracts 87 835 1 037 697 1 125 532 - 1 125 532 1 074 763
Sale of services and products 172 181 919 182 091 - 182 091 192 962
Subtotal 2 049 695 1 781 903 3 831 598 284 599 4 116 197 3 894 304
Interest and dividends earned 19 131 814 207 933 339 748 7 940 347 688 289 411
Profit on disposal of property, books and equipment - 6 379 6 379 - 6 379 4 519
Realised profit on disposal of investments 20 367 138 178 606 545 744 - 545 744 946 819
Equity profit in associatecompanies 8 - 1 590 1 590 - 1 590 1 512
Foreign exchange gain 3 418 11 827 15 245 - 15 245 3 779
2 552 065 2 188 239 4 740 304 292 539 5 032 843 5 140 345
TOTAL EXPENDITURE 1 844 581 1 655 750 3 500 331 215 198 3 715 529 3 653 414
RECURRING ITEMS
Staff costs 15 1 197 349 713 806 1 911 155 27 691 1 938 846 1 729 671
Academic professional 654 293 215 740 870 033 - 870 033 774 393
Other 543 056 498 066 1 041 122 27 691 1 068 813 955 278
Other operating expenditure 17 557 914 765 267 1 323 181 183 914 1 507 095 1 658 582
Depreciation and amortisation 17 89 312 159 466 248 778 3 585 252 363 241 384
Subtotal 1 844 575 1 638 539 3 483 114 215 190 3 698 304 3 629 637
Loss on disposal of property books and equipment 6 (14) (8) 8 - 941
Finance charges - 17 225 17 225 - 17 225 22 837
1 844 581 1 655 750 3 500 331 215 198 3 715 529 3 653 414
APPORTIONMENT TO/(FROM) RESERVES - 34 897 34 897 (34 897) - -
TRANSFERS (FROM)/TO RESERVES (289 783) 332 227 42 444 (42 444) - -
(289 783) 367 124 77 341 (77 341) - -
SURPLUS FOR THE YEAR 417 701 899 613 1 317 314 - 1 317 314 1 486 931
Attributable to holding company 417 701 907 330 1 325 031 - 1 325 031 1 474 852
Attributable to non-controlling interest - (7 717) (7 717) - (7 717) 12 079
SURPLUS FOR THE YEAR 417 701 899 613 1 317 314 - 1 317 314 1 486 931
113
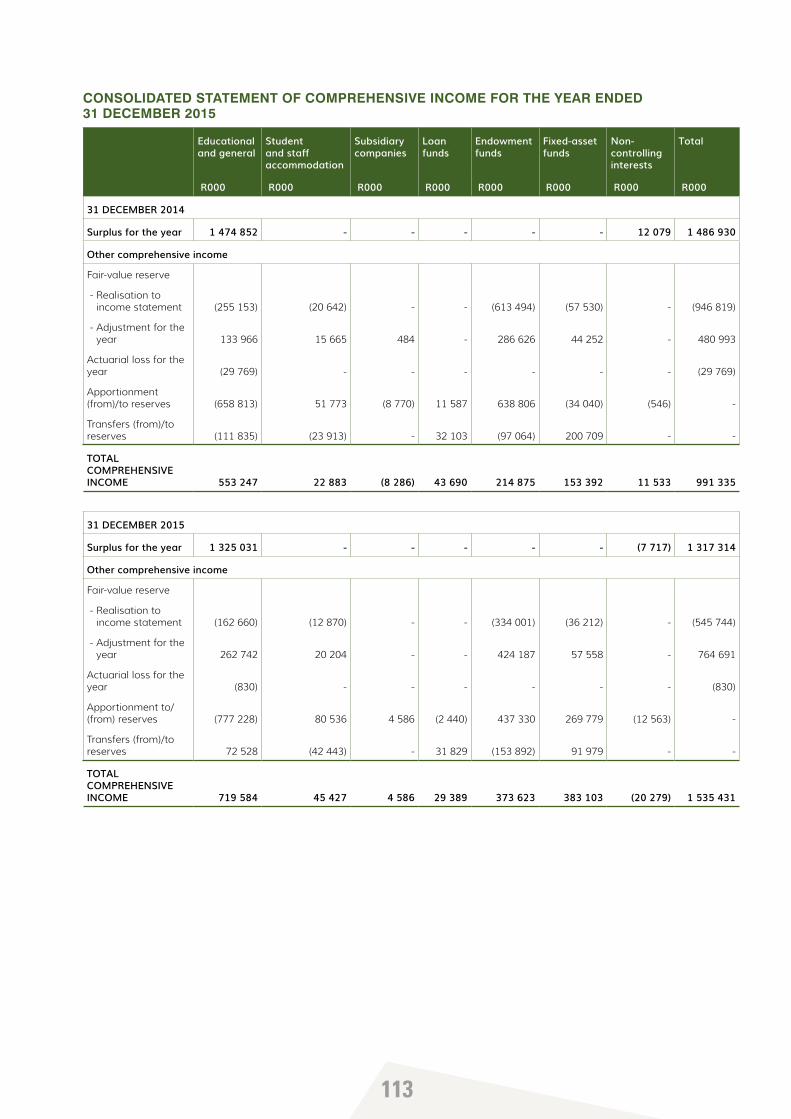
CONSOLIDATED STATEMENT OF COMPREHENSIVE INCOME FOR THE YEAR ENDED 31 DECEMBER 2015
Educationaland general
Studentand staffaccommodation
Subsidiarycompanies
Loanfunds
Endowmentfunds
Fixed-assetfunds
Non-controllinginterests
Total
R000 R000 R000 R000 R000 R000 R000 R000
31 DECEMBER 2014
Surplus for the year 1 474 852 - - - - - 12 079 1 486 930
Other comprehensive income
Fair-value reserve
- Realisation to income statement (255 153) (20 642) - - (613 494) (57 530) - (946 819)
- Adjustment for the year 133 966 15 665 484 - 286 626 44 252 - 480 993
Actuarial loss for the year (29 769) - - - - - - (29 769)
Apportionment (from)/to reserves (658 813) 51 773 (8 770) 11 587 638 806 (34 040) (546) -
Transfers (from)/to reserves (111 835) (23 913) - 32 103 (97 064) 200 709 - -
TOTAL COMPREHENSIVE INCOME 553 247 22 883 (8 286) 43 690 214 875 153 392 11 533 991 335
31 DECEMBER 2015
Surplus for the year 1 325 031 - - - - - (7 717) 1 317 314
Other comprehensive income
Fair-value reserve
- Realisation to income statement (162 660) (12 870) - - (334 001) (36 212) - (545 744)
- Adjustment for the year 262 742 20 204 - - 424 187 57 558 - 764 691
Actuarial loss for the year (830) - - - - - - (830)
Apportionment to/(from) reserves (777 228) 80 536 4 586 (2 440) 437 330 269 779 (12 563) -
Transfers (from)/to reserves 72 528 (42 443) - 31 829 (153 892) 91 979 - -
TOTAL COMPREHENSIVE INCOME 719 584 45 427 4 586 29 389 373 623 383 103 (20 279) 1 535 431
114
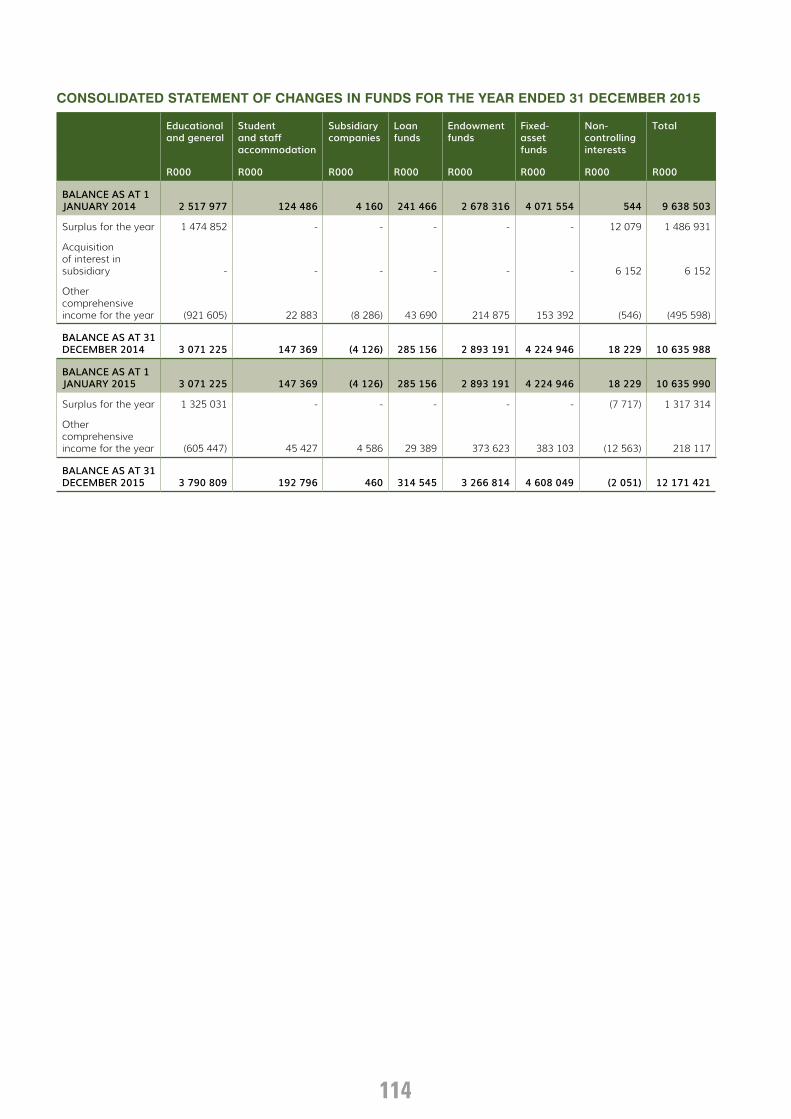
CONSOLIDATED STATEMENT OF CHANGES IN FUNDS FOR THE YEAR ENDED 31 DECEMBER 2015
Educationaland general
Studentand staffaccommodation
Subsidiarycompanies
Loanfunds
Endowmentfunds
Fixed-assetfunds
Non-controllinginterests
Total
R000 R000 R000 R000 R000 R000 R000 R000
BALANCE AS AT 1 JANUARY 2014 2 517 977 124 486 4 160 241 466 2 678 316 4 071 554 544 9 638 503
Surplus for the year 1 474 852 - - - - - 12 079 1 486 931
Acquisition of interest in subsidiary - - - - - - 6 152 6 152
Other comprehensive income for the year (921 605) 22 883 (8 286) 43 690 214 875 153 392 (546) (495 598)
BALANCE AS AT 31 DECEMBER 2014 3 071 225 147 369 (4 126) 285 156 2 893 191 4 224 946 18 229 10 635 988
BALANCE AS AT 1 JANUARY 2015 3 071 225 147 369 (4 126) 285 156 2 893 191 4 224 946 18 229 10 635 990
Surplus for the year 1 325 031 - - - - - (7 717) 1 317 314
Other comprehensive income for the year (605 447) 45 427 4 586 29 389 373 623 383 103 (12 563) 218 117
BALANCE AS AT 31 DECEMBER 2015 3 790 809 192 796 460 314 545 3 266 814 4 608 049 (2 051) 12 171 421
115
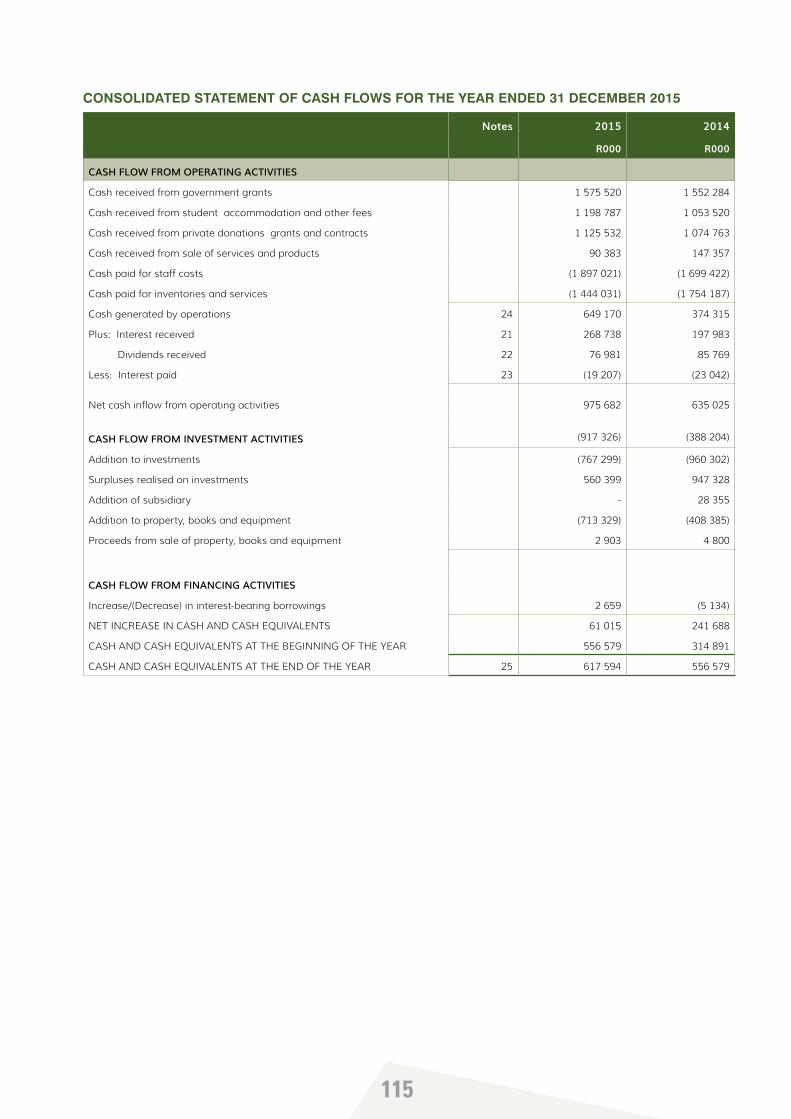
CONSOLIDATED STATEMENT OF CASH FLOWS FOR THE YEAR ENDED 31 DECEMBER 2015
Notes 2015 2014
R000 R000
CASH FLOW FROM OPERATING ACTIVITIES
Cash received from government grants 1 575 520 1 552 284
Cash received from student accommodation and other fees 1 198 787 1 053 520
Cash received from private donations grants and contracts 1 125 532 1 074 763
Cash received from sale of services and products 90 383 147 357
Cash paid for staff costs (1 897 021) (1 699 422)
Cash paid for inventories and services (1 444 031) (1 754 187)
Cash generated by operations 24 649 170 374 315
Plus: Interest received 21 268 738 197 983
Dividends received 22 76 981 85 769
Less: Interest paid 23 (19 207) (23 042)
Net cash inflow from operating activities 975 682 635 025
CASH FLOW FROM INVESTMENT ACTIVITIES (917 326) (388 204)
Addition to investments (767 299) (960 302)
Surpluses realised on investments 560 399 947 328
Addition of subsidiary - 28 355
Addition to property, books and equipment (713 329) (408 385)
Proceeds from sale of property, books and equipment 2 903 4 800
CASH FLOW FROM FINANCING ACTIVITIES
Increase/(Decrease) in interest-bearing borrowings 2 659 (5 134)
NET INCREASE IN CASH AND CASH EQUIVALENTS 61 015 241 688
CASH AND CASH EQUIVALENTS AT THE BEGINNING OF THE YEAR 556 579 314 891
CASH AND CASH EQUIVALENTS AT THE END OF THE YEAR 25 617 594 556 579
116
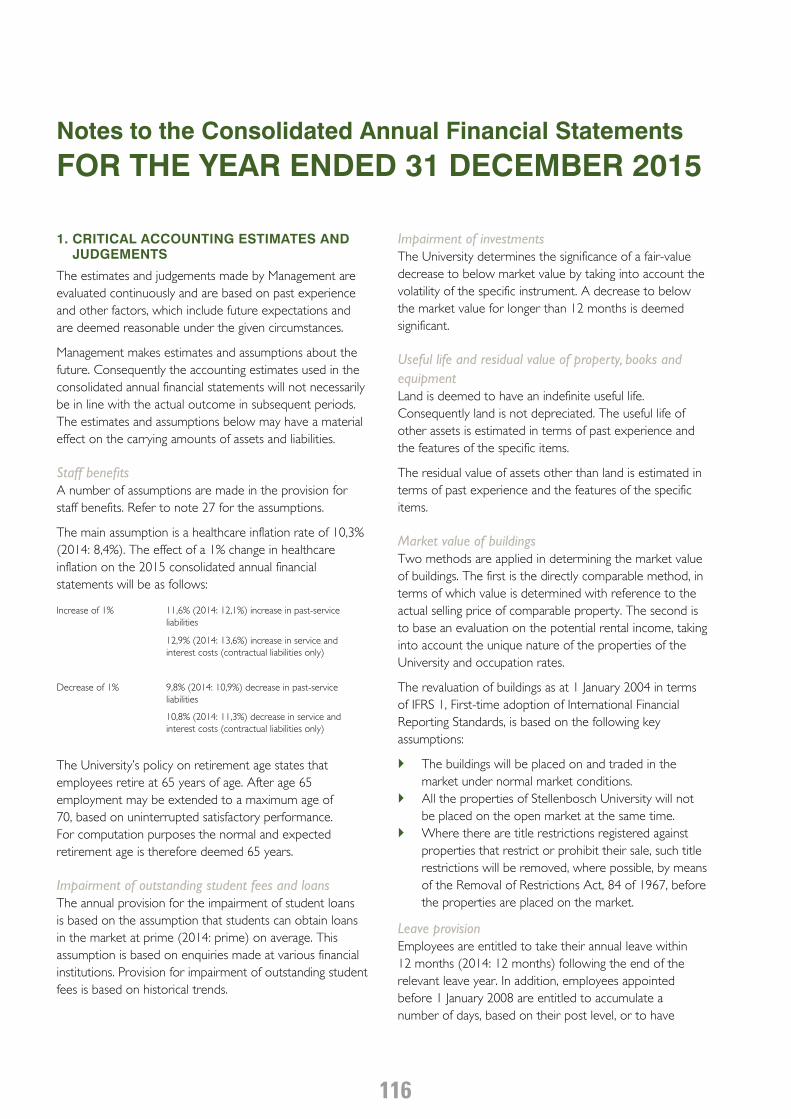
1. CRITICAL ACCOUNTING ESTIMATES AND JUDGEMENTS
The estimates and judgements made by Management are evaluated continuously and are based on past experience and other factors, which include future expectations and are deemed reasonable under the given circumstances.
Management makes estimates and assumptions about the future. Consequently the accounting estimates used in the consolidated annual financial statements will not necessarily be in line with the actual outcome in subsequent periods. The estimates and assumptions below may have a material effect on the carrying amounts of assets and liabilities.
Staff benefitsA number of assumptions are made in the provision for staff benefits. Refer to note 27 for the assumptions.
The main assumption is a healthcare inflation rate of 10,3% (2014: 8,4%). The effect of a 1% change in healthcare inflation on the 2015 consolidated annual financial statements will be as follows:
Increase of 1% 11,6% (2014: 12,1%) increase in past-service liabilities
12,9% (2014: 13,6%) increase in service and interest costs (contractual liabilities only)
Decrease of 1% 9,8% (2014: 10,9%) decrease in past-service liabilities
10,8% (2014: 11,3%) decrease in service and interest costs (contractual liabilities only)
The University’s policy on retirement age states that employees retire at 65 years of age. After age 65 employment may be extended to a maximum age of 70, based on uninterrupted satisfactory performance. For computation purposes the normal and expected retirement age is therefore deemed 65 years.
Impairment of outstanding student fees and loansThe annual provision for the impairment of student loans is based on the assumption that students can obtain loans in the market at prime (2014: prime) on average. This assumption is based on enquiries made at various financial institutions. Provision for impairment of outstanding student fees is based on historical trends.
Impairment of investmentsThe University determines the significance of a fair-value decrease to below market value by taking into account the volatility of the specific instrument. A decrease to below the market value for longer than 12 months is deemed significant.
Useful life and residual value of property, books and equipmentLand is deemed to have an indefinite useful life. Consequently land is not depreciated. The useful life of other assets is estimated in terms of past experience and the features of the specific items.
The residual value of assets other than land is estimated in terms of past experience and the features of the specific items.
Market value of buildingsTwo methods are applied in determining the market value of buildings. The first is the directly comparable method, in terms of which value is determined with reference to the actual selling price of comparable property. The second is to base an evaluation on the potential rental income, taking into account the unique nature of the properties of the University and occupation rates.
The revaluation of buildings as at 1 January 2004 in terms of IFRS 1, First-time adoption of International Financial Reporting Standards, is based on the following key assumptions:
` The buildings will be placed on and traded in the market under normal market conditions.
` All the properties of Stellenbosch University will not be placed on the open market at the same time.
` Where there are title restrictions registered against properties that restrict or prohibit their sale, such title restrictions will be removed, where possible, by means of the Removal of Restrictions Act, 84 of 1967, before the properties are placed on the market.
Leave provisionEmployees are entitled to take their annual leave within 12 months (2014: 12 months) following the end of the relevant leave year. In addition, employees appointed before 1 January 2008 are entitled to accumulate a number of days, based on their post level, or to have
Notes to the Consolidated Annual Financial Statements
FOR THE YEAR ENDED 31 DECEMBER 2015
117
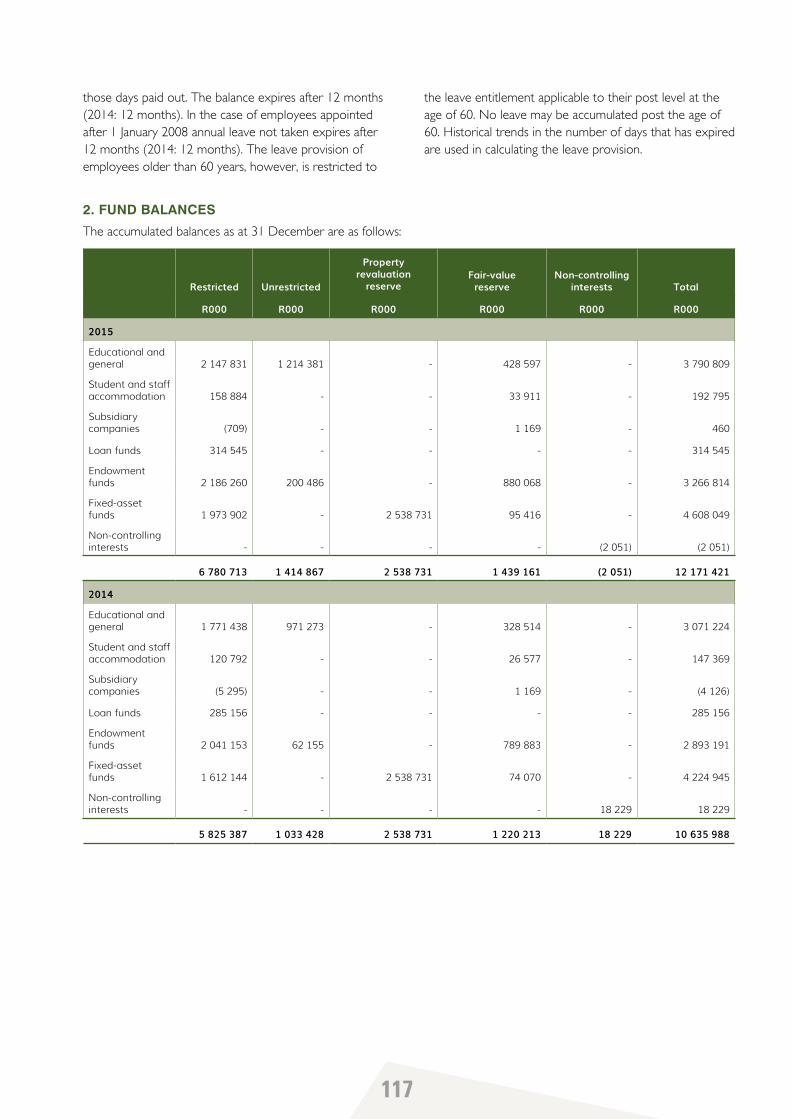
those days paid out. The balance expires after 12 months (2014: 12 months). In the case of employees appointed after 1 January 2008 annual leave not taken expires after 12 months (2014: 12 months). The leave provision of employees older than 60 years, however, is restricted to
the leave entitlement applicable to their post level at the age of 60. No leave may be accumulated post the age of 60. Historical trends in the number of days that has expired are used in calculating the leave provision.
2. FUND BALANCES
The accumulated balances as at 31 December are as follows:
Restricted Unrestricted
Propertyrevaluation
reserveFair-value
reserveNon-controlling
interests Total
R000 R000 R000 R000 R000 R000
2015
Educational and general 2 147 831 1 214 381 - 428 597 - 3 790 809
Student and staffaccommodation 158 884 - - 33 911 - 192 795
Subsidiary companies (709) - - 1 169 - 460
Loan funds 314 545 - - - - 314 545
Endowment funds 2 186 260 200 486 - 880 068 - 3 266 814
Fixed-asset funds 1 973 902 - 2 538 731 95 416 - 4 608 049
Non-controlling interests - - - - (2 051) (2 051)
6 780 713 1 414 867 2 538 731 1 439 161 (2 051) 12 171 421
2014
Educational and general 1 771 438 971 273 - 328 514 - 3 071 224
Student and staffaccommodation 120 792 - - 26 577 - 147 369
Subsidiary companies (5 295) - - 1 169 - (4 126)
Loan funds 285 156 - - - - 285 156
Endowment funds 2 041 153 62 155 - 789 883 - 2 893 191
Fixed-asset funds 1 612 144 - 2 538 731 74 070 - 4 224 945
Non-controlling interests - - - - 18 229 18 229
5 825 387 1 033 428 2 538 731 1 220 213 18 229 10 635 988
118
2015 2014R000 R000
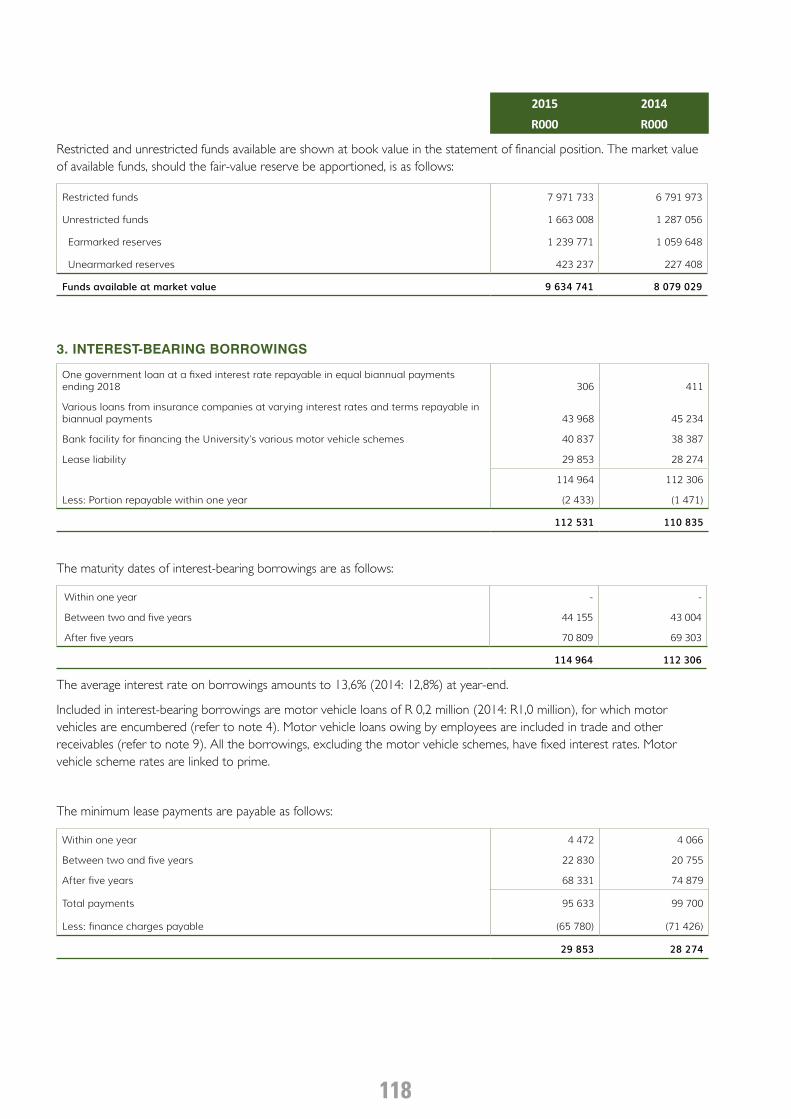
Restricted and unrestricted funds available are shown at book value in the statement of financial position. The market value of available funds, should the fair-value reserve be apportioned, is as follows:
Restricted funds 7 971 733 6 791 973
Unrestricted funds 1 663 008 1 287 056
Earmarked reserves 1 239 771 1 059 648
Unearmarked reserves 423 237 227 408
Funds available at market value 9 634 741 8 079 029
3. INTEREST-BEARING BORROWINGS
One government loan at a fixed interest rate repayable in equal biannual payments ending 2018 306 411
Various loans from insurance companies at varying interest rates and terms repayable in biannual payments 43 968 45 234
Bank facility for financing the University’s various motor vehicle schemes 40 837 38 387
Lease liability 29 853 28 274
114 964 112 306
Less: Portion repayable within one year (2 433) (1 471)
112 531 110 835
The maturity dates of interest-bearing borrowings are as follows:
Within one year - -
Between two and five years 44 155 43 004
After five years 70 809 69 303
114 964 112 306
The average interest rate on borrowings amounts to 13,6% (2014: 12,8%) at year-end.
Included in interest-bearing borrowings are motor vehicle loans of R 0,2 million (2014: R1,0 million), for which motor vehicles are encumbered (refer to note 4). Motor vehicle loans owing by employees are included in trade and other receivables (refer to note 9). All the borrowings, excluding the motor vehicle schemes, have fixed interest rates. Motor vehicle scheme rates are linked to prime.
The minimum lease payments are payable as follows:
Within one year 4 472 4 066
Between two and five years 22 830 20 755
After five years 68 331 74 879
Total payments 95 633 99 700
Less: finance charges payable (65 780) (71 426)
29 853 28 274
119
2015 2014R000 R000
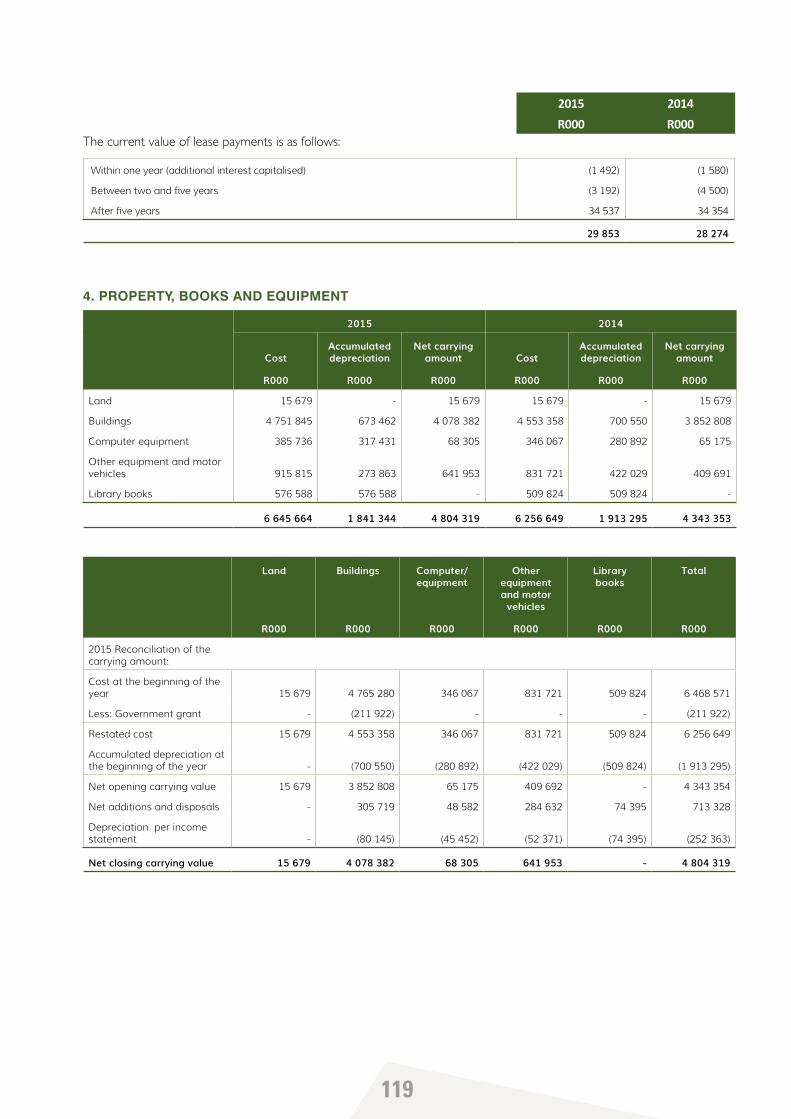
The current value of lease payments is as follows:
Within one year (additional interest capitalised) (1 492) (1 580)
Between two and five years (3 192) (4 500)
After five years 34 537 34 354
29 853 28 274
4. PROPERTY, BOOKS AND EQUIPMENT
2015 2014
CostAccumulateddepreciation
Net carrying amount Cost
Accumulateddepreciation
Net carrying amount
R000 R000 R000 R000 R000 R000
Land 15 679 - 15 679 15 679 - 15 679
Buildings 4 751 845 673 462 4 078 382 4 553 358 700 550 3 852 808
Computer equipment 385 736 317 431 68 305 346 067 280 892 65 175
Other equipment and motor vehicles 915 815 273 863 641 953 831 721 422 029 409 691
Library books 576 588 576 588 - 509 824 509 824 -
6 645 664 1 841 344 4 804 319 6 256 649 1 913 295 4 343 353
Land Buildings Computer/equipment
Other equipmentand motor
vehicles
Librarybooks
Total
R000 R000 R000 R000 R000 R000
2015 Reconciliation of the carrying amount:
Cost at the beginning of the year 15 679 4 765 280 346 067 831 721 509 824 6 468 571
Less: Government grant - (211 922) - - - (211 922)
Restated cost 15 679 4 553 358 346 067 831 721 509 824 6 256 649
Accumulated depreciation at the beginning of the year - (700 550) (280 892) (422 029) (509 824) (1 913 295)
Net opening carrying value 15 679 3 852 808 65 175 409 692 - 4 343 354
Net additions and disposals - 305 719 48 582 284 632 74 395 713 328
Depreciation per income statement - (80 145) (45 452) (52 371) (74 395) (252 363)
Net closing carrying value 15 679 4 078 382 68 305 641 953 - 4 804 319
120
Land Buildings Computer equipment
Other equipmentand motor
vehicles
Librarybooks
Total
R000 R000 R000 R000 R000 R000
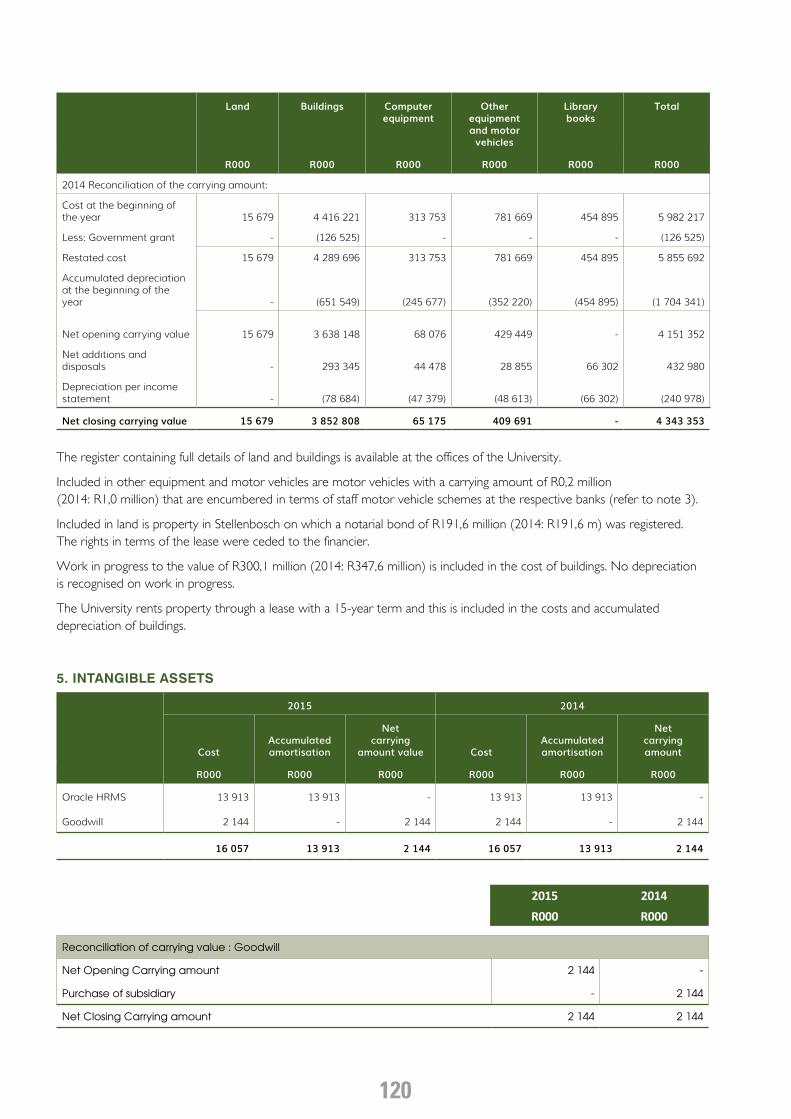
2014 Reconciliation of the carrying amount:
Cost at the beginning of the year 15 679 4 416 221 313 753 781 669 454 895 5 982 217
Less: Government grant - (126 525) - - - (126 525)
Restated cost 15 679 4 289 696 313 753 781 669 454 895 5 855 692
Accumulated depreciation at the beginning of the year - (651 549) (245 677) (352 220) (454 895) (1 704 341)
Net opening carrying value 15 679 3 638 148 68 076 429 449 - 4 151 352
Net additions and disposals - 293 345 44 478 28 855 66 302 432 980
Depreciation per income statement - (78 684) (47 379) (48 613) (66 302) (240 978)
Net closing carrying value 15 679 3 852 808 65 175 409 691 - 4 343 353
The register containing full details of land and buildings is available at the offices of the University.
Included in other equipment and motor vehicles are motor vehicles with a carrying amount of R0,2 million (2014: R1,0 million) that are encumbered in terms of staff motor vehicle schemes at the respective banks (refer to note 3).
Included in land is property in Stellenbosch on which a notarial bond of R191,6 million (2014: R191,6 m) was registered. The rights in terms of the lease were ceded to the financier.
Work in progress to the value of R300,1 million (2014: R347,6 million) is included in the cost of buildings. No depreciation is recognised on work in progress.
The University rents property through a lease with a 15-year term and this is included in the costs and accumulated depreciation of buildings.
5. INTANGIBLE ASSETS
2015 2014
CostAccumulatedamortisation
Netcarrying
amount value CostAccumulatedamortisation
Netcarryingamount
R000 R000 R000 R000 R000 R000
Oracle HRMS 13 913 13 913 - 13 913 13 913 -
Goodwill 2 144 - 2 144 2 144 - 2 144
16 057 13 913 2 144 16 057 13 913 2 144
2015 2014R000 R000
Reconciliation of carrying value : Goodwill
Net Opening Carrying amount 2 144 -
Purchase of subsidiary - 2 144
Net Closing Carrying amount 2 144 2 144
121
2015 2014R000 R000
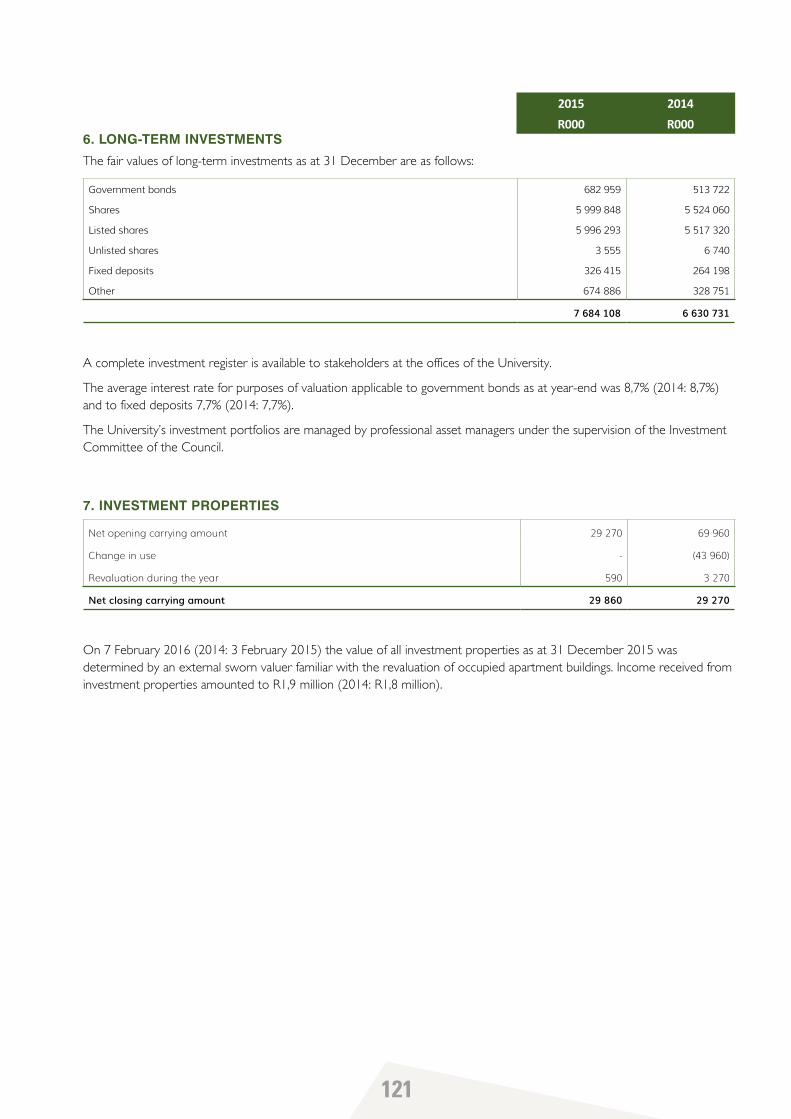
6. LONG-TERM INVESTMENTS
The fair values of long-term investments as at 31 December are as follows:
Government bonds 682 959 513 722
Shares 5 999 848 5 524 060
Listed shares 5 996 293 5 517 320
Unlisted shares 3 555 6 740
Fixed deposits 326 415 264 198
Other 674 886 328 751
7 684 108 6 630 731
A complete investment register is available to stakeholders at the offices of the University.
The average interest rate for purposes of valuation applicable to government bonds as at year-end was 8,7% (2014: 8,7%) and to fixed deposits 7,7% (2014: 7,7%).
The University’s investment portfolios are managed by professional asset managers under the supervision of the Investment Committee of the Council.
7. INVESTMENT PROPERTIES
Net opening carrying amount 29 270 69 960
Change in use - (43 960)
Revaluation during the year 590 3 270
Net closing carrying amount 29 860 29 270
On 7 February 2016 (2014: 3 February 2015) the value of all investment properties as at 31 December 2015 was determined by an external sworn valuer familiar with the revaluation of occupied apartment buildings. Income received from investment properties amounted to R1,9 million (2014: R1,8 million).
122
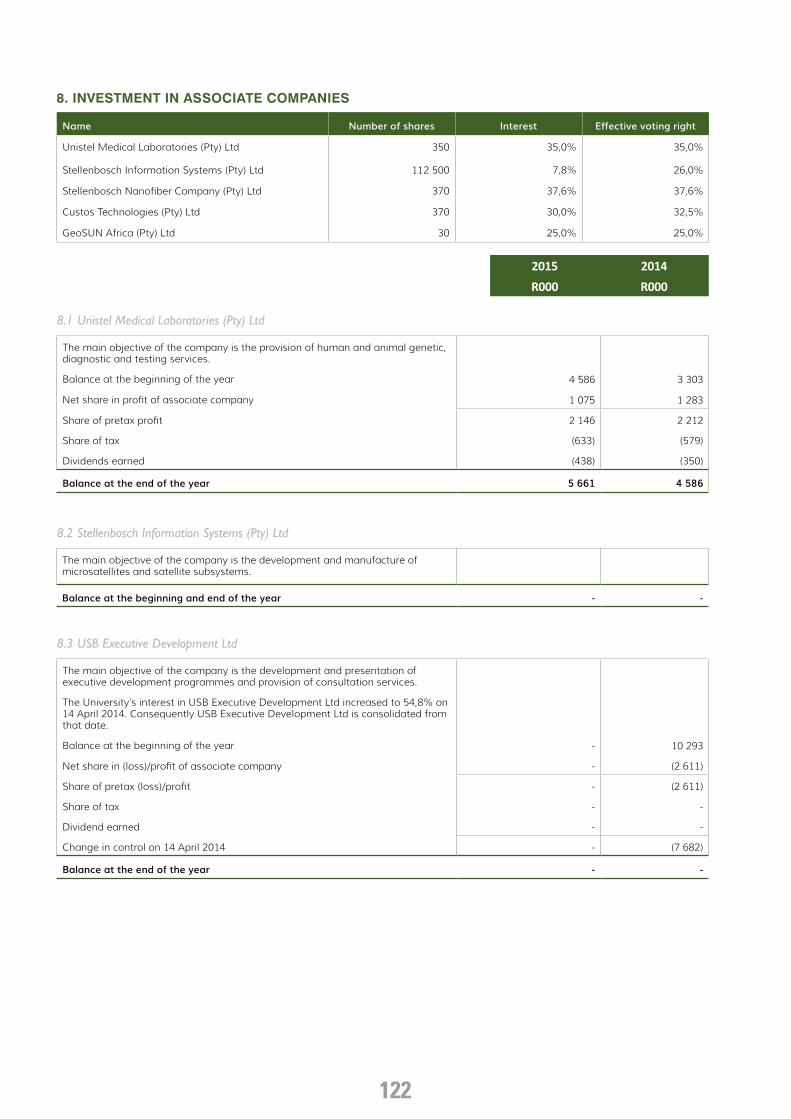
8. INVESTMENT IN ASSOCIATE COMPANIES
Name Number of shares Interest Effective voting right
Unistel Medical Laboratories (Pty) Ltd 350 35,0% 35,0%
Stellenbosch Information Systems (Pty) Ltd 112 500 7,8% 26,0%
Stellenbosch Nanofiber Company (Pty) Ltd 370 37,6% 37,6%
Custos Technologies (Pty) Ltd 370 30,0% 32,5%
GeoSUN Africa (Pty) Ltd 30 25,0% 25,0%
2015 2014R000 R000
8.1 Unistel Medical Laboratories (Pty) Ltd
The main objective of the company is the provision of human and animal genetic, diagnostic and testing services.
Balance at the beginning of the year 4 586 3 303
Net share in profit of associate company 1 075 1 283
Share of pretax profit 2 146 2 212
Share of tax (633) (579)
Dividends earned (438) (350)
Balance at the end of the year 5 661 4 586
8.2 Stellenbosch Information Systems (Pty) Ltd
The main objective of the company is the development and manufacture of microsatellites and satellite subsystems.
Balance at the beginning and end of the year - -
8.3 USB Executive Development Ltd
The main objective of the company is the development and presentation of executive development programmes and provision of consultation services.
The University’s interest in USB Executive Development Ltd increased to 54,8% on 14 April 2014. Consequently USB Executive Development Ltd is consolidated from that date.
Balance at the beginning of the year - 10 293
Net share in (loss)/profit of associate company - (2 611)
Share of pretax (loss)/profit - (2 611)
Share of tax - -
Dividend earned - -
Change in control on 14 April 2014 - (7 682)
Balance at the end of the year - -
123
2015 2014R000 R000
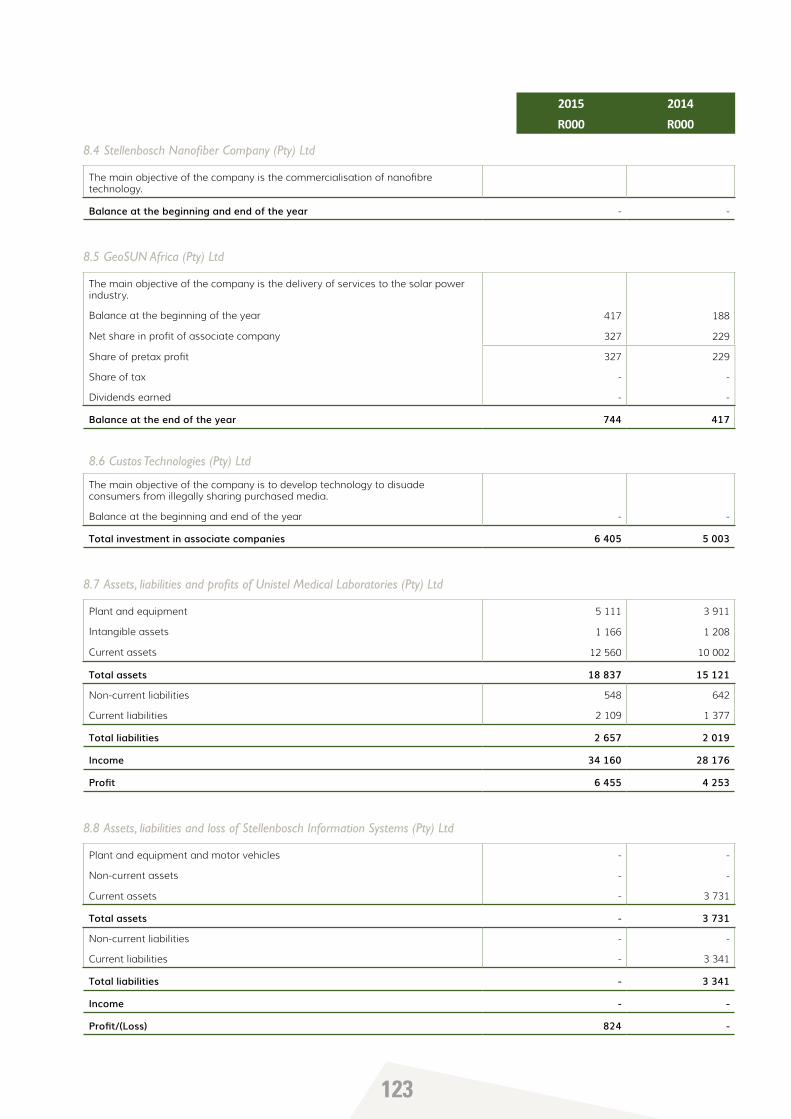
8.4 Stellenbosch Nanofiber Company (Pty) Ltd
The main objective of the company is the commercialisation of nanofibre technology.
Balance at the beginning and end of the year - -
8.5 GeoSUN Africa (Pty) Ltd
The main objective of the company is the delivery of services to the solar power industry.
Balance at the beginning of the year 417 188
Net share in profit of associate company 327 229
Share of pretax profit 327 229
Share of tax - -
Dividends earned - -
Balance at the end of the year 744 417
8.6 Custos Technologies (Pty) Ltd
The main objective of the company is to develop technology to disuade consumers from illegally sharing purchased media.
Balance at the beginning and end of the year - -
Total investment in associate companies 6 405 5 003
8.7 Assets, liabilities and profits of Unistel Medical Laboratories (Pty) Ltd
Plant and equipment 5 111 3 911
Intangible assets 1 166 1 208
Current assets 12 560 10 002
Total assets 18 837 15 121
Non-current liabilities 548 642
Current liabilities 2 109 1 377
Total liabilities 2 657 2 019
Income 34 160 28 176
Profit 6 455 4 253
8.8 Assets, liabilities and loss of Stellenbosch Information Systems (Pty) Ltd
Plant and equipment and motor vehicles - -
Non-current assets - -
Current assets - 3 731
Total assets - 3 731
Non-current liabilities - -
Current liabilities - 3 341
Total liabilities - 3 341
Income - -
Profit/(Loss) 824 -
124
2015 2014R000 R000
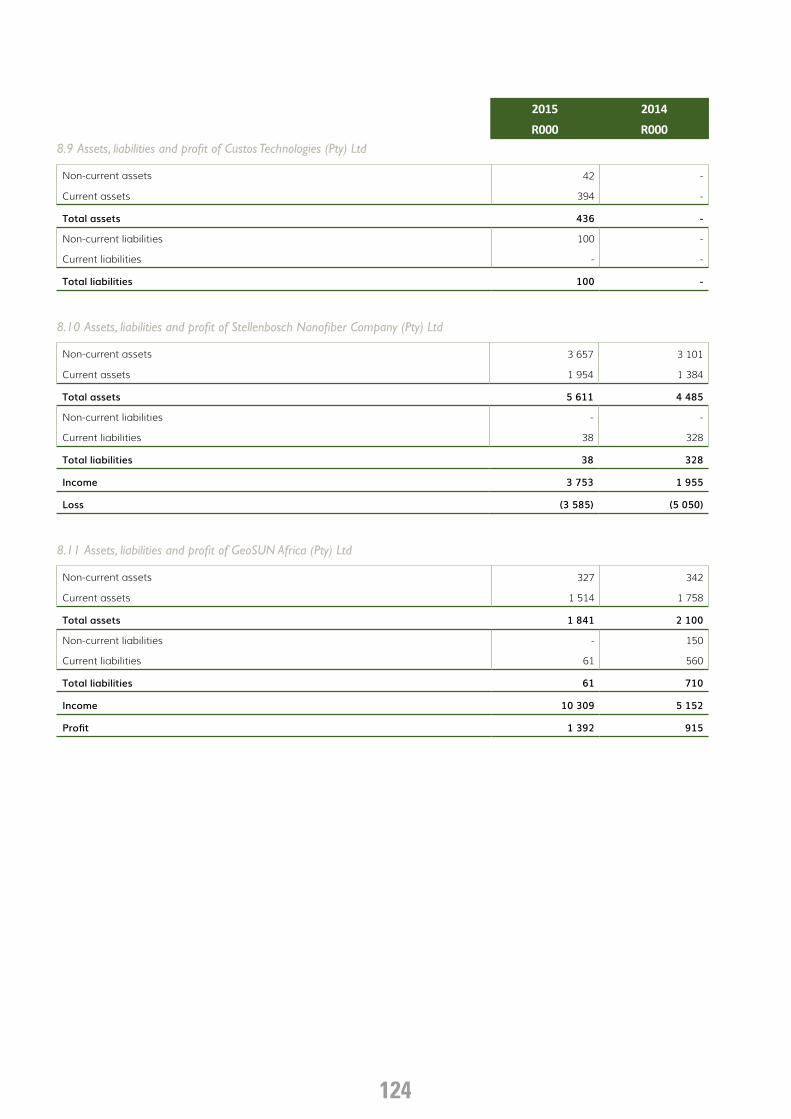
8.9 Assets, liabilities and profit of Custos Technologies (Pty) Ltd
Non-current assets 42 -
Current assets 394 -
Total assets 436 -
Non-current liabilities 100 -
Current liabilities - -
Total liabilities 100 -
8.10 Assets, liabilities and profit of Stellenbosch Nanofiber Company (Pty) Ltd
Non-current assets 3 657 3 101
Current assets 1 954 1 384
Total assets 5 611 4 485
Non-current liabilities - -
Current liabilities 38 328
Total liabilities 38 328
Income 3 753 1 955
Loss (3 585) (5 050)
8.11 Assets, liabilities and profit of GeoSUN Africa (Pty) Ltd
Non-current assets 327 342
Current assets 1 514 1 758
Total assets 1 841 2 100
Non-current liabilities - 150
Current liabilities 61 560
Total liabilities 61 710
Income 10 309 5 152
Profit 1 392 915
125
2015 2014R000 R000
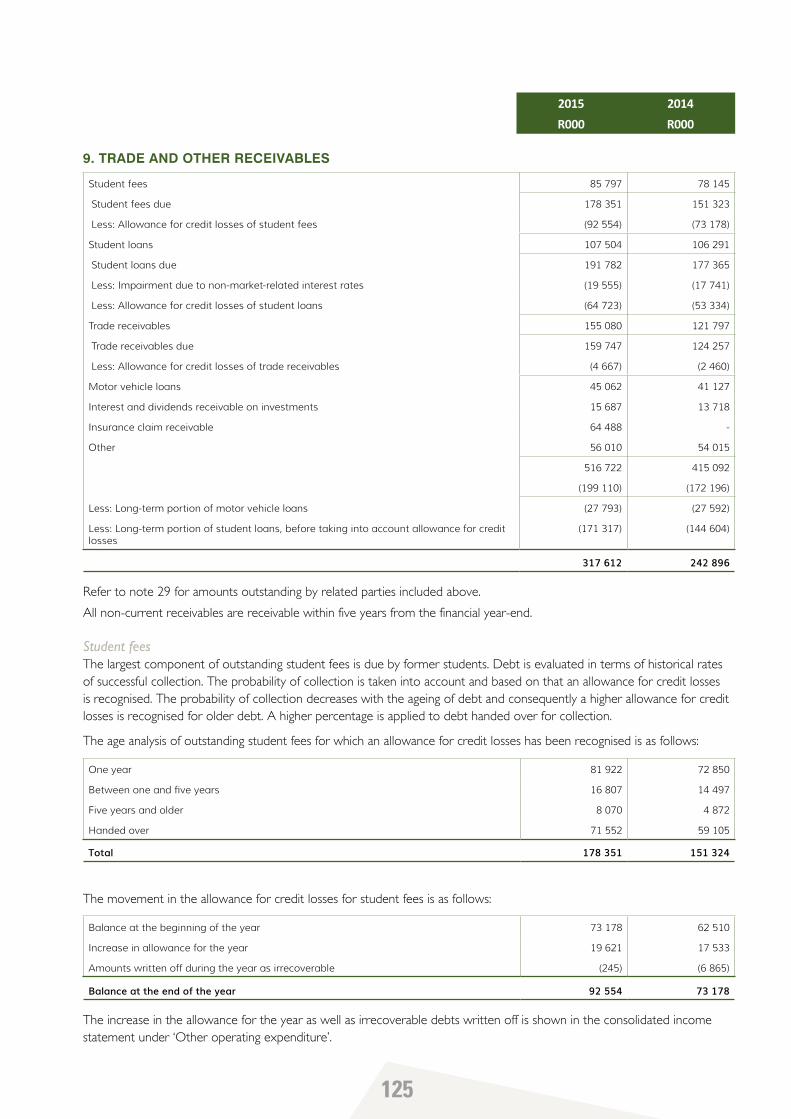
9. TRADE AND OTHER RECEIVABLES
Student fees 85 797 78 145
Student fees due 178 351 151 323
Less: Allowance for credit losses of student fees (92 554) (73 178)
Student loans 107 504 106 291
Student loans due 191 782 177 365
Less: Impairment due to non-market-related interest rates (19 555) (17 741)
Less: Allowance for credit losses of student loans (64 723) (53 334)
Trade receivables 155 080 121 797
Trade receivables due 159 747 124 257
Less: Allowance for credit losses of trade receivables (4 667) (2 460)
Motor vehicle loans 45 062 41 127
Interest and dividends receivable on investments 15 687 13 718
Insurance claim receivable 64 488 -
Other 56 010 54 015
516 722 415 092
(199 110) (172 196)
Less: Long-term portion of motor vehicle loans (27 793) (27 592)
Less: Long-term portion of student loans, before taking into account allowance for credit losses
(171 317) (144 604)
317 612 242 896
Refer to note 29 for amounts outstanding by related parties included above.
All non-current receivables are receivable within five years from the financial year-end.
Student feesThe largest component of outstanding student fees is due by former students. Debt is evaluated in terms of historical rates of successful collection. The probability of collection is taken into account and based on that an allowance for credit losses is recognised. The probability of collection decreases with the ageing of debt and consequently a higher allowance for credit losses is recognised for older debt. A higher percentage is applied to debt handed over for collection.
The age analysis of outstanding student fees for which an allowance for credit losses has been recognised is as follows:
One year 81 922 72 850
Between one and five years 16 807 14 497
Five years and older 8 070 4 872
Handed over 71 552 59 105
Total 178 351 151 324
The movement in the allowance for credit losses for student fees is as follows:
Balance at the beginning of the year 73 178 62 510
Increase in allowance for the year 19 621 17 533
Amounts written off during the year as irrecoverable (245) (6 865)
Balance at the end of the year 92 554 73 178
The increase in the allowance for the year as well as irrecoverable debts written off is shown in the consolidated income statement under ‘Other operating expenditure’.
126
2015 2014R000 R000
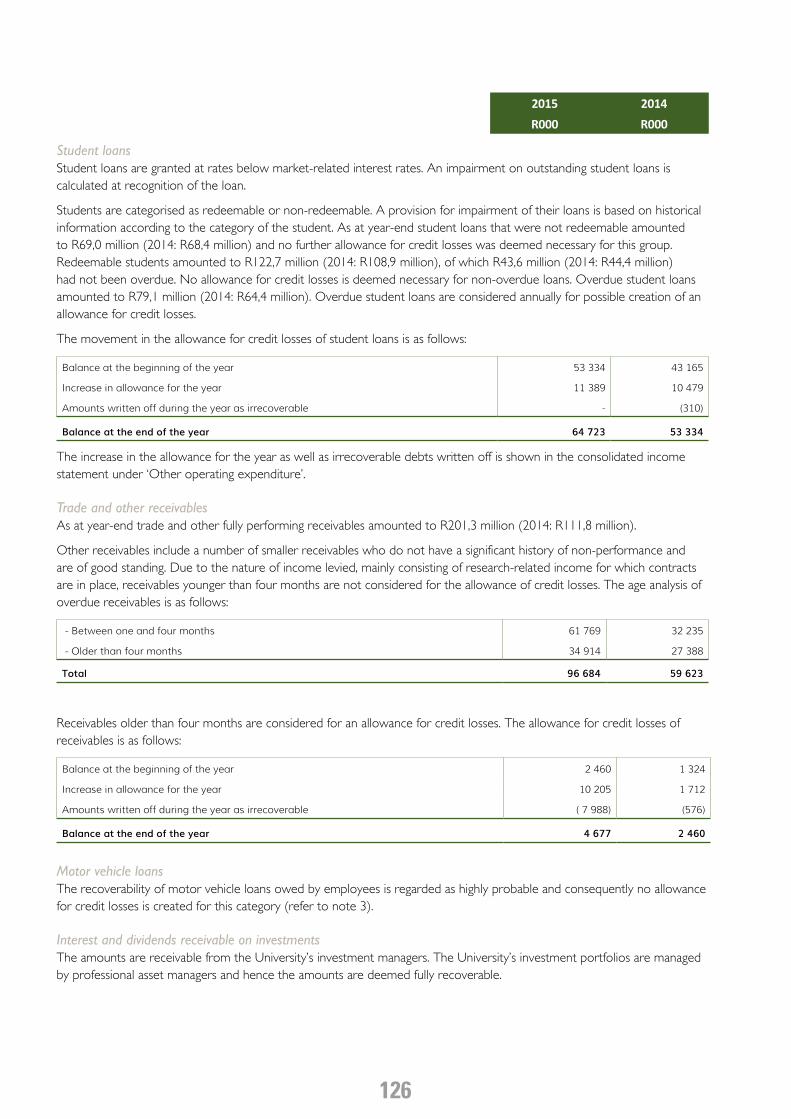
Student loansStudent loans are granted at rates below market-related interest rates. An impairment on outstanding student loans is calculated at recognition of the loan.
Students are categorised as redeemable or non-redeemable. A provision for impairment of their loans is based on historical information according to the category of the student. As at year-end student loans that were not redeemable amounted to R69,0 million (2014: R68,4 million) and no further allowance for credit losses was deemed necessary for this group. Redeemable students amounted to R122,7 million (2014: R108,9 million), of which R43,6 million (2014: R44,4 million) had not been overdue. No allowance for credit losses is deemed necessary for non-overdue loans. Overdue student loans amounted to R79,1 million (2014: R64,4 million). Overdue student loans are considered annually for possible creation of an allowance for credit losses.
The movement in the allowance for credit losses of student loans is as follows:
Balance at the beginning of the year 53 334 43 165
Increase in allowance for the year 11 389 10 479
Amounts written off during the year as irrecoverable - (310)
Balance at the end of the year 64 723 53 334
The increase in the allowance for the year as well as irrecoverable debts written off is shown in the consolidated income statement under ‘Other operating expenditure’.
Trade and other receivablesAs at year-end trade and other fully performing receivables amounted to R201,3 million (2014: R111,8 million).
Other receivables include a number of smaller receivables who do not have a significant history of non-performance and are of good standing. Due to the nature of income levied, mainly consisting of research-related income for which contracts are in place, receivables younger than four months are not considered for the allowance of credit losses. The age analysis of overdue receivables is as follows:
- Between one and four months 61 769 32 235
- Older than four months 34 914 27 388
Total 96 684 59 623
Receivables older than four months are considered for an allowance for credit losses. The allowance for credit losses of receivables is as follows:
Balance at the beginning of the year 2 460 1 324
Increase in allowance for the year 10 205 1 712
Amounts written off during the year as irrecoverable ( 7 988) (576)
Balance at the end of the year 4 677 2 460
Motor vehicle loansThe recoverability of motor vehicle loans owed by employees is regarded as highly probable and consequently no allowance for credit losses is created for this category (refer to note 3).
Interest and dividends receivable on investmentsThe amounts are receivable from the University’s investment managers. The University’s investment portfolios are managed by professional asset managers and hence the amounts are deemed fully recoverable.
127
2015 2014R000 R000
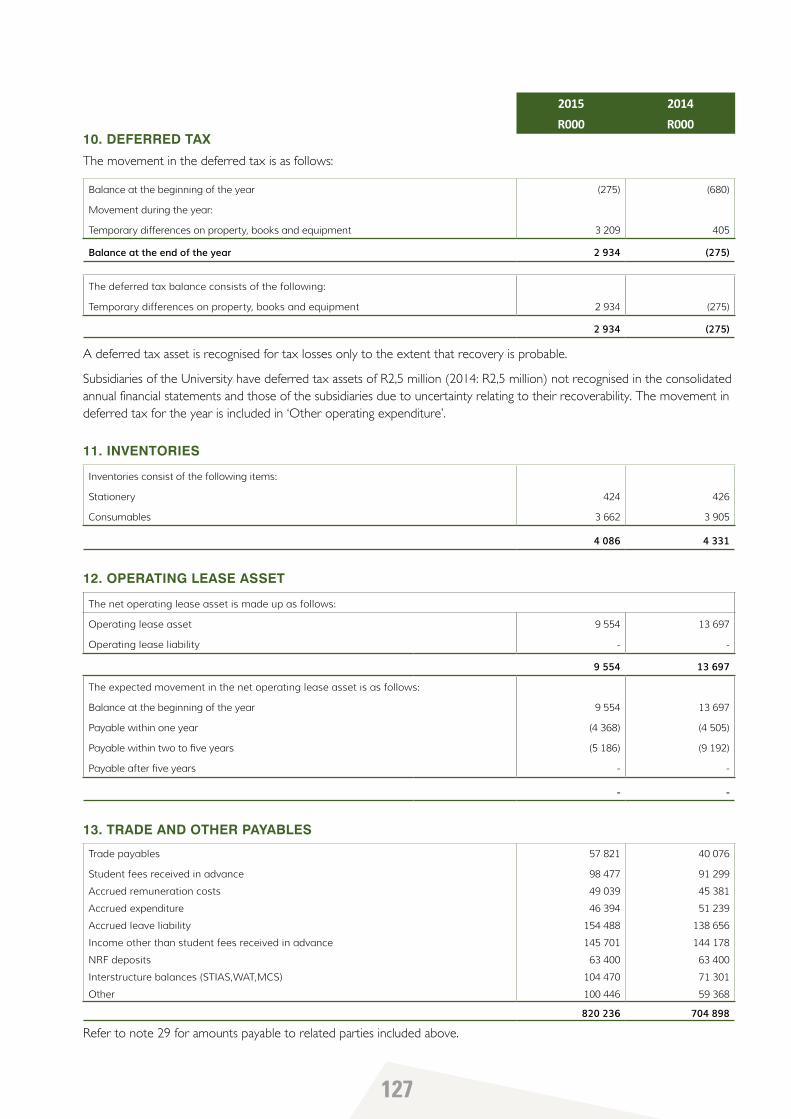
10. DEFERRED TAX
The movement in the deferred tax is as follows:
Balance at the beginning of the year (275) (680)
Movement during the year:
Temporary differences on property, books and equipment 3 209 405
Balance at the end of the year 2 934 (275)
The deferred tax balance consists of the following:
Temporary differences on property, books and equipment 2 934 (275)
2 934 (275)
A deferred tax asset is recognised for tax losses only to the extent that recovery is probable.
Subsidiaries of the University have deferred tax assets of R2,5 million (2014: R2,5 million) not recognised in the consolidated annual financial statements and those of the subsidiaries due to uncertainty relating to their recoverability. The movement in deferred tax for the year is included in ‘Other operating expenditure’.
11. INVENTORIES
Inventories consist of the following items:
Stationery 424 426
Consumables 3 662 3 905
4 086 4 331
12. OPERATING LEASE ASSET
The net operating lease asset is made up as follows:
Operating lease asset 9 554 13 697
Operating lease liability - -
9 554 13 697
The expected movement in the net operating lease asset is as follows:
Balance at the beginning of the year 9 554 13 697
Payable within one year (4 368) (4 505)
Payable within two to five years (5 186) (9 192)
Payable after five years - -
- -
13. TRADE AND OTHER PAYABLES
Trade payables 57 821 40 076
Student fees received in advance 98 477 91 299
Accrued remuneration costs 49 039 45 381
Accrued expenditure 46 394 51 239
Accrued leave liability 154 488 138 656
Income other than student fees received in advance 145 701 144 178
NRF deposits 63 400 63 400
Interstructure balances (STIAS,WAT,MCS) 104 470 71 301
Other 100 446 59 368
820 236 704 898
Refer to note 29 for amounts payable to related parties included above.
128
2015 2014R000 R000
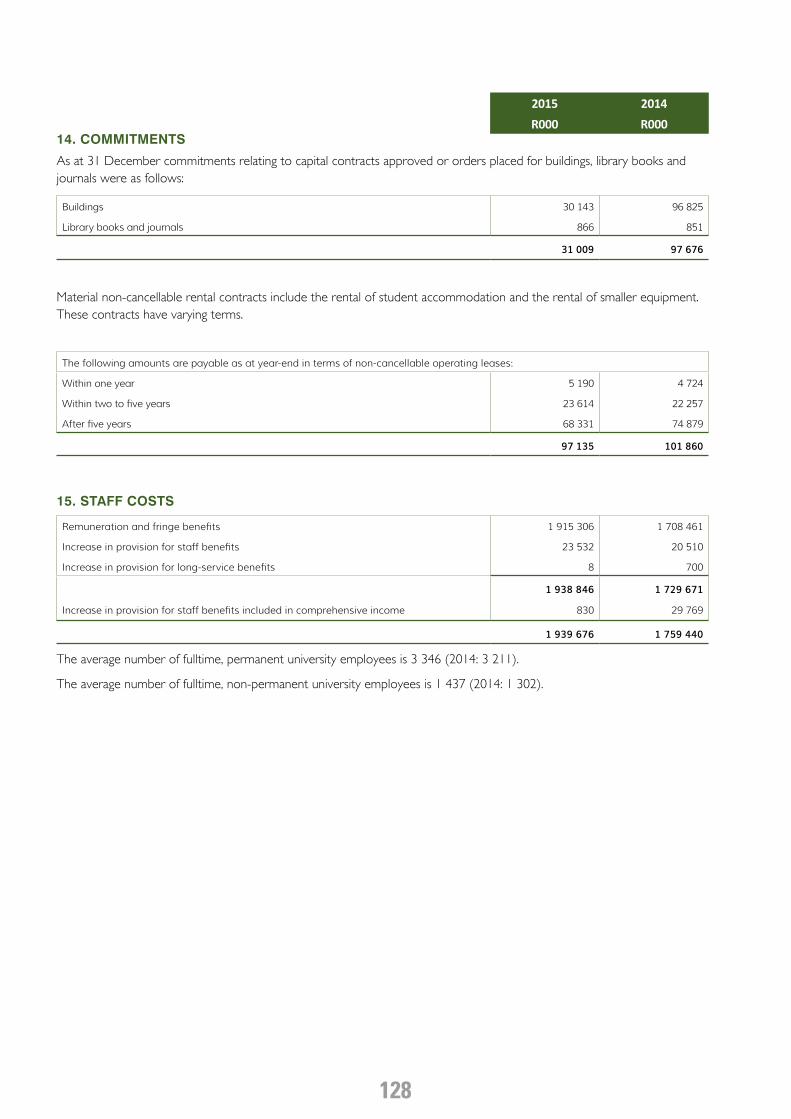
14. COMMITMENTS
As at 31 December commitments relating to capital contracts approved or orders placed for buildings, library books and journals were as follows:
Buildings 30 143 96 825
Library books and journals 866 851
31 009 97 676
Material non-cancellable rental contracts include the rental of student accommodation and the rental of smaller equipment. These contracts have varying terms.
The following amounts are payable as at year-end in terms of non-cancellable operating leases:
Within one year 5 190 4 724
Within two to five years 23 614 22 257
After five years 68 331 74 879
97 135 101 860
15. STAFF COSTS
Remuneration and fringe benefits 1 915 306 1 708 461
Increase in provision for staff benefits 23 532 20 510
Increase in provision for long-service benefits 8 700
1 938 846 1 729 671
Increase in provision for staff benefits included in comprehensive income 830 29 769
1 939 676 1 759 440
The average number of fulltime, permanent university employees is 3 346 (2014: 3 211).
The average number of fulltime, non-permanent university employees is 1 437 (2014: 1 302).
129
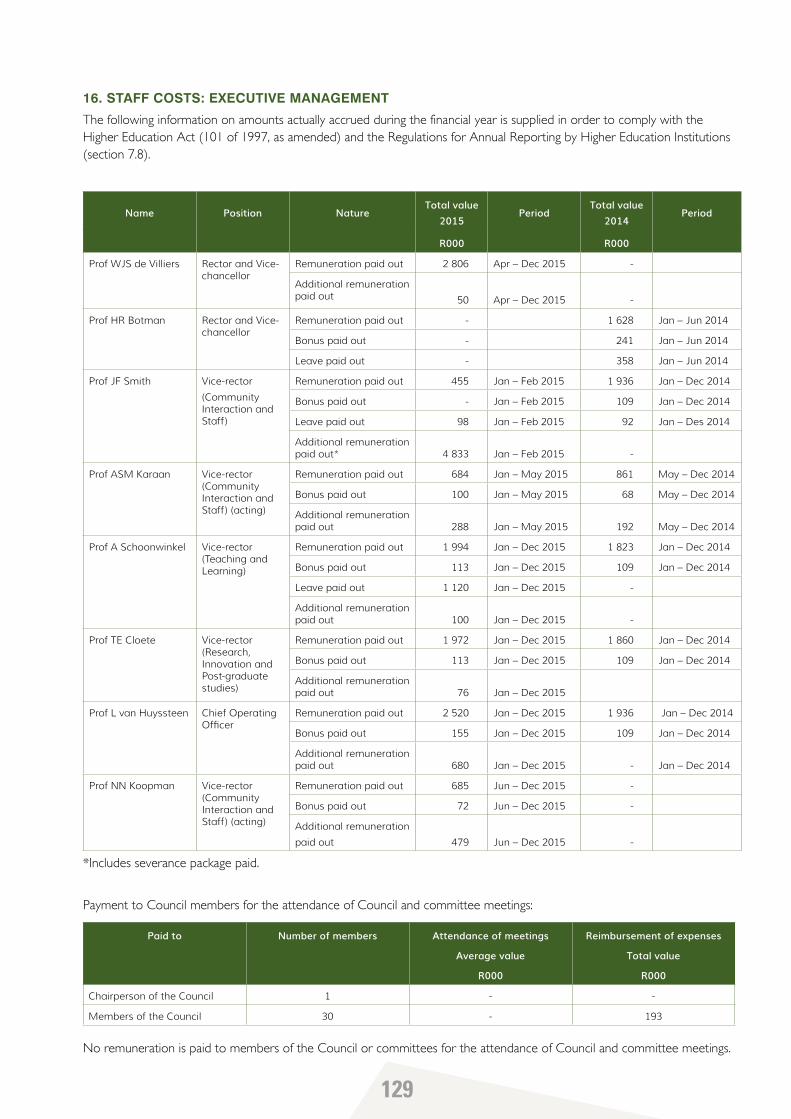
16. STAFF COSTS: EXECUTIVE MANAGEMENT
The following information on amounts actually accrued during the financial year is supplied in order to comply with the Higher Education Act (101 of 1997, as amended) and the Regulations for Annual Reporting by Higher Education Institutions (section 7.8).
Name Position NatureTotal value
2015Period
Total value2014
Period
R000 R000
Prof WJS de Villiers Rector and Vice-chancellor
Remuneration paid out 2 806 Apr – Dec 2015 -
Additional remuneration paid out 50 Apr – Dec 2015 -
Prof HR Botman Rector and Vice-chancellor
Remuneration paid out - 1 628 Jan – Jun 2014
Bonus paid out - 241 Jan – Jun 2014
Leave paid out - 358 Jan – Jun 2014
Prof JF Smith Vice-rector
(Community Interaction and Staff)
Remuneration paid out 455 Jan – Feb 2015 1 936 Jan – Dec 2014
Bonus paid out - Jan – Feb 2015 109 Jan – Dec 2014
Leave paid out 98 Jan – Feb 2015 92 Jan – Des 2014
Additional remuneration paid out* 4 833 Jan – Feb 2015 -
Prof ASM Karaan Vice-rector (Community Interaction and Staff) (acting)
Remuneration paid out 684 Jan – May 2015 861 May – Dec 2014
Bonus paid out 100 Jan – May 2015 68 May – Dec 2014
Additional remuneration paid out 288 Jan – May 2015 192 May – Dec 2014
Prof A Schoonwinkel Vice-rector (Teaching and Learning)
Remuneration paid out 1 994 Jan – Dec 2015 1 823 Jan – Dec 2014
Bonus paid out 113 Jan – Dec 2015 109 Jan – Dec 2014
Leave paid out 1 120 Jan – Dec 2015 -
Additional remuneration paid out 100 Jan – Dec 2015 -
Prof TE Cloete Vice-rector (Research, Innovation and Post-graduate studies)
Remuneration paid out 1 972 Jan – Dec 2015 1 860 Jan – Dec 2014
Bonus paid out 113 Jan – Dec 2015 109 Jan – Dec 2014
Additional remuneration paid out 76 Jan – Dec 2015
Prof L van Huyssteen Chief Operating Officer
Remuneration paid out 2 520 Jan – Dec 2015 1 936 Jan – Dec 2014
Bonus paid out 155 Jan – Dec 2015 109 Jan – Dec 2014
Additional remuneration paid out 680 Jan – Dec 2015 - Jan – Dec 2014
Prof NN Koopman Vice-rector (Community Interaction and Staff) (acting)
Remuneration paid out 685 Jun – Dec 2015 -
Bonus paid out 72 Jun – Dec 2015 -
Additional remuneration
paid out 479 Jun – Dec 2015 -
*Includes severance package paid.
Payment to Council members for the attendance of Council and committee meetings:
Paid to Number of members Attendance of meetings
Average value
R000
Reimbursement of expenses
Total value
R000
Chairperson of the Council 1 - -
Members of the Council 30 - 193
No remuneration is paid to members of the Council or committees for the attendance of Council and committee meetings.
130
2015 2014R000 R000
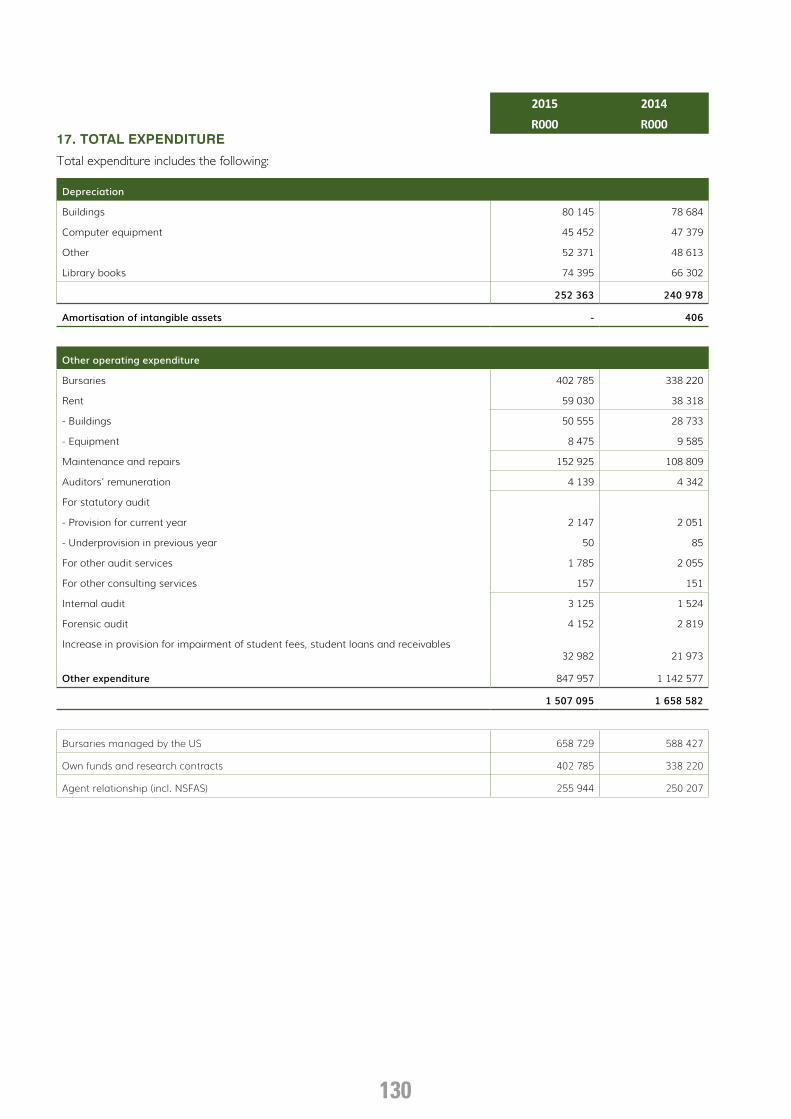
17. TOTAL EXPENDITURE
Total expenditure includes the following:
Depreciation
Buildings 80 145 78 684
Computer equipment 45 452 47 379
Other 52 371 48 613
Library books 74 395 66 302
252 363 240 978
Amortisation of intangible assets - 406
Other operating expenditure
Bursaries 402 785 338 220
Rent 59 030 38 318
- Buildings 50 555 28 733
- Equipment 8 475 9 585
Maintenance and repairs 152 925 108 809
Auditors’ remuneration 4 139 4 342
For statutory audit
- Provision for current year 2 147 2 051
- Underprovision in previous year 50 85
For other audit services 1 785 2 055
For other consulting services 157 151
Internal audit 3 125 1 524
Forensic audit 4 152 2 819
Increase in provision for impairment of student fees, student loans and receivables32 982 21 973
Other expenditure 847 957 1 142 577
1 507 095 1 658 582
Bursaries managed by the US 658 729 588 427
Own funds and research contracts 402 785 338 220
Agent relationship (incl. NSFAS) 255 944 250 207
131
2015 2014R000 R000
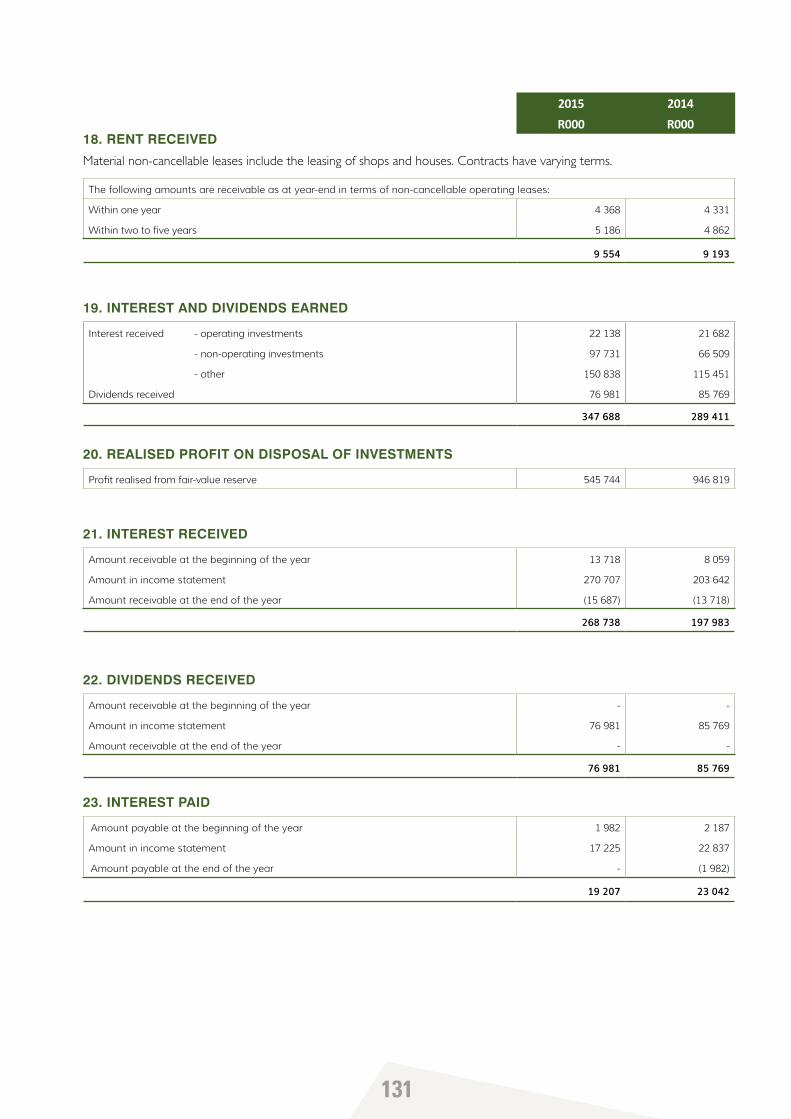
18. RENT RECEIVED
Material non-cancellable leases include the leasing of shops and houses. Contracts have varying terms.
The following amounts are receivable as at year-end in terms of non-cancellable operating leases:
Within one year 4 368 4 331
Within two to five years 5 186 4 862
9 554 9 193
19. INTEREST AND DIVIDENDS EARNED
Interest received - operating investments 22 138 21 682
- non-operating investments 97 731 66 509
- other 150 838 115 451
Dividends received 76 981 85 769
347 688 289 411
20. REALISED PROFIT ON DISPOSAL OF INVESTMENTS
Profit realised from fair-value reserve 545 744 946 819
21. INTEREST RECEIVED
Amount receivable at the beginning of the year 13 718 8 059
Amount in income statement 270 707 203 642
Amount receivable at the end of the year (15 687) (13 718)
268 738 197 983
22. DIVIDENDS RECEIVED
Amount receivable at the beginning of the year - -
Amount in income statement 76 981 85 769
Amount receivable at the end of the year - -
76 981 85 769
23. INTEREST PAID
Amount payable at the beginning of the year 1 982 2 187
Amount in income statement 17 225 22 837
Amount payable at the end of the year - (1 982)
19 207 23 042
132
2015 2014R000 R000
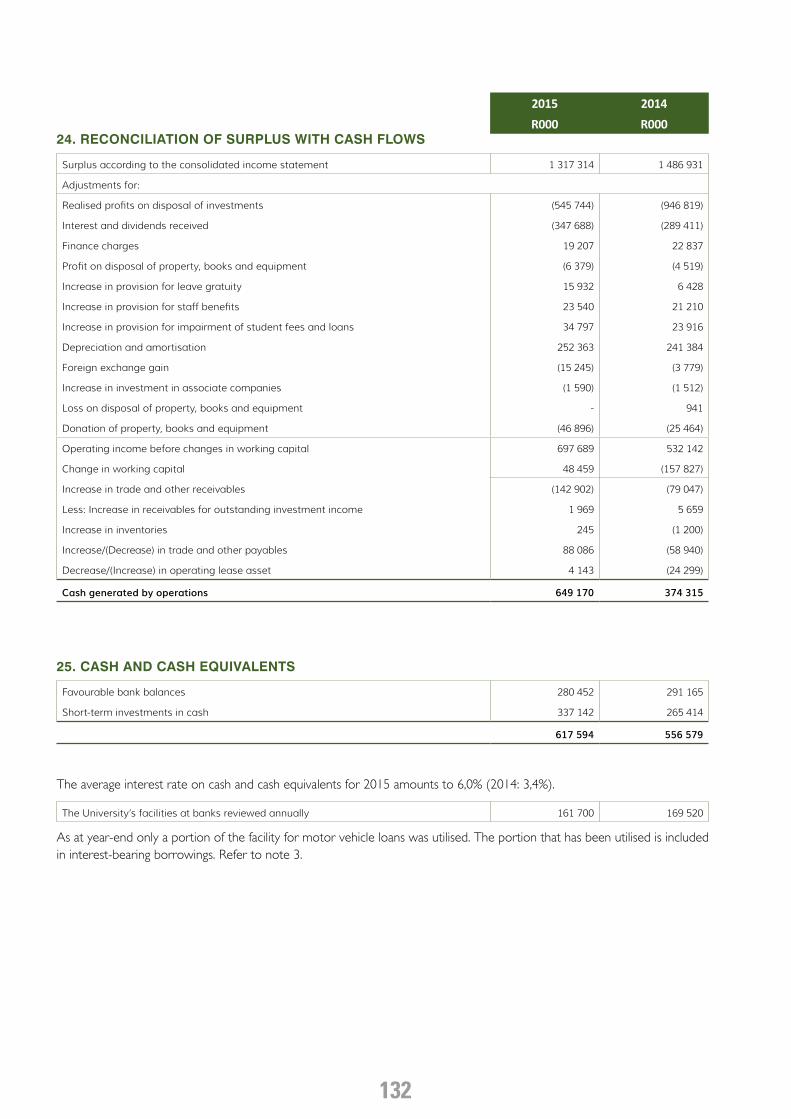
24. RECONCILIATION OF SURPLUS WITH CASH FLOWS
Surplus according to the consolidated income statement 1 317 314 1 486 931
Adjustments for:
Realised profits on disposal of investments (545 744) (946 819)
Interest and dividends received (347 688) (289 411)
Finance charges 19 207 22 837
Profit on disposal of property, books and equipment (6 379) (4 519)
Increase in provision for leave gratuity 15 932 6 428
Increase in provision for staff benefits 23 540 21 210
Increase in provision for impairment of student fees and loans 34 797 23 916
Depreciation and amortisation 252 363 241 384
Foreign exchange gain (15 245) (3 779)
Increase in investment in associate companies (1 590) (1 512)
Loss on disposal of property, books and equipment - 941
Donation of property, books and equipment (46 896) (25 464)
Operating income before changes in working capital 697 689 532 142
Change in working capital 48 459 (157 827)
Increase in trade and other receivables (142 902) (79 047)
Less: Increase in receivables for outstanding investment income 1 969 5 659
Increase in inventories 245 (1 200)
Increase/(Decrease) in trade and other payables 88 086 (58 940)
Decrease/(Increase) in operating lease asset 4 143 (24 299)
Cash generated by operations 649 170 374 315
25. CASH AND CASH EQUIVALENTS
Favourable bank balances 280 452 291 165
Short-term investments in cash 337 142 265 414
617 594 556 579
The average interest rate on cash and cash equivalents for 2015 amounts to 6,0% (2014: 3,4%).
The University’s facilities at banks reviewed annually 161 700 169 520
As at year-end only a portion of the facility for motor vehicle loans was utilised. The portion that has been utilised is included in interest-bearing borrowings. Refer to note 3.
133
2015 2014R000 R000
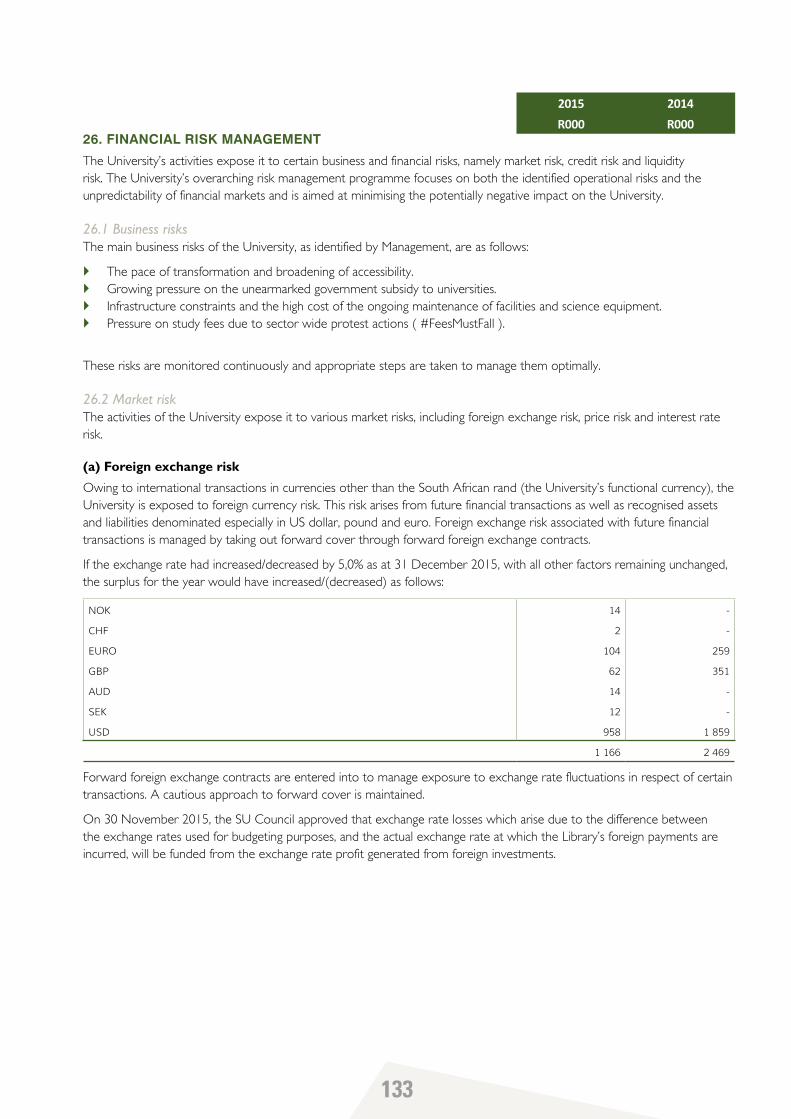
26. FINANCIAL RISK MANAGEMENT
The University’s activities expose it to certain business and financial risks, namely market risk, credit risk and liquidity risk. The University’s overarching risk management programme focuses on both the identified operational risks and the unpredictability of financial markets and is aimed at minimising the potentially negative impact on the University.
26.1 Business risksThe main business risks of the University, as identified by Management, are as follows:
` The pace of transformation and broadening of accessibility.` Growing pressure on the unearmarked government subsidy to universities.` Infrastructure constraints and the high cost of the ongoing maintenance of facilities and science equipment.` Pressure on study fees due to sector wide protest actions ( #FeesMustFall ).
These risks are monitored continuously and appropriate steps are taken to manage them optimally.
26.2 Market riskThe activities of the University expose it to various market risks, including foreign exchange risk, price risk and interest rate risk.
(a) Foreign exchange risk
Owing to international transactions in currencies other than the South African rand (the University’s functional currency), the University is exposed to foreign currency risk. This risk arises from future financial transactions as well as recognised assets and liabilities denominated especially in US dollar, pound and euro. Foreign exchange risk associated with future financial transactions is managed by taking out forward cover through forward foreign exchange contracts.
If the exchange rate had increased/decreased by 5,0% as at 31 December 2015, with all other factors remaining unchanged, the surplus for the year would have increased/(decreased) as follows:
NOK 14 -
CHF 2 -
EURO 104 259
GBP 62 351
AUD 14 -
SEK 12 -
USD 958 1 859
1 166 2 469
Forward foreign exchange contracts are entered into to manage exposure to exchange rate fluctuations in respect of certain transactions. A cautious approach to forward cover is maintained.
On 30 November 2015, the SU Council approved that exchange rate losses which arise due to the difference between the exchange rates used for budgeting purposes, and the actual exchange rate at which the Library’s foreign payments are incurred, will be funded from the exchange rate profit generated from foreign investments.
134
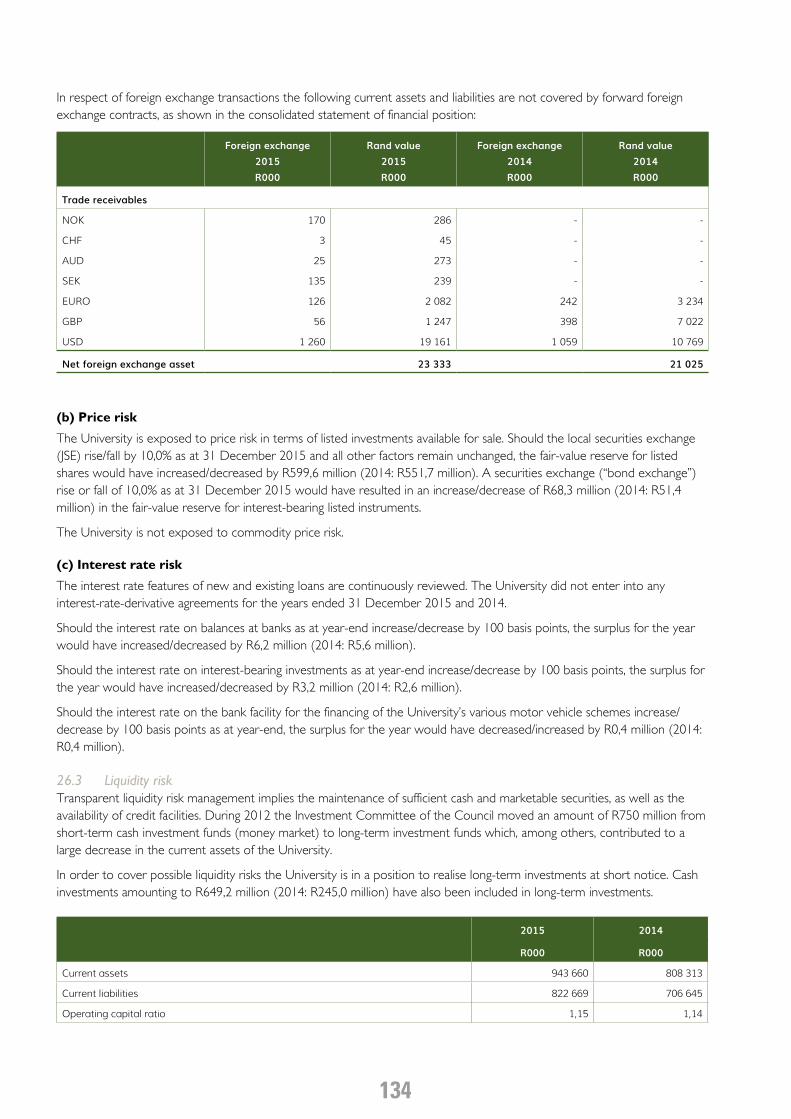
In respect of foreign exchange transactions the following current assets and liabilities are not covered by forward foreign exchange contracts, as shown in the consolidated statement of financial position:
Foreign exchange2015R000
Rand value2015R000
Foreign exchange 2014R000
Rand value2014R000
Trade receivables
NOK 170 286 - -
CHF 3 45 - -
AUD 25 273 - -
SEK 135 239 - -
EURO 126 2 082 242 3 234
GBP 56 1 247 398 7 022
USD 1 260 19 161 1 059 10 769
Net foreign exchange asset 23 333 21 025
(b) Price risk
The University is exposed to price risk in terms of listed investments available for sale. Should the local securities exchange (JSE) rise/fall by 10,0% as at 31 December 2015 and all other factors remain unchanged, the fair-value reserve for listed shares would have increased/decreased by R599,6 million (2014: R551,7 million). A securities exchange (“bond exchange”) rise or fall of 10,0% as at 31 December 2015 would have resulted in an increase/decrease of R68,3 million (2014: R51,4 million) in the fair-value reserve for interest-bearing listed instruments.
The University is not exposed to commodity price risk.
(c) Interest rate risk
The interest rate features of new and existing loans are continuously reviewed. The University did not enter into any interest-rate-derivative agreements for the years ended 31 December 2015 and 2014.
Should the interest rate on balances at banks as at year-end increase/decrease by 100 basis points, the surplus for the year would have increased/decreased by R6,2 million (2014: R5,6 million).
Should the interest rate on interest-bearing investments as at year-end increase/decrease by 100 basis points, the surplus for the year would have increased/decreased by R3,2 million (2014: R2,6 million).
Should the interest rate on the bank facility for the financing of the University’s various motor vehicle schemes increase/decrease by 100 basis points as at year-end, the surplus for the year would have decreased/increased by R0,4 million (2014: R0,4 million).
26.3 Liquidity riskTransparent liquidity risk management implies the maintenance of sufficient cash and marketable securities, as well as the availability of credit facilities. During 2012 the Investment Committee of the Council moved an amount of R750 million from short-term cash investment funds (money market) to long-term investment funds which, among others, contributed to a large decrease in the current assets of the University.
In order to cover possible liquidity risks the University is in a position to realise long-term investments at short notice. Cash investments amounting to R649,2 million (2014: R245,0 million) have also been included in long-term investments.
2015 2014
R000 R000
Current assets 943 660 808 313
Current liabilities 822 669 706 645
Operating capital ratio 1,15 1,14

135
26.4 Credit riskCredit risk mainly arises from outstanding student fees and student loans, trade receivables and cash resources. The largest component of outstanding student fees is due by former students. Trade receivables consist of a large number of clients and their creditworthiness is evaluated continuously by the University. Cash surpluses are invested only at reputable financial institutions. As at 31 December 2015 and 31 December 2014 there was no material credit risk for which adequate provision had not been made. Trade and other receivables are shown net of any allowance for credit losses.
26.5 Estimation of fair valueThe fair values of listed investments available for sale are based on quoted market prices as at year-end. The quoted market price refers to the closing price on the last date of business before year-end. The fair values of unlisted investments not traded in an active market are determined by means of applicable valuation methods, based on market conditions as at year-end. Fair values of the remainder of the financial instruments are determined on the basis of discounted-cash flow models. The nominal values of trade and other receivables and payables and interest-bearing borrowings less impairments and allowances for credit losses are deemed as their fair values. Short-term debt instruments represent endowment funds where the donor may determine the application and time of application, and are measured at fair value.
Since 1 January 2009 Stellenbosch University has applied the adjustment to IFRS 7 for financial instruments shown at fair value in the statement of financial position. This adjustment requires that fair-value measurements are disclosed in accordance with the hierarchy below:
Level 1 Quoted prices in terms of active markets for identical assets and liabilities.
Level 2 Inputs other than quoted prices obtained directly (prices) or indirectly (derived from prices).
Level 3 Inputs for assets and liabilities not based on available market data.
Assets as at 31 December 2015 shown at fair value:
Level 1 Level 2 Level 3 Total
R000 R000 R000 R000
Government bonds 682 959 - - 682 959
Shares
- Listed shares 5 996 293 - - 5 996 293
- Unlisted shares - 3 555 - 3 555
Fixed deposits 326 415 - - 326 415
Other 674 886 - - 674 886
7 680 553 3 555 - 7 684 108
The fair value of listed investments, government bonds, fixed deposits and other investments is based on current market prices. Other investments mainly consist of cash instruments forming part of the University’s long-term investment pool. The University determines the fair value of unlisted investments and investments for which there are not an active market by making use of relevant valuation techniques. As at 31 December 2014 government bonds, listed shares, fixed deposits and other investments were classified as level 1 and unlisted shares as level 2.
The fair value of financial instruments not traded on the securities exchange (“bond exchange”) is determined by means of relevant valuation techniques. These techniques mainly take into account available market data. The use of entity-specific estimates is limited. Should inputs comprise available market data only, the instrument is shown at level 2. Specific valuation techniques include the use of quoted or dealer prices of similar instruments, taking risk factors into account.
Should any of the inputs not be based on available market data, the item is shown at level 3.
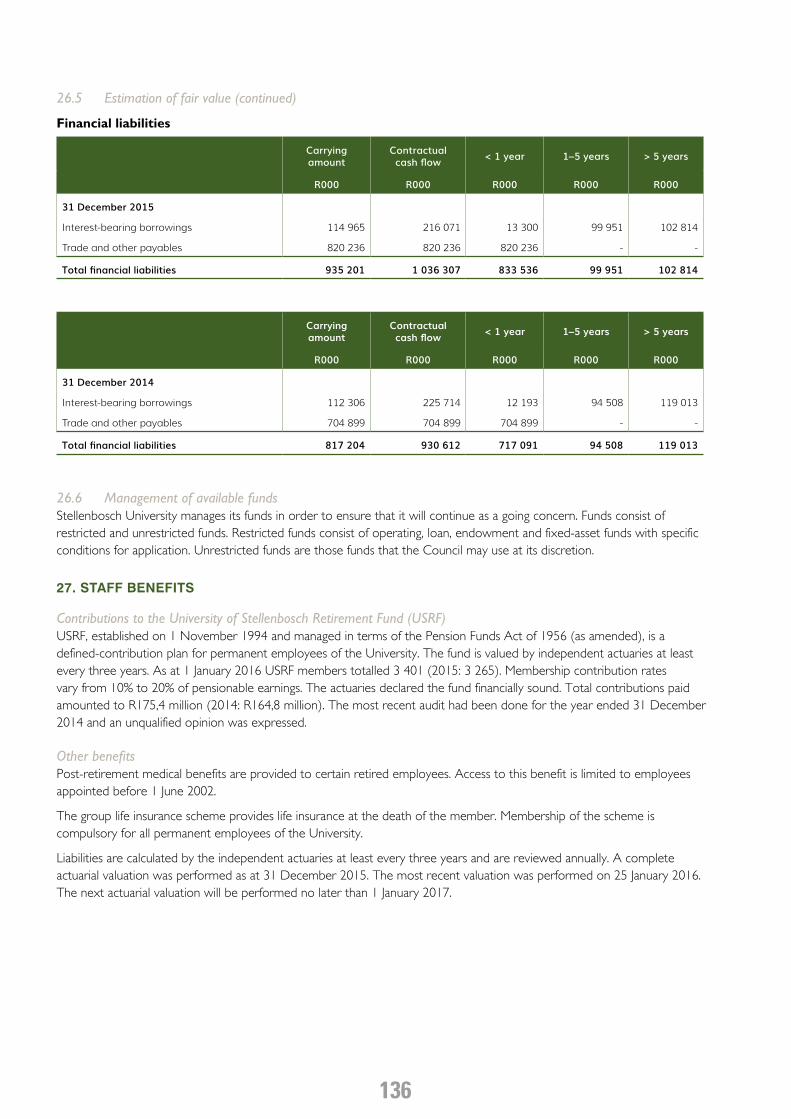
136
26.5 Estimation of fair value (continued)
Financial liabilities
Carrying amount
Contractual cash flow < 1 year 1–5 years > 5 years
R000 R000 R000 R000 R000
31 December 2015
Interest-bearing borrowings 114 965 216 071 13 300 99 951 102 814
Trade and other payables 820 236 820 236 820 236 - -
Total financial liabilities 935 201 1 036 307 833 536 99 951 102 814
Carrying amount
Contractual cash flow < 1 year 1–5 years > 5 years
R000 R000 R000 R000 R000
31 December 2014
Interest-bearing borrowings 112 306 225 714 12 193 94 508 119 013
Trade and other payables 704 899 704 899 704 899 - -
Total financial liabilities 817 204 930 612 717 091 94 508 119 013
26.6 Management of available fundsStellenbosch University manages its funds in order to ensure that it will continue as a going concern. Funds consist of restricted and unrestricted funds. Restricted funds consist of operating, loan, endowment and fixed-asset funds with specific conditions for application. Unrestricted funds are those funds that the Council may use at its discretion.
27. STAFF BENEFITS
Contributions to the University of Stellenbosch Retirement Fund (USRF)USRF, established on 1 November 1994 and managed in terms of the Pension Funds Act of 1956 (as amended), is a defined-contribution plan for permanent employees of the University. The fund is valued by independent actuaries at least every three years. As at 1 January 2016 USRF members totalled 3 401 (2015: 3 265). Membership contribution rates vary from 10% to 20% of pensionable earnings. The actuaries declared the fund financially sound. Total contributions paid amounted to R175,4 million (2014: R164,8 million). The most recent audit had been done for the year ended 31 December 2014 and an unqualified opinion was expressed.
Other benefits Post-retirement medical benefits are provided to certain retired employees. Access to this benefit is limited to employees appointed before 1 June 2002.
The group life insurance scheme provides life insurance at the death of the member. Membership of the scheme is compulsory for all permanent employees of the University.
Liabilities are calculated by the independent actuaries at least every three years and are reviewed annually. A complete actuarial valuation was performed as at 31 December 2015. The most recent valuation was performed on 25 January 2016. The next actuarial valuation will be performed no later than 1 January 2017.
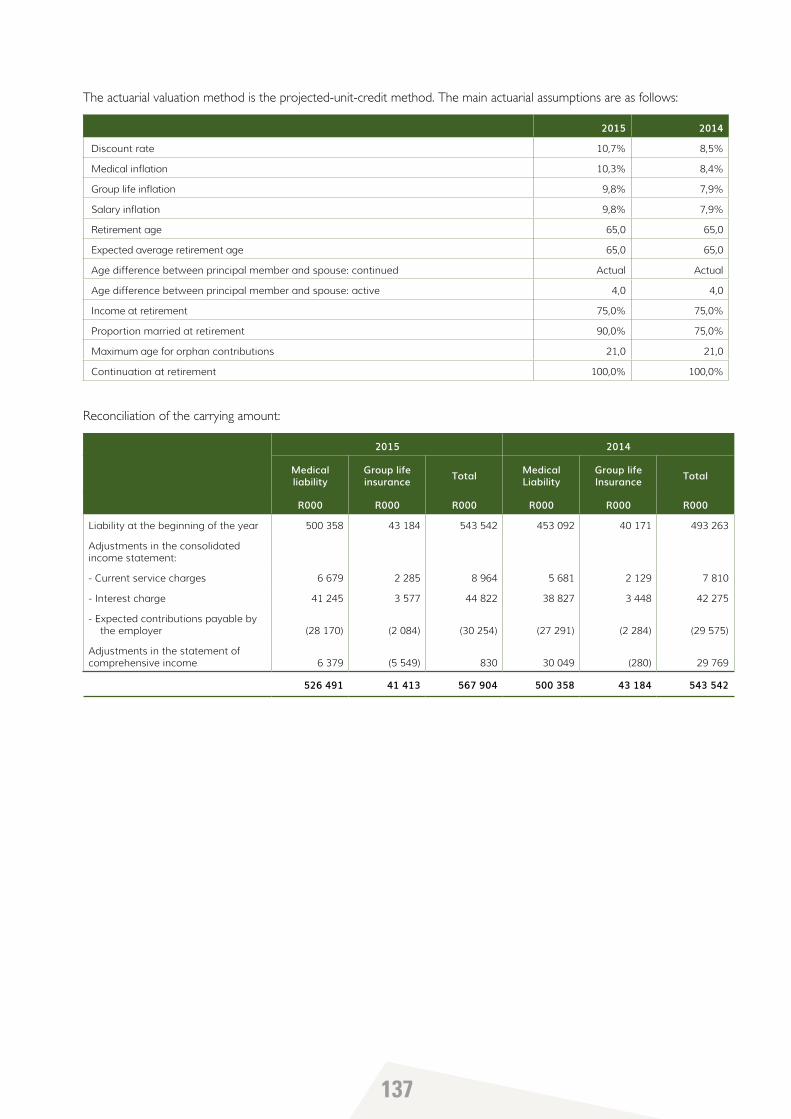
137
The actuarial valuation method is the projected-unit-credit method. The main actuarial assumptions are as follows:
2015 2014
Discount rate 10,7% 8,5%
Medical inflation 10,3% 8,4%
Group life inflation 9,8% 7,9%
Salary inflation 9,8% 7,9%
Retirement age 65,0 65,0
Expected average retirement age 65,0 65,0
Age difference between principal member and spouse: continued Actual Actual
Age difference between principal member and spouse: active 4,0 4,0
Income at retirement 75,0% 75,0%
Proportion married at retirement 90,0% 75,0%
Maximum age for orphan contributions 21,0 21,0
Continuation at retirement 100,0% 100,0%
Reconciliation of the carrying amount:
2015 2014
Medical liability
Group life insurance Total Medical
LiabilityGroup life Insurance Total
R000 R000 R000 R000 R000 R000
Liability at the beginning of the year 500 358 43 184 543 542 453 092 40 171 493 263
Adjustments in the consolidated income statement:
- Current service charges 6 679 2 285 8 964 5 681 2 129 7 810
- Interest charge 41 245 3 577 44 822 38 827 3 448 42 275
- Expected contributions payable by the employer (28 170) (2 084) (30 254) (27 291) (2 284) (29 575)
Adjustments in the statement of comprehensive income 6 379 (5 549) 830 30 049 (280) 29 769
526 491 41 413 567 904 500 358 43 184 543 542
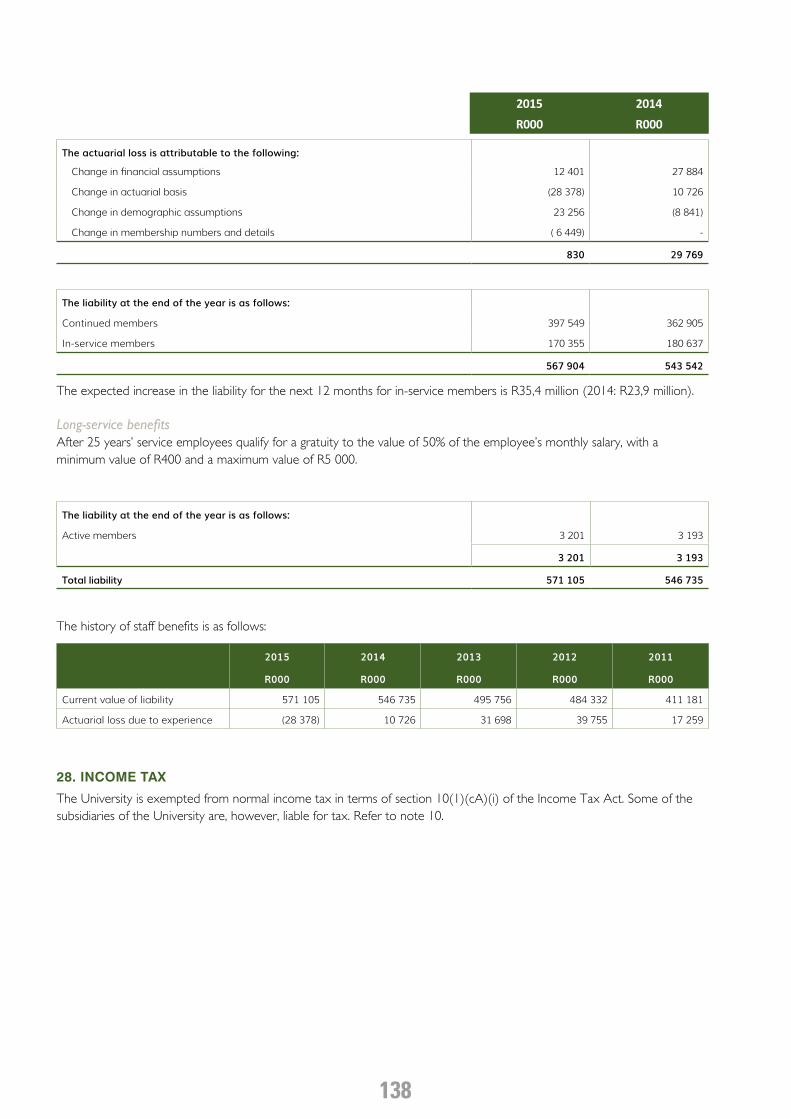
138
2015 2014R000 R000
The actuarial loss is attributable to the following:
Change in financial assumptions 12 401 27 884
Change in actuarial basis (28 378) 10 726
Change in demographic assumptions 23 256 (8 841)
Change in membership numbers and details ( 6 449) -
830 29 769
The liability at the end of the year is as follows:
Continued members 397 549 362 905
In-service members 170 355 180 637
567 904 543 542
The expected increase in the liability for the next 12 months for in-service members is R35,4 million (2014: R23,9 million).
Long-service benefitsAfter 25 years’ service employees qualify for a gratuity to the value of 50% of the employee’s monthly salary, with a minimum value of R400 and a maximum value of R5 000.
The liability at the end of the year is as follows:
Active members 3 201 3 193
3 201 3 193
Total liability 571 105 546 735
The history of staff benefits is as follows:
2015 2014 2013 2012 2011
R000 R000 R000 R000 R000
Current value of liability 571 105 546 735 495 756 484 332 411 181
Actuarial loss due to experience (28 378) 10 726 31 698 39 755 17 259
28. INCOME TAX
The University is exempted from normal income tax in terms of section 10(1)(cA)(i) of the Income Tax Act. Some of the subsidiaries of the University are, however, liable for tax. Refer to note 10.
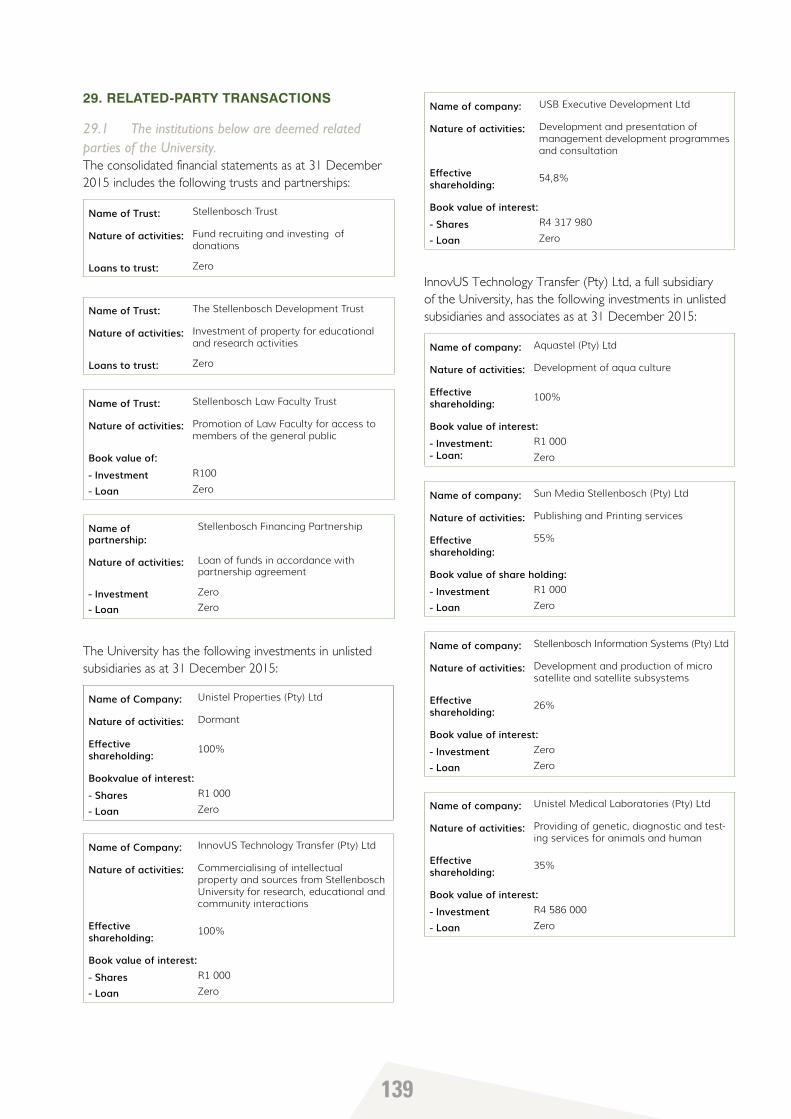
139
29. RELATED-PARTY TRANSACTIONS
29.1 The institutions below are deemed related parties of the University.The consolidated financial statements as at 31 December 2015 includes the following trusts and partnerships:
Name of Trust: Stellenbosch Trust
Nature of activities: Fund recruiting and investing of donations
Loans to trust: Zero
Name of Trust: The Stellenbosch Development Trust
Nature of activities: Investment of property for educational and research activities
Loans to trust: Zero
Name of Trust: Stellenbosch Law Faculty Trust
Nature of activities: Promotion of Law Faculty for access to members of the general public
Book value of:- Investment- Loan
R100
Zero
Name of partnership:
Stellenbosch Financing Partnership
Nature of activities: Loan of funds in accordance with partnership agreement
- Investment- Loan
Zero
Zero
The University has the following investments in unlisted subsidiaries as at 31 December 2015:
Name of Company: Unistel Properties (Pty) Ltd
Nature of activities: Dormant
Effective shareholding: 100%
Bookvalue of interest:- Shares- Loan
R1 000
Zero
Name of Company: InnovUS Technology Transfer (Pty) Ltd
Nature of activities: Commercialising of intellectual property and sources from Stellenbosch University for research, educational and community interactions
Effective shareholding: 100%
Book value of interest:- Shares- Loan
R1 000
Zero
Name of company: USB Executive Development Ltd
Nature of activities: Development and presentation of management development programmes and consultation
Effective shareholding: 54,8%
Book value of interest:- Shares- Loan
R4 317 980
Zero
InnovUS Technology Transfer (Pty) Ltd, a full subsidiary of the University, has the following investments in unlisted subsidiaries and associates as at 31 December 2015:
Name of company: Aquastel (Pty) Ltd
Nature of activities: Development of aqua culture
Effective shareholding: 100%
Book value of interest:- Investment: - Loan:
R1 000
Zero
Name of company: Sun Media Stellenbosch (Pty) Ltd
Nature of activities: Publishing and Printing services
Effective shareholding:
55%
Book value of share holding:- Investment- Loan
R1 000
Zero
Name of company: Stellenbosch Information Systems (Pty) Ltd
Nature of activities: Development and production of micro satellite and satellite subsystems
Effective shareholding: 26%
Book value of interest:- Investment- Loan
Zero
Zero
Name of company: Unistel Medical Laboratories (Pty) Ltd
Nature of activities: Providing of genetic, diagnostic and test-ing services for animals and human
Effective shareholding: 35%
Book value of interest: - Investment- Loan
R4 586 000
Zero
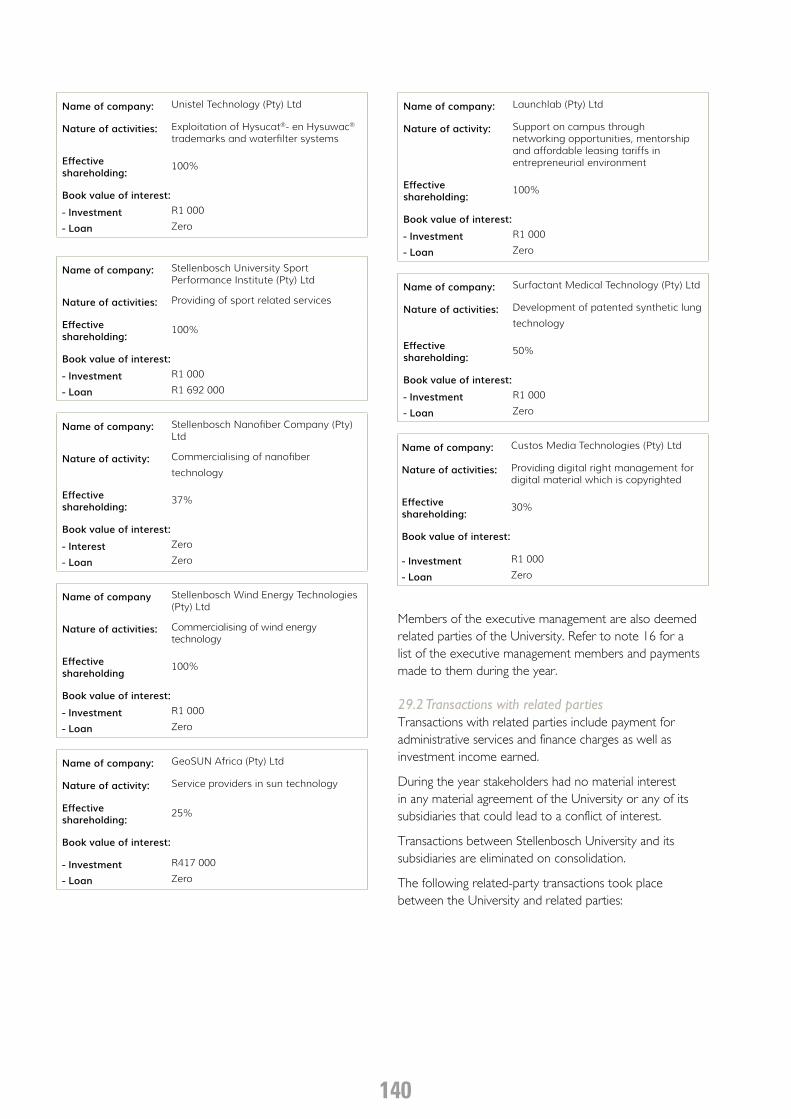
140
Name of company: Unistel Technology (Pty) Ltd
Nature of activities: Exploitation of Hysucat®- en Hysuwac®
trademarks and waterfilter systems
Effective shareholding: 100%
Book value of interest:- Investment- Loan
R1 000
Zero
Name of company: Stellenbosch University Sport Performance Institute (Pty) Ltd
Nature of activities: Providing of sport related services
Effective shareholding: 100%
Book value of interest: - Investment- Loan
R1 000
R1 692 000
Name of company: Stellenbosch Nanofiber Company (Pty) Ltd
Nature of activity: Commercialising of nanofiber
technology
Effective shareholding: 37%
Book value of interest:- Interest- Loan
Zero
Zero
Name of company Stellenbosch Wind Energy Technologies (Pty) Ltd
Nature of activities: Commercialising of wind energy technology
Effective shareholding 100%
Book value of interest:- Investment- Loan
R1 000
Zero
Name of company: GeoSUN Africa (Pty) Ltd
Nature of activity: Service providers in sun technology
Effective shareholding: 25%
Book value of interest:
- Investment- Loan
R417 000
Zero
Name of company: Launchlab (Pty) Ltd
Nature of activity: Support on campus through networking opportunities, mentorship and affordable leasing tariffs in entrepreneurial environment
Effective shareholding: 100%
Book value of interest: - Investment- Loan
R1 000
Zero
Name of company: Surfactant Medical Technology (Pty) Ltd
Nature of activities: Development of patented synthetic lung
technology
Effective shareholding: 50%
Book value of interest: - Investment- Loan
R1 000
Zero
Name of company: Custos Media Technologies (Pty) Ltd
Nature of activities: Providing digital right management for digital material which is copyrighted
Effective shareholding: 30%
Book value of interest:
- Investment- Loan
R1 000
Zero
Members of the executive management are also deemed related parties of the University. Refer to note 16 for a list of the executive management members and payments made to them during the year.
29.2 Transactions with related partiesTransactions with related parties include payment for administrative services and finance charges as well as investment income earned.
During the year stakeholders had no material interest in any material agreement of the University or any of its subsidiaries that could lead to a conflict of interest.
Transactions between Stellenbosch University and its subsidiaries are eliminated on consolidation.
The following related-party transactions took place between the University and related parties:

141
2015 2014R000 R000
29.2.1 Income
From subsidiaries:
Contributions received
Services
Interest
231 340
19 415
975
232 335
19 824
801
251 730 252 960
29.2.2 Expenditure
To subsidiaries:
Services
Interest
2 532
580
17 413
348
3 112 17 761
29.2.3 Amounts outstanding as at year-end
Receivable from:Subsidiaries 29 307 11 597
29 307 11 597
Payable to:Subsidiaries 4 912 1 289
4 912 1 289
29.2.4 Loans granted to related parties
Stellenbosch University Sport Performance Institute (Pty) Ltd 1 692 2 732
Unistel Technology (Pty) Ltd - 4 970
InnovUS Technology Transfer (Pty) Ltd - 2 323
1 692 10 025
The loan to Stellenbosch University Sport Performance Institute (Pty) Ltd bears interest linked to prime and has fixed terms for repayment.
The loans to Unistel Technologies (Pty) Ltd and Innovus Technology Transfer (Pty) Ltd in 2014 bore interest linked to prime and were repayable by mutual agreement.
30. CONTINGENT LIABILITY
The University guarantees a percentage of the outstanding amount on mortgage loans of qualifying employees. The maximum exposure as at year-end amounts to R135 775 (2014: R430 398).
31. COMPARATIVE BALANCES
The following adjustment was made during the current year, which also impacted the comparative balances as follows:
Where the University, in accordance with IAS 18, acts as an Agent, the bursary income, and corresponding bursary expense, are not accounted for through the income statement. Previously, both the income and corresponding expense have been recorded.
The impact is as follows:
Decrease in private donations, grants and other contracts 250 207
Decrease in operating expenses 250 207
142
GLOSSARY
Terms and definitions
A-rated researcher Researchers who are regarded as world leaders in their respective research fields.
graduate attributes In order to create sustainable hope in Africa, Stellenbosch University seeks to equip every graduate with desirable and enduring attributes in the course of his or her studies. A Stellenbosch graduate:
` has an enquiring mind (accepts responsibility for lifelong learning and the application of knowledge; thinks critically and creatively;
` is an engaged citizen at the local, regional and global level (acts accountably towards society and the environment; exercises efficient leadership; participates in a diverse, multilingual society; creates opportunities for others as a social entrepreneur);
` is a dynamic professional (applies and communicates knowledge; seizes opportunities and solves problems; innovates; uses sustainable and efficient technologies; behaves ethically); and
` is a well-rounded individual both socially and intellectually (utilises opportunities for personal growth – cultural, intellectual and in sports; seeks enriching experiences; takes informed and well-considered decisions).
blended learning A collaborative system of learning that integrates technologies such as web-based, satellite and mobile applications with face-to-face learning and teaching for greater flexibility (anytime access) and mobility (anywhere access). Blended learning enhances interaction amongst students, and between staff and students, while also improving access to resources.
designated groups People who are coloured, black and Indian (CBI).
dual-medium instruction Classes are offered bilingually in Afrikaans and English; teaching takes place at least 50% of the time in Afrikaans and the teaching and learning material is, as far as possible, in Afrikaans and in English. Modules thus presented are marked with a T specification in the University’s Calendar. Also see language specification.
flipped classroom The flipped classroom is a pedagogical model in which the typical lecture and homework elements of a course are reversed. The term is widely used to describe almost any class structure that provides prerecorded lectures followed by in-class exercises. (Educause, February 2012)
Horizon 2020 The European Union’s biggest research and innovation funding programme to promote excellent science and industrial leadership, and to tackle social challenges. Funding is made available to a variety of projects over a seven-year period – from 2014 to 2020 – generally in a framework of three to four years per project.
income stream The University’s financial capital is divided into four income or money streams, which are numbered for ease of reference. The four streams depend upon different financial inputs:
` first-stream income: state subsidy; ` second-stream income: student and accommodation fees paid by students; ` third-stream income: earned from (contract) research, investments, commercialisation and
sales; and ` fourth-stream income: philanthropic donations and bequests.

143
interpreting The class is presented entirely in either Afrikaans or English, and an interpreter simultaneously translates the lesson into the other language. The interpreter uses a headset or hand microphone, and students listen to the lecture through earphones.
knowledge and other partnerships
The University establishes relationships through formal, institutional partnerships with civil society organisations, local governments or municipalities, the Western Cape provincial government, the Western Cape Department of Health, the national departments of Defence and Military Veterans, churches (Theology), Elsenburg (AgriSciences), etc. These partnerships are usually informed by a formal memorandum of understanding.
Kuali Kuali is an open source administrative software solution for higher education institutions. It is home to software systems for financial management, research administration, student services, library management, business continuity and workflow. (www.kuali.org)
language specification In the University’s Calendar, all modules are marked with a language specification according to the University’s Language Policy and Plan. Further particulars at www.sun.ac.za/language
Language specification Characteristics
The A specification - The teaching is done mainly in Afrikaans.
(Afrikaans as the principalmedium of instruction)
- The teaching and learning materials (textbooks excluded) are in Afrikaans and English as far as possible.
The T specification - The teaching is done in Afrikaans for not less than 50% of the time. (Also referred to as dualmedium instruction.)
(Bilingual classes: 50% Englishand 50% Afrikaans)
- The teaching and learning materials (textbooks excluded) are in Afrikaans and English as far as possible.
The E specification - The teaching is done mainly in English.
(English as medium ofinstruction)
- The teaching and learning materials (textbooks excluded) are in English and in Afrikaans whenever possible.
The A&E specification Teaching of separate classes that are presented entirely in Afrikaans or entirely in English. Also called parallel-medium instruction.
(Separate ‘streams’ in Afrikaansand in English)
A+i Classes presented in Afrikaans are interpreted simultaneously to English and classes presented in English are interpreted to Afrikaans. See “interpreting”.
E+i
(Classes interpreted to Afrikaansor English)
module A module is a set of classes or lectures, seminars or practicals forming a unit within a subject.
parallel-medium instruction Instruction is offered in separate classes in Afrikaans and in English. Modules offered in this way are marked with an A&E specification in the University’s Calendar.
postgraduate bachelor’s degrees Bachelor’s degrees which may be taken as second bachelor’s qualifications, e.g. BPhil and the two- and three-year LLB degrees. This excludes Bachelor Honours degrees.
programme A combination of modules making up a curriculum for a degree qualification, for example BA, BEd, BEng, BAcc, BSc. Also known as learning programme, instructional programme or study programme. We differentiate between undergraduate programmes – the first university qualification in a certain field of study – and postgraduate programmes – programmes that follow on the first qualification, for instance postgraduate diploma, honours, master’s and doctorate. We also differentiate between diploma programmes and certificate programmes.
144
society-centred scholarship A scientific and societal approach to social impact, utilising transdisciplinary collaborative methodologies to build capacity.
Technology Innovation Agency TIA is a national public entity, funded by the Deaprtment of Science and Technology, that serves as the key institutional intervention to bridge the innovation chasm between research and development from higher education institutions, science councils, public entities, and private sector, and commercialisation.
Vision 2030 The University, as a 21st century institution, plays a leading role in the creation of an advanced society. Our goal of inclusivity focuses on the talents and contributions of individuals; innovation deals with the need specifically to address the challenges of a more sustainable future creatively; the energy of students and academics is directed at creating the future imaginatively from courageous efforts to tackle current problems and issues actively; discovery happens when theory and practice are interwoven in the education process; and the Stellenbosch experience delivers thought leaders that have a better insight into world issues, an innovative unlocking of creative abilities to solve problems, and an encouragement of meaningful action to serve society through knowledge. This all happens in a context of transforming the University to be future fit and globally competitive. (Stellenbosch University Institusional Intent and Strategy 2013–2018, page 17)