Embed Size (px)
Citation preview

Financial reporting by listed companies Spotlight on Swiss trends
September 2014
Audit. Tax. Consulting. Corporate Finance
To start a new section, hold down the apple+shift keys and click
to release this object and type the section title in the box below.
Contents
1. Executive summary 1
2. Survey objectives 2
3. Reporting the economic environment 3
4. Narrative reporting 8
5. Changes to financial statements 13
6. Goodwill and impairment 23
7. Income taxes 29
8. Pensions 34
9. Attractiveness for Swiss GAAP FER in Switzerland 42
Appendices 50
How can we help – your IFRS contacts 55
To start a new section, hold down the apple+shift keys and click
to release this object and type the section title in the box below.
We are pleased to present our annual Survey on IFRS reporting by Swiss listed groups. Now in its fifth year, we have focused our survey on those matters which most concern preparers, investors and regulators alike. The complexity of IFRS requirements and the length of associated disclosures have led to concerns about a lack of transparency in financial statements. As a result, this year our survey looked into the various components of management’s communication with investors to provide an extended review of narrative reporting. Secondly, 2013 was not a peaceful year in the world of IFRS, with many changes to pensions, consolidation and fair value measurement. We also looked at the impact of these changes on financial statements. Last but not least, our discussions with Swiss listed groups have revealed an increasing interest in Swiss GAAP FER following the conversion of certain high-profile companies to these accounting standards, and so our study includes an analysis of the impact on the financial statements of this change.
Communication with investorsNarrative reporting, comprising of press release, investor presentation and the narrative section of the annual report, is an important communication tool allowing management to share its view on the company’s performance, position and progress during the year as a complement to information provided in the financial statements. There are no specific requirements on what should be included in this commentary. In practice, the lack of guidance and differences in the complexity and size of the 10 SMI entities reviewed led to significant variability in reporting. While we noticed a certain disconnect at times between the narrative reporting and the IFRS financial statements, companies tended to be consistent in their commentary and KPIs on which they focused.
Significant changes resulting from new standardsFor most companies, 2013 was not a period of stability as companies with December year-end grappled with the adoption of new standards on accounting for investments in other entities and pensions.
IAS 19 (revised) Employee Benefits led 18 companies (60%) to present restated comparative figures. The main financial impact was a 6% average decrease in total equity reported after the restatement for companies previously applying the corridor approach. The application of the revised IAS 19 has, however, had a lower than expected impact on pension costs, with an average decrease in net results of 10%, mainly due to improving financial performance.
Following the transition, the length of the disclosures on pensions has also increased by 2 pages, from 4 pages to 6 pages on average.
One of the main drivers of change in the financial statements of the future will be the effort made by the IASB to reduce the volume of disclosures through its disclosure framework project, in a response to the concerns of preparers and investors around transparency. The first step for companies seeking to streamline is to look at the accounting policies. We saw 4 out of 10 SMI companies in our sample taking the opportunity to reduce the accounting policy notes by 20% on average.
Attractiveness of Swiss GAAP FEROver the past few years, around 15 companies listed on the SIX SWISS Exchange have switched from IFRS to Swiss GAAP FER. This development is very important with the conversion of three high profile companies in 2013, including Swatch as the first SMI company to make the change. The impact of a transition can be significant on equity and net results as well as disclosures; first-time adopters were able to reduce, the length of the financial statements by 24% on average. We noted two different approaches: some adopters included massive cuts to the disclosures, whereas other companies presented fairly similar disclosures and notes, in line with promises not to reduce transparency.
Looking aheadWhile 2013 was a relatively busy year in the world of IFRS, the coming years look set to be period of relative stability. Looking ahead, important projects such as revenues and financial instruments have been completed by the IASB in 2014, while other significant projects such as leasing remain under discussion. Although the effective dates are still several years away, companies will need to make full use of the intervening period to manage the transition to the new requirements.
Our financial reporting experts would be delighted to respond to your questions on these projects or any other topics raised in this report.
Fabien Bryois, Swiss certified accountant
Martin Welser, Swiss certified accountant
Financial reporting by listed companies Spotlight on Swiss trends 1
1. Executive summary
To start a new section, hold down the apple+shift keys and click
to release this object and type the section title in the box below.
2
2. Survey objectives
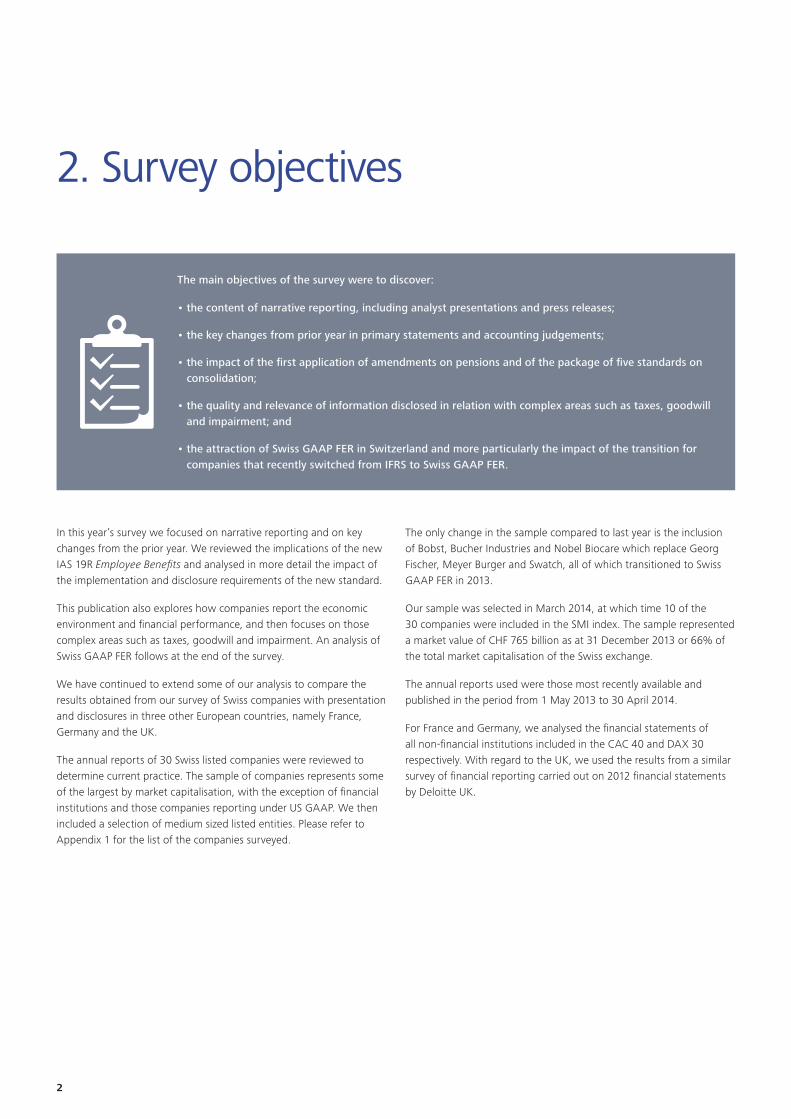
In this year’s survey we focused on narrative reporting and on key changes from the prior year. We reviewed the implications of the new IAS 19R Employee Benefits and analysed in more detail the impact of the implementation and disclosure requirements of the new standard.
This publication also explores how companies report the economic environment and financial performance, and then focuses on those complex areas such as taxes, goodwill and impairment. An analysis of Swiss GAAP FER follows at the end of the survey.
We have continued to extend some of our analysis to compare the results obtained from our survey of Swiss companies with presentation and disclosures in three other European countries, namely France, Germany and the UK.
The annual reports of 30 Swiss listed companies were reviewed to determine current practice. The sample of companies represents some of the largest by market capitalisation, with the exception of financial institutions and those companies reporting under US GAAP. We then included a selection of medium sized listed entities. Please refer to Appendix 1 for the list of the companies surveyed.
The only change in the sample compared to last year is the inclusion of Bobst, Bucher Industries and Nobel Biocare which replace Georg Fischer, Meyer Burger and Swatch, all of which transitioned to Swiss GAAP FER in 2013.
Our sample was selected in March 2014, at which time 10 of the 30 companies were included in the SMI index. The sample represented a market value of CHF 765 billion as at 31 December 2013 or 66% of the total market capitalisation of the Swiss exchange.
The annual reports used were those most recently available and published in the period from 1 May 2013 to 30 April 2014.
For France and Germany, we analysed the financial statements of all non-financial institutions included in the CAC 40 and DAX 30 respectively. With regard to the UK, we used the results from a similar survey of financial reporting carried out on 2012 financial statements by Deloitte UK.
The main objectives of the survey were to discover:
• the content of narrative reporting, including analyst presentations and press releases;
• the key changes from prior year in primary statements and accounting judgements;
• the impact of the first application of amendments on pensions and of the package of five standards on consolidation;
• the quality and relevance of information disclosed in relation with complex areas such as taxes, goodwill and impairment; and
• the attraction of Swiss GAAP FER in Switzerland and more particularly the impact of the transition for companies that recently switched from IFRS to Swiss GAAP FER.
To start a new section, hold down the apple+shift keys and click
to release this object and type the section title in the box below.
Financial reporting by listed companies Spotlight on Swiss trends 3
3. Reporting the economic environment
The economic environment in 2013In the first semester of 2013, the global economic outlook improved, reflecting the general sense of relief in financial markets and economic trouble spots around the world. However, the big worries of the recent past – the euro crisis, the US fiscal cliff and slowing growth rates in China – remained to some extent in the public eye.
Significantly, in the second semester of 2013, the economic outlook improved considerably. In particular, GDP figures show that the Swiss economy was in extremely robust health. The global economic situation also improved, boosting Swiss exports.
Swiss CFOs are even more optimistic about the economic outlook, and fears of recession remained extremely low. It was therefore widely expected that companies would comment on the positive environment they faced during the year and the impact on their business.
Integrating an analysis of the economic environment into the IFRS survey provides an interesting overview of the impact of the economic environment on company results and financial statements disclosures. The first part of this chapter will consider the economic environment from a global perspective, the consequences of which will then be analysed at the level of the companies in our survey.
GDP growth
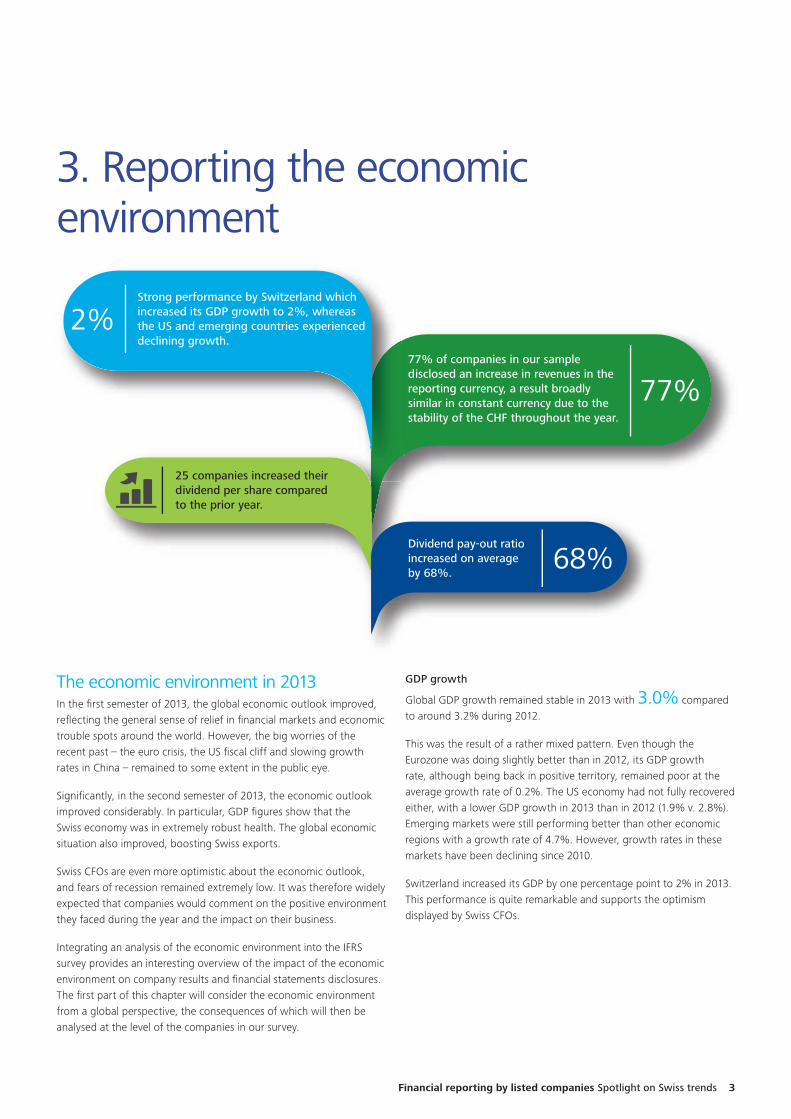
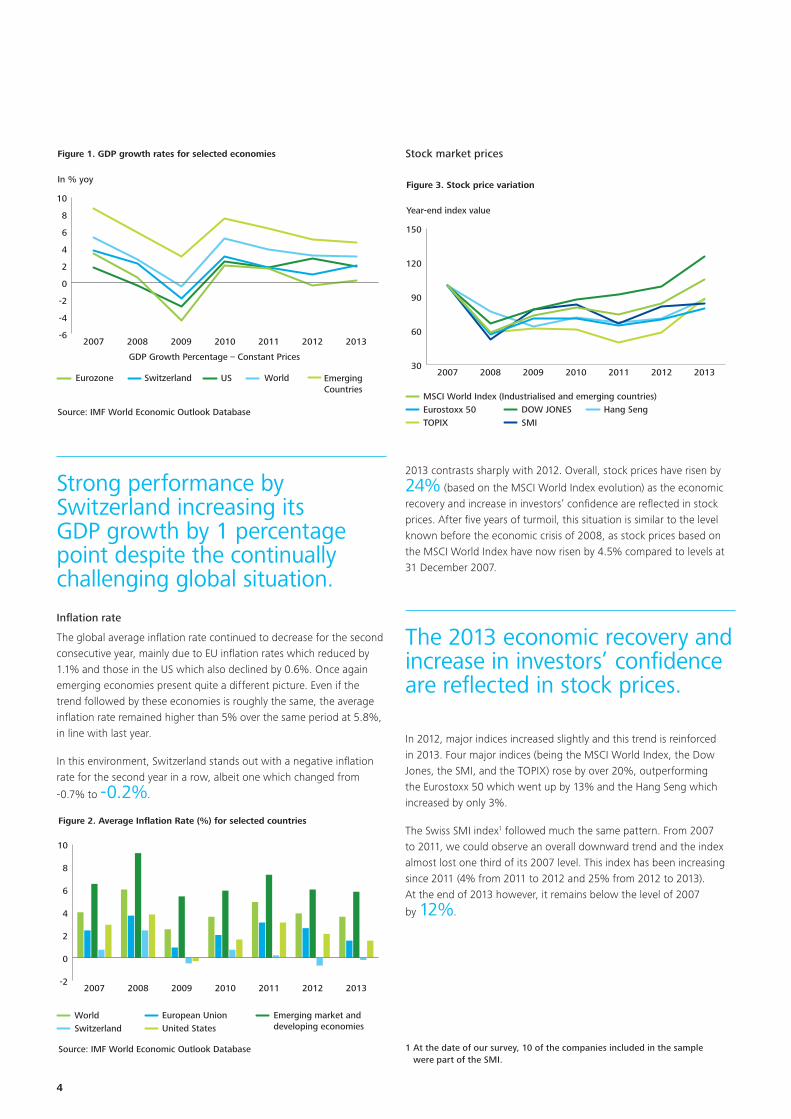
Global GDP growth remained stable in 2013 with 3.0% compared to around 3.2% during 2012.
This was the result of a rather mixed pattern. Even though the Eurozone was doing slightly better than in 2012, its GDP growth rate, although being back in positive territory, remained poor at the average growth rate of 0.2%. The US economy had not fully recovered either, with a lower GDP growth in 2013 than in 2012 (1.9% v. 2.8%). Emerging markets were still performing better than other economic regions with a growth rate of 4.7%. However, growth rates in these markets have been declining since 2010.
Switzerland increased its GDP by one percentage point to 2% in 2013. This performance is quite remarkable and supports the optimism displayed by Swiss CFOs.
25 companies increased their dividend per share compared to the prior year.
Dividend pay-out ratio increased on average by 68%.
68%
Strong performance by Switzerland which increased its GDP growth to 2%, whereas the US and emerging countries experienced declining growth.
77% of companies in our sample disclosed an increase in revenues in the reporting currency, a result broadly similar in constant currency due to the stability of the CHF throughout the year.
2%
77%
To start a new section, hold down the apple+shift keys and click
to release this object and type the section title in the box below.
4
Figure 1. GDP growth rates for selected economies
In % yoy
-6
-4
-2
0
2
4
6
8
10
2013201220112010200920082007
EmergingCountries
World
GDP Growth Percentage – Constant Prices
Source: IMF World Economic Outlook Database
USSwitzerlandEurozone
Strong performance by Switzerland increasing its GDP growth by 1 percentage point despite the continually challenging global situation.
Inflation rate
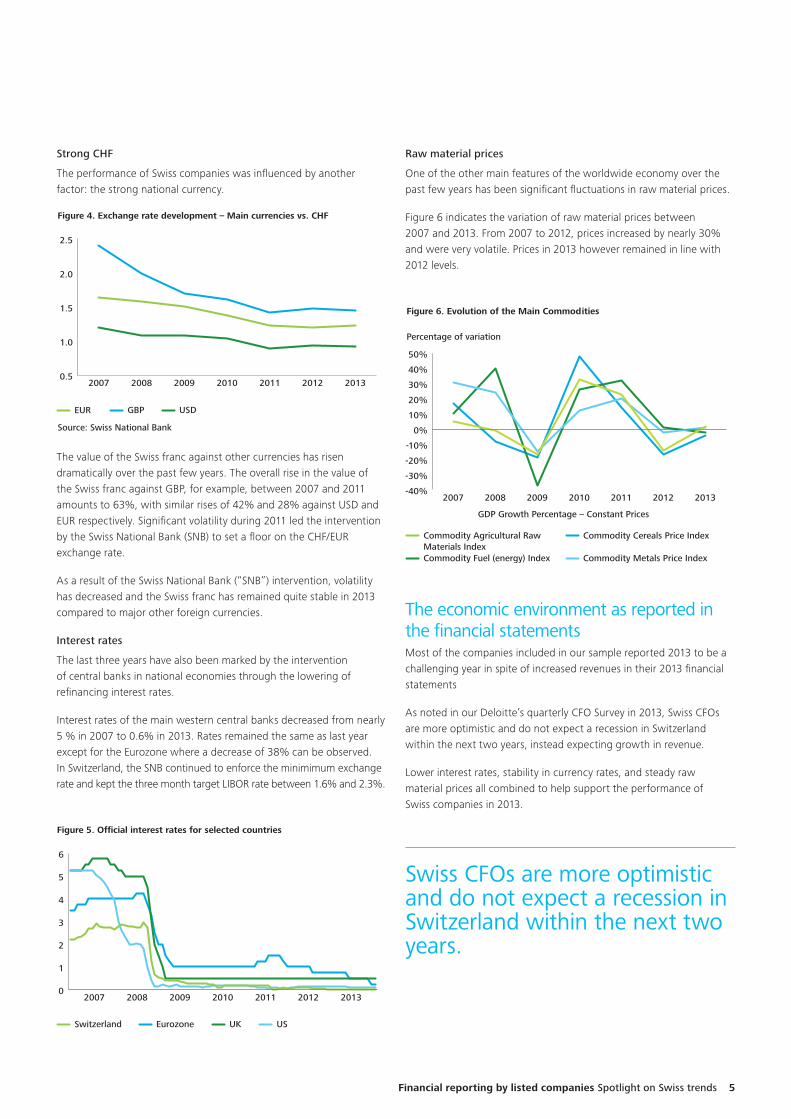
The global average inflation rate continued to decrease for the second consecutive year, mainly due to EU inflation rates which reduced by 1.1% and those in the US which also declined by 0.6%. Once again emerging economies present quite a different picture. Even if the trend followed by these economies is roughly the same, the average inflation rate remained higher than 5% over the same period at 5.8%, in line with last year.
In this environment, Switzerland stands out with a negative inflation rate for the second year in a row, albeit one which changed from
-0.7% to -0.2%.
Figure 2. Average Inflation Rate (%) for selected countries
-2
0
2
4
6
8
10
2013201220112010200920082007
World European Union
Source: IMF World Economic Outlook Database
Emerging market anddeveloping economiesSwitzerland United States
Stock market prices
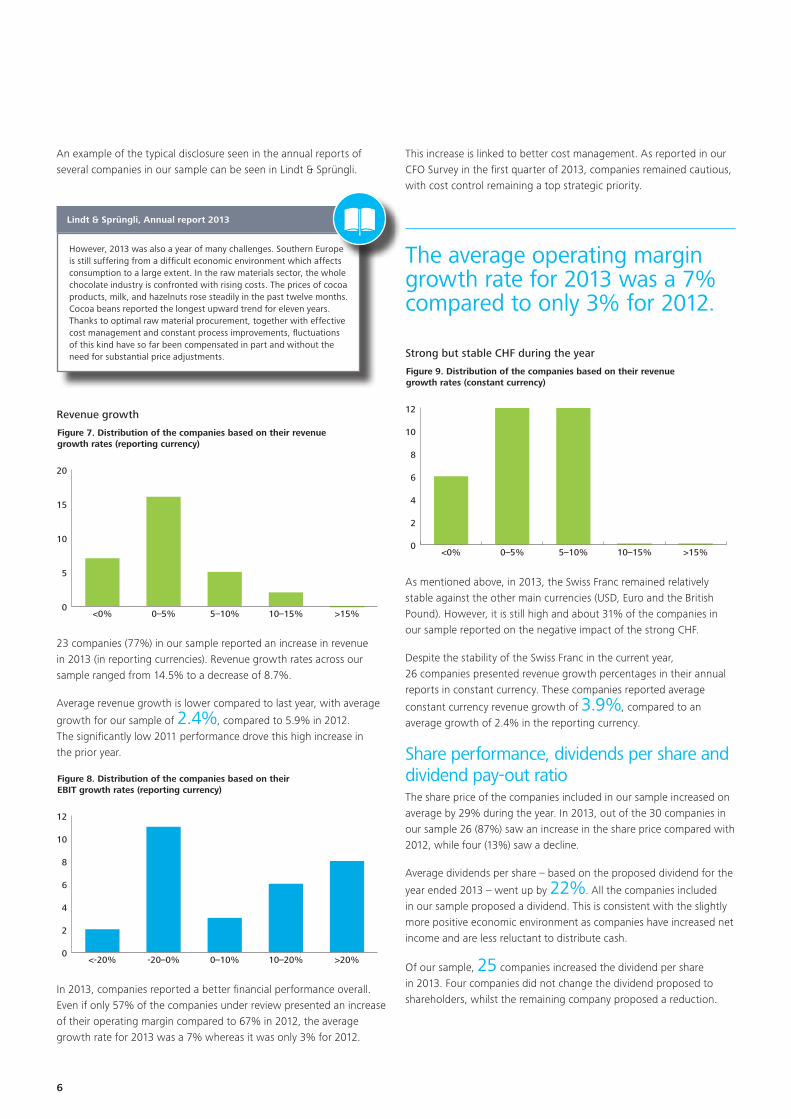
Figure 3. Stock price variation
Year-end index value
30
60
90
120
150
2013201220112010200920082007
MSCI World Index (Industrialised and emerging countries)Eurostoxx 50 DOW JONES Hang SengTOPIX SMI
2013 contrasts sharply with 2012. Overall, stock prices have risen by
24% (based on the MSCI World Index evolution) as the economic recovery and increase in investors’ confidence are reflected in stock prices. After five years of turmoil, this situation is similar to the level known before the economic crisis of 2008, as stock prices based on the MSCI World Index have now risen by 4.5% compared to levels at 31 December 2007.
The 2013 economic recovery and increase in investors’ confidence are reflected in stock prices.
In 2012, major indices increased slightly and this trend is reinforced in 2013. Four major indices (being the MSCI World Index, the Dow Jones, the SMI, and the TOPIX) rose by over 20%, outperforming the Eurostoxx 50 which went up by 13% and the Hang Seng which increased by only 3%.
The Swiss SMI index1 followed much the same pattern. From 2007 to 2011, we could observe an overall downward trend and the index almost lost one third of its 2007 level. This index has been increasing since 2011 (4% from 2011 to 2012 and 25% from 2012 to 2013). At the end of 2013 however, it remains below the level of 2007
by 12%.
1 At the date of our survey, 10 of the companies included in the sample were part of the SMI.
To start a new section, hold down the apple+shift keys and click
to release this object and type the section title in the box below.
Financial reporting by listed companies Spotlight on Swiss trends 5
Strong CHF
The performance of Swiss companies was influenced by another factor: the strong national currency.
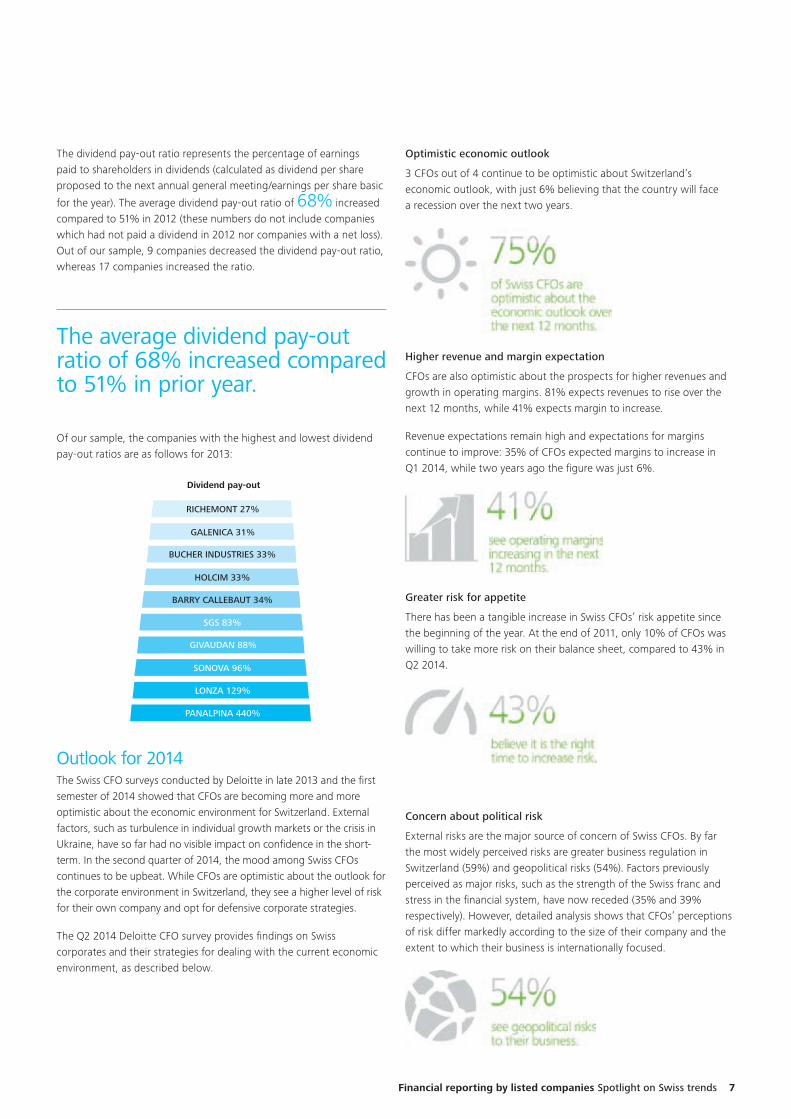
Figure 4. Exchange rate development – Main currencies vs. CHF
Source: Swiss National Bank
0.5
1.0
1.5
2.0
2.5
2013201220112010200920082007
EUR GBP USD
The value of the Swiss franc against other currencies has risen dramatically over the past few years. The overall rise in the value of the Swiss franc against GBP, for example, between 2007 and 2011 amounts to 63%, with similar rises of 42% and 28% against USD and EUR respectively. Significant volatility during 2011 led the intervention by the Swiss National Bank (SNB) to set a floor on the CHF/EUR exchange rate.
As a result of the Swiss National Bank (“SNB”) intervention, volatility has decreased and the Swiss franc has remained quite stable in 2013 compared to major other foreign currencies.
Interest rates
The last three years have also been marked by the intervention of central banks in national economies through the lowering of refinancing interest rates.
Interest rates of the main western central banks decreased from nearly 5 % in 2007 to 0.6% in 2013. Rates remained the same as last year except for the Eurozone where a decrease of 38% can be observed. In Switzerland, the SNB continued to enforce the minimimum exchange rate and kept the three month target LIBOR rate between 1.6% and 2.3%.
Raw material prices
One of the other main features of the worldwide economy over the past few years has been significant fluctuations in raw material prices.
Figure 6 indicates the variation of raw material prices between 2007 and 2013. From 2007 to 2012, prices increased by nearly 30% and were very volatile. Prices in 2013 however remained in line with 2012 levels.
Figure 5. Official interest rates for selected countries
0
1
2
3
4
5
6
Switzerland Eurozone UK US
2013201220112010200920082007
Figure 6. Evolution of the Main Commodities
Percentage of variation
-40%
-30%
-20%
-10%
0%
10%
20%
30%
40%
50%
2013201220112010200920082007
Commodity Agricultural Raw Materials Index
Commodity Cereals Price Index
Commodity Fuel (energy) Index Commodity Metals Price Index
GDP Growth Percentage – Constant Prices
The economic environment as reported in the financial statementsMost of the companies included in our sample reported 2013 to be a challenging year in spite of increased revenues in their 2013 financial statements
As noted in our Deloitte’s quarterly CFO Survey in 2013, Swiss CFOs are more optimistic and do not expect a recession in Switzerland within the next two years, instead expecting growth in revenue.
Lower interest rates, stability in currency rates, and steady raw material prices all combined to help support the performance of Swiss companies in 2013.
Swiss CFOs are more optimistic and do not expect a recession in Switzerland within the next two years.
To start a new section, hold down the apple+shift keys and click
to release this object and type the section title in the box below.
6
An example of the typical disclosure seen in the annual reports of several companies in our sample can be seen in Lindt & Sprüngli.
This increase is linked to better cost management. As reported in our CFO Survey in the first quarter of 2013, companies remained cautious, with cost control remaining a top strategic priority.
The average operating margin growth rate for 2013 was a 7% compared to only 3% for 2012.
Strong but stable CHF during the year
Figure 9. Distribution of the companies based on their revenue growth rates (constant currency)
0
2
4
6
8
10
12
>15%10–15%5–10%0–5%<0%
As mentioned above, in 2013, the Swiss Franc remained relatively stable against the other main currencies (USD, Euro and the British Pound). However, it is still high and about 31% of the companies in our sample reported on the negative impact of the strong CHF.
Despite the stability of the Swiss Franc in the current year, 26 companies presented revenue growth percentages in their annual reports in constant currency. These companies reported average
constant currency revenue growth of 3.9%, compared to an average growth of 2.4% in the reporting currency.
Share performance, dividends per share and dividend pay-out ratioThe share price of the companies included in our sample increased on average by 29% during the year. In 2013, out of the 30 companies in our sample 26 (87%) saw an increase in the share price compared with 2012, while four (13%) saw a decline.
Average dividends per share – based on the proposed dividend for the
year ended 2013 – went up by 22%. All the companies included in our sample proposed a dividend. This is consistent with the slightly more positive economic environment as companies have increased net income and are less reluctant to distribute cash.
Of our sample, 25 companies increased the dividend per share in 2013. Four companies did not change the dividend proposed to shareholders, whilst the remaining company proposed a reduction.
However, 2013 was also a year of many challenges. Southern Europe is still suffering from a difficult economic environment which affects consumption to a large extent. In the raw materials sector, the whole chocolate industry is confronted with rising costs. The prices of cocoa products, milk, and hazelnuts rose steadily in the past twelve months. Cocoa beans reported the longest upward trend for eleven years. Thanks to optimal raw material procurement, together with effective cost management and constant process improvements, fluctuations of this kind have so far been compensated in part and without the need for substantial price adjustments.
Lindt & Sprüngli, Annual report 2013
Revenue growth
Figure 7. Distribution of the companies based on their revenue growth rates (reporting currency)
0
5
10
15
20
>15%10–15%5–10%0–5%<0%
23 companies (77%) in our sample reported an increase in revenue in 2013 (in reporting currencies). Revenue growth rates across our sample ranged from 14.5% to a decrease of 8.7%.
Average revenue growth is lower compared to last year, with average
growth for our sample of 2.4%, compared to 5.9% in 2012. The significantly low 2011 performance drove this high increase in the prior year.
Figure 8. Distribution of the companies based on their EBIT growth rates (reporting currency)
0
2
4
6
8
10
12
>20%10–20%0–10%-20–0%<-20%
In 2013, companies reported a better financial performance overall. Even if only 57% of the companies under review presented an increase of their operating margin compared to 67% in 2012, the average growth rate for 2013 was a 7% whereas it was only 3% for 2012.
To start a new section, hold down the apple+shift keys and click
to release this object and type the section title in the box below.
Financial reporting by listed companies Spotlight on Swiss trends 7
The dividend pay-out ratio represents the percentage of earnings paid to shareholders in dividends (calculated as dividend per share proposed to the next annual general meeting/earnings per share basic
for the year). The average dividend pay-out ratio of 68% increased compared to 51% in 2012 (these numbers do not include companies which had not paid a dividend in 2012 nor companies with a net loss). Out of our sample, 9 companies decreased the dividend pay-out ratio, whereas 17 companies increased the ratio.
The average dividend pay-out ratio of 68% increased compared to 51% in prior year.
Of our sample, the companies with the highest and lowest dividend pay-out ratios are as follows for 2013:
Dividend pay-out
PANALPINA 440%
LONZA 129%
SONOVA 96%
GIVAUDAN 88%
SGS 83%
RICHEMONT 27%
GALENICA 31%
BUCHER INDUSTRIES 33%
HOLCIM 33%
BARRY CALLEBAUT 34%
Outlook for 2014The Swiss CFO surveys conducted by Deloitte in late 2013 and the first semester of 2014 showed that CFOs are becoming more and more optimistic about the economic environment for Switzerland. External factors, such as turbulence in individual growth markets or the crisis in Ukraine, have so far had no visible impact on confidence in the short-term. In the second quarter of 2014, the mood among Swiss CFOs continues to be upbeat. While CFOs are optimistic about the outlook for the corporate environment in Switzerland, they see a higher level of risk for their own company and opt for defensive corporate strategies.
The Q2 2014 Deloitte CFO survey provides findings on Swiss corporates and their strategies for dealing with the current economic environment, as described below.
Optimistic economic outlook
3 CFOs out of 4 continue to be optimistic about Switzerland’s economic outlook, with just 6% believing that the country will face a recession over the next two years.
Higher revenue and margin expectation
CFOs are also optimistic about the prospects for higher revenues and growth in operating margins. 81% expects revenues to rise over the next 12 months, while 41% expects margin to increase.
Revenue expectations remain high and expectations for margins continue to improve: 35% of CFOs expected margins to increase in Q1 2014, while two years ago the figure was just 6%.
Greater risk for appetite
There has been a tangible increase in Swiss CFOs’ risk appetite since the beginning of the year. At the end of 2011, only 10% of CFOs was willing to take more risk on their balance sheet, compared to 43% in Q2 2014.
Concern about political risk
External risks are the major source of concern of Swiss CFOs. By far the most widely perceived risks are greater business regulation in Switzerland (59%) and geopolitical risks (54%). Factors previously perceived as major risks, such as the strength of the Swiss franc and stress in the financial system, have now receded (35% and 39% respectively). However, detailed analysis shows that CFOs’ perceptions of risk differ markedly according to the size of their company and the extent to which their business is internationally focused.
To start a new section, hold down the apple+shift keys and click
to release this object and type the section title in the box below.
8
4. Narrative reporting
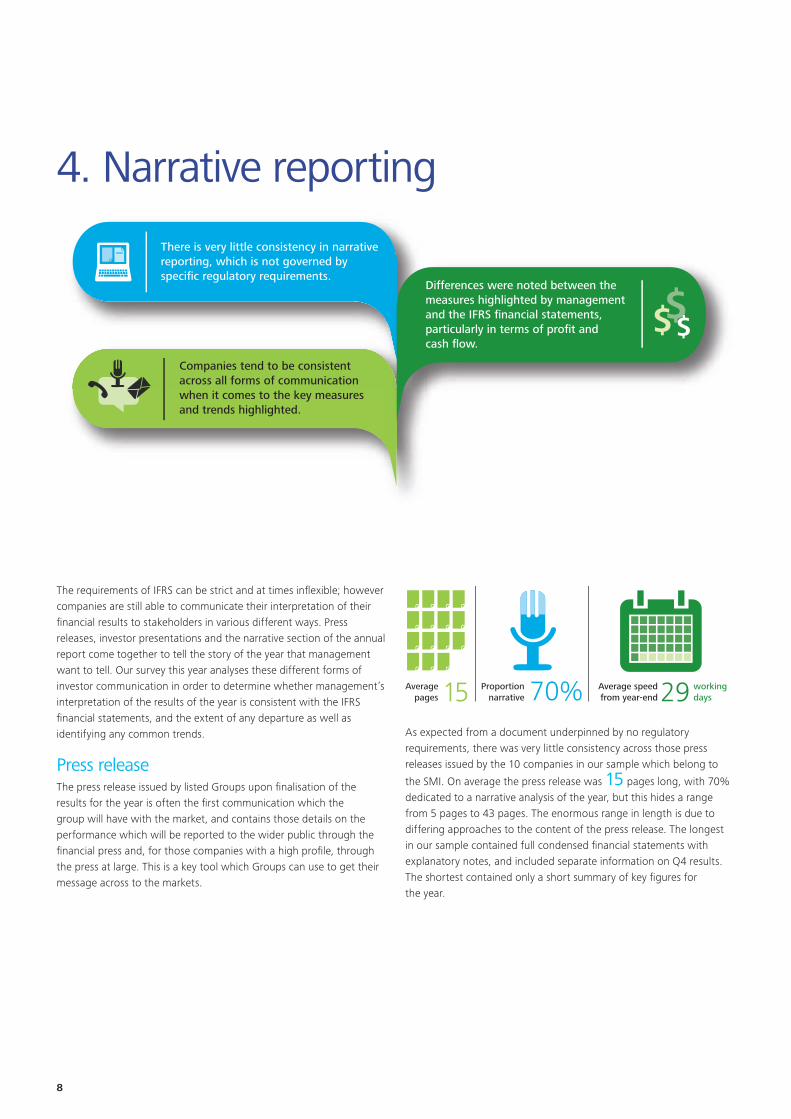
The requirements of IFRS can be strict and at times inflexible; however companies are still able to communicate their interpretation of their financial results to stakeholders in various different ways. Press releases, investor presentations and the narrative section of the annual report come together to tell the story of the year that management want to tell. Our survey this year analyses these different forms of investor communication in order to determine whether management’s interpretation of the results of the year is consistent with the IFRS financial statements, and the extent of any departure as well as identifying any common trends.
Press releaseThe press release issued by listed Groups upon finalisation of the results for the year is often the first communication which the group will have with the market, and contains those details on the performance which will be reported to the wider public through the financial press and, for those companies with a high profile, through the press at large. This is a key tool which Groups can use to get their message across to the markets.
Averagepages
Proportionnarrative
Average speedfrom year-end
workingdays2970%
As expected from a document underpinned by no regulatory requirements, there was very little consistency across those press releases issued by the 10 companies in our sample which belong to
the SMI. On average the press release was 15 pages long, with 70% dedicated to a narrative analysis of the year, but this hides a range from 5 pages to 43 pages. The enormous range in length is due to differing approaches to the content of the press release. The longest in our sample contained full condensed financial statements with explanatory notes, and included separate information on Q4 results. The shortest contained only a short summary of key figures for the year.
Companies tend to be consistent across all forms of communication when it comes to the key measures and trends highlighted.
There is very little consistency in narrative reporting, which is not governed by specific regulatory requirements.
Differences were noted between the measures highlighted by management and the IFRS financial statements, particularly in terms of profit and cash flow.
$$$
To start a new section, hold down the apple+shift keys and click
to release this object and type the section title in the box below.
Financial reporting by listed companies Spotlight on Swiss trends 9
Speed of reporting
The earliest press release was issued to the market 15 working days after year-end, with the slowest 50 days. Only one company however issued the press release before the consolidated financial statements had been formally approved by the Board of Directors. It is therefore reasonable to conclude that Groups are waiting until the financial statements are finalised before making any public announcements. Only one out of the 10 SMI companies in our sample released preliminary figures to the market in advance of the main press release – this was also the company with the slowest reporting to the market.
Contents
Despite this, there is an element of consistency in the topics covered by the press releases. All of the companies provided a summary of the consolidated results for the year, together with the outlook for 2014. Seven companies also provided explanations regarding the performance of the individual segments during the period, although one company provided some financial figures for the segments without any accompanying narrative. Two companies also gave a detailed analysis of the fourth quarter trading results.
Key measures highlighted in the press release narrative
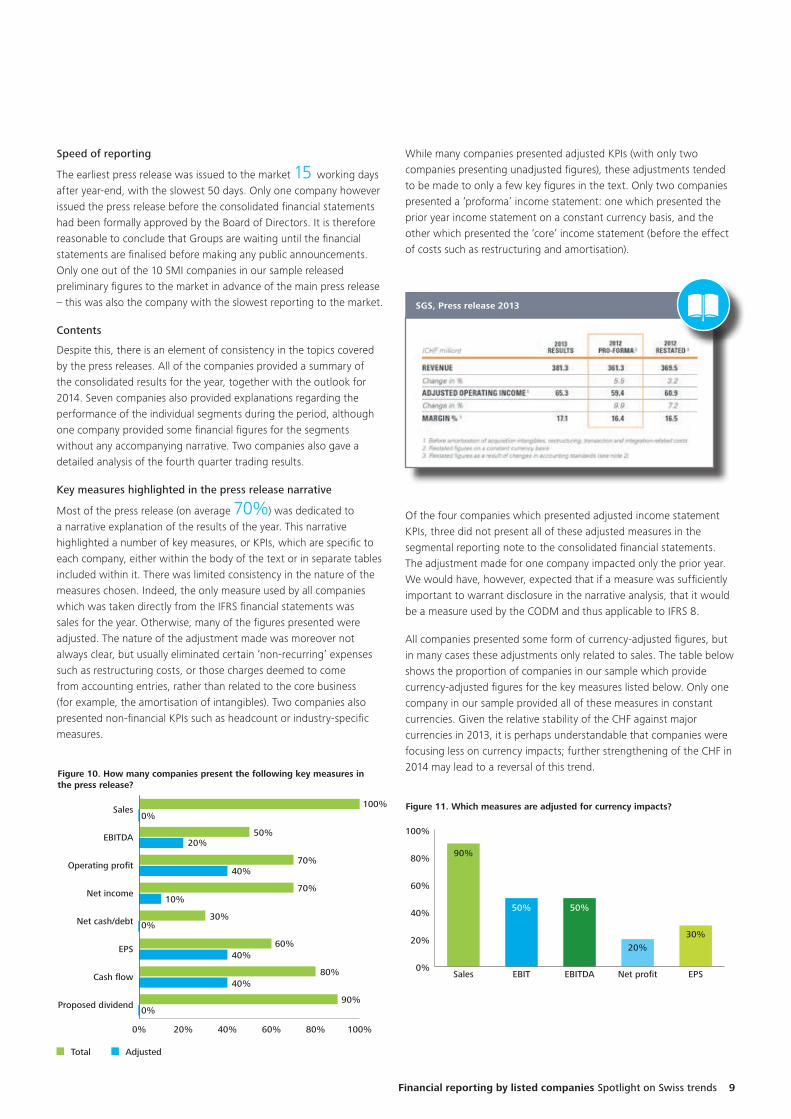
Most of the press release (on average 70%) was dedicated to a narrative explanation of the results of the year. This narrative highlighted a number of key measures, or KPIs, which are specific to each company, either within the body of the text or in separate tables included within it. There was limited consistency in the nature of the measures chosen. Indeed, the only measure used by all companies which was taken directly from the IFRS financial statements was sales for the year. Otherwise, many of the figures presented were adjusted. The nature of the adjustment made was moreover not always clear, but usually eliminated certain ‘non-recurring’ expenses such as restructuring costs, or those charges deemed to come from accounting entries, rather than related to the core business (for example, the amortisation of intangibles). Two companies also presented non-financial KPIs such as headcount or industry-specific measures.
Figure 10. How many companies present the following key measures in the press release?
0% 20% 40% 60% 80% 100%
Proposed dividend
Cash flow
EPS
Net cash/debt
Net income
Operating profit
EBITDA
Sales
90%
80%
60%
30%
70%
70%
50%
100%
0%
40%
40%
0%
10%
40%
20%
0%
Total Adjusted
While many companies presented adjusted KPIs (with only two companies presenting unadjusted figures), these adjustments tended to be made to only a few key figures in the text. Only two companies presented a ‘proforma’ income statement: one which presented the prior year income statement on a constant currency basis, and the other which presented the ‘core’ income statement (before the effect of costs such as restructuring and amortisation).
SGS, Press release 2013
Of the four companies which presented adjusted income statement KPIs, three did not present all of these adjusted measures in the segmental reporting note to the consolidated financial statements. The adjustment made for one company impacted only the prior year. We would have, however, expected that if a measure was sufficiently important to warrant disclosure in the narrative analysis, that it would be a measure used by the CODM and thus applicable to IFRS 8.
All companies presented some form of currency-adjusted figures, but in many cases these adjustments only related to sales. The table below shows the proportion of companies in our sample which provide currency-adjusted figures for the key measures listed below. Only one company in our sample provided all of these measures in constant currencies. Given the relative stability of the CHF against major currencies in 2013, it is perhaps understandable that companies were focusing less on currency impacts; further strengthening of the CHF in 2014 may lead to a reversal of this trend.
Figure 11. Which measures are adjusted for currency impacts?
0%
20%
40%
60%
80%
100%
EPSNet profitEBITDAEBITSales
30%20%
50%50%
90%
To start a new section, hold down the apple+shift keys and click
to release this object and type the section title in the box below.
10
The press releases highlighted a number of key measures, or KPIs; there was limited consistency in the nature of the measures chosen.
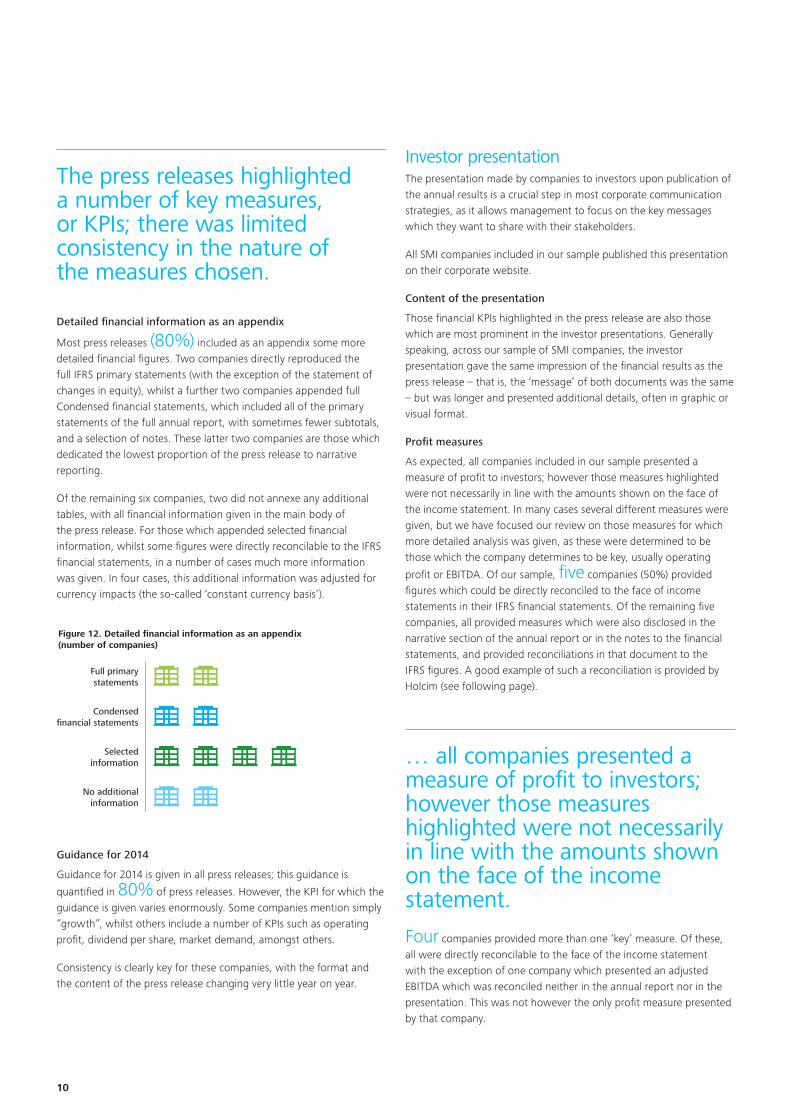
Detailed financial information as an appendix
Most press releases (80%) included as an appendix some more detailed financial figures. Two companies directly reproduced the full IFRS primary statements (with the exception of the statement of changes in equity), whilst a further two companies appended full Condensed financial statements, which included all of the primary statements of the full annual report, with sometimes fewer subtotals, and a selection of notes. These latter two companies are those which dedicated the lowest proportion of the press release to narrative reporting.
Of the remaining six companies, two did not annexe any additional tables, with all financial information given in the main body of the press release. For those which appended selected financial information, whilst some figures were directly reconcilable to the IFRS financial statements, in a number of cases much more information was given. In four cases, this additional information was adjusted for currency impacts (the so-called ‘constant currency basis’).
Full primarystatements
Condensedfinancial statements
Selectedinformation
No additionalinformation
Figure 12. Detailed financial information as an appendix (number of companies)
Guidance for 2014
Guidance for 2014 is given in all press releases; this guidance is
quantified in 80% of press releases. However, the KPI for which the guidance is given varies enormously. Some companies mention simply “growth”, whilst others include a number of KPIs such as operating profit, dividend per share, market demand, amongst others.
Consistency is clearly key for these companies, with the format and the content of the press release changing very little year on year.
Investor presentationThe presentation made by companies to investors upon publication of the annual results is a crucial step in most corporate communication strategies, as it allows management to focus on the key messages which they want to share with their stakeholders.
All SMI companies included in our sample published this presentation on their corporate website.
Content of the presentation
Those financial KPIs highlighted in the press release are also those which are most prominent in the investor presentations. Generally speaking, across our sample of SMI companies, the investor presentation gave the same impression of the financial results as the press release – that is, the ‘message’ of both documents was the same – but was longer and presented additional details, often in graphic or visual format.
Profit measures
As expected, all companies included in our sample presented a measure of profit to investors; however those measures highlighted were not necessarily in line with the amounts shown on the face of the income statement. In many cases several different measures were given, but we have focused our review on those measures for which more detailed analysis was given, as these were determined to be those which the company determines to be key, usually operating
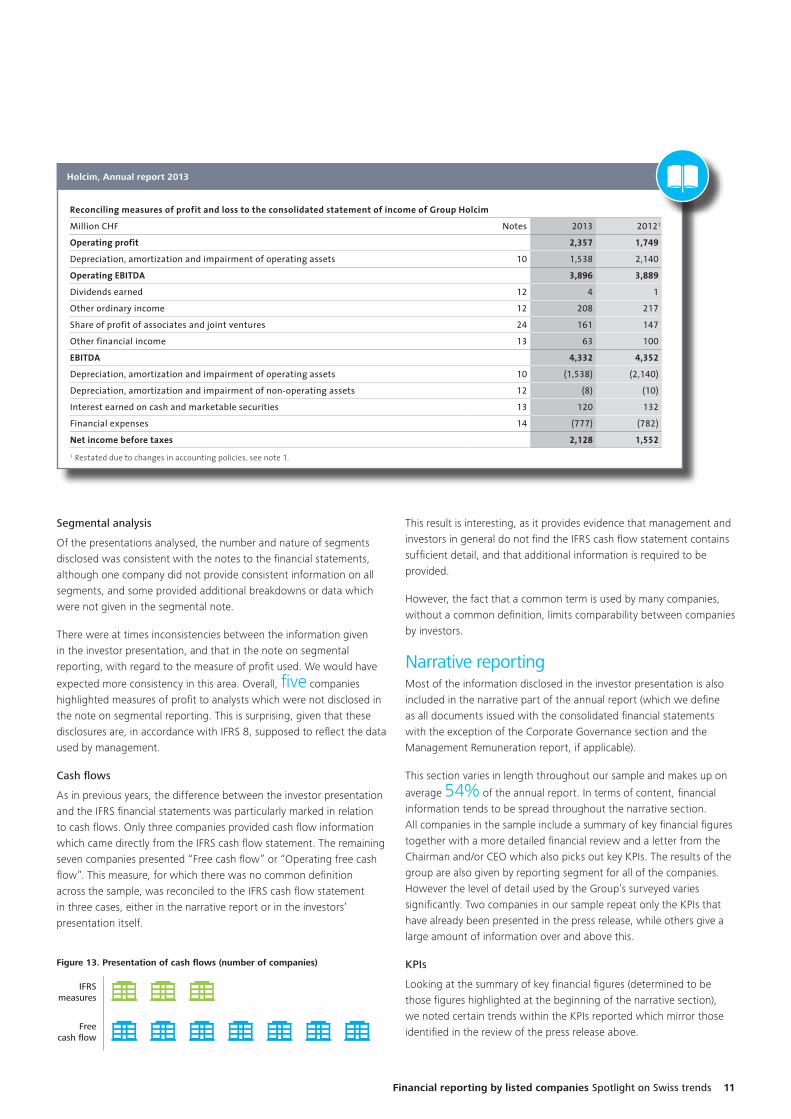
profit or EBITDA. Of our sample, five companies (50%) provided figures which could be directly reconciled to the face of income statements in their IFRS financial statements. Of the remaining five companies, all provided measures which were also disclosed in the narrative section of the annual report or in the notes to the financial statements, and provided reconciliations in that document to the IFRS figures. A good example of such a reconciliation is provided by Holcim (see following page).
… all companies presented a measure of profit to investors; however those measures highlighted were not necessarily in line with the amounts shown on the face of the income statement.
Four companies provided more than one ‘key’ measure. Of these, all were directly reconcilable to the face of the income statement with the exception of one company which presented an adjusted EBITDA which was reconciled neither in the annual report nor in the presentation. This was not however the only profit measure presented by that company.
To start a new section, hold down the apple+shift keys and click
to release this object and type the section title in the box below.
Financial reporting by listed companies Spotlight on Swiss trends 11
Fina
ncia
l In
form
atio
n
194
Reconciling measures of profit and loss to the consolidated statement of income of Group Holcim
Million CHF Notes 2013 20121
Operating profit 2,357 1,749
Depreciation, amortization and impairment of operating assets 10 1,538 2,140
Operating EBITDA 3,896 3,889
Dividends earned 12 4 1
Other ordinary income 12 208 217
Share of profit of associates and joint ventures 24 161 147
Other financial income 13 63 100
EBITDA 4,332 4,352
Depreciation, amortization and impairment of operating assets 10 (1,538) (2,140)
Depreciation, amortization and impairment of non-operating assets 12 (8) (10)
Interest earned on cash and marketable securities 13 120 132
Financial expenses 14 (777) (782)
Net income before taxes 2,128 1,552 1 Restatedduetochangesinaccountingpolicies,seenote1.
5 Information by product line
Cement1 Aggregates Other construction materials
and services
Corporate/Eliminations Total Group
Million CHF 2013 20122 2013 20122 2013 20122 2013 20122 2013 20122
Statement of income, statement of financial position and statement of cash flows
Net sales to external customers 11,884 12,620 1,585 1,616 6,249 6,924 19,719 21,160
Net sales to other segments 1,055 1,267 842 925 562 721 (2,460) (2,913)
Total net sales 12,939 13,887 2,428 2,541 6,812 7,645 (2,460) (2,913) 19,719 21,160
– of which Asia Pacific 5,497 6,361 647 747 1,641 1,902 (503) (668) 7,282 8,343
– of which Latin America 2,747 2,787 85 109 822 963 (305) (369) 3,349 3,490
– of which Europe 2,618 2,633 1,189 1,167 2,545 2,810 (742) (801) 5,611 5,809
– of which North America 1,369 1,383 478 475 1,694 1,798 (369) (379) 3,171 3,276
– of which Africa Middle East 807 849 26 27 84 111 (33) (39) 884 947
– of which Corporate/Eliminations (99) (125) 2 15 26 61 (507) (656) (578) (705)
Operating profit (loss) 2,236 2,012 188 (18) (67) (245) 2,357 1,749
– of which Asia Pacific 915 1,176 95 90 21 7 1,030 1,273
– of which Latin America 697 710 11 12 14 (13) 722 709
– of which Europe 414 (47) 83 (105) (61) (219) 436 (372)
– of which North America 171 160 34 16 (6) (12) 199 164
– of which Africa Middle East 221 220 1 2 (6) (2) 216 220
– of which Corporate/Eliminations (182) (206) (36) (33) (29) (5) (247) (245)
Operating profit (loss) margin in % 17.3 14.5 7.8 (0.7) (1.0) (3.2) 12.0 8.3
Net operating assets 16,641 18,247 4,848 5,272 3,222 3,568 24,712 27,087
Acquisition cost segment assets3 1,756 1,271 227 231 240 220 3 12 2,227 1,734
Cash flow from investing activities4 (1,708) (1,138) (157) (200) (113) (190) 313 331 (1,665) (1,197)
Personnel
Number of personnel 47,179 50,293 5,812 6,379 17,376 19,421 490 266 70,857 76,359 1 Cement,clinkerandothercementitiousmaterials.2 Restatedduetochangesinaccountingpolicies,seenote1.3 Property,plantandequipmentandintangibleassets.4 Netinvestmentsinproperty,plantandequipment,Groupcompanies,financialassets,intangibleandotherassets.
Segmental analysis
Of the presentations analysed, the number and nature of segments disclosed was consistent with the notes to the financial statements, although one company did not provide consistent information on all segments, and some provided additional breakdowns or data which were not given in the segmental note.
There were at times inconsistencies between the information given in the investor presentation, and that in the note on segmental reporting, with regard to the measure of profit used. We would have
expected more consistency in this area. Overall, five companies highlighted measures of profit to analysts which were not disclosed in the note on segmental reporting. This is surprising, given that these disclosures are, in accordance with IFRS 8, supposed to reflect the data used by management.
Cash flows
As in previous years, the difference between the investor presentation and the IFRS financial statements was particularly marked in relation to cash flows. Only three companies provided cash flow information which came directly from the IFRS cash flow statement. The remaining seven companies presented “Free cash flow” or “Operating free cash flow”. This measure, for which there was no common definition across the sample, was reconciled to the IFRS cash flow statement in three cases, either in the narrative report or in the investors’ presentation itself.
IFRSmeasures
Freecash flow
Figure 13. Presentation of cash flows (number of companies)
This result is interesting, as it provides evidence that management and investors in general do not find the IFRS cash flow statement contains sufficient detail, and that additional information is required to be provided.
However, the fact that a common term is used by many companies, without a common definition, limits comparability between companies by investors.
Narrative reporting Most of the information disclosed in the investor presentation is also included in the narrative part of the annual report (which we define as all documents issued with the consolidated financial statements with the exception of the Corporate Governance section and the Management Remuneration report, if applicable).
This section varies in length throughout our sample and makes up on
average 54% of the annual report. In terms of content, financial information tends to be spread throughout the narrative section. All companies in the sample include a summary of key financial figures together with a more detailed financial review and a letter from the Chairman and/or CEO which also picks out key KPIs. The results of the group are also given by reporting segment for all of the companies. However the level of detail used by the Group’s surveyed varies significantly. Two companies in our sample repeat only the KPIs that have already been presented in the press release, while others give a large amount of information over and above this.
KPIs
Looking at the summary of key financial figures (determined to be those figures highlighted at the beginning of the narrative section), we noted certain trends within the KPIs reported which mirror those identified in the review of the press release above.
Holcim, Annual report 2013
To start a new section, hold down the apple+shift keys and click
to release this object and type the section title in the box below.
12
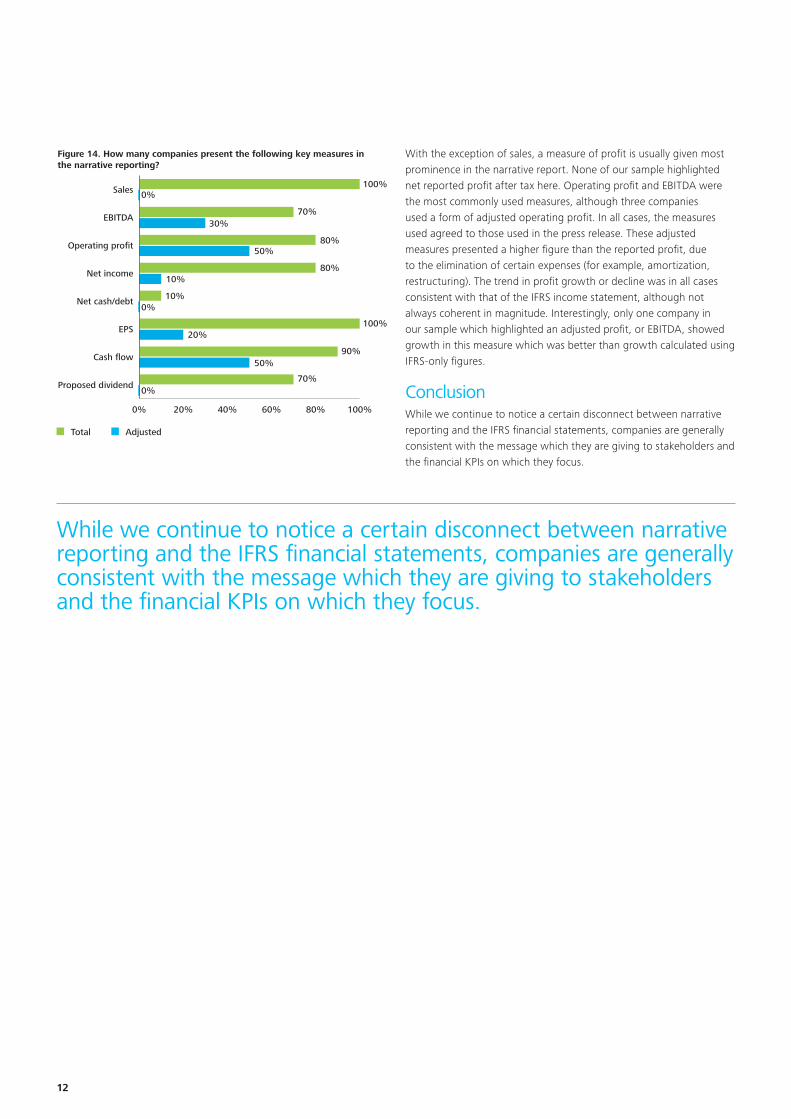
Figure 14. How many companies present the following key measures in the narrative reporting?
0% 20% 40% 60% 80% 100%
Proposed dividend
Cash flow
EPS
Net cash/debt
Net income
Operating profit
EBITDA
Sales
70%
90%
100%
10%
80%
80%
70%
100%
0%
50%
20%
0%
10%
50%
30%
0%
Total Adjusted
With the exception of sales, a measure of profit is usually given most prominence in the narrative report. None of our sample highlighted net reported profit after tax here. Operating profit and EBITDA were the most commonly used measures, although three companies used a form of adjusted operating profit. In all cases, the measures used agreed to those used in the press release. These adjusted measures presented a higher figure than the reported profit, due to the elimination of certain expenses (for example, amortization, restructuring). The trend in profit growth or decline was in all cases consistent with that of the IFRS income statement, although not always coherent in magnitude. Interestingly, only one company in our sample which highlighted an adjusted profit, or EBITDA, showed growth in this measure which was better than growth calculated using IFRS-only figures.
ConclusionWhile we continue to notice a certain disconnect between narrative reporting and the IFRS financial statements, companies are generally consistent with the message which they are giving to stakeholders and the financial KPIs on which they focus.
While we continue to notice a certain disconnect between narrative reporting and the IFRS financial statements, companies are generally consistent with the message which they are giving to stakeholders and the financial KPIs on which they focus.
To start a new section, hold down the apple+shift keys and click
to release this object and type the section title in the box below.
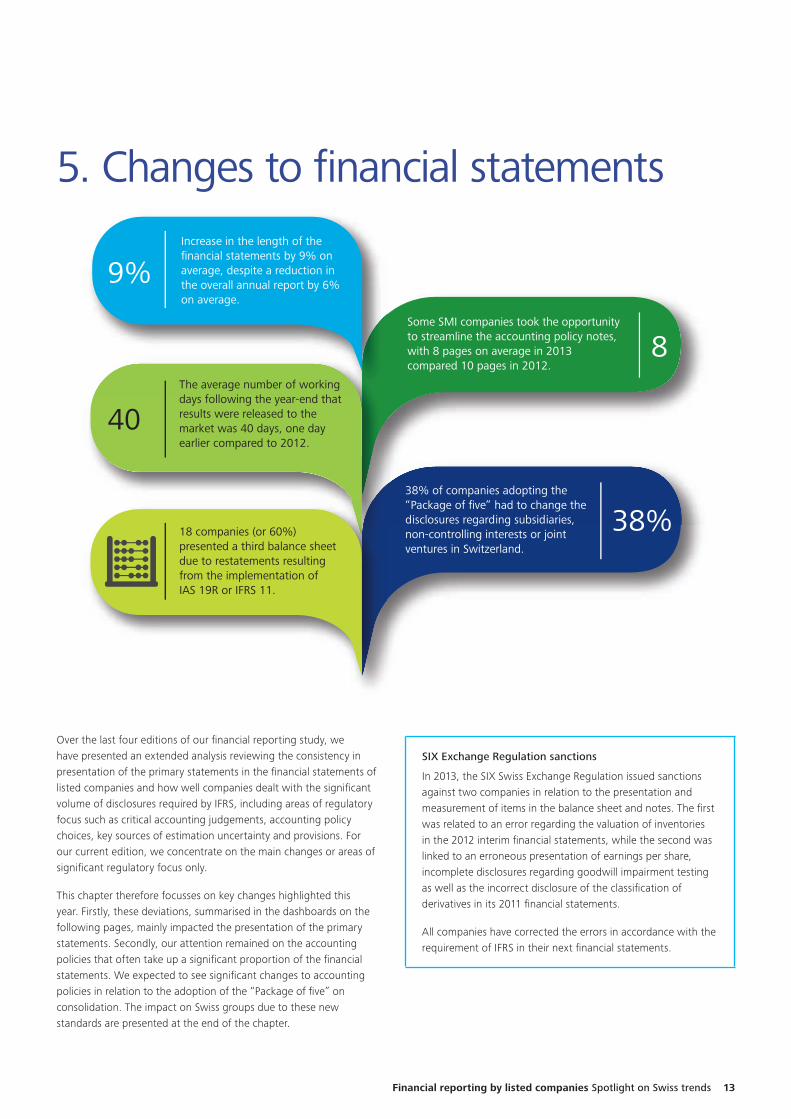
The average number of working days following the year-end that results were released to the market was 40 days, one day earlier compared to 2012.
18 companies (or 60%) presented a third balance sheet due to restatements resulting from the implementation ofIAS 19R or IFRS 11.
Some SMI companies took the opportunity to streamline the accounting policy notes, with 8 pages on average in 2013 compared 10 pages in 2012.
38% of companies adopting the “Package of five” had to change the disclosures regarding subsidiaries, non-controlling interests or joint ventures in Switzerland.
The average number of working days following the year end that
Increase in the length of the financial statements by 9% on average, despite a reduction in the overall annual report by 6% on average.
9%
40
8
38%
Over the last four editions of our financial reporting study, we have presented an extended analysis reviewing the consistency in presentation of the primary statements in the financial statements of listed companies and how well companies dealt with the significant volume of disclosures required by IFRS, including areas of regulatory focus such as critical accounting judgements, accounting policy choices, key sources of estimation uncertainty and provisions. For our current edition, we concentrate on the main changes or areas of significant regulatory focus only.
This chapter therefore focusses on key changes highlighted this year. Firstly, these deviations, summarised in the dashboards on the following pages, mainly impacted the presentation of the primary statements. Secondly, our attention remained on the accounting policies that often take up a significant proportion of the financial statements. We expected to see significant changes to accounting policies in relation to the adoption of the “Package of five” on consolidation. The impact on Swiss groups due to these new standards are presented at the end of the chapter.
SIX Exchange Regulation sanctions
In 2013, the SIX Swiss Exchange Regulation issued sanctions against two companies in relation to the presentation and measurement of items in the balance sheet and notes. The first was related to an error regarding the valuation of inventories in the 2012 interim financial statements, while the second was linked to an erroneous presentation of earnings per share, incomplete disclosures regarding goodwill impairment testing as well as the incorrect disclosure of the classification of derivatives in its 2011 financial statements.
All companies have corrected the errors in accordance with the requirement of IFRS in their next financial statements.
Financial reporting by listed companies Spotlight on Swiss trends 13
5. Changes to financial statements
To start a new section, hold down the apple+shift keys and click
to release this object and type the section title in the box below.
Financial reporting: overview of length
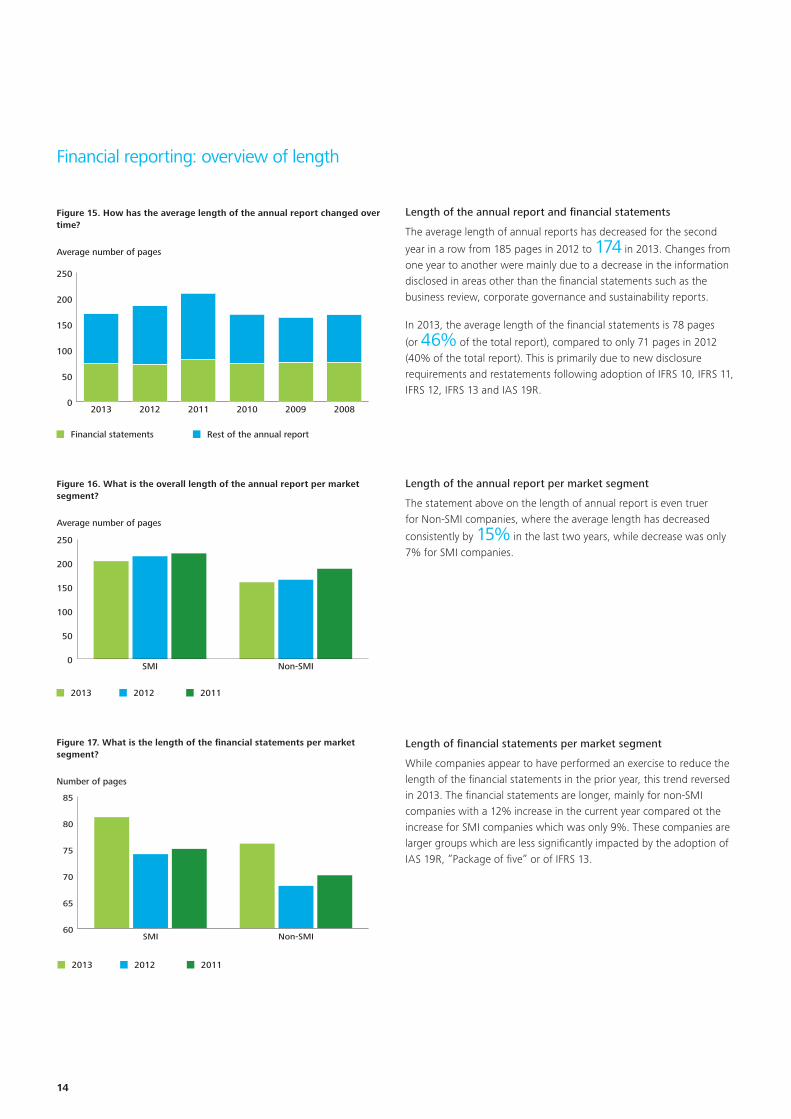
Figure 15. How has the average length of the annual report changed over time?
Financial statements Rest of the annual report
Average number of pages
0
50
100
150
200
250
200820092010201120122013
Figure 16. What is the overall length of the annual report per market segment?
2013 2012 2011
0
50
100
150
200
250
Non-SMISMI
Average number of pages
Figure 17. What is the length of the financial statements per market segment?
2013 2012 2011
60
65
70
75
80
85
Non-SMISMI
Number of pages
Length of the annual report and financial statements
The average length of annual reports has decreased for the second
year in a row from 185 pages in 2012 to 174 in 2013. Changes from one year to another were mainly due to a decrease in the information disclosed in areas other than the financial statements such as the business review, corporate governance and sustainability reports.
In 2013, the average length of the financial statements is 78 pages
(or 46% of the total report), compared to only 71 pages in 2012 (40% of the total report). This is primarily due to new disclosure requirements and restatements following adoption of IFRS 10, IFRS 11, IFRS 12, IFRS 13 and IAS 19R.
Length of the annual report per market segment
The statement above on the length of annual report is even truer for Non-SMI companies, where the average length has decreased
consistently by 15% in the last two years, while decrease was only 7% for SMI companies.
Length of financial statements per market segment
While companies appear to have performed an exercise to reduce the length of the financial statements in the prior year, this trend reversed in 2013. The financial statements are longer, mainly for non-SMI companies with a 12% increase in the current year compared ot the increase for SMI companies which was only 9%. These companies are larger groups which are less significantly impacted by the adoption of IAS 19R, ”Package of five” or of IFRS 13.
14
To start a new section, hold down the apple+shift keys and click
to release this object and type the section title in the box below.
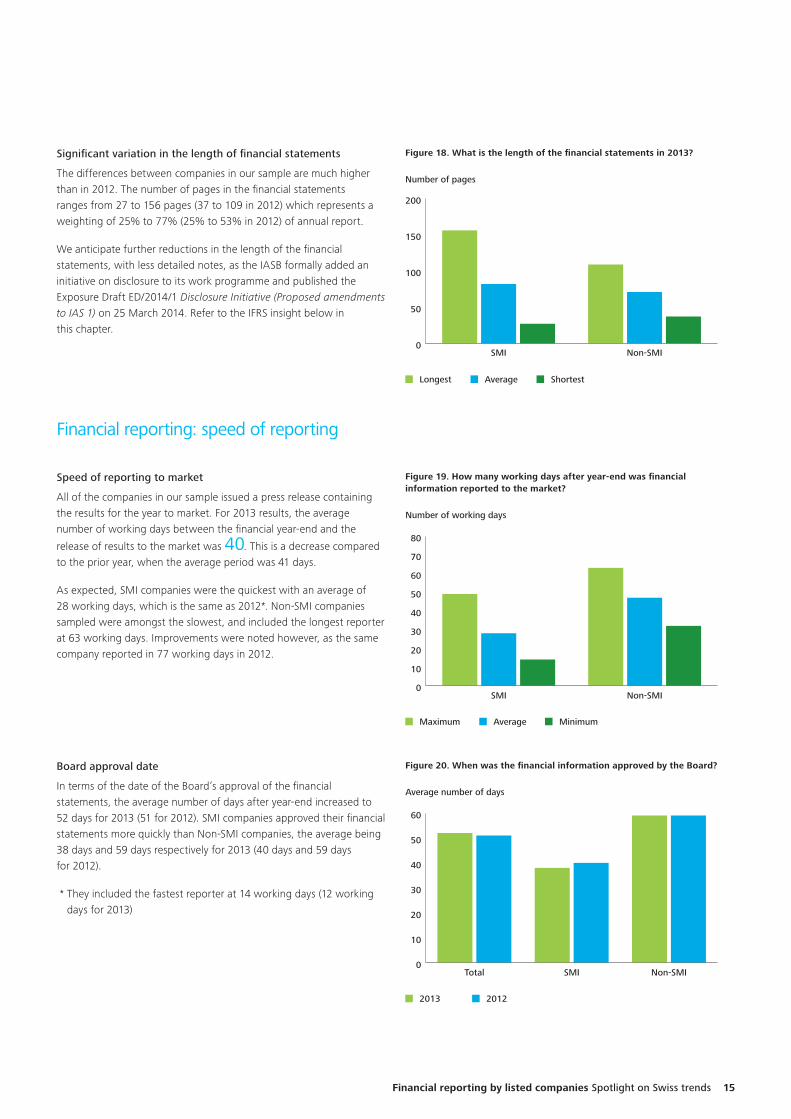
Figure 18. What is the length of the financial statements in 2013?
Longest Average Shortest
0
50
100
150
200
Non-SMISMI
Number of pages
Significant variation in the length of financial statements
The differences between companies in our sample are much higher than in 2012. The number of pages in the financial statements ranges from 27 to 156 pages (37 to 109 in 2012) which represents a weighting of 25% to 77% (25% to 53% in 2012) of annual report.
We anticipate further reductions in the length of the financial statements, with less detailed notes, as the IASB formally added an initiative on disclosure to its work programme and published the Exposure Draft ED/2014/1 Disclosure Initiative (Proposed amendments to IAS 1) on 25 March 2014. Refer to the IFRS insight below in this chapter.
Speed of reporting to market
All of the companies in our sample issued a press release containing the results for the year to market. For 2013 results, the average number of working days between the financial year-end and the
release of results to the market was 40. This is a decrease compared to the prior year, when the average period was 41 days.
As expected, SMI companies were the quickest with an average of 28 working days, which is the same as 2012*. Non-SMI companies sampled were amongst the slowest, and included the longest reporter at 63 working days. Improvements were noted however, as the same company reported in 77 working days in 2012.
Board approval date
In terms of the date of the Board’s approval of the financial statements, the average number of days after year-end increased to 52 days for 2013 (51 for 2012). SMI companies approved their financial statements more quickly than Non-SMI companies, the average being 38 days and 59 days respectively for 2013 (40 days and 59 days for 2012).
* They included the fastest reporter at 14 working days (12 working days for 2013)
Figure 19. How many working days after year-end was financial information reported to the market?
Maximum Average Minimum
0
10
20
30
40
50
60
70
80
Non-SMISMI
Number of working days
Figure 20. When was the financial information approved by the Board?
2013 2012
0
10
20
30
40
50
60
Non-SMISMITotal
Average number of days
Financial reporting: speed of reporting
Financial reporting by listed companies Spotlight on Swiss trends 15
To start a new section, hold down the apple+shift keys and click
to release this object and type the section title in the box below.
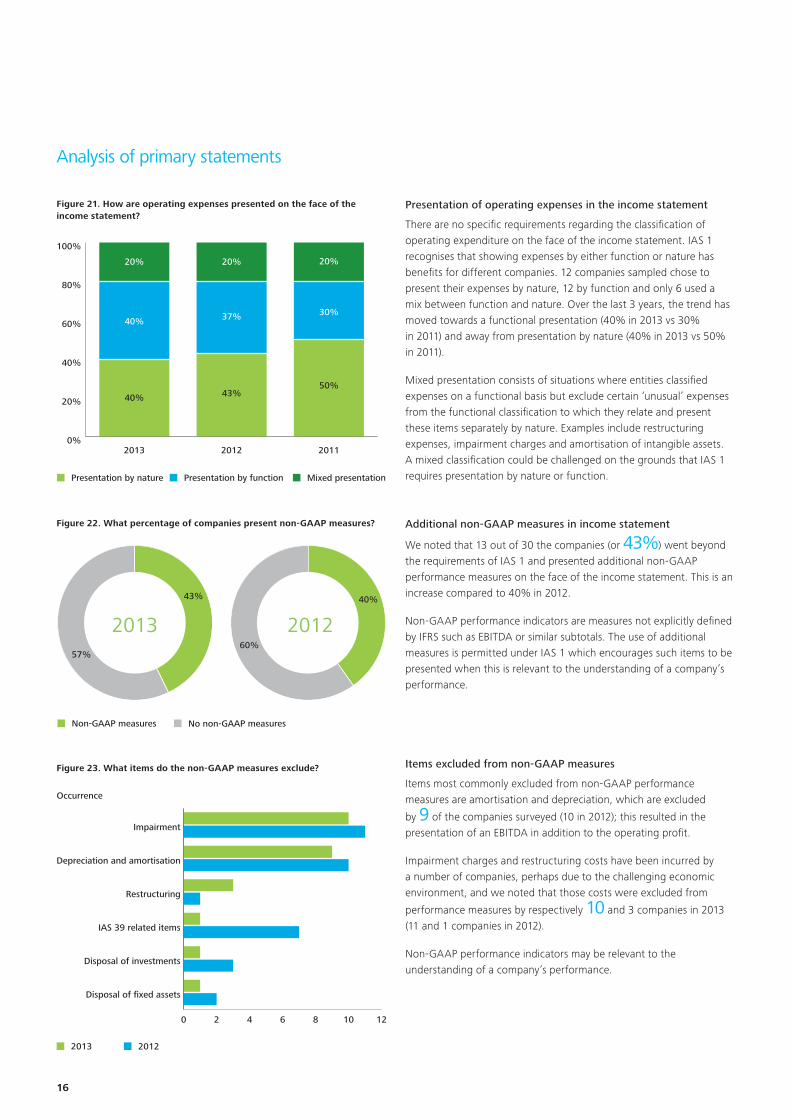
Figure 21. How are operating expenses presented on the face of the income statement?
Presentation by nature Presentation by function Mixed presentation
0%
20%
40%
60%
80%
100%
2011
50%
30%
20%
2012
43%
37%
20%
2013
40%
40%
20%
Figure 22. What percentage of companies present non-GAAP measures?
Non-GAAP measures No non-GAAP measures
43%
57%
40%
60%
2013 2012
Presentation of operating expenses in the income statement
There are no specific requirements regarding the classification of operating expenditure on the face of the income statement. IAS 1 recognises that showing expenses by either function or nature has benefits for different companies. 12 companies sampled chose to present their expenses by nature, 12 by function and only 6 used a mix between function and nature. Over the last 3 years, the trend has moved towards a functional presentation (40% in 2013 vs 30% in 2011) and away from presentation by nature (40% in 2013 vs 50% in 2011).
Mixed presentation consists of situations where entities classified expenses on a functional basis but exclude certain ‘unusual’ expenses from the functional classification to which they relate and present these items separately by nature. Examples include restructuring expenses, impairment charges and amortisation of intangible assets. A mixed classification could be challenged on the grounds that IAS 1 requires presentation by nature or function.
Additional non-GAAP measures in income statement
We noted that 13 out of 30 the companies (or 43%) went beyond the requirements of IAS 1 and presented additional non-GAAP performance measures on the face of the income statement. This is an increase compared to 40% in 2012.
Non-GAAP performance indicators are measures not explicitly defined by IFRS such as EBITDA or similar subtotals. The use of additional measures is permitted under IAS 1 which encourages such items to be presented when this is relevant to the understanding of a company’s performance.
Items excluded from non-GAAP measures
Items most commonly excluded from non-GAAP performance measures are amortisation and depreciation, which are excluded
by 9 of the companies surveyed (10 in 2012); this resulted in the presentation of an EBITDA in addition to the operating profit.
Impairment charges and restructuring costs have been incurred by a number of companies, perhaps due to the challenging economic environment, and we noted that those costs were excluded from
performance measures by respectively 10 and 3 companies in 2013 (11 and 1 companies in 2012).
Non-GAAP performance indicators may be relevant to the understanding of a company’s performance.
Figure 23. What items do the non-GAAP measures exclude?
2013 2012
0 2 4 6 8 10 12
Disposal of fixed assets
Disposal of investments
IAS 39 related items
Restructuring
Depreciation and amortisation
Impairment
Occurrence
Analysis of primary statements
16
To start a new section, hold down the apple+shift keys and click
to release this object and type the section title in the box below.
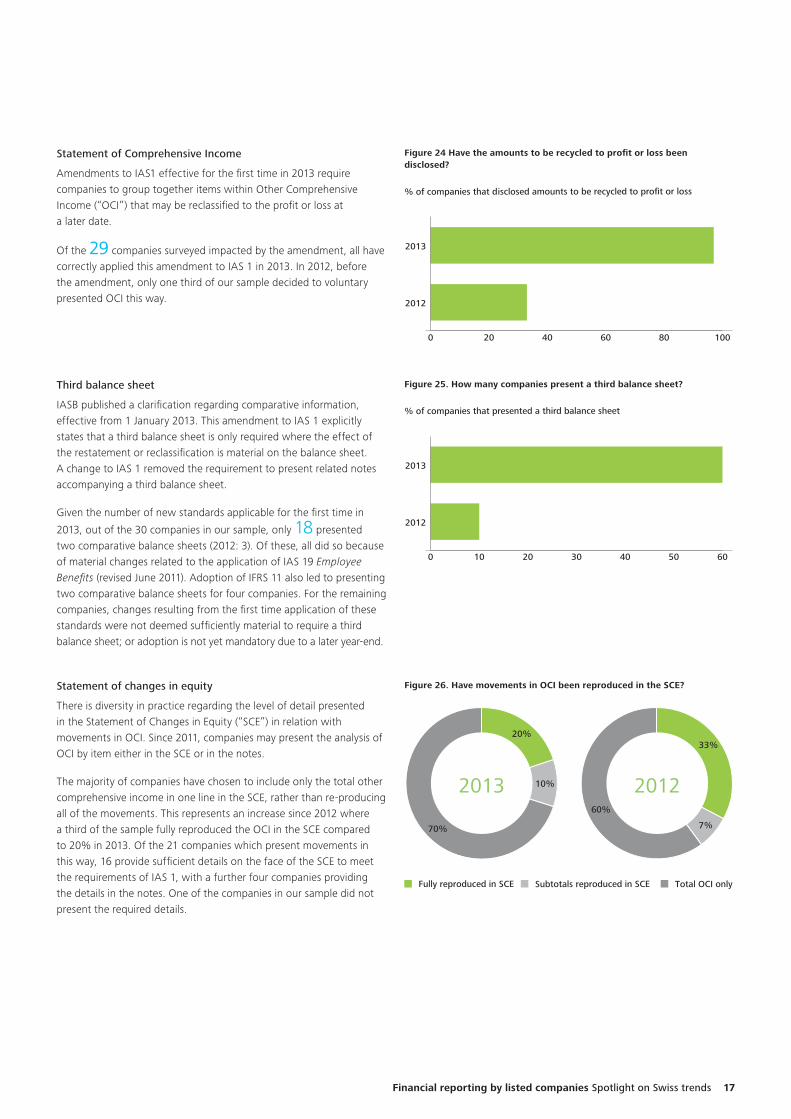
Figure 24 Have the amounts to be recycled to profit or loss been disclosed?
Statement of Comprehensive Income
Amendments to IAS1 effective for the first time in 2013 require companies to group together items within Other Comprehensive Income (“OCI”) that may be reclassified to the profit or loss at a later date.
Of the 29 companies surveyed impacted by the amendment, all have correctly applied this amendment to IAS 1 in 2013. In 2012, before the amendment, only one third of our sample decided to voluntary presented OCI this way.
Figure 26. Have movements in OCI been reproduced in the SCE?
Fully reproduced in SCE Subtotals reproduced in SCE Total OCI only
20%
10%
70%
33%
7%
60%
2013 2012
Statement of changes in equity
There is diversity in practice regarding the level of detail presented in the Statement of Changes in Equity (“SCE”) in relation with movements in OCI. Since 2011, companies may present the analysis of OCI by item either in the SCE or in the notes.
The majority of companies have chosen to include only the total other comprehensive income in one line in the SCE, rather than re-producing all of the movements. This represents an increase since 2012 where a third of the sample fully reproduced the OCI in the SCE compared to 20% in 2013. Of the 21 companies which present movements in this way, 16 provide sufficient details on the face of the SCE to meet the requirements of IAS 1, with a further four companies providing the details in the notes. One of the companies in our sample did not present the required details.
% of companies that disclosed amounts to be recycled to profit or loss
0 20 40 60 80 100
2012
2013
Third balance sheet
IASB published a clarification regarding comparative information, effective from 1 January 2013. This amendment to IAS 1 explicitly states that a third balance sheet is only required where the effect of the restatement or reclassification is material on the balance sheet. A change to IAS 1 removed the requirement to present related notes accompanying a third balance sheet.
Given the number of new standards applicable for the first time in
2013, out of the 30 companies in our sample, only 18 presented two comparative balance sheets (2012: 3). Of these, all did so because of material changes related to the application of IAS 19 Employee Benefits (revised June 2011). Adoption of IFRS 11 also led to presenting two comparative balance sheets for four companies. For the remaining companies, changes resulting from the first time application of these standards were not deemed sufficiently material to require a third balance sheet; or adoption is not yet mandatory due to a later year-end.
Figure 25. How many companies present a third balance sheet?
% of companies that presented a third balance sheet
0 10 20 30 40 50 60
2012
2013
Financial reporting by listed companies Spotlight on Swiss trends 17
To start a new section, hold down the apple+shift keys and click
to release this object and type the section title in the box below.
Qualitative review of the accounting policiesA summary of the significant accounting policies and other explanatory notes are required by IAS 1 Presentation of Financial Statements as a component of a complete set of IFRS financial statements.
IAS 1.117(b) requires disclosure of those accounting policies that are relevant to an understanding of the financial statements. To be relevant, the accounting policy disclosures must be specific to the company, its business and the transactions involved.
The selection of the appropriate accounting policies to be disclosed requires management’s judgment considering materiality. Generic or “boilerplate” disclosures only reflecting the wording of the applicable IFRS and extensive disclosures of accounting policies which are not material are not considered relevant.
Disclosure of those accounting policies selected by management where alternative policies would be permitted are of particular importance to users. Other accounting policies may be significant because they are expected by users due to the nature of the entity’s business (e.g. construction contracts, research and development) even if the amounts involved are not material.
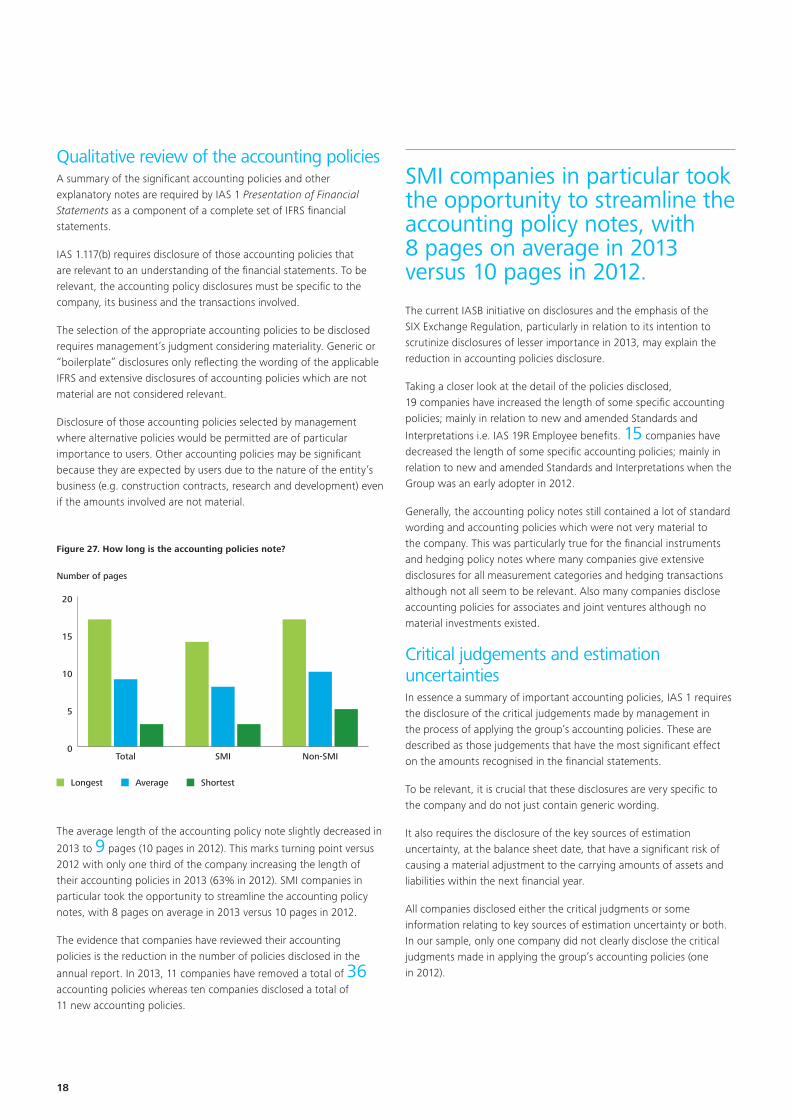
Figure 27. How long is the accounting policies note?
Longest Average Shortest
0
5
10
15
20
Non-SMISMITotal
Number of pages
The average length of the accounting policy note slightly decreased in
2013 to 9 pages (10 pages in 2012). This marks turning point versus 2012 with only one third of the company increasing the length of their accounting policies in 2013 (63% in 2012). SMI companies in particular took the opportunity to streamline the accounting policy notes, with 8 pages on average in 2013 versus 10 pages in 2012.
The evidence that companies have reviewed their accounting policies is the reduction in the number of policies disclosed in the
annual report. In 2013, 11 companies have removed a total of 36 accounting policies whereas ten companies disclosed a total of 11 new accounting policies.
SMI companies in particular took the opportunity to streamline the accounting policy notes, with 8 pages on average in 2013 versus 10 pages in 2012.
The current IASB initiative on disclosures and the emphasis of the SIX Exchange Regulation, particularly in relation to its intention to scrutinize disclosures of lesser importance in 2013, may explain the reduction in accounting policies disclosure.
Taking a closer look at the detail of the policies disclosed, 19 companies have increased the length of some specific accounting policies; mainly in relation to new and amended Standards and
Interpretations i.e. IAS 19R Employee benefits. 15 companies have decreased the length of some specific accounting policies; mainly in relation to new and amended Standards and Interpretations when the Group was an early adopter in 2012.
Generally, the accounting policy notes still contained a lot of standard wording and accounting policies which were not very material to the company. This was particularly true for the financial instruments and hedging policy notes where many companies give extensive disclosures for all measurement categories and hedging transactions although not all seem to be relevant. Also many companies disclose accounting policies for associates and joint ventures although no material investments existed.
Critical judgements and estimation uncertaintiesIn essence a summary of important accounting policies, IAS 1 requires the disclosure of the critical judgements made by management in the process of applying the group’s accounting policies. These are described as those judgements that have the most significant effect on the amounts recognised in the financial statements.
To be relevant, it is crucial that these disclosures are very specific to the company and do not just contain generic wording.
It also requires the disclosure of the key sources of estimation uncertainty, at the balance sheet date, that have a significant risk of causing a material adjustment to the carrying amounts of assets and liabilities within the next financial year.
All companies disclosed either the critical judgments or some information relating to key sources of estimation uncertainty or both. In our sample, only one company did not clearly disclose the critical judgments made in applying the group’s accounting policies (one in 2012).
18
To start a new section, hold down the apple+shift keys and click
to release this object and type the section title in the box below.
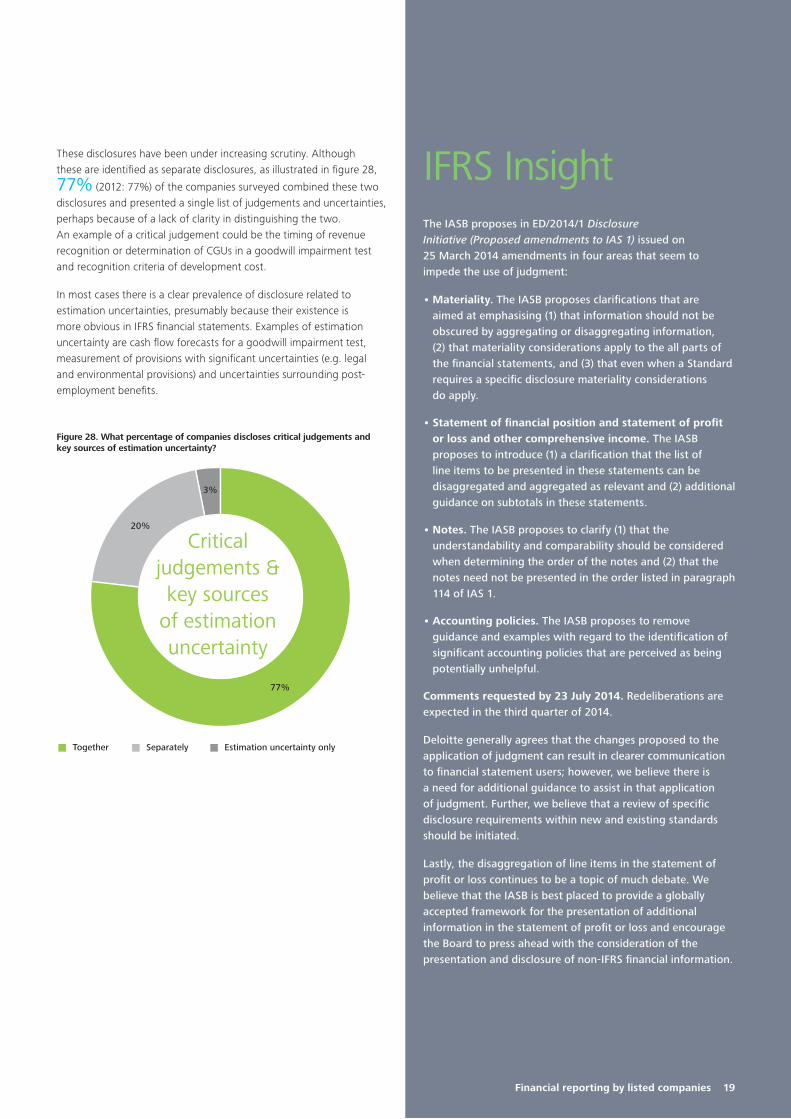
These disclosures have been under increasing scrutiny. Although these are identified as separate disclosures, as illustrated in figure 28,
77% (2012: 77%) of the companies surveyed combined these two disclosures and presented a single list of judgements and uncertainties, perhaps because of a lack of clarity in distinguishing the two. An example of a critical judgement could be the timing of revenue recognition or determination of CGUs in a goodwill impairment test and recognition criteria of development cost.
In most cases there is a clear prevalence of disclosure related to estimation uncertainties, presumably because their existence is more obvious in IFRS financial statements. Examples of estimation uncertainty are cash flow forecasts for a goodwill impairment test, measurement of provisions with significant uncertainties (e.g. legal and environmental provisions) and uncertainties surrounding post-employment benefits.
Figure 28. What percentage of companies discloses critical judgements and key sources of estimation uncertainty?
Together Separately Estimation uncertainty only
77%
3%
20%
Criticaljudgements &key sources
of estimationuncertainty
Financial reporting by listed companies 19
IFRS InsightThe IASB proposes in ED/2014/1 Disclosure Initiative (Proposed amendments to IAS 1) issued on 25 March 2014 amendments in four areas that seem to impede the use of judgment:
• Materiality. The IASB proposes clarifications that are aimed at emphasising (1) that information should not be obscured by aggregating or disaggregating information, (2) that materiality considerations apply to the all parts of the financial statements, and (3) that even when a Standard requires a specific disclosure materiality considerations do apply.
• Statement of financial position and statement of profit or loss and other comprehensive income. The IASB proposes to introduce (1) a clarification that the list of line items to be presented in these statements can be disaggregated and aggregated as relevant and (2) additional guidance on subtotals in these statements.
• Notes. The IASB proposes to clarify (1) that the understandability and comparability should be considered when determining the order of the notes and (2) that the notes need not be presented in the order listed in paragraph 114 of IAS 1.
• Accounting policies. The IASB proposes to remove guidance and examples with regard to the identification of significant accounting policies that are perceived as being potentially unhelpful.
Comments requested by 23 July 2014. Redeliberations are expected in the third quarter of 2014.
Deloitte generally agrees that the changes proposed to the application of judgment can result in clearer communication to financial statement users; however, we believe there is a need for additional guidance to assist in that application of judgment. Further, we believe that a review of specific disclosure requirements within new and existing standards should be initiated.
Lastly, the disaggregation of line items in the statement of profit or loss continues to be a topic of much debate. We believe that the IASB is best placed to provide a globally accepted framework for the presentation of additional information in the statement of profit or loss and encourage the Board to press ahead with the consideration of the presentation and disclosure of non-IFRS financial information.
To start a new section, hold down the apple+shift keys and click
to release this object and type the section title in the box below.
20
A good example of disclosures of critical judgements and distinct key source of estimation uncertainty is given by Schindler.
These disclosures are specific to the company, and thus provide the investor with better information than the more standard, ‘boiler-plate’ disclosures noted in some annual reports.
Schindler, Annual report 2013 – Significant estimates and judgements
11Schindler Financial Statements 2013 | Notes to the Group financial statements |
GroupFinancial Statements
The development of IFRS 9 – Financial Instruments is being monitored on an ongoing basis. The full impact of IFRS 9 will be analyzed once it has been completed. There are no plans to adopt IFRS 9 prior to the mandatory effective date.
2.3 Significant estimates and judgments
The financial statements prepared in accordance with IFRS contain certain assumptions and estimates that influence the figures presented in this report. They are based on analyses and judgments, which are continuously reviewed and adapted if necessary. The actual results may differ from these estimates.
2.3.1 Estimates and assumptions
Taxes
Current income taxes are calculated on the basis of the results for the financial year. The actual amount of income tax due may differ from the amount that was originally calculated because the final tax assessment may be made several years after the end of the financial year. Offsetting risks are individually identified and assessed, and the corresponding provisions are recorded if necessary. Deferred tax assets are deter-mined on the basis of significant estimates. The underlying forecasts cover a period of several years and include interpretations of existing tax laws and regulations.
Provisions
Provisions contain a greater degree of estimation than other balance sheet items and can therefore result in a higher or lower outflow of resources, depending on the development of the relevant situation. Provisions for product liability cases as well as self-insurance are based on actuarial reports. They take account of all units under maintenance (product liabilities) and all employees (self-insurance), as well as the prob ability of occurrence based on historical experience. The amounts recorded as provisions are therefore subject to a degree of uncertainty both in terms of timing and the level of future cash flows.
Employee benefits
The status of various defined benefit plans depends on long-term actuarial assump-tions that may differ from actual future developments. The determination of the discount rate and of future changes in salaries/wages are important assumptions in actuarial valuations.
2.3.2 Judgments
Associates
Qualitative factors have to be taken into account when assessing whether the Schindler Group has significant influence over associates. Although it has a 30.9% (previous year: 35.0%) participation in Hyundai Elevator Co. Ltd., Schindler has no significant in flu ence over the company: it is not represented on the Board of Directors and has no access to detailed information. Furthermore, no transactions are executed between Schindler and Hyundai Elevator Co. Ltd. From August 15, 2011, this participation has no longer been recognized as an associate and is, instead, reported as a long-term financial asset.
12 | Schindler Financial Statements 2013 | Notes to the Group financial statements
GroupFinancial Statements
Impairment of available-for-sale financial instruments
A review is carried out at each balance sheet date to determine whether there is objective evidence that a financial instrument is to be impaired. In the case of available- for-sale equity instruments, a significant or prolonged decline in market prices below original cost is regarded as objective evidence of impairment. To determine whether a decline in market prices is significant or prolonged, factors such as the duration and extent of the decrease in market prices below original cost, as well as the historical price volatilities of the instrument, are taken into account.
3 Summary of main accounting principles
3.1 Consolidation
3.1.1 Consolidation principles
The consolidated financial statements include the annual financial statements of Schindler Holding Ltd., Hergiswil, Switzerland, and of all companies controlled by Schindler Holding Ltd. (Group companies). An overview of Group companies is provided in note 37.
The consolidated financial statements are based on the annual financial statements of the individual Group companies that are prepared according to a uniform set of accounting principles and reporting practices. These companies are controlled directly or indirectly by Schindler Holding Ltd. Control exists if Schindler is exposed, or has rights, to variable returns or if it has the ability to affect the amount of those returns through its power over that company. When assessing whether Schindler has power over a company, the voting rights held (normally a share of more than 50% of voting rights) and other contractual agreements, as well as operational respon-sibility, are taken into account.
The assets, liabilities, income, and expenses of all Group companies are consolidated. Non-controlling interests are reported separately. All intra-Group relationships and transactions are eliminated upon consolidation; this includes unrealized profits be tween Group companies.
Companies acquired in the reporting period are included in the consolidated financial statements from the date on which the Group obtained control of their business activities. Companies sold by the Group are consolidated until the date on which control is transferred to the purchaser.
Participations in companies are classified as associates and accounted for using the equity method provided Schindler has significant influence over them but does not control them.
3.1.2 Business combinations and goodwill
Business combinations are accounted for using the purchase method. Acquisition costs comprise the consideration paid, including the proportion of the purchase price retained for contractual representations and warranties, and contingent consideration. The latter is recognized at fair value on the transaction date. Subsequent changes in the
The average number of critical judgements and accounting estimates disclosed is six, unchanged from the previous year despite increased management judgement required in the application of IFRS 10.
To start a new section, hold down the apple+shift keys and click
to release this object and type the section title in the box below.
2013 2012
0
1
2
3
4
5
6
7
8
9 and +876543 and –
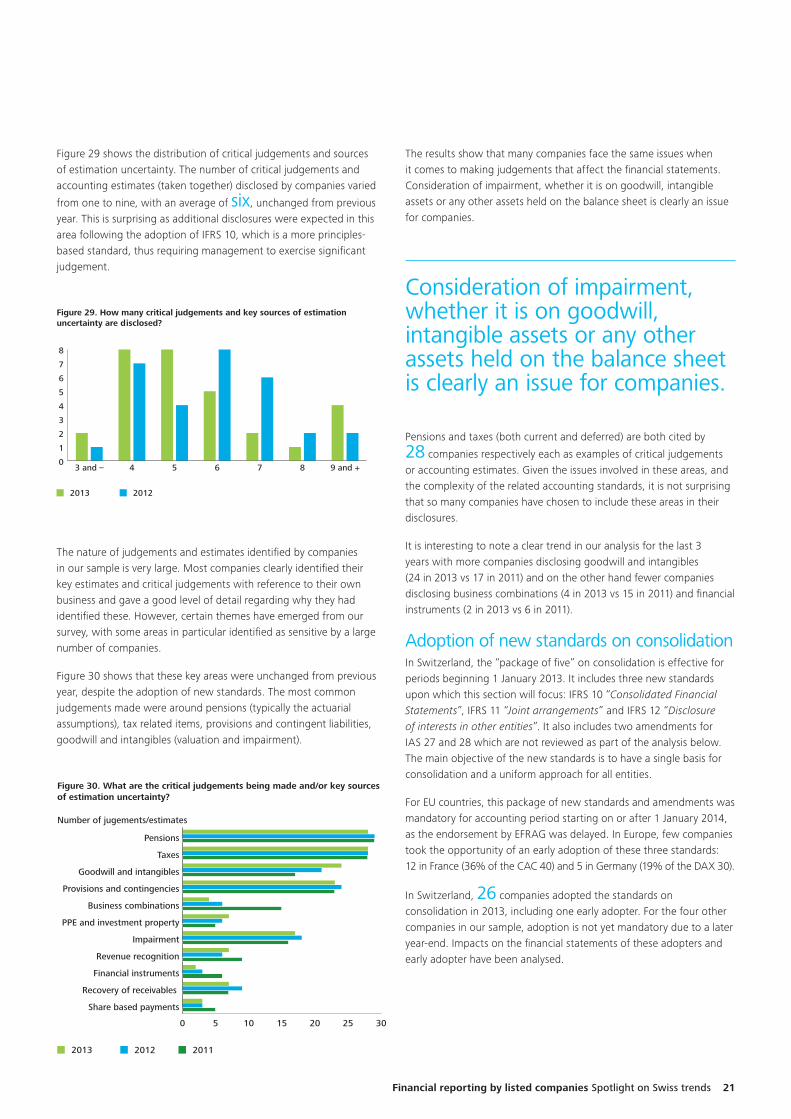
Figure 29. How many critical judgements and key sources of estimation uncertainty are disclosed?
2013 2012 2011
0 5 10 15 20 25 30
Share based payments
Recovery of receivables
Financial instruments
Revenue recognition
Impairment
PPE and investment property
Business combinations
Provisions and contingencies
Goodwill and intangibles
Taxes
Pensions
Number of jugements/estimates
Figure 30. What are the critical judgements being made and/or key sourcesof estimation uncertainty?
The results show that many companies face the same issues when it comes to making judgements that affect the financial statements. Consideration of impairment, whether it is on goodwill, intangible assets or any other assets held on the balance sheet is clearly an issue for companies.
Consideration of impairment, whether it is on goodwill, intangible assets or any other assets held on the balance sheet is clearly an issue for companies.
Pensions and taxes (both current and deferred) are both cited by
28 companies respectively each as examples of critical judgements or accounting estimates. Given the issues involved in these areas, and the complexity of the related accounting standards, it is not surprising that so many companies have chosen to include these areas in their disclosures.
It is interesting to note a clear trend in our analysis for the last 3 years with more companies disclosing goodwill and intangibles (24 in 2013 vs 17 in 2011) and on the other hand fewer companies disclosing business combinations (4 in 2013 vs 15 in 2011) and financial instruments (2 in 2013 vs 6 in 2011).
Adoption of new standards on consolidationIn Switzerland, the “package of five” on consolidation is effective for periods beginning 1 January 2013. It includes three new standards upon which this section will focus: IFRS 10 “Consolidated Financial Statements”, IFRS 11 “Joint arrangements” and IFRS 12 “Disclosure of interests in other entities”. It also includes two amendments for IAS 27 and 28 which are not reviewed as part of the analysis below. The main objective of the new standards is to have a single basis for consolidation and a uniform approach for all entities.
For EU countries, this package of new standards and amendments was mandatory for accounting period starting on or after 1 January 2014, as the endorsement by EFRAG was delayed. In Europe, few companies took the opportunity of an early adoption of these three standards: 12 in France (36% of the CAC 40) and 5 in Germany (19% of the DAX 30).
In Switzerland, 26 companies adopted the standards on consolidation in 2013, including one early adopter. For the four other companies in our sample, adoption is not yet mandatory due to a later year-end. Impacts on the financial statements of these adopters and early adopter have been analysed.
Financial reporting by listed companies Spotlight on Swiss trends 21
Figure 29 shows the distribution of critical judgements and sources of estimation uncertainty. The number of critical judgements and accounting estimates (taken together) disclosed by companies varied
from one to nine, with an average of six, unchanged from previous year. This is surprising as additional disclosures were expected in this area following the adoption of IFRS 10, which is a more principles-based standard, thus requiring management to exercise significant judgement.
The nature of judgements and estimates identified by companies in our sample is very large. Most companies clearly identified their key estimates and critical judgements with reference to their own business and gave a good level of detail regarding why they had identified these. However, certain themes have emerged from our survey, with some areas in particular identified as sensitive by a large number of companies.
Figure 30 shows that these key areas were unchanged from previous year, despite the adoption of new standards. The most common judgements made were around pensions (typically the actuarial assumptions), tax related items, provisions and contingent liabilities, goodwill and intangibles (valuation and impairment).
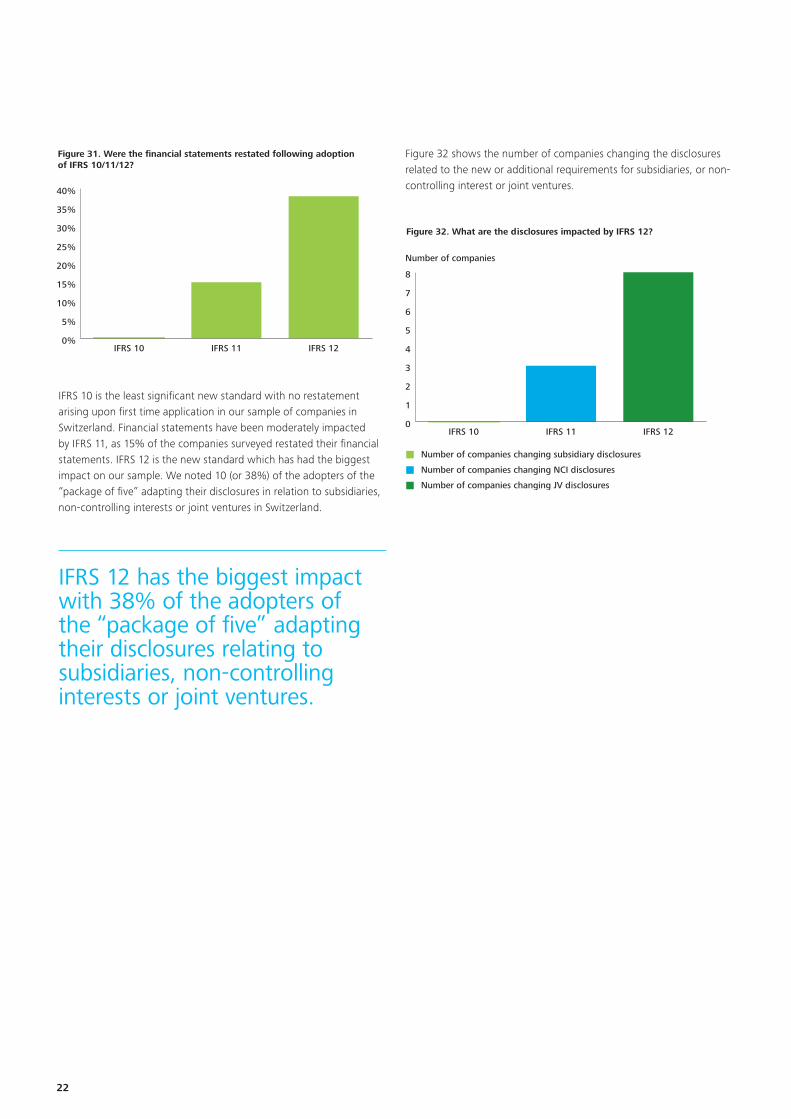
To start a new section, hold down the apple+shift keys and click
to release this object and type the section title in the box below.
0%
5%
10%
15%
20%
25%
30%
35%
40%
IFRS 12IFRS 11IFRS 10
Figure 31. Were the financial statements restated following adoption of IFRS 10/11/12?
IFRS 10 is the least significant new standard with no restatement arising upon first time application in our sample of companies in Switzerland. Financial statements have been moderately impacted by IFRS 11, as 15% of the companies surveyed restated their financial statements. IFRS 12 is the new standard which has had the biggest impact on our sample. We noted 10 (or 38%) of the adopters of the “package of five” adapting their disclosures in relation to subsidiaries, non-controlling interests or joint ventures in Switzerland.
IFRS 12 has the biggest impact with 38% of the adopters of the “package of five” adapting their disclosures relating to subsidiaries, non-controlling interests or joint ventures.
0
1
2
3
4
5
6
7
8
IFRS 12IFRS 11IFRS 10
Figure 32. What are the disclosures impacted by IFRS 12?
Number of companies
Number of companies changing subsidiary disclosures
Number of companies changing NCI disclosures
Number of companies changing JV disclosures
Figure 32 shows the number of companies changing the disclosures related to the new or additional requirements for subsidiaries, or non-controlling interest or joint ventures.
22
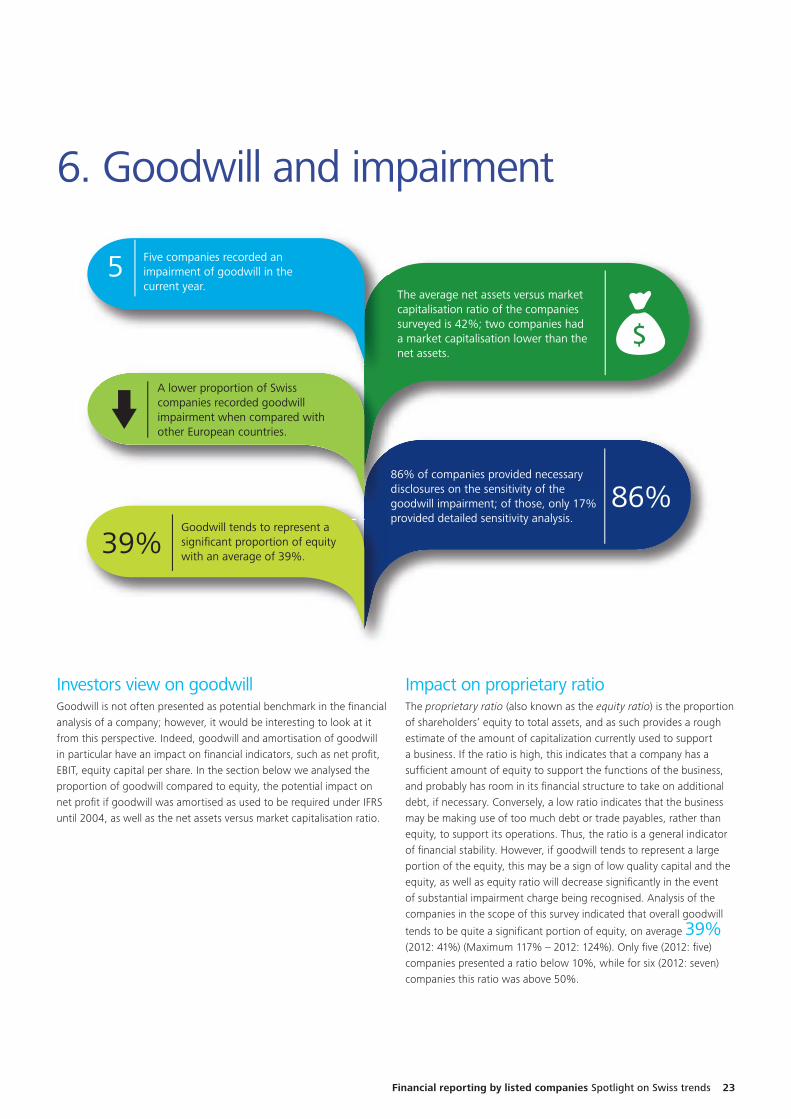
To start a new section, hold down the apple+shift keys and click
to release this object and type the section title in the box below.
6. Goodwill and impairment
Investors view on goodwillGoodwill is not often presented as potential benchmark in the financial analysis of a company; however, it would be interesting to look at it from this perspective. Indeed, goodwill and amortisation of goodwill in particular have an impact on financial indicators, such as net profit, EBIT, equity capital per share. In the section below we analysed the proportion of goodwill compared to equity, the potential impact on net profit if goodwill was amortised as used to be required under IFRS until 2004, as well as the net assets versus market capitalisation ratio.
Impact on proprietary ratioThe proprietary ratio (also known as the equity ratio) is the proportion of shareholders’ equity to total assets, and as such provides a rough estimate of the amount of capitalization currently used to support a business. If the ratio is high, this indicates that a company has a sufficient amount of equity to support the functions of the business, and probably has room in its financial structure to take on additional debt, if necessary. Conversely, a low ratio indicates that the business may be making use of too much debt or trade payables, rather than equity, to support its operations. Thus, the ratio is a general indicator of financial stability. However, if goodwill tends to represent a large portion of the equity, this may be a sign of low quality capital and the equity, as well as equity ratio will decrease significantly in the event of substantial impairment charge being recognised. Analysis of the companies in the scope of this survey indicated that overall goodwill
tends to be quite a significant portion of equity, on average 39% (2012: 41%) (Maximum 117% – 2012: 124%). Only five (2012: five) companies presented a ratio below 10%, while for six (2012: seven) companies this ratio was above 50%.
A lower proportion of Swiss companies recorded goodwill impairment when compared with other European countries.
Goodwill tends to represent a significant proportion of equity with an average of 39%.
The average net assets versus market capitalisation ratio of the companies surveyed is 42%; two companies had a market capitalisation lower than the net assets.
86% of companies provided necessary disclosures on the sensitivity of the goodwill impairment; of those, only 17% provided detailed sensitivity analysis.
A l ti f S i
Five companies recorded an impairment of goodwill in the current year.
5
86%
39%
Financial reporting by listed companies Spotlight on Swiss trends 23
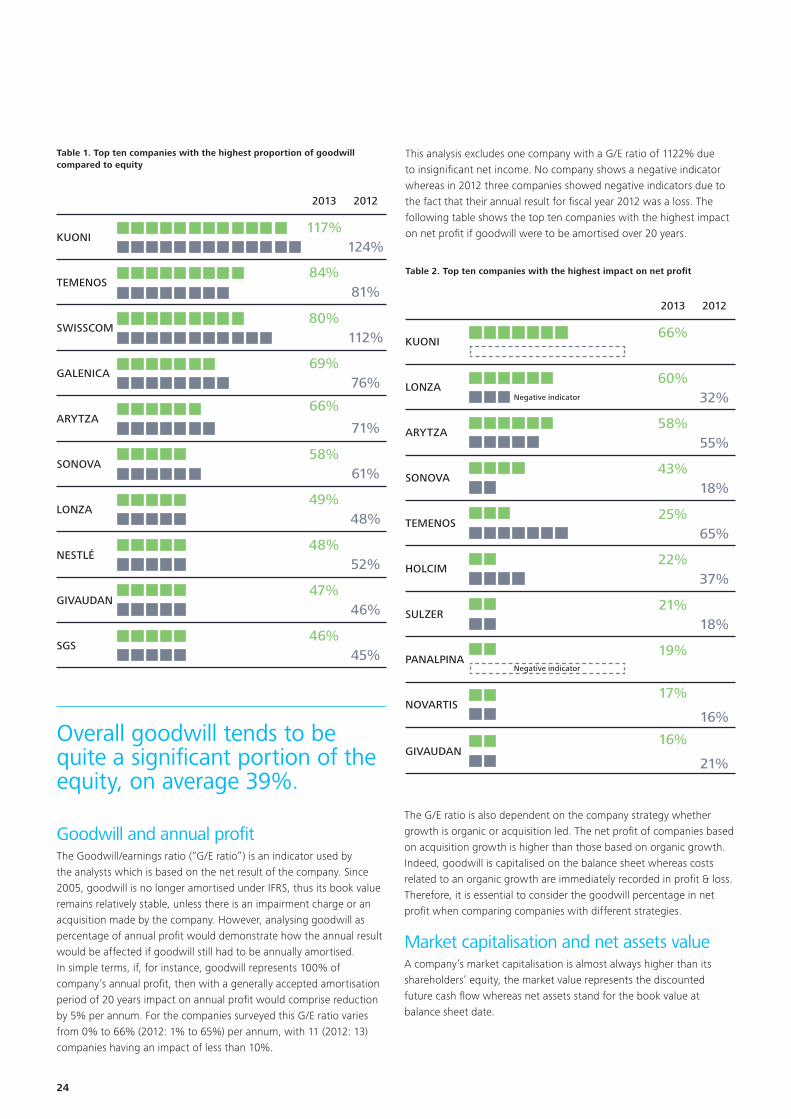
To start a new section, hold down the apple+shift keys and click
to release this object and type the section title in the box below.
Goodwill and annual profitThe Goodwill/earnings ratio (“G/E ratio”) is an indicator used by the analysts which is based on the net result of the company. Since 2005, goodwill is no longer amortised under IFRS, thus its book value remains relatively stable, unless there is an impairment charge or an acquisition made by the company. However, analysing goodwill as percentage of annual profit would demonstrate how the annual result would be affected if goodwill still had to be annually amortised. In simple terms, if, for instance, goodwill represents 100% of company’s annual profit, then with a generally accepted amortisation period of 20 years impact on annual profit would comprise reduction by 5% per annum. For the companies surveyed this G/E ratio varies from 0% to 66% (2012: 1% to 65%) per annum, with 11 (2012: 13) companies having an impact of less than 10%.
KUONI
2013
117%
84%
80%
69%
66%
58%
49%
48%
47%
46%
2012
124%
81%
112%
76%
71%
61%
48%
52%
46%
45%
TEMENOS
SWISSCOM
GALENICA
ARYTZA
SONOVA
LONZA
NESTLÉ
GIVAUDAN
SGS
Table 1. Top ten companies with the highest proportion of goodwill compared to equity
Overall goodwill tends to be quite a significant portion of the equity, on average 39%.
Table 2. Top ten companies with the highest impact on net profit
2013
66%
60%
58%
43%
25%
22%
21%
19%
17%
16%
2012
32%
55%
18%
65%
37%
18%
16%
21%
KUONI
LONZA
ARYTZA
SONOVA
TEMENOS
HOLCIM
SULZER
PANALPINA
NOVARTIS
GIVAUDAN
Negative indicator
Negative indicator
This analysis excludes one company with a G/E ratio of 1122% due to insignificant net income. No company shows a negative indicator whereas in 2012 three companies showed negative indicators due to the fact that their annual result for fiscal year 2012 was a loss. The following table shows the top ten companies with the highest impact on net profit if goodwill were to be amortised over 20 years.
The G/E ratio is also dependent on the company strategy whether growth is organic or acquisition led. The net profit of companies based on acquisition growth is higher than those based on organic growth. Indeed, goodwill is capitalised on the balance sheet whereas costs related to an organic growth are immediately recorded in profit & loss. Therefore, it is essential to consider the goodwill percentage in net profit when comparing companies with different strategies.
Market capitalisation and net assets value A company’s market capitalisation is almost always higher than its shareholders’ equity, the market value represents the discounted future cash flow whereas net assets stand for the book value at balance sheet date.
24
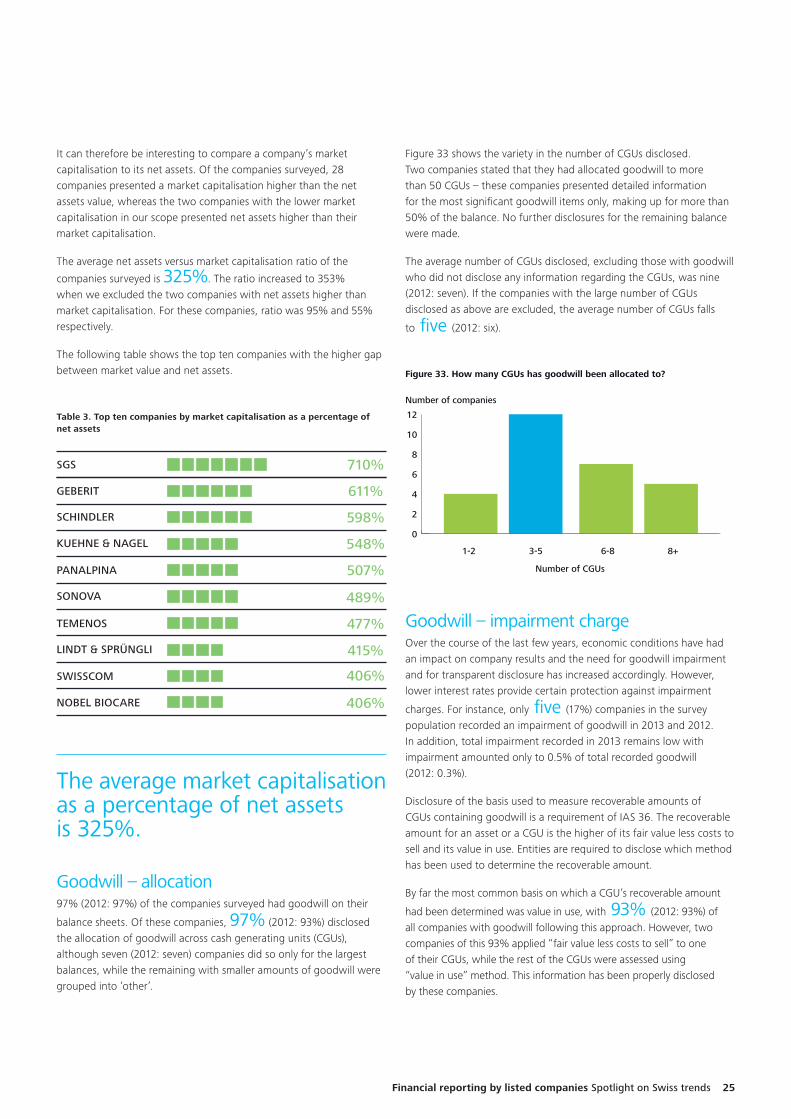
To start a new section, hold down the apple+shift keys and click
to release this object and type the section title in the box below.
It can therefore be interesting to compare a company’s market capitalisation to its net assets. Of the companies surveyed, 28 companies presented a market capitalisation higher than the net assets value, whereas the two companies with the lower market capitalisation in our scope presented net assets higher than their market capitalisation.
The average net assets versus market capitalisation ratio of the
companies surveyed is 325%. The ratio increased to 353% when we excluded the two companies with net assets higher than market capitalisation. For these companies, ratio was 95% and 55% respectively.
The following table shows the top ten companies with the higher gap between market value and net assets.
The average market capitalisation as a percentage of net assets is 325%.
0
2
4
6
8
10
12
1-2 3-5 6-8 8+
Number of CGUs
Figure 33. How many CGUs has goodwill been allocated to?
Number of companies
Goodwill – impairment charge Over the course of the last few years, economic conditions have had an impact on company results and the need for goodwill impairment and for transparent disclosure has increased accordingly. However, lower interest rates provide certain protection against impairment
charges. For instance, only five (17%) companies in the survey population recorded an impairment of goodwill in 2013 and 2012. In addition, total impairment recorded in 2013 remains low with impairment amounted only to 0.5% of total recorded goodwill (2012: 0.3%).
Disclosure of the basis used to measure recoverable amounts of CGUs containing goodwill is a requirement of IAS 36. The recoverable amount for an asset or a CGU is the higher of its fair value less costs to sell and its value in use. Entities are required to disclose which method has been used to determine the recoverable amount.
By far the most common basis on which a CGU’s recoverable amount
had been determined was value in use, with 93% (2012: 93%) of all companies with goodwill following this approach. However, two companies of this 93% applied “fair value less costs to sell” to one of their CGUs, while the rest of the CGUs were assessed using “value in use” method. This information has been properly disclosed by these companies.
Figure 33 shows the variety in the number of CGUs disclosed. Two companies stated that they had allocated goodwill to more than 50 CGUs – these companies presented detailed information for the most significant goodwill items only, making up for more than 50% of the balance. No further disclosures for the remaining balance were made.
The average number of CGUs disclosed, excluding those with goodwill who did not disclose any information regarding the CGUs, was nine (2012: seven). If the companies with the large number of CGUs disclosed as above are excluded, the average number of CGUs falls
to five (2012: six).
Table 3. Top ten companies by market capitalisation as a percentage of net assets
KUEHNE & NAGEL
710%
611%
598%
548%
507%
489%
477%
415%
406%
406%
SGS
GEBERIT
SCHINDLER
PANALPINA
SONOVA
TEMENOS
LINDT & SPRÜNGLI
SWISSCOM
NOBEL BIOCARE
Goodwill – allocation97% (2012: 97%) of the companies surveyed had goodwill on their
balance sheets. Of these companies, 97% (2012: 93%) disclosed the allocation of goodwill across cash generating units (CGUs), although seven (2012: seven) companies did so only for the largest balances, while the remaining with smaller amounts of goodwill were grouped into ‘other’.
Financial reporting by listed companies Spotlight on Swiss trends 25
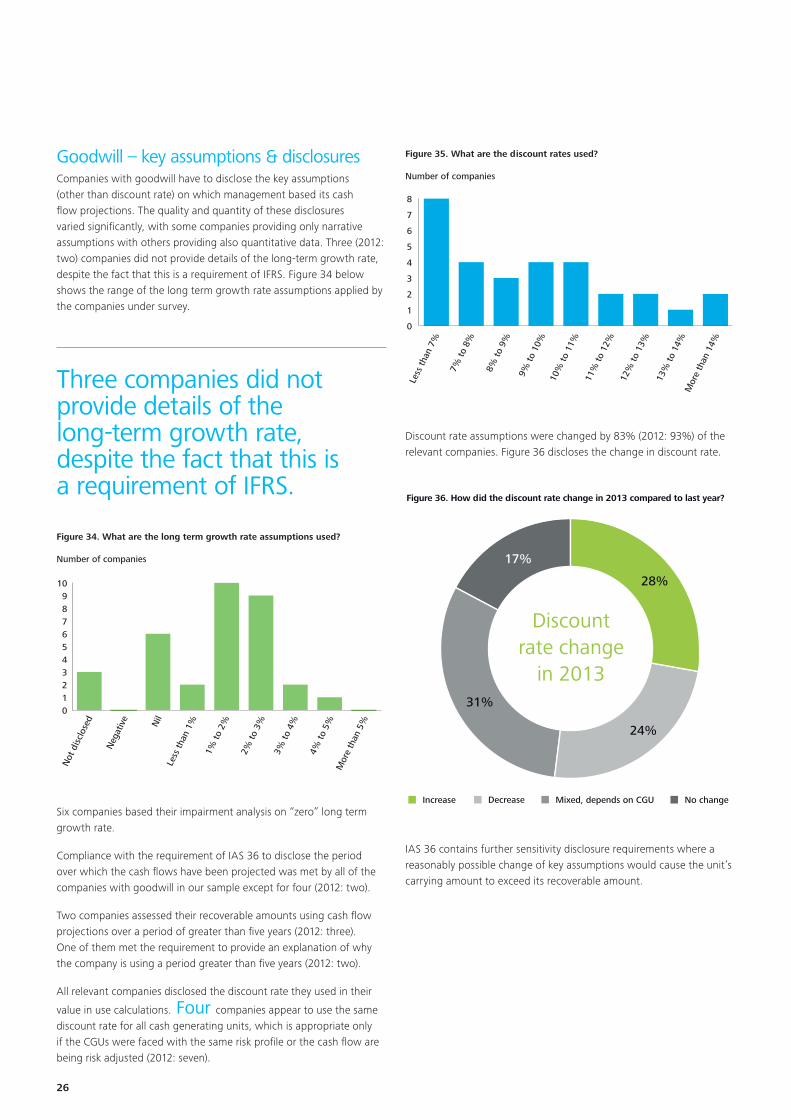
To start a new section, hold down the apple+shift keys and click
to release this object and type the section title in the box below.
0123456789
10
Not
dis
clos
ed
Neg
ativ
e
Nil
Less
than
1%
1% to
2%
2% to
3%
3% to
4%
4% to
5%
Mor
e th
an 5
%
Figure 34. What are the long term growth rate assumptions used?
Number of companies
0
1
2
3
4
5
6
7
8
Less
than
7%
7% to
8%
8% to
9%
9% to
10%
10%
to 1
1%
11%
to 1
2%
12%
to 1
3%
13%
to 1
4%M
ore
than
14%
Figure 35. What are the discount rates used?
Number of companies
Six companies based their impairment analysis on “zero” long term growth rate.
Compliance with the requirement of IAS 36 to disclose the period over which the cash flows have been projected was met by all of the companies with goodwill in our sample except for four (2012: two).
Two companies assessed their recoverable amounts using cash flow projections over a period of greater than five years (2012: three). One of them met the requirement to provide an explanation of why the company is using a period greater than five years (2012: two).
All relevant companies disclosed the discount rate they used in their
value in use calculations. Four companies appear to use the same discount rate for all cash generating units, which is appropriate only if the CGUs were faced with the same risk profile or the cash flow are being risk adjusted (2012: seven).
Figure 36. How did the discount rate change in 2013 compared to last year?
28%
17%
31%
24%
Increase Decrease Mixed, depends on CGU No change
Discount rate change
in 2013
IAS 36 contains further sensitivity disclosure requirements where a reasonably possible change of key assumptions would cause the unit’s carrying amount to exceed its recoverable amount.
Discount rate assumptions were changed by 83% (2012: 93%) of the relevant companies. Figure 36 discloses the change in discount rate.
Three companies did not provide details of the long-term growth rate, despite the fact that this is a requirement of IFRS.
Goodwill – key assumptions & disclosuresCompanies with goodwill have to disclose the key assumptions (other than discount rate) on which management based its cash flow projections. The quality and quantity of these disclosures varied significantly, with some companies providing only narrative assumptions with others providing also quantitative data. Three (2012: two) companies did not provide details of the long-term growth rate, despite the fact that this is a requirement of IFRS. Figure 34 below shows the range of the long term growth rate assumptions applied by the companies under survey.
26
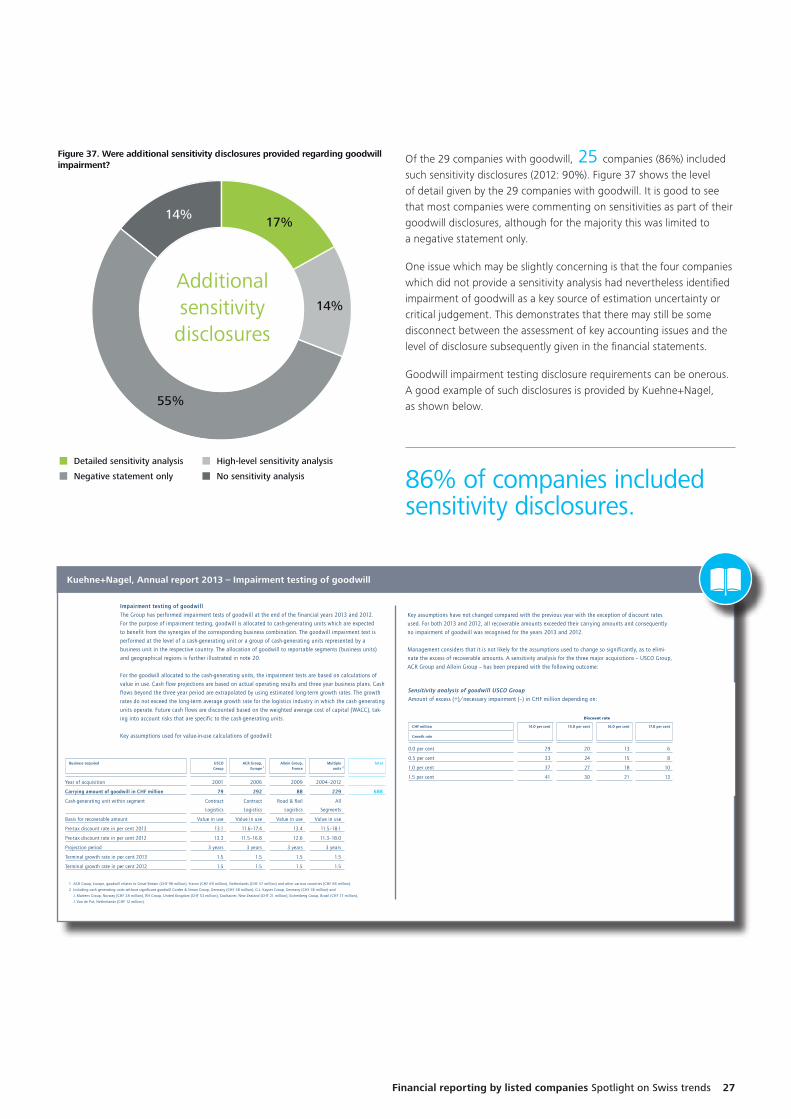
To start a new section, hold down the apple+shift keys and click
to release this object and type the section title in the box below.
Figure 37. Were additional sensitivity disclosures provided regarding goodwill impairment?
17%14%
55%
14%
Detailed sensitivity analysis High-level sensitivity analysis
Negative statement only No sensitivity analysis
Additionalsensitivitydisclosures
Of the 29 companies with goodwill, 25 companies (86%) included such sensitivity disclosures (2012: 90%). Figure 37 shows the level of detail given by the 29 companies with goodwill. It is good to see that most companies were commenting on sensitivities as part of their goodwill disclosures, although for the majority this was limited to a negative statement only.
One issue which may be slightly concerning is that the four companies which did not provide a sensitivity analysis had nevertheless identified impairment of goodwill as a key source of estimation uncertainty or critical judgement. This demonstrates that there may still be some disconnect between the assessment of key accounting issues and the level of disclosure subsequently given in the financial statements.
Goodwill impairment testing disclosure requirements can be onerous. A good example of such disclosures is provided by Kuehne+Nagel, as shown below.
98 Consolidated Financial Statements 2013 other notes
impairment testing of goodwill
the group has performed impairment tests of goodwill at the end of the financial years 2013 and 2012.
for the purpose of impairment testing, goodwill is allocated to cash-generating units which are expected
to benefit from the synergies of the corresponding business combination. the goodwill impairment test is
performed at the level of a cash-generating unit or a group of cash-generating units represented by a
business unit in the respective country. the allocation of goodwill to reportable segments (business units)
and geographical regions is further illustrated in note 20.
for the goodwill allocated to the cash-generating units, the impairment tests are based on calculations of
value in use. cash flow projections are based on actual operating results and three year business plans. cash
flows beyond the three year period are extrapolated by using estimated long-term growth rates. the growth
rates do not exceed the long-term average growth rate for the logistics industry in which the cash generating
units operate. future cash flows are discounted based on the weighted average cost of capital (wacc), tak-
ing into account risks that are specific to the cash-generating units.
key assumptions used for value-in-use calculations of goodwill:
key assumptions have not changed compared with the previous year with the exception of discount rates
used. for both 2013 and 2012, all recoverable amounts exceeded their carrying amounts and consequently
no impairment of goodwill was recognised for the years 2013 and 2012.
management considers that it is not likely for the assumptions used to change so significantly, as to elimi-
nate the excess of recoverable amounts. a sensitivity analysis for the three major acquisitions – usco group,
acr group and alloin group – has been prepared with the following outcome:
1
business acquired uscogroup
acr group,europe
alloin group,france
multiple units
total
year of acquisition 2001 2006 2009 2004–2012
carrying amount of goodwill in chf million 79 292 88 229 688
cash-generating unit within segment contract
logistics
contract
logistics
road & rail
logistics
all
segments
basis for recoverable amount value in use value in use value in use value in use
pre-tax discount rate in per cent 2013 13.1 11.6–17.4 13.4 11.5–18.1
pre-tax discount rate in per cent 2012 13.3 11.5–16.8 12.6 11.3–18.0
projection period 3 years 3 years 3 years 3 years
terminal growth rate in per cent 2013 1.5 1.5 1.5 1.5
terminal growth rate in per cent 2012 1.5 1.5 1.5 1.5
1 acr group, europe, goodwill relates to great britain (chf 98 million), france (chf 69 million), netherlands (chf 57 million) and other various countries (chf 68 million).
2 including cash generating units without significant goodwill cordes & simon group, germany (chf 38 million), g.l. kayser group, germany (chf 36 million) and
J. martens group, norway (chf 28 million), rh group, united kingdom (chf 53 million), cooltainer, new zealand (chf 21 million), eichenberg group, brazil (chf 17 million),
J. van de put, netherlands (chf 12 million).
2
99Consolidated Financial Statements 2013 other notes
Sensitivity analysis of goodwill USCO Group
amount of excess (+)/necessary impairment (–) in chf million depending on:
Sensitivity analysis of goodwill ACR Group
amount of excess (+)/necessary impairment (–) in chf million depending on:
Sensitivity analysis of goodwill Alloin Group
amount of excess (+)/necessary impairment (–) in chf million depending on:
Discount rate
chf million 14.0 per cent 15.0 per cent 16.0 per cent 17.0 per cent
growth rate
0.0 per cent 29 20 13 6
0.5 per cent 33 24 15 8
1.0 per cent 37 27 18 10
1.5 per cent 41 30 21 13
Discount rate
chf million 15.0 per cent 16.0 per cent 17.0 per cent 18.0 per cent
growth rate
0.0 per cent 484 439 399 364
0.5 per cent 501 454 412 375
1.0 per cent 520 470 426 387
1.5 per cent 540 487 441 400
Discount rate
chf million 13.0 per cent 14.0 per cent 15.0 per cent 16.0 per cent
growth rate
0.0 per cent 72 60 50 41
0.5 per cent 77 65 54 44
1.0 per cent 82 69 57 48
1.5 per cent 88 74 62 51
Kuehne+Nagel, Annual report 2013 – Impairment testing of goodwill
86% of companies included sensitivity disclosures.
Financial reporting by listed companies Spotlight on Swiss trends 27
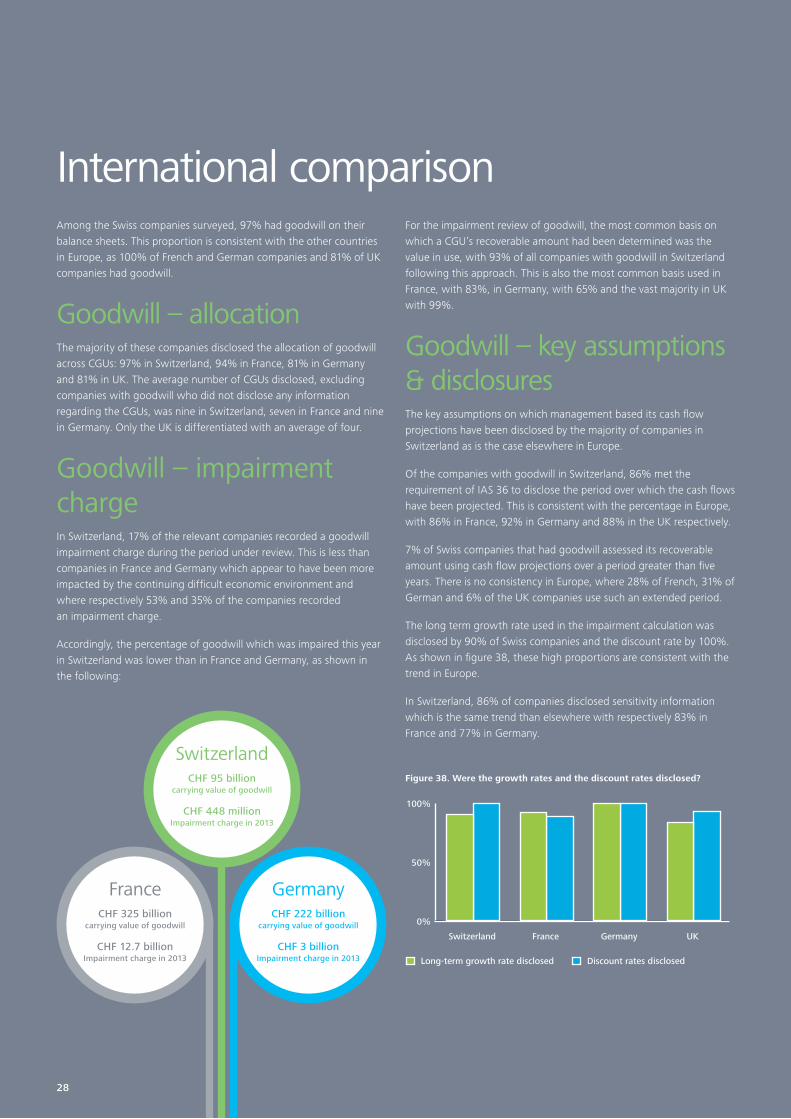
To start a new section, hold down the apple+shift keys and click
to release this object and type the section title in the box below.
International comparisonAmong the Swiss companies surveyed, 97% had goodwill on their balance sheets. This proportion is consistent with the other countries in Europe, as 100% of French and German companies and 81% of UK companies had goodwill.
Goodwill – allocationThe majority of these companies disclosed the allocation of goodwill across CGUs: 97% in Switzerland, 94% in France, 81% in Germany and 81% in UK. The average number of CGUs disclosed, excluding companies with goodwill who did not disclose any information regarding the CGUs, was nine in Switzerland, seven in France and nine in Germany. Only the UK is differentiated with an average of four.
Goodwill – impairment chargeIn Switzerland, 17% of the relevant companies recorded a goodwill impairment charge during the period under review. This is less than companies in France and Germany which appear to have been more impacted by the continuing difficult economic environment and where respectively 53% and 35% of the companies recorded an impairment charge.
Accordingly, the percentage of goodwill which was impaired this year in Switzerland was lower than in France and Germany, as shown in the following:
For the impairment review of goodwill, the most common basis on which a CGU’s recoverable amount had been determined was the value in use, with 93% of all companies with goodwill in Switzerland following this approach. This is also the most common basis used in France, with 83%, in Germany, with 65% and the vast majority in UK with 99%.
Goodwill – key assumptions & disclosures The key assumptions on which management based its cash flow projections have been disclosed by the majority of companies in Switzerland as is the case elsewhere in Europe.
Of the companies with goodwill in Switzerland, 86% met the requirement of IAS 36 to disclose the period over which the cash flows have been projected. This is consistent with the percentage in Europe, with 86% in France, 92% in Germany and 88% in the UK respectively.
7% of Swiss companies that had goodwill assessed its recoverable amount using cash flow projections over a period greater than five years. There is no consistency in Europe, where 28% of French, 31% of German and 6% of the UK companies use such an extended period.
The long term growth rate used in the impairment calculation was disclosed by 90% of Swiss companies and the discount rate by 100%. As shown in figure 38, these high proportions are consistent with the trend in Europe.
In Switzerland, 86% of companies disclosed sensitivity information which is the same trend than elsewhere with respectively 83% in France and 77% in Germany.
0%
50%
100%
UKGermanyFranceSwitzerland
Long-term growth rate disclosed Discount rates disclosed
Figure 38. Were the growth rates and the discount rates disclosed?
Switzerland CHF 95 billion
carrying value of goodwill
CHF 448 millionImpairment charge in 2013
France CHF 325 billion
carrying value of goodwill
CHF 12.7 billionImpairment charge in 2013
Germany CHF 222 billion
carrying value of goodwill
CHF 3 billionImpairment charge in 2013
2828
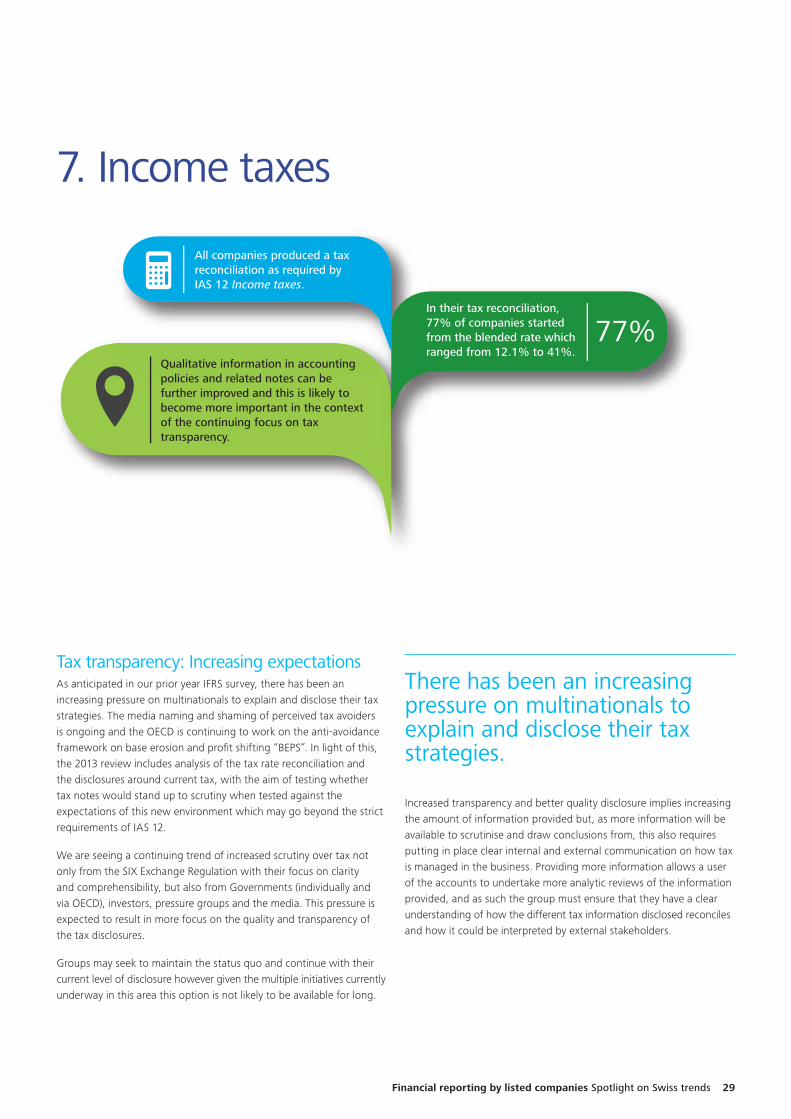
To start a new section, hold down the apple+shift keys and click
to release this object and type the section title in the box below.
Financial reporting by listed companies Spotlight on Swiss trends 29
7. Income taxes
All companies produced a tax reconciliation as required by IAS 12 Income taxes.
In their tax reconciliation, 77% of companies started from the blended rate which ranged from 12.1% to 41%.
Qualitative information in accounting policies and related notes can be further improved and this is likely to become more important in the context of the continuing focus on tax transparency.
77%
Tax transparency: Increasing expectations As anticipated in our prior year IFRS survey, there has been an increasing pressure on multinationals to explain and disclose their tax strategies. The media naming and shaming of perceived tax avoiders is ongoing and the OECD is continuing to work on the anti-avoidance framework on base erosion and profit shifting “BEPS”. In light of this, the 2013 review includes analysis of the tax rate reconciliation and the disclosures around current tax, with the aim of testing whether tax notes would stand up to scrutiny when tested against the expectations of this new environment which may go beyond the strict requirements of IAS 12.
We are seeing a continuing trend of increased scrutiny over tax not only from the SIX Exchange Regulation with their focus on clarity and comprehensibility, but also from Governments (individually and via OECD), investors, pressure groups and the media. This pressure is expected to result in more focus on the quality and transparency of the tax disclosures.
Groups may seek to maintain the status quo and continue with their current level of disclosure however given the multiple initiatives currently underway in this area this option is not likely to be available for long.
There has been an increasing pressure on multinationals to explain and disclose their tax strategies.
Increased transparency and better quality disclosure implies increasing the amount of information provided but, as more information will be available to scrutinise and draw conclusions from, this also requires putting in place clear internal and external communication on how tax is managed in the business. Providing more information allows a user of the accounts to undertake more analytic reviews of the information provided, and as such the group must ensure that they have a clear understanding of how the different tax information disclosed reconciles and how it could be interpreted by external stakeholders.
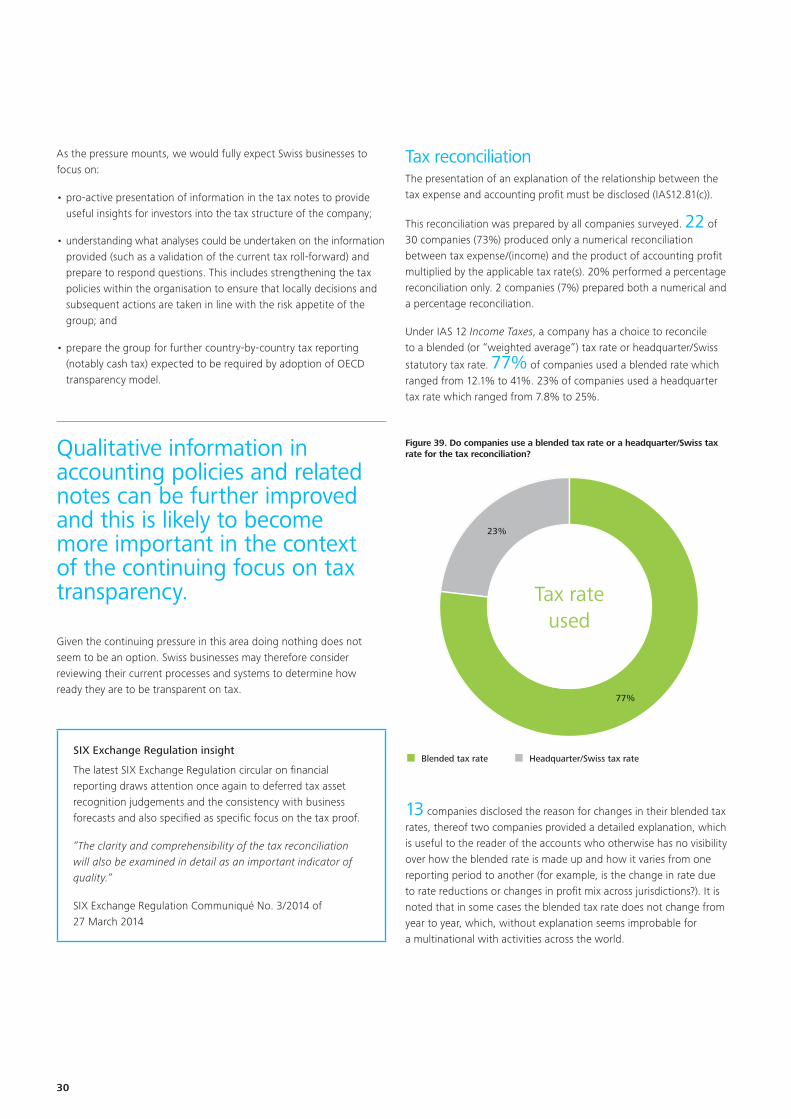
To start a new section, hold down the apple+shift keys and click
to release this object and type the section title in the box below.
30
As the pressure mounts, we would fully expect Swiss businesses to focus on:
• pro-active presentation of information in the tax notes to provide useful insights for investors into the tax structure of the company;
• understanding what analyses could be undertaken on the information provided (such as a validation of the current tax roll-forward) and prepare to respond questions. This includes strengthening the tax policies within the organisation to ensure that locally decisions and subsequent actions are taken in line with the risk appetite of the group; and
• prepare the group for further country-by-country tax reporting (notably cash tax) expected to be required by adoption of OECD transparency model.
Qualitative information in accounting policies and related notes can be further improved and this is likely to become more important in the context of the continuing focus on tax transparency.
Given the continuing pressure in this area doing nothing does not seem to be an option. Swiss businesses may therefore consider reviewing their current processes and systems to determine how ready they are to be transparent on tax.
SIX Exchange Regulation insight
The latest SIX Exchange Regulation circular on financial reporting draws attention once again to deferred tax asset recognition judgements and the consistency with business forecasts and also specified as specific focus on the tax proof.
“The clarity and comprehensibility of the tax reconciliation will also be examined in detail as an important indicator of quality.“
SIX Exchange Regulation Communiqué No. 3/2014 of 27 March 2014
Tax reconciliation The presentation of an explanation of the relationship between the tax expense and accounting profit must be disclosed (IAS12.81(c)).
This reconciliation was prepared by all companies surveyed. 22 of 30 companies (73%) produced only a numerical reconciliation between tax expense/(income) and the product of accounting profit multiplied by the applicable tax rate(s). 20% performed a percentage reconciliation only. 2 companies (7%) prepared both a numerical and a percentage reconciliation.
Under IAS 12 Income Taxes, a company has a choice to reconcile to a blended (or “weighted average”) tax rate or headquarter/Swiss
statutory tax rate. 77% of companies used a blended rate which ranged from 12.1% to 41%. 23% of companies used a headquarter tax rate which ranged from 7.8% to 25%.
Figure 39. Do companies use a blended tax rate or a headquarter/Swiss tax rate for the tax reconciliation?
Blended tax rate Headquarter/Swiss tax rate
77%
23%
Tax rateused
13 companies disclosed the reason for changes in their blended tax rates, thereof two companies provided a detailed explanation, which is useful to the reader of the accounts who otherwise has no visibility over how the blended rate is made up and how it varies from one reporting period to another (for example, is the change in rate due to rate reductions or changes in profit mix across jurisdictions?). It is noted that in some cases the blended tax rate does not change from year to year, which, without explanation seems improbable for a multinational with activities across the world.
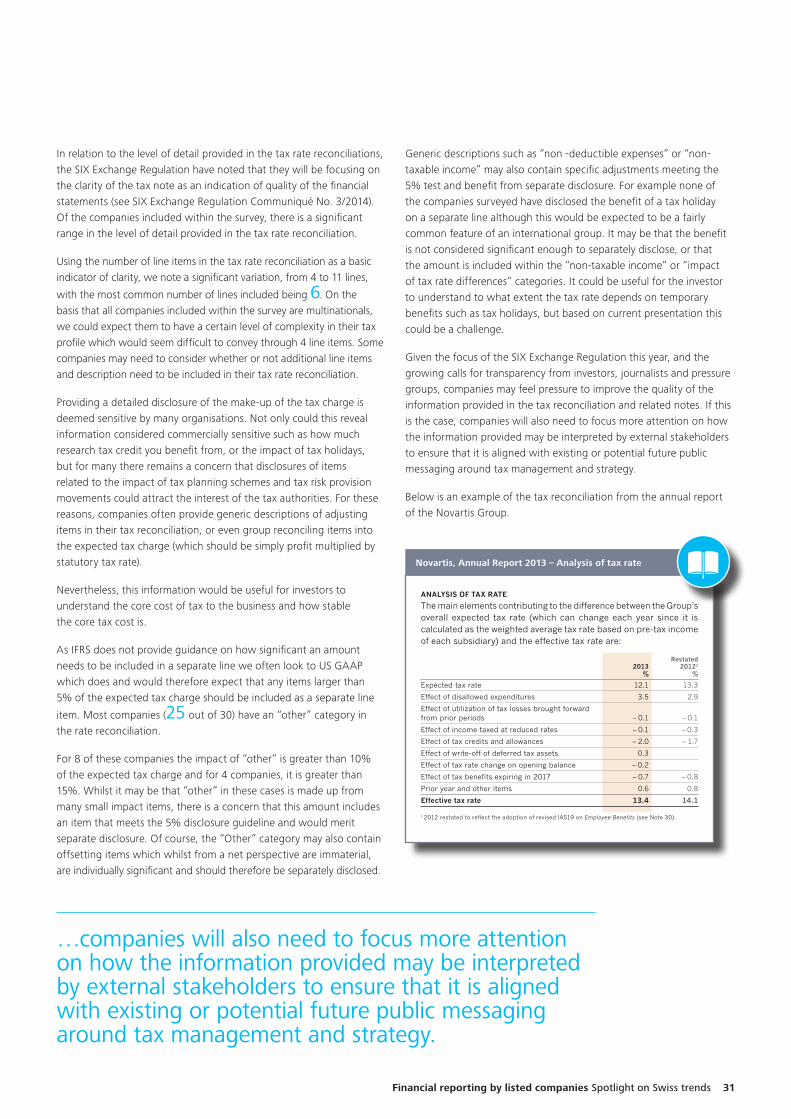
To start a new section, hold down the apple+shift keys and click
to release this object and type the section title in the box below.
Financial reporting by listed companies Spotlight on Swiss trends 31
In relation to the level of detail provided in the tax rate reconciliations, the SIX Exchange Regulation have noted that they will be focusing on the clarity of the tax note as an indication of quality of the financial statements (see SIX Exchange Regulation Communiqué No. 3/2014). Of the companies included within the survey, there is a significant range in the level of detail provided in the tax rate reconciliation.
Using the number of line items in the tax rate reconciliation as a basic indicator of clarity, we note a significant variation, from 4 to 11 lines,
with the most common number of lines included being 6. On the basis that all companies included within the survey are multinationals, we could expect them to have a certain level of complexity in their tax profile which would seem difficult to convey through 4 line items. Some companies may need to consider whether or not additional line items and description need to be included in their tax rate reconciliation.
Providing a detailed disclosure of the make-up of the tax charge is deemed sensitive by many organisations. Not only could this reveal information considered commercially sensitive such as how much research tax credit you benefit from, or the impact of tax holidays, but for many there remains a concern that disclosures of items related to the impact of tax planning schemes and tax risk provision movements could attract the interest of the tax authorities. For these reasons, companies often provide generic descriptions of adjusting items in their tax reconciliation, or even group reconciling items into the expected tax charge (which should be simply profit multiplied by statutory tax rate).
Nevertheless, this information would be useful for investors to understand the core cost of tax to the business and how stable the core tax cost is.
As IFRS does not provide guidance on how significant an amount needs to be included in a separate line we often look to US GAAP which does and would therefore expect that any items larger than 5% of the expected tax charge should be included as a separate line
item. Most companies (25 out of 30) have an “other” category in the rate reconciliation.
For 8 of these companies the impact of “other” is greater than 10% of the expected tax charge and for 4 companies, it is greater than 15%. Whilst it may be that “other” in these cases is made up from many small impact items, there is a concern that this amount includes an item that meets the 5% disclosure guideline and would merit separate disclosure. Of course, the “Other” category may also contain offsetting items which whilst from a net perspective are immaterial, are individually significant and should therefore be separately disclosed.
…companies will also need to focus more attention on how the information provided may be interpreted by external stakeholders to ensure that it is aligned with existing or potential future public messaging around tax management and strategy.
Generic descriptions such as “non -deductible expenses” or “non-taxable income” may also contain specific adjustments meeting the 5% test and benefit from separate disclosure. For example none of the companies surveyed have disclosed the benefit of a tax holiday on a separate line although this would be expected to be a fairly common feature of an international group. It may be that the benefit is not considered significant enough to separately disclose, or that the amount is included within the “non-taxable income” or “impact of tax rate differences” categories. It could be useful for the investor to understand to what extent the tax rate depends on temporary benefits such as tax holidays, but based on current presentation this could be a challenge.
Given the focus of the SIX Exchange Regulation this year, and the growing calls for transparency from investors, journalists and pressure groups, companies may feel pressure to improve the quality of the information provided in the tax reconciliation and related notes. If this is the case, companies will also need to focus more attention on how the information provided may be interpreted by external stakeholders to ensure that it is aligned with existing or potential future public messaging around tax management and strategy.
Below is an example of the tax reconciliation from the annual report of the Novartis Group.
Novartis, Annual Report 2013 – Analysis of tax rate
2032 | GROUP RE V IE W 15 | HE a ltHc a RE P ORtfOl IO 59 | c ORP OR atE RE sP Ons Ib Il I t y 77 | c ORP OR atE GOV ERn a ncE 107 | c OMPEnsat IOn REP ORt 1 39 | F IN A N C I A L R EP O R T
Notes to the Novartis Group Consolidated Financial Statements
5. INTEREST ExPENSE AND OTHER FINANCIAL INCOME AND ExPENSE
iNterest expeNse
2013 2012
usd millions usd millions
Interest expense – 664 – 655
Expense due to discounting long-term liabilities – 19 – 69
total interest expense – 683 – 724
other FiNaNCial iNCome aNd expeNse
2013 2012
usd millions usd millions
Interest income 34 50
Dividend income 1 1
Net capital gains/(losses) on
available-for-sale securities 28 – 6
Net capital (losses)/gains on
cash and cash equivalents – 1 47
Income on forward contracts and options 2 86
Expenses on forward contracts and options – 129
Impairment of commodities
and available-for-sale securities – 14
Other financial expense – 20 – 20
Monetary loss from hyperinflation accounting – 32 – 19
Currency result, net – 90 – 106
total other financial income and expense – 92 – 96
6. TAxES
iNCome BeFore taxes
restated
2013 20121
usd millions usd millions
Switzerland 5 516 5 059
Foreign 5 219 5 866
total income before taxes 10 735 10 925
1 2012 restated to reflect the adoption of revised IAS19 on Employee Benefits (see Note 30).
CurreNt aNd deFerred iNCome tax expeNse
restated
2013 20121
usd millions usd millions
Switzerland – 507 – 530
Foreign – 1 764 – 1 806
total current income tax expense – 2 271 – 2 336
Switzerland 157 267
Foreign 671 527
total deferred tax income 828 794
total income tax expense – 1 443 – 1 542
1 2012 restated to reflect the adoption of revised IAS19 on Employee Benefits (see Note 30).
aNalYsis oF tax rate
The main elements contributing to the difference between the Group’s overall expected tax rate (which can change each year since it is calculated as the weighted average tax rate based on pre-tax income of each subsidiary) and the effective tax rate are:
restated
2013 20121
% %
Expected tax rate 12.1 13.3
Effect of disallowed expenditures 3.5 2.9
Effect of utilization of tax losses brought forward
from prior periods – 0.1 – 0.1
Effect of income taxed at reduced rates – 0.1 – 0.3
Effect of tax credits and allowances – 2.0 – 1.7
Effect of write-off of deferred tax assets 0.3
Effect of tax rate change on opening balance – 0.2
Effect of tax benefits expiring in 2017 – 0.7 – 0.8
Prior year and other items 0.6 0.8
effective tax rate 13.4 14.1
1 2012 restated to reflect the adoption of revised IAS19 on Employee Benefits (see Note 30).
The utilization of tax-loss carry-forwards lowered the tax charge by uSD 13 million in 2013 and by uSD 11 million in 2012, respectively.
To start a new section, hold down the apple+shift keys and click
to release this object and type the section title in the box below.
32
Current tax account reconciliationIAS 12 paragraph 81(a) requires that the “aggregate current and deferred tax relating to items that are charged or credited directly to equity”, to provide transparency over where the movements in current and deferred tax have been booked. Further in IAS 12 paragraph 81(g)(ii) it is specifically required to disclose the deferred tax booked to profit and loss if this is not apparent from the statement of financial position.
Many companies completed the obligation related to deferred taxes satisfactorily, showing the movements between opening and closing deferred tax balances split between equity and the income statement. However, for 47% of companies, a reconstruction of the current tax payable roll-forward (movement from opening to closing net tax payable or receivable positions) based on the information provided in the statement of financial position and supporting notes showed an unreconciled amount of at least 10% of the cash paid in the year1. The explanation for these differences may be that there have been acquisitions or disposals or there are foreign exchange movements or current tax amounts booked to equity which are not being disclosed as required by the standard. It could also be that there is a lack of consistency in the amounts included as “current income taxes” in the various different statements (P&L, cash flow, equity), for example the cash flow statement may include tax penalties but the P&L tax charge excludes them. In the absence of a clear explanation in the accounts, a reader may also draw the conclusion that the figures are not reliable which could undermine confidence in the information presented.
For 47% of companies the current tax roll-forward could not be easily reconstructed from other disclosures in the financial statements, indicating a potential lack or transparency.
Irrespective of the reason for the unreconciled amounts, this review highlights the difficulties that companies have in reconciling cash taxes. These difficulties often arise as different information sources may be used for different elements of the tax disclosures and tax data collection templates may not contain coherence checks between these sources. Those businesses who are currently finding the process challenging, will no doubt need to consider what additional steps and controls will be required to satisfy the country-by-country reporting requirements that the OECD are proposing.
Country-by-country reporting
The country-by-country reporting proposals put forward by the OECD would require businesses to make available to tax authorities in the countries in which they operate certain key information (on a country by country basis) such as turnover, cash taxes paid, number of staff employed amongst others. Whilst the proposal to make this information publically available has been axed and therefore there would be no impact on the financial statements as a result of this reform, it would still be expected that businesses would leverage from the existing tax reporting processes to gather the required information.
Deferred tax assetsDeferred tax assets are recognised for all deductible temporary differences and all unused tax losses and tax credits, to the extent that it is probable that the future taxable profit will be available against which they can be utilised (IAS 12.24). The amount and expiry date of deductible temporary differences for which no deferred tax asset was recognised must be disclosed (IAS 12.81(e)).
90% of companies clearly disclosed the amount of deductible temporary differences, unused tax credits and tax losses for which no deferred tax asset had been recognised on the balance sheet. Most companies disclosed unused tax losses. Two companies disclosed only the amount and expiry date of deductible temporary differences, unused tax credits and tax loss for which a DTA had been recognised.
Deferred tax balances: offsettingAn entity shall offset deferred tax assets and deferred tax liabilities only if:
• the entity has a legal right to offset current assets against current liabilities; and
• the deferred tax assets and deferred tax liabilities relate to income taxes levied by the same taxation authority on either:
– the same taxable entity; or
– different taxable entities which intend either to settle current tax liabilities and assets on a net basis, or to realise the assets and settle the liabilities simultaneously, in each future period in which significant amounts of deferred tax liabilities or assets are expected to be settled or recovered.
1 In order to compare the unreconciled amount between different companies, percentage of cash paid in the year was used as a comparator. Current tax charge and opening or closing balance sheet positions could also have been used.
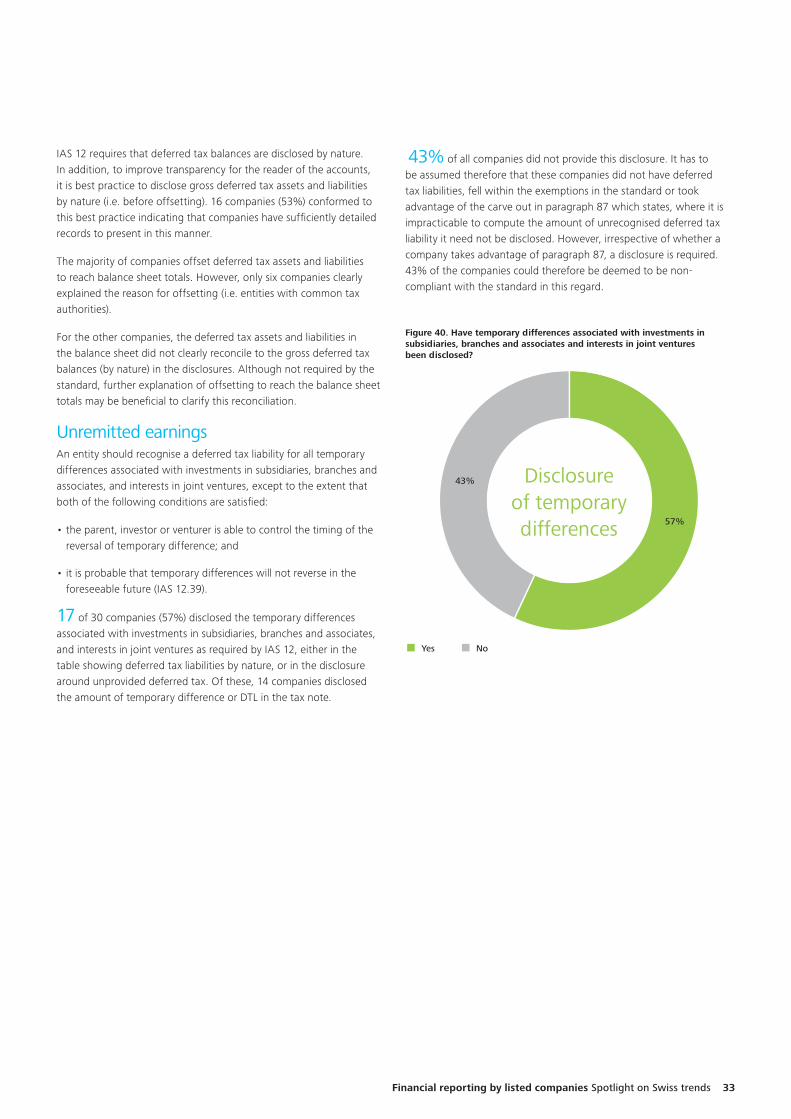
To start a new section, hold down the apple+shift keys and click
to release this object and type the section title in the box below.
Financial reporting by listed companies Spotlight on Swiss trends 33
IAS 12 requires that deferred tax balances are disclosed by nature. In addition, to improve transparency for the reader of the accounts, it is best practice to disclose gross deferred tax assets and liabilities by nature (i.e. before offsetting). 16 companies (53%) conformed to this best practice indicating that companies have sufficiently detailed records to present in this manner.
The majority of companies offset deferred tax assets and liabilities to reach balance sheet totals. However, only six companies clearly explained the reason for offsetting (i.e. entities with common tax authorities).
For the other companies, the deferred tax assets and liabilities in the balance sheet did not clearly reconcile to the gross deferred tax balances (by nature) in the disclosures. Although not required by the standard, further explanation of offsetting to reach the balance sheet totals may be beneficial to clarify this reconciliation.
Unremitted earningsAn entity should recognise a deferred tax liability for all temporary differences associated with investments in subsidiaries, branches and associates, and interests in joint ventures, except to the extent that both of the following conditions are satisfied:
• the parent, investor or venturer is able to control the timing of the reversal of temporary difference; and
• it is probable that temporary differences will not reverse in the foreseeable future (IAS 12.39).
17 of 30 companies (57%) disclosed the temporary differences associated with investments in subsidiaries, branches and associates, and interests in joint ventures as required by IAS 12, either in the table showing deferred tax liabilities by nature, or in the disclosure around unprovided deferred tax. Of these, 14 companies disclosed the amount of temporary difference or DTL in the tax note.
Figure 40. Have temporary differences associated with investments in subsidiaries, branches and associates and interests in joint ventures been disclosed?
Yes No
57%
43% Disclosureof temporarydifferences
43% of all companies did not provide this disclosure. It has to be assumed therefore that these companies did not have deferred tax liabilities, fell within the exemptions in the standard or took advantage of the carve out in paragraph 87 which states, where it is impracticable to compute the amount of unrecognised deferred tax liability it need not be disclosed. However, irrespective of whether a company takes advantage of paragraph 87, a disclosure is required. 43% of the companies could therefore be deemed to be non-compliant with the standard in this regard.
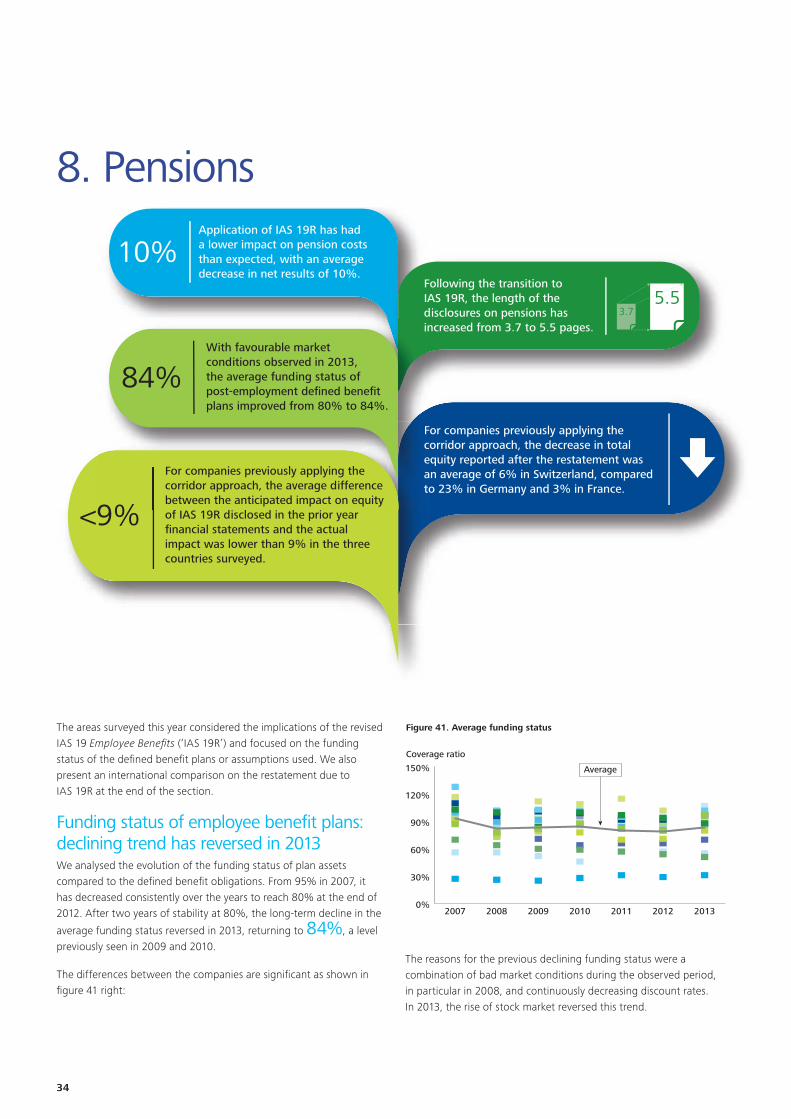
To start a new section, hold down the apple+shift keys and click
to release this object and type the section title in the box below.
34
8. PensionsApplication of IAS 19R has had a lower impact on pension costs than expected, with an average decrease in net results of 10%.
Following the transition to IAS 19R, the length of the disclosures on pensions has increased from 3.7 to 5.5 pages.
For companies previously applying the corridor approach, the average difference between the anticipated impact on equity of IAS 19R disclosed in the prior year financial statements and the actual impact was lower than 9% in the three countries surveyed.
For companies previously applying the corridor approach, the decrease in total equity reported after the restatement was an average of 6% in Switzerland, compared to 23% in Germany and 3% in France.
10%
i
For companies previously applying the corridor approach, the average differencebetween the anticipated impact on equity
Fceat
With favourable market conditions observed in 2013,the average funding status of post-employment defined benefit plans improved from 80% to 84%.
84%
<9%
3.75.5
The areas surveyed this year considered the implications of the revised IAS 19 Employee Benefits (‘IAS 19R’) and focused on the funding status of the defined benefit plans or assumptions used. We also present an international comparison on the restatement due to IAS 19R at the end of the section.
Funding status of employee benefit plans: declining trend has reversed in 2013We analysed the evolution of the funding status of plan assets compared to the defined benefit obligations. From 95% in 2007, it has decreased consistently over the years to reach 80% at the end of 2012. After two years of stability at 80%, the long-term decline in the
average funding status reversed in 2013, returning to 84%, a level previously seen in 2009 and 2010.
The differences between the companies are significant as shown in figure 41 right:
Figure 41. Average funding status
Coverage ratio
0%
30%
60%
90%
120%
150%
2013201220112010200920082007
Average
The reasons for the previous declining funding status were a combination of bad market conditions during the observed period, in particular in 2008, and continuously decreasing discount rates. In 2013, the rise of stock market reversed this trend.
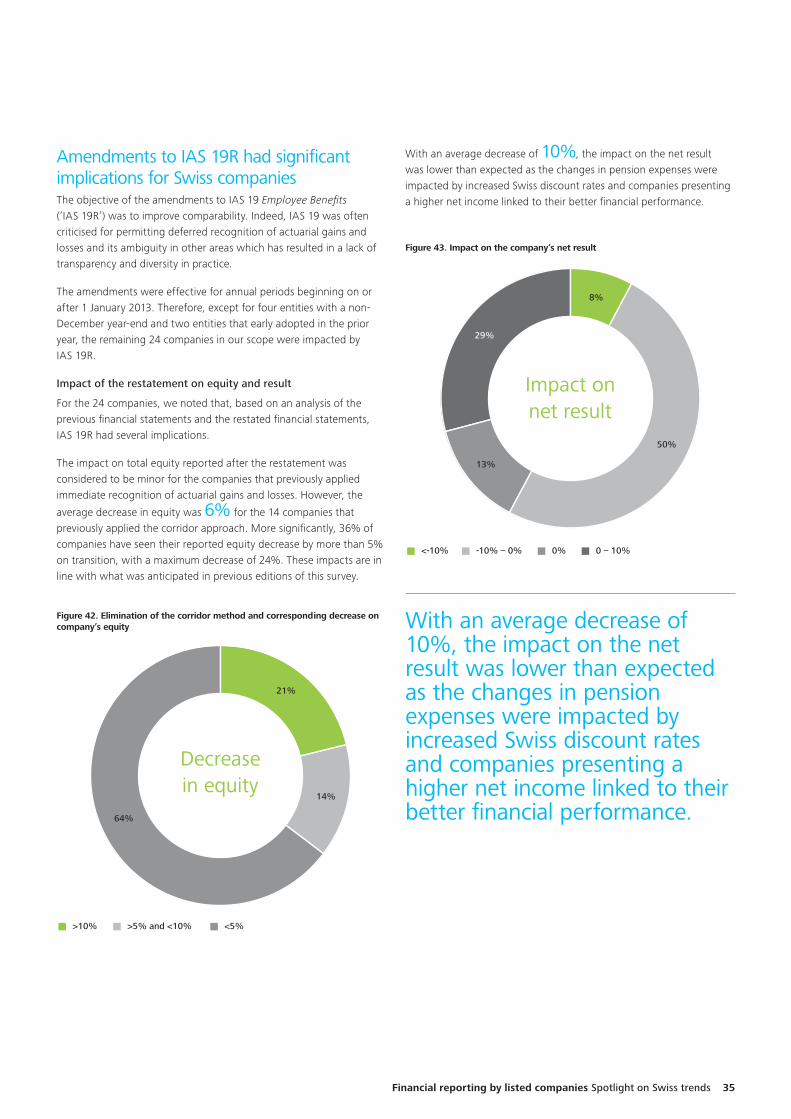
To start a new section, hold down the apple+shift keys and click
to release this object and type the section title in the box below.
Financial reporting by listed companies Spotlight on Swiss trends 35
Amendments to IAS 19R had significant implications for Swiss companiesThe objective of the amendments to IAS 19 Employee Benefits (‘IAS 19R’) was to improve comparability. Indeed, IAS 19 was often criticised for permitting deferred recognition of actuarial gains and losses and its ambiguity in other areas which has resulted in a lack of transparency and diversity in practice.
The amendments were effective for annual periods beginning on or after 1 January 2013. Therefore, except for four entities with a non-December year-end and two entities that early adopted in the prior year, the remaining 24 companies in our scope were impacted by IAS 19R.
Impact of the restatement on equity and result
For the 24 companies, we noted that, based on an analysis of the previous financial statements and the restated financial statements, IAS 19R had several implications.
The impact on total equity reported after the restatement was considered to be minor for the companies that previously applied immediate recognition of actuarial gains and losses. However, the
average decrease in equity was 6% for the 14 companies that previously applied the corridor approach. More significantly, 36% of companies have seen their reported equity decrease by more than 5% on transition, with a maximum decrease of 24%. These impacts are in line with what was anticipated in previous editions of this survey.
Figure 42. Elimination of the corridor method and corresponding decrease on company’s equity
>10% >5% and <10% <5%
21%
64%
14%
Decreasein equity
With an average decrease of 10%, the impact on the net result was lower than expected as the changes in pension expenses were impacted by increased Swiss discount rates and companies presenting a higher net income linked to their better financial performance.
Figure 43. Impact on the company’s net result
<-10% -10% – 0% 0% 0 – 10%
8%
13%
29%
50%
Impact onnet result
With an average decrease of 10%, the impact on the net result was lower than expected as the changes in pension expenses were impacted by increased Swiss discount rates and companies presenting a higher net income linked to their better financial performance.
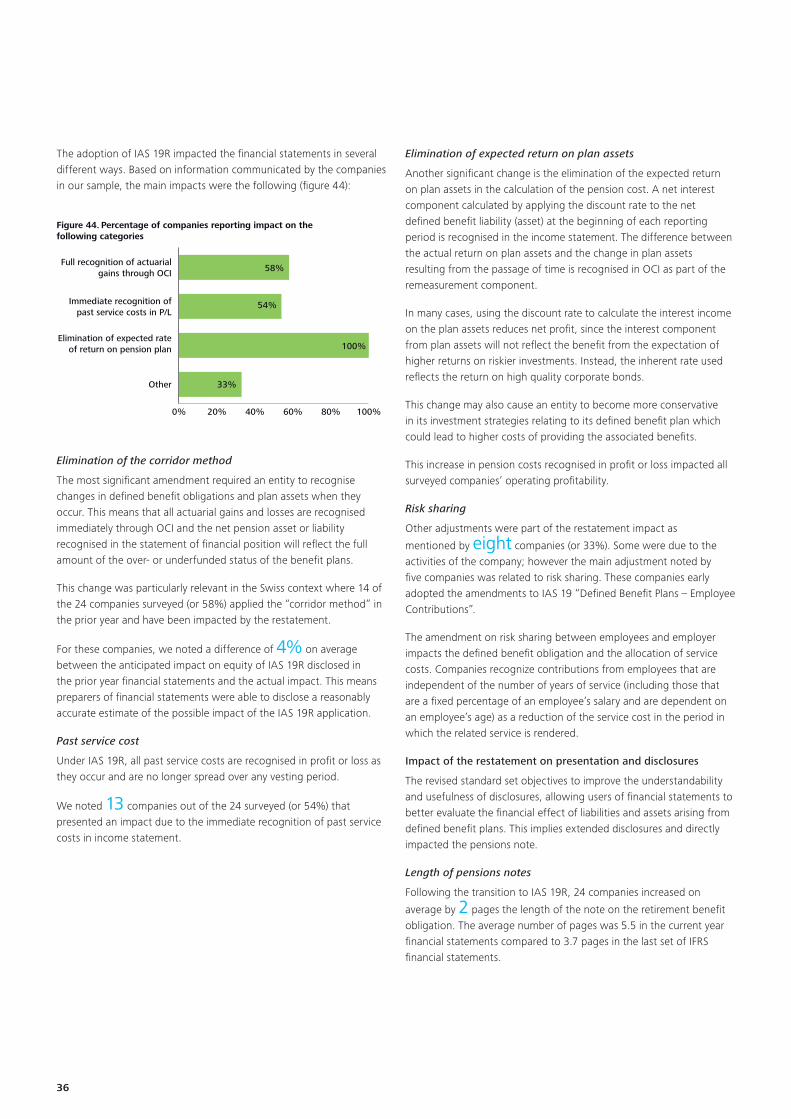
To start a new section, hold down the apple+shift keys and click
to release this object and type the section title in the box below.
36
The adoption of IAS 19R impacted the financial statements in several different ways. Based on information communicated by the companies in our sample, the main impacts were the following (figure 44):
Figure 44. Percentage of companies reporting impact on the following categories
Full recognition of actuarialgains through OCI
Immediate recognition ofpast service costs in P/L
Elimination of expected rateof return on pension plan
Other
0% 20% 40% 60% 80% 100%
54%
58%
100%
33%
Elimination of the corridor method
The most significant amendment required an entity to recognise changes in defined benefit obligations and plan assets when they occur. This means that all actuarial gains and losses are recognised immediately through OCI and the net pension asset or liability recognised in the statement of financial position will reflect the full amount of the over- or underfunded status of the benefit plans.
This change was particularly relevant in the Swiss context where 14 of the 24 companies surveyed (or 58%) applied the “corridor method” in the prior year and have been impacted by the restatement.
For these companies, we noted a difference of 4% on average between the anticipated impact on equity of IAS 19R disclosed in the prior year financial statements and the actual impact. This means preparers of financial statements were able to disclose a reasonably accurate estimate of the possible impact of the IAS 19R application.
Past service cost
Under IAS 19R, all past service costs are recognised in profit or loss as they occur and are no longer spread over any vesting period.
We noted 13 companies out of the 24 surveyed (or 54%) that presented an impact due to the immediate recognition of past service costs in income statement.
Elimination of expected return on plan assets
Another significant change is the elimination of the expected return on plan assets in the calculation of the pension cost. A net interest component calculated by applying the discount rate to the net defined benefit liability (asset) at the beginning of each reporting period is recognised in the income statement. The difference between the actual return on plan assets and the change in plan assets resulting from the passage of time is recognised in OCI as part of the remeasurement component.
In many cases, using the discount rate to calculate the interest income on the plan assets reduces net profit, since the interest component from plan assets will not reflect the benefit from the expectation of higher returns on riskier investments. Instead, the inherent rate used reflects the return on high quality corporate bonds.
This change may also cause an entity to become more conservative in its investment strategies relating to its defined benefit plan which could lead to higher costs of providing the associated benefits.
This increase in pension costs recognised in profit or loss impacted all surveyed companies’ operating profitability.
Risk sharing
Other adjustments were part of the restatement impact as
mentioned by eight companies (or 33%). Some were due to the activities of the company; however the main adjustment noted by five companies was related to risk sharing. These companies early adopted the amendments to IAS 19 “Defined Benefit Plans – Employee Contributions”.
The amendment on risk sharing between employees and employer impacts the defined benefit obligation and the allocation of service costs. Companies recognize contributions from employees that are independent of the number of years of service (including those that are a fixed percentage of an employee’s salary and are dependent on an employee’s age) as a reduction of the service cost in the period in which the related service is rendered.
Impact of the restatement on presentation and disclosures
The revised standard set objectives to improve the understandability and usefulness of disclosures, allowing users of financial statements to better evaluate the financial effect of liabilities and assets arising from defined benefit plans. This implies extended disclosures and directly impacted the pensions note.
Length of pensions notes
Following the transition to IAS 19R, 24 companies increased on
average by 2 pages the length of the note on the retirement benefit obligation. The average number of pages was 5.5 in the current year financial statements compared to 3.7 pages in the last set of IFRS financial statements.
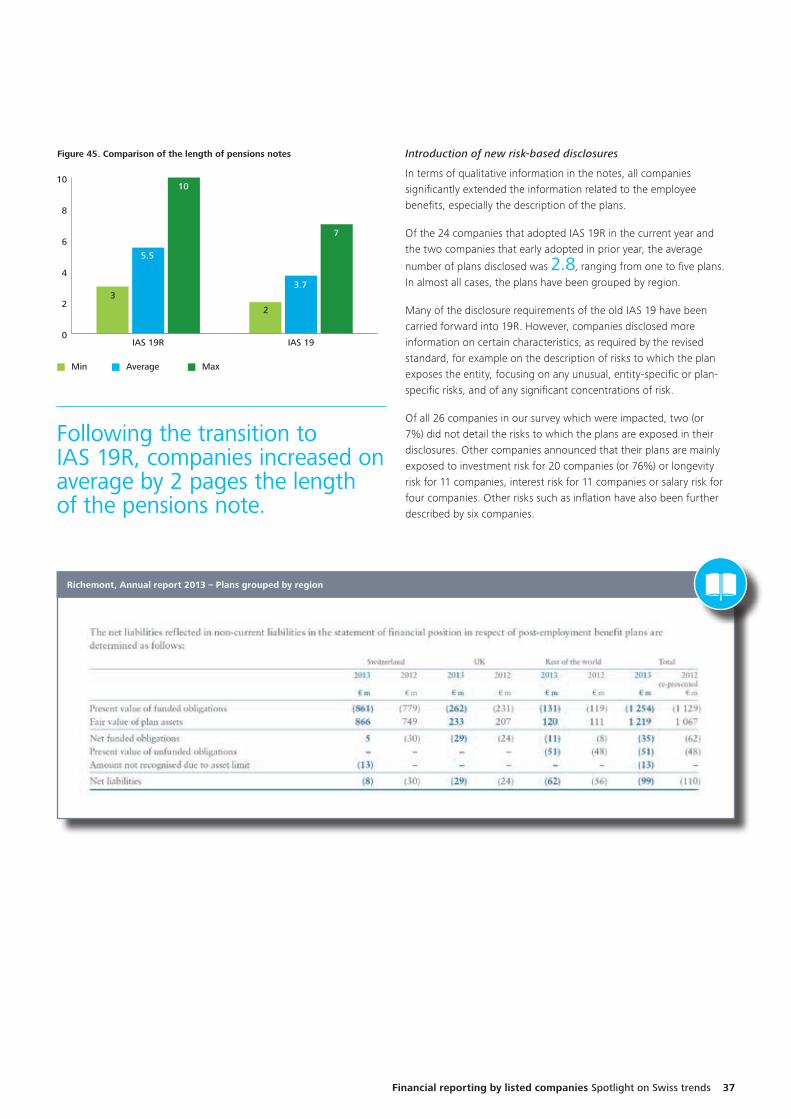
To start a new section, hold down the apple+shift keys and click
to release this object and type the section title in the box below.
Financial reporting by listed companies Spotlight on Swiss trends 37
Figure 45. Comparison of the length of pensions notes
0
2
4
6
8
10
IAS 19IAS 19R
Min Average
3
5.5
10
2
3.7
7
Max
Following the transition to IAS 19R, companies increased on average by 2 pages the length of the pensions note.
Introduction of new risk-based disclosures
In terms of qualitative information in the notes, all companies significantly extended the information related to the employee benefits, especially the description of the plans.
Of the 24 companies that adopted IAS 19R in the current year and the two companies that early adopted in prior year, the average
number of plans disclosed was 2.8, ranging from one to five plans. In almost all cases, the plans have been grouped by region.
Many of the disclosure requirements of the old IAS 19 have been carried forward into 19R. However, companies disclosed more information on certain characteristics, as required by the revised standard, for example on the description of risks to which the plan exposes the entity, focusing on any unusual, entity-specific or plan-specific risks, and of any significant concentrations of risk.
Of all 26 companies in our survey which were impacted, two (or 7%) did not detail the risks to which the plans are exposed in their disclosures. Other companies announced that their plans are mainly exposed to investment risk for 20 companies (or 76%) or longevity risk for 11 companies, interest risk for 11 companies or salary risk for four companies. Other risks such as inflation have also been further described by six companies.
Richemont, Annual report 2013 – Plans grouped by region
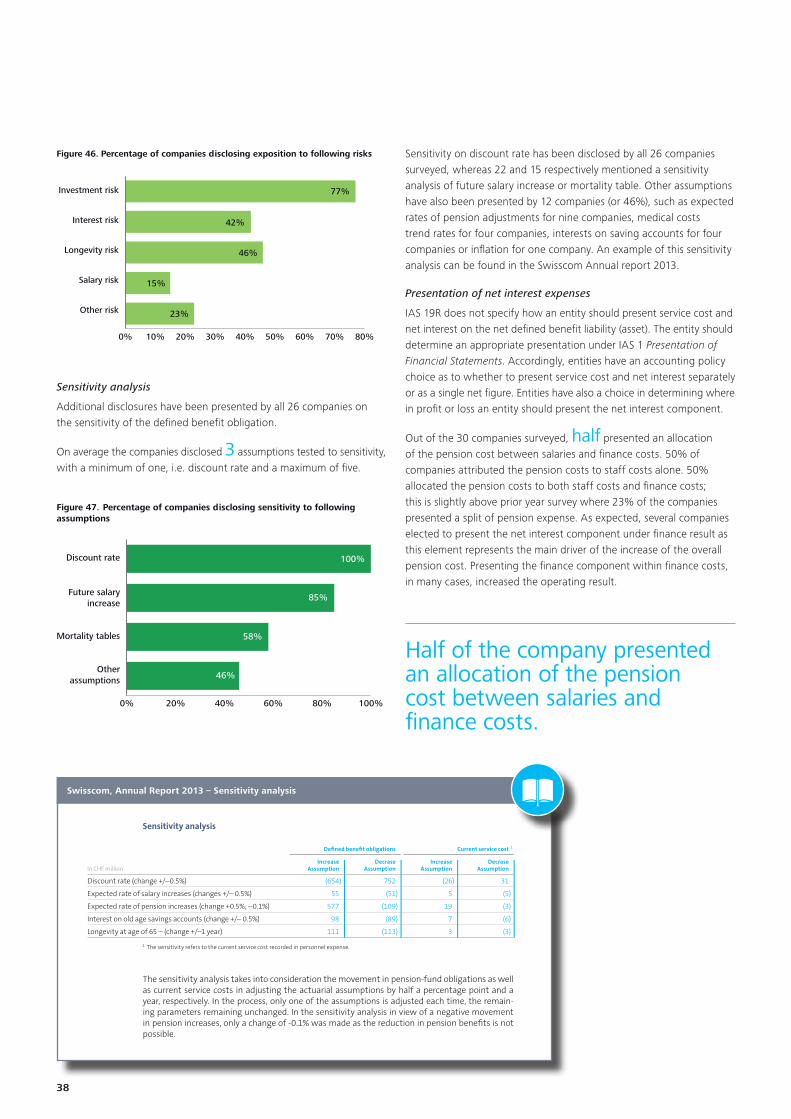
To start a new section, hold down the apple+shift keys and click
to release this object and type the section title in the box below.
38
Figure 46. Percentage of companies disclosing exposition to following risks
Investment risk
Interest risk
Longevity risk
Other risk
Salary risk
0% 10% 20% 30% 40% 50% 60% 70% 80%
42%
77%
46%
23%
15%
Sensitivity analysis
Additional disclosures have been presented by all 26 companies on the sensitivity of the defined benefit obligation.
On average the companies disclosed 3 assumptions tested to sensitivity, with a minimum of one, i.e. discount rate and a maximum of five.
Figure 47. Percentage of companies disclosing sensitivity to following assumptions
Discount rate
Future salaryincrease
Mortality tables
Otherassumptions
0% 20% 40% 60% 80% 100%
85%
100%
58%
46%
Sensitivity on discount rate has been disclosed by all 26 companies surveyed, whereas 22 and 15 respectively mentioned a sensitivity analysis of future salary increase or mortality table. Other assumptions have also been presented by 12 companies (or 46%), such as expected rates of pension adjustments for nine companies, medical costs trend rates for four companies, interests on saving accounts for four companies or inflation for one company. An example of this sensitivity analysis can be found in the Swisscom Annual report 2013.
Presentation of net interest expenses
IAS 19R does not specify how an entity should present service cost and net interest on the net defined benefit liability (asset). The entity should determine an appropriate presentation under IAS 1 Presentation of Financial Statements. Accordingly, entities have an accounting policy choice as to whether to present service cost and net interest separately or as a single net figure. Entities have also a choice in determining where in profit or loss an entity should present the net interest component.
Out of the 30 companies surveyed, half presented an allocation of the pension cost between salaries and finance costs. 50% of companies attributed the pension costs to staff costs alone. 50% allocated the pension costs to both staff costs and finance costs; this is slightly above prior year survey where 23% of the companies presented a split of pension expense. As expected, several companies elected to present the net interest component under finance result as this element represents the main driver of the increase of the overall pension cost. Presenting the finance component within finance costs, in many cases, increased the operating result.
Swisscom, Annual Report 2013 – Sensitivity analysis
Actuarial assumptions
2013 2012
Assumptions comPlan Other plans comPlan Other plans
Discount rate at 31 December 2.30% 2.85% 1.94% 2.44%
Expected rate of salary increases 2.24% 2.19% 2.24% 2.06%
Expected rate of pension increases 0.10% 0.10% 0.10% 0.10%
Interest on old age savings accounts 2.30% 2.30% 1.50% 1.50%
Longevity at age of 65 – men (number of years) 21.29 21.29 21.18 21.18
Longevity at age of 65 – women (number of years) 23.76 23.76 23.66 23.66
The discount rate is based upon CHF-denominated corporate bonds with a AA rating issued by domestic and foreign issuers and quoted on the Swiss Exchange. Future growth factors for salaries corresponds to a long-term historical average value which is specific to Swisscom. Growth in pen-sions reflects comPlan’s ability to meet future pension increases based on the assumptions made. Interest accruing on the retirement savings equates the discount rate. From 2012 on, Swisscom applies the BVG2010 generation tables for life-expectancy assumptions. The change from period tables to generation tables resulted in an actuarial loss of CHF 534 million in 2012.
Sensitivity analysis
Defined benefit obligations Current service cost 1
Increase Decrase Increase Decrase
In CHF million Assumption Assumption Assumption Assumption
Discount rate (change +/–0.5%) (654) 752 (26) 31
Expected rate of salary increases (changes +/– 0.5%) 55 (51) 5 (5)
Expected rate of pension increases (change +0.5%; –0.1%) 577 (109) 19 (3)
Interest on old age savings accounts (change +/– 0.5%) 98 (89) 7 (6)
Longevity at age of 65 – (change +/–1 year) 111 (113) 3 (3)
1 The sensitivity refers to the current service cost recorded in personnel expense.
The sensitivity analysis takes into consideration the movement in pension-fund obligations as well as current service costs in adjusting the actuarial assumptions by half a percentage point and a year, respectively. In the process, only one of the assumptions is adjusted each time, the remain-ing parameters remaining unchanged. In the sensitivity analysis in view of a negative movement in pension increases, only a change of -0.1% was made as the reduction in pension benefits is not possible.
11 Share-based payments
In CHF million 2013 2012
Share-based payments Management Incentive Plan 2 2
Other share-based payments 4 4
Total expense of share-based payments 6 6
Management Incentive Plan
The Management Incentive Plan is an equity-share plan for members of the Group Executive Board and Board of Directors. A part of the remuneration and of the variable earnings-related compensa-tion of the members of the Board of Directors as well as the Group Executive Board, respectively, is settled in the form of Swisscom shares. The shares are allocated based on their tax values. The level of the earnings-related compensation and the number of shares allocated are determined in the
Half of the company presented an allocation of the pension cost between salaries and finance costs.
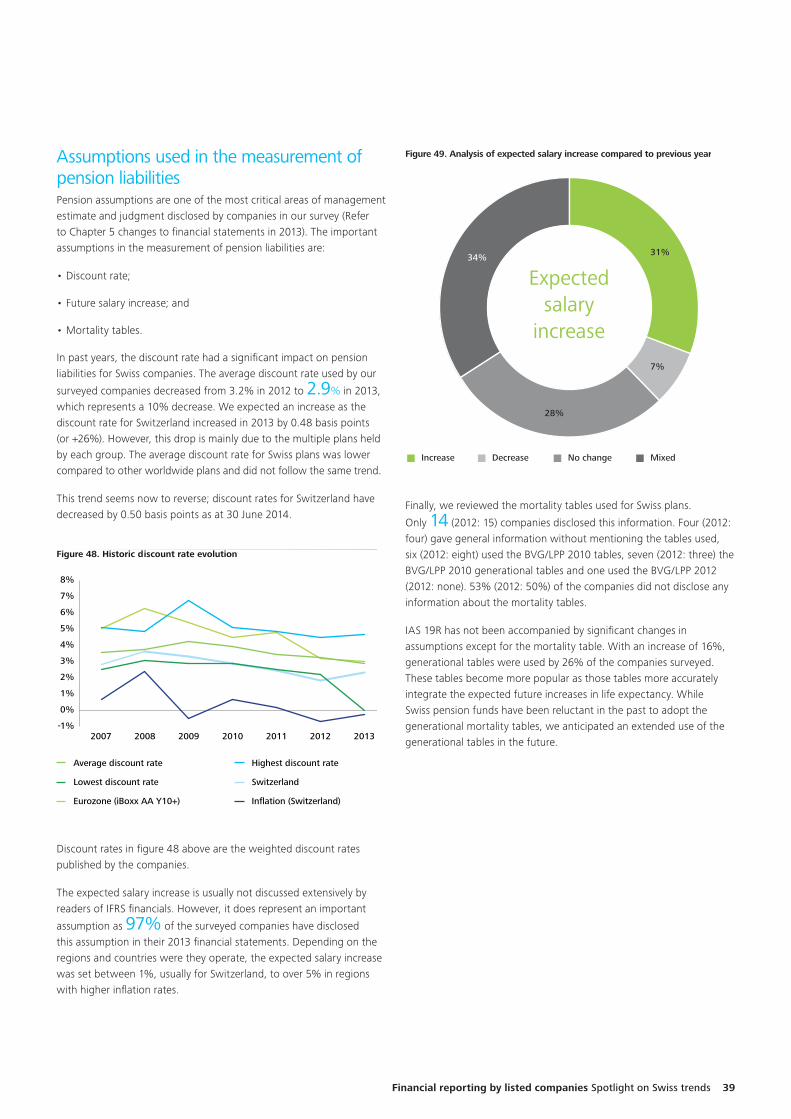
To start a new section, hold down the apple+shift keys and click
to release this object and type the section title in the box below.
Financial reporting by listed companies Spotlight on Swiss trends 39
Assumptions used in the measurement of pension liabilitiesPension assumptions are one of the most critical areas of management estimate and judgment disclosed by companies in our survey (Refer to Chapter 5 changes to financial statements in 2013). The important assumptions in the measurement of pension liabilities are:
• Discount rate;
• Future salary increase; and
• Mortality tables.
In past years, the discount rate had a significant impact on pension liabilities for Swiss companies. The average discount rate used by our
surveyed companies decreased from 3.2% in 2012 to 2.9% in 2013, which represents a 10% decrease. We expected an increase as the discount rate for Switzerland increased in 2013 by 0.48 basis points (or +26%). However, this drop is mainly due to the multiple plans held by each group. The average discount rate for Swiss plans was lower compared to other worldwide plans and did not follow the same trend.
This trend seems now to reverse; discount rates for Switzerland have decreased by 0.50 basis points as at 30 June 2014.
-1%
0%
1%
2%
3%
4%
5%
6%
7%
8%
2013201220112010200920082007
Figure 48. Historic discount rate evolution
Inflation (Switzerland)Eurozone (iBoxx AA Y10+)
SwitzerlandLowest discount rate
Highest discount rateAverage discount rate
Discount rates in figure 48 above are the weighted discount rates published by the companies.
The expected salary increase is usually not discussed extensively by readers of IFRS financials. However, it does represent an important
assumption as 97% of the surveyed companies have disclosed this assumption in their 2013 financial statements. Depending on the regions and countries were they operate, the expected salary increase was set between 1%, usually for Switzerland, to over 5% in regions with higher inflation rates.
Figure 49. Analysis of expected salary increase compared to previous year
Increase Decrease No change Mixed
31%
28%
34%
7%
Expectedsalary
increase
Finally, we reviewed the mortality tables used for Swiss plans.
Only 14 (2012: 15) companies disclosed this information. Four (2012: four) gave general information without mentioning the tables used, six (2012: eight) used the BVG/LPP 2010 tables, seven (2012: three) the BVG/LPP 2010 generational tables and one used the BVG/LPP 2012 (2012: none). 53% (2012: 50%) of the companies did not disclose any information about the mortality tables.
IAS 19R has not been accompanied by significant changes in assumptions except for the mortality table. With an increase of 16%, generational tables were used by 26% of the companies surveyed. These tables become more popular as those tables more accurately integrate the expected future increases in life expectancy. While Swiss pension funds have been reluctant in the past to adopt the generational mortality tables, we anticipated an extended use of the generational tables in the future.
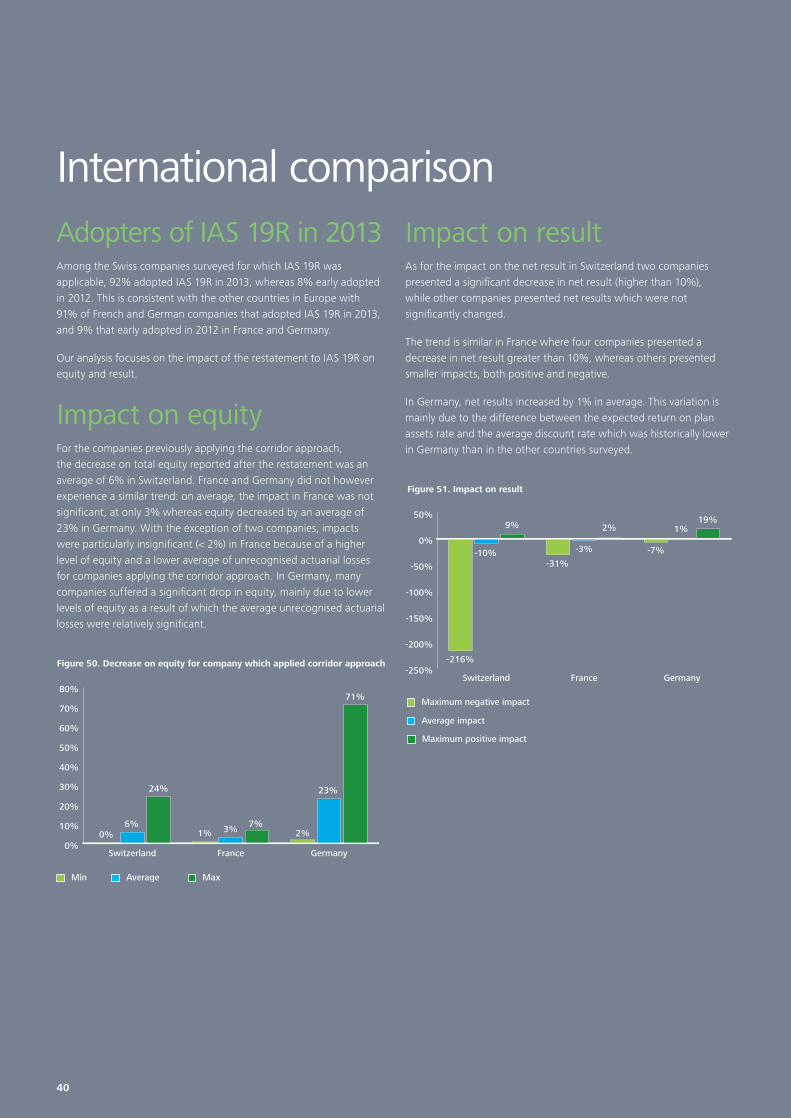
To start a new section, hold down the apple+shift keys and click
to release this object and type the section title in the box below.
International comparisonAdopters of IAS 19R in 2013Among the Swiss companies surveyed for which IAS 19R was applicable, 92% adopted IAS 19R in 2013, whereas 8% early adopted in 2012. This is consistent with the other countries in Europe with 91% of French and German companies that adopted IAS 19R in 2013, and 9% that early adopted in 2012 in France and Germany.
Our analysis focuses on the impact of the restatement to IAS 19R on equity and result.
Impact on equityFor the companies previously applying the corridor approach, the decrease on total equity reported after the restatement was an average of 6% in Switzerland. France and Germany did not however experience a similar trend: on average, the impact in France was not significant, at only 3% whereas equity decreased by an average of 23% in Germany. With the exception of two companies, impacts were particularly insignificant (< 2%) in France because of a higher level of equity and a lower average of unrecognised actuarial losses for companies applying the corridor approach. In Germany, many companies suffered a significant drop in equity, mainly due to lower levels of equity as a result of which the average unrecognised actuarial losses were relatively significant.
Figure 50. Decrease on equity for company which applied corridor approach
0%
10%
20%
30%
40%
50%
60%
70%
80%
GermanyFranceSwitzerland
Min Average
24%
6%0%
7%3%1%
71%
23%
2%
Max
Impact on resultAs for the impact on the net result in Switzerland two companies presented a significant decrease in net result (higher than 10%), while other companies presented net results which were not significantly changed.
The trend is similar in France where four companies presented a decrease in net result greater than 10%, whereas others presented smaller impacts, both positive and negative.
In Germany, net results increased by 1% in average. This variation is mainly due to the difference between the expected return on plan assets rate and the average discount rate which was historically lower in Germany than in the other countries surveyed.
Figure 51. Impact on result
-250%
-200%
-150%
-100%
-50%
0%
50%
GermanyFranceSwitzerland
Maximum negative impact
Average impact
-216%
-10%
9%
-31%
-3%
2%
-7%
1%19%
Maximum positive impact
40

To start a new section, hold down the apple+shift keys and click
to release this object and type the section title in the box below.
Disclosures related to the restatementBased on information communicated by the companies, the main impacts were summarised in figure 52.
Figure 52. Percentage of companies reporting impact on the following categories
0%
10%
20%
30%
40%
50%
60%
70%
80%
OtherImmediaterecognition
of past servicecosts in P/L
Full recognitionof actuarial gains
through OCI
Switzerland France
58%
35% 35%
54%
77%
50%
33%
3%
40%
Germany
The full recognition of actuarial gains through OCI has a lower impact in other European countries, as more companies applied the immediate recognition of actuarial gains and losses in OCI. In Switzerland, the “corridor approach” was still used by 58% of companies, compared to 25% in France and 35% in Germany.
When we compare actual results on first-time implementation of IAS 19R with those anticipated in the previous year, we noted a difference of 4% on average for companies applying the “corridor method” in Switzerland. However in France and Germany the difference between the anticipated impact on equity of IAS 19R disclosed in the prior year financial statements and the actual impact was of 9% and 6% respectively.
We noted 13 companies out of the 24 surveyed (or 54%) that presented an impact due to the immediate recognition of past service costs in income statement. This trend was similar with 77% and 50% in France and Germany respectively.
High number of companies located in all three countries mentioned a restatement impacted by the reversal of the difference between the expected rate of return on pension plan and the discount rate through other comprehensive income.
In the restatement disclosure, Swiss and German companies also included other adjustments, for 33% and 40% of the companies respectively. However the reasons were different in Germany, where companies noted a changed categorization with regard to termination benefits, and were also impacted by the definition of short term and other long term benefits; i.e. on bonus payment.
The full recognition of actuarial gains through OCI has a lower impact in other European countries, as more companies applied the immediate recognition of actuarial gains and losses in OCI. In Switzerland, the “corridor approach” was still used by 58% of companies, compared to 25% in France and 35% in Germany.
Financial reporting by listed companies A spotlight on Swiss trends 41
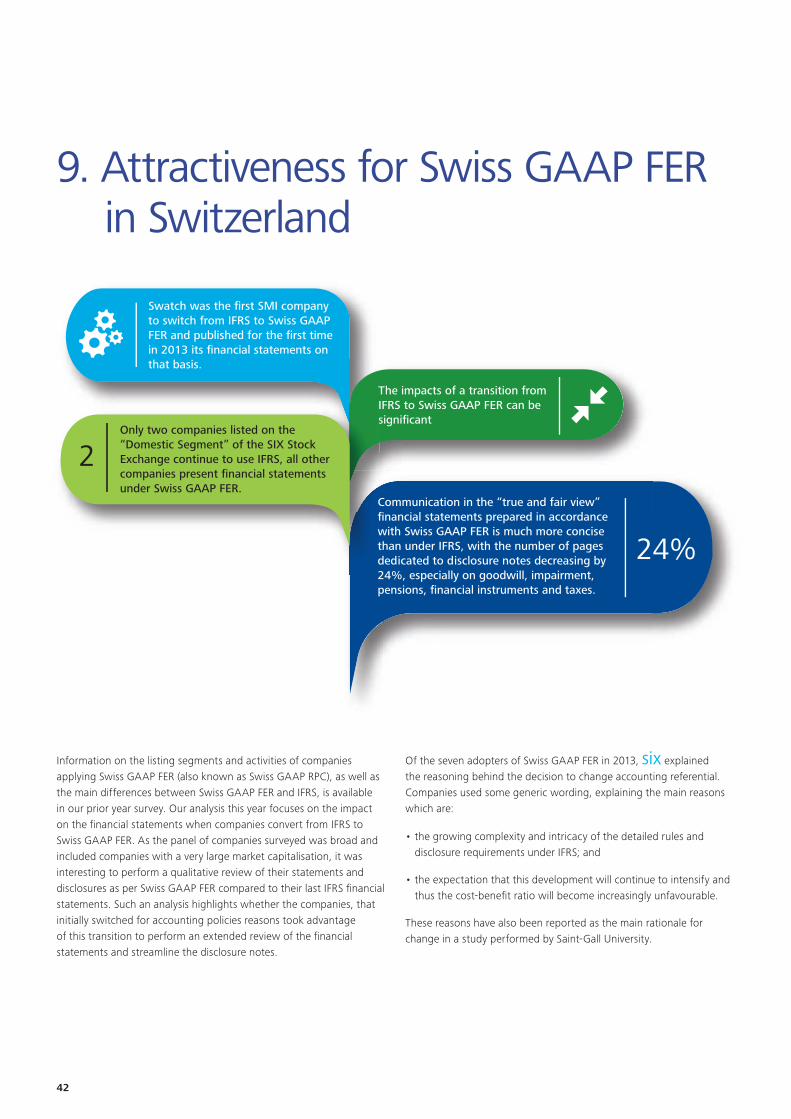
To start a new section, hold down the apple+shift keys and click
to release this object and type the section title in the box below.
42
9. Attractiveness for Swiss GAAP FER in Switzerland
Information on the listing segments and activities of companies applying Swiss GAAP FER (also known as Swiss GAAP RPC), as well as the main differences between Swiss GAAP FER and IFRS, is available in our prior year survey. Our analysis this year focuses on the impact on the financial statements when companies convert from IFRS to Swiss GAAP FER. As the panel of companies surveyed was broad and included companies with a very large market capitalisation, it was interesting to perform a qualitative review of their statements and disclosures as per Swiss GAAP FER compared to their last IFRS financial statements. Such an analysis highlights whether the companies, that initially switched for accounting policies reasons took advantage of this transition to perform an extended review of the financial statements and streamline the disclosure notes.
Of the seven adopters of Swiss GAAP FER in 2013, six explained the reasoning behind the decision to change accounting referential. Companies used some generic wording, explaining the main reasons which are:
• the growing complexity and intricacy of the detailed rules and disclosure requirements under IFRS; and
• the expectation that this development will continue to intensify and thus the cost-benefit ratio will become increasingly unfavourable.
These reasons have also been reported as the main rationale for change in a study performed by Saint-Gall University.
Swatch was the first SMI company to switch from IFRS to Swiss GAAP FER and published for the first time in 2013 its financial statements on that basis.
The impacts of a transition from IFRS to Swiss GAAP FER can be significants
2
24%
Only two companies listed on the “Domestic Segment” of the SIX Stock Exchange continue to use IFRS, all other companies present financial statements under Swiss GAAP FER.
Communication in the “true and fair view” financial statements prepared in accordance with Swiss GAAP FER is much more concise than under IFRS, with the number of pages dedicated to disclosure notes decreasing by 24%, especially on goodwill, impairment, pensions, financial instruments and taxes.
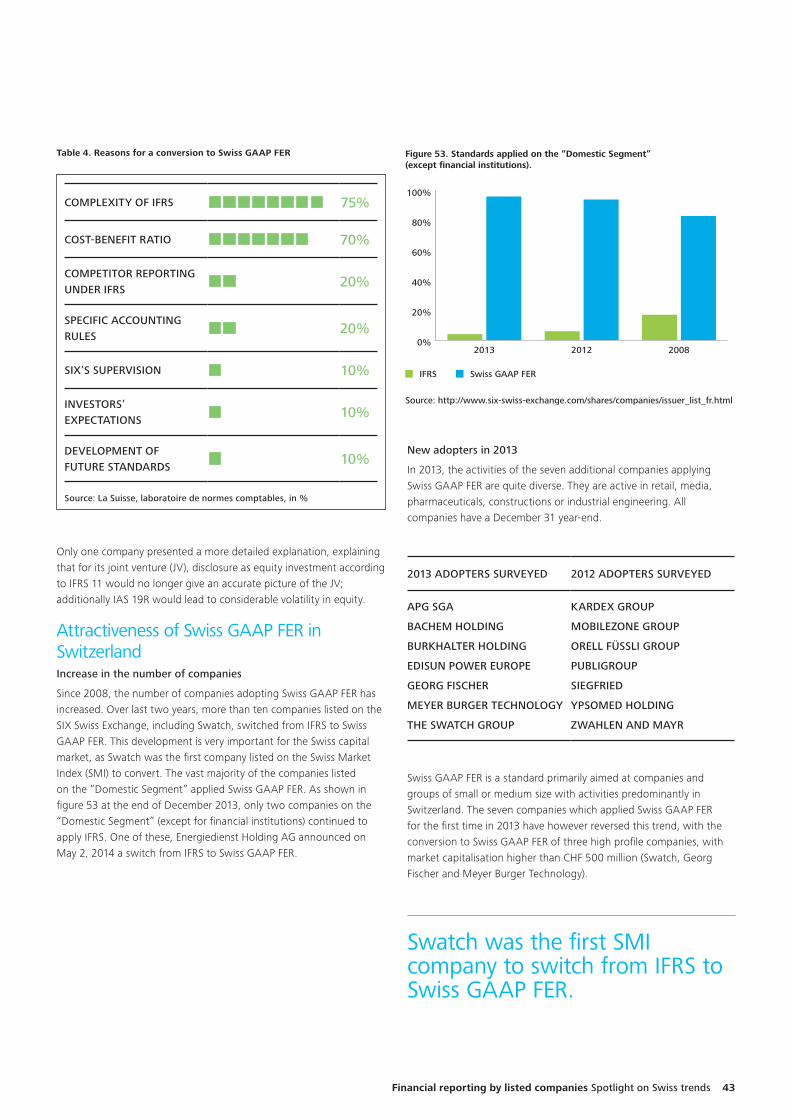
To start a new section, hold down the apple+shift keys and click
to release this object and type the section title in the box below.
Financial reporting by listed companies Spotlight on Swiss trends 43
Table 4. Reasons for a conversion to Swiss GAAP FER
0%
20%
40%
60%
80%
100%
200820122013
IFRS Swiss GAAP FER
Source: http://www.six-swiss-exchange.com/shares/companies/issuer_list_fr.html
Figure 53. Standards applied on the “Domestic Segment” (except financial institutions).
New adopters in 2013
In 2013, the activities of the seven additional companies applying Swiss GAAP FER are quite diverse. They are active in retail, media, pharmaceuticals, constructions or industrial engineering. All companies have a December 31 year-end.
2013 ADOPTERS SURVEYED 2012 ADOPTERS SURVEYED
APG SGA
BACHEM HOLDING
BURKHALTER HOLDING
EDISUN POWER EUROPE
GEORG FISCHER
MEYER BURGER TECHNOLOGY
THE SWATCH GROUP
KARDEX GROUP
MOBILEZONE GROUP
ORELL FÜSSLI GROUP
PUBLIGROUP
SIEGFRIED
YPSOMED HOLDING
ZWAHLEN AND MAYR
Swiss GAAP FER is a standard primarily aimed at companies and groups of small or medium size with activities predominantly in Switzerland. The seven companies which applied Swiss GAAP FER for the first time in 2013 have however reversed this trend, with the conversion to Swiss GAAP FER of three high profile companies, with market capitalisation higher than CHF 500 million (Swatch, Georg Fischer and Meyer Burger Technology).
Swatch was the first SMI company to switch from IFRS to Swiss GAAP FER.
COMPLEXITY OF IFRS 75%
COST-BENEFIT RATIO 70%
COMPETITOR REPORTING UNDER IFRS
20%
SPECIFIC ACCOUNTING RULES
20%
SIX’S SUPERVISION 10%
INVESTORS’ EXPECTATIONS
10%
DEVELOPMENT OF FUTURE STANDARDS
10%
Source: La Suisse, laboratoire de normes comptables, in %
Only one company presented a more detailed explanation, explaining that for its joint venture (JV), disclosure as equity investment according to IFRS 11 would no longer give an accurate picture of the JV; additionally IAS 19R would lead to considerable volatility in equity.
Attractiveness of Swiss GAAP FER in SwitzerlandIncrease in the number of companies
Since 2008, the number of companies adopting Swiss GAAP FER has increased. Over last two years, more than ten companies listed on the SIX Swiss Exchange, including Swatch, switched from IFRS to Swiss GAAP FER. This development is very important for the Swiss capital market, as Swatch was the first company listed on the Swiss Market Index (SMI) to convert. The vast majority of the companies listed on the “Domestic Segment” applied Swiss GAAP FER. As shown in figure 53 at the end of December 2013, only two companies on the “Domestic Segment” (except for financial institutions) continued to apply IFRS. One of these, Energiedienst Holding AG announced on May 2, 2014 a switch from IFRS to Swiss GAAP FER.
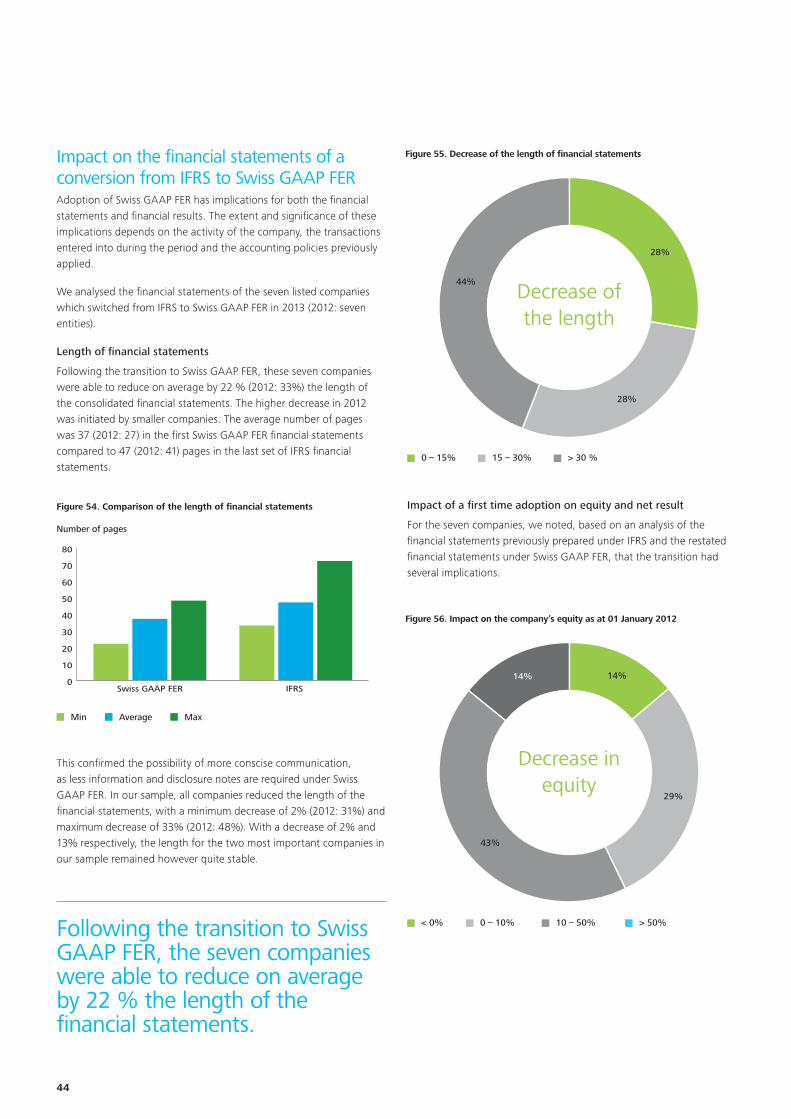
To start a new section, hold down the apple+shift keys and click
to release this object and type the section title in the box below.
44
Impact on the financial statements of a conversion from IFRS to Swiss GAAP FERAdoption of Swiss GAAP FER has implications for both the financial statements and financial results. The extent and significance of these implications depends on the activity of the company, the transactions entered into during the period and the accounting policies previously applied.
We analysed the financial statements of the seven listed companies which switched from IFRS to Swiss GAAP FER in 2013 (2012: seven entities).
Length of financial statements
Following the transition to Swiss GAAP FER, these seven companies were able to reduce on average by 22 % (2012: 33%) the length of the consolidated financial statements. The higher decrease in 2012 was initiated by smaller companies. The average number of pages was 37 (2012: 27) in the first Swiss GAAP FER financial statements compared to 47 (2012: 41) pages in the last set of IFRS financial statements.
Min Average Max
0
10
20
30
40
50
60
70
80
IFRS Swiss GAAP FER
Figure 54. Comparison of the length of financial statements
Number of pages
Impact of a first time adoption on equity and net result
For the seven companies, we noted, based on an analysis of the financial statements previously prepared under IFRS and the restated financial statements under Swiss GAAP FER, that the transition had several implications.
Figure 55. Decrease of the length of financial statements
0 – 15% 15 – 30% > 30 %
28%
44%
28%
Decrease ofthe length
Figure 56. Impact on the company’s equity as at 01 January 2012
< 0% 0 – 10% 10 – 50% > 50%
14%14%
43%
29%
Decrease inequity
This confirmed the possibility of more conscise communication, as less information and disclosure notes are required under Swiss GAAP FER. In our sample, all companies reduced the length of the financial statements, with a minimum decrease of 2% (2012: 31%) and maximum decrease of 33% (2012: 48%). With a decrease of 2% and 13% respectively, the length for the two most important companies in our sample remained however quite stable.
Following the transition to Swiss GAAP FER, the seven companies were able to reduce on average by 22 % the length of the financial statements.
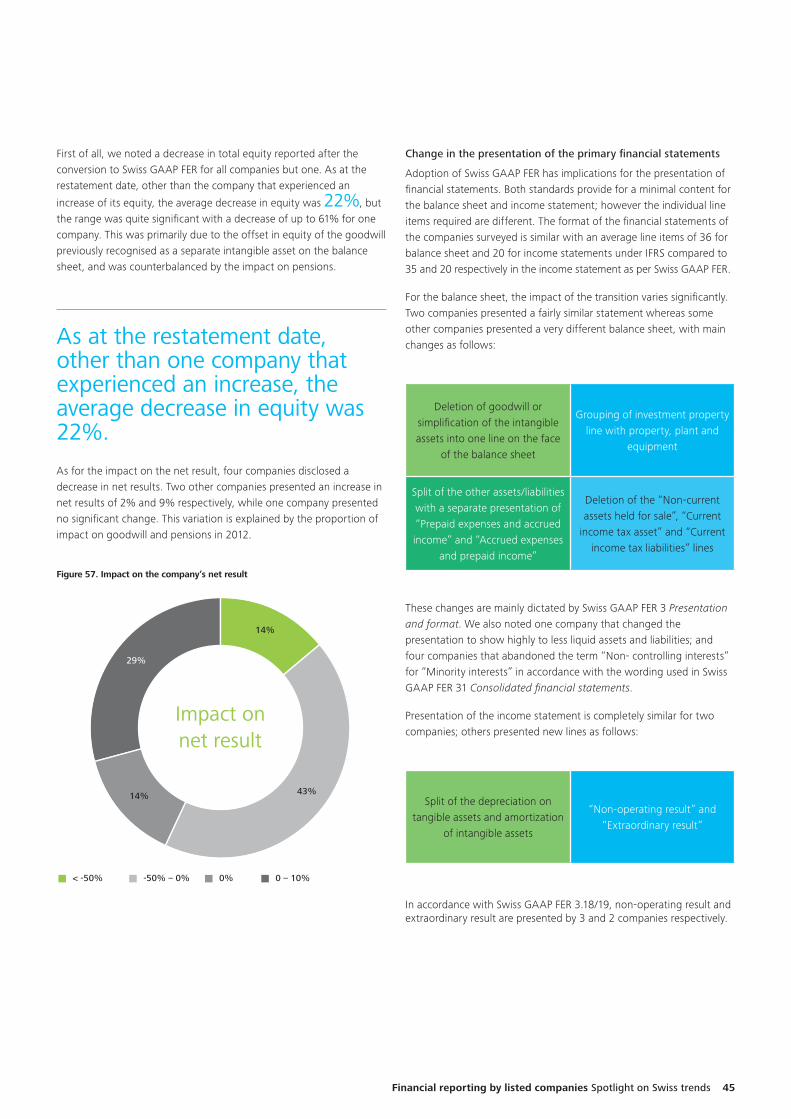
To start a new section, hold down the apple+shift keys and click
to release this object and type the section title in the box below.
Financial reporting by listed companies Spotlight on Swiss trends 45
First of all, we noted a decrease in total equity reported after the conversion to Swiss GAAP FER for all companies but one. As at the restatement date, other than the company that experienced an
increase of its equity, the average decrease in equity was 22%, but the range was quite significant with a decrease of up to 61% for one company. This was primarily due to the offset in equity of the goodwill previously recognised as a separate intangible asset on the balance sheet, and was counterbalanced by the impact on pensions.
As at the restatement date, other than one company that experienced an increase, the average decrease in equity was 22%.
As for the impact on the net result, four companies disclosed a decrease in net results. Two other companies presented an increase in net results of 2% and 9% respectively, while one company presented no significant change. This variation is explained by the proportion of impact on goodwill and pensions in 2012.
Figure 57. Impact on the company’s net result
< -50% -50% – 0% 0% 0 – 10%
14%
29%
14% 43%
Impact onnet result
Change in the presentation of the primary financial statements
Adoption of Swiss GAAP FER has implications for the presentation of financial statements. Both standards provide for a minimal content for the balance sheet and income statement; however the individual line items required are different. The format of the financial statements of the companies surveyed is similar with an average line items of 36 for balance sheet and 20 for income statements under IFRS compared to 35 and 20 respectively in the income statement as per Swiss GAAP FER.
For the balance sheet, the impact of the transition varies significantly. Two companies presented a fairly similar statement whereas some other companies presented a very different balance sheet, with main changes as follows:
Deletion of goodwill or simplification of the intangible assets into one line on the face
of the balance sheet
Grouping of investment property line with property, plant and
equipment
Split of the other assets/liabilities with a separate presentation of “Prepaid expenses and accrued income” and “Accrued expenses
and prepaid income”
Deletion of the “Non-current assets held for sale”, “Current
income tax asset” and “Current income tax liabilities” lines
These changes are mainly dictated by Swiss GAAP FER 3 Presentation and format. We also noted one company that changed the presentation to show highly to less liquid assets and liabilities; and four companies that abandoned the term “Non- controlling interests” for “Minority interests” in accordance with the wording used in Swiss GAAP FER 31 Consolidated financial statements.
Presentation of the income statement is completely similar for two companies; others presented new lines as follows:
Split of the depreciation on tangible assets and amortization
of intangible assets
“Non-operating result” and “Extraordinary result”
In accordance with Swiss GAAP FER 3.18/19, non-operating result and extraordinary result are presented by 3 and 2 companies respectively.
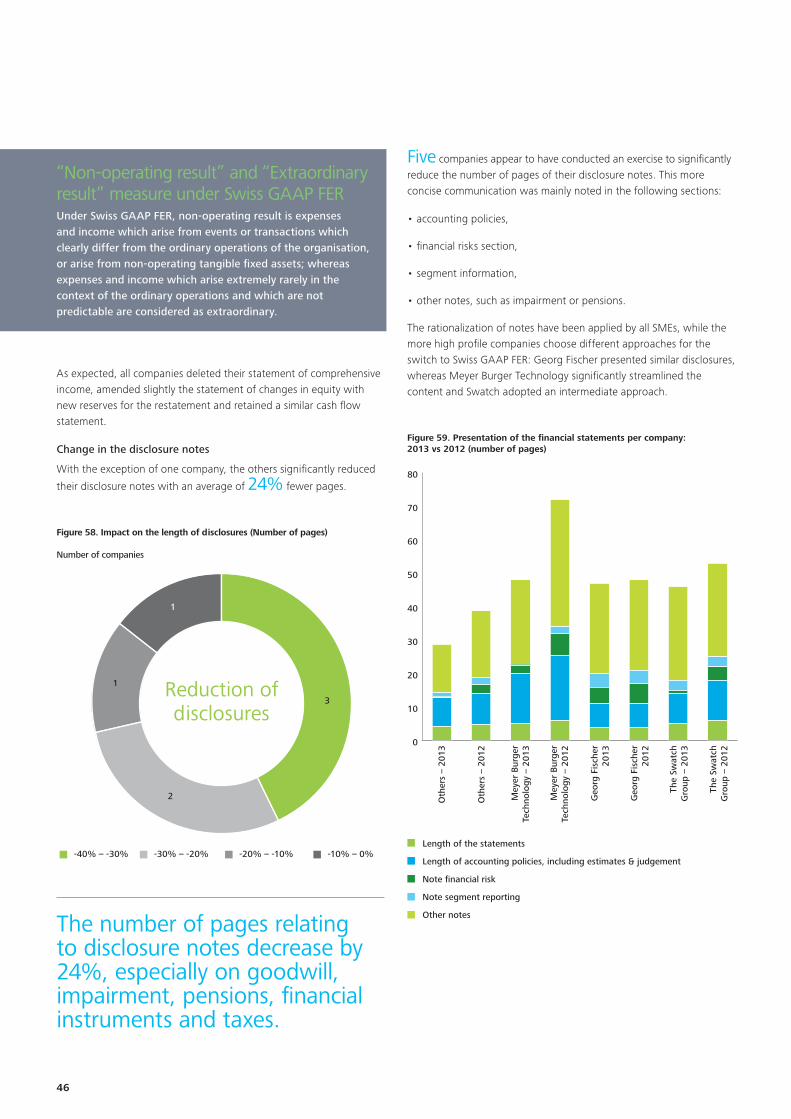
To start a new section, hold down the apple+shift keys and click
to release this object and type the section title in the box below.
46
“Non-operating result” and “Extraordinary result” measure under Swiss GAAP FERUnder Swiss GAAP FER, non-operating result is expenses and income which arise from events or transactions which clearly differ from the ordinary operations of the organisation, or arise from non-operating tangible fixed assets; whereas expenses and income which arise extremely rarely in the context of the ordinary operations and which are not predictable are considered as extraordinary.
As expected, all companies deleted their statement of comprehensive income, amended slightly the statement of changes in equity with new reserves for the restatement and retained a similar cash flow statement.
Change in the disclosure notes
With the exception of one company, the others significantly reduced
their disclosure notes with an average of 24% fewer pages.
Five companies appear to have conducted an exercise to significantly reduce the number of pages of their disclosure notes. This more concise communication was mainly noted in the following sections:
• accounting policies,
• financial risks section,
• segment information,
• other notes, such as impairment or pensions.
The rationalization of notes have been applied by all SMEs, while the more high profile companies choose different approaches for the switch to Swiss GAAP FER: Georg Fischer presented similar disclosures, whereas Meyer Burger Technology significantly streamlined the content and Swatch adopted an intermediate approach.
Figure 58. Impact on the length of disclosures (Number of pages)
Number of companies
-40% – -30% -30% – -20% -20% – -10% -10% – 0%
3
1
1
2
Reduction ofdisclosures
The number of pages relating to disclosure notes decrease by 24%, especially on goodwill, impairment, pensions, financial instruments and taxes.
0
10
20
30
40
50
60
70
80
The
Swat
chG
roup
– 2
012
The
Swat
chG
roup
– 2
013
Geo
rg F
isch
er20
12
Geo
rg F
isch
er20
13
Mey
er B
urge
rTe
chno
logy
– 2
012
Mey
er B
urge
rTe
chno
logy
– 2
013
Oth
ers
– 20
12
Oth
ers
– 20
13Figure 59. Presentation of the financial statements per company:2013 vs 2012 (number of pages)
Length of the statements
Length of accounting policies, including estimates & judgement
Note financial risk
Note segment reporting
Other notes
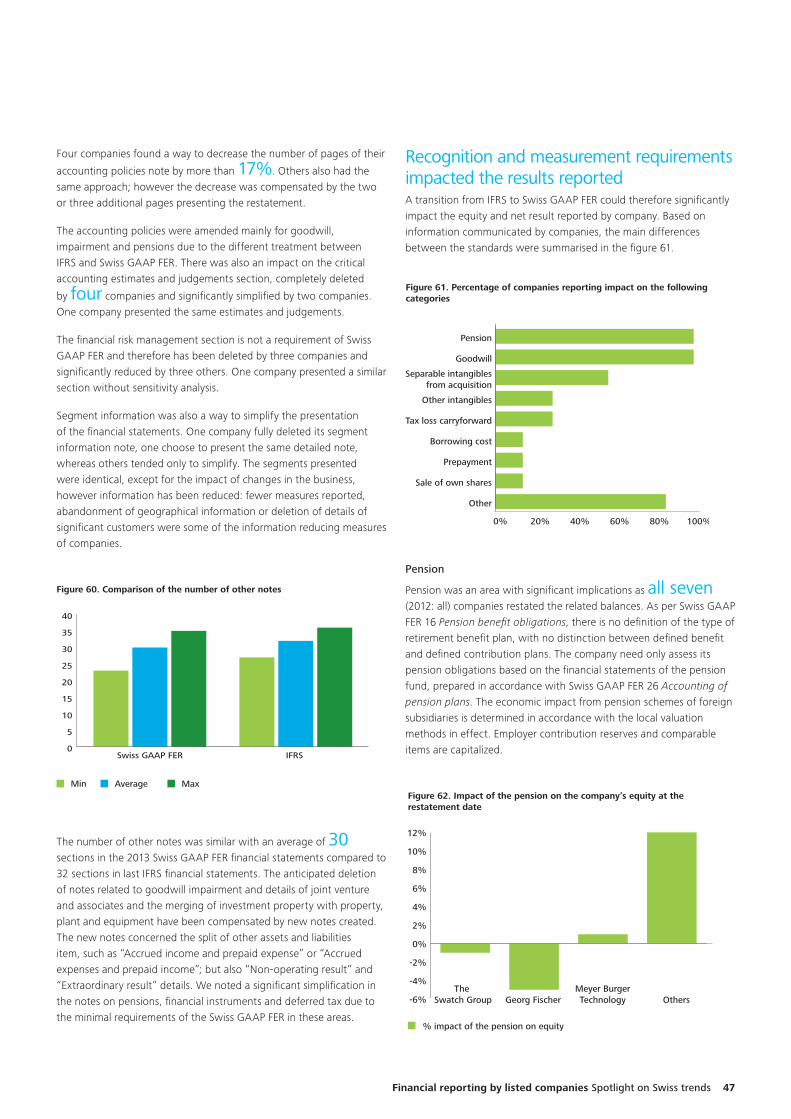
To start a new section, hold down the apple+shift keys and click
to release this object and type the section title in the box below.
Financial reporting by listed companies Spotlight on Swiss trends 47
Four companies found a way to decrease the number of pages of their
accounting policies note by more than 17%. Others also had the same approach; however the decrease was compensated by the two or three additional pages presenting the restatement.
The accounting policies were amended mainly for goodwill, impairment and pensions due to the different treatment between IFRS and Swiss GAAP FER. There was also an impact on the critical accounting estimates and judgements section, completely deleted
by four companies and significantly simplified by two companies. One company presented the same estimates and judgements.
The financial risk management section is not a requirement of Swiss GAAP FER and therefore has been deleted by three companies and significantly reduced by three others. One company presented a similar section without sensitivity analysis.
Segment information was also a way to simplify the presentation of the financial statements. One company fully deleted its segment information note, one choose to present the same detailed note, whereas others tended only to simplify. The segments presented were identical, except for the impact of changes in the business, however information has been reduced: fewer measures reported, abandonment of geographical information or deletion of details of significant customers were some of the information reducing measures of companies.
Min Average Max
0
5
10
15
20
25
30
35
40
IFRS Swiss GAAP FER
Figure 60. Comparison of the number of other notes
The number of other notes was similar with an average of 30 sections in the 2013 Swiss GAAP FER financial statements compared to 32 sections in last IFRS financial statements. The anticipated deletion of notes related to goodwill impairment and details of joint venture and associates and the merging of investment property with property, plant and equipment have been compensated by new notes created. The new notes concerned the split of other assets and liabilities item, such as “Accrued income and prepaid expense” or “Accrued expenses and prepaid income”; but also “Non-operating result” and “Extraordinary result” details. We noted a significant simplification in the notes on pensions, financial instruments and deferred tax due to the minimal requirements of the Swiss GAAP FER in these areas.
Recognition and measurement requirements impacted the results reportedA transition from IFRS to Swiss GAAP FER could therefore significantly impact the equity and net result reported by company. Based on information communicated by companies, the main differences between the standards were summarised in the figure 61.
0% 20% 40% 60% 80% 100%
Other
Sale of own shares
Prepayment
Borrowing cost
Tax loss carryforward
Other intangibles
Separable intangiblesfrom acquisition
Goodwill
Pension
Figure 61. Percentage of companies reporting impact on the followingcategories
Pension
Pension was an area with significant implications as all seven (2012: all) companies restated the related balances. As per Swiss GAAP FER 16 Pension benefit obligations, there is no definition of the type of retirement benefit plan, with no distinction between defined benefit and defined contribution plans. The company need only assess its pension obligations based on the financial statements of the pension fund, prepared in accordance with Swiss GAAP FER 26 Accounting of pension plans. The economic impact from pension schemes of foreign subsidiaries is determined in accordance with the local valuation methods in effect. Employer contribution reserves and comparable items are capitalized.
The Swatch Group Georg Fischer
Meyer BurgerTechnology
% impact of the pension on equity
Others
Figure 62. Impact of the pension on the company’s equity at the restatement date
-6%
-4%
-2%
0%
2%
4%
6%
8%
10%
12%
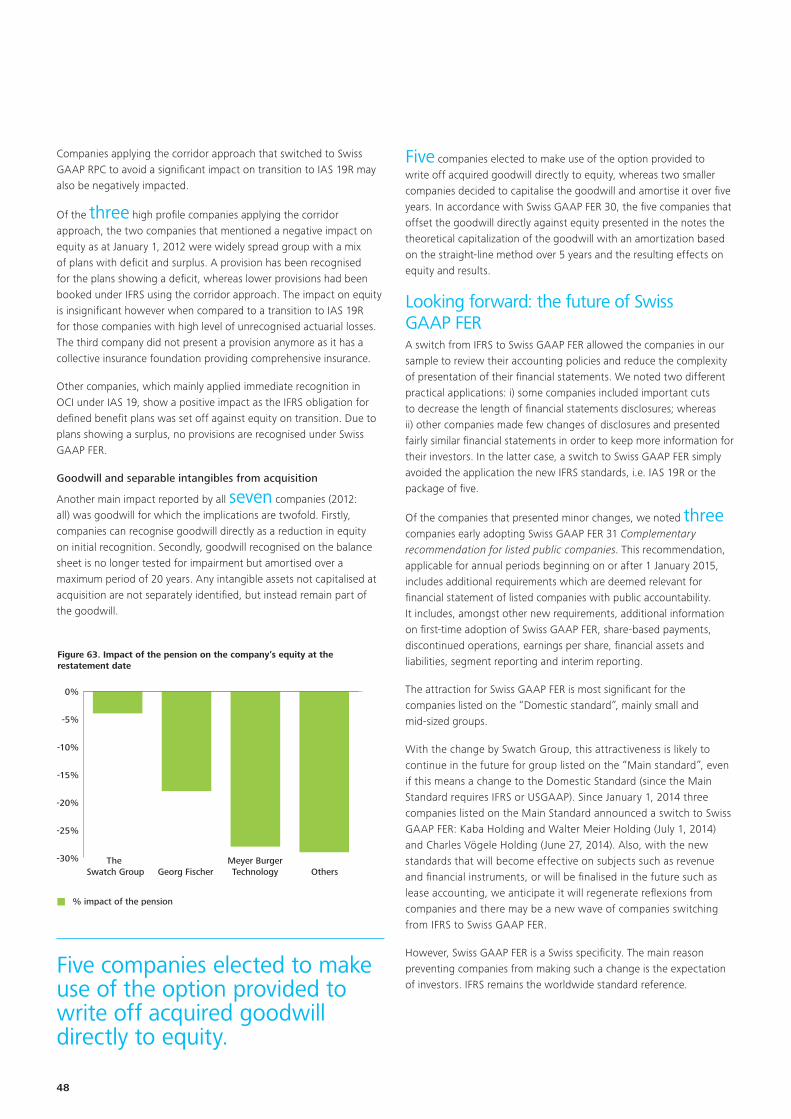
To start a new section, hold down the apple+shift keys and click
to release this object and type the section title in the box below.
48
Companies applying the corridor approach that switched to Swiss GAAP RPC to avoid a significant impact on transition to IAS 19R may also be negatively impacted.
Of the three high profile companies applying the corridor approach, the two companies that mentioned a negative impact on equity as at January 1, 2012 were widely spread group with a mix of plans with deficit and surplus. A provision has been recognised for the plans showing a deficit, whereas lower provisions had been booked under IFRS using the corridor approach. The impact on equity is insignificant however when compared to a transition to IAS 19R for those companies with high level of unrecognised actuarial losses. The third company did not present a provision anymore as it has a collective insurance foundation providing comprehensive insurance.
Other companies, which mainly applied immediate recognition in OCI under IAS 19, show a positive impact as the IFRS obligation for defined benefit plans was set off against equity on transition. Due to plans showing a surplus, no provisions are recognised under Swiss GAAP FER.
Goodwill and separable intangibles from acquisition
Another main impact reported by all seven companies (2012: all) was goodwill for which the implications are twofold. Firstly, companies can recognise goodwill directly as a reduction in equity on initial recognition. Secondly, goodwill recognised on the balance sheet is no longer tested for impairment but amortised over a maximum period of 20 years. Any intangible assets not capitalised at acquisition are not separately identified, but instead remain part of the goodwill.
The Swatch Group Georg Fischer
Meyer BurgerTechnology
% impact of the pension
Others
Figure 63. Impact of the pension on the company’s equity at the restatement date
-30%
-25%
-20%
-15%
-10%
-5%
0%
Five companies elected to make use of the option provided to write off acquired goodwill directly to equity, whereas two smaller companies decided to capitalise the goodwill and amortise it over five years. In accordance with Swiss GAAP FER 30, the five companies that offset the goodwill directly against equity presented in the notes the theoretical capitalization of the goodwill with an amortization based on the straight-line method over 5 years and the resulting effects on equity and results.
Looking forward: the future of Swiss GAAP FERA switch from IFRS to Swiss GAAP FER allowed the companies in our sample to review their accounting policies and reduce the complexity of presentation of their financial statements. We noted two different practical applications: i) some companies included important cuts to decrease the length of financial statements disclosures; whereas ii) other companies made few changes of disclosures and presented fairly similar financial statements in order to keep more information for their investors. In the latter case, a switch to Swiss GAAP FER simply avoided the application the new IFRS standards, i.e. IAS 19R or the package of five.
Of the companies that presented minor changes, we noted three companies early adopting Swiss GAAP FER 31 Complementary recommendation for listed public companies. This recommendation, applicable for annual periods beginning on or after 1 January 2015, includes additional requirements which are deemed relevant for financial statement of listed companies with public accountability. It includes, amongst other new requirements, additional information on first-time adoption of Swiss GAAP FER, share-based payments, discontinued operations, earnings per share, financial assets and liabilities, segment reporting and interim reporting.
The attraction for Swiss GAAP FER is most significant for the companies listed on the “Domestic standard”, mainly small and mid-sized groups.
With the change by Swatch Group, this attractiveness is likely to continue in the future for group listed on the “Main standard”, even if this means a change to the Domestic Standard (since the Main Standard requires IFRS or USGAAP). Since January 1, 2014 three companies listed on the Main Standard announced a switch to Swiss GAAP FER: Kaba Holding and Walter Meier Holding (July 1, 2014) and Charles Vögele Holding (June 27, 2014). Also, with the new standards that will become effective on subjects such as revenue and financial instruments, or will be finalised in the future such as lease accounting, we anticipate it will regenerate reflexions from companies and there may be a new wave of companies switching from IFRS to Swiss GAAP FER.
However, Swiss GAAP FER is a Swiss specificity. The main reason preventing companies from making such a change is the expectation of investors. IFRS remains the worldwide standard reference.
Five companies elected to make use of the option provided to write off acquired goodwill directly to equity.
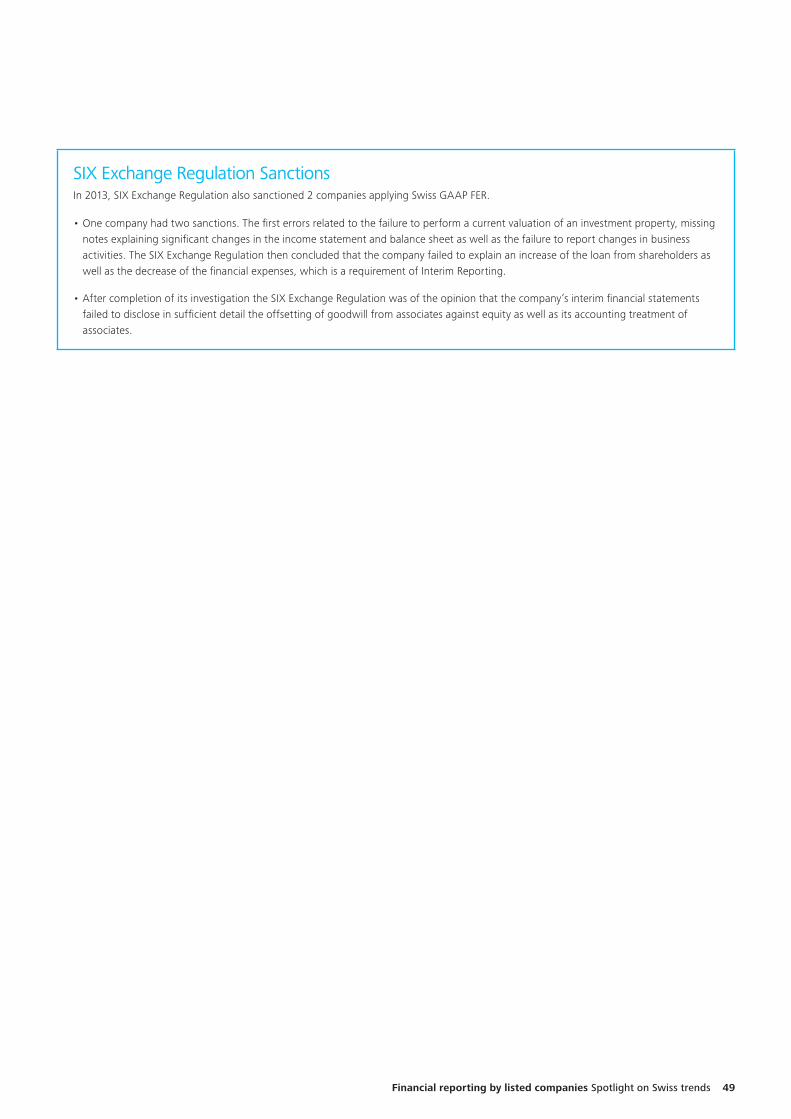
To start a new section, hold down the apple+shift keys and click
to release this object and type the section title in the box below.
SIX Exchange Regulation SanctionsIn 2013, SIX Exchange Regulation also sanctioned 2 companies applying Swiss GAAP FER.
• One company had two sanctions. The first errors related to the failure to perform a current valuation of an investment property, missing notes explaining significant changes in the income statement and balance sheet as well as the failure to report changes in business activities. The SIX Exchange Regulation then concluded that the company failed to explain an increase of the loan from shareholders as well as the decrease of the financial expenses, which is a requirement of Interim Reporting.
• After completion of its investigation the SIX Exchange Regulation was of the opinion that the company’s interim financial statements failed to disclose in sufficient detail the offsetting of goodwill from associates against equity as well as its accounting treatment of associates.
Financial reporting by listed companies Spotlight on Swiss trends 49
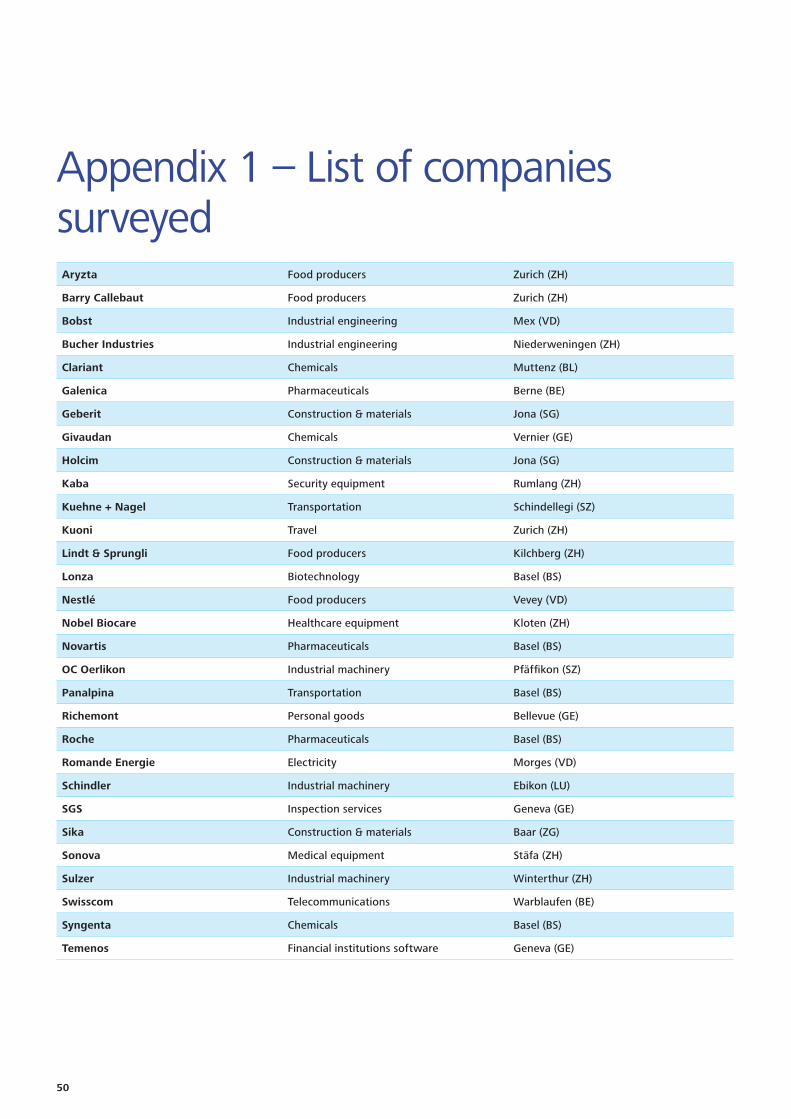
To start a new section, hold down the apple+shift keys and click
to release this object and type the section title in the box below.
50
Appendix 1 – List of companies surveyedAryzta Food producers Zurich (ZH)
Barry Callebaut Food producers Zurich (ZH)
Bobst Industrial engineering Mex (VD)
Bucher Industries Industrial engineering Niederweningen (ZH)
Clariant Chemicals Muttenz (BL)
Galenica Pharmaceuticals Berne (BE)
Geberit Construction & materials Jona (SG)
Givaudan Chemicals Vernier (GE)
Holcim Construction & materials Jona (SG)
Kaba Security equipment Rumlang (ZH)
Kuehne + Nagel Transportation Schindellegi (SZ)
Kuoni Travel Zurich (ZH)
Lindt & Sprungli Food producers Kilchberg (ZH)
Lonza Biotechnology Basel (BS)
Nestlé Food producers Vevey (VD)
Nobel Biocare Healthcare equipment Kloten (ZH)
Novartis Pharmaceuticals Basel (BS)
OC Oerlikon Industrial machinery Pfäffikon (SZ)
Panalpina Transportation Basel (BS)
Richemont Personal goods Bellevue (GE)
Roche Pharmaceuticals Basel (BS)
Romande Energie Electricity Morges (VD)
Schindler Industrial machinery Ebikon (LU)
SGS Inspection services Geneva (GE)
Sika Construction & materials Baar (ZG)
Sonova Medical equipment Stäfa (ZH)
Sulzer Industrial machinery Winterthur (ZH)
Swisscom Telecommunications Warblaufen (BE)
Syngenta Chemicals Basel (BS)
Temenos Financial institutions software Geneva (GE)
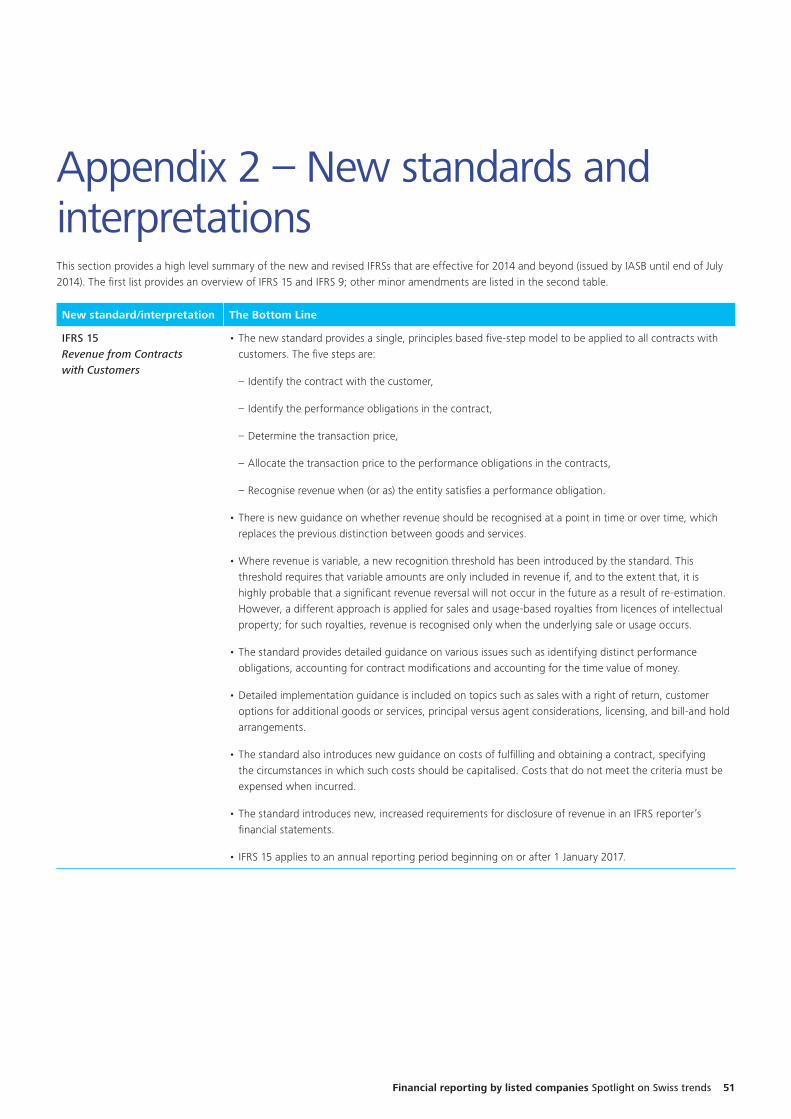
To start a new section, hold down the apple+shift keys and click
to release this object and type the section title in the box below.
Financial reporting by listed companies Spotlight on Swiss trends 51
Appendix 2 – New standards and interpretationsThis section provides a high level summary of the new and revised IFRSs that are effective for 2014 and beyond (issued by IASB until end of July 2014). The first list provides an overview of IFRS 15 and IFRS 9; other minor amendments are listed in the second table.
New standard/interpretation The Bottom Line
IFRS 15 Revenue from Contracts with Customers
• The new standard provides a single, principles based five-step model to be applied to all contracts with customers. The five steps are:
– Identify the contract with the customer,
– Identify the performance obligations in the contract,
– Determine the transaction price,
– Allocate the transaction price to the performance obligations in the contracts,
– Recognise revenue when (or as) the entity satisfies a performance obligation.
• There is new guidance on whether revenue should be recognised at a point in time or over time, which replaces the previous distinction between goods and services.
• Where revenue is variable, a new recognition threshold has been introduced by the standard. This threshold requires that variable amounts are only included in revenue if, and to the extent that, it is highly probable that a significant revenue reversal will not occur in the future as a result of re-estimation. However, a different approach is applied for sales and usage-based royalties from licences of intellectual property; for such royalties, revenue is recognised only when the underlying sale or usage occurs.
• The standard provides detailed guidance on various issues such as identifying distinct performance obligations, accounting for contract modifications and accounting for the time value of money.
• Detailed implementation guidance is included on topics such as sales with a right of return, customer options for additional goods or services, principal versus agent considerations, licensing, and bill-and hold arrangements.
• The standard also introduces new guidance on costs of fulfilling and obtaining a contract, specifying the circumstances in which such costs should be capitalised. Costs that do not meet the criteria must be expensed when incurred.
• The standard introduces new, increased requirements for disclosure of revenue in an IFRS reporter’s financial statements.
• IFRS 15 applies to an annual reporting period beginning on or after 1 January 2017.
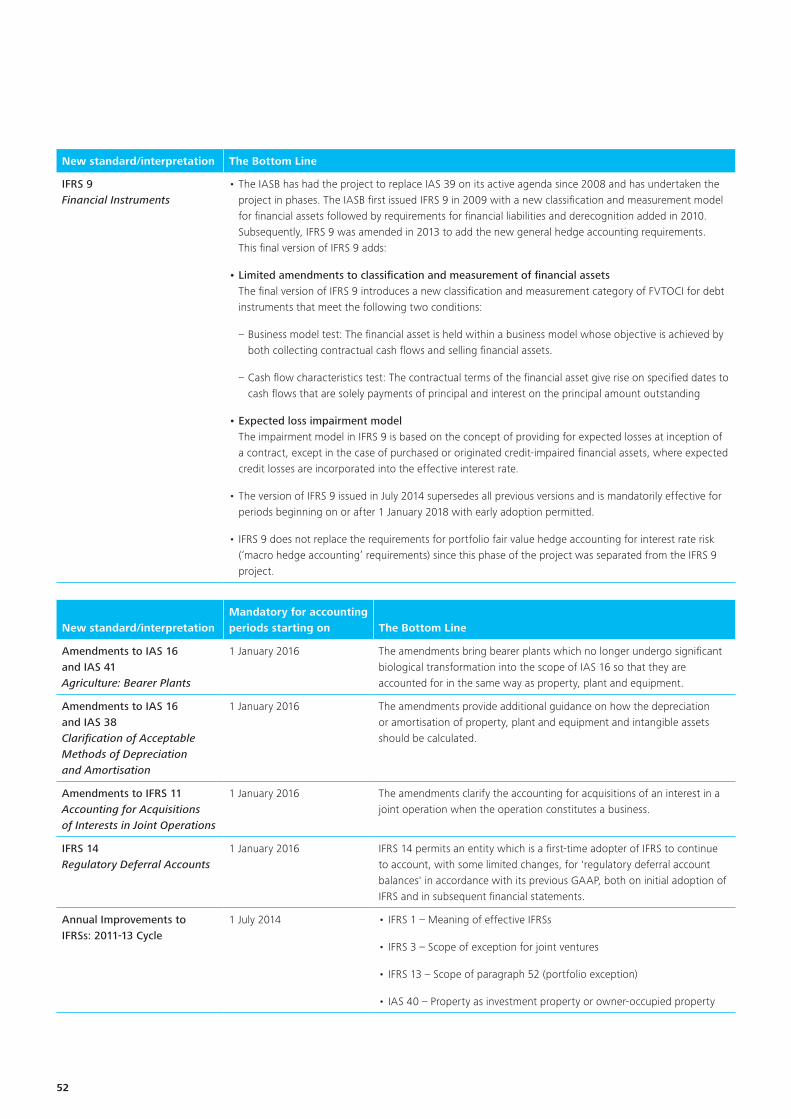
To start a new section, hold down the apple+shift keys and click
to release this object and type the section title in the box below.
52
New standard/interpretation The Bottom Line
IFRS 9 Financial Instruments
• The IASB has had the project to replace IAS 39 on its active agenda since 2008 and has undertaken the project in phases. The IASB first issued IFRS 9 in 2009 with a new classification and measurement model for financial assets followed by requirements for financial liabilities and derecognition added in 2010. Subsequently, IFRS 9 was amended in 2013 to add the new general hedge accounting requirements. This final version of IFRS 9 adds:
• Limited amendments to classification and measurement of financial assets The final version of IFRS 9 introduces a new classification and measurement category of FVTOCI for debt instruments that meet the following two conditions:
– Business model test: The financial asset is held within a business model whose objective is achieved by both collecting contractual cash flows and selling financial assets.
– Cash flow characteristics test: The contractual terms of the financial asset give rise on specified dates to cash flows that are solely payments of principal and interest on the principal amount outstanding
• Expected loss impairment model The impairment model in IFRS 9 is based on the concept of providing for expected losses at inception of a contract, except in the case of purchased or originated credit-impaired financial assets, where expected credit losses are incorporated into the effective interest rate.
• The version of IFRS 9 issued in July 2014 supersedes all previous versions and is mandatorily effective for periods beginning on or after 1 January 2018 with early adoption permitted.
• IFRS 9 does not replace the requirements for portfolio fair value hedge accounting for interest rate risk (‘macro hedge accounting’ requirements) since this phase of the project was separated from the IFRS 9 project.
New standard/interpretationMandatory for accounting periods starting on The Bottom Line
Amendments to IAS 16 and IAS 41Agriculture: Bearer Plants
1 January 2016 The amendments bring bearer plants which no longer undergo significant biological transformation into the scope of IAS 16 so that they are accounted for in the same way as property, plant and equipment.
Amendments to IAS 16 and IAS 38Clarification of Acceptable Methods of Depreciation and Amortisation
1 January 2016 The amendments provide additional guidance on how the depreciation or amortisation of property, plant and equipment and intangible assets should be calculated.
Amendments to IFRS 11Accounting for Acquisitions of Interests in Joint Operations
1 January 2016 The amendments clarify the accounting for acquisitions of an interest in a joint operation when the operation constitutes a business.
IFRS 14Regulatory Deferral Accounts
1 January 2016 IFRS 14 permits an entity which is a first-time adopter of IFRS to continue to account, with some limited changes, for 'regulatory deferral account balances' in accordance with its previous GAAP, both on initial adoption of IFRS and in subsequent financial statements.
Annual Improvements to IFRSs: 2011-13 Cycle
1 July 2014 • IFRS 1 – Meaning of effective IFRSs
• IFRS 3 – Scope of exception for joint ventures
• IFRS 13 – Scope of paragraph 52 (portfolio exception)
• IAS 40 – Property as investment property or owner-occupied property
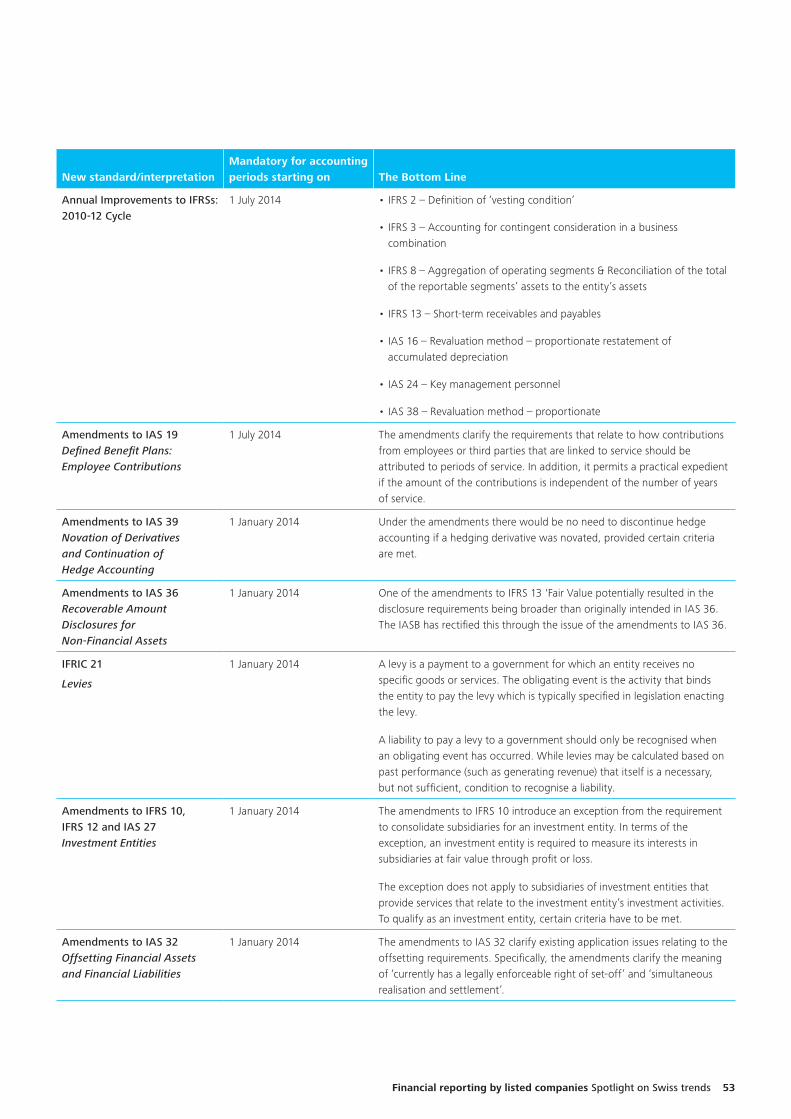
To start a new section, hold down the apple+shift keys and click
to release this object and type the section title in the box below.
Financial reporting by listed companies Spotlight on Swiss trends 53
New standard/interpretationMandatory for accounting periods starting on The Bottom Line
Annual Improvements to IFRSs: 2010-12 Cycle
1 July 2014 • IFRS 2 – Definition of ‘vesting condition’
• IFRS 3 – Accounting for contingent consideration in a business combination
• IFRS 8 – Aggregation of operating segments & Reconciliation of the total of the reportable segments’ assets to the entity’s assets
• IFRS 13 – Short-term receivables and payables
• IAS 16 – Revaluation method – proportionate restatement of accumulated depreciation
• IAS 24 – Key management personnel
• IAS 38 – Revaluation method – proportionate
Amendments to IAS 19Defined Benefit Plans: Employee Contributions
1 July 2014 The amendments clarify the requirements that relate to how contributions from employees or third parties that are linked to service should be attributed to periods of service. In addition, it permits a practical expedient if the amount of the contributions is independent of the number of years of service.
Amendments to IAS 39Novation of Derivatives and Continuation of Hedge Accounting
1 January 2014 Under the amendments there would be no need to discontinue hedge accounting if a hedging derivative was novated, provided certain criteria are met.
Amendments to IAS 36Recoverable Amount Disclosures for Non-Financial Assets
1 January 2014 One of the amendments to IFRS 13 'Fair Value potentially resulted in the disclosure requirements being broader than originally intended in IAS 36. The IASB has rectified this through the issue of the amendments to IAS 36.
IFRIC 21
Levies
1 January 2014 A levy is a payment to a government for which an entity receives no specific goods or services. The obligating event is the activity that binds the entity to pay the levy which is typically specified in legislation enacting the levy.
A liability to pay a levy to a government should only be recognised when an obligating event has occurred. While levies may be calculated based on past performance (such as generating revenue) that itself is a necessary, but not sufficient, condition to recognise a liability.
Amendments to IFRS 10, IFRS 12 and IAS 27 Investment Entities
1 January 2014 The amendments to IFRS 10 introduce an exception from the requirement to consolidate subsidiaries for an investment entity. In terms of the exception, an investment entity is required to measure its interests in subsidiaries at fair value through profit or loss.
The exception does not apply to subsidiaries of investment entities that provide services that relate to the investment entity’s investment activities. To qualify as an investment entity, certain criteria have to be met.
Amendments to IAS 32 Offsetting Financial Assets and Financial Liabilities
1 January 2014 The amendments to IAS 32 clarify existing application issues relating to the offsetting requirements. Specifically, the amendments clarify the meaning of ‘currently has a legally enforceable right of set-off’ and ‘simultaneous realisation and settlement’.
To start a new section, hold down the apple+shift keys and click
to release this object and type the section title in the box below.
54
Appendix 3 – Other Deloitte IFRS publications
Deloitte iGAAP 2014 – A Guide to IFRS Reporting The latest edition of Deloitte’s iGAAP sets out comprehensive guidance for entities reporting under IFRS by (1 focusing on the practical issues faced by reporting entities; (2) explaining clearly the requirements of IFRSs; (3) adding interpretation and commentary when IFRSs are silent, ambiguous, or unclear; and (4) providing many illustrative examples.
The manual deals comprehensively with those new Standards that apply for periods beginning in 2013, and also covers those further pronouncements issued by the IASB up to 31 July 2013 that will apply from 2014 and later.
New materials include:
• the ‘suite of five’ issued in May 2011 and effective in 2013 – IFRS 10 Consolidated Financial Statements, IFRS 11 Joint Arrangements, IFRS 12 Disclosure of Interests in Other Entities, and the revised versions of IAS 27 Separate Financial Statements and IAS 28 Investments in Associates and Joint Ventures.
• IFRS 13 Fair Value Measurement.
• the revised version of IAS 19 Employee Benefits.
• Investment Entities (Amendments to IFRS 10, IFRS 12 and IAS 27), issued in October 2012.
• Recoverable Amount Disclosures for Non-Financial Assets (Amendments to IAS 36), issued in May 2013.
• IFRIC 21 Levies, issued in May 2013.
Deloitte IFRS model financial statementsThese financial statements illustrate the presentation and disclosure requirements of IFRS by an entity that is not a first-time adopter. Also available is the IFRS compliance, presentation and disclosure checklist.
IFRS in your PocketOur popular guide to IFRS includes information about:
• The IASB organisation – its structure, membership, due process, contact information, and a chronology.
• Use of IFRSs around the world, including updates on Europe, United States, Canada and elsewhere in the Americas, and Asia-Pacific.
• Recent pronouncements – those which are effective and those which can be early adopted.
• Summaries of current Standards and related Interpretations, as well as the Conceptual Framework for Financial Reporting and the Preface to IFRSs.
• IASB agenda projects and active research topics.
• IFRS Interpretations Committee current agenda topics.
• Other useful IASB-related information.
To start a new section, hold down the apple+shift keys and click
to release this object and type the section title in the box below.
Financial reporting by listed companies Spotlight on Swiss trends 55
How can we help – your IFRS contacts
ZurichMartin WelserPartner058 279 62 [email protected]
Rolf SchönauerPartnerFinancial Services Industry058 279 63 [email protected]
Oliver KösterDirector058 279 61 [email protected]
BaselChristophe AebiDirector058 279 90 [email protected]
LuganoLuciano MongaPartner058 279 94 [email protected]
Geneva/LausanneFabien BryoisPartner058 279 80 [email protected]
Alexandre BugaPartnerFinancial Services Industry058 279 80 [email protected]
Chris JonesPartner058 279 81 [email protected]
Joelle HerbetteDirector058 279 81 [email protected]

To start a new section, hold down the apple+shift keys and click
to release this object and type the section title in the box below.
56


To start a new section, hold down the apple+shift keys and click
to release this object and type the section title in the box below.
Deloitte refers to one or more of Deloitte Touche Tohmatsu Limited (“DTTL”), a UK private company limited by guarantee, and its network of member firms, each of which is a legally separate and independent entity. Please see www.deloitte.com/ch/about for a detailed description of the legal structure of DTTL and its member firms.
Deloitte AG is a subsidiary of Deloitte LLP, the United Kingdom member firm of DTTL.
Deloitte AG is an audit firm recognised and supervised by the Federal Audit Oversight Authority (FAOA) and the Swiss Financial Market Supervisory Authority (FINMA).
This publication has been written in general terms and therefore cannot be relied on to cover specific situations; application of the principles set out will depend upon the particular circumstances involved and we recommend that you obtain professional advice before acting or refraining from acting on any of the contents of this publication. Deloitte AG would be pleased to advise readers on how to apply the principles set out in this publication to their specific circumstances. Deloitte AG accepts no duty of care or liability for any loss occasioned to any person acting or refraining from action as a result of any material in this publication.
© 2014 Deloitte AG. All rights reserved.
Designed and produced by The Creative Studio at Deloitte, London. 37130A


![Investment Banking I Industry Spotlight · 2020-01-10 · 5 Tech-Enabled Business Services I Industry Spotlight Q3 2018 Public Market Valuation Trends [1] In this chart, the blue](https://img.pdfslide.net/doc/110x75/5e44ff080035021ef24b30df/investment-banking-i-industry-spotlight-2020-01-10-5-tech-enabled-business-services.jpg)