Embed Size (px)
Citation preview

www.arcelormittalsa.com
Financial results for the six months ended June 2014
1

www.arcelormittalsa.com Overview
2
Agenda
• Overview CEO, Paul O’Flaherty
• Steel market overview CEO, Paul O’Flaherty
• Finance CFO, Matthias Wellhausen
• Operating results COO, Hans Ludwig Rosenstock
• Other key issues and outlook CEO, Paul O’Flaherty
• Questions
www.arcelormittalsa.com
Overview Paul O’Flaherty, CEO
3
www.arcelormittalsa.com Overview
4
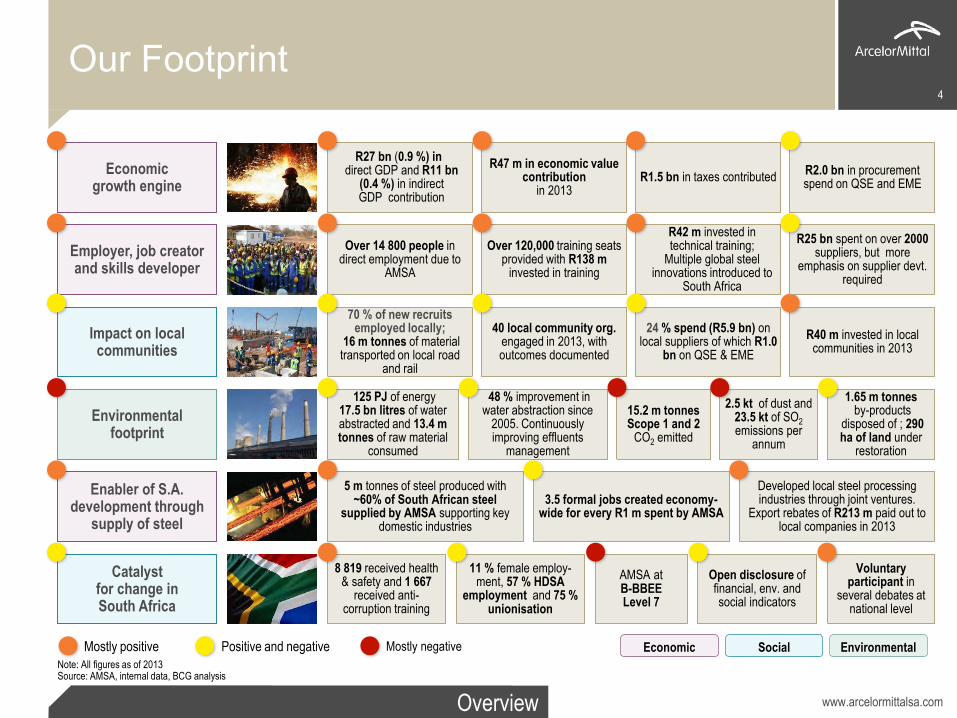
70 % of new recruits employed locally;
16 m tonnes of material transported on local road
and rail
R40 m invested in local communities in 2013
40 local community org. engaged in 2013, with outcomes documented
24 % spend (R5.9 bn) on local suppliers of which R1.0
bn on QSE & EME
5 m tonnes of steel produced with ~60% of South African steel
supplied by AMSA supporting key domestic industries
3.5 formal jobs created economy-wide for every R1 m spent by AMSA
Developed local steel processing industries through joint ventures.
Export rebates of R213 m paid out to local companies in 2013
Our Footprint
Note: All figures as of 2013 Source: AMSA, internal data, BCG analysis
Employer, job creator and skills developer
Impact on local communities
Environmental footprint
Enabler of S.A. development through
supply of steel
Catalyst for change in South Africa
Economic growth engine
R27 bn (0.9 %) in direct GDP and R11 bn
(0.4 %) in indirect GDP contribution
R1.5 bn in taxes contributed
R42 m invested in technical training;
Multiple global steel innovations introduced to
South Africa
Over 14 800 people in direct employment due to
AMSA
Over 120,000 training seats provided with R138 m
invested in training
Economic Social Environmental Mostly positive Positive and negative Mostly negative
R2.0 bn in procurement spend on QSE and EME
R47 m in economic value contribution
in 2013
15.2 m tonnes Scope 1 and 2
CO2 emitted
1.65 m tonnes by-products
disposed of ; 290 ha of land under
restoration
48 % improvement in water abstraction since
2005. Continuously improving effluents
management
125 PJ of energy 17.5 bn litres of water abstracted and 13.4 m tonnes of raw material
consumed
2.5 kt of dust and 23.5 kt of SO2 emissions per
annum
11 % female employ-ment, 57 % HDSA
employment and 75 % unionisation
8 819 received health & safety and 1 667
received anti-corruption training
Open disclosure of financial, env. and social indicators
AMSA at B-BBEE Level 7
Voluntary participant in
several debates at national level
R25 bn spent on over 2000 suppliers, but more
emphasis on supplier devt. required
www.arcelormittalsa.com Overview
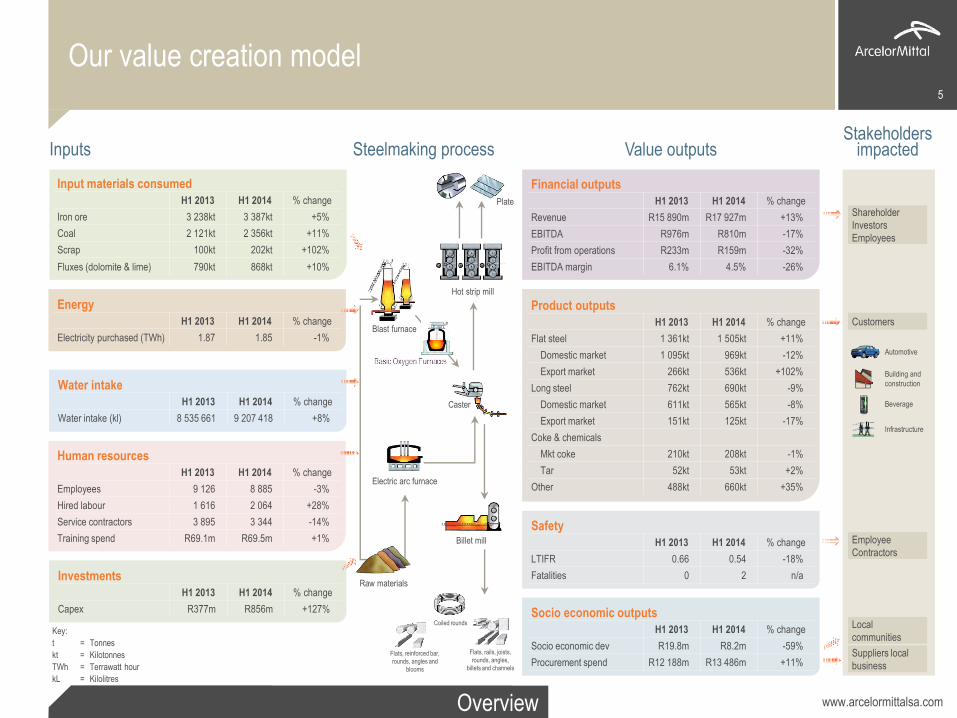
Our value creation model 5
Key:
t = Tonnes
kt = Kilotonnes
TWh = Terrawatt hour
kL = Kilolitres
Inputs
Input materials consumed
H1 2013 H1 2014 % change
Iron ore 3 238kt 3 387kt +5%
Coal 2 121kt 2 356kt +11%
Scrap 100kt 202kt +102%
Fluxes (dolomite & lime) 790kt 868kt +10%
Energy
H1 2013 H1 2014 % change
Electricity purchased (TWh) 1.87 1.85 -1%
Water intake
H1 2013 H1 2014 % change
Water intake (kl) 8 535 661 9 207 418 +8%
Human resources
H1 2013 H1 2014 % change
Employees 9 126 8 885 -3%
Hired labour 1 616 2 064 +28%
Service contractors 3 895 3 344 -14%
Training spend R69.1m R69.5m +1%
Investments
H1 2013 H1 2014 % change
Capex R377m R856m +127%
Financial outputs
H1 2013 H1 2014 % change
Revenue R15 890m R17 927m +13%
EBITDA R976m R810m -17%
Profit from operations R233m R159m -32%
EBITDA margin 6.1% 4.5% -26%
Stakeholders impacted
Shareholder
Investors
Employees
Customers
Automotive
Building and
construction
Beverage
Infrastructure
Employee
Contractors
Local
communities
Suppliers local
business
Product outputs
H1 2013 H1 2014 % change
Flat steel 1 361kt 1 505kt +11%
Domestic market 1 095kt 969kt -12%
Export market 266kt 536kt +102%
Long steel 762kt 690kt -9%
Domestic market 611kt 565kt -8%
Export market 151kt 125kt -17%
Coke & chemicals
Mkt coke 210kt 208kt -1%
Tar 52kt 53kt +2%
Other 488kt 660kt +35%
Safety
H1 2013 H1 2014 % change
LTIFR 0.66 0.54 -18%
Fatalities 0 2 n/a
Value outputs
Socio economic outputs
H1 2013 H1 2014 % change
Socio economic dev R19.8m R8.2m -59%
Procurement spend R12 188m R13 486m +11%
Steelmaking process
Plate
Hot strip mill
Caster
Blast furnace
Electric arc furnace
Billet mill
Raw materials
Coiled rounds
Flats, rails, joists,
rounds, angles,
billets and channels
Flats, reinforced bar,
rounds, angles and
blooms
www.arcelormittalsa.com Overview
6
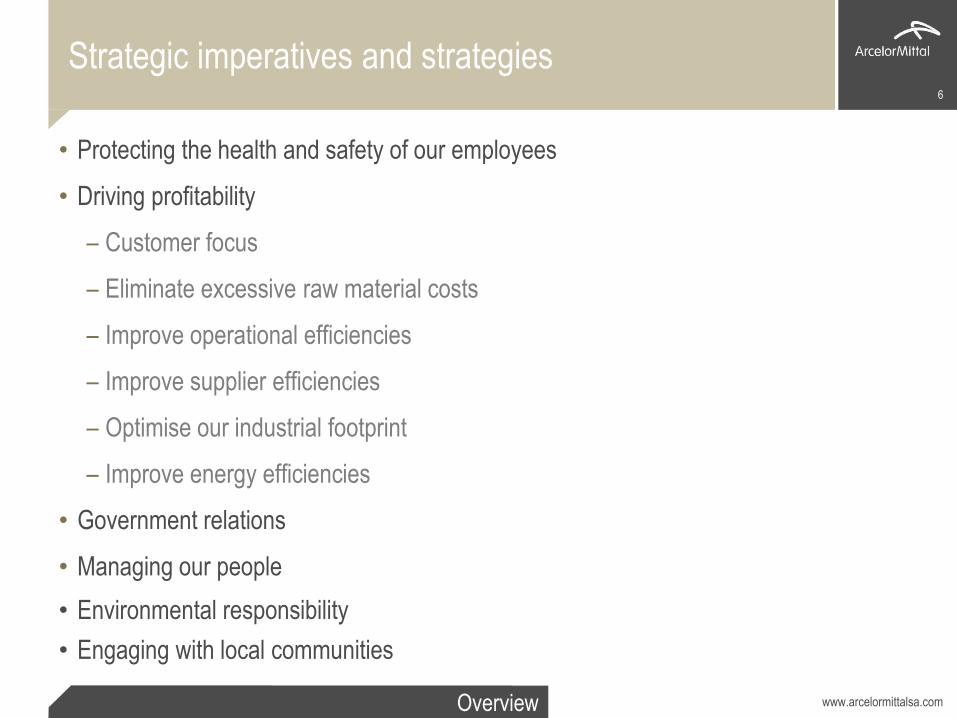
Strategic imperatives and strategies
• Protecting the health and safety of our employees
• Driving profitability
– Customer focus
– Eliminate excessive raw material costs
– Improve operational efficiencies
– Improve supplier efficiencies
– Optimise our industrial footprint
– Improve energy efficiencies
• Government relations
• Managing our people
• Environmental responsibility
• Engaging with local communities
www.arcelormittalsa.com Overview
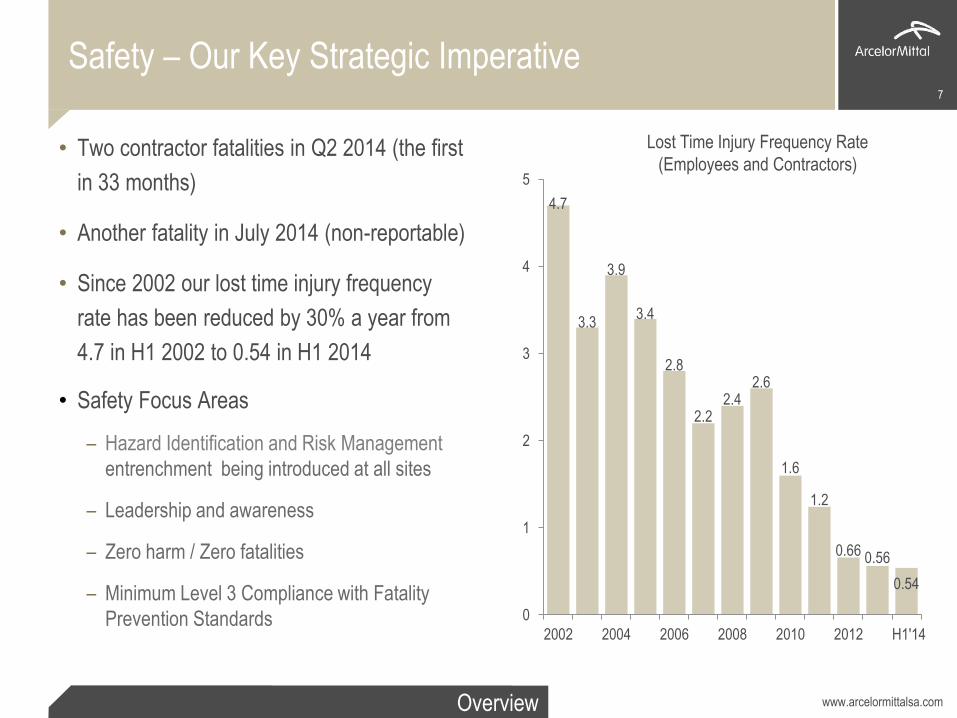
Safety – Our Key Strategic Imperative
• Two contractor fatalities in Q2 2014 (the first
in 33 months)
• Another fatality in July 2014 (non-reportable)
• Since 2002 our lost time injury frequency
rate has been reduced by 30% a year from
4.7 in H1 2002 to 0.54 in H1 2014
• Safety Focus Areas
– Hazard Identification and Risk Management
entrenchment being introduced at all sites
– Leadership and awareness
– Zero harm / Zero fatalities
– Minimum Level 3 Compliance with Fatality
Prevention Standards
7
4.7
3.3
3.9
3.4
2.8
2.2 2.4
2.6
1.6
1.2
0.66 0.56
0.54
0
1
2
3
4
5
2002 2004 2006 2008 2010 2012 H1'14
Lost Time Injury Frequency Rate
(Employees and Contractors)
www.arcelormittalsa.com Overview
8
Environmental investment program
• R1 452m spent on environmental capital since 2007
– Air emission compliance (44%)
– Water management (47%)
– Others such as waste management (9%)
• Rehabilitation of legacy sites remains important
• Energy efficiency
– Investigate alternative suppliers for electricity and gas
– Mitigating options to replace natural gas and/or generate own electricity
www.arcelormittalsa.com Overview
9
Socio Economic activities
• R8.2m (R19.8m) spent
– 100 houses re-roofed in Boipatong bringing the total to 3 000 since 2010
– 10 new homes in Blaaubosch near Newcastle were built by employees bringing the total of
new homes built near our plants to 54 since our volunteering program in 2009
– Grants for NGO’ s mostly involved in health and education related activities and up-skilling at
the North West University around the Vaal area
– Science centers
• 1 500 pupils attend science centers in the Vaal Triangle, Saldanha and Newcastle
• Vanderbijlpark Works recruits graduates from the program with 34 learners already on the
workforce pipeline for various engineering fields
• 500 local communities benefited from computer lessons offered by the centers
• Early childhood development programs offered by the centers
• Signed an MOU for the Newcastle Science Center to assist the Department of Education
with teacher development training
www.arcelormittalsa.com Overview
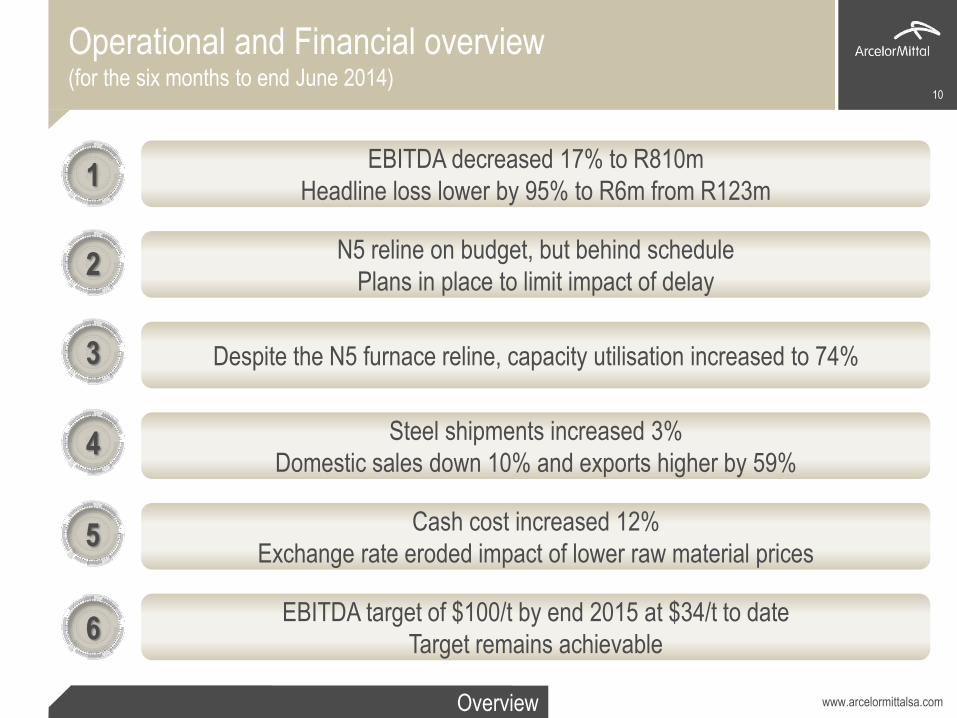
Operational and Financial overview (for the six months to end June 2014)
10
1
2
3
4
6
5
EBITDA decreased 17% to R810m
Headline loss lower by 95% to R6m from R123m
N5 reline on budget, but behind schedule
Plans in place to limit impact of delay
Despite the N5 furnace reline, capacity utilisation increased to 74%
Steel shipments increased 3%
Domestic sales down 10% and exports higher by 59%
Cash cost increased 12%
Exchange rate eroded impact of lower raw material prices
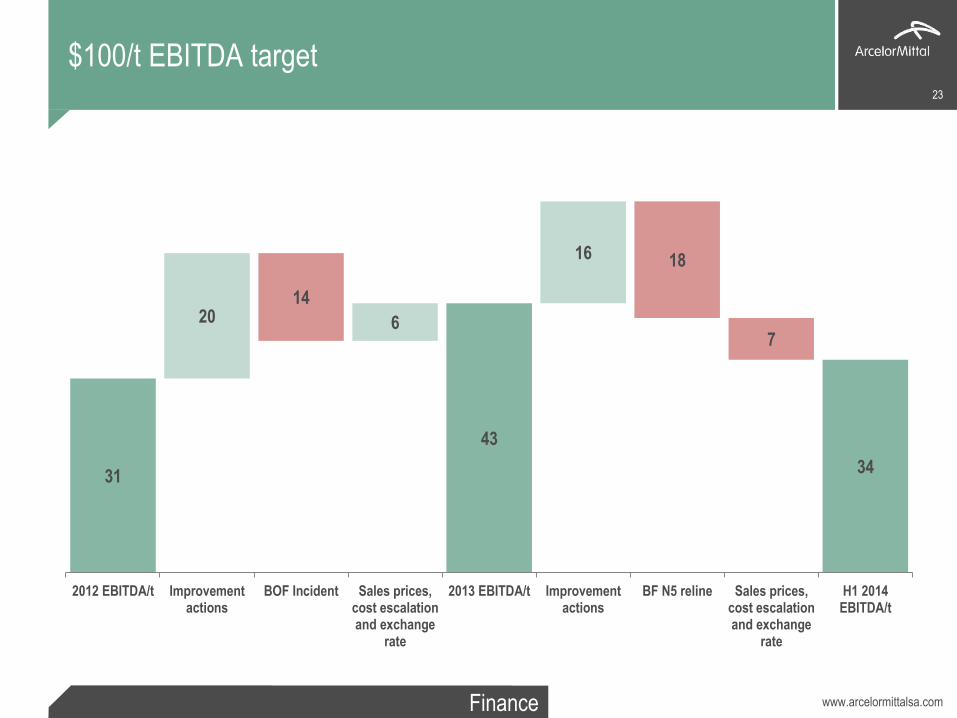
EBITDA target of $100/t by end 2015 at $34/t to date
Target remains achievable
www.arcelormittalsa.com Overview
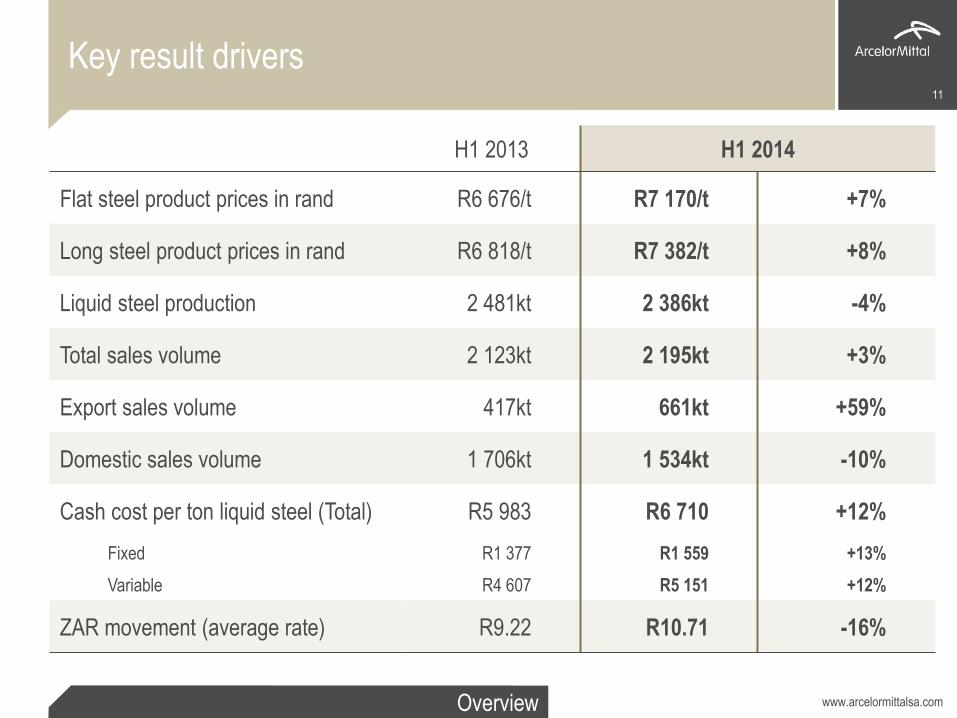
Key result drivers 11
H1 2013 H1 2014
Flat steel product prices in rand R6 676/t R7 170/t +7%
Long steel product prices in rand R6 818/t R7 382/t +8%
Liquid steel production 2 481kt 2 386kt -4%
Total sales volume 2 123kt 2 195kt +3%
Export sales volume 417kt 661kt +59%
Domestic sales volume 1 706kt 1 534kt -10%
Cash cost per ton liquid steel (Total) R5 983 R6 710 +12%
Fixed R1 377 R1 559 +13%
Variable R4 607 R5 151 +12%
ZAR movement (average rate) R9.22 R10.71 -16%
www.arcelormittalsa.com
Steel market overview Paul O’Flaherty, CEO
12
www.arcelormittalsa.com Steel market overview
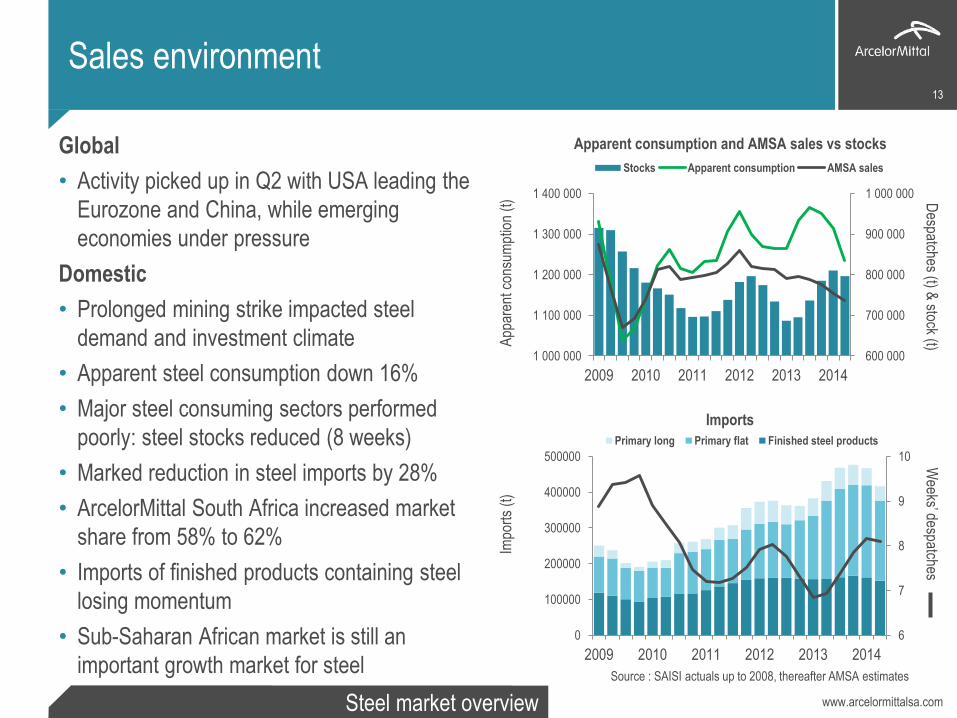
Sales environment
Global
• Activity picked up in Q2 with USA leading the
Eurozone and China, while emerging
economies under pressure
Domestic
• Prolonged mining strike impacted steel
demand and investment climate
• Apparent steel consumption down 16%
• Major steel consuming sectors performed
poorly: steel stocks reduced (8 weeks)
• Marked reduction in steel imports by 28%
• ArcelorMittal South Africa increased market
share from 58% to 62%
• Imports of finished products containing steel
losing momentum
• Sub-Saharan African market is still an
important growth market for steel
13
6
7
8
9
10
0
100000
200000
300000
400000
500000
2009 2010 2011 2012 2013 2014
Primary long Primary flat Finished steel products
Imports
Source : SAISI actuals up to 2008, thereafter AMSA estimates
Weeks’ despatches
Impo
rts
(t)
600 000
700 000
800 000
900 000
1 000 000
1 000 000
1 100 000
1 200 000
1 300 000
1 400 000
2009 2010 2011 2012 2013 2014
Stocks Apparent consumption AMSA sales
Apparent consumption and AMSA sales vs stocks
Despatches (t) &
stock (t) App
aren
t con
sum
ptio
n (t
)
www.arcelormittalsa.com Steel market overview
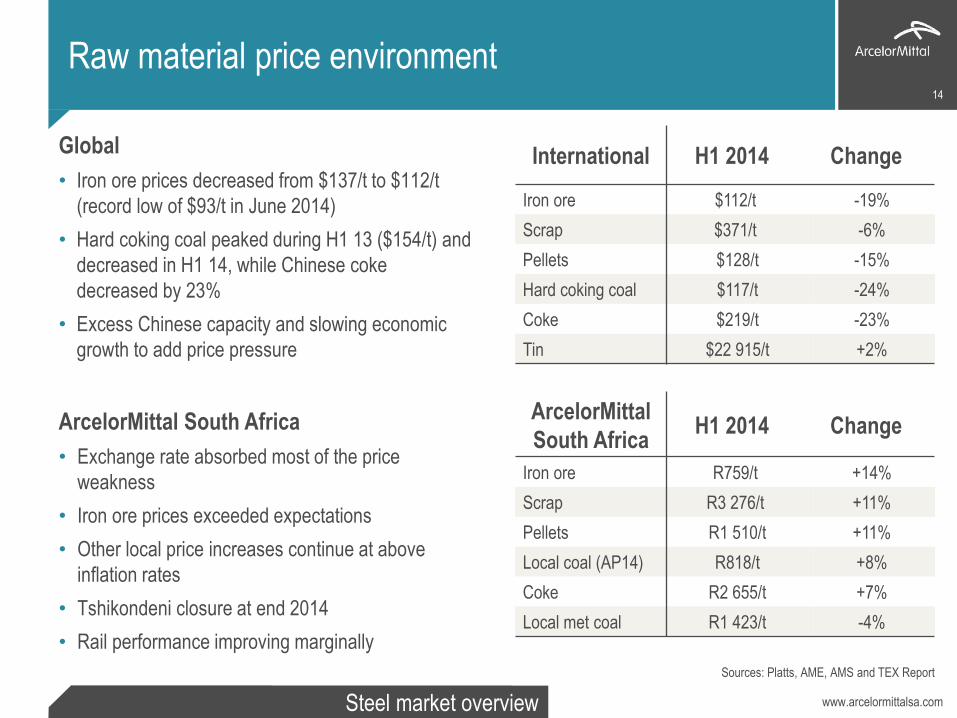
Raw material price environment
Global
• Iron ore prices decreased from $137/t to $112/t
(record low of $93/t in June 2014)
• Hard coking coal peaked during H1 13 ($154/t) and
decreased in H1 14, while Chinese coke
decreased by 23%
• Excess Chinese capacity and slowing economic
growth to add price pressure
ArcelorMittal South Africa
• Exchange rate absorbed most of the price
weakness
• Iron ore prices exceeded expectations
• Other local price increases continue at above
inflation rates
• Tshikondeni closure at end 2014
• Rail performance improving marginally
14
International H1 2014 Change
Iron ore $112/t -19%
Scrap $371/t -6%
Pellets $128/t -15%
Hard coking coal $117/t -24%
Coke $219/t -23%
Tin $22 915/t +2%
Sources: Platts, AME, AMS and TEX Report
ArcelorMittal
South Africa H1 2014 Change
Iron ore R759/t +14%
Scrap R3 276/t +11%
Pellets R1 510/t +11%
Local coal (AP14) R818/t +8%
Coke R2 655/t +7%
Local met coal R1 423/t -4%
www.arcelormittalsa.com Steel market overview
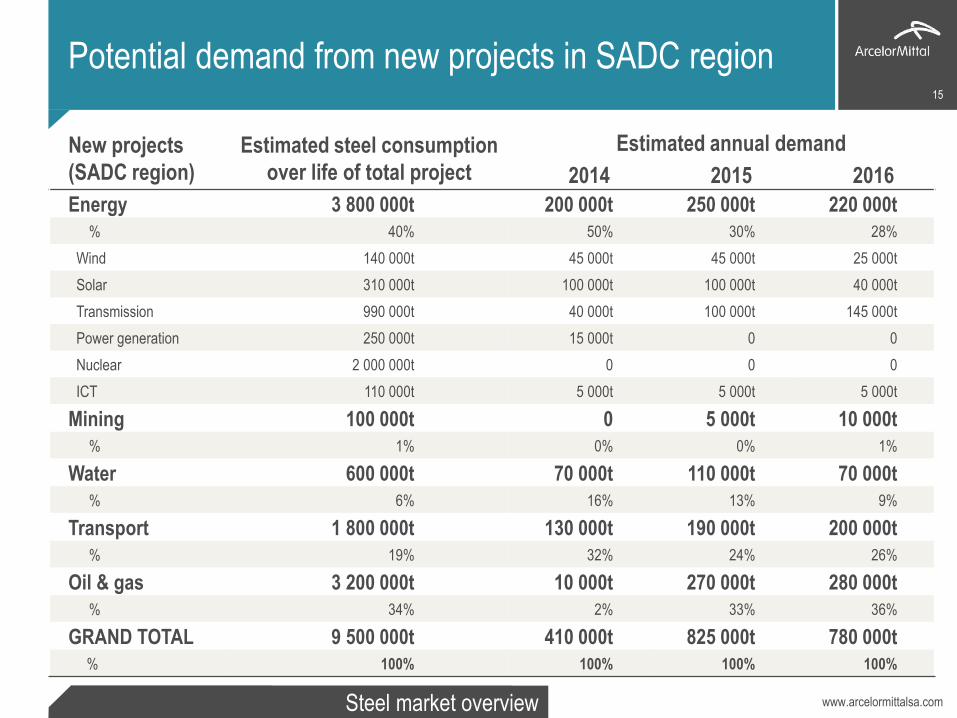
Potential demand from new projects in SADC region 15
New projects
(SADC region)
Estimated steel consumption
over life of total project
Estimated annual demand
2014 2015 2016
Energy 3 800 000t 200 000t 250 000t 220 000t
% 40% 50% 30% 28%
Wind 140 000t 45 000t 45 000t 25 000t
Solar 310 000t 100 000t 100 000t 40 000t
Transmission 990 000t 40 000t 100 000t 145 000t
Power generation 250 000t 15 000t 0 0
Nuclear 2 000 000t 0 0 0
ICT 110 000t 5 000t 5 000t 5 000t
Mining 100 000t 0 5 000t 10 000t
% 1% 0% 0% 1%
Water 600 000t 70 000t 110 000t 70 000t
% 6% 16% 13% 9%
Transport 1 800 000t 130 000t 190 000t 200 000t
% 19% 32% 24% 26%
Oil & gas 3 200 000t 10 000t 270 000t 280 000t
% 34% 2% 33% 36%
GRAND TOTAL 9 500 000t 410 000t 825 000t 780 000t
% 100% 100% 100% 100%
www.arcelormittalsa.com 16
Finance Matthias Wellhausen, CFO
www.arcelormittalsa.com Finance
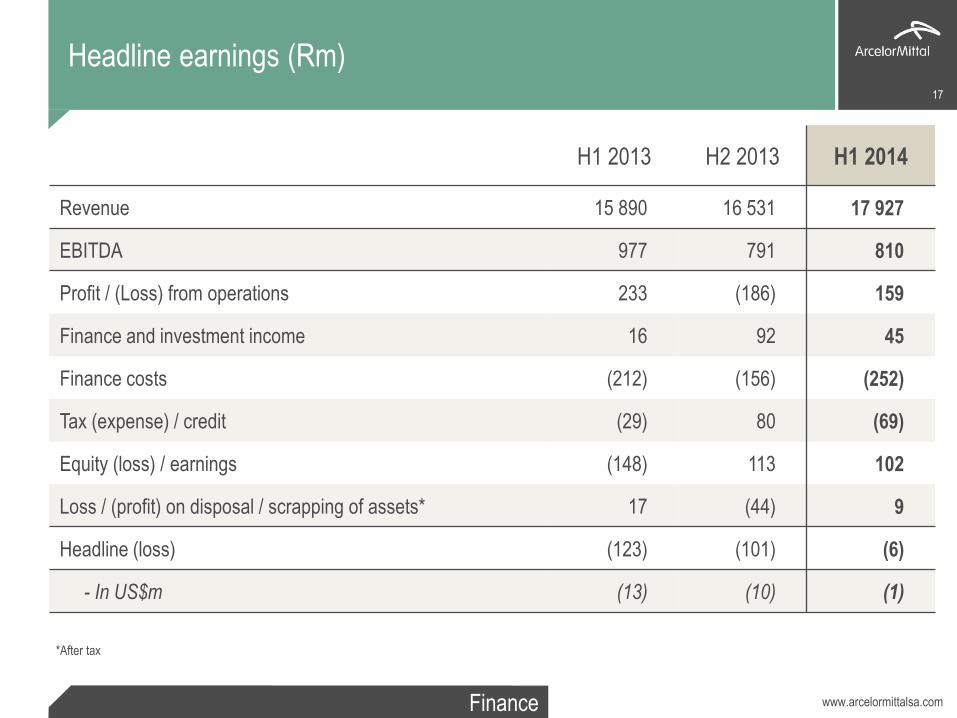
Headline earnings (Rm)
H1 2013 H2 2013 H1 2014
Revenue 15 890 16 531 17 927
EBITDA 977 791 810
Profit / (Loss) from operations 233 (186) 159
Finance and investment income 16 92 45
Finance costs (212) (156) (252)
Tax (expense) / credit (29) 80 (69)
Equity (loss) / earnings (148) 113 102
Loss / (profit) on disposal / scrapping of assets* 17 (44) 9
Headline (loss) (123) (101) (6)
- In US$m (13) (10) (1)
17
*After tax
www.arcelormittalsa.com Finance
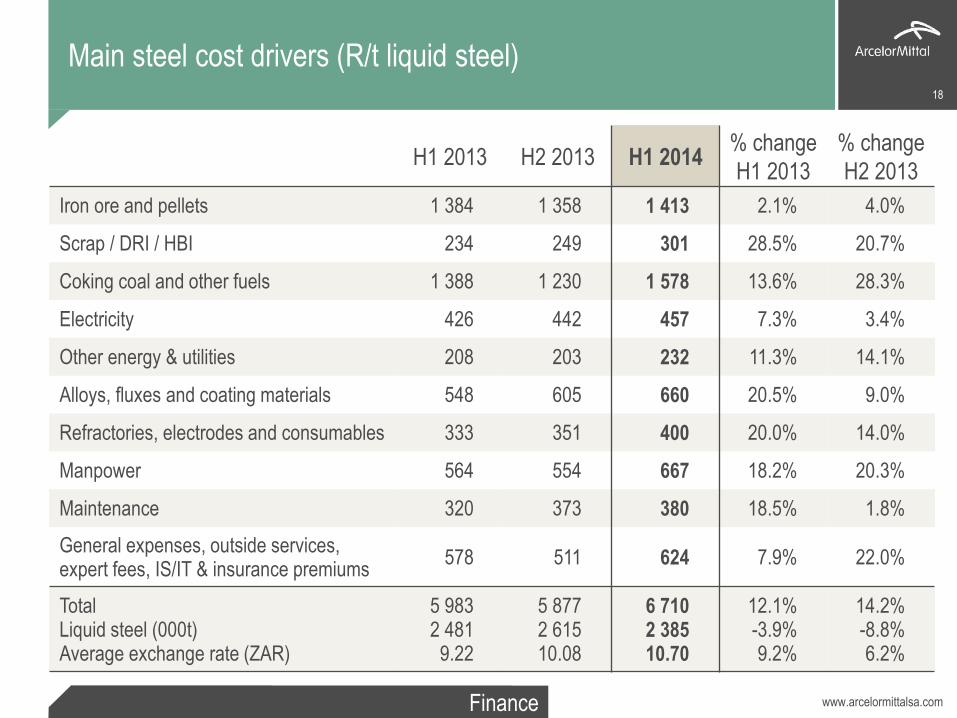
Main steel cost drivers (R/t liquid steel)
H1 2013 H2 2013 H1 2014 % change
H1 2013
% change
H2 2013
Iron ore and pellets 1 384 1 358 1 413 2.1% 4.0%
Scrap / DRI / HBI 234 249 301 28.5% 20.7%
Coking coal and other fuels 1 388 1 230 1 578 13.6% 28.3%
Electricity 426 442 457 7.3% 3.4%
Other energy & utilities 208 203 232 11.3% 14.1%
Alloys, fluxes and coating materials 548 605 660 20.5% 9.0%
Refractories, electrodes and consumables 333 351 400 20.0% 14.0%
Manpower 564 554 667 18.2% 20.3%
Maintenance 320 373 380 18.5% 1.8%
General expenses, outside services, expert fees, IS/IT & insurance premiums
578 511 624 7.9% 22.0%
Total Liquid steel (000t) Average exchange rate (ZAR)
5 983 2 481
9.22
5 877 2 615 10.08
6 710 2 385 10.70
12.1% -3.9% 9.2%
14.2% -8.8% 6.2%
18
www.arcelormittalsa.com Finance
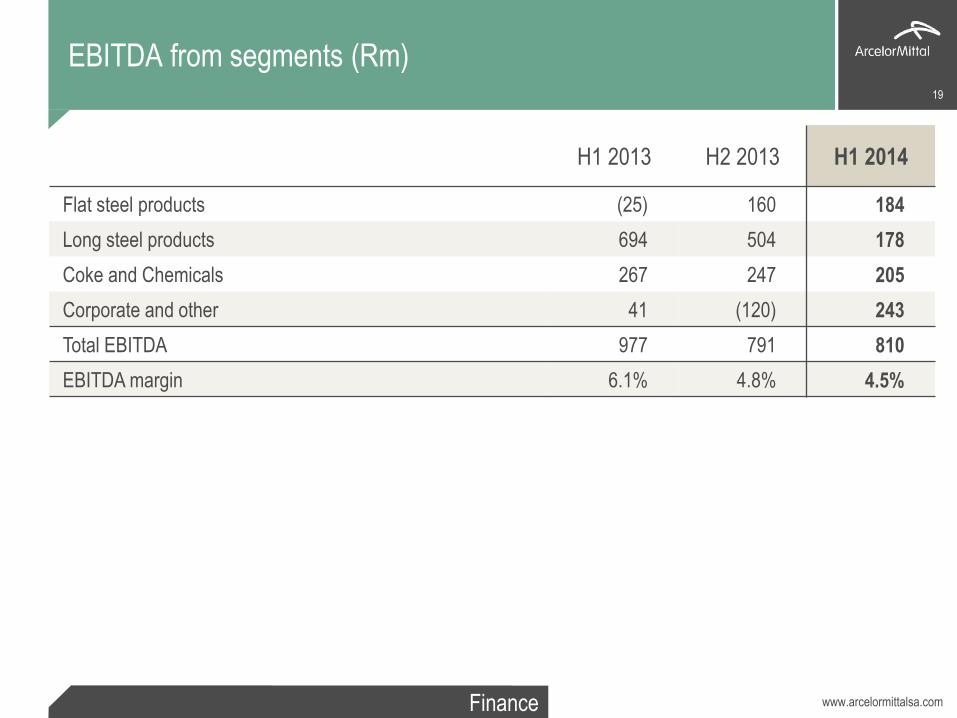
EBITDA from segments (Rm)
H1 2013 H2 2013 H1 2014
Flat steel products (25) 160 184
Long steel products 694 504 178
Coke and Chemicals 267 247 205
Corporate and other 41 (120) 243
Total EBITDA 977 791 810
EBITDA margin 6.1% 4.8% 4.5%
19
www.arcelormittalsa.com Finance
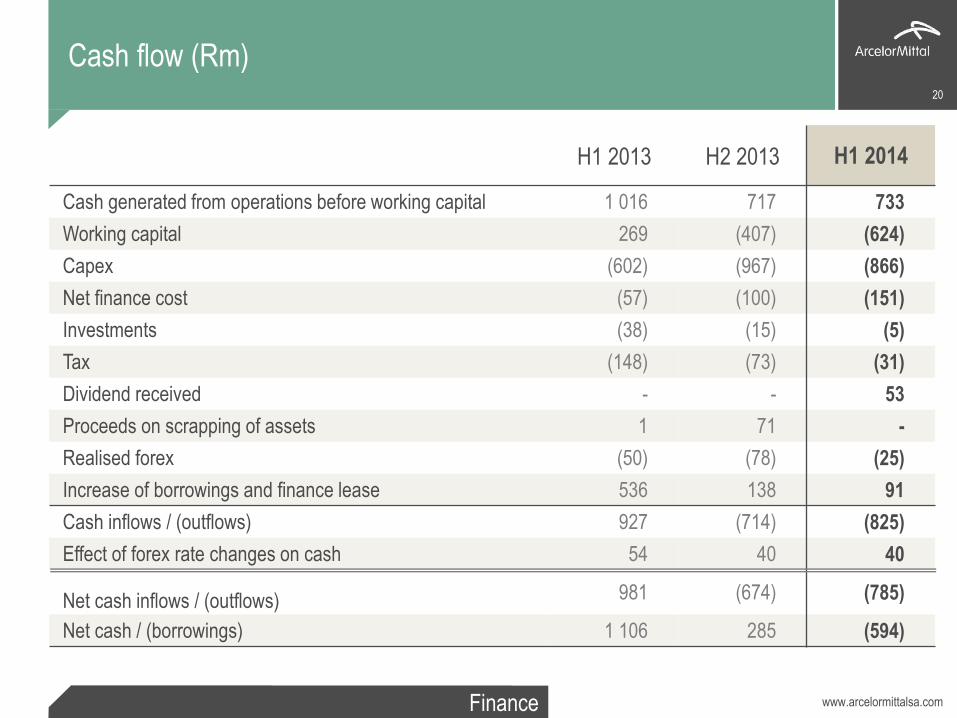
Cash flow (Rm)
H1 2013 H2 2013 H1 2014
Cash generated from operations before working capital 1 016 717 733
Working capital 269 (407) (624)
Capex (602) (967) (866)
Net finance cost (57) (100) (151)
Investments (38) (15) (5)
Tax (148) (73) (31)
Dividend received - - 53
Proceeds on scrapping of assets 1 71 -
Realised forex (50) (78) (25)
Increase of borrowings and finance lease 536 138 91
Cash inflows / (outflows) 927 (714) (825)
Effect of forex rate changes on cash 54 40 40
Net cash inflows / (outflows) 981 (674) (785)
Net cash / (borrowings) 1 106 285 (594)
20
www.arcelormittalsa.com Finance
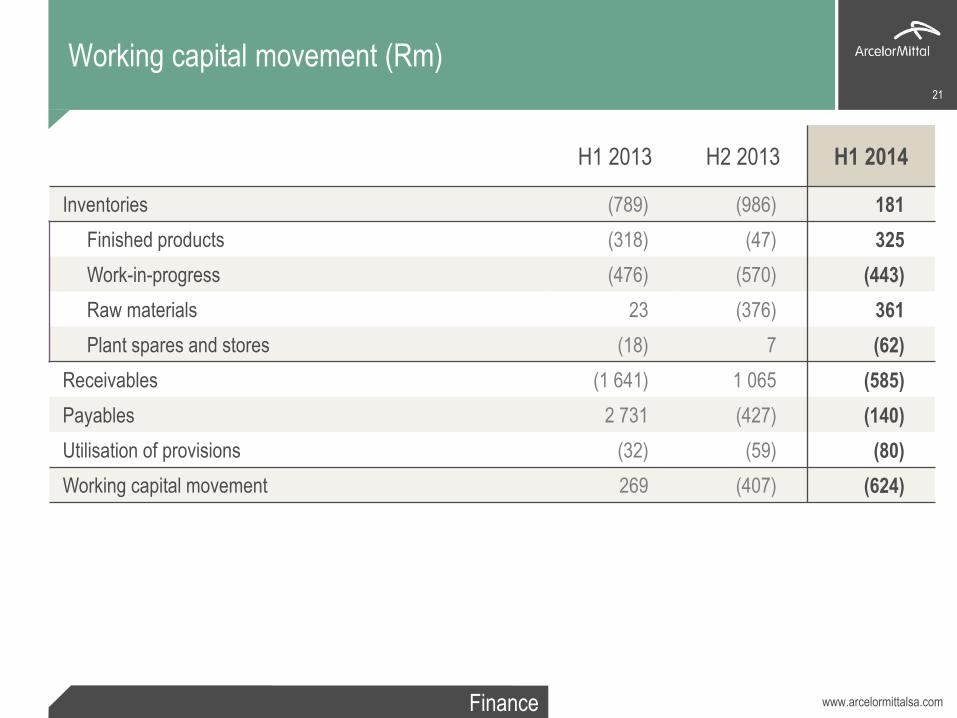
Working capital movement (Rm)
H1 2013 H2 2013 H1 2014
Inventories (789) (986) 181
Finished products (318) (47) 325
Work-in-progress (476) (570) (443)
Raw materials 23 (376) 361
Plant spares and stores (18) 7 (62)
Receivables (1 641) 1 065 (585)
Payables 2 731 (427) (140)
Utilisation of provisions (32) (59) (80)
Working capital movement 269 (407) (624)
21
www.arcelormittalsa.com Finance
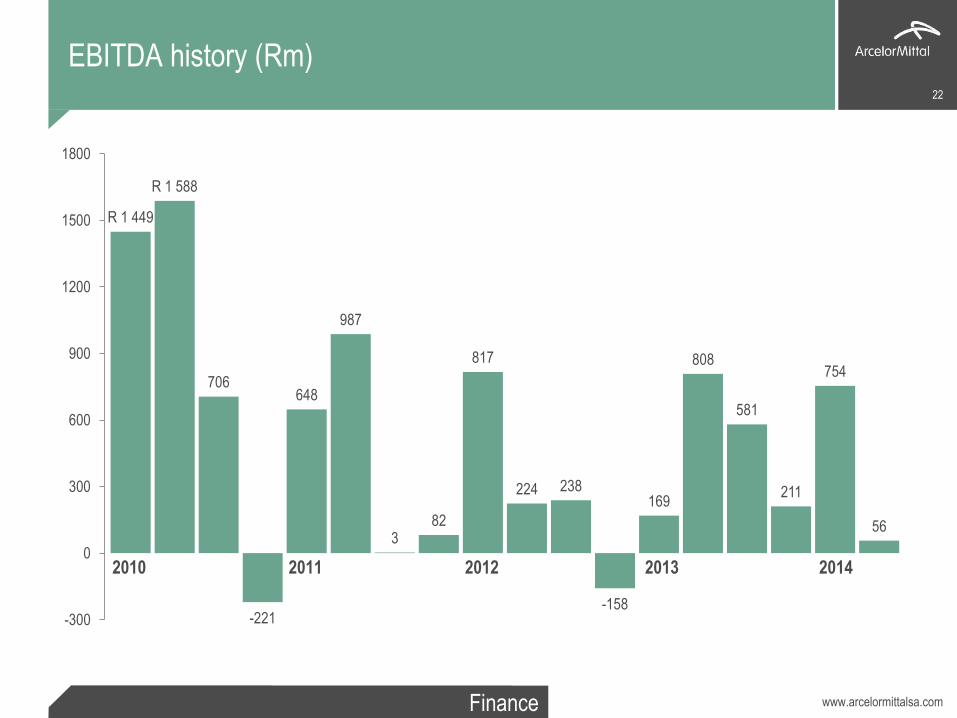
R 1 449
R 1 588
706
-221
648
987
3 82
817
224 238
-158
169
808
581
211
754
56
-300
0
300
600
900
1200
1500
1800
2010 2011 2012 2014 2013
22
EBITDA history (Rm)
www.arcelormittalsa.com Finance
$100/t EBITDA target 23
31
20 14
6
43
16 18
7
34
2012 EBITDA/t Improvementactions
BOF Incident Sales prices,cost escalationand exchange
rate
2013 EBITDA/t Improvementactions
BF N5 reline Sales prices,cost escalationand exchange
rate
H1 2014EBITDA/t
www.arcelormittalsa.com 24
Operating results Hans Ludwig Rosenstock, COO
www.arcelormittalsa.com Operating results
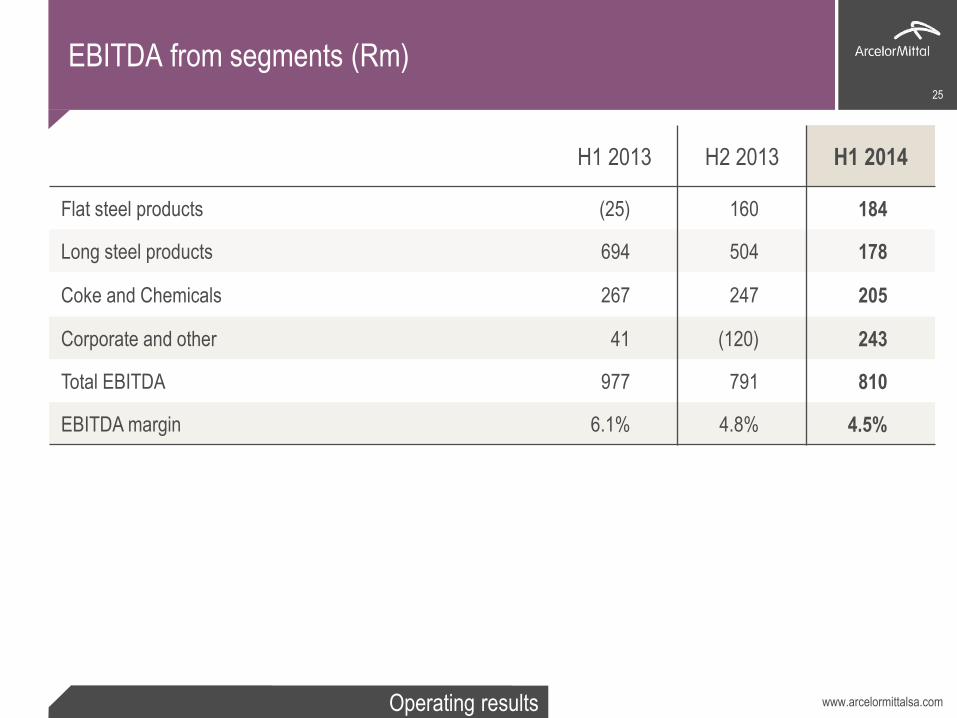
EBITDA from segments (Rm)
H1 2013 H2 2013 H1 2014
Flat steel products (25) 160 184
Long steel products 694 504 178
Coke and Chemicals 267 247 205
Corporate and other 41 (120) 243
Total EBITDA 977 791 810
EBITDA margin 6.1% 4.8% 4.5%
25
www.arcelormittalsa.com Operating results
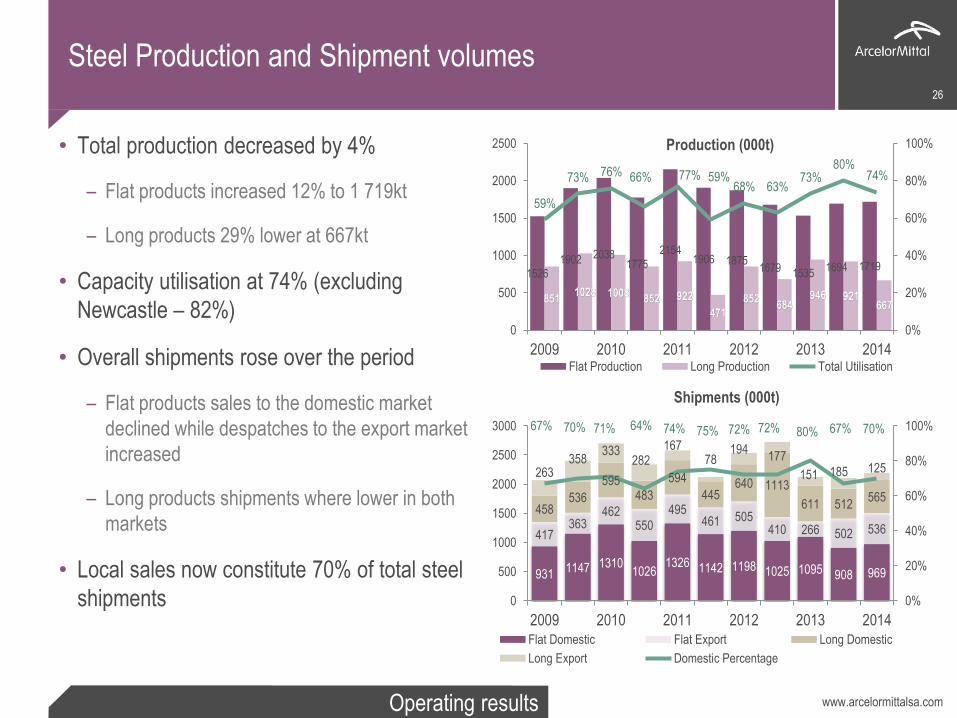
Steel Production and Shipment volumes
• Total production decreased by 4%
– Flat products increased 12% to 1 719kt
– Long products 29% lower at 667kt
• Capacity utilisation at 74% (excluding
Newcastle – 82%)
• Overall shipments rose over the period
– Flat products sales to the domestic market
declined while despatches to the export market
increased
– Long products shipments where lower in both
markets
• Local sales now constitute 70% of total steel
shipments
26
931 1147 1310
1026 1326 1142 1198 1025 1095 908 969
417 363
462 550
495 461 505
410 266 502 536
458 536
595 483
594
445 640 1113
611 512 565
263 358
333 282
167 78
194 177
151 185 125
67% 70% 71% 64% 74% 75% 72% 72% 80% 67% 70%
0%
20%
40%
60%
80%
100%
0
500
1000
1500
2000
2500
3000
2009 2010 2011 2012 2013 2014Flat Domestic Flat Export Long Domestic
Long Export Domestic Percentage
1526
1902 2038 1775
2154 1906 1875
1679 1535 1694 1719
851 1028 1008
852 922
471
852 684
946 921 667
59%
73% 76% 66% 77% 59% 68% 63%
73% 80%
74%
0%
20%
40%
60%
80%
100%
0
500
1000
1500
2000
2500
2009 2010 2011 2012 2013 2014Flat Production Long Production Total Utilisation
Production (000t)
Shipments (000t)
www.arcelormittalsa.com Operating results
88
345
309 321
376
255 233 227
210
335
273
50 50 62 63 60 57 56 53 52 57 54
0
100
200
300
400
500
600
0
50
100
150
200
250
300
350
400
2009 2010 2011 2012 2013 2014
Commercial coke Speciality chemicals
Coke price
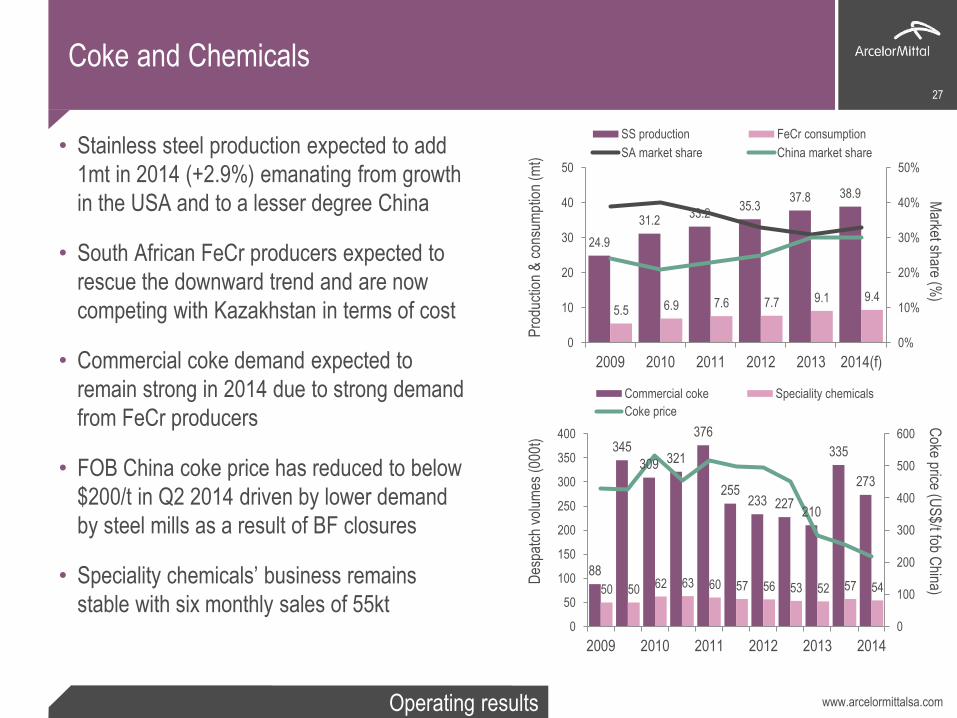
Coke and Chemicals
• Stainless steel production expected to add
1mt in 2014 (+2.9%) emanating from growth
in the USA and to a lesser degree China
• South African FeCr producers expected to
rescue the downward trend and are now
competing with Kazakhstan in terms of cost
• Commercial coke demand expected to
remain strong in 2014 due to strong demand
from FeCr producers
• FOB China coke price has reduced to below
$200/t in Q2 2014 driven by lower demand
by steel mills as a result of BF closures
• Speciality chemicals’ business remains
stable with six monthly sales of 55kt
27
24.9
31.2 33.2
35.3 37.8 38.9
5.5 6.9 7.6 7.7 9.1 9.4
0%
10%
20%
30%
40%
50%
0
10
20
30
40
50
2009 2010 2011 2012 2013 2014(f)
SS production FeCr consumption
SA market share China market share
Pro
duct
ion
& c
onsu
mpt
ion
(mt)
D
espa
tch
volu
mes
(00
0t)
Coke price (U
S$/t fob C
hina) M
arket share (%)
www.arcelormittalsa.com Operating results
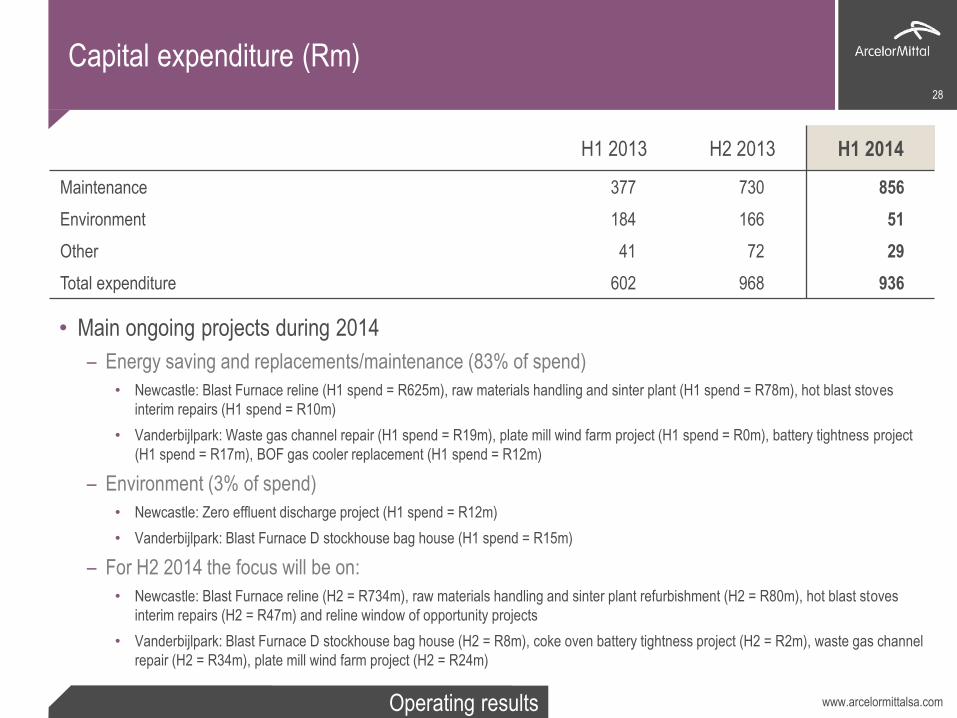
H1 2013 H2 2013 H1 2014
Maintenance 377 730 856
Environment 184 166 51
Other 41 72 29
Total expenditure 602 968 936
28
• Main ongoing projects during 2014
– Energy saving and replacements/maintenance (83% of spend)
• Newcastle: Blast Furnace reline (H1 spend = R625m), raw materials handling and sinter plant (H1 spend = R78m), hot blast stoves
interim repairs (H1 spend = R10m)
• Vanderbijlpark: Waste gas channel repair (H1 spend = R19m), plate mill wind farm project (H1 spend = R0m), battery tightness project
(H1 spend = R17m), BOF gas cooler replacement (H1 spend = R12m)
– Environment (3% of spend)
• Newcastle: Zero effluent discharge project (H1 spend = R12m)
• Vanderbijlpark: Blast Furnace D stockhouse bag house (H1 spend = R15m)
– For H2 2014 the focus will be on:
• Newcastle: Blast Furnace reline (H2 = R734m), raw materials handling and sinter plant refurbishment (H2 = R80m), hot blast stoves
interim repairs (H2 = R47m) and reline window of opportunity projects
• Vanderbijlpark: Blast Furnace D stockhouse bag house (H2 = R8m), coke oven battery tightness project (H2 = R2m), waste gas channel
repair (H2 = R34m), plate mill wind farm project (H2 = R24m)
Capital expenditure (Rm)
www.arcelormittalsa.com Operating results
29
Blast furnace N5 rebuild at Newcastle Works
• Project commenced on 12 May 2014
– On target in terms of budget
• Safety - injuries to date: 72
• 2 400 people on site (50% of these are local)
• Overall programme is 64% complete (vs target of 83%)
– Non performance of contractors responsible for about 70% of delay
– Additional work created 25% of the delay
– Industrial action responsible for 5% of the delay
• Actions being implemented to minimise impact
– Reallocation of work packages, appointment of additional supervisors and additional contractors
– Additional billet imports
• Planned completion date is mid-October 2014
29
www.arcelormittalsa.com Operating results
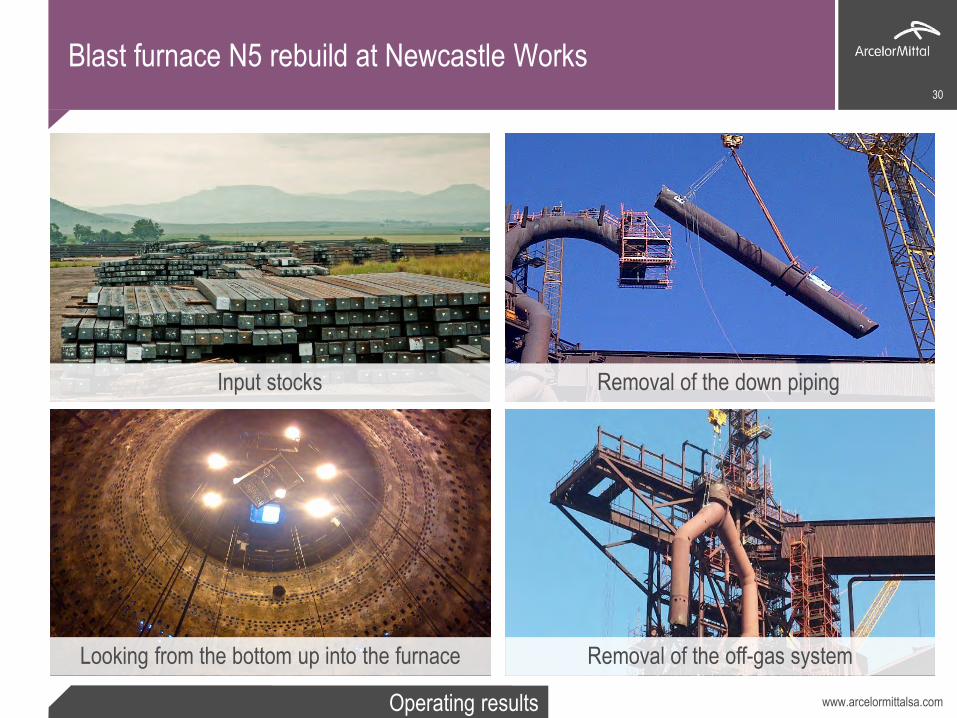
Blast furnace N5 rebuild at Newcastle Works 30
Input stocks
Rebar inventory ready for rolling to customer
specifications
Looking from the bottom up into the furnace
Removal of the down piping
Removal of the off-gas system
www.arcelormittalsa.com Operating results
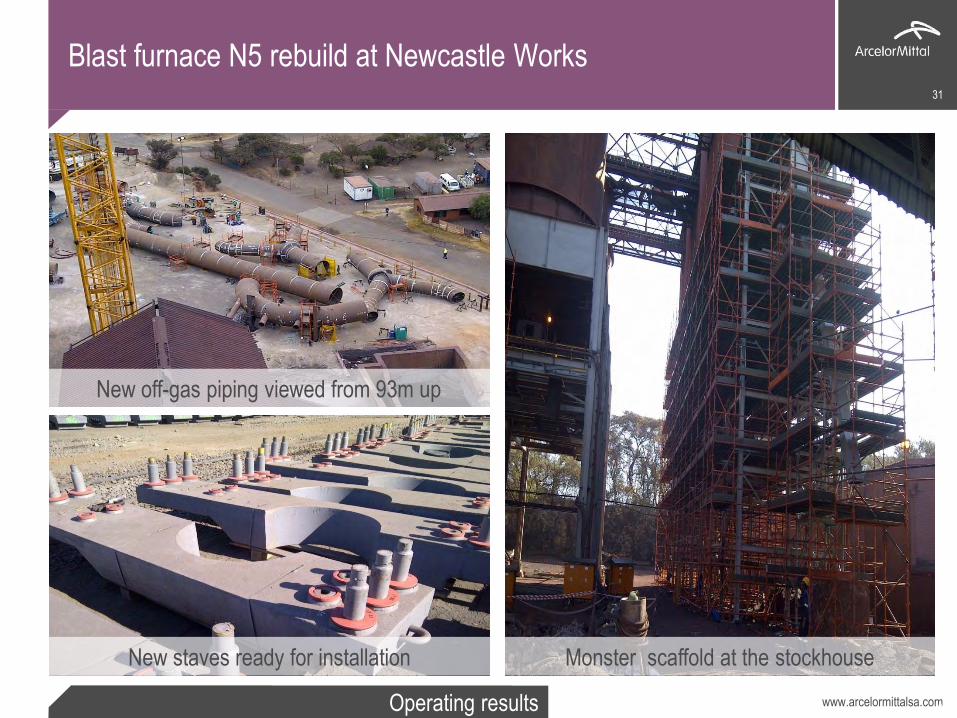
31
Blast furnace N5 rebuild at Newcastle Works
31
New off-gas piping viewed from 93m up
New staves ready for installation Monster scaffold at the stockhouse
www.arcelormittalsa.com Operating results
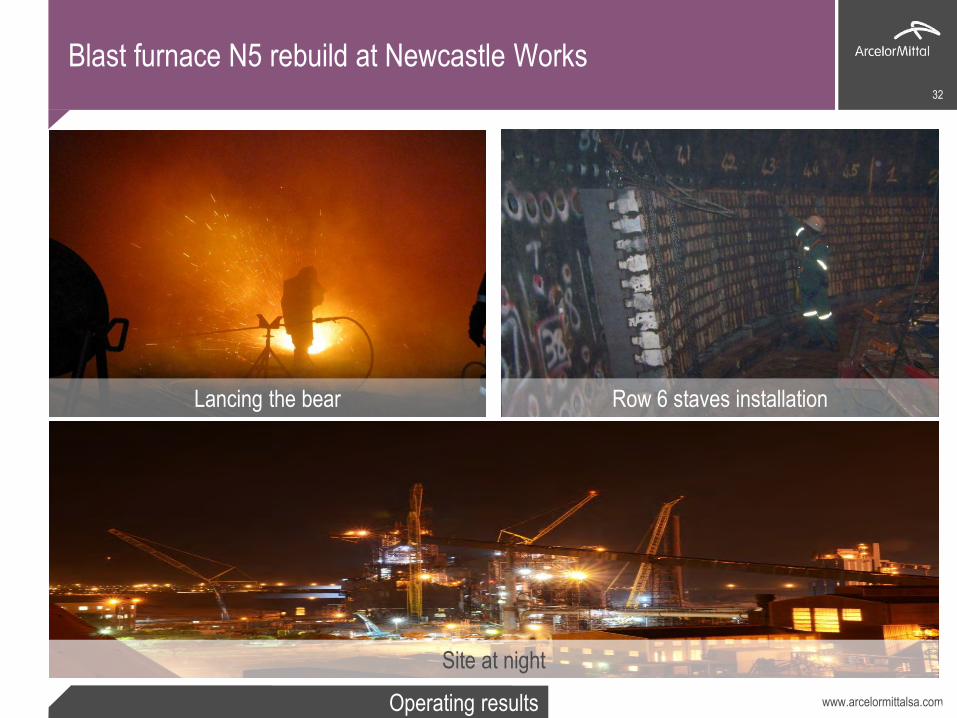
32
Blast furnace N5 rebuild at Newcastle Works
32
Removal of old hopper
New staves ready for installation
Arrival of a portion of the new cyclone Row 6 staves installation Lancing the bear
Site at night
www.arcelormittalsa.com 33
Other key issues and outlook Paul O’Flaherty, CEO
www.arcelormittalsa.com Other key issues
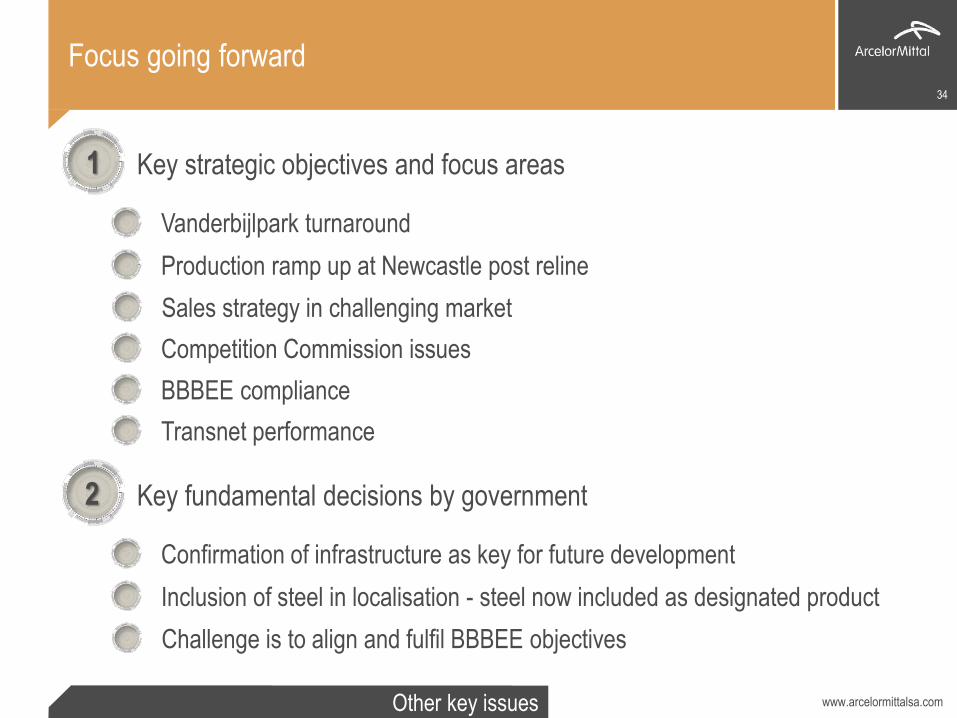
Focus going forward 34
1 Key strategic objectives and focus areas
Production ramp up at Newcastle post reline
Competition Commission issues
BBBEE compliance
Vanderbijlpark turnaround
Transnet performance
Sales strategy in challenging market
2 Key fundamental decisions by government
Inclusion of steel in localisation - steel now included as designated product
Confirmation of infrastructure as key for future development
Challenge is to align and fulfil BBBEE objectives
www.arcelormittalsa.com Other key issues
Outlook for 3Q 35
1 Outlook for Q3 2014
Electricity winter tariffs applicable this quarter
Domestic economy remain subdued
Seifsa strike a major concern
Reline in full swing for the quarter
Results expected to remain under pressure
www.arcelormittalsa.com
Financial results for the six months ended June 2014
36
Questions