Embed Size (px)
Citation preview
Copyright (C) 1995 GMO Payment Gateway, Inc. All Rights Reserved.
https://corp.gmo-pg.com/
Financial Results Briefing for Q1 FY2020
From Offline to Digital Data;
Sustainable Growth Through Expansion of Digital Transformation Platform
GMO Payment Gateway, Inc.
(3769; Tokyo Stock Exchange First Section)
February 13, 2020 The 60th IR Meeting

Copyright (C) 1995 GMO Payment Gateway, Inc. All Rights Reserved. 2
Safe Harbor Statement
The contents of this document are based on generally recognized economic and social conditions, as well as assumptions judged to be reasonable by GMO Payment Gateway as of February 13, 2020. Please note that the contents are subject to change without prior notice in the event of changes in the business environment or other unforeseen occurrences.
Copyright (C) 1995 GMO Payment Gateway, Inc. All Rights Reserved. 3
1. Summary of financial results for Q1 FY2020
2. Future initiatives and growth strategy
3. Financial highlights
Agenda

Copyright (C) 1995 GMO Payment Gateway, Inc. All Rights Reserved. 4
1. Summary of financial results for Q1 FY2020
Copyright (C) 1995 GMO Payment Gateway, Inc. All Rights Reserved. 5
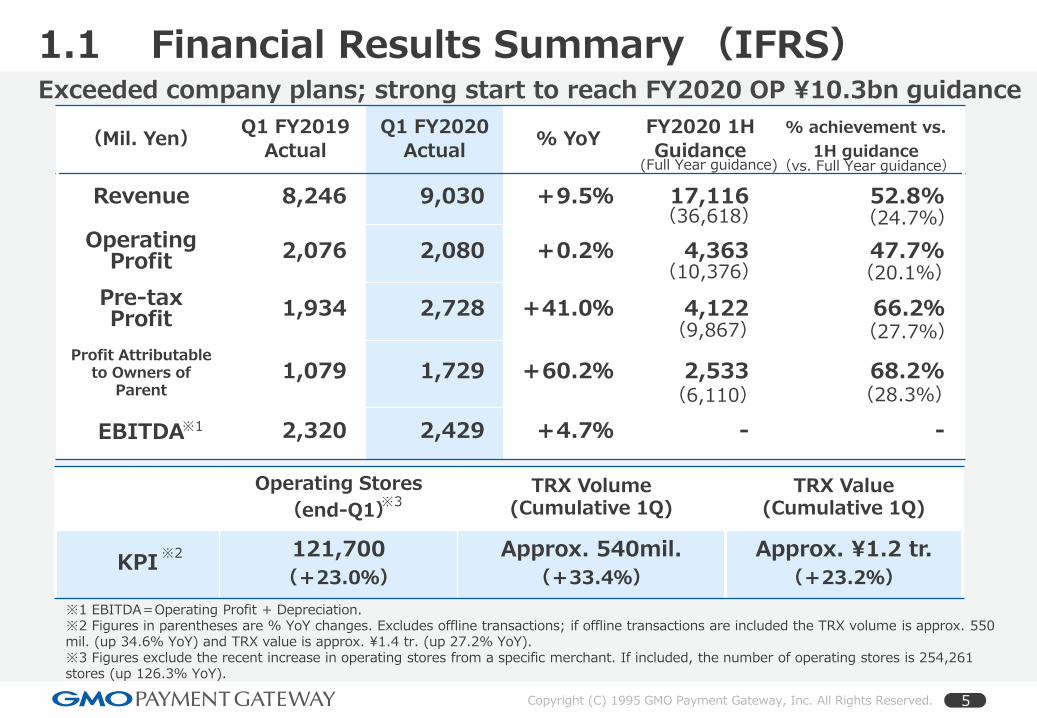
Exceeded company plans; strong start to reach FY2020 OP ¥10.3bn guidance
(Mil. Yen)Q1 FY2019
Actual
Q1 FY2020
Actual% YoY
FY2020 1H
Guidance
% achievement vs.
1H guidance
Revenue 8,246 9,030 +9.5% 17,116 52.8%
Operating Profit 2,076 2,080 +0.2% 4,363 47.7%
Pre-tax Profit 1,934 2,728 +41.0% 4,122 66.2%
Profit Attributable to Owners of
Parent1,079 1,729 +60.2% 2,533 68.2%
EBITDA 2,320 2,429 +4.7% - -
Operating Stores
(end-Q1)
TRX Volume (Cumulative 1Q)
TRX Value (Cumulative 1Q)
KPI121,700
(+23.0%)
Approx. 540mil.
(+33.4%)
Approx. ¥1.2 tr.
(+23.2%)
※1
※2
※1 EBITDA=Operating Profit + Depreciation.※2 Figures in parentheses are % YoY changes. Excludes offline transactions; if offline transactions are included the TRX volume is approx. 550 mil. (up 34.6% YoY) and TRX value is approx. ¥1.4 tr. (up 27.2% YoY).※3 Figures exclude the recent increase in operating stores from a specific merchant. If included, the number of operating stores is 254,261 stores (up 126.3% YoY).
※3
(36,618)
(10,376)
(6,110)
(24.7%)
(20.1%)
(28.3%)
(Full Year guidance)(vs. Full Year guidance)
(27.7%)(9,867)
1.1 Financial Results Summary (IFRS)

Copyright (C) 1995 GMO Payment Gateway, Inc. All Rights Reserved. 6
0
1000
2000
3000
4000
5000
6000
7000
8000
9000
Company plan
Consolidated Revenue
Online payment like-for-like
Consolidated revenue
+9.5%
PG like-for-like Online payment
Revenue +24.8%
1.2.1 1Q Revenue: Factors behind the 9.5% YoY growth
Exceeded company plans: PG like-for-like online payment revenues grew strongly at approx. 25% YoY
(Mil. Yen)
■ Consol. revenue & PG like-for-likeonline payment revenue
※
3 special factors affecting the growth rate:
① Contract cancellation of a large merchant in the previous Q2
② Contract termination of a merchant in the previous Q2
③ Change in contractual terms with a merchant this Q1
※ PG like-for-like online payment revenue = PG parent online payment revenue – sum of the revenues of the 3 special factors stated above.PG parent online payment revenue = GMO Payment Gateway’s parent-only online payment processing revenue (sum total of stock, fee and spread revenues)
Q1 FY12019 Q1 FY2020
・PG like-for-like online payment revenue: Up 24.8% YoY
・ Tackling this year’s issues: EP progressing ahead of plan,
MK progress on track
・Offline payment (GMO-FG & GCS): Up 58.7% YoY
・ Services to financial institutions: Up 66.6% YoY
・GMO Payment After Delivery (2 week term): Up 24.3%
<Positive factors>
<Negative factors>
Impact of consumption tax hike and cashless points rebates

Copyright (C) 1995 GMO Payment Gateway, Inc. All Rights Reserved. 7
・GP margin improvement atGMO-FG etc. +¥105mil.
・Increase in revenue etc.+¥500mil.
・Increase in provision for doubtful accounts +¥396mil.
・Increase in other expenses from HQ relocation +¥56mil.
1.2.2 Factors affecting profits: OP & Pretax profit
Higher SG&A due to increased provisioning; Pre-tax profit uplifted from higher equity method income■ OP waterfall chart
・2C2P turns a profit +¥54mil.・Gain on change in equity
of 2C2P +¥414mil.
・Increase in investment gains on inv. partnerships +¥223mil.
Q1 FY2019 Q1 FY2020 Q1 FY2019 Q1 FY2020
■ Pre-tax profit waterfall chart
SGA increase
+621
(Mil. Yen) (Mil. Yen)
GP increase
+605
Other revenue
-6
Other expenses
+26
OP increase
+4
Financial income+265
Financial expense
-53
Equity method income +470
2,076 2,080
1,934
2,728
Copyright (C) 1995 GMO Payment Gateway, Inc. All Rights Reserved. 8
2,014
2,1021,494
1,566
0
1,000
2,000
3,000
4,000
5,000
6,000
7,000
8,000
9,000
10,000
Payment Processing Business Money Service Business Payment Enhancement Business
2,428
2,502
645
336
-77
-26
(200)
300
800
1,300
1,800
2,300
2,800
3,300
+ Strong trend of GMO Payment after Delivery (2 week term)
- Decline in Remittance and Early Payment services- Change in provision rate
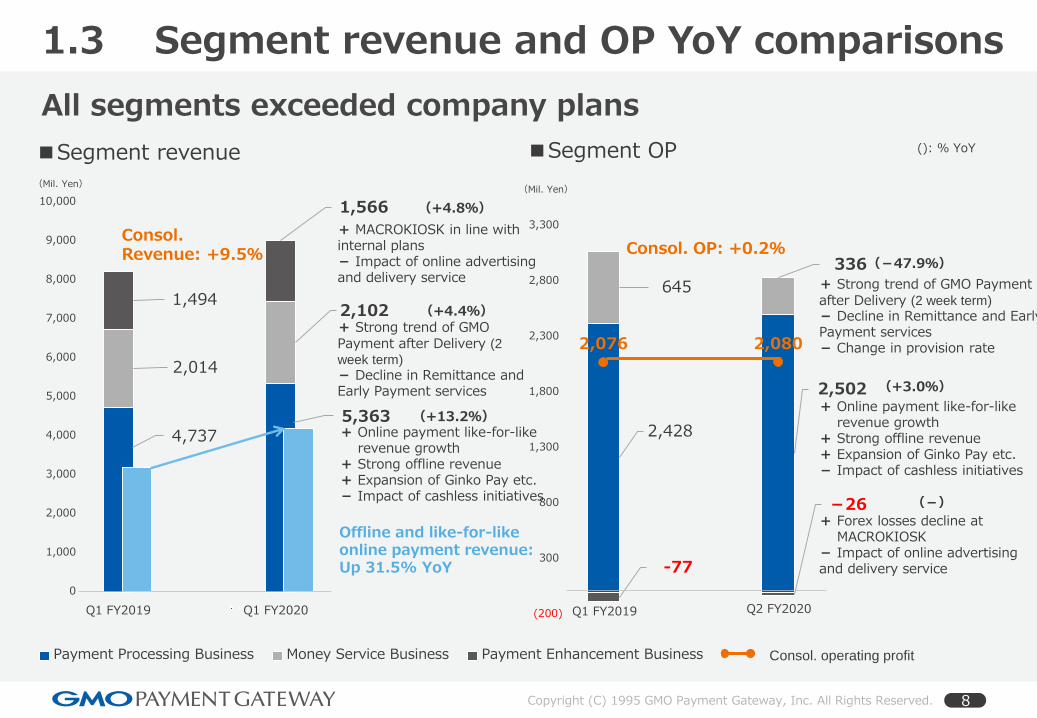
1.3 Segment revenue and OP YoY comparisons
All segments exceeded company plans
■Segment OP■Segment revenue
(+13.2%)
(+4.4%)
(+4.8%)
(-47.9%)
(-)
(+3.0%)
+ Online payment like-for-likerevenue growth
+ Strong offline revenue+ Expansion of Ginko Pay etc.- Impact of cashless initiatives
+ Strong trend of GMO Payment after Delivery (2
week term)
- Decline in Remittance and Early Payment services
+ MACROKIOSK in line with internal plans- Impact of online advertising and delivery service
Consol. OP: +0.2%
+ Online payment like-for-likerevenue growth
+ Strong offline revenue+ Expansion of Ginko Pay etc.- Impact of cashless initiatives
Q1 FY2019 Q2 FY2020Q1 FY2019 Q1 FY2020
+ Forex losses decline atMACROKIOSK
- Impact of online advertising and delivery service
(Mil. Yen)(Mil. Yen)
Consol. operating profit
2,076 2,080
4,7375,363
Consol. Revenue: +9.5%
Offline and like-for-like online payment revenue: Up 31.5% YoY
(): % YoY

Copyright (C) 1995 GMO Payment Gateway, Inc. All Rights Reserved. 9
1.4 ConclusionsQ1 results exceeded company plans; return to growth trajectory by executing on the priority initiatives
1. Q1 beat company plans, progressing ahead of plans
2. Steady progress in the executing on the priority initiatives
3. Benefits are emerging from addressing the 4 issues of this year
4. Achieve OP ¥10.3bn; return topline to growth trajectory next FY
Online: steady progress in acquiring new merchants, business expansion with existing merchantsOffline: expanding cashless payments, making inroads into Unattended Market (UM)
TRX Volume +33.4%, TRX Value +23.2%Consol. revenue, segment revenue and all profit lines achieved Q1 targetsFavorable business conditions in infrastructure & utility
Takeaways
Numerics

Copyright (C) 1995 GMO Payment Gateway, Inc. All Rights Reserved. 10
Current Q1 Revenue
+9.5%
0
1,000
2,000
3,000
4,000
5,000
6,000
7,000
8,000
9,000
Oct-Dec
2017
Jan-Mar
2018
Apr-Jun
2018
Jul-Sep
2018
Oct-Dec
2018
Jan-Mar
2019
Apr-Jun
2019
Jul-Sep
2019
Oct-Dec
2019
Revenue Operating Profit
(Reference) Growth trend of revenue and OPQ1 returns to baseline growth rate after the impact of spike in growth in the previous Q1
(Mil. Yen)
Previous Q1
OP +30.2%
Current Q1
OP +0.2%
■ Quarterly trend of revenue and operating profit (%: YoY change)
Baseline growthPrevious Q1 Revenue
+35.2%

Copyright (C) 1995 GMO Payment Gateway, Inc. All Rights Reserved. 11
2. Future initiatives and growth strategy

Copyright (C) 1995 GMO Payment Gateway, Inc. All Rights Reserved. 12
2.1 Management targets and requisitesAchieve OP milestone of ¥25bn by continually realizing multi-billion-yen scale business projects
Management Requisite
Continually realize multi-billion yen businesses
2. Offline payment (IoT)
3. FinTech
6. Global business
5. B2B Payment business
1. Industry-specific DX platform
OP(Mgmt Target)
20302020
¥10.3bn ¥100.0bn
2025
¥25.0bn
EC logistics
Data volume
■ 10-year growth of data & delivery parcels (estimate)
2.5 x
1,000x ?
+¥15.0bn
Migration to 5G likely to lead to
surge in data traffic/volume
※ Digital Transformation (DX): To reform the business model, services and products of companies in response to customer and social needs by leveraging data and digital technology and thereby adapt to the drastic business changes underway. In addition, reform the work process, corporate organization, processes and protocols as well as corporate culture itself, in order to maintain or enhance competitive advantage.Translated from the Japanese excerpt of Ministry of Economy, Trade and, Industry’s, “Guidelines for Promotion of Digital Transformations (DX Promotion Guidelines).”
※
Finance TelcoUtility Logistic
Priority Initiatives
4. Global major players

Copyright (C) 1995 GMO Payment Gateway, Inc. All Rights Reserved. 13
2.2 Progress of priority initiativesInitiatives to generate incremental ¥15bn OP to begin contribution from latter part of the year
■ Progress of priority initiatives post-2020 and expected timing of contribution to P/L
※SMCC refers to Sumitomo Mitsui Card Company, Limited, Visa refers to Visa Worldwide (Japan) Co. Ltd., and Infomart refers to Infomart Corporation, SMBC refers to Sumitomo Mitsui Banking Corporation, Toyota collectively refers to the three companies of Toyota Motor Corporation, Toyota Financial Service Corporation and Toyota Finance Corporation.
2020 2021 2025
Existing business (payment, lending) expanding steadilyIncremental growth from new businesses and M&A.
Current
First project to go live this Autumn
Estimated service launchPrio
rityIn
itiativ
es
1H 2H
4. Global major players
5. B2B payment business
2. Offline payment (IoT)
3. FinTech
1. DX platform
Financial
Telco
Utility
Logistic
6. Global business
Issuing/AcquiringExpansion of Ginko Pay
Several projects in the pipeline
Preparing to launch B2B payment service
Start B2B factoring with Infomart Expanding service to new areas
Capturing the Unattended Market
stera(SMCC・Visa)Ginko Pay
Issuing/Acquiring
New network buildout jointly with SMCC and Visa

Copyright (C) 1995 GMO Payment Gateway, Inc. All Rights Reserved. 14
2020 列2 2025
Merchandise EC Non-merchandise EC
2.3.1 DX Platform
Achieve ¥18bn OP by 2025 from the broader EC domain by expanding into non-EC areas
※2 TRX value for the Multi-Payment service of GMO Payment Gateway Inc.
■ TRX value: breakdown of merchandise and non-merchandise EC
Merchandise ECApprox. 20% CAGR
Non-merchandise EC approx. 40% CAGR
Industry-specific DX platform
■OP potential from broader EC
<DX Platform strategy>
Acquire large and high-growth merchants
■Growth strategy
Expand non-merchandise EC businesses
① Construct industry-specific DX platforms
② Target new industries created and/or seeing growth acceleration from 5G
2020(Plan)
2025
×1.2
¥18.0bn+
Approx. ¥8.3bn
※1 Excludes the financial industry DX platform
5
・Financial ・Utility
・Telco ・Logistic etc.
※1
※2(Incl. DX platform)
Copyright (C) 1995 GMO Payment Gateway, Inc. All Rights Reserved. 15
Ginko Pay Issuing/Acquiring Other
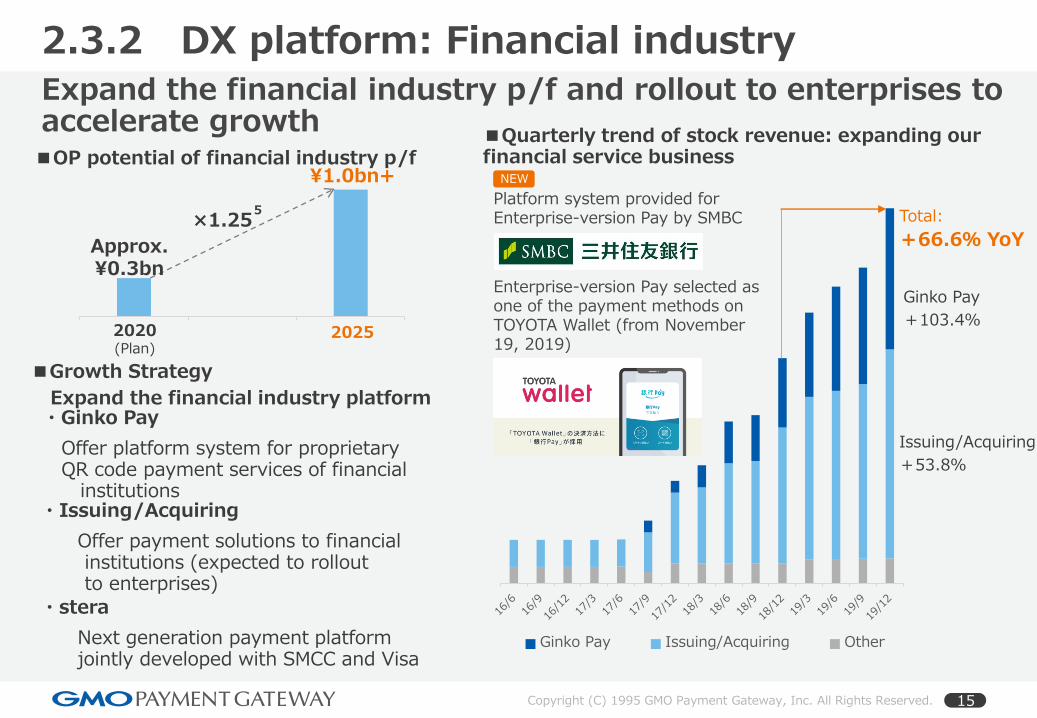
2.3.2 DX platform: Financial industryExpand the financial industry p/f and rollout to enterprises to accelerate growth
Total:
+66.6% YoY
■Quarterly trend of stock revenue: expanding our financial service business
Ginko Pay
+103.4%
Issuing/Acquiring
+53.8%
■OP potential of financial industry p/f
2020 列2 20252025
×1.25
¥1.0bn+
Approx. ¥0.3bn
5
Expand the financial industry platform
■Growth Strategy
・Ginko Pay
Offer platform system for proprietary QR code payment services of financial
institutions
・stera
Next generation payment platformjointly developed with SMCC and Visa
・Issuing/Acquiring
Offer payment solutions to financialinstitutions (expected to rollout to enterprises)
Platform system provided for Enterprise-version Pay by SMBC
Enterprise-version Pay selected as one of the payment methods on TOYOTA Wallet (from November 19, 2019)
2020(Plan)
NEW

Copyright (C) 1995 GMO Payment Gateway, Inc. All Rights Reserved. 16
2.4 Offline Payment (IoT)Realize high growth in the huge offline payment market through stera and capturing the Unattended Market
■Quarterly trend of Initial revenuefrom Offline market
0
100
200
300
400
500
600
17/12 18/3 18/6 18/9 18/12 19/3 19/6 19/9 19/12
(Mil. Yen)
+102.9%YoY
Reinforcing sales to the Unattended Market
stera(SMCC・Visa)
Replace existing network and buildout the new
network scheme with SMCC and Visa
■Growth Strategy
Office Pay®by GMO, making payments using company ID, launched from December 20, 2019.
■ OP potential of offline payment (IoT)
2020 列2 20252020(Plan)
2025
×1.4
¥2.0bn +
Approx. ¥0.4bn
5
¥1.826 tr.
Ticket Vending Machine Fare Adjustment/Auto Pay
Market size:
¥1 tr.
Market size:
NEW

Copyright (C) 1995 GMO Payment Gateway, Inc. All Rights Reserved. 17
End-Dec 2017 End-Dec 2019
GMO Payment
After DeliveryOverseas Lending
B2B Factoring
2.5 FinTech: Expanding high-margin services
Expand high margin services and further raise the capital efficiency
※ Those financial services offered by GMO-PG consolidated subsidiaries where the ROIC exceeds the WACC.
ROIC = Annual estimated NOPAT ÷ Monthly average BS asset balance
Up 106.7% vs End-Dec 2017
Expand the high-margin services
■Growth Strategy■Monthly trend of Infomart B2B Factoring
inquiries (cumulative)
19/9 19/10 19/11 19/12
Target
Actual
■OP potential of FinTech
2020 列2 20252020(Plan)
2025
×1.2
¥3.0bn+
Approx. ¥1.3bn
5
・GMO Payment After Delivery
・Overseas Lending
・B2B Factoring
Support cash needs by early cash conversionof invoice (accounts receivable)
Tentative orders of over 3-mnths of new acquisition targetNEW
Launched Electronic Invoice Early Payment together with Infomart (from January 30, 2020)
※■Asset balance of high-margin services

Copyright (C) 1995 GMO Payment Gateway, Inc. All Rights Reserved. 18
2.6 Global BusinessFinancial results of investees are strong especially at 2C2P; accelerating growth of payment processing and lending
US
Taiwan
Thailand
Singapore
Malaysia
Indonesia
Japan
India
Hong Kong
Vietnam
Philippines
2019/1Q 2020/1Q
+21.1%YoY
Payment processingrevenue growth
2019/1Q 2020/1Q
■ Investments and Borrowers of GMO-PG and GMO Global Payment Fund; Revenue trend by service
Positive profit
└Strong growth in EM;Revenue up 3x
└Profitable; Appraisal value up 8-fold
└TRX value expandsRevenue up approx. 2x
└Merchants increasingEst. full year positive profit
└GMV expanding
└Strong lendingTurned profitableon a monthly base
└Revenue 4x
Borrower
Standout investee
2019/1Q 2020/1Q
+26.6%YoY
Lending revenue growth
Full year revenue: Up 57.3% YoY
※
※ Based on Jan. to Dec. 2019 cumulative revenue of 2C2P.
<Reference>
Newly established
Newly established
└Repayment completed
└Revenue growth approx. 8% in line with plans
Investment gains/losses
from equity method affiliate
2C2P (YoY basis)

Copyright (C) 1995 GMO Payment Gateway, Inc. All Rights Reserved. 19
3. Financial Highlights

Copyright (C) 1995 GMO Payment Gateway, Inc. All Rights Reserved. 20
3.1 Balance Sheet Changes
7,965 7,275 8,245
43,674 53,530
65,449
23,185
27,171
33,070 42,033
52,013
65,139
0
20,000
40,000
60,000
80,000
100,000
120,000
140,000
160,000
End-Sep 2018 End-Sep 2019 End-Dec 2019
Assets
Investment Related MSB Related Other Cash&Equivalents
116,858
139,990
171,904
※1 Securities classified under Investment Securities and Equity-Method Affiliates※2 MSB Related Asset = Lease assets, Short term loans, Advance payment, Accrued revenue (net of provision for doubtful accounts)
MSB Related Liabilities = Accrued expenses※3 Deposits received from merchants under the Representative Contract. ※4 Some figures are shown in net amounts of financial assets and liabilities.
(Mil. Yen)
26,020 27,539 26,767
14,732 15,123 20,551 6,300
17,199 16,999 16,676
16,745 16,762 14,327
16,630
28,140 38,800
46,752
62,683
0
20,000
40,000
60,000
80,000
100,000
120,000
140,000
160,000
End-Sep 2018 End-Sep 2019 End-Dec 2019
Liabilities and Equity
Equty MSB Related Borrowings
Bonds Other Merchant Deposits
116,858
139,990
171,904
(Mil. Yen)
※2※1※3
Provision for Doubtful Accounts-2,343
Provision for Doubtful Accounts-1,968
Provision for Doubtful Accounts-2,003
※2
Includes deposits received from few merchants due to New Year holiday
Increase in deposits received and MSB-related assets

Copyright (C) 1995 GMO Payment Gateway, Inc. All Rights Reserved. 21
Domestic Lending Early Payment GMO Payment After Delivery Remittance B2B Factoring Finance Lease
3.2 FinTech:Assets and profit growthSteady growth of high-margin services; YoY decline from reversals of provisions booked in the previous year
■ MSB related assets ■Segment revenue
End-Dec 2018 End-Dec 2019
+19.9% +3.5%
+26.6%
+6.6%
-14.3%
-13.3%
-38.0%
+21.6%
+28.1%
+18.8%
-46.2%
-47.9%
■Segment OP
Q1 FY2019 Q1 FY2020Q1 FY2019 Q1 FY2020
※ Figures are net of GMO Payment After Delivery assets (accrued revenue) and provision of doubtful accounts.
(%: YoY change)
+846.1%+967.8%
Impact from change in provision for doubtful accounts

Copyright (C) 1995 GMO Payment Gateway, Inc. All Rights Reserved. 22
3.3.1 Revenue by business model
Spread
Fee
Stock
Initial
+4.8% YoY
+5.1% YoY
+15.0% YoY
+ 69.3% YoY393 666
1,184
1,362
3,072
3,230
3,595
3,770
0
1,000
2,000
3,000
4,000
5,000
6,000
7,000
8,000
9,000
Q1 FY2019 Q1 FY2020
Initial Stock Fee Spread
(+)Strong online payment excl. one-offs(+)Growth of GMO Payment After Delivery
(2 week term)(-)Impact of cashless initiatives (point rebate)
(+)Strong terminal sales in offline market
(+)Robust trend of banking business
(+)Strong online payment excl. one-offs(+)Strong offline payment(+)MACROKIOSK trending in line with plans(-)Decline of remittance service
(Mil. Yen)
Copyright (C) 1995 GMO Payment Gateway, Inc. All Rights Reserved. 23
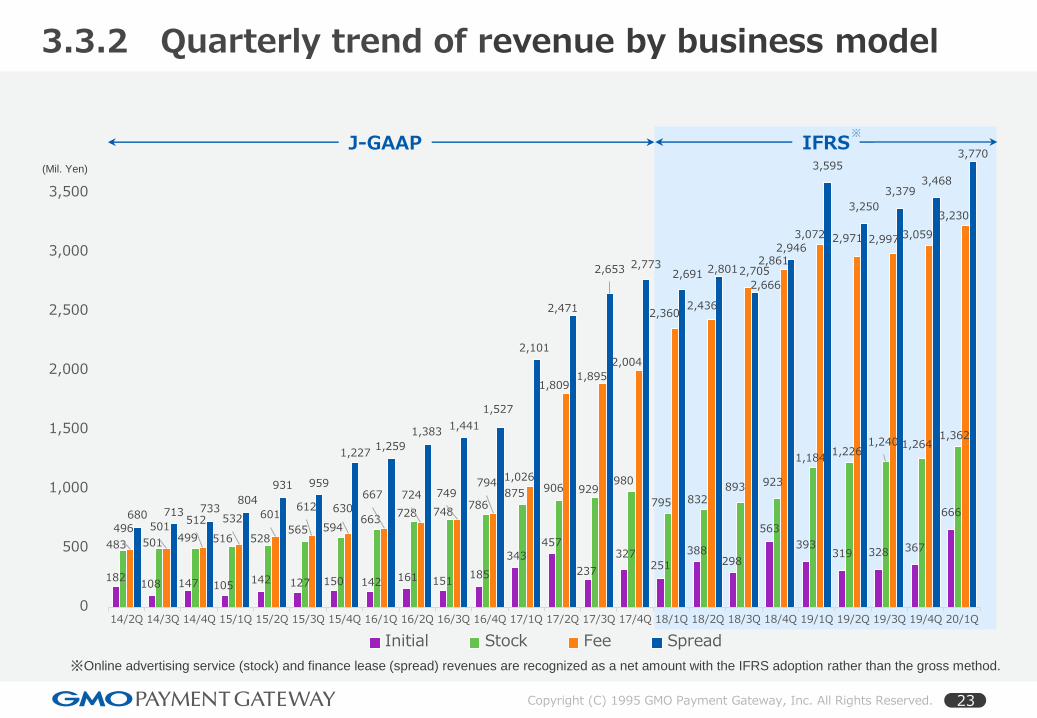
3.3.2 Quarterly trend of revenue by business model
182 108 147 105
142 127 150 142 161 151 185
343
457
237
327 251
388 298
563
393 319 328 367
666
483 501 499 516 528 565 594
663 728 748
786 875 906 929
980
795 832 893 923
1,184 1,226
1,240 1,264 1,362
496 501 512 532 601
612 630
667 724 749 794
1,026
1,809 1,895
2,004
2,360 2,436
2,705 2,861
3,072 2,971 2,997 3,059
3,230
680 713 733 804
931 959
1,227 1,259
1,383 1,441
1,527
2,101
2,471
2,653 2,773 2,691 2,801
2,666
2,946
3,595
3,250
3,379 3,468
3,770
0
500
1,000
1,500
2,000
2,500
3,000
3,500
14/2Q 14/3Q 14/4Q 15/1Q 15/2Q 15/3Q 15/4Q 16/1Q 16/2Q 16/3Q 16/4Q 17/1Q 17/2Q 17/3Q 17/4Q 18/1Q 18/2Q 18/3Q 18/4Q 19/1Q 19/2Q 19/3Q 19/4Q 20/1Q
Initial Stock Fee Spread
(Mil. Yen)
※Online advertising service (stock) and finance lease (spread) revenues are recognized as a net amount with the IFRS adoption rather than the gross method.
J-GAAP IFRS※

Copyright (C) 1995 GMO Payment Gateway, Inc. All Rights Reserved. 24
3.3.3 Revenue trend by business model (annual)
0
2,000
4,000
6,000
8,000
10,000
12,000
14,000
16,000
18,000
20,000
22,000
24,000
26,000
28,000
30,000
32,000
34,000
36,000
38,000
40,000
2004/9 2005/9 2006/9 2007/9 2008/9 2009/9 2010/9 2011/9 2012/9 2013/9 2014/9 2015/9 2016/9 2017/9 2018/9 2019/9 2020/9E
TSE Listing
Initial
Stock
Fee
Spread
J-GAAP IFRS(Mil. Yen)

Copyright (C) 1995 GMO Payment Gateway, Inc. All Rights Reserved. 25
3.4.1 Quarterly trend of CoS and SGA ratio
2,998 3,0903,294
4,347
5,645 5,716
6,086 6,0986,459
6,563
7,295
8,246
7,7697,945
8,160
9,030
683 700 772
1,109
1,813 1,823 1,9402,035 2,143
2,3202,581
3,004 2,807 2,818 2,986
3,181
1,307 1,316
1,655
2,036
2,497 2,491
3,067
2,494 2,595 2,382
2,997 3,098 2,791 2,6462,664
3,72022.8% 22.6%23.4%
25.5%
32.1%
31.9% 31.9%33.4%
33.2%35.3% 35.4% 36.4% 36.1%
35.5%36.6%
35.20%
43.6%
42.6%
50.3%
46.8%
44.2%
43.6%
50.4%
40.9%40.2%
36.3%
41.1%
37.6%35.9%
33.3% 32.7%
41.20%
0.0%
10.0%
20.0%
30.0%
40.0%
50.0%
0
1,000
2,000
3,000
4,000
5,000
6,000
7,000
8,000
9,000
16/3(2Q) 16/6(3Q) 16/9(4Q) 16/12(1Q) 17/3(2Q) 17/6(3Q) 17/9(4Q) 17/12(1Q) 18/3(2Q) 18/6(3Q) 18/9(4Q) 18/12(1Q) 19/3(2Q) 19/6(3Q) 19/9(4Q) 19/12(1Q)
revenue Cost of Sales SG&A CoS ratio SG&A ratio
※39.8%
※37.4%
※44.5%
※41.7%
※40.3%
※39.9%
※47.2%
(Mil. Yen)
J-GAAP IFRS
CoS ratio fluctuates with changes in revenue mix
*Figures with asterisk exclude outsourcing expense related to MSB.
These outsourcing expenses are not booked in SG&A from December 2017 (Q1) due to IFRS adoption.
Copyright (C) 1995 GMO Payment Gateway, Inc. All Rights Reserved. 26
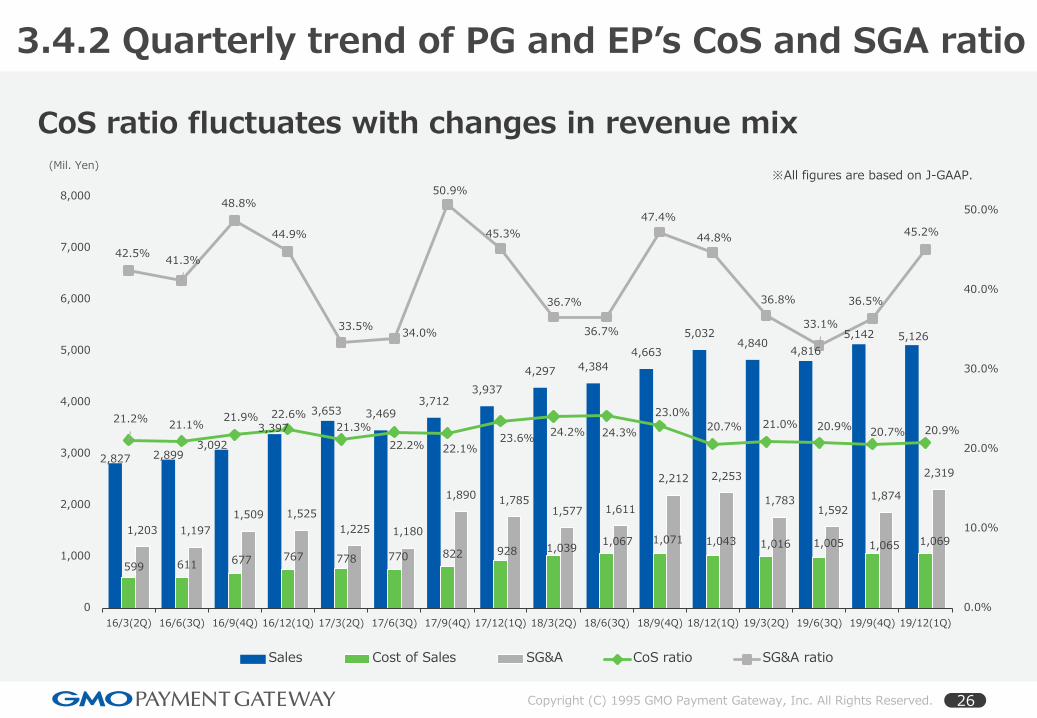
3.4.2 Quarterly trend of PG and EP’s CoS and SGA ratio
2,827 2,8993,092
3,397
3,653 3,4693,712
3,937
4,297 4,384
4,663
5,0324,840
4,816
5,142 5,126
599 611 677 767 778 770 822 928 1,0391,067 1,071 1,043 1,016 1,005 1,065 1,069
1,203 1,197
1,509 1,525
1,225 1,180
1,8901,785
1,577 1,611
2,212 2,253
1,7831,592
1,874
2,319
21.2%21.1%
21.9% 22.6%21.3%
22.2% 22.1%23.6%
24.2% 24.3%
23.0%
20.7% 21.0% 20.9%20.7% 20.9%
42.5%41.3%
48.8%
44.9%
33.5%34.0%
50.9%
45.3%
36.7%
36.7%
47.4%
44.8%
36.8%
33.1%
36.5%
45.2%
0.0%
10.0%
20.0%
30.0%
40.0%
50.0%
0
1,000
2,000
3,000
4,000
5,000
6,000
7,000
8,000
16/3(2Q) 16/6(3Q) 16/9(4Q) 16/12(1Q) 17/3(2Q) 17/6(3Q) 17/9(4Q) 17/12(1Q) 18/3(2Q) 18/6(3Q) 18/9(4Q) 18/12(1Q) 19/3(2Q) 19/6(3Q) 19/9(4Q) 19/12(1Q)
Sales Cost of Sales SG&A CoS ratio SG&A ratio
(Mil. Yen)※All figures are based on J-GAAP.
CoS ratio fluctuates with changes in revenue mix

Copyright (C) 1995 GMO Payment Gateway, Inc. All Rights Reserved. 27
-10,000
-8,000
-6,000
-4,000
-2,000
0
2,000
4,000
6,000
8,000
10,000
12,000
14,000
16,000
18,000
20,000
FY2014 FY2015 FY2016 FY2017 FY2018 FY2019 Q1
FY2020
Operating CF Investing CF Financing CF FCF
3.5 Consolidated CF Statement
Operating CF: +¥16,985
Investing CF: -¥963
Financing CF: -¥2,952
Pretax profit +¥2,728Chgs in rcvbls +¥448Advances paid -¥6,690Accrued income -¥5,591Chgs in payables +¥577Accrued expenses +¥5,401Deposits received +¥21,947
Acg. of intangibles -¥398Acg. of inv. securities -¥356
LT debt repayment -¥200Dividend payout -¥2,634
FCF: +¥16,021
■Q1 FY2020 changes
Cash & Equivalents: ¥65,139
(Mil. Yen)J-GAAP IFRS
※1 Includes deposits received from few merchants due to New Year holiday.※2 FCF is calculated as Operating CF less Investing CF. Only major items of the cash flow statement are shown on this page.
※1
※2
(Mil. Yen)

Copyright (C) 1995 GMO Payment Gateway, Inc. All Rights Reserved. 28
3.6 Major Quarterly KPIs
0
10,000
20,000
30,000
40,000
50,000
0
20,000
40,000
60,000
80,000
100,000
120,000
Recurring billing TRX volume Pay-as-you-go billing TRX volume Actual operating stores TRX Value
※1 Operating stores are measured on an end-of-quarter basis. TRX value and volume are the total for the respective quarter.
(10K cases)(Stores)
(Billion yen)
8,000
5,000
4,000
10,000
9,000
7,000
6,000
11,000
※2 Figure excludes a significant increase in operating stores from a specific merchant. If included, operating stores would be 254,261 outlets by end-Dec 2019 (up 126.3% YoY).
※2
※1
12,000
Proportion of spread revenue ≒50%
※Annual average basis (revised in 5% increments)
Group-wide annual TRX value reaches ¥4.9 trillionOperating stores: 121,700 stores, TRX volume 540 mil., TRX value approx. ¥1.2 trillion.
(Reference)Consolidated TRX value: Approx. ¥4.9 trillion
TRX value excl. GMO-FG: Approx. ¥4.5 trillion13,000

Thank You Very Much
GMO Payment Gateway, Inc. (3769; Tokyo Stock Exchange, Section 1)
For inquiries please contact our IR team at the telephone number below:
URL: https://corp.gmo-pg.com/en/ir/
Corporate Value Creation Strategy Division (IR Department) TEL: +81-3-3464-0182