Embed Size (px)
Citation preview
Quarter ended 31 March 2011
Financial Results & Business Update
3 3 3
Disclaimer
Any remarks that we may make about future expectations, plans and prospects for
the company constitute forward-looking statements. Actual results may differ
materially from those indicated by these forward-looking statements as a result of
various factors. In particular, the forward-looking financial information provided by the
company in this conference call represents the company’s estimates as of 19 April
2011. We anticipate that subsequent events and developments will cause the
company’s estimates to change. However, while the company may elect to update
this forward-looking financial information at some point in the future, the company
specifically disclaims any obligation to do so. This forward-looking information should
not be relied upon as representing the company’s estimates of its future financial
performance as of any date subsequent to 19 April 2011.
4 4 4
Agenda
Introduction | Sarah Bowman | Investor Relations
Strategy and Business update | Andreas Andreades | CEO
Financial update | David Arnott | CFO
Acquisition Update | Max Chuard | Director, M&A and IR
Outlook and Summary | Andreas Andreades | CEO
1
2
3
4
5
Q & A 6
5 5 5
Agenda
Introduction | Sarah Bowman | Investor Relations
Strategy and Business update | Andreas Andreades | CEO
Financial update | David Arnott | CFO
Acquisition Update | Max Chuard | Director, M&A and IR
Outlook and Summary | Andreas Andreades | CEO
1
2
3
4
5
Q & A 6
6 6 6
Business update
• Continuing to gain market share → Top of the IBS League table again for 2010 - confirms significant market share
gains
→ Forrester also ranks Temenos as best selling vendor, one of two “power”
vendors in the market
• Continuing to broaden our partner sales and delivery network → Now launching the first Europe-wide ASP offering to widen the addressable
market for T24 in partnership with Wipro
• Reconfirm outlook → T24 to grow 19%-24% in the year
→ Pipeline, visibility and market development continue to support our full-year
licence outlook
Highlights
7 7 7
Update on Q1 sales
Growth drivers
• Licence revenue → 6% Like for like licence growth, ahead of reported – V-bank
contribution lower
→ Lower contribution from sales to MEA: 6% vs. 12% in Q1 2010
→ Middle East tensions and Japan disaster slow down but do not stop
decision making
→ Pipeline supports full year outlook and continues to be at record levels
→ Wipro partnership gives us increased visibility
• Product extensions → Demand for new products strong
→ Now comprise 16% of Q1 total licence revenues
• Odyssey integration proceeding well → No. 1 vendor in fast-growing market segment
→ Complete front-to-back product portfolio
→ PWM expectations ahead of business plan
8 8 8
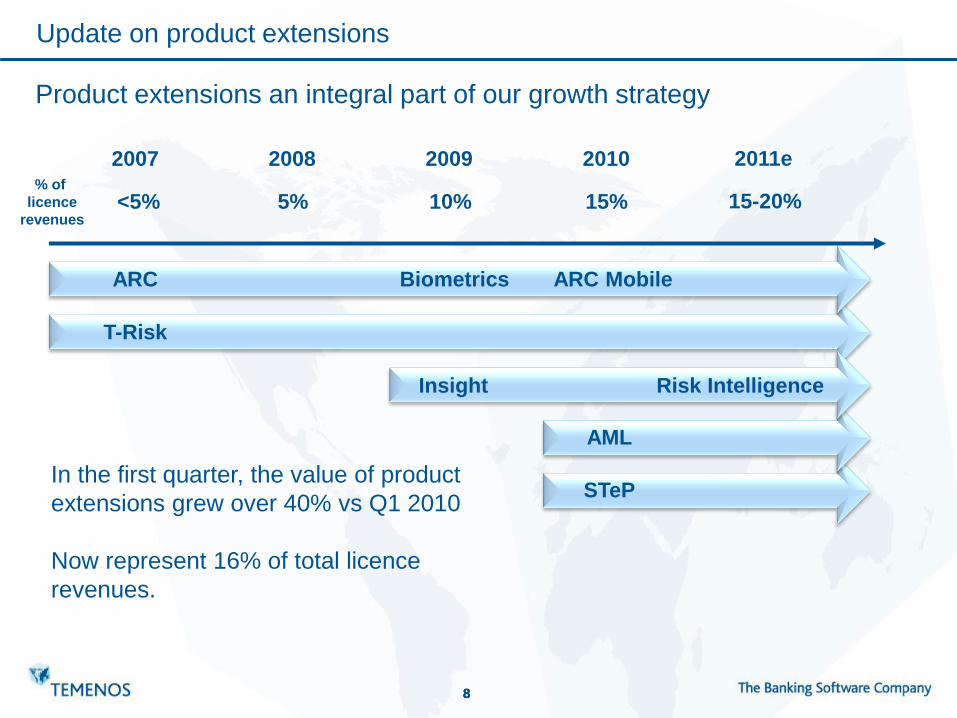
Product extensions an integral part of our growth strategy
ARC
T-Risk
AML
STeP
ARC Mobile Biometrics
2007 2008 2009 2010
<5% % of
licence
revenues 5% 10% 15%
Insight
2011e
Risk Intelligence
Update on product extensions
In the first quarter, the value of product
extensions grew over 40% vs Q1 2010
Now represent 16% of total licence
revenues.
15-20%
9 9 9
Wipro partnership and ASP model
• Signed exclusive agreement with Wipro to deliver T24 on ASP model
to small European banks → Initial reseller agreement projected to bring a minimum of USD 15m in
licence revenues over the next 2 years
→ Significant increase to licence revenue visibility on committed revenue
flow to Temenos
→ Temenos maintains traditional ILF business model
→ Model may be replicated in other regional markets
• ASP model delivers proven benefits to small/mid size banks → ASP provides lowest upfront investment and low TCO for smaller
banks/new entrants
→ Circa 8,000 banks in Europe with average assets of less than 3bn –
addressed through this new offering
→ Market studies show increased demand for ASP model in Europe
→ We also see substantial demand at sales level
10 10 10
Services and partner update
• Transition to new business model → Partners continue to invest and take a greater load of service business
→ Refocusing services organisation towards offering high level product related
services, training and governance
→ This meant we had to reduce our headcount, taking a restructuring charge of
USD 5.7m in Q1 2011
• 2011 a transition year for services business → We believe the transitional model still requires more Temenos support
→ We continue to rebalance skills towards our target operating model
→ We are at the point that we have the right capacity for growth, even if this
means that we are going to have a break even services business for 2011
• Mid-term projections unchanged → Services to comprise 25-30% of revenues
→ 10-15% operating margins
11 11 11
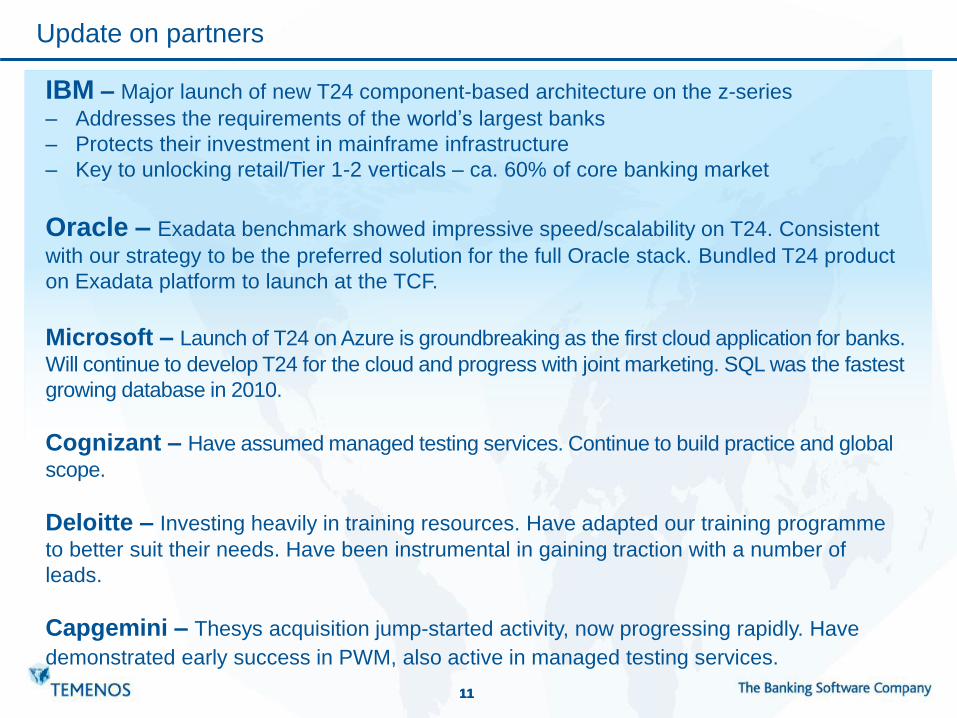
Update on partners
IBM – Major launch of new T24 component-based architecture on the z-series
‒ Addresses the requirements of the world’s largest banks
‒ Protects their investment in mainframe infrastructure
‒ Key to unlocking retail/Tier 1-2 verticals – ca. 60% of core banking market
Oracle – Exadata benchmark showed impressive speed/scalability on T24. Consistent
with our strategy to be the preferred solution for the full Oracle stack. Bundled T24 product
on Exadata platform to launch at the TCF.
Microsoft – Launch of T24 on Azure is groundbreaking as the first cloud application for banks.
Will continue to develop T24 for the cloud and progress with joint marketing. SQL was the fastest
growing database in 2010.
Cognizant – Have assumed managed testing services. Continue to build practice and global
scope.
Deloitte – Investing heavily in training resources. Have adapted our training programme
to better suit their needs. Have been instrumental in gaining traction with a number of
leads.
Capgemini – Thesys acquisition jump-started activity, now progressing rapidly. Have
demonstrated early success in PWM, also active in managed testing services.
12 12 12
Agenda
Introduction | Sarah Bowman | Investor Relations
Strategy and Business update | Andreas Andreades | CEO
Acquisition Update | Max Chuard | Director, M&A and IR
Outlook and Summary | Andreas Andreades | CEO
1
2
4
5
Q & A 6
Financial update | David Arnott | CFO 3
13 13 13
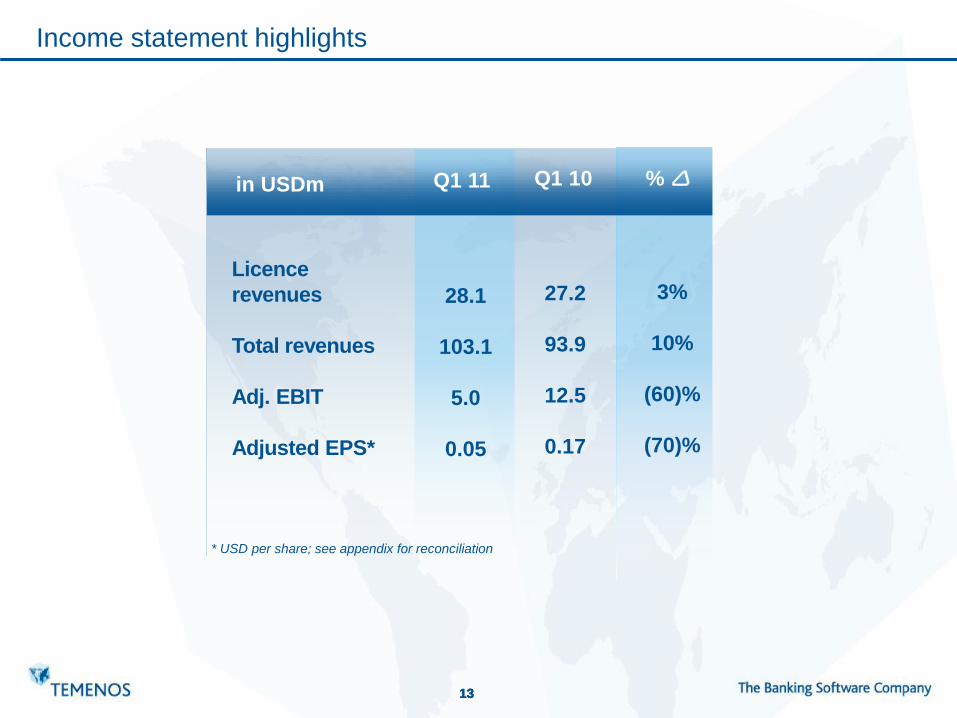
Income statement highlights
Licence
revenues
Total revenues
Adj. EBIT
Adjusted EPS*
Q1 11
28.1
103.1
5.0
0.05
Q1 10
27.2
93.9
12.5
0.17
%
3%
10%
(60)%
(70)%
in USDm
* USD per share; see appendix for reconciliation
14 14 14
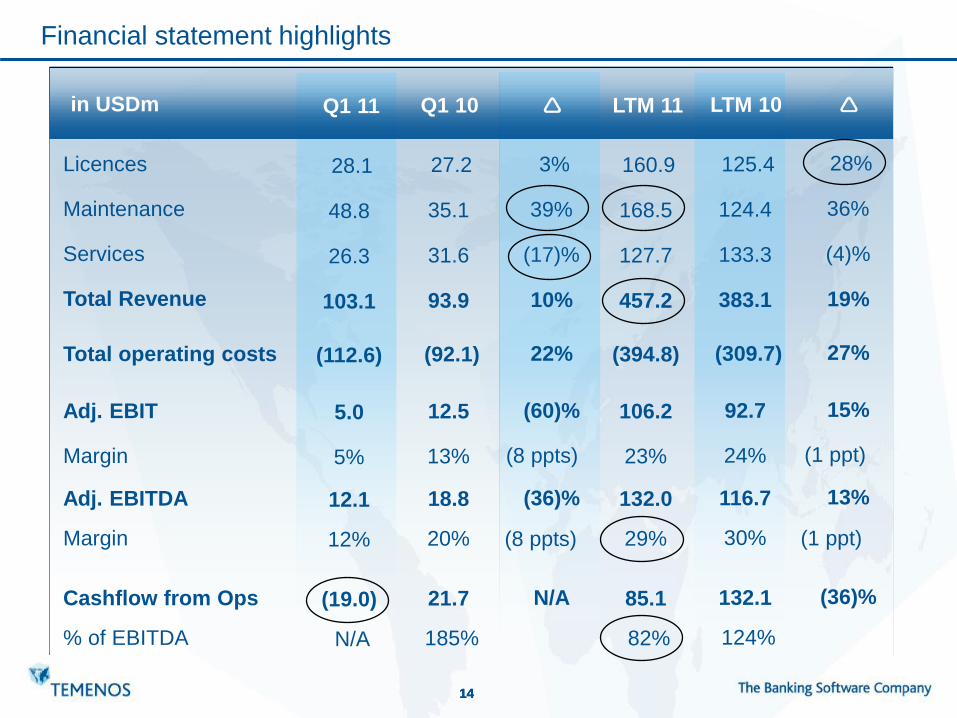
Financial statement highlights
Licences
Maintenance
Services
Total Revenue
Total operating costs
Adj. EBIT
Margin
Adj. EBITDA
Margin
Cashflow from Ops
% of EBITDA
in USDm
28.1
48.8
26.3
103.1
(112.6)
5.0
5%
12.1
12%
(19.0)
N/A
Q1 11
27.2
35.1
31.6
93.9
(92.1)
12.5
13%
18.8
20%
21.7
185%
Q1 10
3%
39%
(17)%
10%
22%
(60)%
(8 ppts)
(36)%
(8 ppts)
N/A
160.9
168.5
127.7
457.2
(394.8)
106.2
23%
132.0
29%
85.1
82%
LTM 11
125.4
124.4
133.3
383.1
(309.7)
92.7
24%
116.7
30%
132.1
124%
LTM 10
28%
36%
(4)%
19%
27%
15%
(1 ppt)
13%
(1 ppt)
(36)%
15 15 15
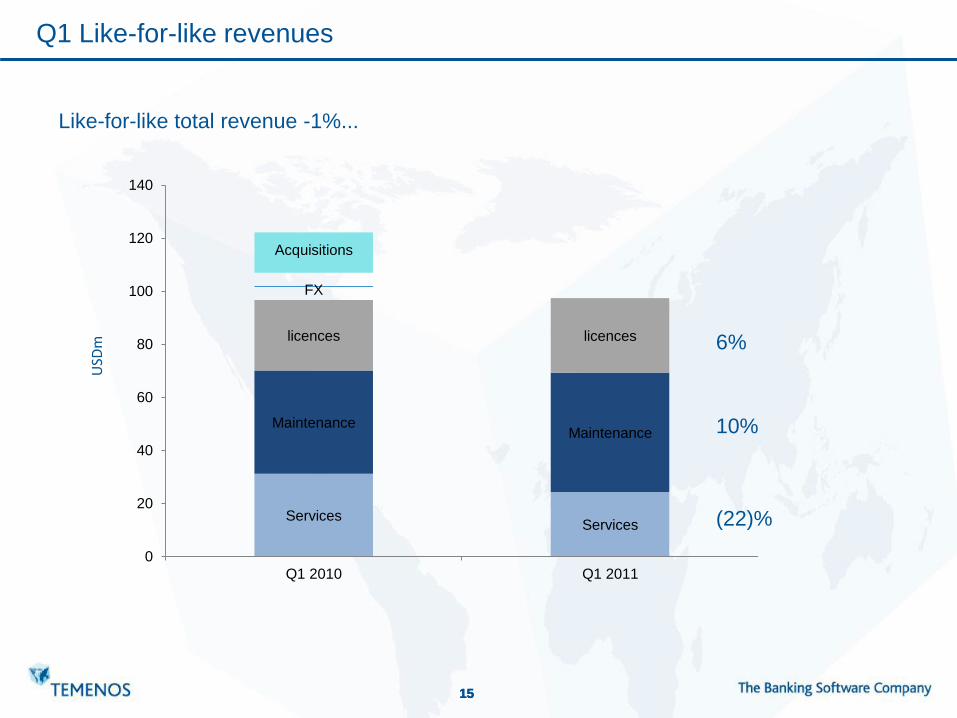
ServicesServices
MaintenanceMaintenance
licences licences
FX
Acquisitions
0
20
40
60
80
100
120
140
Q1 2010 Q1 2011
Q1 Like-for-like revenues
6%
10%
(22)%
Like-for-like total revenue -1%...
USD
m
16 16 16
0
20
40
60
80
100
120
Q1 2010 Q1 2011
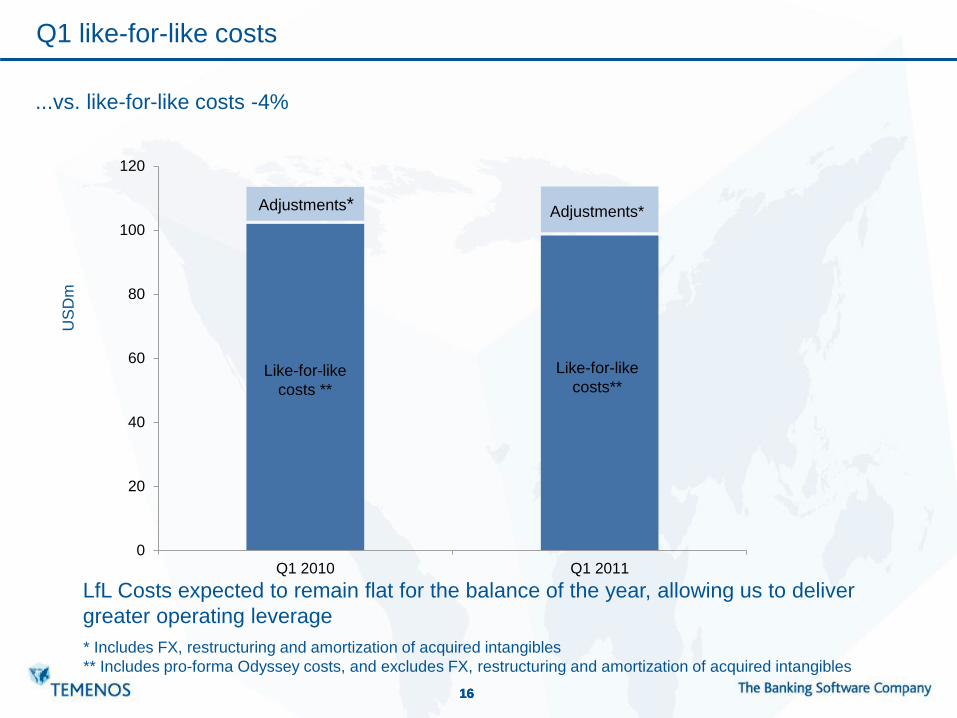
Q1 like-for-like costs U
SD
m
...vs. like-for-like costs -4%
Like-for-like
costs **
Like-for-like
costs**
Adjustments* Adjustments*
* Includes FX, restructuring and amortization of acquired intangibles
** Includes pro-forma Odyssey costs, and excludes FX, restructuring and amortization of acquired intangibles
LfL Costs expected to remain flat for the balance of the year, allowing us to deliver
greater operating leverage
17 17 17
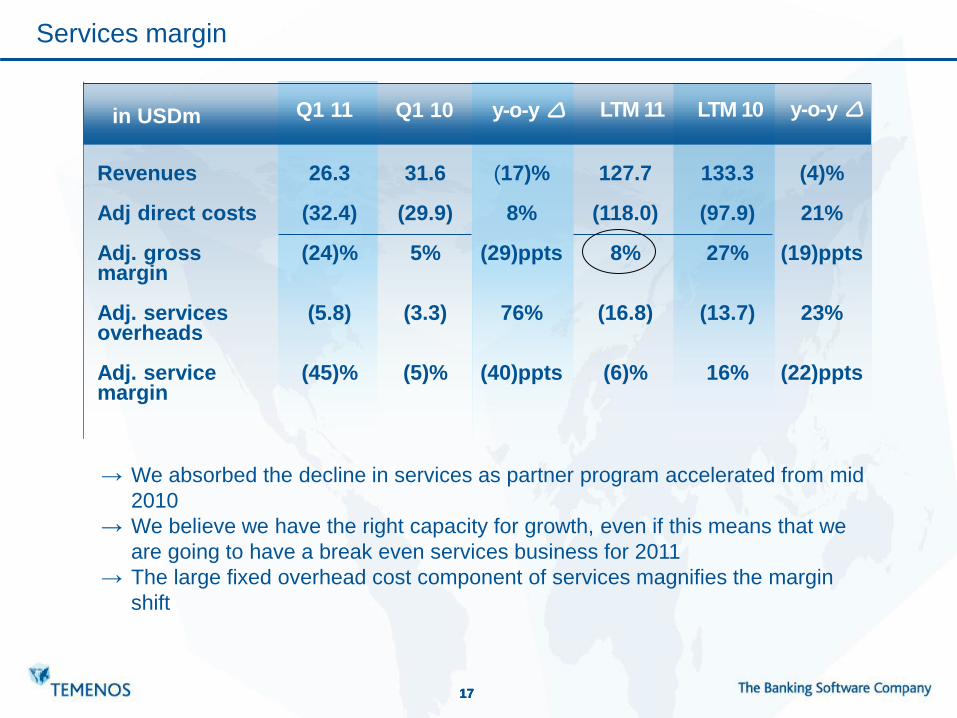
Services margin
Q1 11
Q1 10 y-o-y LTM 11 LTM 10 y-o-y in USDm
Revenues Adj direct costs Adj. gross margin Adj. services overheads Adj. service margin
26.3
(32.4)
(24)%
(5.8)
(45)%
31.6
(29.9)
5%
(3.3)
(5)%
(17)%
8%
(29)ppts
76%
(40)ppts
127.7
(118.0)
8%
(16.8)
(6)%
133.3
(97.9)
27%
(13.7)
16%
(4)%
21%
(19)ppts
23%
(22)ppts
→ We absorbed the decline in services as partner program accelerated from mid
2010
→ We believe we have the right capacity for growth, even if this means that we
are going to have a break even services business for 2011
→ The large fixed overhead cost component of services magnifies the margin
shift
18 18 18
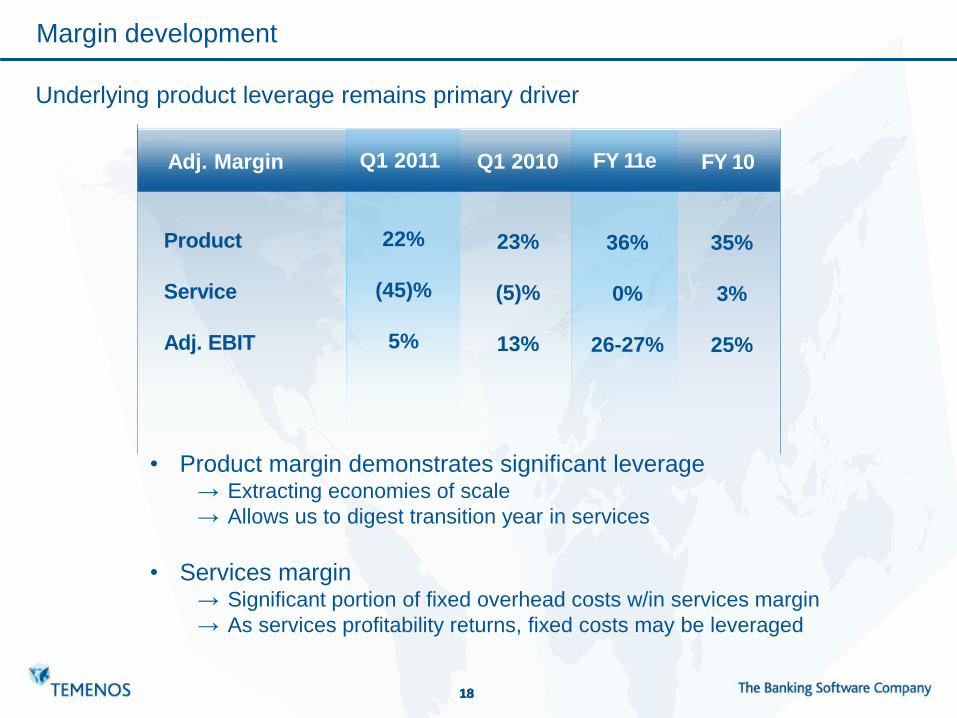
Margin development
Adj. Margin
Underlying product leverage remains primary driver
• Product margin demonstrates significant leverage → Extracting economies of scale
→ Allows us to digest transition year in services
• Services margin → Significant portion of fixed overhead costs w/in services margin
→ As services profitability returns, fixed costs may be leveraged
Product
Service
Adj. EBIT
Q1 2010
23%
(5)%
13%
Q1 2011
22%
(45)%
5%
FY 10
35%
3%
25%
Adj. Margin FY 11e
36%
0%
26-27%
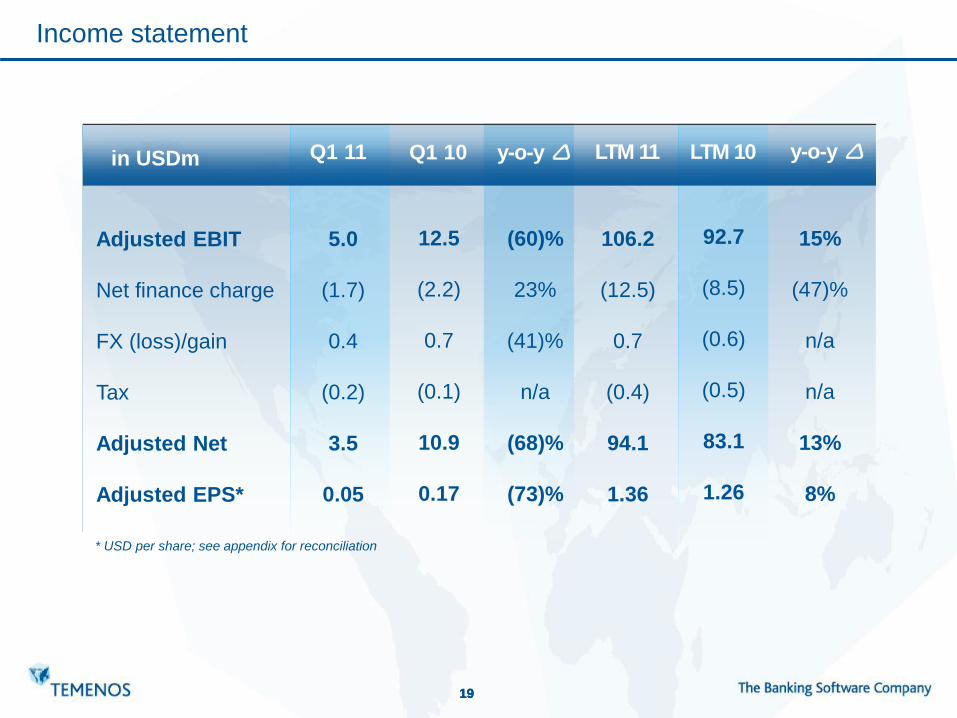
19 19 19
Q1 11
Q1 10 y-o-y LTM 11 LTM 10 y-o-y in USDm
Adjusted EBIT
Net finance charge
FX (loss)/gain
Tax
Adjusted Net
Adjusted EPS*
5.0
(1.7)
0.4
(0.2)
3.5
0.05
12.5
(2.2)
0.7
(0.1)
10.9
0.17
(60)%
23%
(41)%
n/a
(68)%
(73)%
Income statement
106.2
(12.5)
0.7
(0.4)
94.1
1.36
92.7
(8.5)
(0.6)
(0.5)
83.1
1.26
15%
(47)%
n/a
n/a
13%
8%
* USD per share; see appendix for reconciliation
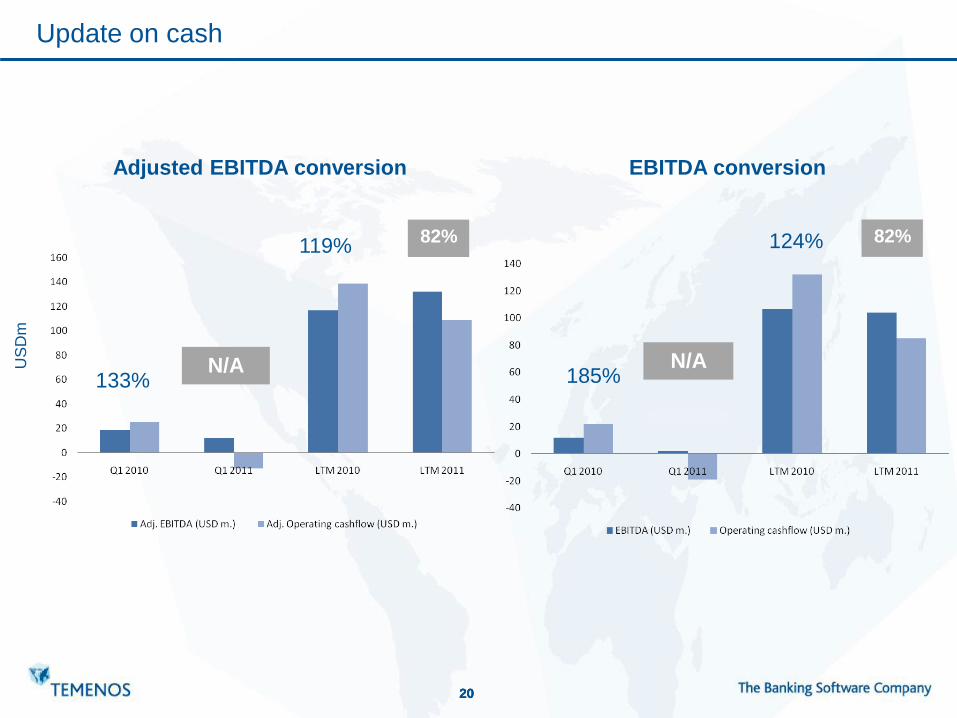
20 20 20
Update on cash
133%
119%
N/A
82%
185%
124%
N/A
82%
EBITDA conversion Adjusted EBITDA conversion
US
Dm
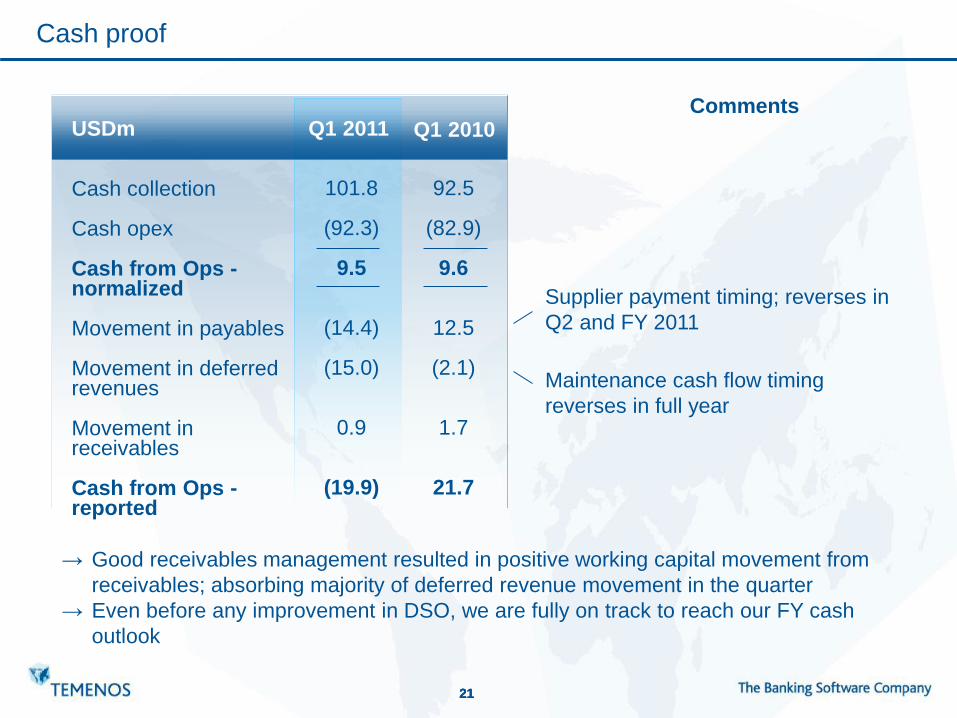
21 21 21
Cash proof
Cash collection Cash opex Cash from Ops - normalized Movement in payables Movement in deferred revenues Movement in receivables Cash from Ops - reported
USDm
101.8
(92.3)
9.5
(14.4)
(15.0)
0.9
(19.9)
Q1 2011
Supplier payment timing; reverses in
Q2 and FY 2011
→ Good receivables management resulted in positive working capital movement from
receivables; absorbing majority of deferred revenue movement in the quarter
→ Even before any improvement in DSO, we are fully on track to reach our FY cash
outlook
Comments Q1 2010
92.5
(82.9)
9.6
12.5
(2.1)
1.7
21.7
Maintenance cash flow timing
reverses in full year
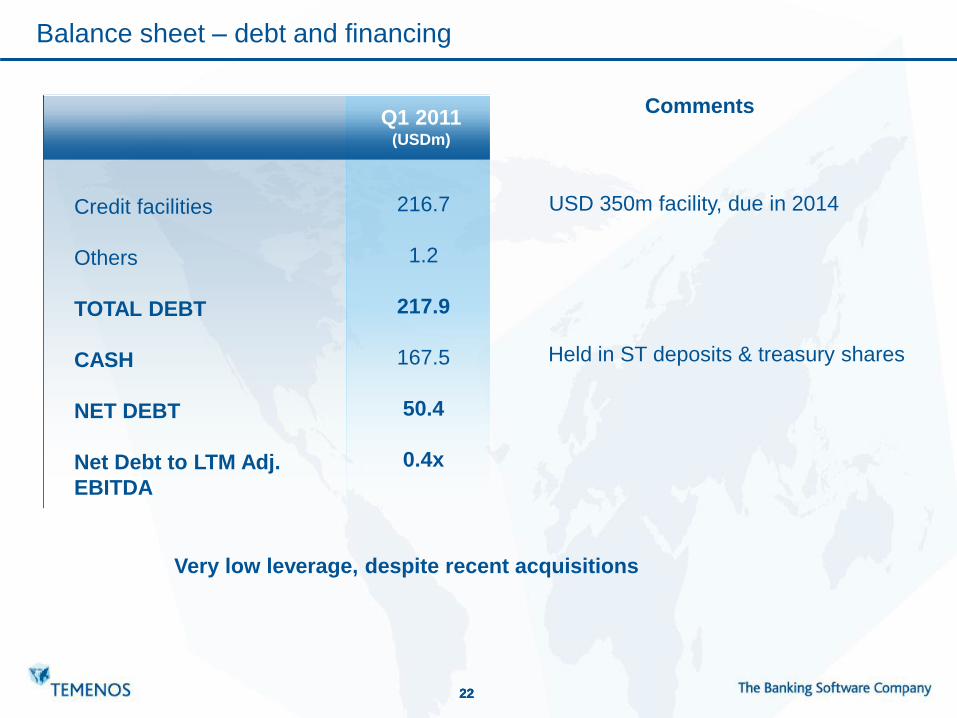
22 22 22
Balance sheet – debt and financing
Credit facilities
Others
TOTAL DEBT
CASH
NET DEBT
Net Debt to LTM Adj.
EBITDA
Q1 2011 (USDm)
216.7
1.2
217.9
167.5
50.4
0.4x
Comments
USD 350m facility, due in 2014
Held in ST deposits & treasury shares
Very low leverage, despite recent acquisitions
23 23 23
Agenda
Introduction | Sarah Bowman | Investor Relations
Strategy and Business update | Andreas Andreades | CEO
Outlook and Summary | Andreas Andreades | CEO
1
2
5
Q & A 6
Financial update | David Arnott | CFO 3
Acquisition Update | Max Chuard | Director, M&A and IR
4
24 24 24
Odyssey - Private Wealth Management update
• Odyssey integration progresses rapidly → New PWM division in place with own P&L structure
→ Full integration of sales force under PWM
→ Integration of G&A/IT/Finance complete; bringing significant cost synergies
• Product development strategy on track → Can address all tiers with a combined front-to-back solution
• Strong demand seen for PWM products → Currently, expected 2011 PWM licence revenues are ahead of business
plan, giving us confidence in the full year
→ 2 live clients with combined Triple A and T24 solution
25 25 25
Acquisition update
• We continue to screen potential candidates → From a product perspective we are looking for candidates in adjacent
markets
→ Geographically, we are actively looking at key, large markets
• We maintain our strict adherence to acquisition criteria → Acquisitions must be accretive within the first 12 months
→ Aim to leverage global sales organization, market leadership and R&D
investment in leading product set.
26 26 26
Agenda
Introduction | Sarah Bowman | Investor Relations
Strategy and Business update | Andreas Andreades | CEO
1
2
Q & A 6
Financial update | David Arnott | CFO 3
Acquisition Update | Max Chuard | Director, M&A and IR
4
Outlook and Summary | Andreas Andreades | CEO 5
27 27 27
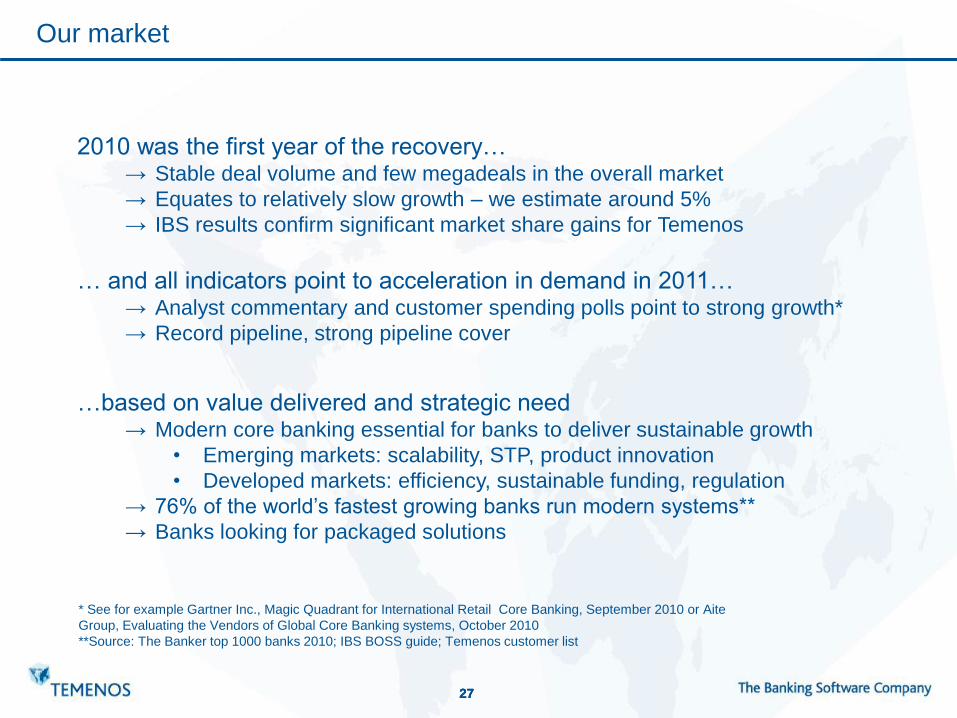
* See for example Gartner Inc., Magic Quadrant for International Retail Core Banking, September 2010 or Aite
Group, Evaluating the Vendors of Global Core Banking systems, October 2010
**Source: The Banker top 1000 banks 2010; IBS BOSS guide; Temenos customer list
Our market
2010 was the first year of the recovery… → Stable deal volume and few megadeals in the overall market
→ Equates to relatively slow growth – we estimate around 5%
→ IBS results confirm significant market share gains for Temenos
… and all indicators point to acceleration in demand in 2011… → Analyst commentary and customer spending polls point to strong growth*
→ Record pipeline, strong pipeline cover
…based on value delivered and strategic need → Modern core banking essential for banks to deliver sustainable growth
• Emerging markets: scalability, STP, product innovation
• Developed markets: efficiency, sustainable funding, regulation
→ 76% of the world’s fastest growing banks run modern systems**
→ Banks looking for packaged solutions
28 28 28
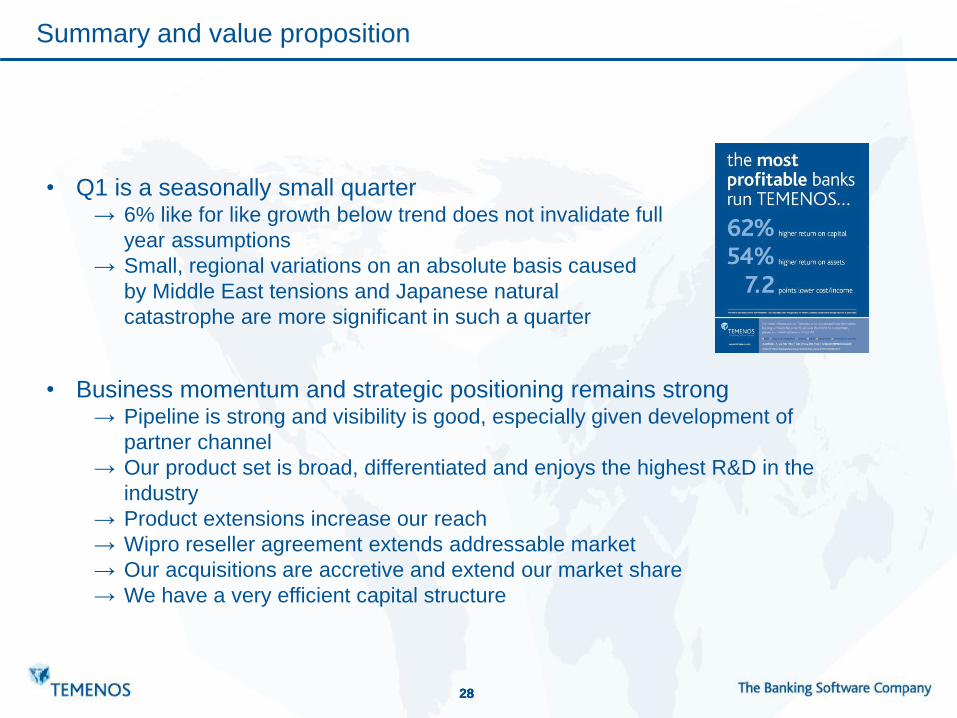
Summary and value proposition
• Q1 is a seasonally small quarter → 6% like for like growth below trend does not invalidate full
year assumptions
→ Small, regional variations on an absolute basis caused
by Middle East tensions and Japanese natural
catastrophe are more significant in such a quarter
• Business momentum and strategic positioning remains strong
→ Pipeline is strong and visibility is good, especially given development of
partner channel
→ Our product set is broad, differentiated and enjoys the highest R&D in the
industry
→ Product extensions increase our reach
→ Wipro reseller agreement extends addressable market
→ Our acquisitions are accretive and extend our market share
→ We have a very efficient capital structure
29 29 29
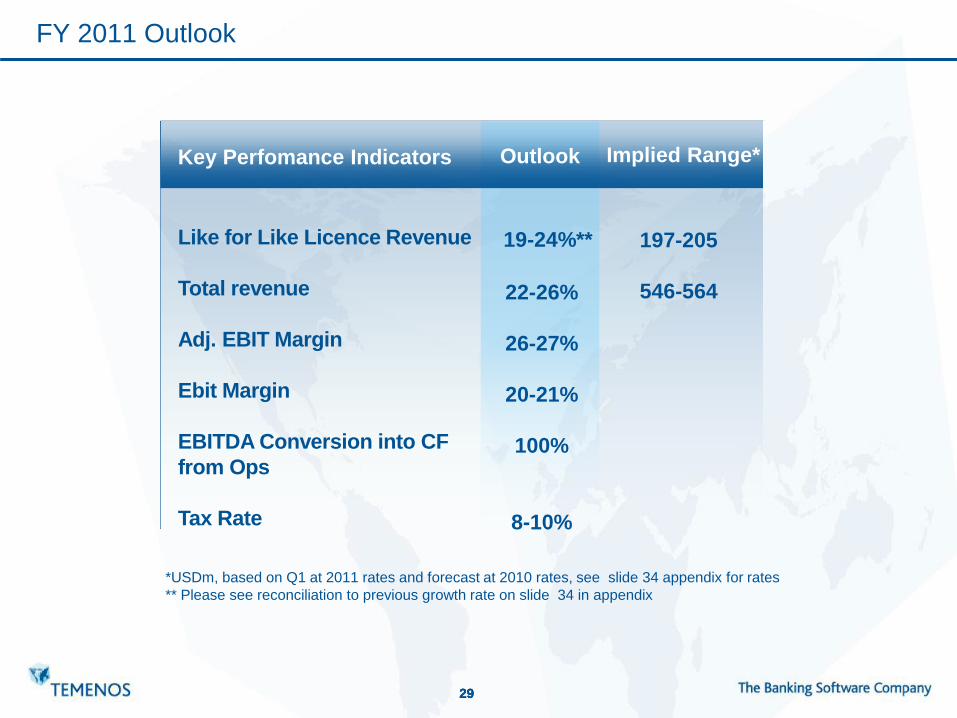
FY 2011 Outlook
Like for Like Licence Revenue
Total revenue
Adj. EBIT Margin
Ebit Margin
EBITDA Conversion into CF
from Ops
Tax Rate
197-205
546-564
Implied Range* Key Perfomance Indicators
*USDm, based on Q1 at 2011 rates and forecast at 2010 rates, see slide 34 appendix for rates
** Please see reconciliation to previous growth rate on slide 34 in appendix
22-26%
26-27%
20-21%
100%
8-10%
Outlook
19-24%**
30 30 30
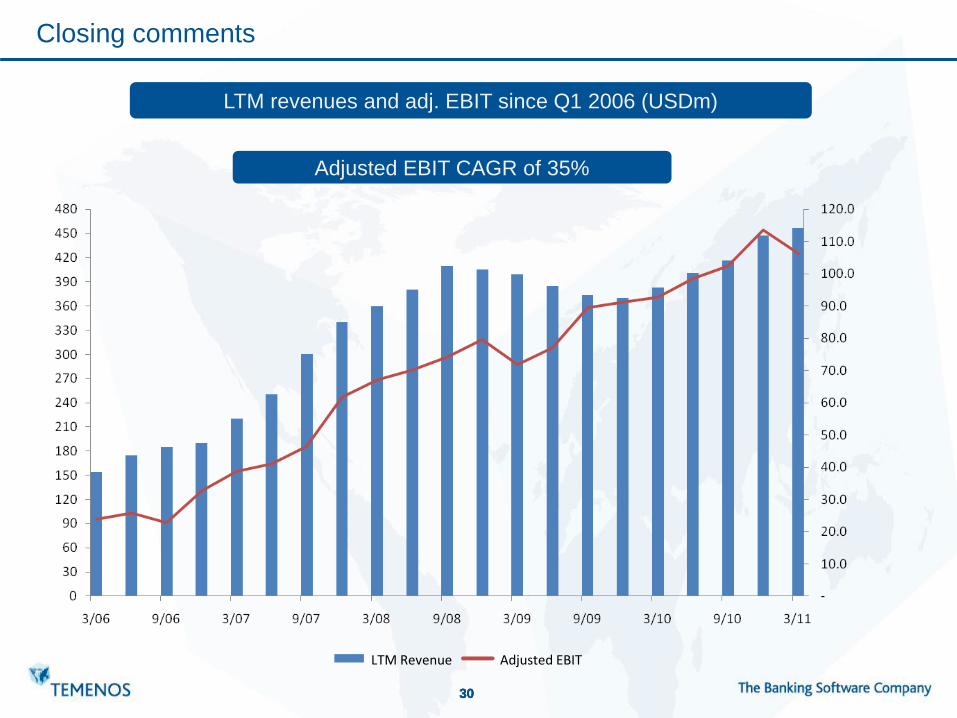
Closing comments
LTM revenues and adj. EBIT since Q1 2006 (USDm)
Adjusted EBIT CAGR of 35%
LTM Revenue Adjusted EBIT
31 31 31
Agenda
Introduction | Sarah Bowman | Investor Relations
Strategy and Business update | Andreas Andreades | CEO
1
2
Financial update | David Arnott | CFO 3
Acquisition Update | Max Chuard | Director, M&A and IR
4
Q & A 6
Outlook and Summary | Andreas Andreades | CEO 5
32 32 32
Appendices
33 33 33
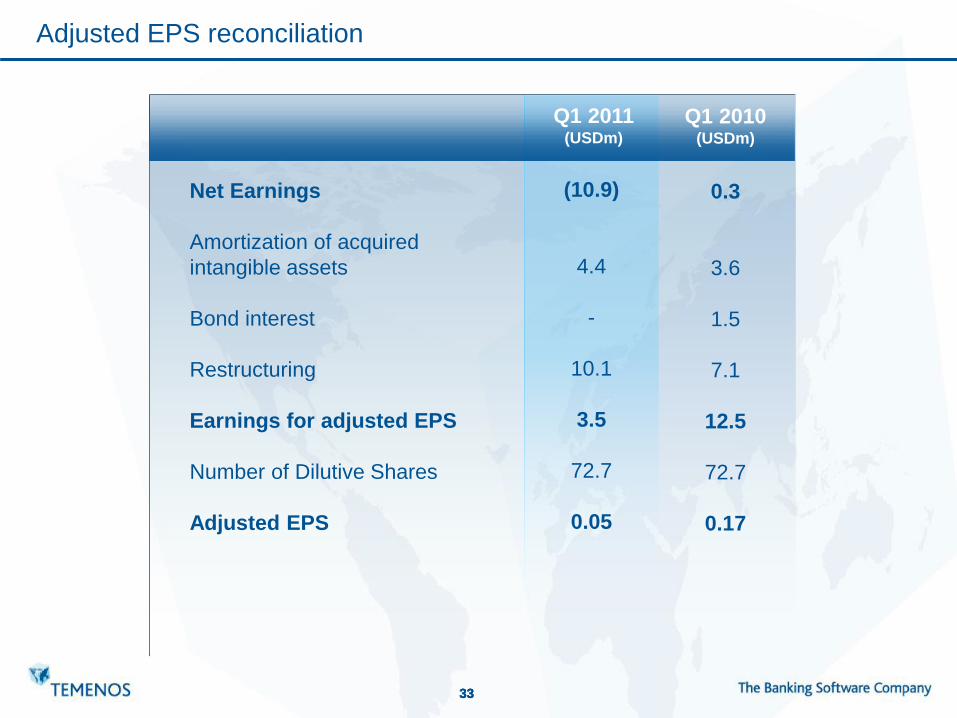
Adjusted EPS reconciliation
Net Earnings
Amortization of acquired
intangible assets
Bond interest
Restructuring
Earnings for adjusted EPS
Number of Dilutive Shares
Adjusted EPS
Q1 2011 (USDm)
(10.9)
4.4
-
10.1
3.5
72.7
0.05
Q1 2010 (USDm)
0.3
3.6
1.5
7.1
12.5
72.7
0.17
34 34 34
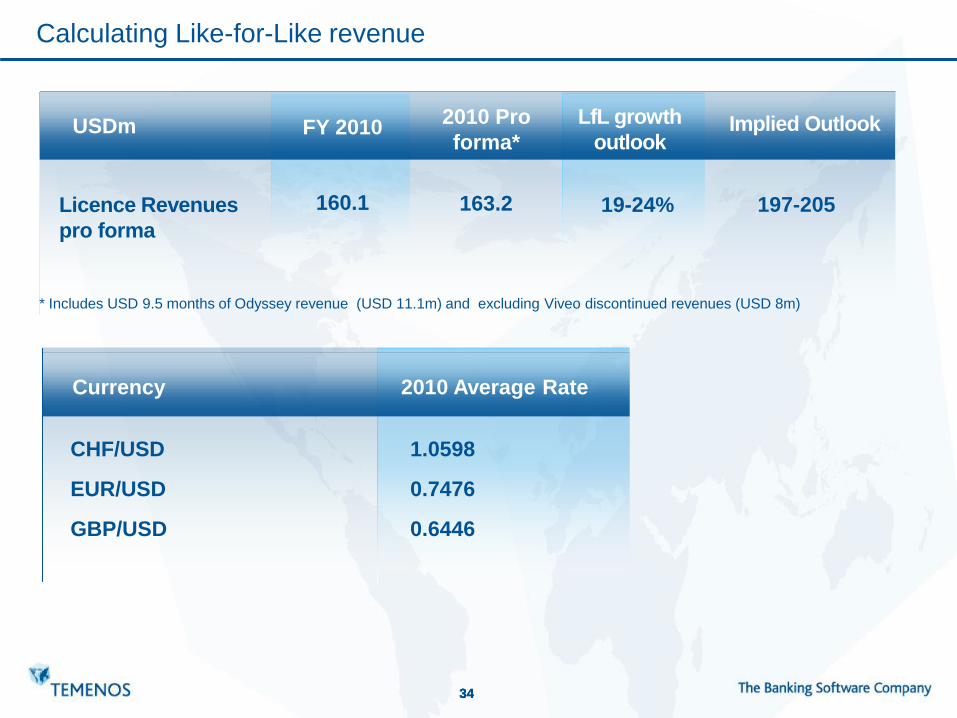
Calculating Like-for-Like revenue
Licence Revenues
pro forma
FY 2010
160.1
2010 Pro
forma*
163.2
LfL growth
outlook
19-24%
USDm Implied Outlook
* Includes USD 9.5 months of Odyssey revenue (USD 11.1m) and excluding Viveo discontinued revenues (USD 8m)
CHF/USD EUR/USD GBP/USD
2010 Average Rate
1.0598
0.7476
0.6446
Currency
197-205
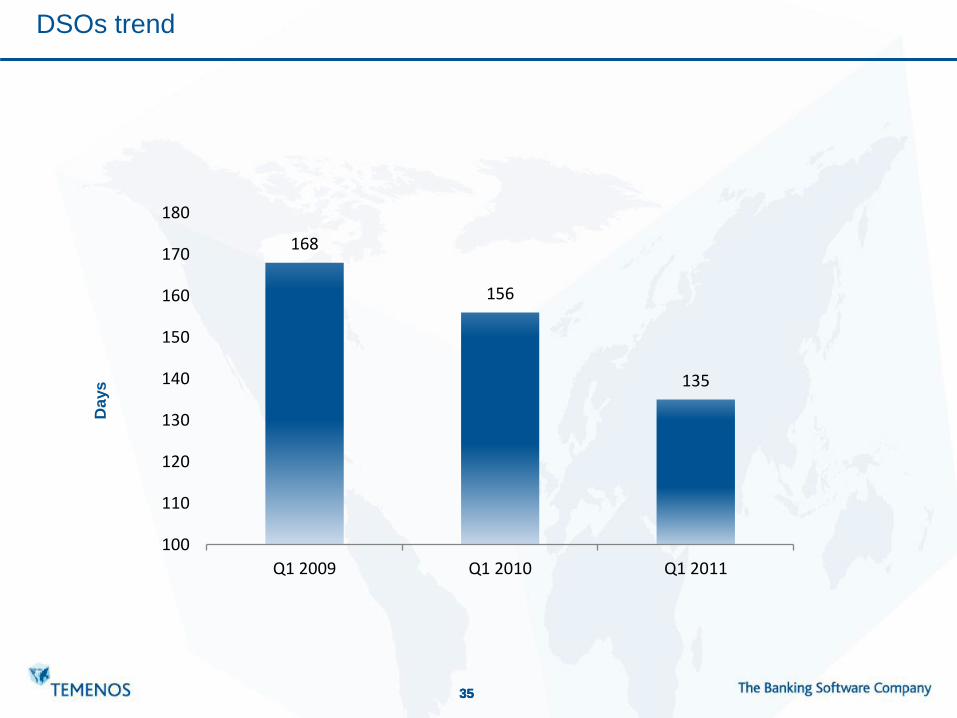
35 35 35
DSOs trend
Days
168
156
135
100
110
120
130
140
150
160
170
180
Q1 2009 Q1 2010 Q1 2011
36 36 36
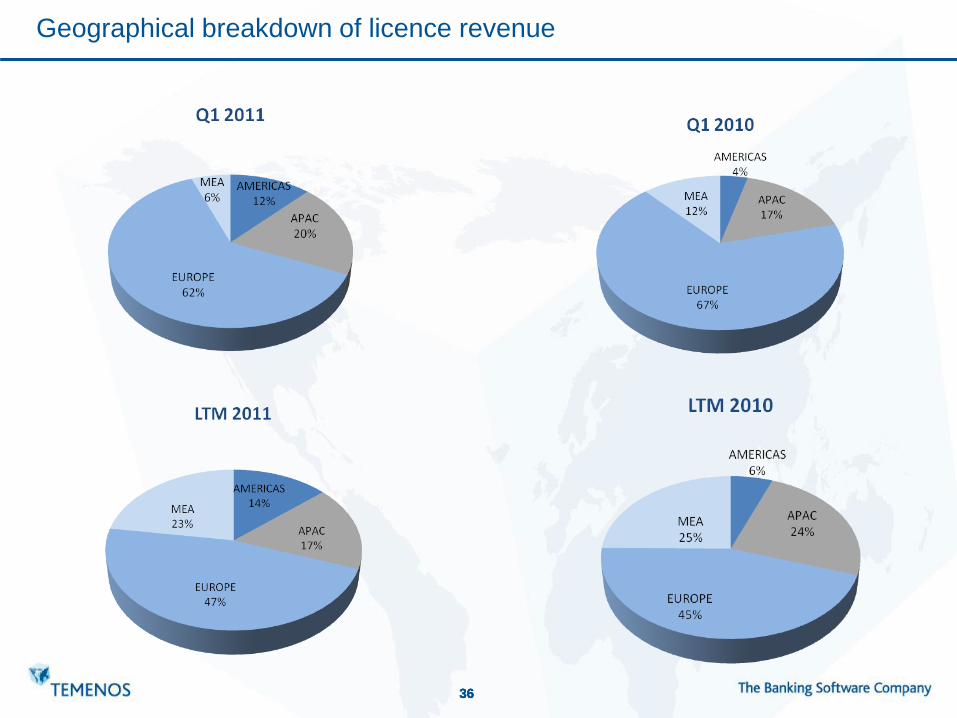
Geographical breakdown of licence revenue
37 37 37
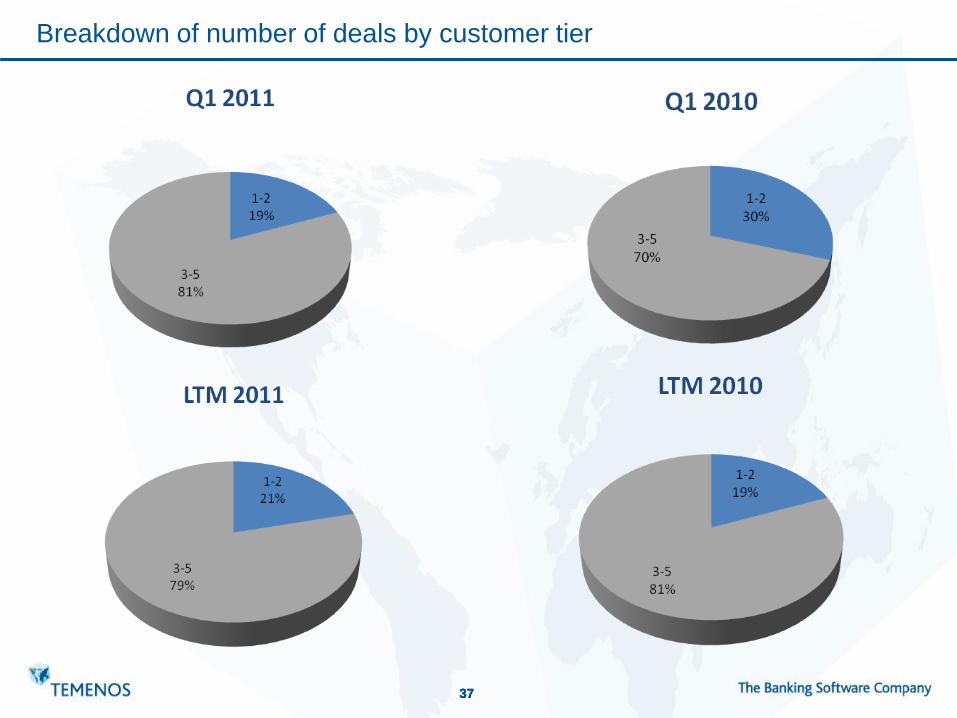
Breakdown of number of deals by customer tier
38 38 38
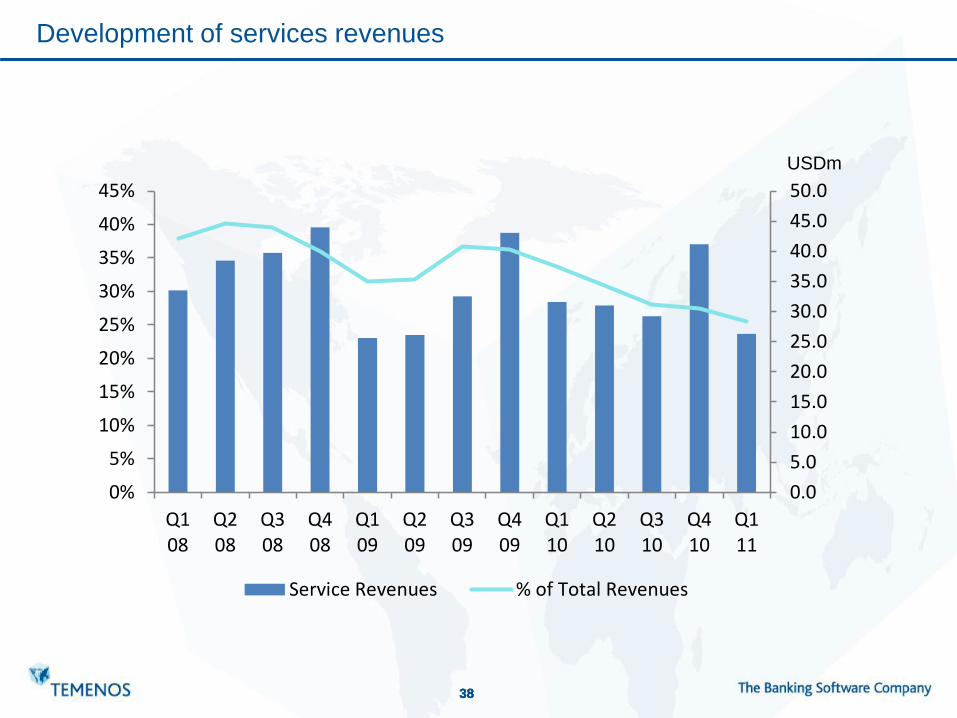
Development of services revenues
0.0
5.0
10.0
15.0
20.0
25.0
30.0
35.0
40.0
45.0
50.0
0%
5%
10%
15%
20%
25%
30%
35%
40%
45%
Q108
Q208
Q308
Q408
Q109
Q209
Q309
Q409
Q110
Q210
Q310
Q410
Q111
Service Revenues % of Total Revenues
USDm
39 39 39
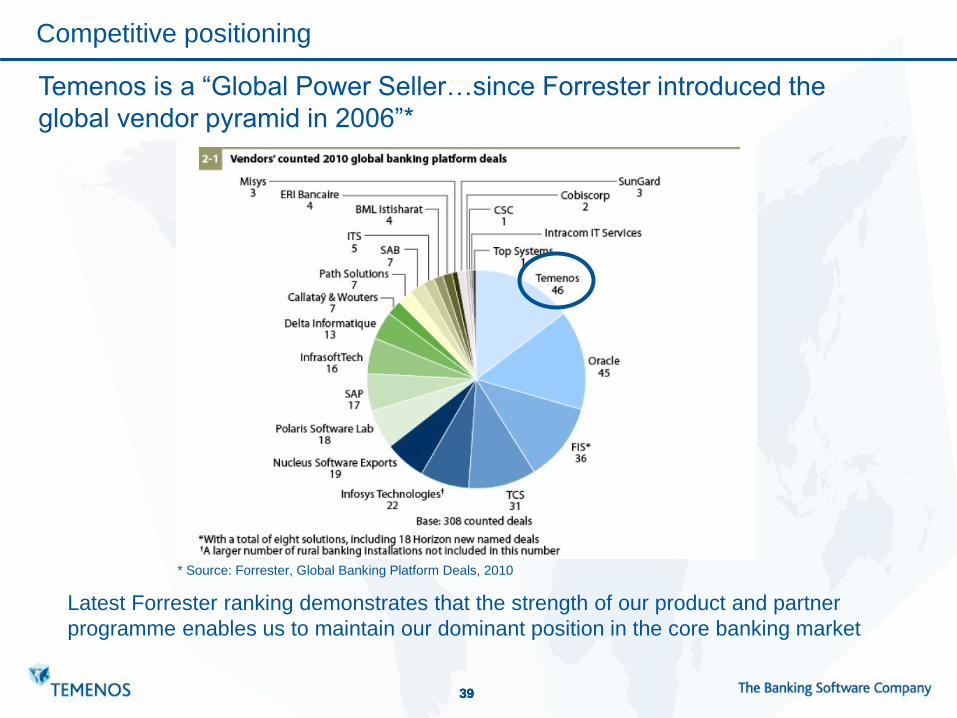
Competitive positioning
* Source: Forrester, Global Banking Platform Deals, 2010
Temenos is a “Global Power Seller…since Forrester introduced the
global vendor pyramid in 2006”*
Latest Forrester ranking demonstrates that the strength of our product and partner
programme enables us to maintain our dominant position in the core banking market
40 40 40
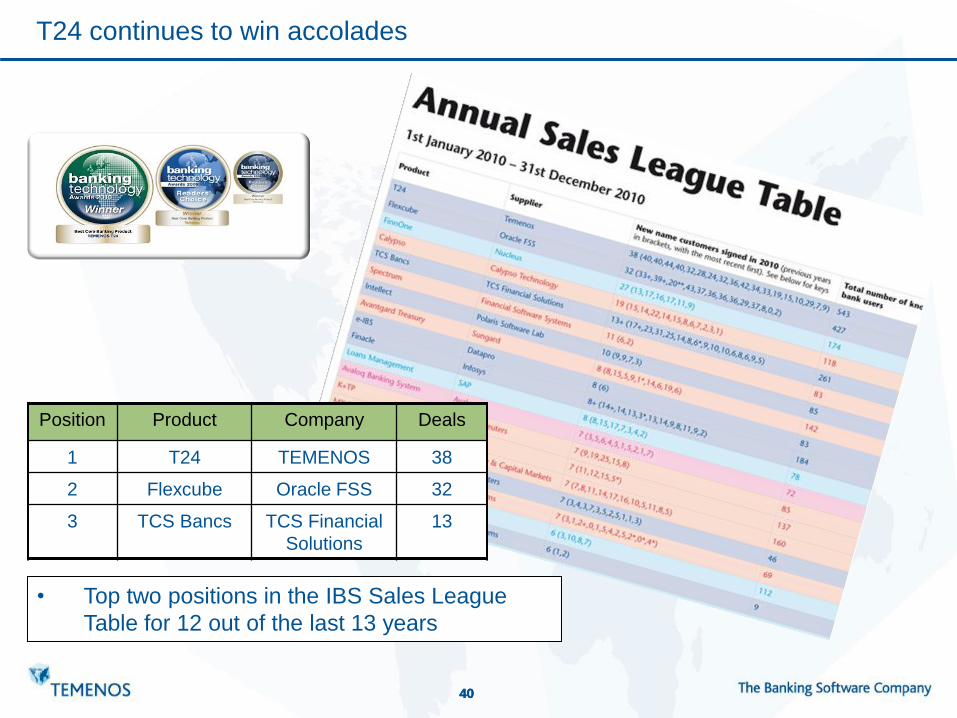
Position Product Company Deals
1 T24 TEMENOS 38
2 Flexcube Oracle FSS 32
3 TCS Bancs TCS Financial
Solutions
13
• Top two positions in the IBS Sales League
Table for 12 out of the last 13 years
T24 continues to win accolades

Thank You