Embed Size (px)
Citation preview

© 2013 SUNTORY BEVERAGE & FOOD Limited. All Rights Reserved©2016 SUNTORY BEVERAGE & FOOD LIMITED. All Rights Reserved.
Financial Results for First Half
Fiscal Year Ending December 31, 2016
August 4, 2016
Suntory Beverage & Food Limited
© 2013 SUNTORY BEVERAGE & FOOD Limited. All Rights Reserved©2016 SUNTORY BEVERAGE & FOOD LIMITED. All Rights Reserved.
Review of First Half FY2016
Saburo Kogo, President & CEO

© 2013 SUNTORY BEVERAGE & FOOD Limited. All Rights Reserved©2016 SUNTORY BEVERAGE & FOOD LIMITED. All Rights Reserved.
Performance Highlights
(Billions of yen)
Net Sales
Operating Income
Net Income
679.0
39.9
17.9
+9.1%
+5.0%
-4.8%
YoYFY2016Jan - Jun
+14.0%
+13.5%
+3.1%
Currency neutral
3

© 2013 SUNTORY BEVERAGE & FOOD Limited. All Rights Reserved©2016 SUNTORY BEVERAGE & FOOD LIMITED. All Rights Reserved.
Accelerate organic growth and increase earning power
Key Initiatives for FY2016
Challenge to a new business model
Create synergies globally
4

© 2013 SUNTORY BEVERAGE & FOOD Limited. All Rights Reserved©2016 SUNTORY BEVERAGE & FOOD LIMITED. All Rights Reserved.
(Japan)
Launched products offering new value to create new demand
Launched on
August 2, 2016
+
5
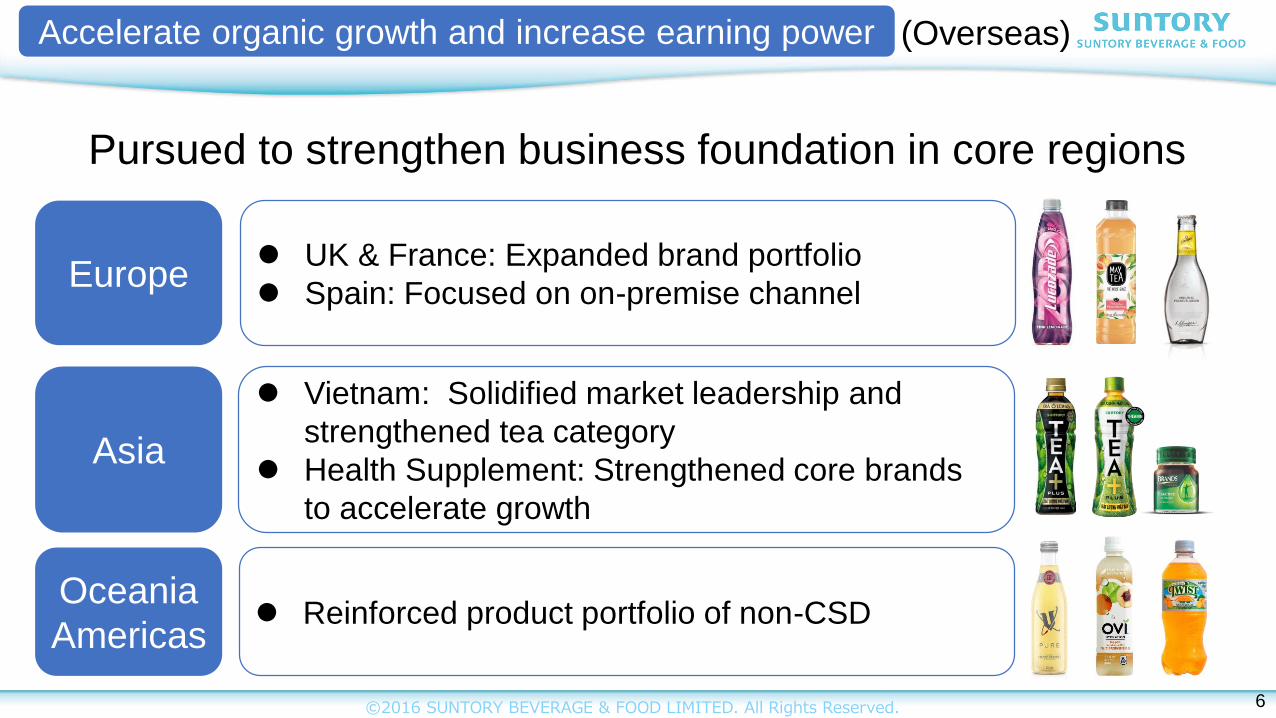
Accelerate organic growth and increase earning power
© 2013 SUNTORY BEVERAGE & FOOD Limited. All Rights Reserved©2016 SUNTORY BEVERAGE & FOOD LIMITED. All Rights Reserved.
Pursued to strengthen business foundation in core regions
Europe
Asia
UK & France: Expanded brand portfolio
Spain: Focused on on-premise channel
Reinforced product portfolio of non-CSD
Vietnam: Solidified market leadership and
strengthened tea category
Health Supplement: Strengthened core brands
to accelerate growth
6
(Overseas)Accelerate organic growth and increase earning power
Oceania
Americas

© 2013 SUNTORY BEVERAGE & FOOD Limited. All Rights Reserved©2016 SUNTORY BEVERAGE & FOOD LIMITED. All Rights Reserved.
Create pleasing office environment and
contribute to happiness of office workers through soft drinks
Enhance intellectual productivity
Distribution network
Full-line portfolioProduct &
vending machines
development capability
Group synergy
Outside partner
RefreshmentHealth
enhancementPromote
communication
Provide solution with new added value(Full-line beverage service business)
Challenge to a new business model (Japan)
7

© 2013 SUNTORY BEVERAGE & FOOD Limited. All Rights Reserved©2016 SUNTORY BEVERAGE & FOOD LIMITED. All Rights Reserved.
Vending machine
development capability
FOSHU
productsx
Earn points when purchasing
products from dedicated vending
machines
Able to exchange those points
for FOSHU products
Manage earned points with
a smartphone app
Earn points by also walking
in order to promote exercise
Companies working on
employee health management
Offering new service that raise
awareness of employees’ health & welfare
“Suntory GREEN+” supporting corporate
employee health and welfare management
Overview of our service
8
Challenge to a new business model (Japan)

© 2013 SUNTORY BEVERAGE & FOOD Limited. All Rights Reserved©2016 SUNTORY BEVERAGE & FOOD LIMITED. All Rights Reserved.
Overview
Acquisition
price
Acquire route to market for sales and
marketing of the two brands Lucozade &
Ribena and manufacturing facilities from
GSK Nigeria
Approx. 7 billion yen (Subject to adjustments including foreign exchange rates)
Sales of
soft drinksApprox. 9 billion yen*
(Approx. 15 billion naira)
*Sales of Nutritional Healthcare; actual results for the fiscal year ended December 2015, calculated at the rate of 0.6 yen per Nigerian naira.
Acquisition of soft drink operations and route to market capabilities in Nigeria
Nigeria
Morocco
GhanaKenya
South Africa
9
(Overseas)Challenge to a new business model
Algeria

© 2013 SUNTORY BEVERAGE & FOOD Limited. All Rights Reserved©2016 SUNTORY BEVERAGE & FOOD LIMITED. All Rights Reserved.
Enhance cooperation by function globally andutilize expertise of each group company
New product
development
(R&D)
SCM
Finance
Sharing manufacturing know-how
Pursue initiatives on global joint purchasing
Sharing expertise of reducing manufacturing costs
Japan – France:
France – Japan:
Vietnam – Japan:
Americas*1 – Japan:
Promote initiatives to improve working capital (CCC*2) globally
HR Continue active exchanges of personnel
*1: North Carolina; business region of Pepsi Bottling Ventures Group
*2: CCC: Cash Conversion Cycle
10
Create synergies globally
Blood Orangina
May Tea
TEA+ MATCHA
OVI (Following launch in Australia & New Zealand)

© 2013 SUNTORY BEVERAGE & FOOD Limited. All Rights Reserved©2016 SUNTORY BEVERAGE & FOOD LIMITED. All Rights Reserved.
Financial Results of First Half FY2016
Haruhisa Inada, Managing Executive Officer & CFO

© 2013 SUNTORY BEVERAGE & FOOD Limited. All Rights Reserved©2016 SUNTORY BEVERAGE & FOOD LIMITED. All Rights Reserved.
Summary of First Half
Total On track with strong performance in Japan
offsetting FX impact
Japan Sales and profit increased driven by
initiatives to improve profitability
Overseas Sluggish in France, growth in Vietnam
Negative FX impact on sales and profit
12
© 2013 SUNTORY BEVERAGE & FOOD Limited. All Rights Reserved©2016 SUNTORY BEVERAGE & FOOD LIMITED. All Rights Reserved.
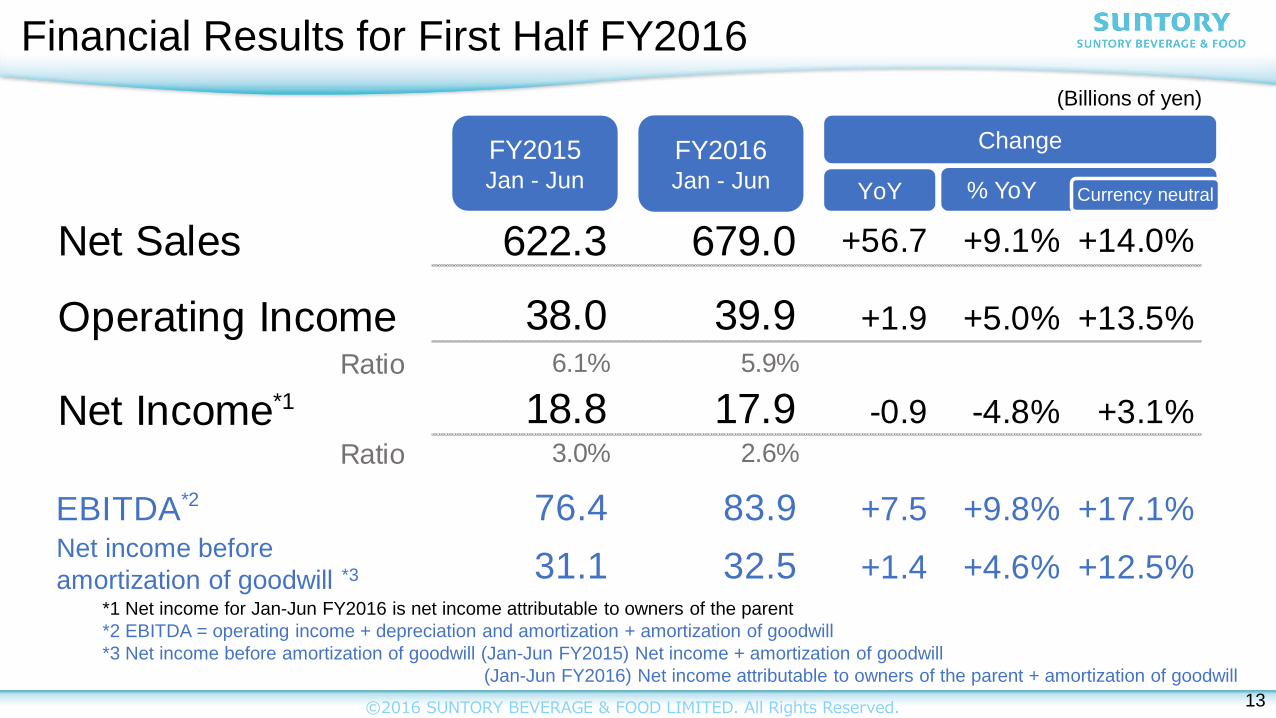
Net Sales 622.3 679.0 +56.7 +9.1% +14.0%
Operating Income 38.0 39.9 +1.9 +5.0% +13.5%
Ratio 6.1% 5.9%
Net Income*1 18.8 17.9 -0.9 -4.8% +3.1%
Ratio 3.0% 2.6%
EBITDA*2 76.4 83.9 +7.5 +9.8% +17.1%
31.1 32.5 +1.4 +4.6% +12.5%
Financial Results for First Half FY2016
(Billions of yen)
Net income before
amortization of goodwill *3
*1 Net income for Jan-Jun FY2016 is net income attributable to owners of the parent
*2 EBITDA = operating income + depreciation and amortization + amortization of goodwill
*3 Net income before amortization of goodwill (Jan-Jun FY2015) Net income + amortization of goodwill
(Jan-Jun FY2016) Net income attributable to owners of the parent + amortization of goodwill
FY2015Jan - Jun
FY2016Jan - Jun
Change
YoY % YoY Currency neutral
13

© 2013 SUNTORY BEVERAGE & FOOD Limited. All Rights Reserved©2016 SUNTORY BEVERAGE & FOOD LIMITED. All Rights Reserved.
Net Sales 622.3 679.0 +56.7 +9.1%
Japan 350.5 421.9 +71.3 +20.3%
Overseas 271.8 257.2 -14.6 -5.4%
Operating Income 38.0 39.9 +1.9 +5.0%
Japan 15.3 22.0 +6.7 +44.1%
Overseas 35.0 32.5 -2.5 -7.2%
Reconciliations -12.3 -14.6 -2.3
FY2015
Jan - Jun
FY2016
Jan - Jun
Change
% YoYYoY
14
Financial Results for First Half FY2016
(Billions of yen)

© 2013 SUNTORY BEVERAGE & FOOD Limited. All Rights Reserved©2016 SUNTORY BEVERAGE & FOOD LIMITED. All Rights Reserved.
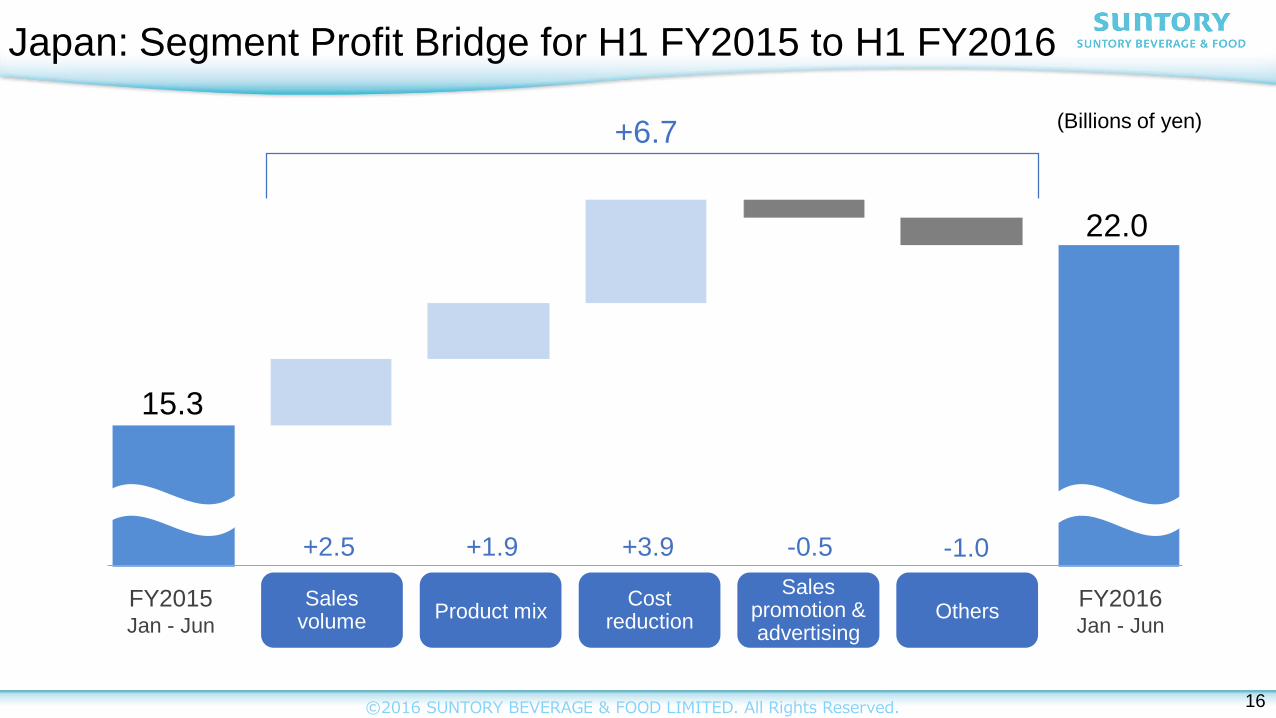
Sales increased significantly mainly due to
consolidation impact of Japan Beverage Group
Profit increased significantly contributed by
initiatives to improve profitability
15
Sales 350.5 421.9 +71.3 +20.3%
Segment Profit 15.3 22.0 +6.7 +44.1%
Ratio 4.4% 5.2%
FY2015Jan - Jun
Change
(Billions of yen)
% YoYYoY
FY2016Jan - Jun
Japan Segment: Results for First Half FY2016
© 2013 SUNTORY BEVERAGE & FOOD Limited. All Rights Reserved©2016 SUNTORY BEVERAGE & FOOD LIMITED. All Rights Reserved.
15.3
22.0
16
Japan: Segment Profit Bridge for H1 FY2015 to H1 FY2016
+2.5 +1.9 -0.5+3.9 -1.0
FY2016Jan - Jun
FY2015Jan - Jun
Sales volume
Product mixCost
reduction
Sales promotion & advertising
Others
(Billions of yen)+6.7

© 2013 SUNTORY BEVERAGE & FOOD Limited. All Rights Reserved©2016 SUNTORY BEVERAGE & FOOD LIMITED. All Rights Reserved.
Sales
Overseas 271.8 257.2 -14.6 -5.4% +5.0%
Europe 122.8 118.2 -4.7 -3.8% +5.6%
Asia 85.3 81.1 -4.3 -5.0% +7.3%
Oceania 22.2 19.3 -2.8 -12.8% +1.5%
Americas 41.5 38.6 -2.9 -6.9% +0.2%
Overseas Segment: Results for First Half FY2016
FY2015Jan - Jun
FY2016Jan - Jun
Change
YoY
(Billions of yen)
% YoY Currency neutral
17

© 2013 SUNTORY BEVERAGE & FOOD Limited. All Rights Reserved©2016 SUNTORY BEVERAGE & FOOD LIMITED. All Rights Reserved.
Overseas 35.0 32.5 -2.5 -7.2% +3.5%
Ratio 12.9% 12.6%
Europe 21.2 18.2 -3.0 -14.2% -5.4%
Asia 6.5 8.2 +1.7 +25.9% +48.6%
Oceania 2.8 2.0 -0.8 -27.0% -17.6%
Americas 4.5 4.1 -0.5 -10.1% -2.6%
Overseas Segment: Results for First Half FY2016
Segment
ProfitFY2015Jan - Jun
FY2016Jan - Jun
Change
YoY
(Billions of yen)
% YoY Currency neutral
18

© 2013 SUNTORY BEVERAGE & FOOD Limited. All Rights Reserved©2016 SUNTORY BEVERAGE & FOOD LIMITED. All Rights Reserved.
32.5
-1.0 +2.7 -0.1-0.4
Europe Asia Oceania Americas
19
-3.6
FX
impact
Europe
Asia
Oceania
Americas
+1.1(Currency neutral basis)
35.0
Overseas: Segment Profit Bridge for H1 FY2015 to H1 FY2016
(Billions of yen)
FY2015Jan - Jun
FY2016Jan - Jun
-2.0
-1.0
-0.3
-0.3

© 2013 SUNTORY BEVERAGE & FOOD Limited. All Rights Reserved©2016 SUNTORY BEVERAGE & FOOD LIMITED. All Rights Reserved.
Sales 122.8 118.2 -3.8% +5.6%
Segment Profit 21.2 18.2 -14.2% -5.4%
Europe
% Change
Currencyneutral
FY2015Jan - Jun
(Billions of yen)
FY2016Jan - Jun
Negatively impacted by adverse market condition in France
France: Negatively impacted by recurrent deflation
pressure and adverse weather
UK: Expanded product portfolio
Spain: Good sales in on-premise channel, also
contributed by PepsiCo collaboration
20
© 2013 SUNTORY BEVERAGE & FOOD Limited. All Rights Reserved©2016 SUNTORY BEVERAGE & FOOD LIMITED. All Rights Reserved.
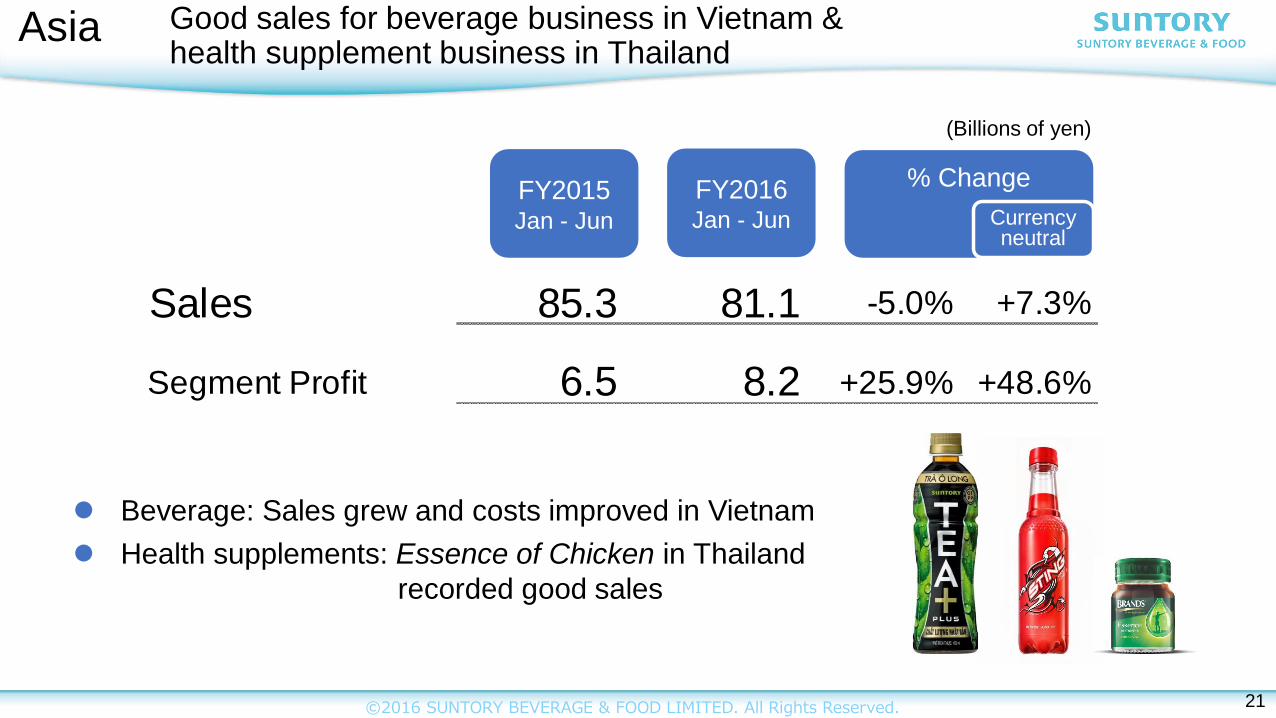
Sales 85.3 81.1 -5.0% +7.3%
Segment Profit 6.5 8.2 +25.9% +48.6%
Beverage: Sales grew and costs improved in Vietnam
Health supplements: Essence of Chicken in Thailand
recorded good sales
% Change
Currencyneutral
FY2015Jan - Jun
(Billions of yen)
FY2016Jan - Jun
Asia Good sales for beverage business in Vietnam & health supplement business in Thailand
21

© 2013 SUNTORY BEVERAGE & FOOD Limited. All Rights Reserved©2016 SUNTORY BEVERAGE & FOOD LIMITED. All Rights Reserved.
Sales 22.2 19.3 -12.8% +1.5%
Segment Profit 2.8 2.0 -27.0% -17.6%
Continued to focus on V. Launched V Pure (New Zealand)
Profit declined due to revision of inventory valuation
method in 2015
% Change
Currencyneutral
FY2015Jan - Jun
(Billions of yen)
FY2016Jan - Jun
Oceania Impacted by revision of inventory valuation method in 2015
22

© 2013 SUNTORY BEVERAGE & FOOD Limited. All Rights Reserved©2016 SUNTORY BEVERAGE & FOOD LIMITED. All Rights Reserved.
Sales 41.5 38.6 -6.9% +0.2%
Segment Profit 4.5 4.1 -10.1% -2.6%
Good momentum in non-carbonated beverages
Negatively impacted by adverse weather in May & June
% Change
Currencyneutral
FY2015Jan - Jun
(Billions of yen)
FY2016Jan - Jun
Americas Non-carbonated beverages grew but impacted byadverse weather
23

© 2013 SUNTORY BEVERAGE & FOOD Limited. All Rights Reserved©2016 SUNTORY BEVERAGE & FOOD LIMITED. All Rights Reserved.
Key Factors for Second Half FY2016
JapanHigh uncertainty from weather,
return to deflation, etc.
France Continuing deflation
Slow down of market growth
due to degradation in external
environment
Vietnam
Continue initiatives to
improve profitability
Execute recovery plan
Aim to increase market share
in northern region
24

© 2013 SUNTORY BEVERAGE & FOOD Limited. All Rights Reserved©2016 SUNTORY BEVERAGE & FOOD LIMITED. All Rights Reserved.

© 2013 SUNTORY BEVERAGE & FOOD Limited. All Rights Reserved©2016 SUNTORY BEVERAGE & FOOD LIMITED. All Rights Reserved.
Net Sales 1,381.0 1,430.0 +49.0 +3.5% +6.6%
Operating Income 92.0 90.0 -2.0 -2.2% +3.2%
Ratio 6.7% 6.3%
Net Income*1 42.5 40.5 -2.0 -4.6% +0.1%
Ratio 3.1% 2.8%
EBITDA*2 175.5 180.0 +4.5 +2.5% +7.2%
69.7 70.0 +0.3 +0.4% +5.5%
*1 Forecast of net income in 2016 is net income attributable to owners of the parent
*2 EBITDA = operating income + depreciation and amortization + amortization of goodwill
*3 Net income before amortization of goodwill in 2016 = Net Income attributable to owners of the parent + amortization of goodwill
Forecast for FY2016
FY2015Results
FY2016Forecast
Change
YoY
(Billions of yen)
% YoY Currency neutral
Net income before
amortization of goodwill *3
26

© 2013 SUNTORY BEVERAGE & FOOD Limited. All Rights Reserved©2016 SUNTORY BEVERAGE & FOOD LIMITED. All Rights Reserved.
Sales 806.9 870.0 +63.1 +7.8%
Segment Profit 46.7 50.0 +3.3 +7.0%
FY2015Results
FY2016Forecast
Change
% YoY
(Billions of yen)
YoY
Japan Segment: Forecast for FY2016
27

© 2013 SUNTORY BEVERAGE & FOOD Limited. All Rights Reserved©2016 SUNTORY BEVERAGE & FOOD LIMITED. All Rights Reserved.
46.7
50.0
+0.1 +2.3 -1.2+2.7 -0.6
Japan: Segment Profit Bridge for FY2015 to FY2016
(Billions of yen)
FY2016Forecast
FY2015Result
Sales
volumeProduct mix
Cost
reduction
Sales
promotion &
advertising
Others
28

© 2013 SUNTORY BEVERAGE & FOOD Limited. All Rights Reserved©2016 SUNTORY BEVERAGE & FOOD LIMITED. All Rights Reserved.
Sales
Overseas 574.1 560.0 -14.1 -2.5% +4.7%
Europe 254.2 243.5 -10.7 -4.2% +4.3%
Asia 180.5 183.0 +2.5 +1.4% +8.1%
Oceania 45.6 42.0 -3.6 -7.9% +2.5%
Americas 93.7 91.5 -2.2 -2.4% +0.2%
Overseas Segment: Forecast for FY2016
FY2015Results
FY2016Forecast
Change
YoY
(Billions of yen)
% YoY Currency neutral
29

© 2013 SUNTORY BEVERAGE & FOOD Limited. All Rights Reserved©2016 SUNTORY BEVERAGE & FOOD LIMITED. All Rights Reserved.
Segment
Profit
Overseas 74.0 69.5 -4.5 -6.1% +2.4%
Europe 44.0 41.0 -3.0 -6.9% +1.9%
Asia 13.6 13.7 +0.1 +0.7% +13.7%
Oceania 5.9 4.5 -1.4 -23.1% -16.1%
Americas 10.5 10.3 -0.2 -2.3% +0.5%
Overseas Segment: Forecast for FY2016
FY2015Results
FY2016Forecast
Change
YoY
(Billions of yen)
% YoY Currency neutral
30

© 2013 SUNTORY BEVERAGE & FOOD Limited. All Rights Reserved©2016 SUNTORY BEVERAGE & FOOD LIMITED. All Rights Reserved.
U.S. Dollar 120.3 111.7 118.0
Euro 134.1 124.5 125.0
British Pound 183.3 160.0 165.0
Singapore Dollar 89.1 80.9 85.0
New Zealand Dollar 89.1 75.5 76.0
Australian Dollar 94.0 81.9 82.0
FY2015Jan - Jun
FY2016Jan - Jun
FY2016Forecast
Exchange Rates
(Yen, average exchange rate)
31

© 2013 SUNTORY BEVERAGE & FOOD Limited. All Rights Reserved©2016 SUNTORY BEVERAGE & FOOD LIMITED. All Rights Reserved.
Forward-Looking Statements
This document contains forward-looking statements related to business and financial performance of the Company or the Group.
These forward-looking statements are projections made based on the currently available information and are subject to risks and uncertainties including, but not limited to, economic trends, competition in the industry in which the Company and the Group operate, market needs, exchange rates, as well as tax and other systems.
Therefore, actual business results and other outcomes published in the future may vary due to these factors. The Company accepts no liability for any loss or damage arising from the use of the information contained in this document.