Embed Size (px)
Citation preview
Copyright ©2014. Japan Aviation Electronics Industry. Ltd
Financial Results for FY2013 and Prospects for FY2014
6807 Japan Aviation Electronics Industry, Ltd.
May 8, 2014
1

Copyright ©2014. Japan Aviation Electronics Industry. Ltd
FY2013 Financial Results
2
(From April 1, 2013 to March 31, 2014)
Note : Amounts indicated less than 100 million yen are rounded off.

Copyright ©2014. Japan Aviation Electronics Industry. Ltd
1. FY2013 Financial Results Overview
FY2012 FY2013 % of Previous Year
Net Sales 1,296 1,598 123%
Operating Income (to Net Sales Ratio)
86 165 192%
Income before Income Tax (to Net Sales Ratio)
77 155 200%
Net Income (to Net Sales Ratio) 51 106 210%
Average Exchange Rate: 82.91 100.17 (JPY/USD)
(6.6%) (10.3%)
(3.9%) (6.6%)
3
(JPY in 100 milllions)
(6.0%) (9.7%)
Copyright ©2014. Japan Aviation Electronics Industry. Ltd
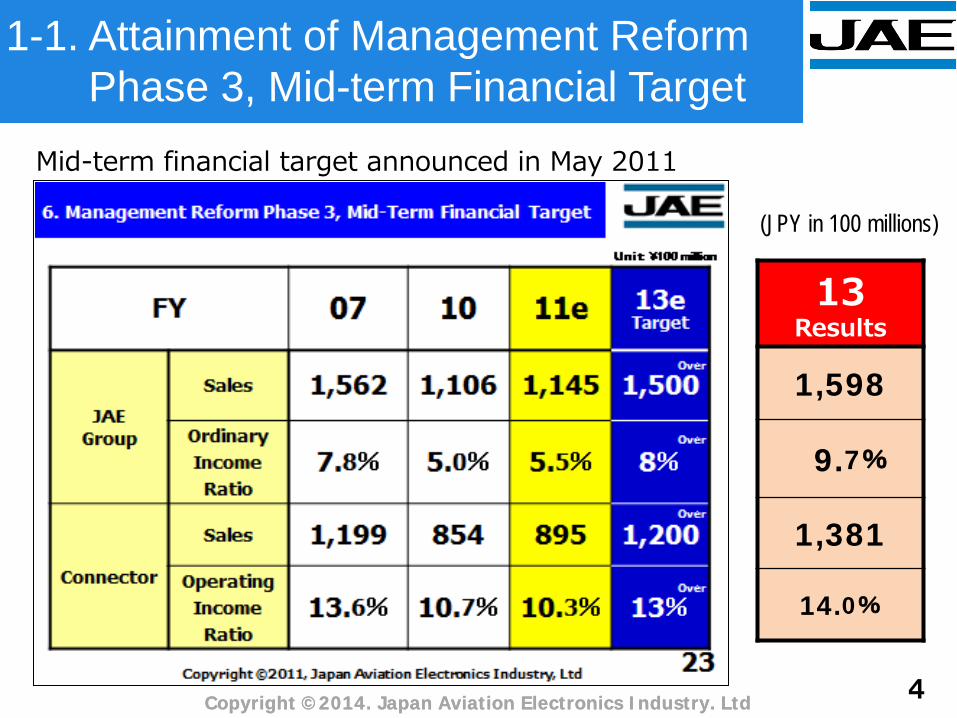
13 Results
1,598
9.7%
1,381
14.0%
Mid-term financial target announced in May 2011
1-1. Attainment of Management Reform Phase 3, Mid-term Financial Target
Copyright ©2014. Japan Aviation Electronics Industry. Ltd 4
(JPY in 100 millions)

Copyright ©2014. Japan Aviation Electronics Industry. Ltd
150
100
50
0
-50
1-2. Record High Net Sales & Income
5
Operating Income -- Increased five years in a row --
Net Sales -- Increased four years in a row --
Net
Sal
es In
com
e
(JPY in 100 millions)
Net Income
(FY)
(JPY in 100 millions)
Copyright ©2014. Japan Aviation Electronics Industry. Ltd
(FY)
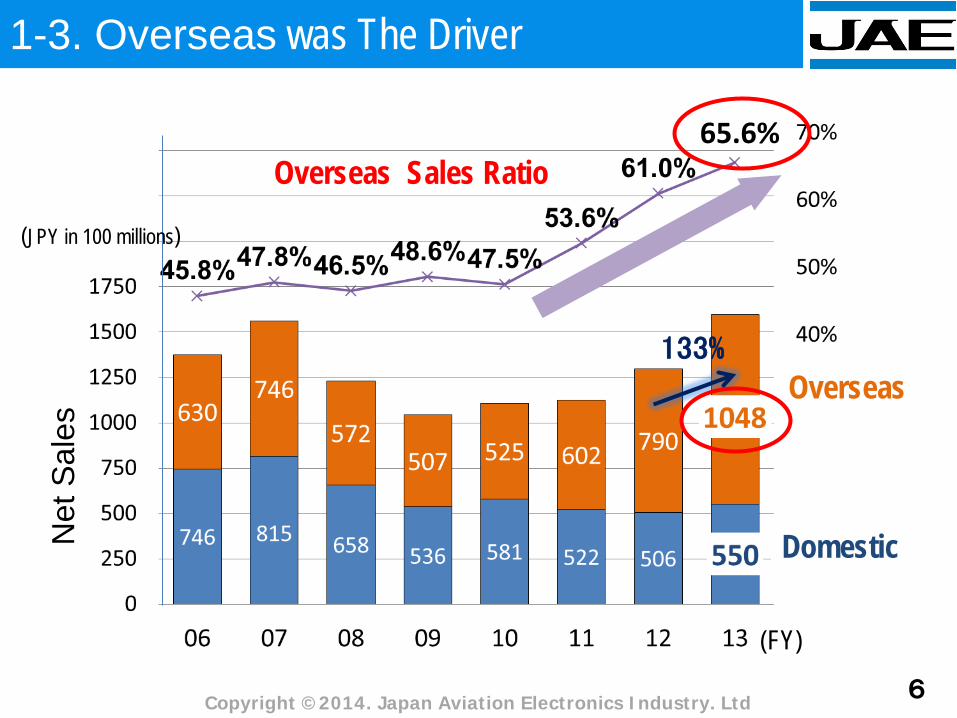
Domestic
Overseas
1-3. Overseas was The Driver
65.6%
6
133%
Net
Sal
es
Overseas Sales Ratio
(JPY in 100 millions)

Copyright ©2014. Japan Aviation Electronics Industry. Ltd
Sales Operating Income % of
Previous Year
% of Previous
Year
Connector 1,381 126% 193 (14.0%)
178%
UIS 42 84% △1 (△3.2%)
―
Aerospace 146 106% 9 (6.3%)
48%
Others 28 292% △36 ―
Total 1,598 123% 165 (10.3%)
192%
2. Sales & Operating Income by Business Segment for FY2013 (consolidated)
7
(JPY in 100 millions)

Copyright ©2014. Japan Aviation Electronics Industry. Ltd
事業部門別業績(コネクタ事業)
1,381
Others
Automotive
Industrial
1,098 124%
118%
132%
129%
105% Digital Home Electronics
Information
Communications
% of previous Year
Overseas
72 %
28 %
32 %
68%
126%
8
(JPY in 100 millions)
Domestic
Overseas
Domestic
(FY)
2-1. Record High Results for Connector Segment by Automotive, Comm. & Computer Growth

Copyright ©2014. Japan Aviation Electronics Industry. Ltd
20 23
27 19
3 0
0
50
12 13
50 42 84%
Input Devices 70%
Interface Devices 115%
Component mounting
Note : The mounting business was terminated in May 2012
2-2. UIS Sales : Decline in revenue due to the decreased demand for cursor wheels for digital cameras
Integration of the electrostatic touch panel business from FY2014 onward
9
(JPY in 100 millions)
% of previous Year
(FY)
Copyright ©2014. Japan Aviation Electronics Industry. Ltd
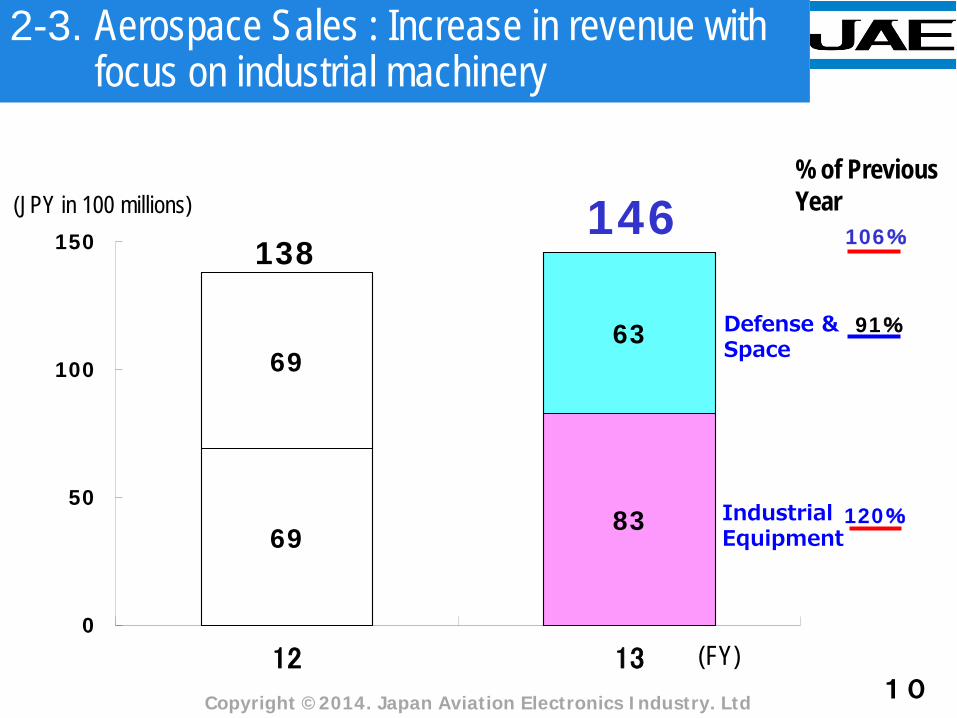
69 83
69 63
0
50
100
150
12 13
138 146 106%
Defense & Space
91%
Industrial Equipment
120%
10
2-3. Aerospace Sales : Increase in revenue with focus on industrial machinery
(JPY in 100 millions) % of Previous Year
(FY)

Copyright ©2014. Japan Aviation Electronics Industry. Ltd
1. By further promoting in-house production, automated assembly and better efficiency, JAE was able to establish its production system which is sustainable under the excessive fluctuation of exchange rate.
2. JAE continued aggressive investment in production systems, under the management philosophy which places emphasis on cash flow control.
11
3. Major Factors for FY2013 Financial Results

Copyright ©2014. Japan Aviation Electronics Industry. Ltd 8 9 10 11 12 13 (FY)
Production outside Japan
Production in Japan
12
67% 65% 72% 74% 73%
68%
0
100
0 0
(JPY) Fluctuation of Exchange Rate
(USD Value in JPY)
Ratio of Overseas Sales
(JPY in b)
Ratio of Production in Japan
3-1. Sustainable Production System under Excessive Exchange Rate Fluctuation
JAE strengthened auto assembly lines in Japan during super-strong
yen period to build sustainable production system in Japan
Thanks to correction of the yen appreciation,
FY2013 results became even better
Copyright ©2014. Japan Aviation Electronics Industry. Ltd
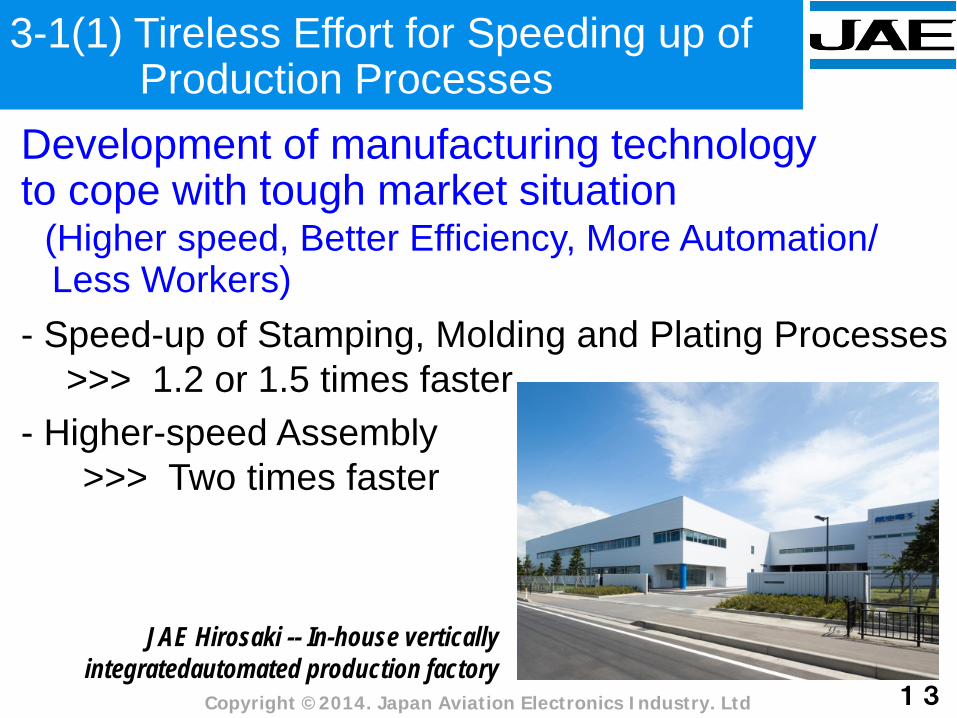
- Higher-speed Assembly >>> Two times faster
Development of manufacturing technology to cope with tough market situation (Higher speed, Better Efficiency, More Automation/ Less Workers)
3-1(1) Tireless Effort for Speeding up of Production Processes
- Speed-up of Stamping, Molding and Plating Processes >>> 1.2 or 1.5 times faster
13
JAE Hirosaki -- In-house vertically integratedautomated production factory

Copyright ©2014. Japan Aviation Electronics Industry. Ltd
- In June 2012, JAE Tijuana added 5th and 6th Factories
JAE Philippines
3-1(2) Enhancement of Production System Outside Japan for Automotive Business Expansion
A Typical Assembly Line at JAE Tijuana
- In November 2013, 2nd Factory of JAE Philippines was completed
14
For stronger demand of sub-harness for automotive use
Copyright ©2014. Japan Aviation Electronics Industry. Ltd
設備投資・償却費
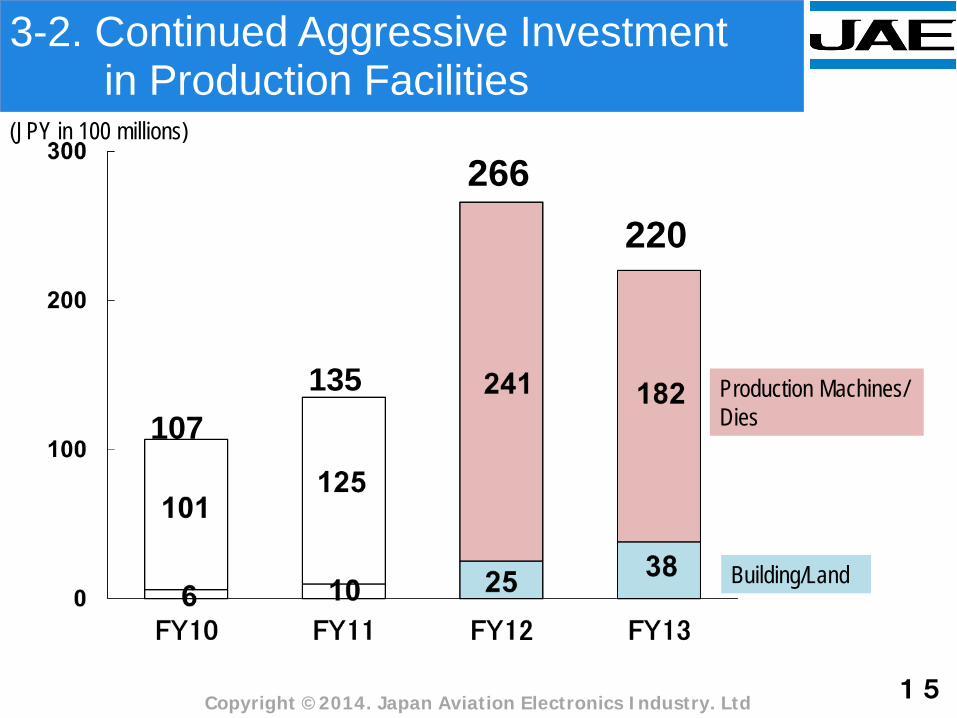
Building/Land
Production Machines/ Dies
135
266 220
3-2. Continued Aggressive Investment in Production Facilities
107
15
(JPY in 100 millions)

138 156 206
292
-115 -140
-281 -238
23 16
-75
54
-300
-200
-100
0
100
200
300
10 11 12 13 FY
3-3. Going into the black for FY2013 FCF, with the management of priority to C/F
Operating CF
Investment CF
Free CF
Copyright ©2014. Japan Aviation Electronics Industry. Ltd 16
(JPY in 100 millions)
Copyright ©2014. Japan Aviation Electronics Industry. Ltd
FY2014 Financial Projection
17
(From April 1, 2014 to March 31, 2015)

Copyright ©2014. Japan Aviation Electronics Industry. Ltd
Aiming to improve the record for volume of sales and profits
Adherence to the basic policy 1. Revenue increase through precise launching of
strategic products based on reinforcement of global marketing and technology development capacities
2. Reinforcement of earning power based on technology and production innovation centered around development of in-house production
3. Continuation of further growth investments leading to increased profitability
Prospects for FY2014 and relevant points
18
Copyright ©2014. Japan Aviation Electronics Industry. Ltd
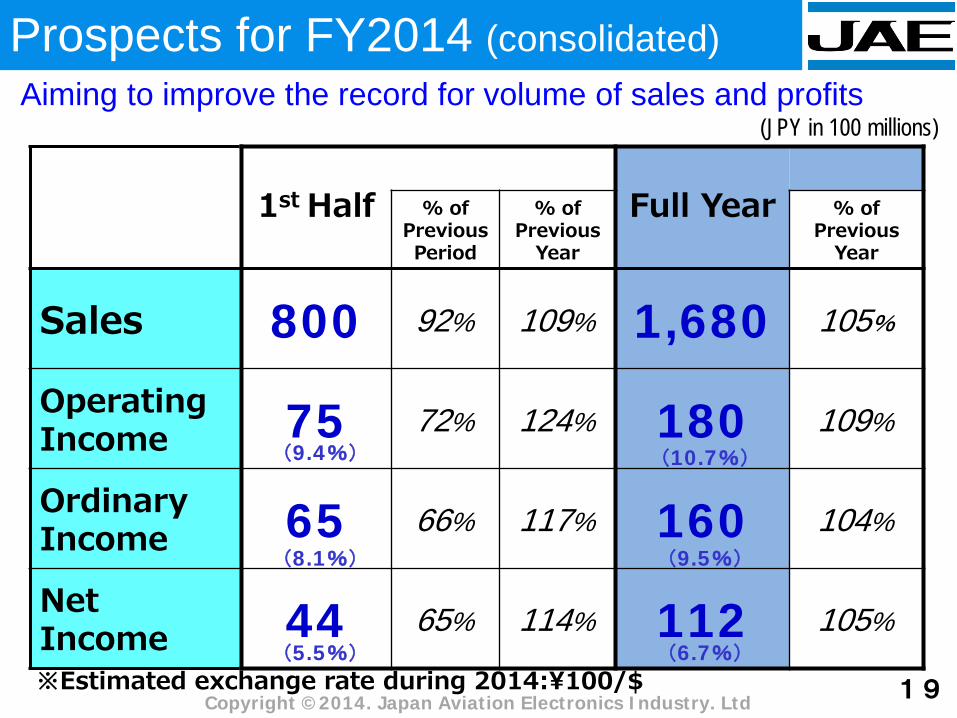
Prospects for FY2014 (consolidated) Aiming to improve the record for volume of sales and profits
1st Half Full Year % of Previous Period
% of Previous
Year
% of Previous
Year
Sales 800 92% 109% 1,680 105%
Operating Income 75 72% 124% 180 109%
Ordinary Income 65 66% 117% 160 104%
Net Income 44 65% 114% 112 105%
※Estimated exchange rate during 2014:¥100/$
(9.4%) (10.7%)
(8.1%) (9.5%)
(5.5%) (6.7%)
19
(JPY in 100 millions)

Copyright ©2014. Japan Aviation Electronics Industry. Ltd
Sales by Business Segment for FY2014 (consolidated)
1st Half Full Year % of Previous Period
% of Previous
Year
% of Previous
Year
Connector 700 94% 109% 1,460 106%
UIS ※ 35 98% 129% 75 119%
Aerospace 63 73% 105% 140 96%
Others 2 - - 5 -
Total 800 92% 109% 1,680 105%
Estimated
20 ※Integration of the electrostatic touch panel business into the UIS Line
(JPY in 100 millions)

Copyright ©2014. Japan Aviation Electronics Industry. Ltd
8. Sales Expansion in Three Major Market Segments
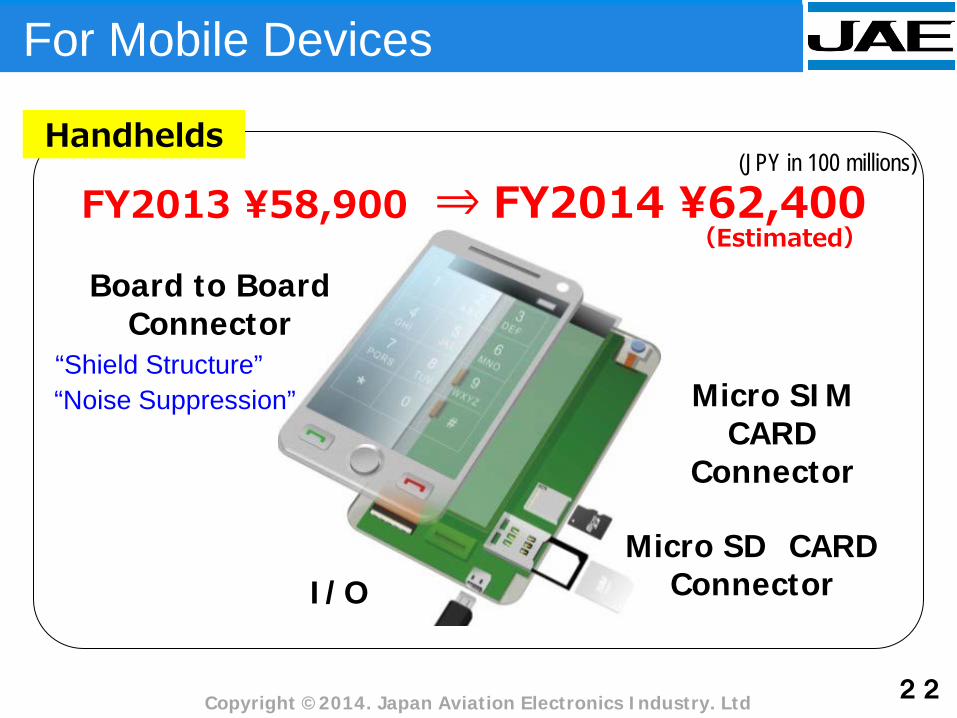
Handhelds
Automotive
Industrial & Infrastructure (I&I)
589 624 106%
525
265
591
286
FY2013 FY2014p Y/Y
21
113%
108%
Connector, UIS & Aerospace
Connector, UIS & Aerospace
Mainly Connector
(JPY in 100 millions) FY2014 90% of the volume of sales for the entire company
Copyright ©2014. Japan Aviation Electronics Industry. Ltd
Micro SD CARD Connector
Micro SIM CARD
Connector
Board to Board Connector
I/O
FY2013 ¥58,900 ⇒ FY2014 ¥62,400 Handhelds
For Mobile Devices
(Estimated)
“Shield Structure”
22
(JPY in 100 millions)
“Noise Suppression”

Copyright ©2014. Japan Aviation Electronics Industry. Ltd
Trends in acceptance for local smartphone market in China
11
Acceptance of orders: 2.3times increase compared to FY2012
23 12 13
Strengthening of sales bases
South China ・・・JAE Hong Kong ・・・JAE Hong Kong Shenzhen Rep office (March 14:office expansion) East China ・・・JAE Shanghai North China ・・・JAE Shanghai Beijing branch office
FY12:100
1H 2H 1H 2H 1H 2H
Development of local smartphone markets in China
Strengthening of systems with the objective of realizing steady growth and further expansion
FY

Copyright ©2014. Japan Aviation Electronics Industry. Ltd 24
For Automotive Automotive (incl. EV/HEV)
Resolver RD Converter
Capacitive Touch Panel
Connector/Sub-harness for Car Information/communication
Connector for Safety System
Connector for Body/Chassis System
Connector for Power Train System
FY2013 ¥52,500 ⇒ FY2014 ¥59,100 (Estimated)
(JPY in 100 millions)
Copyright ©2014. Japan Aviation Electronics Industry. Ltd
FY 25
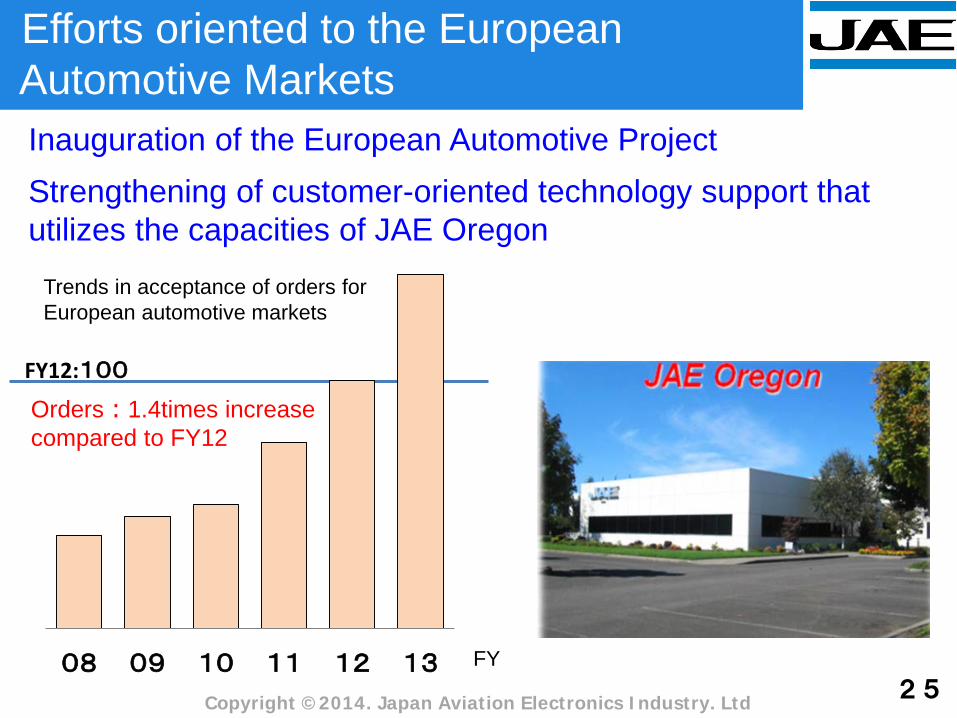
FY12:100
Trends in acceptance of orders for European automotive markets
08 09 10 11 12 13
Orders:1.4times increase compared to FY12
Efforts oriented to the European Automotive Markets
Inauguration of the European Automotive Project Strengthening of customer-oriented technology support that utilizes the capacities of JAE Oregon
Copyright ©2014. Japan Aviation Electronics Industry. Ltd 26
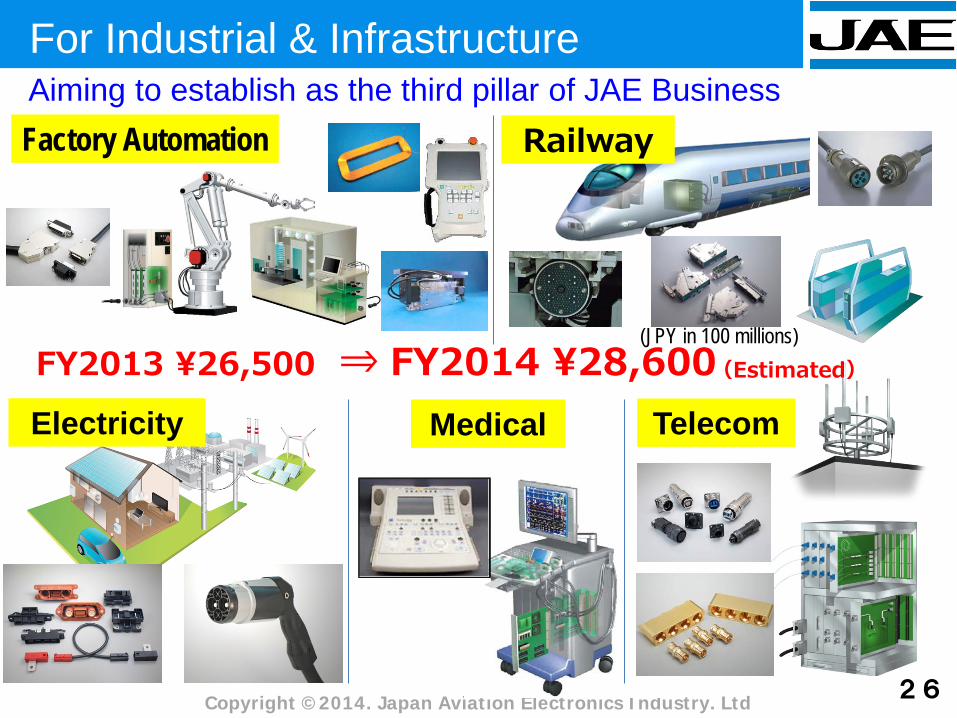
Factory Automation Railway
Electricity Medical Telecom
For Industrial & Infrastructure Aiming to establish as the third pillar of JAE Business
FY2013 ¥26,500 ⇒ FY2014 ¥28,600 (Estimated) (JPY in 100 millions)

Copyright ©2014. Japan Aviation Electronics Industry. Ltd 27
Strengthening of Industrial machinery & Infrastructure
Reforms in manufacturing of connectors for the industrial machinery and infrastructure markets
Substantial improvement in the operational time of NC machining equipment through utilization of robots (approximately double the conventional ratio)

Copyright ©2014. Japan Aviation Electronics Industry. Ltd
38 23
182 177
184 190
-200
-150
-100
-50
0
50
100
150
200
250
300
200
13 14 FY ( ):Lease costs
220
(1)
Building/Land
Production machines /
Dies
(0)
28
Continuation of proactive capital investments
Capital Investments
Depreciation
(JPY in 100 millions)

以上
以上
10. Mid-Term Financial Target
Copyright ©2014. Japan Aviation Electronics Industry. Ltd
1
2
29
Nets Sales 2,000JPY in 100 millions or more
Income before Income Tax 200 JPY in 100millions or more
Copyright ©2014. Japan Aviation Electronics Industry. Ltd
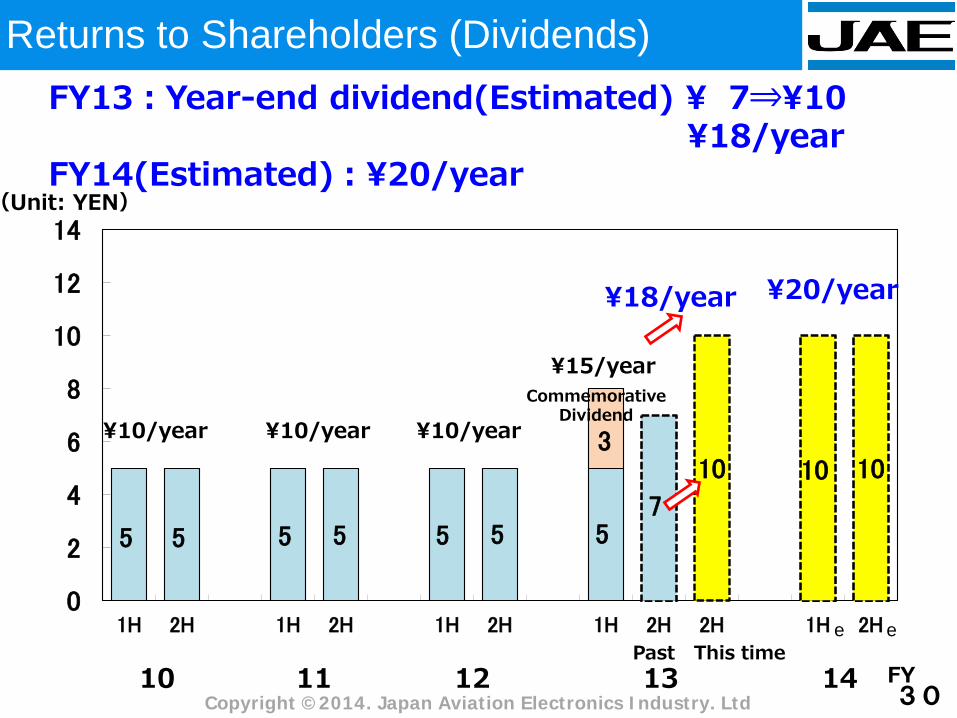
5 5 5 5 5 5 5 7
10 10 10 3
0
2
4
6
8
10
12
14
1H 2H 1H 2H 1H 2H 1H 2H 2H 1H 2H
10 12 11
(Unit: YEN)
¥10/year
13 14
FY13:Year-end dividend(Estimated) ¥ 7⇒¥10 ¥18/year FY14(Estimated):¥20/year
Commemorative Dividend
¥18/year
Past This time FY 30
Returns to Shareholders (Dividends)
e e
¥10/year ¥10/year
¥15/year
¥20/year

Copyright ©2014. Japan Aviation Electronics Industry. Ltd
31
<General Notes> The plans, strategies & results forecasts and targets for our company and our consolidated affiliates (hereinafter JAE) noted in these materials are forecasts and targets as of May 8, 2014, and include risks and uncertainties. The targets noted in these materials are not projections, and do not reflect current projections by the management team with regards to future results. Rather, these are targets to be attained by the management team through implementing business strategies. Note that actual results may differ greatly from forecasts and targets, etc. based on various factors. Major factors that affect actual business results, etc. are the political and economic situations in Japan, the US, Asia and so forth that involve regions where JAE conducts business operations, demand fluctuations for JAE products (including software products) in the market, deflationary pressures caused by severe competition, the ability to continue supplying over our competitors, the ability to expand business operations in overseas markets, changes to the laws and regulations concerning business activities, and their opacity, potential legal responsibilities, exchange rates, etc, and there may be other factors beyond the ones listed here. Actual results may differ from management targets and other forecasts due to a worsening global economy and the global financial situation, stagnation in the domestic and overseas stock markets, etc. Note that descriptions concerning projections are current as of that day. Although new risks and factors of uncertainty that occur at any anytime are evident, it is impossible to predict their occurrence or effects. In addition, details describing future predictions may not actually occur due to risk and uncertainties. Do not rely solely on these descriptions.