Embed Size (px)
Citation preview
Nippon Life Insurance Company
May 25, 2018
Financial Resul ts for the Fiscal Year Ended March 31 , 2018
Nippon Life Insurance Company (the “Company”; President: Hiroshi Shimizu) announces financial results for the
fiscal year ended March 31, 2018.
[Contents]
Financial Summary for the Fiscal Year Ended March 31, 2018
1. Business Highlights···································································································1
2. Overview of General Accounts Asset Management for the Fiscal Year Ended March 31, 2018···········4
3. Investment Management Performance (General Account) ······················································8
(1) Asset Composition ·······························································································8
(2) Increases/Decreases in Assets···················································································9
(3) Investment Income ····························································································· 10
(4) Investment Expenses ··························································································· 11
(5) Investment Indicators ·························································································· 12
(6) Net Valuation Gains/Losses on Trading Securities ························································ 13
(7) Fair Value Information of Securities (With Fair value, Other Than Trading Securities) ············· 13
(8) Fair Value Information of Assets Held in Trust ···························································· 14
4. Policies in Force by Type of Benefits as of March 31, 2018 ·················································· 15
5. Nonconsolidated Balance Sheets·················································································· 16
6. Nonconsolidated Statements of Income ·········································································· 37
7. Nonconsolidated Statements of Changes in Net Assets ························································ 41
8. Details of Ordinary Profit (Core Operating Profit) ····························································· 45
9. Nonconsolidated Proposed Appropriations of Surplus·························································· 47
10. Status of Nonperforming Assets According to Borrower’s Classification··································· 48
11. Status of Risk-Monitored Loans··················································································· 48
12. Breakdown of Allowance for Doubtful Accounts······························································· 49
13. Solvency Margin Ratio····························································································· 50
14. Status of Separate Accounts for the Fiscal Year Ended March 31, 2018 ···································· 51
15. Status of the Company, Subsidiaries, and Affiliates···························································· 54
Attached: Supplementary Materials for the Fiscal Year Ended March 31, 2018

1 Nippon Life Insurance Company
The Company will submit the financial results for the fiscal year ended March 31, 2018, for discussion at the 71st
annual meeting of the representatives of policyholders to be held on July 3, 2018. A summary of the results is
provided below.
1. Business Highlights
(1) Amount of Policies in Force and New Policies
Policies in Force
As of March 31, 2018 As of March 31, 2017
Number of policies Amount of policies Number of policies Amount of policies
(thousands) As a
percentage of
March 31,
2017 (%)
(100
million
yen)
As a percentage
of March 31,
2017 (%)
(thousands) As a
percentage of
March 31,
2016 (%)
(100 million
yen)
As a percentage
of March 31,
2016 (%)
Individual insurance 26,194 104.8 1,381,477 96.4 24,986 108.1 1,432,370 98.7
Individual annuities 3,886 102.1 235,809 101.5 3,805 108.0 232,306 106.5
Group insurance - - 955,119 101.3 - - 943,263 101.1
Group annuities - - 128,541 101.8 - - 126,254 102.0
Notes: 1. The amount of individual annuities is the total of (a) annuity resources at the start of annuity payments for policies prior to the start of annuity
payments and (b) policy reserves for policies after the start of annuity payments.
2. The amount of group annuities is the amount of the policy reserves.
New Policies
Year ended March 31, 2018 Year ended March 31, 2017
Number of policies Amount of policies Number of policies Amount of policies
(thousands) As a
percentage
of March
31, 2017
(%)
(100
million
yen)
As a
percentage
of March
31, 2017
(%)
New
policies
Net
increase
(decrease)
by
conversion
(thousands) As a
percentage
of March
31, 2016
(%)
(100
million
yen)
As a
percentage
of March
31, 2016
(%)
New
policies
Net
increase
(decrease)
by
conversion
Individual
insurance 3,322 84.8 52,143 61.2 58,130 (5,987) 3,915 88.8 85,187 90.6 89,819 (4,631)
Individual
annuities 222 52.2 13,685 54.1 13,579 106 425 190.6 25,275 172.8 25,099 175
Group
insurance ― ― 3,043 53.6 3,043
― ― 5,682 151.9 5,682
Group
annuities ― ― 3 9.9 3
― ― 36 226.0 36
Notes: 1. New policies include enrollment using the coverage enhancement system, and conversion indicates enrollment using the coverage revision system
and partial coverage revision system.
2. The number of policies includes policies that were converted into new policies.
3. The amount of new policies and net increase in policies by conversion for individual annuities represents annuity resources at the start of annuity
payments.
4. The amount of new policies for group annuities represents the first-time premium.

2 Nippon Life Insurance Company
(2) Annualized Net Premium
Policies in Force
(100 Million Yen, %)
As of March 31, 2018 As of March 31, 2017
As a percentage of
March 31, 2017
As a percentage of
March 31, 2016
Individual insurance 26,861 103.0 26,089 102.4
Individual annuities 9,795 102.7 9,538 108.2
Total 36,657 102.9 35,627 103.9
Medical coverages, living
benefits, and others 6,279 100.9 6,223 101.6
New Policies
(100 Million Yen, %)
Year ended March 31, 2018 Year ended March 31, 2017
As a percentage of
March 31, 2017
As a percentage of
March 31, 2016
Individual insurance 2,623 111.7 2,349 87.9
Individual annuities 598 53.7 1,114 200.3
Total 3,221 93.0 3,463 107.3
Medical coverages, living
benefits, and others 420 90.6 463 93.9
Notes: 1. The amount of annualized net premium is the annualized premium amount calculated by multiplying factors according to the premium payment
method to a single premium payment amount (for single payment policies, the amount is the total premium divided by the insured period).
2. The amount of medical coverages, living benefits, and others represents annualized premium related to medical benefits (hospitalization benefits
and surgical benefits), living benefits (specified illness benefits and nursing care benefits), and waiver of premium benefits (excluding disability
benefits alone, but including specified illness and nursing care benefits).
3. Annualized new policy net premium includes net increases due to conversions.
(3) Major Profit and Loss Items
(100 Million Yen, %)
Year ended March 31, 2018 Year ended March 31, 2017
As a percentage of
March 31, 2017
As a percentage of
March 31, 2016
Revenues from insurance and
reinsurance 44,884 96.6 46,473 76.4
Investment income 16,526 99.4 16,619 110.8
Benefits and other payments 36,631 103.8 35,292 94.1
Investment expenses 3,242 83.6 3,880 179.1
Ordinary profit 4,104 89.5 4,584 85.3

3 Nippon Life Insurance Company
(4) Proposed Appropriations of Surplus
(100 Million Yen, %)
Year ended March 31, 2018 Year ended March 31, 2017
As a percentage of
March 31, 2017
As a percentage of
March 31, 2016
Current-year unappropriated surplus 2,482 101.2 2,453 84.0
Reserve for dividends to policyholders 2,183 118.6 1,840 80.1
Net surplus after deduction 695 87.1 798 127.0
(5) Total Assets
(100 Million Yen, %)
As of March 31, 2018 As of March 31, 2017
As a percentage of
March 31, 2017
As a percentage of
March 31, 2016
Total assets 664,726 102.6 648,140 102.1

4 Nippon Life Insurance Company
2. Overview of General Accounts Asset Management for the Fiscal Year Ended March 31, 2018
(1) Investment Environment
In the fiscal year ended March 31, 2018, the Japanese economy tracked a steady recovery path, notably
achieving positive GDP growth for eight consecutive quarters, supported by a robust corporate sector against
the backdrop of a solid global economy and an upturn in consumer spending due to an improving
employment environment.
The Nikkei Stock Average started the fiscal year at ¥18,909. Subsequently, the index saw some
unsteady movements due to concerns about the North Korea situation, the French presidential
election, and certain other factors. However, against the backdrop of favorable corporate earnings, the
index temporarily reached the ¥24,000 level in January. Thereafter, the markets experienced a global
stock price correction amid an increase in U.S. long-term interest rates in line with heightened
concerns about inflation and worsening public finances in the United States. Consequently, the index
finished at ¥21,454 at the end of March.
The yield rate on 10-year government bonds started the fiscal year at 0.07%. As the Bank of Japan
maintained its policy of quantitative and qualitative monetary easing with yield curve control, the
yield rate was range bound between about 0.0% and 0.1%. The yield rate trended at a low level
throughout the year, finishing at 0.04% at the end of March.
The yen-U.S. dollar exchange rate started the fiscal year at the ¥112 level. Thereafter, the rate
remained bound to the range of ¥107 to ¥114 in response to speculation about exit strategies for
monetary policy in Europe and the United States, risks associated with North Korea, and certain other
factors. From February onward, the yen headed to a stronger level due to increased moves to avoid
risk following a global stock price correction. The yen-U.S. dollar exchange rate finished at ¥106.24
at the end of March.
The yen-euro exchange rate started the fiscal year at the ¥119 level. Subsequently, in response to a
sense of caution about the French presidential election, the yen appreciated to the ¥114 level in April.
Thereafter, the yen temporarily depreciated to the ¥137 level against the backdrop of diminished
European political risks, stronger expectations for a tightening of monetary policy by the European
Central Bank, and certain other factors. From February onward, the yen headed toward a stronger
level due to increased moves to avoid risk. The yen-euro rate finished at ¥130.52 at the end of March.
(2) Investment Policy
The Company’s general account assets increased by ¥1,680.3 billion compared to the end of the fiscal year
ended March 31, 2017, totaling ¥65,178.5 billion as of March 31, 2018 (2.6% increase compared to the
previous fiscal year-end).
The Company has positioned yen-denominated assets that can be expected to provide stable income, such as
bonds, as its core assets. From the perspective of improving profits in the mid- to long-term, the Company
invested in assets such as stocks and foreign securities within the scope of acceptable risk while taking into
account business stability.

5 Nippon Life Insurance Company
Considering the low interest rate environment, the Company limited the additional accumulation of
outstanding domestic bond balances.
The Company focused on safe and stable prime lending by accurately assessing credit risks.
For domestic stocks, the Company strove to enhance the profitability of its portfolio by replacing certain
stocks, while focusing the Company’s attention on the overall state, including corporate profitability and
dividends from the point of view of investing for the mid- to long-term.
Regarding foreign securities, the Company invested in foreign currency-denominated bonds based on
currency movements. Also, the Company invested in foreign bonds with foreign exchange hedges, taking
into consideration the advantages against other yen interest rate assets.
(3) Status of Investment Income/Expense
Investment income was ¥1,603.0 billion, decrease from ¥1,626.8 billion in the fiscal year ended March 31,
2017. The decrease mainly reflected a decrease in gain on sales of domestic stocks.
Investment expenses amounted to ¥324.2 billion, decrease from ¥388.0 billion in the fiscal year ended March
31, 2017. This decrease mainly reflected a decrease in loss on sales, primarily of foreign securities.
As a result, the Company’s net investment income balance increased by ¥39.9 billion, compared to the same
period of the previous fiscal year, to ¥1,278.8 billion.
(4) Investment Risk Management
Investment risk refers to the risk of incurring losses when the value of the Company’s assets and liabilities
fluctuates. It can be categorized into market risk, credit risk, and real estate investment risk. The long-term
nature of life insurance policies requires a long-term approach based on liability characteristics to managing
risks associated with investment. Hence, we seek to manage our portfolio efficiently based on risk-return
analyses that emphasize the importance of generating investment returns over the medium and long terms.
The Company has, therefore, established an Investment Risk Management Department within the Risk
Management Department and, by maintaining and upgrading its rigorous system for managing risks, the
Company seeks to limit losses to acceptable levels while pursuing stable returns.
a. Market risk management
Market risk refers to the risk of incurring losses when the fair value of invested assets and liabilities
fluctuates due to such factors as fluctuations in interest rates, exchange rates, or stock prices. To avoid
excessive losses from financing and investment transactions, the Company manages market risk by
setting and monitoring investment limits for each type of asset and holding purpose as necessary. In
doing so, the Company strives to build a portfolio that gives due consideration to the diversification of
risk. In addition, to control the market risk of the Company’s portfolio, the Company reasonably
calculates the market value-at-risk and conducts appropriate asset allocation within acceptable
boundaries of risk.

6 Nippon Life Insurance Company
b. Credit risk management
Credit risk refers to the risk of incurring losses when the value of assets, primarily loans and bonds,
declines due to deterioration of the financial condition of the party to whom credit has been extended.
In managing credit risk, the Company continues to build a sound portfolio by rigorous examinations of
each transaction by the Credit Department, which is independent of the departments handling investment
and finance activities, setting terms appropriate to the level of credit risk involved, and setting and
monitoring credit ceilings to ensure that credit risk is not excessively concentrated in a particular
company, group, or country. In addition, the Company calculates credit value-at-risk as a measurement of
the magnitude of credit risk across the Company’s portfolio as a whole and monitors whether the
magnitude of risk stays within an appropriate range.
c. Real estate investment risk management
Real estate investment risk refers to the risk of reduced returns caused by such factors as rent decline as
well as incurring losses when real estate values decline due to market deterioration and other factors. The
Company’s approach to managing real estate investment risk involves the rigorous examination of each
investment by the Credit Department, which is independent of the departments handling investment and
finance activities. The Company also adheres to a system involving warning levels for investment returns
and prices. This enables the Company to appropriately focus management efforts on properties with low
profitability.
(5) Asset Liability Management
For life insurance companies to carry out stable management in the long term, it is important to use the Asset
Liability Management (ALM) approach as a basis for understanding the situation of liabilities that pay future
insurance benefits (policy reserves) and investment assets, as well as for adjusting investment periods. The
Company analyzes and evaluates liability cash flows, risk of falling short of assumed interest rates, and level
of allowed risk for each product, and decides the mid- to long-term investment plan at the Managing
Directors’ Meetings and the Risk Management Committee Meetings.
(6) Self-Assessment and Allowance for Doubtful Accounts
Asset self-assessment refers to evaluating individual assets based on the financial condition of each borrower
and its collateral. Assets are classified into four categories (noncategorized, II, III, or IV).
To ensure the objectivity of the self-assessment process, the Company has established a highly reliable
framework that includes:
Strict assessment standards based on the Inspection Manual for Insurance Companies of the
Financial Services Agency
Internal audit by the Auditing Department, which is independent from the groups handling the actual
assessment
External audit by external auditors (certified public accountants)

7 Nippon Life Insurance Company
In the fiscal year ended March 31, 2018, the Company recorded an appropriate allowance for doubtful
accounts according to the same allowance standards as the previous fiscal year.
Allowance for doubtful accounts standard:
Normal: General allowance for doubtful accounts based on actual loan losses in the previous fiscal year.
On caution: General allowance for doubtful accounts based on the accumulated actual loan loss ratio (ratio of
losses incurred from loans within three years from a certain date) for the previous three fiscal years.
Substandard: Corporate loans are divided into two categories: those that are not secured by collateral and
guarantees and others, and the actual loan loss ratio is calculated.
For doubtful, quasi-bankrupt, and bankrupt loans, the necessary amount, concerning the balance calculated by
subtracting the estimated collectible amount based on collateral and guarantees from total loans, is provided
as a specific allowance for doubtful accounts. The portion of the amount in “Category IV” is directly
deducted from total loans.

8 Nippon Life Insurance Company
3. Investment Management Performance (General Account)
(1) Asset Composition
(100 Million Yen, %)
As of March 31, 2018 As of March 31, 2017
Amount % Amount %
Cash, deposits, and call loans 10,634 1.6 10,779 1.7
Receivables under resale agreements ― ― ― ―
Receivables under securities borrowing transactions ― ― ― ―
Monetary receivables purchased 2,782 0.4 3,262 0.5
Proprietary trading securities ― ― ― ―
Assets held in trust 104 0.0 33 0.0
Investments in securities: 537,443 82.5 518,715 81.7
Domestic bonds 223,813 34.3 224,601 35.4
Domestic stocks 93,588 14.4 86,952 13.7
Foreign securities: 193,710 29.7 188,550 29.7
Foreign bonds 144,335 22.1 143,794 22.6
Foreign stocks and other securities 49,375 7.6 44,756 7.0
Other securities 26,330 4.0 18,610 2.9
Loans: 74,683 11.5 77,495 12.2
Policy loans 6,190 0.9 6,547 1.0
Industrial and consumer loans 68,492 10.5 70,948 11.2
Real estate: 16,073 2.5 16,192 2.6
Investment property 10,105 1.6 10,223 1.6
Deferred tax assets ― ― ― ―
Other assets 10,087 1.5 8,531 1.3
Allowance for doubtful accounts (24) (0.0) (28) (0.0)
Total assets (general account): 651,785 100.0 634,982 100.0
Foreign currency-denominated assets 180,158 27.6 170,361 26.8
Notes: 1. The above assets include cash received as collateral under securities lending transactions. Cash collateral received through these transactions is also
recorded in liabilities as cash received as collateral under securities lending transactions (¥330.7 billion and ¥674.0 billion as of March 31, 2018
and 2017, respectively).
2. Real estate amount is the sum of land, buildings, and construction in progress.

9 Nippon Life Insurance Company
(2) Increases/Decreases in Assets
(100 Million Yen)
Year ended March 31, 2018 Year ended March 31, 2017
Cash, deposits, and call loans (144) 741
Receivables under resale agreements ― ―
Receivables under securities borrowing transactions ― ―
Monetary receivables purchased (480) (936)
Proprietary trading securities ― ―
Assets held in trust 70 14
Investments in securities: 18,727 17,378
Domestic bonds (788) (8,946)
Domestic stocks 6,636 5,875
Foreign securities: 5,159 16,969
Foreign bonds 540 9,543
Foreign stocks and other securities 4,619 7,425
Other securities 7,720 3,479
Loans: (2,811) (3,719)
Policy loans (356) (411)
Industrial and consumer loans (2,455) (3,307)
Real estate: (119) (586)
Investment property (118) (573)
Deferred tax assets ― ―
Other assets 1,556 1,325
Allowance for doubtful accounts 4 6
Total assets (general account): 16,803 14,223
Foreign currency-denominated assets 9,796 18,578
Notes: 1. Increases/decreases in cash received as collateral under securities lending transactions are as follows:
¥(343.3) billion and ¥12.2 billion for the fiscal years ended March 31, 2018 and 2017, respectively.
2. Real estate amount is the sum of land, buildings, and construction in progress.

10 Nippon Life Insurance Company
(3) Investment Income
(100 Million Yen)
Year ended March 31, 2018 Year ended March 31, 2017
Interest, dividends, and other income: 14,073 13,656
Interest on deposits and savings 4 0
Interest on securities and dividends 11,839 11,278
Interest on loans 1,300 1,411
Real estate rental income 802 844
Other income 126 120
Gain on proprietary trading securities ― ―
Gain from assets held in trust, net ― ―
Gain on trading securities ― ―
Gain on sales of securities: 1,796 2,540
Gain on sales of domestic bonds, including national
government bonds 124 275
Gain on sales of domestic stocks and other securities 1,309 1,941
Gain on sales of foreign securities 362 322
Other gains ― ―
Gain on redemptions of securities 149 58
Gain on derivative financial instruments, net ― ―
Foreign exchange gains, net ― ―
Reversal of allowance for doubtful accounts 4 7
Reversal of allowance for investment loss ― ―
Other investment income 5 7
Total 16,030 16,268

11 Nippon Life Insurance Company
(4) Investment Expenses (100 Million Yen)
Year ended March 31, 2018 Year ended March 31, 2017
Interest expenses 219 189
Loss on proprietary trading securities ― ―
Loss from assets held in trust, net 32 19
Loss on trading securities ― ―
Loss on sales of securities: 1,028 1,187
Loss on sales of domestic bonds, including national
government bonds 5 11
Loss on sales of domestic stocks and other securities 77 81
Loss on sales of foreign securities 945 1,093
Other losses ― 0
Loss on valuation of securities: 112 277
Loss on valuation of domestic bonds, including national
government bonds ― ―
Loss on valuation of domestic stocks and other
securities 2 136
Loss on valuation of foreign securities 108 140
Other losses 1 0
Loss on redemptions of securities 233 329
Loss on derivative financial instruments, net 1,058 1,191
Foreign exchange losses, net 95 12
Provision for allowance for doubtful accounts ― ―
Provision for allowance for investment loss 29 252
Write-offs of loans ― ―
Depreciation of rental real estate and other assets 148 153
Other investment expenses 283 266
Total 3,242 3,880

12 Nippon Life Insurance Company
(5) Investment Indicators
1) Yield on primary assets (%)
Year ended March 31, 2018 Year ended March 31, 2017
Cash, deposits, and call loans 0.04 (0.00)
Receivables under resale agreements ― ―
Receivables under securities borrowing transactions ― ―
Monetary receivables purchased 1.88 2.00
Proprietary trading securities ― ―
Assets held in trust (32.68) (94.29)
Investments in securities: 2.42 2.35
Domestic bonds 1.81 1.93
Domestic stocks 7.02 7.54
Foreign securities 2.12 1.57
Foreign bonds 1.51 1.12
Foreign stocks and other securities 4.12 3.31
Loans: 1.67 1.76
Industrial and consumer loans 1.39 1.50
Real estate: 2.70 2.89
Investment property 4.29 4.51
General account total: 2.20 2.19
Overseas investments 2.07 1.58
Notes: 1. Yields are calculated by dividing investment income less investment expenses by the daily average book value balance.
2. The amount of overseas investments is the sum of assets denominated in foreign currencies and yen.
2) Daily average balance (100 Million Yen)
Year ended March 31, 2018 Year ended March 31, 2017
Cash, deposits, and call loans 4,459 4,066
Receivables under resale agreements ― ―
Receivables under securities borrowing transactions ― ―
Monetary receivables purchased 2,906 3,596
Proprietary trading securities ― ―
Assets held in trust 100 20
Investments in securities: 464,381 446,708
Domestic bonds 221,770 226,389
Domestic stocks 44,452 43,736
Foreign securities 177,990 161,610
Foreign bonds 136,906 128,191
Foreign stocks and other securities 41,083 33,419
Loans: 76,522 80,214
Industrial and consumer loans 70,177 73,476
Real estate: 16,156 16,633
Investment property 10,175 10,654
General account total: 580,870 566,887
Overseas investments 185,518 167,557
13 Nippon Life Insurance Company
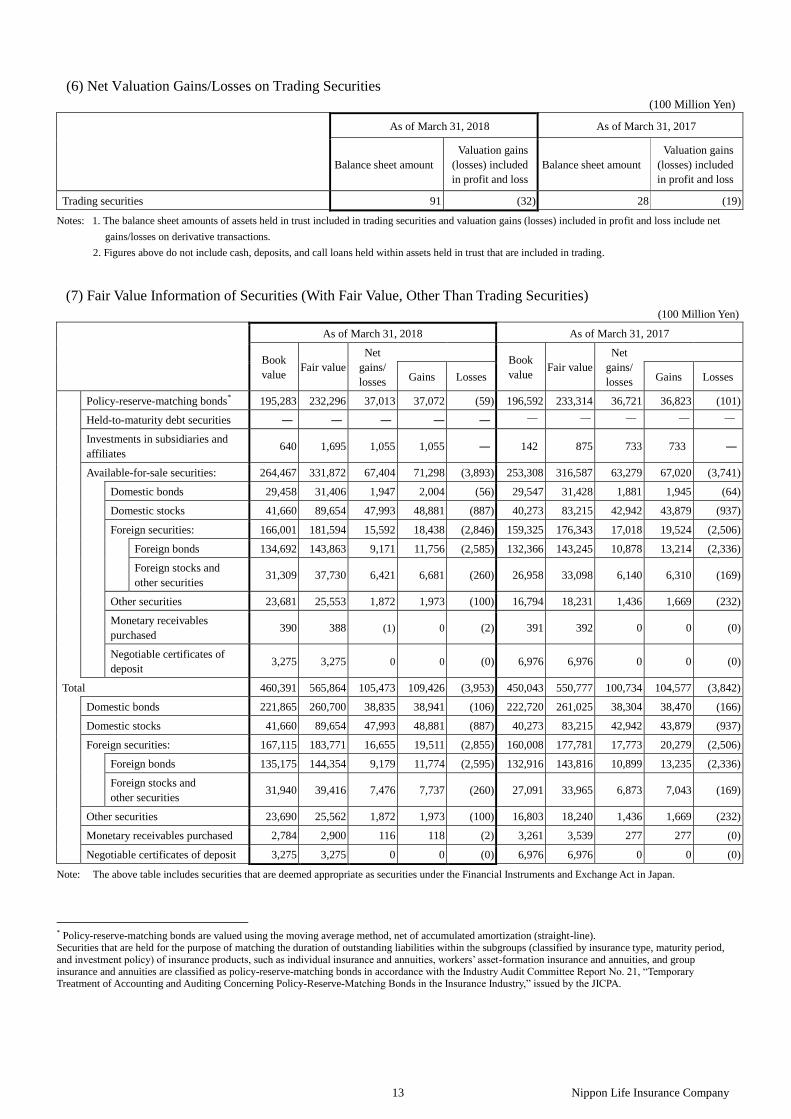
(6) Net Valuation Gains/Losses on Trading Securities
(100 Million Yen)
As of March 31, 2018 As of March 31, 2017
Balance sheet amount
Valuation gains
(losses) included
in profit and loss
Balance sheet amount
Valuation gains
(losses) included
in profit and loss
Trading securities 91 (32) 28 (19)
Notes: 1. The balance sheet amounts of assets held in trust included in trading securities and valuation gains (losses) included in profit and loss include net
gains/losses on derivative transactions.
2. Figures above do not include cash, deposits, and call loans held within assets held in trust that are included in trading.
(7) Fair Value Information of Securities (With Fair Value, Other Than Trading Securities)
(100 Million Yen)
As of March 31, 2018 As of March 31, 2017
Book
value Fair value
Net
gains/
losses
Book
value Fair value
Net
gains/
losses
Gains Losses Gains Losses
Policy-reserve-matching bonds* 195,283 232,296 37,013 37,072 (59) 196,592 233,314 36,721 36,823 (101)
Held-to-maturity debt securities ― ― ― ― ― - - - - -
Investments in subsidiaries and
affiliates 640 1,695 1,055 1,055 ― 142 875 733 733 ―
Available-for-sale securities: 264,467 331,872 67,404 71,298 (3,893) 253,308 316,587 63,279 67,020 (3,741)
Domestic bonds 29,458 31,406 1,947 2,004 (56) 29,547 31,428 1,881 1,945 (64)
Domestic stocks 41,660 89,654 47,993 48,881 (887) 40,273 83,215 42,942 43,879 (937)
Foreign securities: 166,001 181,594 15,592 18,438 (2,846) 159,325 176,343 17,018 19,524 (2,506)
Foreign bonds 134,692 143,863 9,171 11,756 (2,585) 132,366 143,245 10,878 13,214 (2,336)
Foreign stocks and
other securities 31,309 37,730 6,421 6,681 (260) 26,958 33,098 6,140 6,310 (169)
Other securities 23,681 25,553 1,872 1,973 (100) 16,794 18,231 1,436 1,669 (232)
Monetary receivables
purchased 390 388 (1) 0 (2) 391 392 0 0 (0)
Negotiable certificates of
deposit 3,275 3,275 0 0 (0) 6,976 6,976 0 0 (0)
Total 460,391 565,864 105,473 109,426 (3,953) 450,043 550,777 100,734 104,577 (3,842)
Domestic bonds 221,865 260,700 38,835 38,941 (106) 222,720 261,025 38,304 38,470 (166)
Domestic stocks 41,660 89,654 47,993 48,881 (887) 40,273 83,215 42,942 43,879 (937)
Foreign securities: 167,115 183,771 16,655 19,511 (2,855) 160,008 177,781 17,773 20,279 (2,506)
Foreign bonds 135,175 144,354 9,179 11,774 (2,595) 132,916 143,816 10,899 13,235 (2,336)
Foreign stocks and
other securities 31,940 39,416 7,476 7,737 (260) 27,091 33,965 6,873 7,043 (169)
Other securities 23,690 25,562 1,872 1,973 (100) 16,803 18,240 1,436 1,669 (232)
Monetary receivables purchased 2,784 2,900 116 118 (2) 3,261 3,539 277 277 (0)
Negotiable certificates of deposit 3,275 3,275 0 0 (0) 6,976 6,976 0 0 (0)
Note: The above table includes securities that are deemed appropriate as securities under the Financial Instruments and Exchange Act in Japan.
* Policy-reserve-matching bonds are valued using the moving average method, net of accumulated amortization (straight-line). Securities that are held for the purpose of matching the duration of outstanding liabilities within the subgroups (classified by insurance type, maturity period, and investment policy) of insurance products, such as individual insurance and annuities, workers’ asset-formation insurance and annuities, and group insurance and annuities are classified as policy-reserve-matching bonds in accordance with the Industry Audit Committee Report No. 21, “Temporary Treatment of Accounting and Auditing Concerning Policy-Reserve-Matching Bonds in the Insurance Industry,” issued by the JICPA.

14 Nippon Life Insurance Company
[Book Value of Securities of which the Fair Value is extremely difficult to be determined]
(100 Million Yen)
As of March 31, 2018 As of March 31, 2017
Policy-reserve-matching bonds ― ―
Held-to-maturity debt securities: ― ―
Unlisted foreign bonds ― ―
Others ― ―
Investments in subsidiaries and affiliates 8,954 8,234
Available-for-sale securities: 6,695 7,243
Unlisted domestic stocks
(excluding over-the-counter stocks) 549 551
Unlisted foreign stocks
(excluding over-the-counter stocks) 3,170 4,282
Unlisted foreign bonds ― ―
Others 2,975 2,410
Total 15,649 15,478
Note: Of securities of which the fair value is extremely difficult to be determined, the net gains on currency exchange valuation of assets denominated in
foreign currencies were as follows:
¥7.5 billion and ¥46.7 billion as of March 31, 2018 and 2017, respectively.
(8) Fair Value Information of Assets Held in Trust
(100 Million Yen)
As of March 31, 2018 As of March 31, 2017
Balance sheet
amount Fair value
Net gains/losses Balance
sheet amount Fair value
Net gains/losses
Gains Losses Gains Losses
Assets held in trust 104 104 - - - 33 33 - - -
Notes: 1. Fair value is based on a reasonably calculated price by the trustee of the assets held in trust.
2. The balance sheet amount includes net gains/losses on derivative transactions within assets held in trust.
Assets Held in Trust for Trading Purposes
(100 Million Yen)
As of March 31, 2018 As of March 31, 2017
Balance sheet amount
Valuation gains
(losses)
included in
profit and loss
Balance sheet amount
Valuation gains
(losses)
included in
profit and loss
Assets held in trust for trading purposes 104 (32) 33 (19)
Note: The balance sheet amounts and valuation gains (losses) included in profit and loss include net gains/losses on derivative transactions.
Assets Held in Trust Classified as Policy-Reserve-Matching, Held-to-Maturity, and Available-for-Sale
No ending balance as of March 31, 2018 or 2017.

15 Nippon Life Insurance Company
4. Policies in Force by Type of Benefits as of March 31, 2018
Individual insurance Individual annuities Group insurance Total
Number of
policies
(thousands)
Amount
(100 million
yen)
Number of
policies
(thousands)
Amount
(100 million
yen)
Number of
policies
(thousands)
Amount
(100 million
yen)
Number of
policies
(thousands)
Amount
(100 million
yen)
Death protection
General 25,877 1,373,435 ― ― 27,464 954,973 53,342 2,328,408
Disaster 2,840 237,259 88 1,791 2,798 32,351 5,727 271,402
Others 164 1,931 ― ― 69 1,232 233 3,164
Pure endowment 317 8,041 3,886 235,809 8 146 4,212 243,997
Hospitalization
coverage
Disaster 6,556 420 258 11 1,388 13 8,203 446
Illness 6,547 419 255 11 ― ― 6,803 431
Others 6,609 453 57 2 58 0 6,725 455
Disability coverage 7,163 ― 64 ― 2,507 ― 9,735 ―
Surgical coverage 9,851 ― 256 ― ― ― 10,107 ―
Group annuities Workers’ asset-formation
insurance/annuities Total
Number of
policies
(thousands)
Amount
(100 million yen)
Number of
policies
(thousands)
Amount
(100 million yen)
Number of
policies
(thousands)
Amount
(100 million yen)
Pure endowment 9,344 128,541 177 4,519 9,522 133,061
Medical care insurance
Disability income insurance
Number of
policies
(thousands)
Amount
(100 million yen)
Number of
policies
(thousands)
Amount
(100 million yen)
Hospitalization coverage 823 36 Disability income coverage 762 413
Notes: 1. The number of policies for “Group insurance,” “Group annuities,” “Workers’ asset-formation insurance/annuities,” “Medical care insurance”
(group type), and “Disability income insurance” represents the number of insureds.
2. The amount in “Pure endowment” for “Individual annuities,” “Group insurance” (annuity riders), and “Workers’ asset-formation annuities”
(excluding workers’ asset-formation savings annuities) represents the total of (a) annuity resources at the start of the annuities for policies bound
prior to the start of the annuity payments and (b) policy reserves for policies bound after the start of the annuity payments. The amount in “Pure
endowment” for “Group annuities,” “Workers’ asset-formation insurance,” and workers’ asset-formation savings annuities represents the amount of
corresponding policy reserves.
3. The amount in “Hospitalization coverage” represents the amount of daily hospitalization benefits.
4. The amount in “Hospitalization coverage” of medical care insurance represents the amount related to hospitalization from illness.
5. The amount in disability income insurance represents the amount of monthly disability benefit payments.
6. The number of insureds and amount of policies for reinsurance written were 37,000 people and ¥38.2 billion, respectively.

16 Nippon Life Insurance Company
5. Nonconsolidated Balance Sheets
(Million Yen)
As of March 31, 2018 As of March 31, 2017
Assets:
Cash and deposits:
Cash
Deposits
834,511
283
834,227
917,055
270
916,784
Call loans 471,113 270,000
Monetary receivables purchased 278,235 326,256
Assets held in trust 10,421 3,397
Investments in securities: 54,703,507 53,025,060
National government bonds 19,842,086 19,724,839
Local government bonds 883,461 959,375
Corporate bonds 2,089,678 2,290,236
Domestic stocks 9,521,609 8,879,181
Foreign securities
Other securities
19,661,925
2,704,745
19,201,698
1,969,730
Loans: 7,468,329 7,749,527
Policy loans 619,030 654,701
Industrial and consumer loans 6,849,298 7,094,826
Tangible fixed assets:
Land
Buildings
Lease assets
Construction in Progress
Other tangible fixed assets
1,630,859
1,089,297
475,516
12,669
42,550
10,825
1,641,001
1,107,241
471,770
11,738
40,283
9,968
Intangible fixed assets:
Software
Other intangible fixed assets
185,042
81,985
103,057
173,302
80,949
92,353
Reinsurance receivables 512 523
Other assets:
Accounts receivable
Prepaid expenses
Accrued income
Money on deposit
Deposits for futures transactions
Futures transactions variation margin
Derivative financial instruments
Suspense
Other assets
868,603
191,009
15,594
300,306
34,000
20,562
7
258,631
10,802
37,686
691,712
79,970
13,651
279,876
34,280
10,371
34
218,327
20,412
34,789
Customers’ liability for acceptances and guarantees 52,065 44,267
Allowance for doubtful accounts (2,401) (2,882)
Allowance for investment loss (28,138) (25,219)
Total assets 66,472,661 64,814,005

17 Nippon Life Insurance Company
5. Nonconsolidated Balance Sheets (Continued)
(Million Yen)
As of March 31, 2018 As of March 31, 2017
Liabilities:
Policy reserves and other reserves:
Reserve for outstanding claims
Policy reserves
Reserve for dividends to policyholders
Reinsurance payables
Corporate bonds
Other liabilities:
Payables under repurchase agreements
Cash received as collateral under securities lending transactions
Loans payable
Income taxes payable
Accounts payable
Accrued expenses
Deferred income
Deposits received
Guarantee deposits received
Futures transactions variation margin
Derivative financial instruments
Cash collateral received for financial instruments
Lease obligations
Asset retirement obligations
Suspense received
Other liabilities
Accrued bonuses for directors and audit and supervisory board members
Accrued retirement benefits
Accrued retirement benefits for directors and audit and supervisory board
members
Reserve for program points
Reserve for price fluctuations in investments in securities
Deferred tax liabilities
Deferred tax liabilities for land revaluation
Acceptances and guarantees
55,021,894
285,702
53,741,024
995,167
594
1,028,889
1,466,056
237,046
330,722
22,897
37,406
199,866
64,810
17,399
105,494
77,870
9
156,536
191,976
12,059
2,192
9,768
―
90
361,114
4,840
9,411
1,282,194
577,415
104,828
52,065
53,999,143
347,747
52,650,294
1,001,102
605
840,825
1,567,152
―
674,067
26,649
8,020
195,211
63,839
19,100
102,065
78,799
17
270,838
103,383
11,835
2,191
11,085
48
79
358,630
4,498
9,013
1,116,795
563,323
106,432
44,267
Total liabilities 59,909,395 58,610,767

18 Nippon Life Insurance Company
5. Nonconsolidated Balance Sheets (Continued)
(Million Yen)
As of March 31, 2018 As of March 31, 2017
Net assets:
Foundation funds 150,000 150,000
Reserve for redemption of foundation funds 1,200,000 1,150,000
Reserve for revaluation 651 651
Surplus: 450,600 440,635
Legal reserve for deficiencies 16,804 16,042
Other surplus reserves: 433,796 424,593
Equalized reserve for dividends to policyholders 40,000 50,000
Contingency funds 71,917 71,917
Reserve for social public welfare assistance 351 328
Reserve for reduction entry of real estate 49,708 51,196
Reserve for reduction entry of real estate to be purchased 23,422 5,643
Other reserves 170 170
Unappropriated surplus 248,227 245,337
Total foundation funds and others 1,801,251 1,741,286
Net unrealized gains on available-for-sale securities 4,882,103 4,585,298
Deferred losses on derivatives under hedge accounting (59,099) (65,262)
Land revaluation losses (60,989) (58,084)
Total valuations, conversions, and others 4,762,014 4,461,951
Total net assets 6,563,265 6,203,237
Total liabilities and net assets 66,472,661 64,814,005
19 Nippon Life Insurance Company
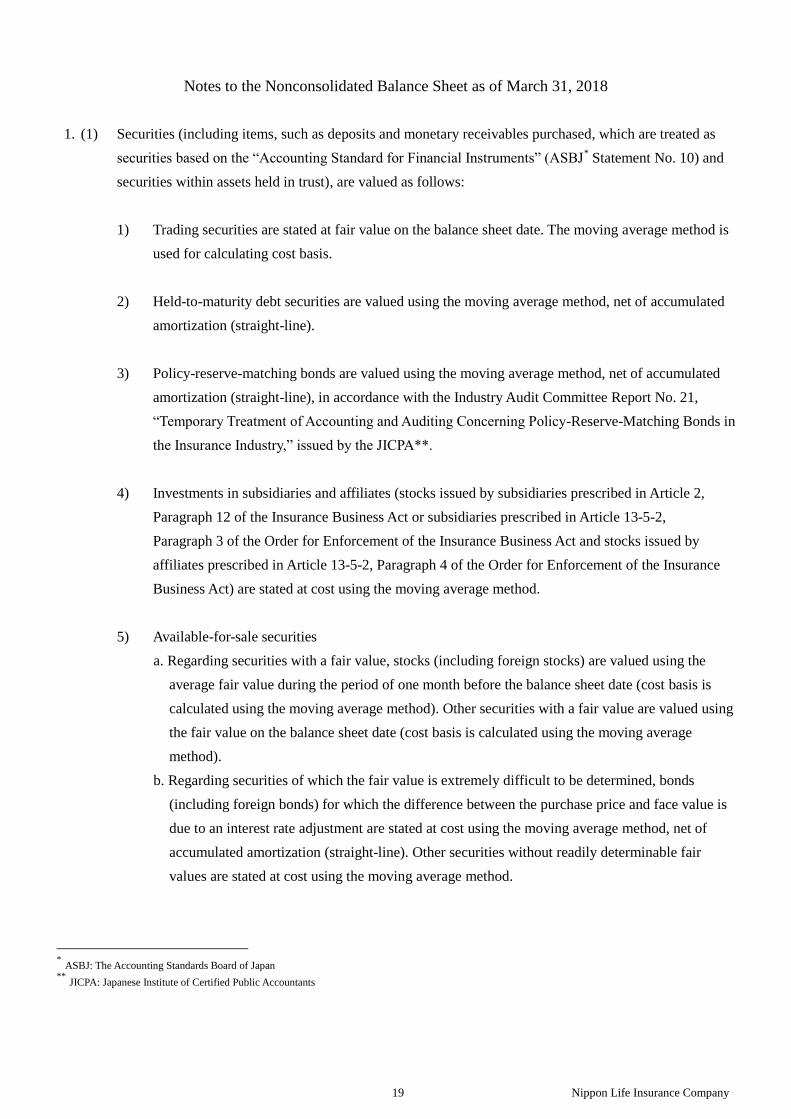
Notes to the Nonconsolidated Balance Sheet as of March 31, 2018
1. (1) Securities (including items, such as deposits and monetary receivables purchased, which are treated as
securities based on the “Accounting Standard for Financial Instruments” (ASBJ* Statement No. 10) and
securities within assets held in trust), are valued as follows:
1) Trading securities are stated at fair value on the balance sheet date. The moving average method is
used for calculating cost basis.
2) Held-to-maturity debt securities are valued using the moving average method, net of accumulated
amortization (straight-line).
3) Policy-reserve-matching bonds are valued using the moving average method, net of accumulated
amortization (straight-line), in accordance with the Industry Audit Committee Report No. 21,
“Temporary Treatment of Accounting and Auditing Concerning Policy-Reserve-Matching Bonds in
the Insurance Industry,” issued by the JICPA**.
4) Investments in subsidiaries and affiliates (stocks issued by subsidiaries prescribed in Article 2,
Paragraph 12 of the Insurance Business Act or subsidiaries prescribed in Article 13-5-2,
Paragraph 3 of the Order for Enforcement of the Insurance Business Act and stocks issued by
affiliates prescribed in Article 13-5-2, Paragraph 4 of the Order for Enforcement of the Insurance
Business Act) are stated at cost using the moving average method.
5) Available-for-sale securities
a. Regarding securities with a fair value, stocks (including foreign stocks) are valued using the
average fair value during the period of one month before the balance sheet date (cost basis is
calculated using the moving average method). Other securities with a fair value are valued using
the fair value on the balance sheet date (cost basis is calculated using the moving average
method).
b. Regarding securities of which the fair value is extremely difficult to be determined, bonds
(including foreign bonds) for which the difference between the purchase price and face value is
due to an interest rate adjustment are stated at cost using the moving average method, net of
accumulated amortization (straight-line). Other securities without readily determinable fair
values are stated at cost using the moving average method.
* ASBJ: The Accounting Standards Board of Japan
** JICPA: Japanese Institute of Certified Public Accountants

20 Nippon Life Insurance Company
(2) Unrealized gains/losses, net of applicable taxes for available-for-sale securities, are recorded as a
separate component of net assets.
2. Securities that are held for the purpose of matching the duration of outstanding liabilities within the subgroups
classified by insurance type, payment method, maturity period, currency, and investment policy are classified
as policy-reserve-matching bonds in accordance with the Industry Audit Committee Report No. 21,
“Temporary Treatment of Accounting and Auditing Concerning Policy-Reserve-Matching Bonds in the
Insurance Industry,” issued by the JICPA.
The Company has specified and subcategorized the following insurance policies:
1) All insurance policies for products other than single payment products and group annuities
2) All insurance policies for single payment products (denominated in yen) other than variable assumed
rate-type insurance
3) All insurance policies for group annuities other than guaranteed fixed-term rate products
4) All single payment products (denominated in U.S. dollars) other than the foregoing
5) All single payment products (denominated in Australian dollars) other than the foregoing
6) All single payment products (denominated in euros) other than the foregoing
3. Derivative financial instruments and derivative financial instruments within assets held in trust are stated at fair
value.
4. (1) Tangible fixed assets are depreciated based on the following methods:
a. Tangible fixed assets (except for lease assets)
(i) Buildings
Straight-line method.
(ii) Assets other than the above
Declining-balance method.
Certain other tangible fixed assets with an acquisition price of less than ¥200,000 are depreciated
over a three-year period on a straight-line basis.
b. Lease assets
(i) Lease assets related to financial leases where ownership is transferred
The same depreciation method applied to fixed assets owned by the Company.
(ii) Lease assets related to financial leases where ownership is not transferred
Straight-line method based on lease period.
(2) Software, which is included within intangible fixed assets, is amortized using the straight-line method.
5. Assets and liabilities denominated in foreign currencies are translated into Japanese yen using the “Accounting
Standards for Foreign Currency Transactions” (Business Accounting Council).
21 Nippon Life Insurance Company
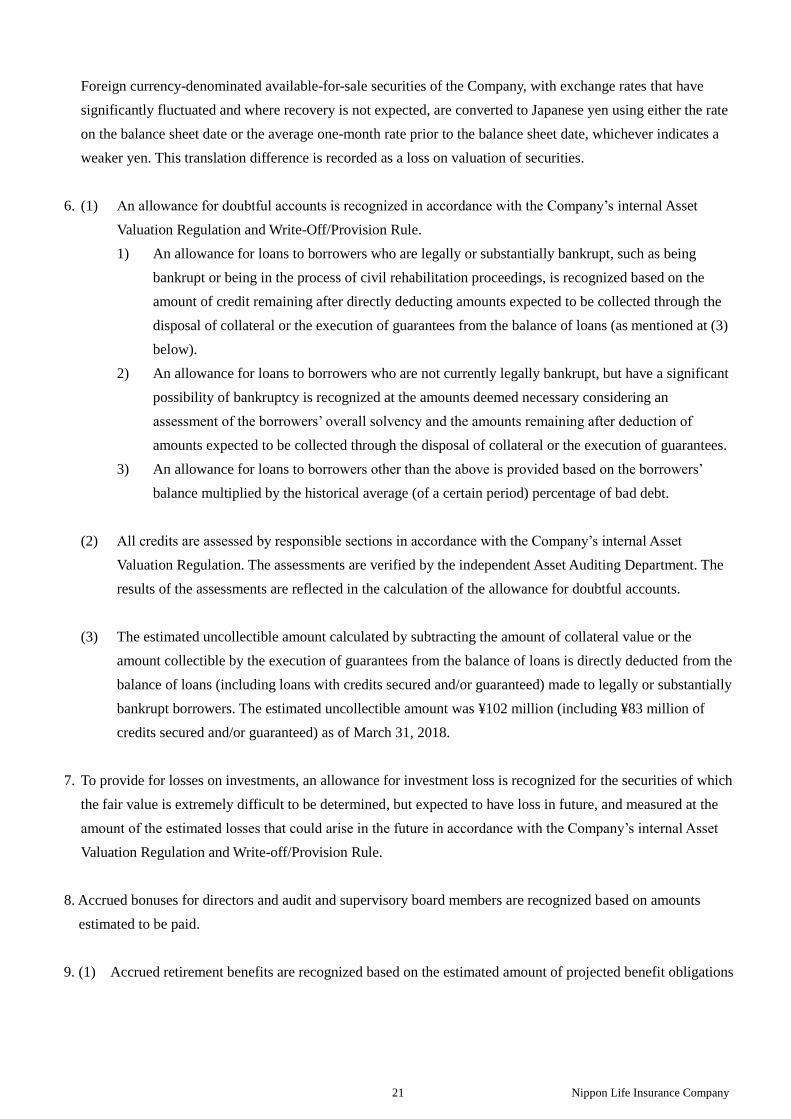
Foreign currency-denominated available-for-sale securities of the Company, with exchange rates that have
significantly fluctuated and where recovery is not expected, are converted to Japanese yen using either the rate
on the balance sheet date or the average one-month rate prior to the balance sheet date, whichever indicates a
weaker yen. This translation difference is recorded as a loss on valuation of securities.
6. (1) An allowance for doubtful accounts is recognized in accordance with the Company’s internal Asset
Valuation Regulation and Write-Off/Provision Rule.
1) An allowance for loans to borrowers who are legally or substantially bankrupt, such as being
bankrupt or being in the process of civil rehabilitation proceedings, is recognized based on the
amount of credit remaining after directly deducting amounts expected to be collected through the
disposal of collateral or the execution of guarantees from the balance of loans (as mentioned at (3)
below).
2) An allowance for loans to borrowers who are not currently legally bankrupt, but have a significant
possibility of bankruptcy is recognized at the amounts deemed necessary considering an
assessment of the borrowers’ overall solvency and the amounts remaining after deduction of
amounts expected to be collected through the disposal of collateral or the execution of guarantees.
3) An allowance for loans to borrowers other than the above is provided based on the borrowers’
balance multiplied by the historical average (of a certain period) percentage of bad debt.
(2) All credits are assessed by responsible sections in accordance with the Company’s internal Asset
Valuation Regulation. The assessments are verified by the independent Asset Auditing Department. The
results of the assessments are reflected in the calculation of the allowance for doubtful accounts.
(3) The estimated uncollectible amount calculated by subtracting the amount of collateral value or the
amount collectible by the execution of guarantees from the balance of loans is directly deducted from the
balance of loans (including loans with credits secured and/or guaranteed) made to legally or substantially
bankrupt borrowers. The estimated uncollectible amount was ¥102 million (including ¥83 million of
credits secured and/or guaranteed) as of March 31, 2018.
7. To provide for losses on investments, an allowance for investment loss is recognized for the securities of which
the fair value is extremely difficult to be determined, but expected to have loss in future, and measured at the
amount of the estimated losses that could arise in the future in accordance with the Company’s internal Asset
Valuation Regulation and Write-off/Provision Rule.
8. Accrued bonuses for directors and audit and supervisory board members are recognized based on amounts
estimated to be paid.
9. (1) Accrued retirement benefits are recognized based on the estimated amount of projected benefit obligations

22 Nippon Life Insurance Company
in excess of the fair value of pension plan assets for future severance payments to employee on the
balance sheet date of the current fiscal year.
(2) The accounting methods used for retirement benefit obligations and benefit costs are as follows:
1) Attribution method for estimated retirement benefits: Benefit formula basis
2) Period of amortizing actuarial gains/losses: 5 years
3) Period of amortizing prior service costs: 5 years
10. Accrued retirement benefits for directors and audit and supervisory board members are recognized based on
estimated payment amounts under internal rules.
11. A reserve for program points is recognized based on the amount projected to be incurred for expenses from the
use of points granted to policyholders.
12. Reserve for price fluctuations in investments in securities is recognized based on Article 115 of the Insurance
Business Act.
13. Hedge accounting is applied based on the following methods:
1) The Company mainly applies the following hedge accounting methods: The exceptional accounting
treatment (“Tokurei-shori”) for interest rate swaps is applied to hedge the cash flow volatility of certain
loans denominated in Japanese yen and certain loans denominated in foreign currencies; deferred hedge
accounting for interest rate swaps is applied to hedge the interest rate fluctuation exposures on certain
insurance policies, based on the Industry Audit Committee Report No. 26, “Accounting and Auditing
Treatments related to Application of Accounting for Financial Instruments in the Insurance Industry,”
issued by the JICPA; deferred hedge accounting and designated hedge accounting (“Furiate-shori”) for
currency swaps are applied to hedge the cash flow volatility caused by foreign exchange rate fluctuations
on certain foreign currency-denominated bonds, certain foreign currency-denominated loans, and foreign
currency-denominated subordinated corporate bonds issued by the Company; fair value hedge
accounting for foreign exchange forward contracts is applied to hedge the price fluctuation exposures
related to foreign exchange rate fluctuations on certain foreign currency-denominated bonds and other
instruments; and fair value hedge accounting for equity forward contracts is applied to hedge the price
fluctuation exposures on certain domestic stocks.
2) Hedging instruments and hedged items
(Hedging instruments) (Hedged items)
Interest rate swaps Loans, foreign currency-denominated loans, and insurance policies
Currency swaps Foreign currency-denominated bonds, foreign currency-denominated loans,
and foreign currency-denominated subordinated corporate bonds

23 Nippon Life Insurance Company
Foreign exchange forward contracts Foreign currency-denominated bonds and other instruments
Equity forward contracts Domestic stocks
3) Effectiveness of hedging activities is mainly evaluated by performing a ratio analysis of fair value
movement comparisons based on the hedging instruments and hedged items taken, which is in
accordance with the Company’s internal risk management policies.
14. Consumption taxes and local consumption taxes are accounted for by the tax exclusion method. However,
consumption taxes paid on certain asset transactions, which are not deductible from consumption taxes
withheld and are stipulated to be deferred under the Consumption Tax Act, are deferred as prepaid expenses
and amortized over a five-year period on a straight-line basis. Consumption taxes other than deferred
consumption taxes are expensed as incurred.
15. Policy reserves are reserves set forth in accordance with Article 116 of the Insurance Business Act. Insurance
premiums reserves are recognized based on the following methodology. In accordance with Article 69,
Paragraph 5 of the Ordinance for Enforcement of the Insurance Business Act, policy reserves include those that
are reserved for certain individual annuity policies.
1) Reserves for contracts subject to the standard policy reserve are calculated in accordance with the
method prescribed by the Commissioner of the Financial Services Agency (Ordinance No. 48 issued by
the Ministry of Finance in 1996).
2) Reserves for other contracts are calculated based on the net level premium method.
During the fiscal year ended March 31, 2018, additional policy reserve amounts were included to cover a
possible deficiency in the amount of the reserve for certain individual annuity policyholders. As a result,
policy reserves increase by ¥88,192 million, while ordinary profit and surplus before income taxes
decrease by ¥88,192 million, compared to amounts that would have been recorded had the additional
policy reserve amounts not been included.
16. Regarding the investment of general accounts (except separate accounts as provided in Article 118,
Paragraph 1 of the Insurance Business Act), in light of the characteristics of life insurance policies, the
Company has built a portfolio geared toward mid- to long-term investment and formulated an investment plan
considering the outlook of the investment environment.
Based on this, in order to reliably pay benefits and other payments in the future, the Company has positioned
yen-denominated assets that can be expected to provide stable income, such as bonds and loans, as the
Company’s core assets, and from the viewpoint of improving profit in the mid- to long-term, the Company
invests in stocks and foreign securities. Also, from the viewpoint of effective investment, the Company mainly
uses derivative transactions for controlling asset investment risks. Specifically, the Company uses interest rate
swaps for the Company’s interest rate-related investments, foreign exchange forward contracts and currency
options and swaps for the Company’s currency-related investments, and equity forward contracts, equity index

24 Nippon Life Insurance Company
futures and equity index options for the Company’s equity-related investments, and hedge accounting is
applied with respect to a portion thereof.
The Company mainly applies the following hedge accounting methods: The exceptional accounting treatment
(“Tokurei-shori”) for interest rate swaps is applied to hedge the cash flow volatility of certain loans
denominated in Japanese yen and certain loans denominated in foreign currencies; deferred hedge accounting
for interest rate swaps is applied to hedge the interest rate fluctuation exposures on certain insurance policies,
based on the Industry Audit Committee Report No. 26, “Accounting and Auditing Treatments related to
Application of Accounting for Financial Instruments in the Insurance Industry,” issued by the JICPA; deferred
hedge accounting and designated hedge accounting (“Furiate-shori”) for currency swaps are applied to hedge
the cash flow volatility caused by foreign exchange rate fluctuations on certain foreign currency-denominated
bonds, certain foreign currency-denominated loans, and foreign currency-denominated subordinated corporate
bonds issued by the Company; fair value hedge accounting for foreign exchange forward contracts is applied
to hedge the price fluctuation exposures related to foreign exchange rate fluctuations on certain foreign
currency-denominated bonds and other instruments; and fair value hedge accounting for equity forward
contracts is applied to hedge the price fluctuation exposures on certain domestic stocks. The effectiveness of
hedging activities is mainly evaluated by performing a ratio analysis of fair value movement comparisons
based on the hedging instruments and hedging methods taken, which is in accordance with the Company’s
internal risk management policies.
Securities are mainly exposed to market risk and credit risk, loans are exposed to credit risk, and derivative
transactions are exposed to market risk and credit risk. Market risk refers to the risk of incurring losses when
the fair value of investment assets declines due to such factors as fluctuations in interest rates, exchange rates,
or stock prices. Credit risk refers to the risk of incurring losses when the value of assets, primarily loans and
bonds, declines due to deterioration of the financial condition of the party to whom credit has been extended.
It includes country risk. These risks are managed according to rules and regulations regarding investment
risks.
To manage market risk, the Company has implemented investment limits based on the nature of the assets in
order to avoid excessive losses from financing and investment transactions. In addition, the Company
monitors and regularly reports on the status of compliance to the Risk Management Committee, the advisory
body of the Management Committee, and has developed a system to control risk within acceptable levels in
the event of a breach of the internal rules. Also, to control market risk in the Company’s portfolio, the
Company uses a statistical analysis method to rationally calculate the market value-at-risk of the portfolio as a
whole and conducts appropriate asset allocation within acceptable boundaries of risk.
To manage credit risk, the Company has built a thorough monitoring system involving the Assessment
Management Department, which is independent of the departments handling investment and finance activities.
The Company also continues to build a sound portfolio through the establishment and monitoring of interest
guidelines to ensure the returns the Company obtains are commensurate with the risk, a system of internal
ratings for classifying the creditworthiness of borrowers, and credit ceilings to ensure that credit risk is not
excessively concentrated in a particular company, group, or country. In addition, the Company calculates

25 Nippon Life Insurance Company
credit value-at-risk as a measurement of the magnitude of credit risk across the Company’s portfolio as a
whole and monitors whether the magnitude of risk stays within an appropriate range.
17. (1) Balance sheet amounts and fair values of major financial instruments and their differences are as follows:
(Million Yen)
Balance sheet amount (*1)
Fair value (*2) Difference
Cash and deposits (negotiable certificates of deposit):
327,500 327,500 ―
Available-for-sale securities 327,500 327,500 ―
Monetary receivables purchased: 278,235 290,037 11,801
Policy-reserve-matching bonds 239,375 251,177 11,801
Available-for-sale securities 38,859 38,859 ―
Assets held in trust: 10,421 10,421 ―
Trading securities 10,421 10,421 ―
Investments in securities: 53,131,946 56,928,112 3,796,166
Trading securities 959,156 959,156 ―
Policy-reserve-matching bonds 19,287,856 22,978,483 3,690,626
Investments in subsidiaries and affiliates
64,047 169,587 105,539
Available-for-sale securities 32,820,885 32,820,885 ―
Loans (*3): 7,466,987 7,692,014 225,026
Policy loans 618,864 618,864 ―
Industrial and consumer loans 6,848,123 7,073,150 225,026
Derivative financial instruments (*4): 102,095 102,095 ―
Hedge accounting not applied 8,879 8,879 ―
Hedge accounting applied 93,215 93,215 ―
Corporate bonds (*3,*5) (1,028,889) (1,081,892) (53,003)
(*1) For transactions for which an allowance for doubtful accounts was recorded, the amount of the
allowance is deducted.
(*2) For securities for which impairment losses were recognized in the fiscal year ended March 31, 2018,
the fair value is the balance sheet amount after the impairment losses are deducted.
(*3) The fair values of derivative financial instruments that are interest rate swaps under exceptional
accounting treatment (“Tokurei-shori”) or currency swaps under designated hedge accounting
(“Furiate-shori”) are included in the fair values of loans and corporate bonds because they are
accounted for as an integral part of the loans and corporate bonds that are the hedged items.
(*4) Assets and liabilities generated by derivative financial instruments are offset and presented net. Net
liabilities in total are presented in parentheses.
(*5) Corporate bonds are recorded in liabilities and presented in parentheses.

26 Nippon Life Insurance Company
(2) Fair value measurement methods for major financial instruments are as follows:
1) Securities, deposits, and monetary receivables purchased that are treated as securities based on the
“Accounting Standard for Financial Instruments” (ASBJ Statement No. 10)
a. Items with a market price
Fair value is measured based on the closing market price on the balance sheet date. However,
the fair values of available-for-sale domestic and foreign equity securities are based on the
average market price over a one-month period prior to the balance sheet date.
b. Items without a market price
Fair value is measured by discounting future cash flows to present value or valuations obtained
from external information vendors.
2) Loans
a. Policy loans
Fair value is measured by the book value of the policy loans, as the fair value is deemed to
approximate book value, due to expected repayment periods, interest rate requirements, and
other characteristics. These loans have no repayment date either in form or in substance
because stated due dates can be extended if the loan amount is within certain range of its
surrender benefit.
b. Industrial and consumer loans
Fair value of variable interest rate loans is deemed to approximate book value because market
interest rates are reflected in future cash flows over the short term. Thus, book value is used as
fair value for variable interest rate loans.
Fair value of fixed interest rate loans is measured mainly by discounting future cash flows to
present value.
Fair value of loans to legally or substantially bankrupt borrowers or borrowers who are not
currently legally bankrupt but have a high probability of bankruptcy are measured by deducting the
estimated uncollectible amount from the book value prior to direct write-offs.
3) Derivative financial instruments
a. Fair value of futures and other market transactions is measured by the liquidation value or
closing market price on the balance sheet date.
b. Fair value of equity options is measured mainly based on liquidation value or closing market
price at the end of March or valuations obtained from external information vendors.
c. Fair value of foreign exchange contracts, currency options, interest rate swaps, currency swaps,
and forward contracts is measured mainly based on valuations obtained from external
information vendors.
4) Assets held in trust

27 Nippon Life Insurance Company
Fair value is based on a reasonably calculated price by the trustee of the assets held in trust, in
accordance with the calculation methods set forth in 1) and 3) above.
5) Corporate bonds
Corporate bonds are stated at fair value on the balance sheet date.
(3) Unlisted equity securities, investments in partnerships whereby partnership assets consist of unlisted
equity securities, and other items of which the fair value is extremely difficult to be determined are not
included in investments in securities in table (1).
Balance sheet amounts by holding purpose were ¥895,401 million for stocks of subsidiaries and affiliates,
and ¥676,159 million for available-for-sale securities as of March 31, 2018.
(4) Matters regarding securities and others by holding purpose are as follows:
1) Trading securities
Derivative financial instruments within assets held in trust and investments in securities for
separate accounts are classified as trading securities as of March 31, 2018.
Valuation gains/losses included in profit and loss were gains of ¥64,141 million for derivative
financial instruments within assets held in trust and investments in securities related to separate
accounts for the current fiscal year.
2) Held-to-maturity debt securities
No ending balance as of March 31, 2018.
3) Policy-reserve-matching bonds
Balance sheet amounts, fair values, and their differences by type are as follows:
(Million Yen)
Type Balance sheet amount Fair value Difference
Fair value exceeds
the balance sheet
amount
Monetary receivables
purchased 233,375 245,210 11,835
Domestic bonds 19,038,485 22,732,183 3,693,698
Foreign securities 40,685 42,681 1,995
Subtotal 19,312,546 23,020,075 3,707,529
Fair value does not
exceed the balance
sheet amount
Monetary receivables
purchased 6,000 5,966 (33)
Domestic bonds 202,192 197,207 (4,985)
Foreign securities 6,493 6,411 (82)
Subtotal 214,685 209,585 (5,100)
Total 19,527,231 23,229,660 3,702,428
28 Nippon Life Insurance Company
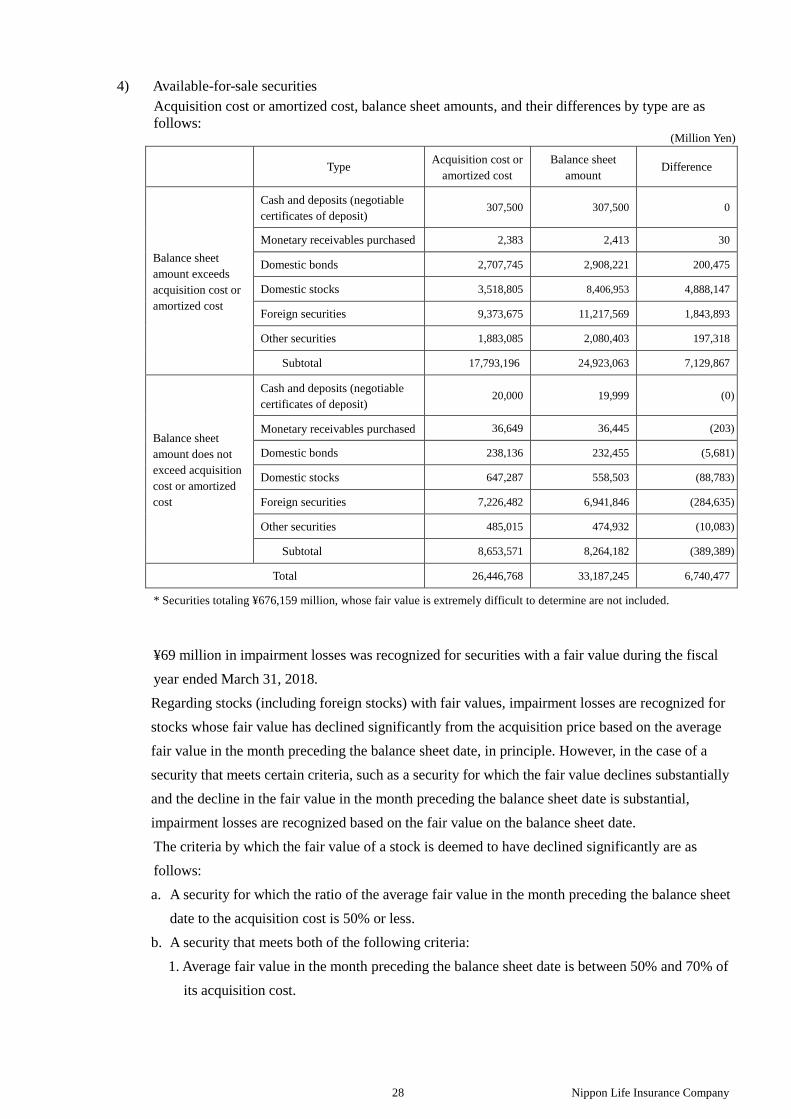
4) Available-for-sale securities
Acquisition cost or amortized cost, balance sheet amounts, and their differences by type are as
follows: (Million Yen)
Type Acquisition cost or
amortized cost
Balance sheet
amount Difference
Balance sheet
amount exceeds
acquisition cost or
amortized cost
Cash and deposits (negotiable
certificates of deposit) 307,500 307,500 0
Monetary receivables purchased 2,383 2,413 30
Domestic bonds 2,707,745 2,908,221 200,475
Domestic stocks 3,518,805 8,406,953 4,888,147
Foreign securities 9,373,675 11,217,569 1,843,893
Other securities 1,883,085 2,080,403 197,318
Subtotal 17,793,196 24,923,063 7,129,867
Balance sheet
amount does not
exceed acquisition
cost or amortized
cost
Cash and deposits (negotiable
certificates of deposit) 20,000 19,999 (0)
Monetary receivables purchased 36,649 36,445 (203)
Domestic bonds 238,136 232,455 (5,681)
Domestic stocks 647,287 558,503 (88,783)
Foreign securities 7,226,482 6,941,846 (284,635)
Other securities 485,015 474,932 (10,083)
Subtotal 8,653,571 8,264,182 (389,389)
Total 26,446,768 33,187,245 6,740,477
* Securities totaling ¥676,159 million, whose fair value is extremely difficult to determine are not included.
¥69 million in impairment losses was recognized for securities with a fair value during the fiscal
year ended March 31, 2018.
Regarding stocks (including foreign stocks) with fair values, impairment losses are recognized for
stocks whose fair value has declined significantly from the acquisition price based on the average
fair value in the month preceding the balance sheet date, in principle. However, in the case of a
security that meets certain criteria, such as a security for which the fair value declines substantially
and the decline in the fair value in the month preceding the balance sheet date is substantial,
impairment losses are recognized based on the fair value on the balance sheet date.
The criteria by which the fair value of a stock is deemed to have declined significantly are as
follows:
a. A security for which the ratio of the average fair value in the month preceding the balance sheet
date to the acquisition cost is 50% or less.
b. A security that meets both of the following criteria:
1. Average fair value in the month preceding the balance sheet date is between 50% and 70% of
its acquisition cost.

29 Nippon Life Insurance Company
2. The historical fair value, the business conditions of the issuing company, and other aspects
are subject to certain requirements.
(5) Scheduled repayment amounts for the main monetary claims and liabilities and redemption amounts for
securities with maturities are as follows:
(Million Yen)
1 year or under Over 1 year
under 5 years
Over 5 years
under 10 years Over 10 years
Cash and deposits (negotiable certificates of deposit):
327,500 ― ― ―
Available-for-sale securities 327,500 ― ― ―
Monetary receivables purchased: 23,000 5,834 29,718 219,569
Policy-reserve-matching bonds ― 5,682 29,564 203,911
Available-for-sale securities 23,000 152 153 15,658
Investments in securities: 781,713 4,530,832 9,885,634 25,364,253
Policy-reserve-matching bonds 349,492 1,260,776 4,444,311 13,134,690
Available-for-sale securities 432,221 3,270,055 5,441,322 12,229,562
Loans 920,137 2,586,756 1,629,408 1,709,831
Corporate bonds ― ― ― 1,028,889
* Assets, such as policy loans, which do not have a stated maturity date, are not included.
Also, ¥1,938 million in loans to legally or substantially bankrupt borrowers or borrowers who are not currently legally
bankrupt, but have a high probability of bankruptcy is not included.
18. The balance sheet amount for investment and rental properties was ¥1,119,049 million, with a fair value of
¥1,295,288 million as of March 31, 2018.
The Company owns rental office buildings and commercial facilities, the fair value of which as of March 31,
2018, was the amount measured based mainly on the “Real Estate Appraisal Standards.”
The amount corresponding to asset retirement obligations that were included in the balance sheet amounts of
investment and rental properties was ¥476 million as of March 31, 2018.
19. (1) The total amount of loans to bankrupt borrowers, delinquent loans, loans that are delinquent for over three
months, and restructured loans, which were included in loans, was ¥29,704 million as of March 31, 2018.
1) The balances of loans to bankrupt borrowers and delinquent loans were ¥1,501 million and
¥26,014 million, respectively, as of March 31, 2018.
Loans to bankrupt borrowers are loans for which interest is not accrued as income, except for a
portion of loans written off, and to which any event specified in Article 96, Paragraph 1, Item 3 (a)
to (e) or Item 4 of the Order for Enforcement of the Corporation Tax Act has occurred. Interest is
not accrued as income for the loans since the recovery of principal or interest on the loans is
unlikely due to the fact that principal repayments or interest payments are overdue for a significant
period of time or for other reasons.

30 Nippon Life Insurance Company
Delinquent loans are loans for which interest is not accrued and exclude loans to bankrupt
borrowers and loans with interest payments extended with the objective of restructuring or
supporting the borrowers.
2) There were no loans delinquent for over three months as of March 31, 2018.
Loans that are delinquent for over three months are loans with principal or interest unpaid for over
three months beginning one day after the due date based on the loan agreement. These loans
exclude loans classified as loans to bankrupt borrowers and delinquent loans.
3) The balance of restructured loans was ¥2,188 million as of March 31, 2018.
Restructured loans are loans that provide certain concessions favorable to borrowers with the intent
of supporting the borrowers’ restructuring, such as by reducing or exempting interest, postponing
principal or interest payments, releasing credits, or providing other benefits to the borrowers.
These loans exclude loans classified as loans to bankrupt borrowers, delinquent loans, and loans
delinquent for over three months.
(2) Direct write-offs of loans decreased the balances of loans to bankrupt borrowers and delinquent loans by
¥13 million and ¥88 million, respectively, as of March 31, 2018.
20. The amount of accumulated depreciation of tangible fixed assets was ¥1,129,850 million as of March 31,
2018.
21. Separate account assets as provided for in Article 118, Paragraph 1 of the Insurance Business Act were
¥1,294,140 million as of March 31, 2018, and a corresponding liability is recorded in the same amount.
22. The total amounts of credits and debits to subsidiaries and affiliates were ¥64,630 million and ¥4,633 million,
respectively as of March 31, 2018.
23. Changes in the reserve for dividends to policyholders for the fiscal year ended March 31, 2018, were as
follows:
Million Yen
Year ended March 31, 2018
a. Balance at the beginning of the current fiscal year ¥1,001,102
b. Transfer to reserve from surplus in the previous fiscal year ¥184,086
c. Dividends paid to policyholders ¥212,224
d. Increase in interest ¥22,203
e. Balance at the end of the current fiscal year (a+b-c+d) ¥995,167

31 Nippon Life Insurance Company
24. Corporate bonds within liabilities are subordinated corporate bonds with special provisions that subordinate the
fulfillment of obligations on the bonds to all other debt obligations.
The corporate bonds are callable at the discretion of the Company, subject to the approval of the regulatory
authority and other conditions.
Issue date Callable date
October 2012 Each interest payment date on or after October 2022
October 2014 Tenth anniversary date after the issue date and on each fifth anniversary date thereafter
April 2015 Tenth anniversary date after the issue date and on each fifth anniversary date thereafter
January 2016 Tenth anniversary date after the issue date and on each fifth anniversary date thereafter
April 2016 Tenth anniversary date after the issue date and on each fifth anniversary date thereafter
Fifteenth anniversary date after the issue date and on each fifth anniversary date thereafter
November 2016 Tenth anniversary date after the issue date and on each fifth anniversary date thereafter
Fifteenth anniversary date after the issue date and on each fifth anniversary date thereafter
April 2017 Tenth anniversary date after the issue date and on each fifth anniversary date thereafter
September 2017 Tenth anniversary date after the issue date and on each fifth anniversary date thereafter
25. The Company assumed the following Yen-denominated subordinated debt on April 27, 2018:
Principal Amount ¥100.0 billion
Interest rate A fixed rate of 1.05% per annum before April 27, 2028, and a fixed rate
with step-up thereafter (reset every five years).
Repayment date Three bank business days preceding April 27, 2048 (The loan is callable
on three bank business days preceding (i) April 27, 2028, and (ii) April
27 every five years thereafter until the loan is fully redeemed at the
discretion of the Company, subject to prior approval by the regulatory
authority.)
Use of funds General working capital
26. Assets pledged as collateral in the form of investments in securities, land, and buildings as of March 31, 2018,
were ¥1,295,180 million, ¥252 million, and ¥47 million, respectively. The total amount of liabilities covered by
the aforementioned assets was ¥567,775 million as of March 31, 2018.
These amounts included ¥239,784 million of the sale of securities under repurchase agreements and ¥237,046
million in payables under repurchase agreements, as well as ¥370,155 million of investments in securities
deposited and ¥330,722 million of cash received as collateral under securities lending transactions secured by
cash, as of March 31, 2018.
27. ¥50,000 million of foundation funds were offered pursuant to Article 60 of the Insurance Business Act during
the fiscal year ended March 31, 2018.

32 Nippon Life Insurance Company
28. The Company redeemed ¥50,000 million of foundation funds and credited the same amount to reserve for
redemption of foundation funds as prescribed in Article 56 of the Insurance Business Act for the fiscal year
ended March 31, 2018.
29. The total amount of stocks and investments in subsidiaries and affiliates was ¥959,448 million as of March 31,
2018.
On March 1, 2018, the Company agreed with Massachusetts Mutual Life Insurance Company and MassMutual
International LLC (hereinafter, “MMI”) to acquire approximately 85.1% of the issued and outstanding shares
of MassMutual Life Insurance Company (hereinafter, “MassMutual Japan”) from MMI.
(1) Purpose of the stock acquisition
The purpose of the stock acquisition is to build a structure that can accommodate a wide range of
customers’ needs in the financial institution bancassurance market in order to continuously expand
policyholders’ profit by expanding the profit base of group business.
(2) Overview of MassMutual Japan
a. Company Name: MassMutual Life Insurance Company
b. Business: Life insurance business
c. Head Office: Shinagawa-ku, Tokyo (Tokyo Head Office)
Fukuoka-shi, Fukuoka (Fukuoka Head Office)
d. Premium Income: ¥322.9 billion (Year ended March 31, 2017)
(3) The stock acquisition schedule
The stock acquisition is scheduled to take place at or after the end of May 2018.
(4) The acquisition cost
The acquisition cost for the shares is expected to be approximately ¥104.2 billion and the acquisition will
be funded by the Company’s cash on hand.
(5) Ownership ratio after the acquisition
Approximately 85.1%
(6) Others
The acquisition of MassMutual Japan shares requires approvals of the Commissioner of the Financial
Services Agency pursuant to Article 271-10, Paragraph 1 and Article 106, Paragraph 7 of the Insurance
Business Act.
30. The amount of securities lent under lending agreements was ¥2,780,156 million as of March 31, 2018.

33 Nippon Life Insurance Company
31. Assets that can be sold or resecured are marketable securities borrowed under lending agreements. These assets
were held without being sold or resecured and totaled ¥520,816 million at fair value as of March 31, 2018.
32. The amount of commitments related to loans and loans outstanding was ¥333,205 million as of March 31,
2018.
33. Of the maximum borrowing amount from the Life Insurance Policyholders Protection Corporation of Japan,
which is provided for in Article 37-4 of the Order for Enforcement of the Insurance Business Act, the amount
applied to the Company was estimated to be ¥80,139 million as of March 31, 2018.
The amount contributed to the aforementioned corporation was recorded within operating expenses.
34. Information relating to retirement benefits is as follows:
(1) Summary of retirement benefit plans
In terms of defined benefit plans, the Company has a defined benefit corporate pension plan and a
lump-sum retirement payment plan for non-sales personnel and sales management personnel, etc.
In terms of defined contribution plans, the Company has a defined contribution pension plan.
The Company also has a defined benefit plan for sales representatives, etc., in the form of a lump-sum
retirement payment plan and an in-house pension plan.
(2) Defined benefit plan
1) Reconciliation of retirement benefit obligations at the beginning and end of the fiscal year
Million Yen
Year ended
March 31, 2018
a. Retirement benefit obligations at the beginning of the year ¥651,278
b. Service costs ¥26,098
c. Interest cost ¥3,907
d. Actuarial losses accrued during the year ¥2,622
e. Retirement benefit payments ¥(43,870)
f. Retirement benefit obligations at the end of the year (a+b+c+d+e) ¥640,036
2) Reconciliation of pension plan assets at the beginning and end of the fiscal year
Million Yen
Year ended
March 31, 2018
a. Pension plan assets at the beginning of the year ¥260,869
b. Expected return on plan assets ¥3,521
c. Actuarial gains accrued during the year ¥2,496

34 Nippon Life Insurance Company
d. Contributions by business proprietor ¥6,598
e. Retirement benefit payments ¥(17,817)
f. Pension plan assets at the end of the year (a+b+c+d+e) ¥255,668
3) Reconciliation of retirement benefit obligations, pension plan assets, and accrued retirement benefits on
the nonconsolidated balance sheet
Million Yen
Year ended
March 31, 2018
a. Retirement benefit obligations for funded plans ¥281,697
b. Pension plan assets ¥(255,668)
¥26,028
c. Retirement benefit obligations for nonfunded plans ¥358,339
d. Unrecognized actuarial gains ¥(23,254)
e. Accrued retirement benefits (a+b+c+d) ¥361,114
4) Losses (gains) relating to retirement benefits
Million Yen
Year ended
March 31, 2018
a. Service costs ¥26,098
b. Interest cost ¥3,907
c. Expected return on plan assets ¥(3,521)
d. Amortization of actuarial losses for the period ¥8,649
e. Benefit cost for defined benefit plans (a+b+c+d) ¥35,133
5) Pension plan assets consist of the following main asset categories:
a. General account of Nippon Life 51.8%
b. Domestic bonds 20.4%
c. Foreign securities 14.6%
d. Cash and deposits 8.0%
e. Domestic stocks 5.1%
f. Total (a+b+c+d+e) 100.0%
6) Calculation method for long-term expected rate of return on plan assets
To determine the long-term expected rate of return on pension plan assets, the Company takes into
consideration present and forecasted allocation of the pension plan assets, and present and long-term rates
of return that are expected from the portfolio of assets that comprise the pension plan assets.

35 Nippon Life Insurance Company
7) Matters relating to the basis for actuarial calculations
The main items in the basis for actuarial calculations as of March 31, 2018, are as follows:
a. Discount rate 0.6%
b. Long-term expected rate of
return on plan assets 1.4%
(3) Defined contribution plans
The Company contributed ¥2,182 million to defined contribution plans during the fiscal year ended
March 31, 2018.
35. (1) Total deferred tax assets were ¥1,422,159 million and total deferred tax liabilities were ¥1,954,549
million as of March 31, 2018. Among deferred tax assets, the deduction for the valuation allowance was
¥45,025 million. The major components resulting in deferred tax assets were policy reserves and other
reserves of ¥840,473 million, reserve for price fluctuations in investments in securities of ¥357,732
million, accrued retirement benefits of ¥100,750 million. The major component resulting in deferred tax
liabilities was net unrealized gains on available-for-sale securities of ¥1,873,322 million.
(2) The statutory tax rate was 28.2% for the fiscal year ended March 31, 2018. The main factors for the
difference between the statutory tax rate and the effective income tax rate were a decrease of 24.6% due
to the amount of reserve for dividends to policyholders.
36. Revaluation of land used in the operations is performed based on the Act on Revaluation of Land. The tax
effect of the amount related to the valuation difference between book value and the revalued amount for land
revaluation is recognized as a deferred tax liability within the liability section. The valuation differences,
excluding tax, are recognized as land revaluation losses within the net assets section.
Revaluation date March 31, 2002
Revaluation methodology The amount is calculated by using the listed value of the land and road
rate as prescribed by Article 2, Items 1 and 4, respectively, of the Order
for Enforcement of the Act on Revaluation of Land.
37. The amount of policy reserves provided for the portion of reinsurance (hereafter, “policy reserves for ceded
reinsurance”) as defined in Article 71, Paragraph 1 of the Ordinance for Enforcement of the Insurance Business
Act was ¥293 million as of March 31, 2018.
38. The amount per Article 30, Paragraph 2 of the Ordinance for Enforcement of the Insurance Business Act was
¥4,823,655 million as of March 31, 2018.

36 Nippon Life Insurance Company
6. Nonconsolidated Statements of Income
(Million Yen)
Year ended March 31, 2018 Year ended March 31, 2017
Ordinary income: 6,338,509 6,452,675
Revenues from insurance and reinsurance: 4,488,421 4,647,334
Insurance premiums 4,487,627 4,646,209
Reinsurance revenue 793 1,125
Investment income: 1,652,609 1,661,965
Interest, dividends, and other income: 1,407,350 1,365,628
Interest on deposits and savings 420 76
Interest on securities and dividends 1,183,986 1,127,836
Interest on loans 130,059 141,124
Real estate rental income 80,271 84,499
Other income 12,612 12,092
Gain on sales of securities 179,682 254,013
Gain on redemptions of securities 14,941 5,805
Reversal of allowance for doubtful accounts 471 742
Other investment income 596 702
Gain from separate accounts, net 49,566 35,072
Other ordinary income: 197,478 143,375
Income from annuity riders 10,897 9,442
Income from deferred benefits 90,531 106,290
Reversal of reserve for outstanding claims 62,044 ―
Other ordinary income 34,004 27,642

37 Nippon Life Insurance Company
6. Nonconsolidated Statements of Income (Continued) (Million Yen)
Year ended March 31, 2018 Year ended March 31, 2017
Ordinary expenses: 5,928,048 5,994,211
Benefits and other payments: 3,663,124 3,529,231
Death and other claims 1,032,798 1,018,393
Annuity payments 802,214 836,311
Health and other benefits 649,240 658,966
Surrender benefits 926,376 801,780
Other refunds 251,106 212,024
Reinsurance premiums 1,388 1,754
Provision for policy reserves: 1,112,934 1,267,952
Provision for reserve for outstanding claims ― 31,116
Provision for policy reserves 1,090,730 1,214,378
Provision for interest on reserve for dividends to policyholders 22,203 22,458
Investment expenses: 324,200 388,005
Interest expenses 21,923 18,996
Loss from assets held in trust, net 3,276 1,976
Loss on sales of securities 102,833 118,770
Loss on valuation of securities 11,235 27,738
Loss on redemptions of securities 23,359 32,958
Loss on derivative financial instruments, net 105,877 119,127
Foreign exchange losses, net 9,589 1,209
Provision for allowance for investment loss 2,918 25,219
Depreciation of rental real estate and other assets 14,826 15,337
Other investment expenses 28,360 26,670
Operating expenses 600,571 572,159
Other ordinary expenses: 227,217 236,861
Deferred benefit payments 117,190 126,767
Taxes 46,058 44,541
Depreciation 42,576 47,578
Provision for retirement benefits 2,483 ―
Other ordinary expenses 18,908 17,974

38 Nippon Life Insurance Company
6. Nonconsolidated Statements of Income (Continued) (Million Yen)
Year ended March 31, 2018 Year ended March 31, 2017
Ordinary profit 410,461 458,464
Extraordinary gains: 16,492 38,895
Gain on disposals of fixed assets 16,492 38,895
Extraordinary losses: 176,850 191,348
Loss on disposals of fixed assets 6,412 14,630
Impairment losses 2,062 4,328
Provision for reserve for price fluctuations in investments in securities 165,399 169,411
Loss on reduction entry of real estate ― 2
Contributions for assisting social public welfare 2,977 2,977
Surplus before income taxes 250,102 306,011
Income taxes ― current 104,789 86,280
Income taxes ― deferred (97,030) (48,873)
Total income taxes 7,758 37,406
Net surplus 242,344 268,604

39 Nippon Life Insurance Company
Notes to the Nonconsolidated Statement of Income for the Fiscal Year Ended March 31, 2018
1. The total income and expenses from transactions with subsidiaries and affiliates is ¥52,836 million and ¥33,088
million, respectively, for the fiscal year ended March 31, 2018.
2. Gain on sales of securities includes gains on sales of domestic bonds, including national government bonds,
domestic stocks, and foreign securities of ¥12,476 million, ¥130,988 million, and ¥36,217 million, respectively,
for the fiscal year ended March 31, 2018.
3. Loss on sales of securities includes losses on sales of domestic bonds, including national government bonds,
domestic stocks, and foreign securities of ¥571 million, ¥7,706 million, and ¥94,555 million, respectively, for
the fiscal year ended March 31, 2018.
4. Loss on valuation of securities includes losses on the valuation of domestic stocks and foreign securities of
¥395 million and ¥10,839 million, respectively, for the fiscal year ended March 31, 2018.
5. Provision for policy reserves for ceded reinsurance that was deducted from the calculation of provision for
policy reserves was ¥17 million for the fiscal year ended March 31, 2018.
6. (1) Loss from assets held in trust, net includes net valuation losses of ¥3,267 million for the fiscal year
ended March 31, 2018.
(2) Loss on derivative financial instruments, net includes net valuation losses of ¥24,062 million for the
fiscal year ended March 31, 2018.
7. Impairment losses are as follows:
1) Method for grouping the assets
Leased property and idle property are classified as one asset group per property. Assets utilized for
insurance business operations are classified into one asset group.
2) Circumstances causing impairment losses
The Company observed a marked decrease in profitability or fair value in some of the fixed asset groups.
The book value of fixed assets was reduced to the recoverable amount and impairment losses were
recognized as extraordinary losses for the fiscal year ended March 31, 2018.

40 Nippon Life Insurance Company
3) Breakdown of asset groups that recognized impairment losses for the fiscal year ended March 31, 2018,
is as follows:
Million Yen
Purpose of use Land Buildings Total
Idle property ¥1,431 ¥630 ¥2,062
Total ¥1,431 ¥630 ¥2,062
4) Calculation method of recoverable amount
The recoverable amount used for the measurement of impairment losses is based on the net realizable
value upon sales of the assets or the discounted future cash flows.
The discount rate used in the calculation of future cash flows is 3.0%. Net realizable values are
determined based on appraisals performed in accordance with the “Real Estate Appraisal Standards” or
posted land prices.

41 Nippon Life Insurance Company
7. Nonconsolidated Statements of Changes in Net Assets
Year Ended March 31, 2017 (Million Yen)
Foundation funds and others
Foundation
funds
Reserve for
redemption of
foundation
funds
Reserve for
revaluation
Surplus
Total foundation
funds and others Legal reserve
for
deficiencies
Other surplus reserves
Total surplus Equalized
reserve for
dividends to
policyholders
Contin-
gency funds
Reserve for
social public
welfare
assistance
Reserve for
reduction
entry of real
estate
Reserve for
reduction
entry of real
estate to be
purchased
Other reserves Unappro-
priated surplus
Beginning balance 200,000 1,100,000 651 15,163 50,000 71,917 305 50,187 ― 170 292,087 479,830 1,780,481
Cumulative effect of
change in accounting
policies 1,873 1,873 1,873
Beginning balance after
reflecting accounting policy
changes 200,000 1,100,000 651 15,163 50,000 71,917 305 50,187 ― 170 293,960 481,703 1,782,355
Increase/decrease:
Additions to reserve for
dividends to policyholders (229,857) (229,857) (229,857)
Additions to legal reserve
for deficiencies 879 (879) ― ―
Additions to reserve for
redemption of foundation
funds 50,000 (50,000) (50,000) ―
Interest on foundation
funds (1,698) (1,698) (1,698)
Net surplus 268,604 268,604 268,604
Redemption of foundation
funds (50,000) (50,000)
Additions to reserve for
social public welfare
assistance 3,000 (3,000) ― ―
Reversal of reserve for
social public welfare
assistance (2,977) 2,977 ― ―
Additions to reserve for
reduction entry of real
estate 1,614 (1,614) ― ―
Reversal of reserve for
reduction entry of real
estate (606) 606 ― ―
Reversal of reserve for
reduction entry of real
estate to be purchased 5,643 (5,643) ― ―
Reversal of land
revaluation losses (28,117) (28,117) (28,117)
Net change, excluding
foundation funds and others
Net change (50,000) 50,000 ― 879 ― ― 23 1,008 5,643 ― (48,623) (41,068) (41,068)
Ending balance 150,000 1,150,000 651 16,042 50,000 71,917 328 51,196 5,643 170 245,337 440,635 1,741,286

42 Nippon Life Insurance Company
7. Nonconsolidated Statements of Changes in Net Assets (Continued)
Year Ended March 31, 2017
(Million Yen)
Valuations, conversions, and others
Total net assets Net unrealized gains on
available-for-sale securities
Deferred losses on
derivatives under hedge
accounting
Land revaluation losses Total valuations,
conversions, and others
Beginning balance 4,722,733 (123,923) (86,202) 4,512,608 6,293,089
Cumulative effect of change in
accounting policies 1,873
Beginning balance after reflecting
accounting policy changes 4,722,733 (123,923) (86,202) 4,512,608 6,294,963
Increase/decrease:
Additions to reserve for dividends to
policyholders (229,857)
Additions to legal reserve for
deficiencies ―
Additions to reserve for redemption of foundation funds
―
Interest on foundation funds (1,698)
Net surplus 268,604
Redemption of foundation funds (50,000)
Additions to reserve for social public welfare assistance
―
Reversal of reserve for social public
welfare assistance ―
Additions to reserve for reduction
entry of real estate ―
Reversal of reserve for reduction entry of real estate
―
Reversal of reserve for reduction
entry of real estate to be purchased ―
Reversal of land revaluation losses (28,117)
Net change, excluding foundation
funds and others (137,434) 58,660 28,117 (50,656) (50,656)
Net change (137,434) 58,660 28,117 (50,656) (91,725)
Ending balance 4,585,298 (65,262) (58,084) 4,461,951 6,203,237

43 Nippon Life Insurance Company
7. Nonconsolidated Statements of Changes in Net Assets (Continued)
Year Ended March 31, 2018
(Million Yen)
Foundation funds and others
Foundation
funds
Reserve for
redemption
of foundation
funds
Reserve for
revaluation
Surplus
Total foundation
funds and
others
Legal reserve
for
deficiencies
Other surplus reserves
Total surplus Equalized
reserve for
dividends to
policyholders
Contin-
gency funds
Reserve for
social public
welfare
assistance
Reserve for
reduction
entry of real
estate
Reserve for
reduction entry of
real estate to be
purchased
Other
reserves
Unappro-
priated surplus
Beginning balance 150,000 1,150,000 651 16,042 50,000 71,917 328 51,196 5,643 170 245,337 440,635 1,741,286
Increase/decrease:
Issuance of foundation funds 50,000 50,000
Additions to reserve for
dividends to policyholders (184,086) (184,086) (184,086)
Additions to legal reserve for
deficiencies 762 (762) ― ―
Additions to reserve for
redemption of foundation
funds 50,000 (50,000) (50,000) ―
Interest on foundation funds (1,198) (1,198) (1,198)
Net surplus 242,344 242,344 242,344
Redemption of foundation
funds (50,000) (50,000)
Reversal of the equalized
reserve for dividends to
policyholders (10,000) 10,000 ― ―
Additions to reserve for social
public welfare assistance 3,000 (3,000) ― ―
Reversal of reserve for social
public welfare assistance (2,977) 2,977 ― ―
Additions to reserve for
reduction entry of real estate 1,453 (1,453) ― ―
Reversal of reserve for
reduction entry of real estate (2,942) 2,942 ― ―
Additions to reserve for
reduction entry of real estate
to be purchased 23,415 (23,415) ― ―
Reversal of reserve for
reduction entry of real estate to
be purchased
(5,636) 5,636 ― ―
Reversal of land revaluation
losses 2,905 2,905 2,905
Net change, excluding
foundation funds and others
Net change ― 50,000 ― 762 (10,000) ― 23 (1,488) 17,778 ― 2,889 9,965 59,965
Ending balance 150,000 1,200,000 651 16,804 40,000 71,917 351 49,708 23,422 170 248,227 450,600 1,801,251

44 Nippon Life Insurance Company
7. Nonconsolidated Statements of Changes in Net Assets (Continued)
Year Ended March 31, 2018
(Million Yen)
Valuations, conversions, and others
Total net assets Net unrealized gains on
available-for-sale securities
Deferred losses on
derivatives under hedge
accounting
Land revaluation losses Total valuations,
conversions, and others
Beginning balance 4,585,298 (65,262) (58,084) 4,461,951 6,203,237
Increase/decrease:
Issuance of foundation funds 50,000
Additions to reserve for dividends to
policyholders (184,086)
Additions to legal reserve for
deficiencies -
Additions to reserve for redemption
of foundation funds -
Interest on foundation funds (1,198)
Net surplus 242,344
Redemption of foundation funds (50,000)
Reversal of the equalized reserve for
dividends to policyholders ―
Additions to reserve for social public
welfare assistance -
Reversal of reserve for social public
welfare assistance -
Additions to reserve for reduction
entry of real estate -
Reversal of reserve for reduction
entry of real estate -
Additions to reserve for reduction
entry of real estate to be purchased -
Reversal of reserve for reduction
entry of real estate to be purchased -
Reversal of land revaluation losses 2,905
Net change, excluding foundation funds and others
296,805 6,162 (2,905) 300,062 300,062
Net change 296,805 6,162 (2,905) 300,062 360,028
Ending balance 4,882,103 (59,099) (60,989) 4,762,014 6,563,265

45 Nippon Life Insurance Company
8. Details of Ordinary Profit (Core Operating Profit) (Million Yen)
Year ended March 31, 2018 Year ended March 31, 2017
Core operating profit (A) 668,249 634,972
Capital gains: 217,621 254,013
Gain on proprietary trading securities ― ―
Gain from assets held in trust, net ― ―
Gain on trading securities ― ―
Gain on sales of securities 179,682 254,013
Gain on derivative financial instruments, net ― ―
Foreign exchange gains, net ― ―
Other capital gains 37,938 ―
Capital losses: 244,536 282,954
Loss on proprietary trading securities ― ―
Loss from assets held in trust, net 3,276 1,976
Loss on trading securities ― ―
Loss on sales of securities 102,833 118,770
Loss on valuation of securities 11,235 27,738
Loss on derivative financial instruments, net 105,877 119,127
Foreign exchange losses, net 9,589 1,209
Other capital losses 11,724 14,131
Net capital losses (B) (26,915) (28,941)
Core operating profit, including net capital gains (A+B) 641,334 606,030
Nonrecurring gains: 165 494
Reinsurance revenue ― ―
Reversal of contingency reserve ― ―
Reversal of specific allowance for doubtful accounts 165 494
Other nonrecurring gains ― ―
Nonrecurring losses: 231,039 148,060
Reinsurance premiums ― -
Provision for contingency reserve 139,929 122,841
Provision for specific allowance for doubtful accounts ― ―
Provision for allowance for specific overseas debts ― ―
Write-offs of loans ― ―
Other nonrecurring losses 91,110 25,219
Net nonrecurring losses (C) (230,873) (147,566)
Ordinary profit (A+B+C) 410,461 458,464

46 Nippon Life Insurance Company
(Reference) Breakdown of “Other” items
(Million Yen)
Year ended March 31, 2018 Year ended March 31, 2017
Core operating profit (26,214) 14,131
Amount of foreign exchange gains and losses related to
foreign currency-denominated insurance products ― 7,508
Interest income and expenses related to swap
transactions for foreign currency-denominated
insurance products and swap transactions for hedging
purposes
11,724 6,622
Impact of market exchange rate movements related to
foreign currency-denominated insurance policies (35,187) ―
Impact of movements in surrender benefits related to
market value adjustment (2,750) ―
Other capital gains 37,938 ―
Amount of foreign exchange gains and losses related to
foreign currency-denominated insurance products ― ―
Interest income and expenses related to swap
transactions for foreign currency-denominated
insurance products and swap transactions for hedging
purposes
― ―
Impact of market exchange rate movements related to
foreign currency-denominated insurance policies 35,187 ―
Impact of movements in surrender benefits related to
market value adjustment 2,750 ―
Other capital losses 11,724 14,131
Amount of foreign exchange gains and losses related to
foreign currency-denominated insurance products ― 7,508
Interest income and expenses related to swap
transactions for foreign currency-denominated
insurance products and swap transactions for hedging
purposes
11,724 6,622
Impact of market exchange rate movements related to
foreign currency-denominated insurance policies ― ―
Impact of movements in surrender benefits related to
market value adjustment ― ―
Other nonrecurring gains ― ―
Reversal of allowance for investment loss ― ―
Other nonrecurring losses 91,110 25,219
Provision for allowance for investment loss 2,918 25,219
Provision for additional policy reserves 88,192 ―

47 Nippon Life Insurance Company
9. Nonconsolidated Proposed Appropriations of Surplus (Thousands Yen)
Year ended March 31, 2018 Year ended March 31, 2017
Unappropriated surplus 248,227,021 245,337,320
Reversal from voluntary surplus reserve: 39,697,424 18,578,397
Reversal of equalized reserve for dividends to
policyholders 30,000,000 10,000,000
Reversal of reserve for reduction entry of real estate 3,674,119 2,942,005
Reversal of reserve for reduction entry of real estate to
be purchased 6,023,305 5,636,391
Total 287,924,446 263,915,718
Appropriations: 287,924,446 263,915,718
Reserve for dividends to policyholders 218,353,870 184,086,582
Net surplus: 69,570,576 79,829,135
Legal reserve for deficiencies 774,000 762,000
Reserve for redemption of foundation funds 50,000,000 50,000,000
Interest on foundation funds 790,000 1,198,000
Voluntary surplus reserve: 18,006,576 27,869,135
Reserve for social public welfare assistance 3,000,000 3,000,000
Reserve for reduction entry of real estate 3,802,405 1,453,954
Reserve for reduction entry of real estate to
be purchased 11,204,171 23,415,180
Surplus carried forward ― ―

48 Nippon Life Insurance Company
10. Status of Nonperforming Assets According to Borrower’s Classification (Million Yen, %)
As of March 31, 2018 As of March 31, 2017
Bankrupt and quasi-bankrupt loans 10,179 10,095
Doubtful loans 17,337 18,796
Substandard loans 2,188 3,171
Subtotal 29,705 32,063
[Percentage of total, %] [0.29] [0.31]
Normal loans 10,297,839 10,214,183
Total 10,327,545 10,246,246
Notes: 1. Bankrupt and quasi-bankrupt loans are nonperforming assets and similar loans that have fallen into bankruptcy due to reasons, including initiation of
bankruptcy proceedings, start of reorganization proceedings, or submission of an application to start rehabilitation proceedings.
2. Doubtful loans are nonperforming assets with a strong likelihood that loan principal cannot be recovered or interest cannot be received according to the
contract because of difficulties in the financial condition and business performance of the debtor who has not yet entered into bankruptcy.
3. Substandard loans include loans that are delinquent for over three months or restructured loans. Loans that are delinquent for over three months are
loans with principal or interest being unpaid for over three months counting from the day after the due date based on the loan agreement (excluding 1.
and 2. in the above notes). Restructured loans are loans that provide certain concessions favorable to the borrower with the intent of supporting the
borrower’s restructuring. Examples of such concessions include reducing or exempting interest, postponing principal or interest payments, releasing
credits, or providing other benefits to the borrowers (excluding 1. and 2. in the above notes and loans that are delinquent for over three months).
4. Normal loans are loans that do not fall under the classifications for 1. to 3. in the above notes and where the debtor has no financial or business
performance problems.
Supplemental information for borrower’s classification
Classifications and calculation methods used in this table are based on the Ordinance for Enforcement of the Insurance Business Act. The table
includes guaranteed private offering loans of financial institutions, loans, securities lending, accrued interest, suspense payments, and
customer’s liability for acceptances and guarantees.
For bankrupt and quasi-bankrupt loans, the estimated uncollectible amount calculated by subtracting the amount of collateral value or the
amount collectible by the execution of guarantees from the balance of loans is directly deducted from the total loan amount. The estimated
uncollectible amounts as of March 31, 2018 and 2017, were ¥102 million and ¥531 million, respectively.
11. Status of Risk-Monitored Loans (Million Yen, %)
As of March 31, 2018 As of March 31, 2017
Loans to bankrupt borrowers 1,501 1,764
Delinquent loans 26,014 27,122
Loans that are delinquent for over three months ― ―
Restructured loans 2,188 3,171
Total 29,704 32,058
[Percentage of total loans, %] [0.40] [0.41]
Notes: 1. For loans to bankrupt borrowers and quasi-bankrupt borrowers (including collateralized and guaranteed loans), an estimated uncollectible amount
(calculated by subtracting estimated collectible amounts based on collateral and guarantees from total loans) is directly deducted from the total loan
amount.
The amounts directly deducted from loans to bankrupt borrowers and delinquent loans were ¥13 million and ¥88 million, respectively, as of March 31,
2018, and ¥399 million and ¥132 million, respectively, as of March 31, 2017.
2. Loans to bankrupt borrowers are loans with principal or interest payments being overdue for a significant period of time and interest not being accrued,
including the following: (a) loans to borrowers that are legally bankrupt through filings for proceedings under the Corporate Reorganization Act, Civil
Rehabilitation Act, Bankruptcy Act, or Company Act; (b) loans to borrowers that have notes suspended from being traded; and (c) loans to borrowers
that have filed for legal proceedings similar to the aforementioned proceedings based on overseas laws.
3. Delinquent loans are loans with interest not accrued and exclude loans to bankrupt borrowers and loans with interest payments extended with the
objective of restructuring or supporting the borrowers.
4. Loans that are delinquent for over three months are loans with principal or interest unpaid for over three months counting from the day after the due
date based on the loan agreement. Note that the account does not include loans to bankrupt borrowers and delinquent loans.

49 Nippon Life Insurance Company
5. Restructured loans are loans that provide certain concessions favorable to the borrower with the intent of supporting the borrower’s restructuring, such
as by reducing or exempting interest, postponing principal or interest payments, releasing credits, or providing other benefits to the borrowers
(excluding loans to bankrupt borrowers, delinquent loans, and loans that are delinquent for over three months from above).
6. Interest that is not accrued for loans of borrowers who are deemed to be bankrupt, quasi-bankrupt, or doubtful based on the results of asset
self-assessment is not recorded as income.
12. Breakdown of Allowance for Doubtful Accounts (Million Yen)
Year ended March 31, 2018 Year ended March 31, 2017 Change
(1) Breakdown of allowance for doubtful accounts
(A) General allowance for doubtful accounts 1,197 1,503 (305)
(B) Specific allowance for doubtful accounts 1,204 1,379 (175)
(C) Allowance for specific overseas debts ― ― ―
(2) Specific allowance for doubtful accounts
(A) Provision 1,306 1,911 (604)
(B) Reversal 1,472 2,405 (933)
[excluding reversals with write-offs]
(C) Net provision (165) (494) 328
(3) Allowance for specific overseas debts
(A) Number of debtor countries ― ― ―
(B) Amounts of credit ― ― ―
(C) Provision ― ― ―
(D) Reversal ― ― ―
(4) Write-offs of loans ― ― ―
(Reference)
Status of Borrower Classification
(100 Million Yen, %)
As of March 31, 2018 As of March 31, 2017
Money available Money available
Percentage
of whole
Percentage
of whole
Loan balances 74,683 100.0 77,495 100.0
(After direct write-offs of category IV)
Noncategorized 74,249 99.4 76,878 99.2
Category II 430 0.6 611 0.8
Category III 2 0.0 4 0.0
Category IV ― ― ― ―
Notes: 1. Specific allowances for doubtful accounts of Category III were as follows: ¥0.2 billion and ¥0.3 billion as of March 31, 2018 and 2017, respectively.
2. The amounts of direct write-offs of Category IV were as follows: ¥0.1 billion and ¥0.5 billion as of March 31, 2018 and 2017, respectively.
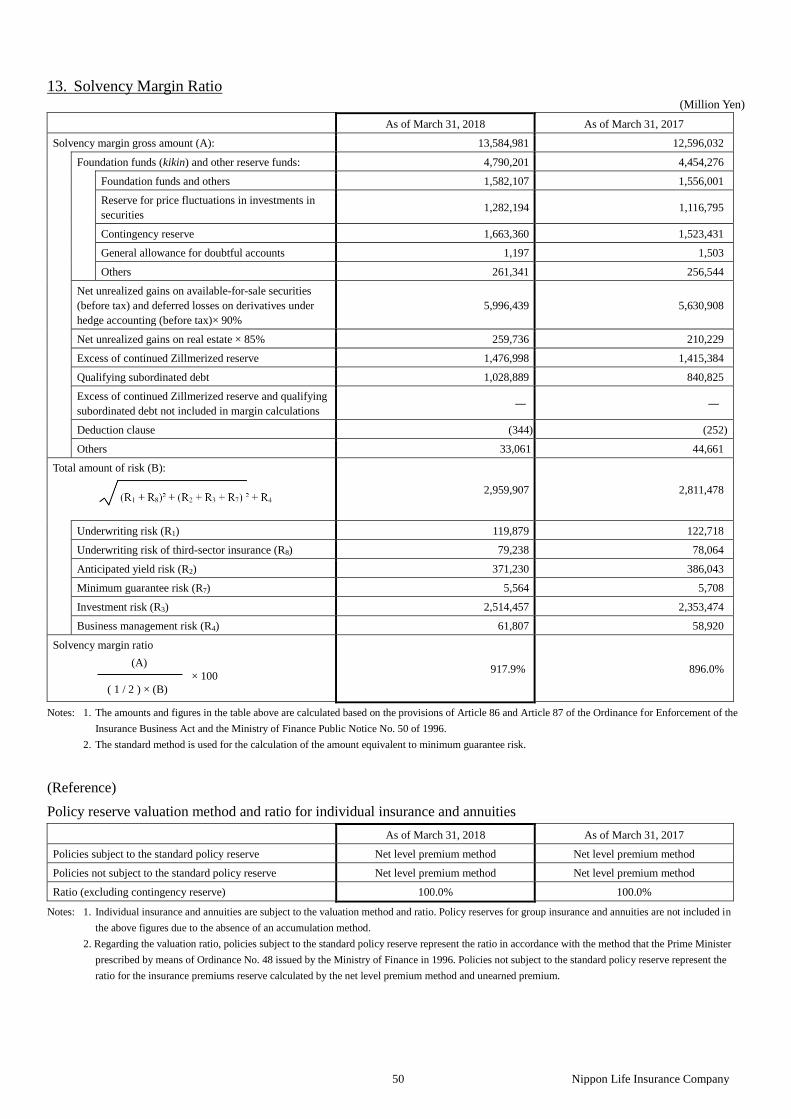
50 Nippon Life Insurance Company
13. Solvency Margin Ratio (Million Yen)
As of March 31, 2018 As of March 31, 2017
Solvency margin gross amount (A): 13,584,981 12,596,032
Foundation funds (kikin) and other reserve funds: 4,790,201 4,454,276
Foundation funds and others 1,582,107 1,556,001
Reserve for price fluctuations in investments in
securities 1,282,194 1,116,795
Contingency reserve 1,663,360 1,523,431
General allowance for doubtful accounts 1,197 1,503
Others 261,341 256,544
Net unrealized gains on available-for-sale securities
(before tax) and deferred losses on derivatives under
hedge accounting (before tax)× 90%
5,996,439 5,630,908
Net unrealized gains on real estate × 85% 259,736 210,229
Excess of continued Zillmerized reserve 1,476,998 1,415,384
Qualifying subordinated debt 1,028,889 840,825
Excess of continued Zillmerized reserve and qualifying
subordinated debt not included in margin calculations ― ―
Deduction clause (344) (252)
Others 33,061 44,661
Total amount of risk (B):
2,959,907 2,811,478
Underwriting risk (R1) 119,879 122,718
Underwriting risk of third-sector insurance (R8) 79,238 78,064
Anticipated yield risk (R2) 371,230 386,043
Minimum guarantee risk (R7) 5,564 5,708
Investment risk (R3) 2,514,457 2,353,474
Business management risk (R4) 61,807 58,920
Solvency margin ratio
(A)
× 100
( 1 / 2 ) × (B)
917.9% 896.0%
Notes: 1. The amounts and figures in the table above are calculated based on the provisions of Article 86 and Article 87 of the Ordinance for Enforcement of the
Insurance Business Act and the Ministry of Finance Public Notice No. 50 of 1996.
2. The standard method is used for the calculation of the amount equivalent to minimum guarantee risk.
(Reference)
Policy reserve valuation method and ratio for individual insurance and annuities
As of March 31, 2018 As of March 31, 2017
Policies subject to the standard policy reserve Net level premium method Net level premium method
Policies not subject to the standard policy reserve Net level premium method Net level premium method
Ratio (excluding contingency reserve) 100.0% 100.0%
Notes: 1. Individual insurance and annuities are subject to the valuation method and ratio. Policy reserves for group insurance and annuities are not included in
the above figures due to the absence of an accumulation method.
2. Regarding the valuation ratio, policies subject to the standard policy reserve represent the ratio in accordance with the method that the Prime Minister
prescribed by means of Ordinance No. 48 issued by the Ministry of Finance in 1996. Policies not subject to the standard policy reserve represent the
ratio for the insurance premiums reserve calculated by the net level premium method and unearned premium.

51 Nippon Life Insurance Company
14. Status of Separate Accounts for the Fiscal Year Ended March 31, 2018
(1) Balance of Separate Account Assets
(Million Yen)
As of March 31, 2018 As of March 31, 2017
Individual variable insurance 114,872 116,005
Individual variable annuities 43,478 41,905
Group annuities 1,135,789 1,157,881
Separate account total 1,294,140 1,315,792
(2) Status of Separate Accounts for Individual Variable Insurance
1) Policies in Force
As of March 31, 2018 As of March 31, 2017
Number of policies Amount of policies
(million yen) Number of policies
Amount of policies
(million yen)
Variable insurance (defined term type) 2,273 2,610 1,195 5,570
Variable insurance (whole life type) 32,628 463,376 33,300 479,050
Total 34,901 465,987 34,495 484,621
2) Breakdown of Separate Account Assets’ Year-End Balance (Individual Variable Insurance)
(Million Yen, %)
As of March 31, 2018 As of March 31, 2017
Amount Composition ratio Amount Composition ratio
Cash, deposits, and call loans 5,020 4.4 4,015 3.5
Investments in securities: 98,803 86.0 103,924 89.6
Domestic bonds 24,508 21.3 23,690 20.4
Domestic stocks 35,204 30.6 42,964 37.0
Foreign securities: 38,067 33.1 37,269 32.1
Foreign bonds 12,313 10.7 9,143 7.9
Foreign stocks and other securities 25,753 22.4 28,126 24.2
Other securities 1,022 0.9 ― ―
Loans ― ― ― ―
Others 11,048 9.6 8,066 7.0
Allowance for doubtful accounts ― ― ― ―
Total 114,872 100.0 116,005 100.0

52 Nippon Life Insurance Company
3) Investment Income and Expenses from Separate Accounts (Individual Variable Insurance)
(Million Yen)
Year ended March 31, 2018 Year ended March 31, 2017
Amount Amount
Interest, dividends, and other income 2,015 1,901
Gain on sales of securities 10,184 4,389
Gain on redemptions of securities ― ―
Gain on valuation of securities (1,489) 3,238
Foreign exchange gains, net 223 ―
Gain on derivative financial instruments, net 1,021 760
Other investment income 8 6
Loss on sales of securities 1,721 2,744
Loss on redemptions of securities ― ―
Loss on valuation of securities (347) (2,297)
Foreign exchange losses, net 231 89
Loss on derivative financial instruments, net 1,314 ―
Other investment expenses 2 2
Net investment income 9,041 9,756
(3) Status of Separate Accounts for Individual Variable Annuities
1) Policies in Force
As of March 31, 2018 As of March 31, 2017
Number of policies Amount of policies
(million yen) Number of policies
Amount of policies
(million yen)
Individual variable annuities 23,519 43,472 11,497 41,903
2) Breakdown of Separate Account Assets’ Year-End Balance (Individual Variable Annuities)
(Million Yen, %)
As of March 31, 2018 As of March 31, 2017
Amount Composition ratio Amount Composition ratio
Cash, deposits, and call loans ― ― ― ―
Investments in securities: 42,021 96.6 40,573 96.8
Domestic bonds 8,997 20.7 10,422 24.9
Domestic stocks ― ― ― ―
Foreign securities: ― ― ― ―
Foreign bonds ― ― ― ―
Foreign stocks and other securities ― ― ― ―
Other securities 33,023 76.0 30,150 71.9
Loans ― ― ― ―
Others 1,456 3.4 1,332 3.2
Allowance for doubtful accounts ― ― ― ―
Total 43,478 100.0 41,905 100.0
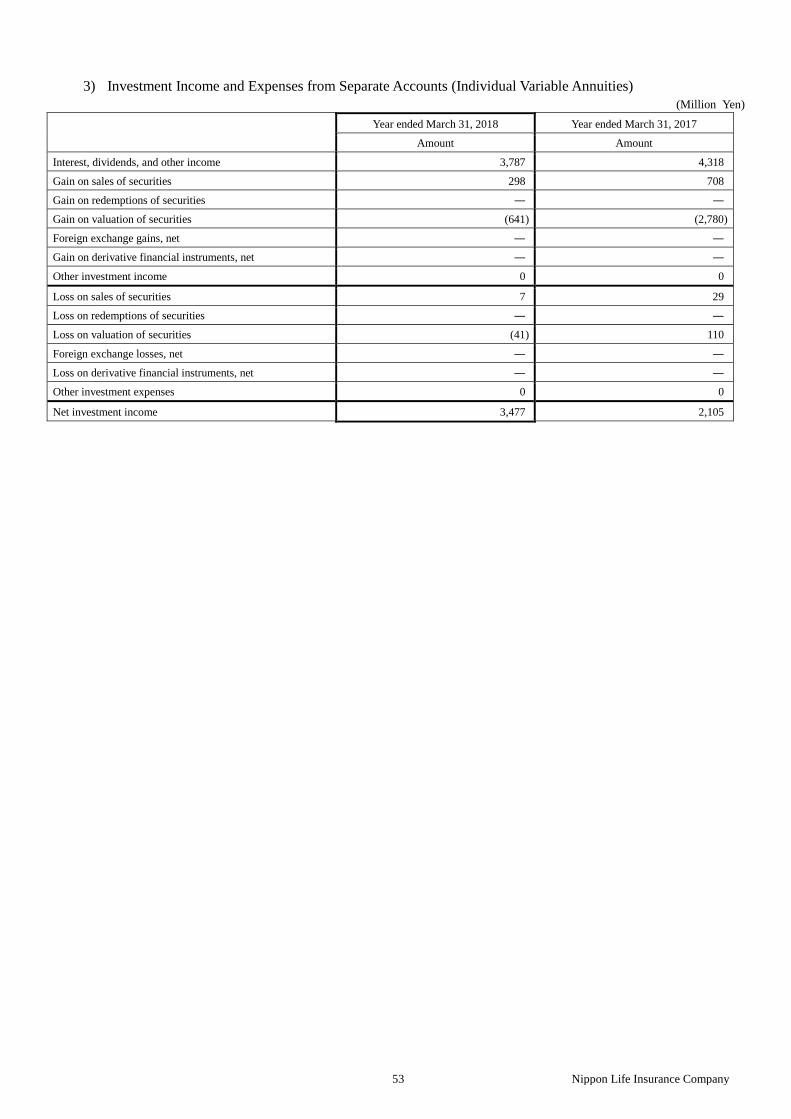
53 Nippon Life Insurance Company
3) Investment Income and Expenses from Separate Accounts (Individual Variable Annuities)
(Million Yen)
Year ended March 31, 2018 Year ended March 31, 2017
Amount Amount
Interest, dividends, and other income 3,787 4,318
Gain on sales of securities 298 708
Gain on redemptions of securities ― ―
Gain on valuation of securities (641) (2,780)
Foreign exchange gains, net ― ―
Gain on derivative financial instruments, net ― ―
Other investment income 0 0
Loss on sales of securities 7 29
Loss on redemptions of securities ― ―
Loss on valuation of securities (41) 110
Foreign exchange losses, net ― ―
Loss on derivative financial instruments, net ― ―
Other investment expenses 0 0
Net investment income 3,477 2,105

54 Nippon Life Insurance Company
15. Status of the Company, Subsidiaries, and Affiliates
(1) Selected Financial Data for Major Operations
(100 Million Yen)
Year ended March 31, 2018 Year ended March 31, 2017
Ordinary income 76,098 73,018
Ordinary profit 4,718 5,283
Net surplus attributable to the parent company 2,439 3,019
Comprehensive income (loss) 5,951 2,517
As of March 31, 2018 As of March 31, 2017
Total assets 743,925 724,642
Solvency margin ratio 968.0% 933.9%
(2) Scope of Consolidation and Application of the Equity Method
As of March 31, 2018
Number of consolidated subsidiaries 11
Number of subsidiaries not consolidated but accounted for under the equity method 0
Number of affiliates accounted for under the equity method 14
Changes in significant subsidiaries and affiliates during the period Additions: 5 The TCW Group, Inc. and 4 other companies
Removals:1 PanAgora Asset Management, Inc.

55 Nippon Life Insurance Company
(3) Policies of Presenting the Consolidated Financial Statements for the Fiscal Year Ended March 31, 2018
1) Consolidated subsidiaries
The consolidated financial statements include the accounts of the Company and the Company’s subsidiaries.
Consolidated subsidiaries as of March 31, 2018, are listed as follows:
Nissay Credit Guarantee Co., Ltd. (Japan)
Nissay Leasing Co., Ltd. (Japan)
Nissay Capital Co., Ltd. (Japan)
Nissay Asset Management Corporation (Japan)
Nissay Information Technology Co., Ltd. (Japan)
Mitsui Life Insurance Company Limited (Japan)
Nippon Life Insurance Company of America (U.S.A.)
NLI Commercial Mortgage Fund, LLC (U.S.A.)
NLI Commercial Mortgage Fund II, LLC (U.S.A.)
NLI US Investments, Inc. (U.S.A.)
MLC Limited (Australia)
The major subsidiaries excluded from consolidation are Nippon Life Global Investors Americas, Inc.,
Nissay Trading Corporation, and Nissay Insurance Agency Co., Ltd.
The respective and aggregate effects of the companies, which are excluded from consolidation, based on
total assets, revenues, net income, and surplus for the fiscal year ended March 31, 2018, are immaterial. This
exclusion from consolidation does not prevent a reasonable assessment of the financial position of the
Company and the Company’s subsidiaries and the result of their operations.
2) Affiliates
Major affiliates accounted for under the equity method as of March 31, 2018, are listed as follows:
The Master Trust Bank of Japan, Ltd. (Japan)
Corporate-Pension Business Service Co., Ltd. (Japan)
Great Wall Changsheng Life Insurance Co., Ltd. (China)
Bangkok Life Assurance Public Company Limited (Thailand)
Reliance Nippon Life Insurance Company Limited (India)
Reliance Nippon Life Asset Management Limited (India)
Post Advisory Group, LLC (U.S.A.)
PT Sequis (Indonesia)
PT Asuransi Jiwa Sequis Life (Indonesia)
The TCW Group, Inc. and four other companies

56 Nippon Life Insurance Company
The TCW Group, Inc. and four other companies have been included within the scope of equity method
accounting for the fiscal year ended March 31, 2018, due to the acquisition of equity interests by the
Company.
In addition, PanAgora Asset Management, Inc. has been excluded from the scope of equity method
accounting due to the sale of shares.
The subsidiaries not consolidated, such as Nippon Life Global Investors Americas, Inc., and Nissay Trading
Corporation, along with affiliates other than those listed above, such as SL Towers Co., Ltd., are not
accounted for under the equity method. The respective and aggregate effects of such companies on
consolidated net income and surplus for the fiscal year ended March 31, 2018, are immaterial.
The numbers of consolidated subsidiaries and affiliates as of March 31, 2018, were as follows:
Consolidated subsidiaries 11
Subsidiaries not consolidated but accounted for under the equity method 0
Affiliates accounted for under the equity method 14
3) The fiscal year-end dates of consolidated subsidiaries
The fiscal year-end date of consolidated overseas subsidiaries is December 31. In preparing the consolidated
financial statements, consolidated overseas subsidiaries are consolidated using financial statements based on
the fiscal year end of accounts as of December 31, and necessary adjustments are made to reflect significant
transactions that occurred between the Company’s fiscal year-end date of March 31 and December 31.
4) Amortization of goodwill
Goodwill and the equivalent amount of goodwill from affiliates accounted for under the equity method are
amortized under the straight-line method over 20 years.
However, for items that are immaterial, the total amount of goodwill is fully amortized as incurred.
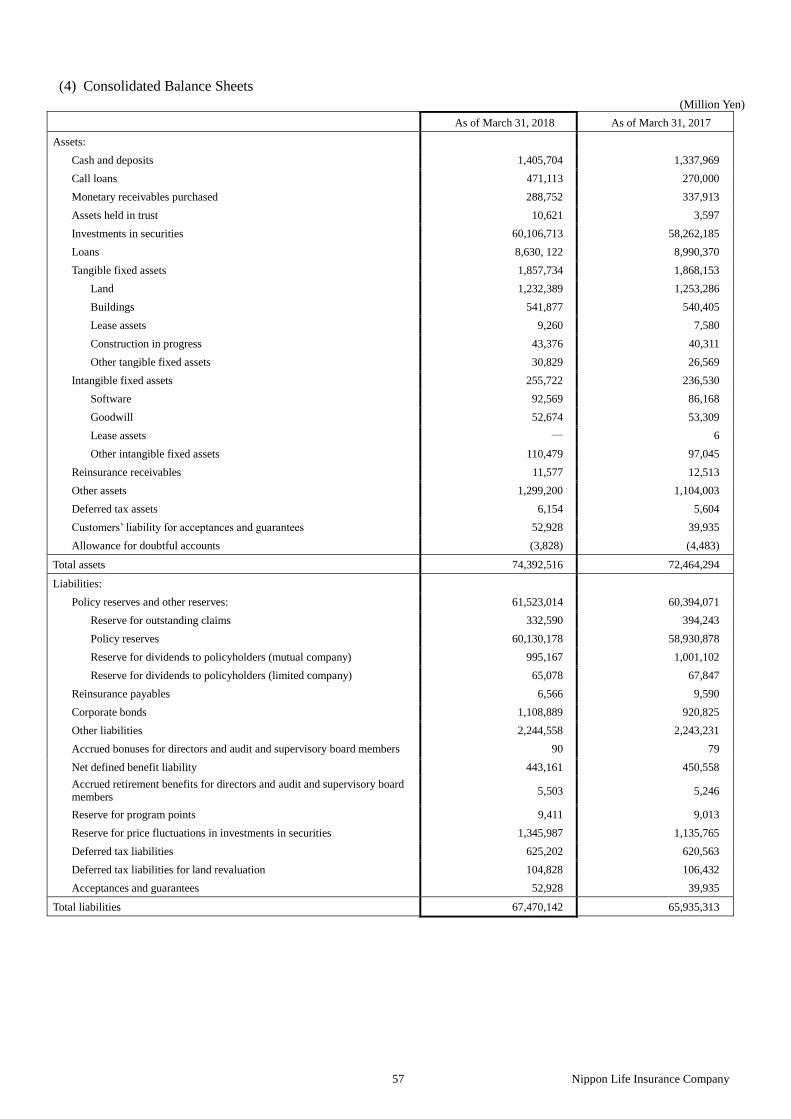
57 Nippon Life Insurance Company
(4) Consolidated Balance Sheets
(Million Yen)
As of March 31, 2018 As of March 31, 2017
Assets:
Cash and deposits 1,405,704 1,337,969
Call loans 471,113 270,000
Monetary receivables purchased 288,752 337,913
Assets held in trust 10,621 3,597
Investments in securities 60,106,713 58,262,185
Loans 8,630, 122 8,990,370
Tangible fixed assets 1,857,734 1,868,153
Land 1,232,389 1,253,286
Buildings 541,877 540,405
Lease assets 9,260 7,580
Construction in progress 43,376 40,311
Other tangible fixed assets 30,829 26,569
Intangible fixed assets 255,722 236,530
Software 92,569 86,168
Goodwill 52,674 53,309
Lease assets ― 6
Other intangible fixed assets 110,479 97,045
Reinsurance receivables 11,577 12,513
Other assets 1,299,200 1,104,003
Deferred tax assets 6,154 5,604
Customers’ liability for acceptances and guarantees 52,928 39,935
Allowance for doubtful accounts (3,828) (4,483)
Total assets 74,392,516 72,464,294
Liabilities:
Policy reserves and other reserves: 61,523,014 60,394,071
Reserve for outstanding claims 332,590 394,243
Policy reserves 60,130,178 58,930,878
Reserve for dividends to policyholders (mutual company) 995,167 1,001,102
Reserve for dividends to policyholders (limited company) 65,078 67,847
Reinsurance payables 6,566 9,590
Corporate bonds 1,108,889 920,825
Other liabilities 2,244,558 2,243,231
Accrued bonuses for directors and audit and supervisory board members 90 79
Net defined benefit liability 443,161 450,558
Accrued retirement benefits for directors and audit and supervisory board members
5,503 5,246
Reserve for program points 9,411 9,013
Reserve for price fluctuations in investments in securities 1,345,987 1,135,765
Deferred tax liabilities 625,202 620,563
Deferred tax liabilities for land revaluation 104,828 106,432
Acceptances and guarantees 52,928 39,935
Total liabilities 67,470,142 65,935,313

58 Nippon Life Insurance Company
(4) Consolidated Balance Sheets (Continued)
(Million Yen)
As of March 31, 2018 As of March 31, 2017
Net assets:
Foundation funds 150,000 150,000
Reserve for redemption of foundation funds 1,200,000 1,150,000
Reserve for revaluation 651 651
Consolidated surplus 625,131 622,388
Total foundation funds and others 1,975,782 1,923,039
Net unrealized gains on available-for-sale securities 4,918,602 4,588,092
Deferred losses on derivatives under hedge accounting (59,092) (65,262)
Land revaluation losses (60,989) (58,084)
Foreign currency translation adjustments 28,706 30,549
Remeasurement of defined benefit plans (18,632) (24,556)
Total accumulated other comprehensive income 4,808,594 4,470,738
Noncontrolling interests 137,996 135,203
Total net assets 6,922,373 6,528,981
Total liabilities and net assets 74,392,516 72,464,294

59 Nippon Life Insurance Company
Notes to the Consolidated Balance Sheets as of March 31, 2018
1. (1) Securities of the Company and certain consolidated subsidiaries (including items, such as deposits and
monetary receivables purchased, which are treated as securities based on the “Accounting Standard for
Financial Instruments” (ASBJ Statement No. 10) and securities within assets held in trust), are valued as
follows:
1) Trading securities are stated at fair value on the balance sheet date. The moving average method is
used for calculating cost basis.
2) Held-to-maturity debt securities are valued using the moving average method, net of accumulated
amortization (straight-line).
3) Policy-reserve-matching bonds are valued using the moving average method, net of accumulated
amortization (straight-line), in accordance with the Industry Audit Committee Report No. 21,
“Temporary Treatment of Accounting and Auditing Concerning Policy-Reserve-Matching Bonds in
the Insurance Industry,” issued by the JICPA.
4) Investments in subsidiaries and affiliates that are not consolidated nor accounted for under the equity
method (stocks issued by subsidiaries prescribed in Article 2, Paragraph 12 of the Insurance Business
Act or subsidiaries prescribed in Article 13-5-2, Paragraph 3 of the Order for Enforcement of the
Insurance Business Act and stocks issued by affiliates prescribed in Article 13-5-2, Paragraph 4 of the
Order for Enforcement of the Insurance Business Act) are stated at cost using the moving average
method.
5) Available-for-sale securities
a. Regarding securities with a fair value, stocks (including foreign stocks) are valued using the
average fair value during the period of one month before the balance sheet date (cost basis is
calculated using the moving average method). Other securities with a fair value are valued using
the fair value on the balance sheet date (cost basis is calculated using the moving average method).
b. Regarding securities of which the fair value is extremely difficult to be determined, bonds
(including foreign bonds) for which the difference between the purchase price and face value is due
to an interest rate adjustment are stated at cost using the moving average method, net of
accumulated amortization (straight-line). Other securities without readily determinable fair values
are stated at cost using the moving average method.
(2) Unrealized gains/losses, net of applicable taxes for available-for-sale securities, are recorded as a separate
component of net assets.

60 Nippon Life Insurance Company
2. Securities that are held for the purpose of matching the duration of outstanding liabilities within the subgroups
classified by insurance type, payment method, maturity period, currency, and investment policy are classified as
policy-reserve-matching bonds in accordance with the Industry Audit Committee Report No. 21, “Temporary
Treatment of Accounting and Auditing Concerning Policy-Reserve-Matching Bonds in the Insurance Industry,”
issued by the JICPA.
The company has specified and subcategorized the following insurance policies:
(1) The Company
1) All insurance policies for products other than single payment products and group annuities
2) All insurance policies for single payment products (denominated in yen) other than variable assumed
rate-type insurance
3) All insurance policies for group annuities other than guaranteed fixed-term rate products
4) All single payment products (denominated in U.S. dollars) other than the foregoing
5) All single payment products (denominated in Australian dollars) other than the foregoing
6) All single payment products (denominated in euros) other than the foregoing
(2) Mitsui Life Insurance Company Limited
1) Subcategory for whole life insurance and annuity insurance (8–27 years) (the component of future
cash flows generated from whole life insurance (including whole life insurance with term rider) and
annuity insurance for more than 7 years up to 27 years)
2) Subcategory for insured contributory pension plans (up to 27 years) (the component of future cash flows
generated from insured contributory pension plans for up to 27 years)
3) Subcategory for foreign currency-denominated single payment endowment insurance (Australian
dollars) (foreign currency-denominated single payment endowment insurance commencing on or after
October 1, 2017)
3. Derivative financial instruments and derivative financial instruments within assets held in trust are stated at fair
value.
4. (1) Tangible fixed assets are depreciated based on the following methods:
a. Tangible fixed assets (except for lease assets)
(i) Buildings
Straight-line method.
(ii) Assets other than the above
Primarily, the declining-balance method.
Certain other tangible fixed assets with an acquisition price of less than ¥200,000 of the Company
and certain consolidated subsidiaries are depreciated over a three-year period on a straight-line
basis.
b. Lease assets
(i) Lease assets related to financial leases where ownership is transferred
The same depreciation method applied to self-owned fixed assets.
61 Nippon Life Insurance Company
(ii) Lease assets related to financial leases where ownership is not transferred
Straight-line method based on lease period.
(2) Software, which is included within intangible fixed assets, is amortized using the straight-line method.
5. Assets and liabilities denominated in foreign currencies are translated into Japanese yen using the “Accounting
Standards for Foreign Currency Transactions” (Business Accounting Council).
Foreign currency-denominated available-for-sale securities of the Company, with exchange rates that have
significantly fluctuated and where recovery is not expected, are converted to Japanese yen using either the rate on
the balance sheet date or the average one-month rate prior to the balance sheet date, whichever indicates a weaker
yen. This translation difference is recorded as a loss on valuation of securities.
Moreover, translation differences related to bonds included in translation differences of foreign
currency-denominated available-for-sale securities held by certain consolidated subsidiaries are recorded as
foreign exchange gains/losses, net, while translation differences related to other foreign currency-denominated
available-for-sale securities are recorded as a separate component of net assets.
6. (1) An allowance for doubtful accounts for the Company is recognized in accordance with the Company’s
internal Asset Valuation Regulation and Write-Off/Provision Rule.
1) An allowance for loans to borrowers who are legally or substantially bankrupt, such as being bankrupt
or being in the process of civil rehabilitation proceedings, is recognized based on the amount of credit
remaining after directly deducting amounts expected to be collected through the disposal of collateral
or the execution of guarantees from the balance of loans (as mentioned at (4) below).
2) An allowance for loans to borrowers who are not currently legally bankrupt, but have a significant
possibility of bankruptcy is recognized at the amounts deemed necessary considering an assessment of
the borrowers’ overall solvency and the amounts remaining after deduction of amounts expected to be
collected through the disposal of collateral or the execution of guarantees.
3) An allowance for loans to borrowers other than the above is provided based on the borrowers’ balance
multiplied by the historical average (of a certain period) percentage of bad debt.
(2) All credits extended by the Company are assessed by responsible sections in accordance with the
Company’s internal Asset Valuation Regulation. The assessments are verified by the independent Asset
Auditing Department. The results of the assessments are reflected in the calculation of the allowance for
doubtful accounts.
(3) For consolidated subsidiaries, the Company records allowance amounts deemed necessary mainly in
accordance with the Company’s internal Asset Valuation Regulation and Write-Off/Provision Rule.
(4) The estimated uncollectible amount calculated by subtracting the amount of collateral value or the amount
collectible by the execution of guarantees from the balance of loans is directly deducted from the balance of

62 Nippon Life Insurance Company
loans (including loans with credits secured and/or guaranteed) made to legally or substantially bankrupt
borrowers. The estimated uncollectible amount was ¥251 million (including ¥117 million of credits secured
and/or guaranteed) as of March 31, 2018.
7. Accrued bonuses for directors and audit and supervisory board members are recognized based on amounts
estimated to be paid.
8. (1) Net defined benefit liability is the amount of retirement benefit obligations prepared for payment of
employee retirement benefits, less pension plan assets, based on the projected amounts as of March 31,2018.
(2) The accounting methods of the Company and certain consolidated subsidiaries used for retirement benefits
are as follows:
1) Attribution method for estimated retirement benefits: Benefit formula basis
2) Period of amortizing actuarial gains/losses: 5 years
3) Period of amortizing prior service costs: 5 years
9. Accrued retirement benefits for directors and audit and supervisory board members are recognized based on
estimated payment amounts under internal rules.
10. A reserve for program points is recognized based on the amount projected to be incurred for expenses from the
use of points granted to policyholders.
11. Reserve for price fluctuations in investments in securities is recognized based on Article 115 of the Insurance
Business Act.
12. Regarding financial leases where the Company or a consolidated subsidiary is the lessor, and ownership is not
transferred, if any, the Company recognizes income and expense at the time of receiving the lease fee as other
ordinary income and other ordinary expenses, respectively.
13. Hedge accounting is applied by the Company and certain consolidated subsidiaries based on the following
methods:
1) The Company and certain consolidated subsidiaries mainly apply the following hedge accounting methods:
The exceptional accounting treatment (“Tokurei-shori”) for interest rate swaps is applied to hedge the cash
flow volatility of certain loans denominated in Japanese yen and certain loans denominated in foreign
currencies; deferred hedge accounting for interest rate swaps is applied to hedge the interest rate fluctuation
exposures on certain insurance policies, based on the Industry Audit Committee Report No. 26, “Accounting
and Auditing Treatments related to Application of Accounting for Financial Instruments in the Insurance
Industry,” issued by the JICPA; deferred hedge accounting and designated hedge accounting
(“Furiate-shori”) for currency swaps are applied to hedge the cash flow volatility caused by foreign

63 Nippon Life Insurance Company
exchange rate fluctuations on certain foreign currency-denominated bonds, certain foreign
currency-denominated loans, and foreign currency-denominated subordinated corporate bonds issued by the
Company and certain consolidated subsidiaries; fair value hedge accounting for foreign exchange forward
contracts is applied to hedge the price fluctuation exposures related to foreign exchange rate fluctuations on
certain foreign currency-denominated bonds and other instruments; and fair value hedge accounting for
equity forward contracts is applied to hedge the price fluctuation exposures on certain domestic stocks.
2) Hedging instruments and hedged items
(Hedging instruments) (Hedged items)
Interest rate swaps Loans, foreign currency-denominated loans, and insurance policies
Currency swaps Foreign currency-denominated bonds, foreign currency-denominated loans,
and foreign currency-denominated subordinated corporate bonds
Foreign exchange forward contracts Foreign currency-denominated bonds and other instruments
Equity forward contracts Domestic stocks
3) Effectiveness of hedging activities is mainly evaluated by performing a ratio analysis of fair value
movement comparisons based on the hedging instruments and hedged items taken, which is in accordance
with the internal risk management policies of the Company and certain consolidated subsidiaries.
14. Consumption taxes and local consumption taxes of the Company and certain consolidated subsidiaries are
accounted for by the tax exclusion method. However, consumption taxes paid on certain asset transactions, which
are not deductible from consumption taxes withheld and are stipulated to be deferred under the Consumption Tax
Act, are deferred as prepaid expenses and amortized over a five-year period on a straight-line basis. Consumption
taxes other than deferred consumption taxes are expensed as incurred.
15. (1) Policy reserves of the Company and consolidated subsidiaries of domestic life insurance companies are
reserves set forth in accordance with Article 116 of the Insurance Business Act. Insurance premium reserves
are recognized based on the following methodology. In accordance with Article 69, Paragraph 5 of the
Ordinance for Enforcement of the Insurance Business Act, policy reserves include those that are reserved
for certain individual annuity policies.
1) Reserves for contracts subject to the standard policy reserve are calculated in accordance with the
method prescribed by the Commissioner of the Financial Services Agency (Ordinance No. 48 issued
by the Ministry of Finance in 1996).
2) Reserves for other contracts are calculated based on the net level premium method.
Matters concerning additional policy reserve amounts accumulated during the fiscal year ended
March 31, 2018, are as follows:
a. The Company
Additional policy reserve amounts were included to cover a possible deficiency in the amount of
the reserve for certain individual annuity policyholders. As a result, policy reserves increase by

64 Nippon Life Insurance Company
¥88,192 million, while ordinary profit and surplus before income taxes decrease by ¥88,192
million, compared to amounts that would have been recorded had the additional policy reserve
amounts not been included.
b. Mitsui Life Insurance Company Limited
Additional policy reserve amounts were included to cover a possible deficiency in the amount of
the reserve for certain individual annuity policyholders. As a result, policy reserves increase by
¥53,265 million, while ordinary profit and surplus before income taxes decrease by ¥53,265
million, compared to amounts that would have been recorded had the additional policy reserve
amounts not been included.
(2) Policy reserves of consolidated overseas life insurance companies are recorded as the amounts calculated in
accordance with the accounting standards of each country, such as Australian accounting standards.
16. Regarding the investment of the general accounts of the Company and certain consolidated subsidiaries (except
separate accounts as provided in Article 118, Paragraph 1 of the Insurance Business Act), in light of the
characteristics of life insurance policies, the Company and certain consolidated subsidiaries have built a portfolio
geared toward mid- to long-term investment and formulated an investment plan considering the outlook of the
investment environment.
Based on this, in order to reliably pay benefits and other payments in the future, the Company and certain
consolidated subsidiaries have positioned yen-denominated assets that can be expected to provide stable income,
such as bonds and loans, as the core assets of the Company and certain consolidated subsidiaries and from the
viewpoint of improving profit in the mid- to long-term, the Company and certain consolidated subsidiaries invest
in stocks and foreign securities. Also, from the viewpoint of effective investment, the Company and certain
consolidated subsidiaries mainly use derivative transactions for controlling asset investment risks. Specifically,
the Company uses interest rate swaps for the interest rate-related investments of the Company and certain
consolidated subsidiaries, foreign exchange forward contracts and currency options and swaps for the currency-
related investments of the Company and certain consolidated subsidiaries, and equity forward contracts equity
index futures and equity index options for the equity-related investments of the Company and certain consolidated
subsidiaries, and hedge accounting is applied with respect to a portion thereof.
The Company and certain consolidated subsidiaries mainly apply the following hedge accounting methods: The
exceptional accounting treatment (“Tokurei-shori”) for interest rate swaps is applied to hedge the cash flow
volatility of certain loans denominated in Japanese yen and certain loans denominated in foreign currencies;
deferred hedge accounting for interest rate swaps is applied to hedge the interest rate fluctuation exposures on
certain insurance policies, based on the Industry Audit Committee Report No. 26, “Accounting and Auditing
Treatments related to Application of Accounting for Financial Instruments in the Insurance Industry,” issued by
the JICPA; deferred hedge accounting and designated hedge accounting (“Furiate-shori”) for currency swaps are
applied to hedge the cash flow volatility caused by foreign exchange rate fluctuations on certain foreign
currency-denominated bonds, certain foreign currency-denominated loans, and foreign currency-denominated
subordinated corporate bonds issued by the Company and certain consolidated subsidiaries; fair value hedge
65 Nippon Life Insurance Company
accounting and deferred hedge accounting for foreign exchange forward contracts are applied to hedge the price
fluctuation exposures related to foreign exchange rate fluctuations on certain foreign currency-denominated bonds
and other instruments and certain foreign currency-denominated stocks; and fair value hedge accounting for
equity forward contracts is applied to hedge the price fluctuation exposures on certain domestic stocks. The
effectiveness of hedging activities is mainly evaluated by performing a ratio analysis of fair value movement
comparisons based on the hedging instruments and hedging methods taken, which is in accordance with the
internal risk management policies of the Company and certain consolidated subsidiaries.
Securities are mainly exposed to market risk and credit risk, loans are exposed to credit risk, and derivative
transactions are exposed to market risk and credit risk. Market risk refers to the risk of incurring losses when the
fair value of investment assets declines due to such factors as fluctuations in interest rates, exchange rates, or
stock prices. Credit risk refers to the risk of incurring losses when the value of assets, primarily loans and bonds,
declines due to deterioration of the financial condition of the party to whom credit has been extended. It includes
country risk. These risks are managed according to rules and regulations regarding investment risks.
To manage market risk, the Company and certain consolidated subsidiaries have implemented investment limits
based on the nature of the assets in order to avoid excessive losses from financing and investment transactions. In
addition, the Company and certain consolidated subsidiaries monitor and regularly report on the status of
compliance to the Risk Management Committee, the advisory body of the Management Committee, and have
developed a system to control risk within acceptable levels in the event of a breach of the internal rules. Also, to
control market risk in the portfolio of the Company and certain consolidated subsidiaries, the Company and
certain consolidated subsidiaries use a statistical analysis method to rationally calculate the market value-at-risk of
the portfolio as a whole and conduct appropriate asset allocation within acceptable boundaries of risk.
To manage credit risk, the Company and certain consolidated subsidiaries have built a thorough monitoring
system involving the Assessment Management Department, which is independent of the departments handling
investment and finance activities. The Company and certain consolidated subsidiaries also continue to build a
sound portfolio through the establishment and monitoring of interest guidelines to ensure the returns the Company
and certain consolidated subsidiaries obtain are commensurate with the risk, a system of internal ratings for
classifying the creditworthiness of borrowers, and credit ceilings to ensure that credit risk is not excessively
concentrated in a particular company, group, or country. In addition, the Company and certain consolidated
subsidiaries calculate credit value-at-risk as a measurement of the magnitude of credit risk across the portfolio of
the Company and certain consolidated subsidiaries as a whole, and monitor whether the magnitude of risk stays
within an appropriate range.
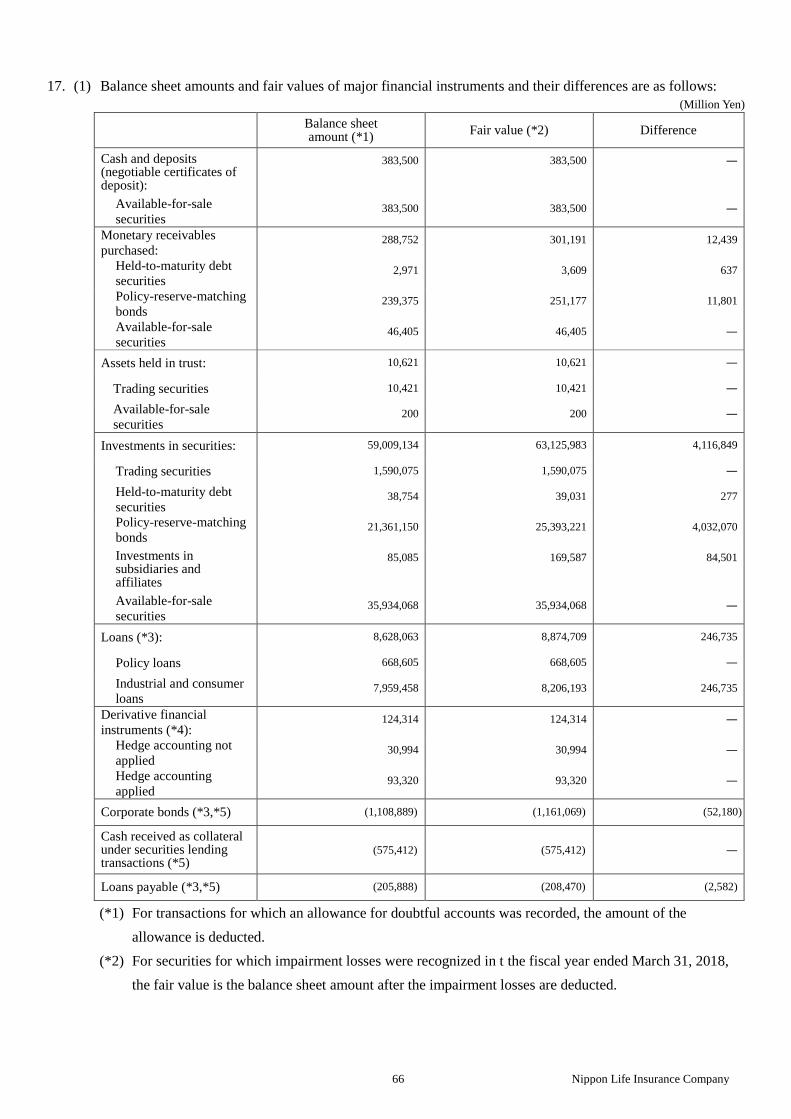
66 Nippon Life Insurance Company
17. (1) Balance sheet amounts and fair values of major financial instruments and their differences are as follows:
(Million Yen)
Balance sheet amount (*1)
Fair value (*2) Difference
Cash and deposits (negotiable certificates of deposit):
383,500 383,500 ―
Available-for-sale
securities 383,500 383,500 ―
Monetary receivables
purchased: 288,752 301,191 12,439
Held-to-maturity debt
securities 2,971 3,609 637
Policy-reserve-matching
bonds 239,375 251,177 11,801
Available-for-sale
securities 46,405 46,405 ―
Assets held in trust: 10,621 10,621 ―
Trading securities 10,421 10,421 ―
Available-for-sale
securities 200 200 ―
Investments in securities: 59,009,134 63,125,983 4,116,849
Trading securities 1,590,075 1,590,075 ―
Held-to-maturity debt
securities 38,754 39,031 277
Policy-reserve-matching
bonds 21,361,150 25,393,221 4,032,070
Investments in subsidiaries and affiliates
85,085 169,587 84,501
Available-for-sale
securities 35,934,068 35,934,068 ―
Loans (*3): 8,628,063 8,874,709 246,735
Policy loans 668,605 668,605 ―
Industrial and consumer
loans 7,959,458 8,206,193 246,735
Derivative financial
instruments (*4): 124,314 124,314 ―
Hedge accounting not
applied 30,994 30,994 ―
Hedge accounting
applied 93,320 93,320 ―
Corporate bonds (*3,*5) (1,108,889) (1,161,069) (52,180)
Cash received as collateral under securities lending transactions (*5)
(575,412) (575,412) ―
Loans payable (*3,*5) (205,888) (208,470) (2,582)
(*1) For transactions for which an allowance for doubtful accounts was recorded, the amount of the
allowance is deducted.
(*2) For securities for which impairment losses were recognized in t the fiscal year ended March 31, 2018,
the fair value is the balance sheet amount after the impairment losses are deducted.

67 Nippon Life Insurance Company
(*3) The fair values of derivative financial instruments that are interest rate swaps under exceptional
accounting treatment (“Tokurei-shori”) or currency swaps under designated hedge accounting
(“Furiate-shori”) are included in the fair values of loans, corporate bonds, and loans payable because
they are accounted for as an integral part of the loans, corporate bonds, and loans payable that are the
hedged items.
(*4) Assets and liabilities generated by derivative financial instruments are offset and presented net. Net
liabilities in total are presented in parentheses.
(*5) Corporate bonds, cash received as collateral under securities lending transactions, and loans payable are
recorded in liabilities and presented in parentheses.
(2) Fair value measurement methods for the major financial instruments of the Company and certain
consolidated subsidiaries are as follows:
1) Securities, deposits, and monetary receivables purchased that are treated as securities based on the
“Accounting Standard for Financial Instruments” (ASBJ Statement No. 10)
a. Items with a market price
Fair value is measured based on the closing market price on the balance sheet date. However, the
fair values of available-for-sale domestic and foreign equity securities are based on the average
market price over a one-month period prior to the balance sheet date.
b. Items without a market price
Fair value is measured by discounting future cash flows to present value or valuations obtained
from external information vendors.
2) Loans
a. Policy loans
Fair value is measured by the book value of the policy loans, as the fair value is deemed to
approximate book value, due to expected repayment periods, interest rate requirements, and other
characteristics. These loans have no repayment date either in form or in substance because stated
due dates can be extended if the loan amount is within certain range of its surrender benefit.
b. Industrial and consumer loans
Fair value of variable interest rate loans is deemed to approximate book value because market
interest rates are reflected in future cash flows over the short term. Thus, book value is used as fair
value for variable interest rate loans.
Fair value of fixed interest rate loans is measured mainly by discounting future cash flows to
present value.
Fair value of loans to legally or substantially bankrupt borrowers or borrowers who are not currently
legally bankrupt but have a high probability of bankruptcy are measured by deducting the estimated
uncollectible amount from the book value prior to direct write-offs.
3) Derivative financial instruments

68 Nippon Life Insurance Company
a. Fair value of futures and other market transactions is measured by the liquidation value or closing
market price on the balance sheet date.
b. Fair value of equity options is measured mainly based on liquidation value or closing market price
on the balance sheet date or valuations obtained from external information vendors.
c. Fair value of foreign exchange contracts, currency options, interest rate swaps, currency swaps, and
forward contracts is measured mainly based on valuations obtained from external information
vendors.
4) Assets held in trust
Fair value is based on a reasonably calculated price by the trustee of the assets held in trust, in
accordance with the calculation methods set forth in 1) and 3) above.
5) Corporate bonds
Corporate bonds are stated at fair value on the balance sheet date.
6) Cash received as collateral under securities lending transactions
The book value is used as fair value due to their short-term settlement.
7) Loans payable
Fair value of variable interest rate loans payable is deemed to approximate book value because market
interest rates are reflected in future cash flows over the short term. Thus, book value is used as fair
value for variable interest rate loans payable. Fair value of fixed interest rate loans payable is
measured mainly by discounting future cash flows to present value.
(3) Unlisted equity securities, investments in partnerships whereby partnership assets consist of unlisted equity
securities, and other items of which the fair value is extremely difficult to be determined are not included in
investments in securities in table (1).
Balance sheet amounts were ¥1,097,579 million as of March 31, 2018.
(4) Matters regarding securities and others by holding purpose are as follows:
1) Trading securities
Derivative financial instruments within assets held in trust, investments in securities for separate
accounts and certain other securities are classified as trading securities as of March 31, 2018.
Valuation gains/losses included in profit and loss were gains of ¥55,422 million for derivative
financial instruments within assets held in trust and investments in securities related to separate
accounts for the current fiscal year.
2) Held-to-maturity debt securities
Balance sheet amounts, fair values, and their differences by type are as follows:

69 Nippon Life Insurance Company
(Million Yen)
Type Balance sheet amount Fair value Difference
Fair value exceeds
the balance sheet
amount
Monetary receivables
purchased 2,971 3,609 637
Domestic bonds 19,709 20,036 326
Foreign securities 1,510 1,519 8
Subtotal 24,191 25,164 972
Fair value does not
exceed the balance
sheet amount
Domestic bonds 6,148 6,143 (4)
Foreign securities 11,385 11,332 (53)
Subtotal 17,533 17,476 (57)
Total 41,725 42,640 914
3) Policy-reserve-matching bonds
Balance sheet amounts, fair values, and their differences by type are as follows:
(Million Yen)
Type Balance sheet amount Fair value Difference
Fair value exceeds
the balance sheet
amount
Monetary receivables
purchased 223,375 245,210 11,835
Domestic bonds 21,034,072 25,070,184 4,036,111
Foreign securities 78,681 81,096 2,415
Subtotal 21,346,129 25,396,491 4,050,361
Fair value does not
exceed the balance
sheet amount
Monetary receivables
purchased 6,000 5,966 (33)
Domestic bonds 239,366 233,023 (6,343)
Foreign securities 9,029 8,917 (112)
Subtotal 254,396 247,907 (6,488)
Total 21,600,526 25,644,398 4,043,872

70 Nippon Life Insurance Company
4) Available-for-sale securities
Acquisition cost or amortized cost, balance sheet amounts, and their differences by type are as follows:
(Million Yen)
Type Acquisition cost or
amortized cost Balance sheet
amount Difference
Balance sheet
amount exceeds
acquisition cost or
amortized cost
Cash and deposits
(negotiable certificates of deposit) 307,500 307,500 0
Monetary receivables purchased 9,028 9,959 930
Domestic bonds 3,638,120 3,867,815 229,694
Domestic stocks 3,671,499 8,604,623 4,933,124
Foreign securities 10,070,068 11,947,002 1,876,934
Other securities 1,942,873 2,145,560 202,687
Subtotal 19,639,090 26,882,463 7,243,372
Balance sheet
amount does not
exceed acquisition
cost or amortized
cost
Cash and deposits
(negotiable certificates of deposit) 76,000 75,999 (0)
Monetary receivables purchased 36,649 36,445 (203)
Assets held in trust 200 200 ―
Domestic bonds 366,440 356,799 (9,641)
Domestic stocks 869,622 750,093 (119,529)
Foreign securities 8,078,281 7,742,435 (335,846)
Other securities 531,266 519,738 (11,528)
Subtotal 9,958,460 9,481,711 (476,749)
Total 29,597,551 36,364,174 6,766,622
* Securities totaling ¥770,147 million, whose fair value is extremely difficult to determine are not included.
¥157 million in impairment losses was recognized for securities with a fair value during the fiscal year
ended March 31, 2018.
Regarding stocks (including foreign stocks) with fair values of the Company and certain consolidated
subsidiaries, impairment losses are recognized for stocks whose fair value has declined significantly
from the acquisition price based on the average fair value in the month preceding the balance sheet
date, in principle. However, in the case of a security that meets certain criteria, such as a security for
which the fair value declines substantially and the decline in the fair value in the month preceding the
balance sheet date is substantial, impairment losses are recognized based on the fair value on the
balance sheet date.
The criteria by which the fair value of a stock is deemed to have declined significantly are as follows:
a. A security for which the ratio of the average fair value in the month preceding the balance sheet
date to the acquisition cost is 50% or less.

71 Nippon Life Insurance Company
b. A security that meets both of the following criteria:
1. Average fair value in the month preceding the balance sheet date is between 50% and 70% of its
acquisition cost.
2. The historical fair value, the business conditions of the issuing company, and other aspects are
subject to certain requirements.
(5) Scheduled repayment amounts for the main monetary claims and liabilities and redemption amounts for
securities with maturities are as follows:
(Million Yen)
1 year or under Over 1 year
under 5 years
Over 5 years
under 10 years Over 10 years
Cash and deposits (negotiable certificates of deposit):
383,500 ― ― ―
Available-for-sale securities 383,500 ― ― ―
Monetary receivables purchased: 23,000 5,834 29,718 229,186
Held-to-maturity debt securities ― ― ― 2,971
Policy-reserve-matching bonds ― 5,682 29,564 203,911
Available-for-sale securities 23,000 152 153 22,303
Investment in securities: 898,346 4,922,007 10,686,740 28,274,456
Held-to-maturity debt securities 12,463 19,629 4,045 2,389
Policy-reserve-matching bonds 349,492 1,273,346 4,487,861 14,988,982
Available-for-sale securities 536,390 3,629,031 6,194,833 13,283,085
Loans (*1) 1,074,869 2,915,020 1,954,034 1,971,594
Corporate bonds ― ― ― 1,078,889
Cash received as collateral under securities lending transactions
575,412 ― ― ―
Loans payable (*2) 39,408 51,093 15,381 ―
(*1) Assets, such as policy loans, which do not have a stated maturity date, are not included.
Also, ¥4,100 million in loans to legally or substantially bankrupt borrowers or borrowers who are not currently legally
bankrupt, but have a high probability of bankruptcy is not included.
(*2) Liabilities, such as subordinated loans payable, which do not have a stated maturity date, are not included.
18. The balance sheet amount for investment and rental properties was ¥1,247,234 million, with a fair value of
¥1,430,349 million as of March 31, 2018.
The Company and certain consolidated subsidiaries own rental office buildings and commercial facilities, the fair
value of which as of March 31, 2018, was the amount measured based mainly on the “Real Estate Appraisal
Standards.”
The amount corresponding to asset retirement obligations that were included in the balance sheet amounts of
investment and rental properties was ¥497 million as of March 31, 2018.

72 Nippon Life Insurance Company
19. (1) The total amount of loans to bankrupt borrowers, delinquent loans, loans that are delinquent for over three
months, and restructured loans, which were included in loans, was ¥31,097 million as of March 31, 2018.
1) The balances of loans to bankrupt borrowers and delinquent loans were ¥1,511 million and ¥27,397
million, respectively, as of March 31, 2018.
Loans to bankrupt borrowers are loans for which interest is not accrued as income, except for a
portion of loans written off, and to which any event specified in Article 96, Paragraph 1, Item 3 (a) to
(e) or Item 4 of the Order for Enforcement of the Corporation Tax Act has occurred. Interest is not
accrued as income for the loans since the recovery of principal or interest on the loans is unlikely due
to the fact that principal repayments or interest payments are overdue for a significant period of time
or for other reasons.
Delinquent loans are loans for which interest is not accrued and exclude loans to bankrupt borrowers
and loans with interest payments extended with the objective of restructuring or supporting the
borrowers.
2) There were no loans delinquent for over three months as of March 31, 2018.
Loans that are delinquent for over three months are loans with principal or interest unpaid for over
three months beginning one day after the due date based on the loan agreement. These loans exclude
loans classified as loans to bankrupt borrowers and delinquent loans.
3) The balance of restructured loans was ¥2,188 million as of March 31, 2018.
Restructured loans are loans that provide certain concessions favorable to borrowers with the intent of
supporting the borrowers’ restructuring, such as by reducing or exempting interest, postponing
principal or interest payments, releasing credits, or providing other benefits to the borrowers. These
loans exclude loans classified as loans to bankrupt borrowers, delinquent loans, and loans delinquent
for over three months.
(2) Direct write-offs of loans decreased the balances of loans to bankrupt borrowers and delinquent loans by
¥15 million and ¥235 million, respectively, as of March 31, 2018.
20. The amount of accumulated depreciation of tangible fixed assets was ¥1,160,122 million as of March 31, 2018.
21. Separate account assets as provided for in Article 118, Paragraph 1 of the Insurance Business Act were ¥1,521,665
million as of March 31, 2018 and a corresponding liability is recorded in the same amount.

73 Nippon Life Insurance Company
22. Changes in the reserve for dividends to policyholders (mutual company) for the fiscal year ended March 31, 2018,
were as follows:
Million Yen
Year ended March 31,
2018
a. Balance at the beginning of the current fiscal year ¥1,001,102
b. Transfer to reserve from surplus in the previous fiscal year ¥184,086
c. Dividends paid to policyholders (mutual company) ¥212,224
d. Increase in interest ¥22,203
e. Balance at the end of the current fiscal year (a+b-c+d) ¥995,167
23. Changes in the reserve for dividends to policyholders (limited company) for the fiscal year ended March 31, 2018,
were as follows:
Million Yen
Year ended March 31,
2018
a. Balance at the beginning of the current fiscal year ¥67,847
b. Dividends paid to policyholders (limited company) ¥20,053
c. Increase in interest ¥12
d. Provision for reserve for dividends to policyholders (limited
company)
¥17,272
e. Balance at the end of the current fiscal year (a-b+c+d) ¥65,078
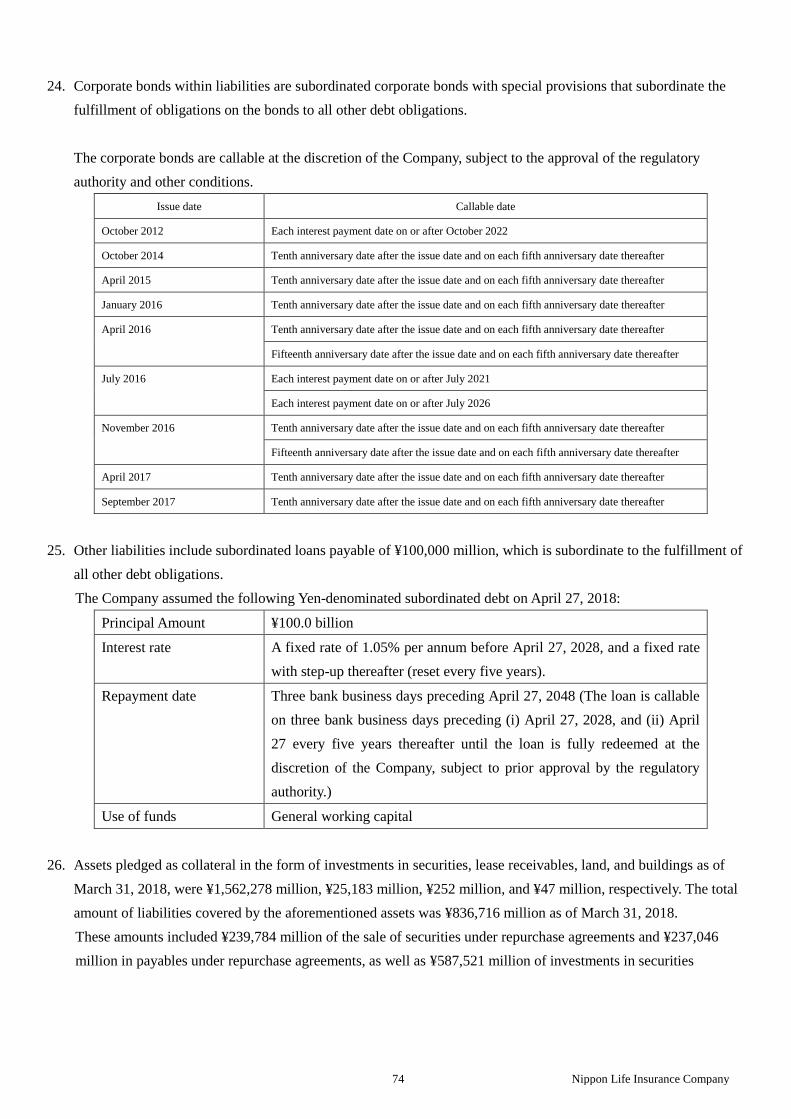
74 Nippon Life Insurance Company
24. Corporate bonds within liabilities are subordinated corporate bonds with special provisions that subordinate the
fulfillment of obligations on the bonds to all other debt obligations.
The corporate bonds are callable at the discretion of the Company, subject to the approval of the regulatory
authority and other conditions.
Issue date Callable date
October 2012 Each interest payment date on or after October 2022
October 2014 Tenth anniversary date after the issue date and on each fifth anniversary date thereafter
April 2015 Tenth anniversary date after the issue date and on each fifth anniversary date thereafter
January 2016 Tenth anniversary date after the issue date and on each fifth anniversary date thereafter
April 2016 Tenth anniversary date after the issue date and on each fifth anniversary date thereafter
Fifteenth anniversary date after the issue date and on each fifth anniversary date thereafter
July 2016 Each interest payment date on or after July 2021
Each interest payment date on or after July 2026
November 2016 Tenth anniversary date after the issue date and on each fifth anniversary date thereafter
Fifteenth anniversary date after the issue date and on each fifth anniversary date thereafter
April 2017 Tenth anniversary date after the issue date and on each fifth anniversary date thereafter
September 2017 Tenth anniversary date after the issue date and on each fifth anniversary date thereafter
25. Other liabilities include subordinated loans payable of ¥100,000 million, which is subordinate to the fulfillment of
all other debt obligations.
The Company assumed the following Yen-denominated subordinated debt on April 27, 2018:
Principal Amount ¥100.0 billion
Interest rate A fixed rate of 1.05% per annum before April 27, 2028, and a fixed rate
with step-up thereafter (reset every five years).
Repayment date Three bank business days preceding April 27, 2048 (The loan is callable
on three bank business days preceding (i) April 27, 2028, and (ii) April
27 every five years thereafter until the loan is fully redeemed at the
discretion of the Company, subject to prior approval by the regulatory
authority.)
Use of funds General working capital
26. Assets pledged as collateral in the form of investments in securities, lease receivables, land, and buildings as of
March 31, 2018, were ¥1,562,278 million, ¥25,183 million, ¥252 million, and ¥47 million, respectively. The total
amount of liabilities covered by the aforementioned assets was ¥836,716 million as of March 31, 2018.
These amounts included ¥239,784 million of the sale of securities under repurchase agreements and ¥237,046
million in payables under repurchase agreements, as well as ¥587,521 million of investments in securities

75 Nippon Life Insurance Company
deposited and ¥575,412 million of cash received as collateral under securities lending transactions secured by
cash, as of March 31, 2018.
27. ¥50,000 million of foundation funds were offered pursuant to Article 60 of the Insurance Business Act during the
fiscal year ended March 31, 2018.
28. The Company redeemed ¥50,000 million of foundation funds and credited the same amount to reserve for
redemption of foundation funds as prescribed in Article 56 of the Insurance Business Act for the fiscal year ended
March 31, 2018.
29. The total amount of stocks and investments in nonconsolidated subsidiaries and affiliates was ¥412,517 million as
of March 31, 2018.
30. Matters concerning transactions with noncontrolling interests and the acquisition of subsidiaries, etc., agreed
during the fiscal year ended March 31, 2018, are as follows:
(1) Nissay Asset Management Corporation
On February 9, 2018, the Company acquired 10% of the shares of Nissay Asset Management Corporation
(hereinafter, “Nissay Asset”) from Putnam Investments (hereinafter, “Putnam”), a U.S. asset management
company, thereby converting Nissay Asset into a wholly owned subsidiary.
1) Overview of the transaction
a. Name and business of the acquiree
Name: Nissay Asset Management Corporation
Business: Asset management business
b. Business combination date
January 1, 2018 (deemed acquisition date)
c. Legal form of the business combination
Conversion into a wholly owned subsidiary through the acquisition of additional shares from a
noncontrolling shareholder
d. Name of company after business combination
Nissay Asset Management Corporation
e. Other matters concerning the overview of the transaction
The Group has long worked to strengthen the asset management business. At this time, the
Company has converted Nissay Asset into a wholly owned subsidiary by acquiring all of the Nissay
Asset shares owned by Putnam, in order to reinforce and expand the asset management business.
2) Overview of accounting treatment that was applied
The Company has accounted for the transaction as a transaction with a noncontrolling shareholder
within the category of transactions under common control. This accounting treatment is based on the
“Accounting Standard for Business Combinations” (ASBJ* Statement No. 21) and the “Guidance on

76 Nippon Life Insurance Company
Accounting Standard for Business Combinations and Accounting Standard for Business Divestitures”
(ASBJ Guidance No. 10).
3) Acquisition cost and breakdown by type of consideration
Consideration for acquisition: payment in cash
¥15,065 million
Acquisition cost
¥15,065 million
4) Matters concerning changes in the Company’s equity with respect to the transaction with the
noncontrolling shareholder
a. Main reasons for changes in consolidated surplus:
Acquisition of additional shares of a subsidiary
b. Decrease in consolidated surplus due to the transaction with the noncontrolling shareholder:
¥8,940 million
(2) MassMutual Life Insurance Company
On March 1, 2018, the Company agreed with Massachusetts Mutual Life Insurance Company and MassMutual
International LLC (hereinafter, “MMI”) to acquire approximately 85.1% of the issued and outstanding shares
of MassMutual Life Insurance Company (hereinafter, “MassMutual Japan”) from MMI.
1) Purpose of the stock acquisition
The purpose of the stock acquisition is to build a structure that can accommodate a wide range of
customers’ needs in the financial institution bancassurance market in order to continuously expand
policyholders’ profit by expanding the profit base of group business.
2) Overview of MassMutual Japan
a. Company Name: MassMutual Life Insurance Company
b. Business: Life insurance business
c. Head Office: Shinagawa-ku, Tokyo (Tokyo Head Office)
Fukuoka-shi, Fukuoka (Fukuoka Head Office)
d. Premium Income: ¥322.9 billion (Year ended March 31, 2017)
3) The stock acquisition schedule
The stock acquisition is scheduled to take place at or after the end of May 2018.
4) The acquisition cost
The acquisition cost for the shares is expected to be approximately ¥104.2 billion and the acquisition will
be funded by the Company’s cash on hand.

77 Nippon Life Insurance Company
5) Ownership ratio after the acquisition
Approximately 85.1%
6) Others
The acquisition of MassMutual Japan shares requires approvals of the Commissioner of the Financial
Services Agency pursuant to Article 271-10, Paragraph 1 and Article 106, Paragraph 7 of the Insurance
Business Act.
(3) Establishment of a life insurance subsidiary
At a meeting of the Board of Directors held on May 23, 2018, the Company passed a resolution to establish
Nippon Life Insurance Preparrtory Company Ltd. (hereinafter, the “Preparatory Company”) for the
establishment of a new life insurance company (hereinafter, the “New Company”).
1) Purpose of establishing the New Company
The purpose of establishing the New Company is to flexibly and dynamically provide services to
independent insurance agencies and related entities in order to more appropriately address diversifying
customer needs and growing sale channels.
2) Overview of the Preparatory Company (pending for the New Company)
a. Company Name: NIPPON LIFE INSUARANCE PREPARATORY COMPANY Ltd
b. The location of its head office: Minato-ku, Tokyo
c. Capital stock: ¥10 billion
3) Schedule for the establishment
The Preparatory Company is scheduled to be established on July 2, 2018.
4) Ownership ratio after the establishment of the Preparatory Company (pending for the New Company)
100%
5) Others
The establishment of the New Company requires the acquisition of approvals of the Commissioner of the
Financial Services Agency pursuant to Article 271-10, Paragraph 1 and Article 106, Paragraph 7 of the
Insurance Business Act by the Company and the acquisition of a life insurance business license pursuant
to Article 3 of the Insurance Business Act by the Preparatory Company.
31. The amount of securities lent under lending agreements was ¥3,053,767 million as of March 31, 2018.
32. Assets that can be sold or resecured are marketable securities borrowed under lending agreements. These assets
were held without being sold or resecured and totaled ¥520,816 million at fair value as of March 31, 2018.
33. The amount of commitments related to loans and loans outstanding was ¥265,022 million as of March 31, 2018.
34. Of the maximum borrowing amount from the Life Insurance Policyholders Protection Corporation of Japan,
which is provided for in Article 37-4 of the Order for Enforcement of the Insurance Business Act, the amount

78 Nippon Life Insurance Company
applied to the Company and certain consolidated subsidiaries was estimated to be ¥91,262 million as of March 31,
2018.
The amount contributed to the aforementioned corporation was recorded within operating expenses.
35. Information relating to retirement benefits is as follows:
(1) Summary of retirement benefit plans
In terms of defined benefit plans, the Company has a defined benefit corporate pension plan and a lump-sum
retirement payment plan for non-sales personnel and sales management personnel, etc.
In terms of defined contribution plans, the Company has a defined contribution pension plan.
The Company also has a defined benefit plan for sales representatives, etc., in the form of a lump-sum
retirement payment plan and an in-house pension plan.
Certain consolidated subsidiaries mainly have a lump-sum retirement payment plan as a defined benefit plan
and a defined contribution pension plan as a defined contribution plan.
(2) Defined benefit plan
1) Reconciliation of retirement benefit obligations at the beginning and end of the fiscal year
Million Yen
Year ended
March 31, 2018
a. Retirement benefit obligations at the beginning of the year ¥720,187
b. Service costs ¥28,304
c. Interest cost ¥4,352
d. Actuarial losses accrued during the year ¥3,681
e. Retirement benefit payments ¥(49,362)
f. Others ¥1
g. Retirement benefit obligations at the end of the year (a+b+c+d+e+f) ¥707,164
2) Reconciliation of pension plan assets at the beginning and end of the fiscal year
Million Yen
Year ended
March 31, 2018
a. Pension plan assets at the beginning of the year ¥271,613
b. Expected return on plan assets ¥3,844
c. Actuarial gains accrued during the year ¥2,539
d. Contributions by business proprietor ¥7,302
e. Retirement benefit payments ¥(19,117)
f. Pension plan assets at the end of the year (a+b+c+d+e) ¥266,183

79 Nippon Life Insurance Company
3) Reconciliation of net defined benefit liability at the beginning and end of the fiscal year under the simplified
valuation method
Million Yen
Year ended
March 31, 2018
a. Net defined benefit liability at the beginning of the year ¥1,984
b. Benefit costs ¥322
c. Retirement benefit payments ¥(126)
d. Net defined benefit liability at the end of the year (a+b+c) ¥2,180
4) Reconciliation of retirement benefit obligations, pension plan assets, and net defined benefit liability on the
consolidated balance sheet
Million Yen
Year ended
March 31, 2018
a. Retirement benefit obligations for funded plans ¥294,371
b. Pension plan assets ¥(266,183)
¥28,188
c. Retirement benefit obligations for nonfund plans ¥414,973
d. Net defined benefit liability recorded in the consolidated balance
sheet
¥443,161
e. Net defined benefit liability ¥443,161
f. Net defined benefit liability recorded in the consolidated balance
sheet
¥443,161
5) Losses (gains) relating to retirement benefits
Million Yen
Year ended
March 31, 2018
a. Service costs ¥28,304
b. Interest cost ¥4,352
c. Expected return on plan assets ¥(3,844)
d. Amortization of actuarial losses for the period ¥9,311
e. Benefit cost under the simplified valuation method ¥322
f. Others ¥1
g. Benefit cost for defined benefit plans (a+b+c+d+e+f) ¥38,447

80 Nippon Life Insurance Company
6) Breakdown of items included in other comprehensive income.
The breakdown of items included in other comprehensive income (before tax) is as follows:
Million Yen
Year ended
March 31, 2018
Actuarial losses ¥8,169
Total ¥8,169
7) Breakdown of items included in total accumulated other comprehensive income
The breakdown of items included in total accumulated other comprehensive income (before tax) is as follows:
Million Yen
Year ended
March 31, 2018
Unrecognized actuarial losses ¥26,385
Total ¥26,385
8) Pension plan assets consist of the following:
a. General account of Nippon Life 50.2%
b. Domestic bonds 22.0%
c. Foreign securities 14.8%
d. Cash and deposits 7.7%
e. Domestic stocks 5.4%
f. Other 0.0%
g. Total (a+b+c+d+e+f) 100.0%
9) Calculation method for long-term expected rate of return on plan assets
To determine the long-term expected rate of return on pension plan assets, the Company takes into
consideration present and forecasted allocation of the pension plan assets, and present and long-term rates of
return that are expected from the portfolio of assets that comprise the pension plan assets.
10) Matters relating to the basis for actuarial calculations
The main items in the basis for actuarial calculations of the Company and certain consolidated subsidiaries
as of March 31, 2018, are as follows:
a. Discount rate 0.6-0.7%
b. Long-term expected rate of return on plan assets 1.4-3.0%

81 Nippon Life Insurance Company
(3) Defined contribution plans
The Company and its consolidated subsidiaries contributed ¥4,768 million to defined contribution plans
during the fiscal year ended March 31, 2018.
36. (1) Total deferred tax assets were ¥1,562,626 million and total deferred tax liabilities were ¥2,080,903 million
as of March 31, 2018. Among deferred tax assets, the deduction for the valuation allowance was ¥100,772
million. The major components resulting in deferred tax assets were policy reserves and other reserves of
¥873,955 million, reserve for price fluctuations in investments in securities of ¥375,549 million, and net
defined benefit liability of ¥124,983 million. The major component resulting in deferred tax liabilities was
net unrealized gains on available-for-sale securities of ¥1,902,132 million.
(2) The statutory tax rate was 28.2% for the fiscal year ended March 31, 2018. The main factor for the difference
between the statutory tax rate and the effective income tax rate was a decrease of 24.3% due to the amount
of reserve for dividends to policyholders (mutual company).
37. Revaluation of land used in the operations of the Company is performed based on the Act on Revaluation of Land.
The tax effect of the amount related to the valuation difference between book value and the revalued amount for
land revaluation is recognized as a deferred tax liability within the liability section. The valuation differences,
excluding tax, are recognized as land revaluation losses within the net assets section.
Revaluation date March 31, 2002
Revaluation methodology The amount is calculated using the listed value of the land and road rate as
prescribed by Article 2, Items 1 and 4, respectively, of the Order for
Enforcement of the Act on Revaluation of Land.

82 Nippon Life Insurance Company
(5) Consolidated Statements of Income and Consolidated Statements of Comprehensive Income
[Consolidated Statements of Income]
(Million Yen)
Year ended March 31, 2018 Year ended March 31, 2017
Ordinary income: 7,609,805 7,301,817
Revenues from insurance and reinsurance 5,422,050 5,236,045
Investment income: 1,871,287 1,805,215
Interest, dividends, and other income 1,496,565 1,458,328
Gain on trading securities 22,599 ―
Gain on sales of securities 252,476 287,182
Gain on redemptions of securities 14,972 6,000
Foreign exchange gains, net 16,168 ―
Reversal of allowance for doubtful accounts 584 1,351
Other investment income 1,806 1,919
Gain from separate accounts, net 66,115 50,432
Other ordinary income 316,467 260,555
Ordinary expenses: 7,137,979 6,773,431
Benefits and other payments: 4,407,378 4,151,681
Death and other claims 1,298,609 1,226,875
Annuity payments 907,776 936,713
Health and other benefits 812,819 824,505
Surrender benefits 1,085,916 932,899
Other refunds 260,653 217,639
Reinsurance premiums 41,602 13,048
Provision for policy reserves: 1,234,488 1,179,180
Provision for policy reserves for outstanding claims ― 30,975
Provision for policy reserves 1,212,272 1,125,720
Provision for interest on reserve for dividends to policyholders (mutual company) 22,203 22,458
Provision for interest on reserve for dividends to policyholders (limited company) 12 25
Investment expenses: 383,966 395,127
Interest expenses 24,392 22,388
Loss from assets held in trust, net 3,276 1,976
Loss on trading securities ― 5,371
Loss on sales of securities 126,883 123,761
Loss on valuation of securities 11,364 27,868
Loss on redemptions of securities 23,374 32,974
Loss on derivative financial instruments, net 144,785 116,229
Foreign exchange losses, net ― 16,441
Write-offs of loans ― 55
Depreciation of rental estate and other assets 17,460 17,834
Other investment expenses 32,428 30,224
Operating expenses 789,288 708,262
Other ordinary expenses 322,857 339,179
Ordinary profit 471,825 528,385

83 Nippon Life Insurance Company
[Consolidated Statements of Income] (Continued)
(Million Yen)
Year ended March 31, 2018 Year ended March 31, 2017
Extraordinary gains: 21,711 39,856
Gain on disposals of fixed assets 21,711 39,856
Extraordinary losses: 223,222 196,275
Loss on disposals of fixed assets 7,781 16,018
Impairment losses 2,242 5,243
Provision for reserve for price fluctuations in investments in securities 210,222 172,034
Loss on reduction entry of real estate ― 2
Contributions for assisting social public welfare 2,977 2,977
Provision for reserve for dividends to policyholders (limited company) 17,272 18,161
Surplus before income taxes 253,042 353,805
Income taxes - current 129,514 99,889
Income taxes - deferred (123,015) (54,372)
Total income taxes 6,499 45,517
Net surplus 246,542 308,288
Net surplus attributable to noncontrolling interests 2,614 6,319
Net surplus attributable to the parent company 243,927 301,969

84 Nippon Life Insurance Company
Notes to the Consolidated Statement of Income for the Fiscal Year Ended March 31, 2018
1. Impairment losses are as follows:
1) Method for grouping the assets
Leased property and idle property of the Company and certain consolidated subsidiaries are classified as one
asset group per property. Assets utilized for insurance business operations are classified into one asset group.
2) Circumstances causing impairment losses
The Company and certain consolidated subsidiaries observed a marked decrease in profitability or fair value
in some of the fixed asset groups. The book value of fixed assets was reduced to the recoverable amount and
impairment losses were recognized as extraordinary losses for the fiscal year ended March 31, 2018.
3) Breakdown of asset groups that recognized impairment losses for fiscal year ended March 31, 2018, is as
follows:
Million Yen
Purpose of use Land Buildings
and others
Total
Leased property ¥39 ¥65 ¥105
Idle property ¥1,501 ¥635 ¥2,136
Total ¥1,540 ¥701 ¥2,242
4) Calculation method of recoverable amount
The recoverable amount used for the measurement of impairment losses is based on the net realizable value
upon sales of the assets or the discounted future cash flows.
The discount rate used in the calculation of future cash flows is 3.0%-3.9%. Net realizable values are
determined based on appraisals performed in accordance with the “Real Estate Appraisal Standards” or
posted land prices.

85 Nippon Life Insurance Company
[Consolidated Statements of Comprehensive Income]
(Million Yen)
Year ended March 31, 2018 Year ended March 31, 2017
Net surplus 246,542 308,288
Other comprehensive income (loss): 348,566 (56,533)
Net unrealized gains (losses) on available-for-sale securities 333,542 (136,125)
Deferred gains on derivatives under hedge accounting 6,166 58,659
Foreign currency translation adjustments 5,436 14,750
Remeasurement of defined benefit plans 5,881 4,730
Share of other comprehensive income (loss) of associates accounted for under
the equity method (2,460) 1,450
Comprehensive income (loss): 595,109 251,754
Comprehensive income (loss) attributable to the parent company 584,689 242,367
Comprehensive income attributable to noncontrolling interests 10,419 9,387
Note to the Consolidated Statement of Comprehensive Income for the Fiscal Year Ended March 31, 2018
Breakdown of other comprehensive loss was as follows:
(1) Reclassification adjustments to profit or loss relating to other comprehensive loss
(Million Yen)
Net unrealized gains on available-for-sale securities:
Losses arising during the year 502,586
Reclassification adjustments to profit or loss (47,681) 454,904
Deferred losses on derivatives under hedge accounting:
Gains arising during the year (1,892)
Reclassification adjustments to profit or loss 10,489 8,597
Foreign currency translation adjustments:
Gains arising during the year 5,436
Reclassification adjustments to profit or loss ― 5,436
Remeasurement of defined benefit plans:
Losses arising during the year (1,123)
Reclassification adjustments to profit or loss 9,293 8,169
Share of other comprehensive income (loss) of associates
accounted for under the equity method:
Gains arising during the year (2,110)
Reclassification adjustments to profit or loss (349) (2,460)
Amount before income tax effect 474,647
Income tax effect (126,080)
Total other comprehensive loss 348,566
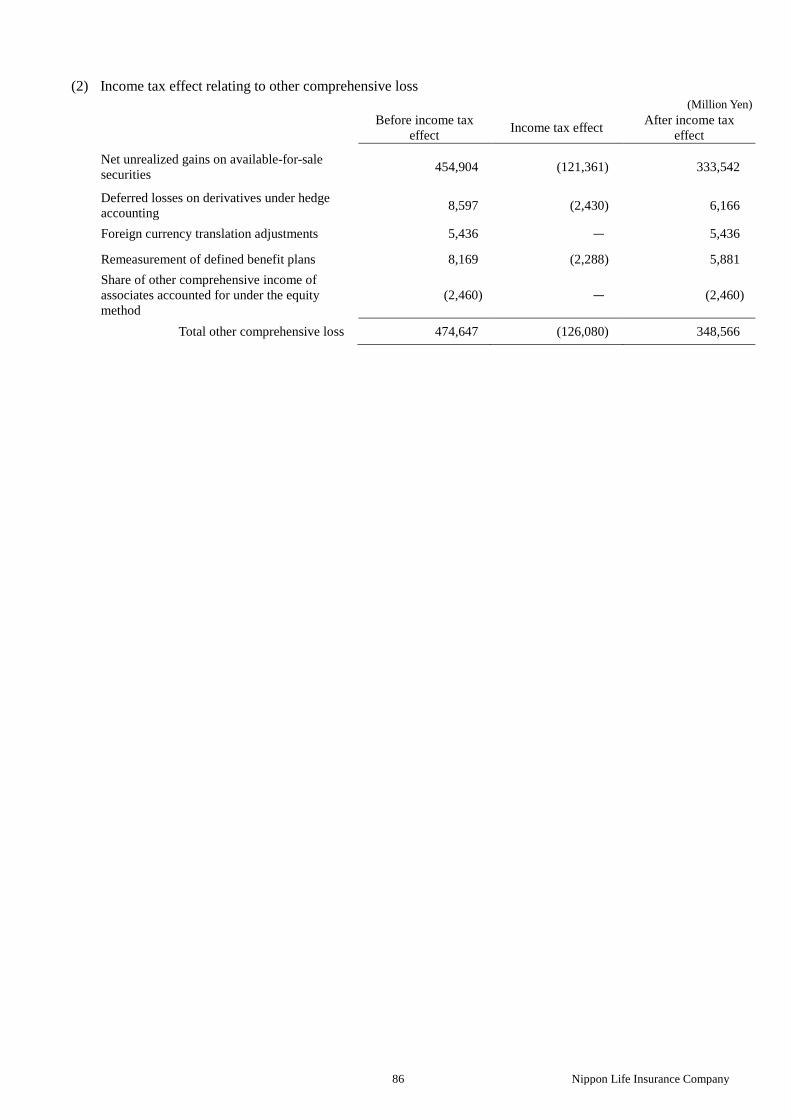
86 Nippon Life Insurance Company
(2) Income tax effect relating to other comprehensive loss
(Million Yen)
Before income tax
effect Income tax effect
After income tax
effect
Net unrealized gains on available-for-sale
securities 454,904 (121,361) 333,542
Deferred losses on derivatives under hedge
accounting 8,597 (2,430) 6,166
Foreign currency translation adjustments 5,436 ― 5,436
Remeasurement of defined benefit plans 8,169 (2,288) 5,881
Share of other comprehensive income of
associates accounted for under the equity
method
(2,460) ― (2,460)
Total other comprehensive loss 474,647 (126,080) 348,566

87 Nippon Life Insurance Company
(6) Consolidated Statements of Cash Flows (Million Yen)
Year ended March 31, 2018 Year ended March 31, 2017
I. Cash flows from operating activities:
Surplus before income taxes 253,042 353,805
Depreciation of rental real estate and other assets 17,460 17,834
Depreciation 48,769 53,632
Impairment losses 2,242 5,243
Amortization of goodwill 2,740 655
Net (decrease) increase in reserve for outstanding claims (62,027) 30,950
Net increase in policy reserve 1,186,025 1,124,400
Provision for interest on reserve for dividends to policyholders (mutual
company) 22,203 22,458
Provision for interest on reserve for dividends to policyholders (limited
company) 12 25
Provision for reserve for dividends to policyholders (limited company) 17,272 18,161
Net decrease in allowance for doubtful accounts (625) (1,442)
Net increase (decrease) in accrued bonuses for directors and audit and
supervisory board members 11 (7)
Net increase (decrease) in net defined benefit liability 771 (3,313)
Net increase in accrued retirement benefits for directors and audit and
supervisory board members 257 37
Net increase in reserve for price fluctuations in investments in securities 210,222 172,034
Interest, dividends, and other income (1,496,565) (1,458,328)
Losses from assets held in trust, net 3,276 1,976
Net gains on investments in securities (108,616) (108,554)
Net losses on policy loans 107,863 119,409
Losses on derivative financial instruments, net 144,785 116,229
Interest expenses 24,392 22,388
Net foreign exchange (gains) losses (16,268) 16,306
Net gains on tangible fixed assets (13,858) (23,604)
(Gains) losses on equity method investments (1,359) 13,093
Gains from separate accounts (66,115) (50,432)
Net decrease (increase) in reinsurance receivables 1,414 (1,513)
Net increase in other assets (excluding those related to investing activities
and financing activities) (14,363) (27,039)
Net (decrease) increase in reinsurance payables (3,334) 1,904
Net increase (decrease) in other liabilities (excluding those related to
investing activities and financing activities) 16,113 (8,829)
Others, net (23,758) (60,522)
Subtotal 251,984 346,961
Interest, dividends, and other income received 1,544,422 1,514,948
Interest paid (23,503) (22,055)
Dividends paid to policyholders (mutual company) (181,027) (181,208)
Dividends paid to policyholders (limited company) (20,053) (20,020)
Others, net 25,100 10,344
Income taxes paid (90,613) (102,103)
Net cash provided by operating activities 1,506,309 1,546,865

88 Nippon Life Insurance Company
(6) Consolidated Statements of Cash Flows (Continued)
(Million Yen)
Year ended March 31, 2018 Year ended March 31, 2017
II. Cash flows from investing activities: Net (increase) decrease in deposits (302) 504
Purchases of monetary receivables purchased (17,947) (3,000)
Proceeds from sales and redemptions of monetary receivables purchased 53,602 115,125
Purchases of assets held in trust (10,300) (4,700)
Proceeds from decrease in assets held in trust 0 1,260
Purchases of securities (9,174,638) (10,727,182)
Proceeds from sales and redemptions of securities 7,997,940 8,800,478
Disbursements for loans (1,505,039) (1,256,954)
Proceeds from collections of loans 1,759,953 1,613,276
Net losses from the settlement of derivative financial instrument (417,693) (151,832)
Net increase in sales under repurchase agreements 244,920 ―
Net (decrease) increase in cash received as collateral under securities lending transactions
(298,360) 39,684
Others, net 110,685 (28,552)
① Total of investing activities (1,257,180) (1,601,893)
[I + II①] [249,128] [(55,028)]
Purchases of tangible fixed assets (54,186) (54,472)
Proceeds from sales of tangible fixed assets 51,901 102,076
Payments for acquisition of subsidiary’s shares with change of consolidation
― (88,249)
Others, net (51,526) (41,186)
Net cash used in investing activities (1,310,991) (1,683,724)
III. Cash flows from financing activities:
Proceeds from debt borrowing 153,893 253,867
Repayments of debt (157,037) (288,594)
Proceeds from issuance of corporate bonds 188,064 270,000
Proceeds from issuance of foundation funds 50,000 ―
Redemption of foundation funds (50,000) (50,000)
Interest on foundation funds (1,198) (1,698)
Payment for acquisition of subsidiary’s shares not resulting in change in scope of consolidation
(15,065) ―
Proceeds from sales of shares of subsidiaries not resulting in change in scope of consolidation
― 58,198
Others, net 2,264 19,619
Net cash provided by financing activities 170,921 261,392
IV. Effect of exchange rate changes on cash and cash equivalents (12,427) 6,339
V. Net increase in cash and cash equivalents 353,812 130,873
VI. Cash and cash equivalents at the beginning of the year 1,541,468 1,410,595
VII. Net increase in cash and cash equivalents resulting from merger between the consolidated subsidiary and the nonconsolidated subsidiary
1,730 ―
VIII. Cash and cash equivalents at the end of the year 1,897,011 1,541,468
* Cash and cash equivalents
Cash and cash equivalents, for the purpose of reporting consolidated cash flows, are composed of cash in hand, deposits held at call with
banks, and all highly liquid short-term investments with a maturity of three months or less when purchased, which are readily convertible
into cash and present insignificant risk of change in value.

89 Nippon Life Insurance Company
Note to the Consolidated Statement of Cash Flows for the Fiscal Year Ended March 31, 2018
1. Cash and cash equivalents
Cash and cash equivalents, for the purpose of reporting consolidated cash flows, are composed of cash in hand,
deposits held at call with banks, and all highly liquid short-term investments with a maturity of three months or less
when purchased, which are readily convertible into cash and present insignificant risk of change in value.

90 Nippon Life Insurance Company
(7) Consolidated Statements of Changes in Net Assets
Year Ended March 31, 2017 (Million Yen)
Foundation funds and others
Foundation
funds
Reserve for
redemption of
foundation funds
Reserve for
revaluation
Consolidated
surplus
Total foundation
funds and others
Beginning balance 200,000 1,100,000 651 630,790 1,931,441
Cumulative effect of change in
accounting policies 1,882 1,882
Beginning balance after reflecting
accounting policy changes 200,000 1,100,000 651 632,673 1,933,324
Increase/decrease:
Additions to reserve for dividends
to policyholders (mutual company)
(229,857) (229,857)
Additions to reserve for redemption of foundation funds
50,000 (50,000) ―
Interest on foundation funds (1,698) (1,698)
Net surplus attributable to the
parent company
301,969 301,969
Redemption of foundation funds (50,000)
(50,000)
Reversal of land revaluation losses (28,117) (28,117)
Change in the parent’s ownership
interest due to transactions with
noncontrolling interests (2,580) (2,580)
Net change, excluding foundation
funds and others
Net change (50,000) 50,000 ― (10,284) (10,284)
Ending balance 150,000 1,150,000 651 622,388 1,923,039
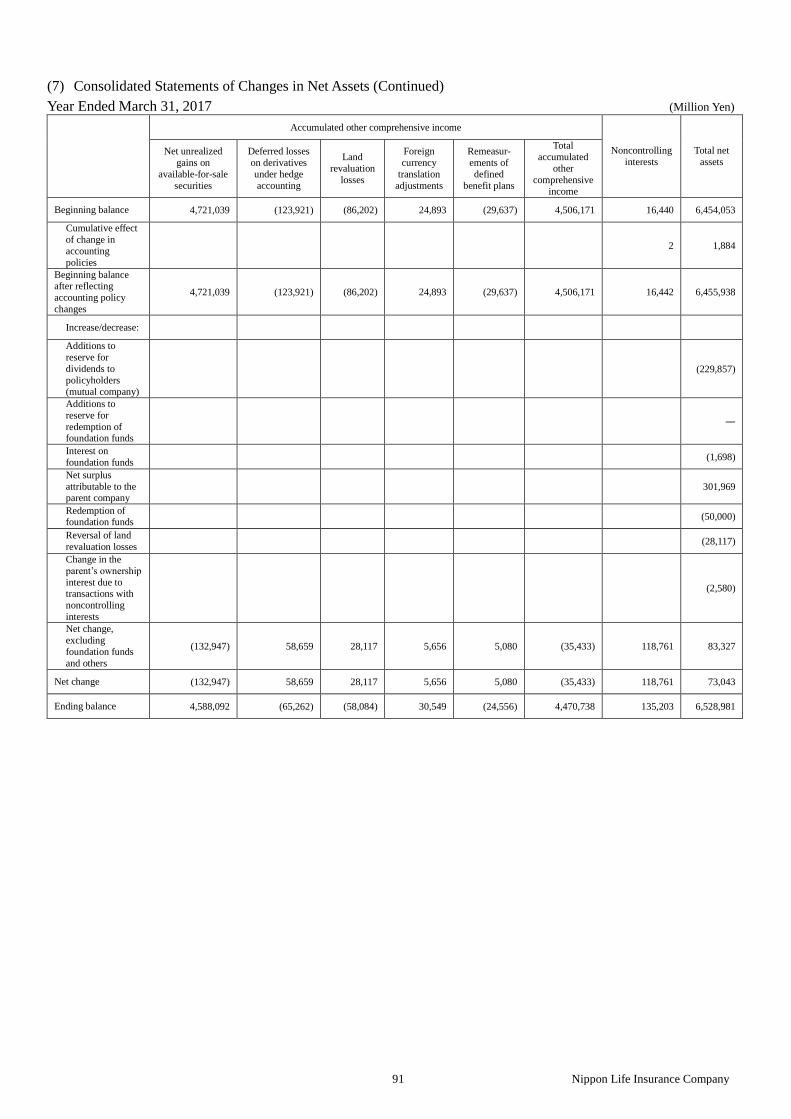
91 Nippon Life Insurance Company
(7) Consolidated Statements of Changes in Net Assets (Continued)
Year Ended March 31, 2017 (Million Yen)
Accumulated other comprehensive income
Noncontrolling
interests
Total net
assets Net unrealized
gains on
available-for-sale
securities
Deferred losses
on derivatives
under hedge
accounting
Land
revaluation
losses
Foreign
currency
translation
adjustments
Remeasur-
ements of
defined
benefit plans
Total
accumulated
other
comprehensive
income
Beginning balance 4,721,039 (123,921) (86,202) 24,893 (29,637) 4,506,171 16,440 6,454,053
Cumulative effect
of change in
accounting
policies
2 1,884
Beginning balance after reflecting
accounting policy
changes
4,721,039 (123,921) (86,202) 24,893 (29,637) 4,506,171 16,442 6,455,938
Increase/decrease:
Additions to
reserve for
dividends to
policyholders
(mutual company)
(229,857)
Additions to
reserve for
redemption of foundation funds
―
Interest on
foundation funds (1,698)
Net surplus
attributable to the parent company
301,969
Redemption of foundation funds
(50,000)
Reversal of land
revaluation losses (28,117)
Change in the
parent’s ownership
interest due to transactions with
noncontrolling
interests
(2,580)
Net change,
excluding
foundation funds
and others
(132,947) 58,659 28,117 5,656 5,080 (35,433) 118,761 83,327
Net change (132,947) 58,659 28,117 5,656 5,080 (35,433) 118,761 73,043
Ending balance 4,588,092 (65,262) (58,084) 30,549 (24,556) 4,470,738 135,203 6,528,981

92 Nippon Life Insurance Company
(7) Consolidated Statements of Changes in Net Assets (Continued)
Year Ended March 31, 2018 (Million Yen)
Foundation funds and others
Foundation
funds
Reserve for
redemption of
foundation funds
Reserve for
revaluation
Consolidated
surplus
Total foundation
funds and others
Beginning balance 150,000 1,150,000 651 622,388 1,923,039
Increase/decrease:
Issuance of foundation funds 50,000 50,000
Additions to reserve for dividends
to policyholders (mutual company) (184,086) (184,086)
Additions to reserve for
redemption of foundation funds 50,000 (50,000) ―
Interest on foundation funds (1,198) (1,198)
Net surplus attributable to the
parent company 243,927 243,927
Redemption of foundation funds (50,000) (50,000)
Reversal of land revaluation losses 2,905 2,905
Change in the parent’s ownership
interest due to transactions with
noncontrolling interests (8,805) (8,805)
Net change, excluding foundation
funds and others
Net change ― 50,000 ― 2,742 52,742
Ending balance 150,000 1,200,000 651 625,131 1,975,782

93 Nippon Life Insurance Company
(7) Consolidated Statements of Changes in Net Assets (Continued)
Year Ended March 31, 2018 (Million Yen)
Accumulated other comprehensive income
Noncontrolling
interests
Total net
assets Net unrealized
gains on
available-for-sale
securities
Deferred losses
on derivatives
under hedge
accounting
Land
revaluation
losses
Foreign
currency
translation
adjustments
Remeasur-
ements of
defined
benefit plans
Total
accumulated
other
comprehensive
income
Beginning balance 4,588,092 (65,262) (58,084) 30,549 (24,556) 4,470,738 135,203 6,528,981
Increase/decrease:
Issuance of
foundation funds 50,000
Additions to
reserve for
dividends to
policyholders
(mutual company)
(184,086)
Additions to
reserve for
redemption of foundation funds
―
Interest on foundation funds
(1,198)
Net surplus attributable to the
parent company 243,927
Redemption of
foundation funds (50,000)
Reversal of land
revaluation losses 2,905
Change in the
parent’s ownership interest due to
transactions with
noncontrolling
interests
(8,805)
Net change,
excluding
foundation funds
and others
330,510 6,170 (2,905) (1,842) 5,924 337,856 2,792 340,648
Net change 330,510 6,170 (2,905) (1,842) 5,924 337,856 2,792 393,391
Ending balance 4,918,602 (59,092) (60,989) 28,706 (18,632) 4,808,594 137,996 6,922,373

94 Nippon Life Insurance Company
(8) Status of Nonperforming Assets According to Borrower’s Classification (Consolidated)
(Million Yen, %)
As of March 31, 2018 As of March 31, 2017
Bankrupt and quasi-bankrupt loans 10,209 10,077
Doubtful loans 18,706 18,967
Substandard loans 2,188 3,171
Subtotal 31,104 32,216
[Percent of total, %] [0.26] [0.27]
Normal loans 11,735,373 11,726,760
Total 11,766,477 11,758,976
Notes: 1. Bankrupt and quasi-bankrupt loans are nonperforming assets and similar loans that have fallen into bankruptcy due to reasons, including initiation of bankruptcy proceedings, start of reorganization proceedings, or submission of an application to start rehabilitation proceedings.
2. Doubtful loans are nonperforming assets with a strong likelihood that loan principal cannot be recovered or interest cannot be received according to the contract because of difficulties in the financial condition and business performance of the debtor who has not yet entered into bankruptcy.
3. Substandard loans include loans that are delinquent for over three months or restructured loans. Loans that are delinquent for over three months are loans with principal or interest being unpaid for over three months counting from the day after the due date based on the loan agreement (excluding 1. and 2. in the above notes). Restructured loans are loans that provide certain concessions favorable to the borrower with the intent of supporting the borrower’s restructuring. Examples of such concessions include reducing or exempting interest, postponing principal or interest payments, releasing credits, or providing other benefits to the borrowers (excluding 1. and 2. in the above notes and loans that are delinquent for over three months).
4. Normal loans are loans that do not fall under the classifications for 1. to 3. in the above notes and where the debtor has no financial or business performance problems.
Supplemental information for borrower’s classification
Classifications and calculation methods used in this table are based on the Ordinance for Enforcement of the Insurance Business Act. The table
includes guaranteed private offering loans of financial institutions, loans, securities lending, accrued interest, suspense payments, and
customer’s liability for acceptances and guarantees.
For bankrupt and quasi-bankrupt loans, the estimated uncollectible amount calculated by subtracting the amount of collateral value or the
amount collectible by the execution of guarantees from the balance of loans is directly deducted from the total loan amount. The estimated
uncollectible amounts as of March 31, 2018 and 2017, were ¥251 million and ¥703 million, respectively.
(9) Status of Risk-Monitored Loans (Consolidated)
(Million Yen, %)
As of March 31, 2018 As of March 31, 2017
Loans to bankrupt borrowers 1,511 1,771
Delinquent loans 27,397 27,267
Loans that are delinquent for over three months ― ―
Restructured loans 2,188 3,171
Total 31,097 32,210
[Percent of total loans, %] [0.36] [0.36]
Notes: 1. For loans to bankrupt borrowers and quasi-bankrupt borrowers (including collateralized and guaranteed loans), an estimated uncollectible amount (calculated by subtracting estimated collectible amounts based on collateral and guarantees from total loans) is directly deducted from the total loan amount. The amounts directly deducted from loans to bankrupt borrowers and delinquent loans were ¥15 million and ¥235 million, respectively, as of March 31, 2018, and ¥442 million and ¥261 million, respectively, as of March 31, 2017
2. Loans to bankrupt borrowers are loans with principal or interest payments being overdue for a significant period of time and interest not being accrued, including the following: (a) loans to borrowers that are legally bankrupt through filings for proceedings under the Corporate Reorganization Act, Civil Rehabilitation Act, Bankruptcy Act, or Company Act; (b) loans to borrowers that have notes suspended from being traded; and (c) loans to borrowers that have filed for legal proceedings similar to the aforementioned proceedings based on overseas laws.
3. Delinquent loans are loans with interest not accrued and exclude loans to bankrupt borrowers and loans with interest payments extended with the objective of restructuring or supporting the borrowers.
4. Loans that are delinquent for over three months are loans with principal or interest unpaid for over three months counting from the day after the due date based on the loan agreement. Note that the account does not include loans to bankrupt borrowers and delinquent loans.
5. Restructured loans are loans that provide certain concessions favorable to the borrower with the intent of supporting the borrower’s restructuring, such as by reducing or exempting interest, postponing principal or interest payments, releasing credits, or providing other benefits to the borrowers (excluding loans to bankrupt borrowers, delinquent loans, and loans that are delinquent for over three months from above).
6. Interest that is not accrued for loans of borrowers who are deemed to be bankrupt, quasi-bankrupt, or doubtful based on the results of asset self-assessment is not recorded as income.

95 Nippon Life Insurance Company
(10) Consolidated Solvency Margin Ratio
(Million Yen)
As of March 31, 2018 As of March 31, 2017
Solvency margin gross amount (A): 14,150,865 13,078,231
Foundation funds (kikin) and other reserve funds: 5,143,211 4,778,735
Foundation funds and others 1,852,172 1,838,692
Reserve for price fluctuations in investments in securities 1,345,987 1,135,765
Contingency reserve 1,680,761 1,544,254
Extraordinary contingency reserve ― ―
General allowance for doubtful accounts 2,114 2,624
Others 262,175 257,398
Net unrealized gains on available-for-sale securities (before tax) and
deferred losses on derivatives under hedge accounting (before tax)× 90% 6,048,444 5,644,495
Net unrealized gains on real estate × 85% 272,410 217,473
Total amount of unrecognized actuarial gains/losses and unrecognized
prior service cost (25,843) (34,071)
Excess of continued Zillmerized reserve 1,679,917 1,565,220
Qualifying subordinated debt 1,208,889 1,020,825
Excess of continued Zillmerized reserve and qualifying subordinated debt
not included in margin calculations ― ―
Deduction clause (249,989) (190,878)
Others 73,824 76,431
Total amount of risk (B): 64
2
732
2
98
2
5
2
1 )()( RRRRRRRRR 2,923,568 2,800,770
Underwriting risk (R1) 159,546 165,787
General underwriting risk (R5) ― ―
Huge disaster risk (R6) ― ―
Underwriting risk of third-sector insurance (R8) 90,205 88,743
Underwriting risk related to small amount and short-term insurance
providers (R9) ― ―
Anticipated yield risk (R2) 425,986 444,139
Minimum guarantee risk (R7) 10,593 13,765
Investment risk (R3) 2,414,061 2,271,347
Business management risk (R4) 62,007 59,675
Solvency margin ratio
(A)
× 100
( 1 / 2 ) × (B)
968.0% 933.9%
Notes: 1. The amounts and figures in the table above are calculated based on the provisions of Article 86-2 and Article 88 of the Ordinance for Enforcement of
the Insurance Business Act and the Financial Services Agency Public Notice No.23 of 2011.
2. The standard method is used for the calculation of the amount equivalent to minimum guarantee risk.
96 Nippon Life Insurance Company
(11) Segment Information
For the fiscal years ended March 31, 2018 and 2017, the Company and its consolidated subsidiaries engaged in
insurance business and insurance-related businesses (including asset management-related business and general
administration-related business) in Japan and overseas. Segment information and its related information are
omitted because there are no other significant segments to report.