Embed Size (px)
Citation preview
NIKON CORPORATIONMay 11, 2017
Financial Results for the Year Ended March 31, 2017
• Forward-looking statements for earnings and other performance data contained herein are based oninformation currently available to the Company, and all potential risks and uncertainties are takeninto account. The Company asks that investors understand that changes in conditions may causeactual performance to significantly differ from these projections.
• Amounts less than 100 million yen are omitted

NIKON CORPORATIONMay 11, 2017
Business Update and Future Strategic Direction
President and Representative DirectorKazuo Ushida

3
Presentation Overview
2017/3Financial Results
Business Environment
2018/3Forecast
• Operating income of ¥50.9 billion, increase from prior year and forecast
• Net income of -¥7.1 billion, decrease from prior year due to one-time restructuring costs
• Achieve break-even of Semiconductor Lithography Business• Strengthen profit-structure of Imaging Products Business• Initiate full-scale enhancement of management DNA
Restructuring Direction
• Operating profit of ¥45 billion, decrease due to prior year• Profit for the period expected to recover to ¥34 billion
• Imaging Products: Continued market shrinkage• Precision Equipment: Continued robust FPD lithography demand• Instruments: Robust automotive/electronic parts related demand• Medical: Increased demand for ophthalmologic diagnosis due to a
globally aging population

4
Financial Results for the Year Ended March 31, 2017
• Continued slowing of Imaging Products Business offset by significant increase in Precision Equipment Business, resulting in ¥19.3 billion increase in operating income
• ¥53.3 billion one-time restructuring costs, resulting in ¥25.3 billion decrease in net income
-20
0
20
40
¥60BOperating Income/Net Income
43.4
18.3
31.6
18.2
50.9
-7.1
Net SalesOperating Income %Net Income %
2015/3 2016/3 2017/3857.7 819.3 748.85.1% 3.9% 6.8%2.1% 2.2% -0.9%
OperatingIncome
NetIncome
5
Forecast for the Year Ending March 31, 2018
-20
0
20
40
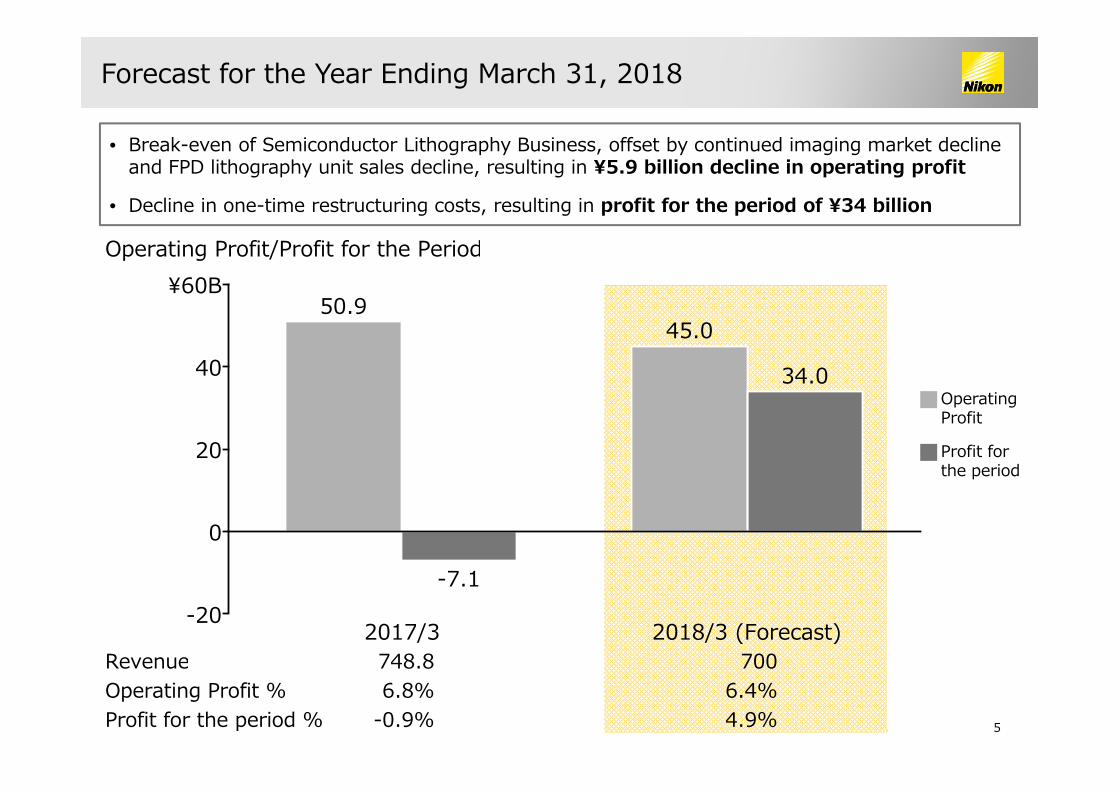
¥60BOperating Profit/Profit for the Period
50.9
-7.1
45.0
34.0
RevenueOperating Profit %Profit for the period %
2017/3 2018/3 (Forecast)748.8 7006.8% 6.4%
-0.9% 4.9%
• Break-even of Semiconductor Lithography Business, offset by continued imaging market decline and FPD lithography unit sales decline, resulting in ¥5.9 billion decline in operating profit
• Decline in one-time restructuring costs, resulting in profit for the period of ¥34 billion
OperatingProfit
Profit forthe period

6
Business Environment for the Year Ending March 31, 2018
Continued market decline and downward pressure on profitability
Continued robust FPD lithography demandMid-to-small sized: Investment shift to expansion of existing linesLarge sized: Investment of new lines including G10.5 is growing
Stable demand for Biological Microscopes Robust demand related to automotive and electronic parts for Industrial Metrology
Forex assumption of US dollar ¥110, Euro ¥120
Imaging Products Business
Precision Equipment Business
Instruments Business
Company-wide
Advent of globally aging population causing steady increase of demand for ophthalmologic diagnosisMedical Business

7
First half-year of restructuring is progressing as plannedShift restructuring to “Phase 2” going forward
Phase 2Additional initiatives/
Full-scale enhancement of
management DNA
Phase 3Realization of
enhancement in management DNA
Phase 4Clarify post-restructuring
Strategic blueprint
Phase 1Launch of
restructuring
2016.11 2017.5 2018 2019
Enhancement ofmanagement DNA
Fundamental re-assessment ofcost-structure/change in mindsetat ground level
Define “Sustainable value creation
through growth”
Target transformation into a company that can generate and sustain ROE of 8% and above in the mid-term
4 PHASES OF RESTRUCTURING

8
Strategic direction for phase 2 of restructuring: Year Ending March 31, 2018
1
2
3
Achieve break-even of Semiconductor Lithography BusinessComplete shift in mindset from top-line to profit centric and sustain profits
Strengthen profit-structure of Imaging Products BusinessTarget a profit-structure able to sustain profit in a declining market. Create a midterm roadmap and initiate a fundamental review of costs
Initiate full-scale enhancement of management DNAStep-up initiatives for implementing new mechanisms

NIKON CORPORATIONMay 11, 2017
2017/3 Financial Results2018/3 Forecast
Senior Executive Vice President, CFO and Representative DirectorMasashi Oka

10
Agenda
•Financial results for the year ended March 2017
•Progress in Restructuring plan
•Forecast for the year ending March 2018

11
Results for year ended March 31, 2017: Financial Highlights
Billions of yen2016/3
Actual (A)2017/3Previous
forecast (B)2017/3
Actual (C)Change(C)-(A)
Change(C)-(B)
Net Sales 819.3 750.0 748.8 -70.5 -1.2
Operating Income 31.6 44.0 50.9 +19.3 +6.9
% vs. Net Sales 3.9% 5.9% 6.8%Ordinary Income 28.5 -5.0 -2.4 -30.9 +2.6
% vs. Net Sales 3.5% -0.7% -0.3%Net Income
attributable to owners of parent
18.2 -9.0 -7.1 -25.3 +1.9% vs. Net Sales 2.2% -1.2% -0.9%
FCF 24.3 45.0 56.6 +32.3 +11.6
Exchange Rate: US$
EURO¥120¥133
¥107¥118
¥108¥119
Impact on Net Sales-61.4 +2.7
Impact on Op. Income-18.2 +0.2
Year-end dividend ¥4, annual dividend ¥16

12
Results for year ended March 31, 2017:Financial Highlights by Segment
Billions of yen2016/3
Actual (A)2017/3Previous
forecast (B)2017/3
Actual (C)Change(C)-(A)
Change(C)-(B)
Precision Equipment Business
Net Sales 178.8 248.0 247.6 +38% -0.2%Operating Income 9.6 48.0 51.0 +41.4 +3.0
Imaging Products Business
Net Sales 520.4 380.0 383.0 -26% +1%Operating Income 45.7 25.0 27.7 -18.0 +2.7
Instruments Business
Net Sales 77.2 76.0 73.4 -5% -3%Operating Income 2.8 1.0 0.3 -2.5 -0.7
MedicalBusiness
Net Sales 18.3 19.0 20.2 +10% +6%Operating Income -4.6 -6.0 -4.5 +0.1 +1.5
OtherNet Sales 24.4 27.0 24.4 ±0% -10%Operating Income 4.5 4.0 4.9 +0.4 +0.9
Corporate Expenses/Elimination of Intersegment Transactions
Net Sales - - - - -Operating Income -26.4 -28.0 -28.5 -2.1 -0.5
ConsolidatedNet Sales 819.3 750.0 748.8 -9% -0.2%Operating Income 31.6 44.0 50.9 +19.3 +6.9

13
Results for year ended March 31, 2017:Precision Equipment Business
• Change from prior year:¥68.8 billion net sales increase¥41.4 billion operating income increase- FPD: Market expansion from strong
demand in mid-to-small sized panel. Increase in net sales/operating income from significant increase in unit sales
- Semiconductor: Continued operating losses despite increase in new unit sales
• Change from prior forecast: ¥0.4 billion net sales decrease¥3 billion operating income increase- Semiconductor: Reduced losses from
improved service profit, reduced expenses and product costs
Semiconductor Lithography Systems(New/Refurbished, Units)Market (CY15/16) 220 210 210Nikon 14/21 24/10 24/10
FPD Lithography Systems (Units)Market (CY15/16) 80 128 128Nikon 46 92 92
Net Sales Operating Income
14
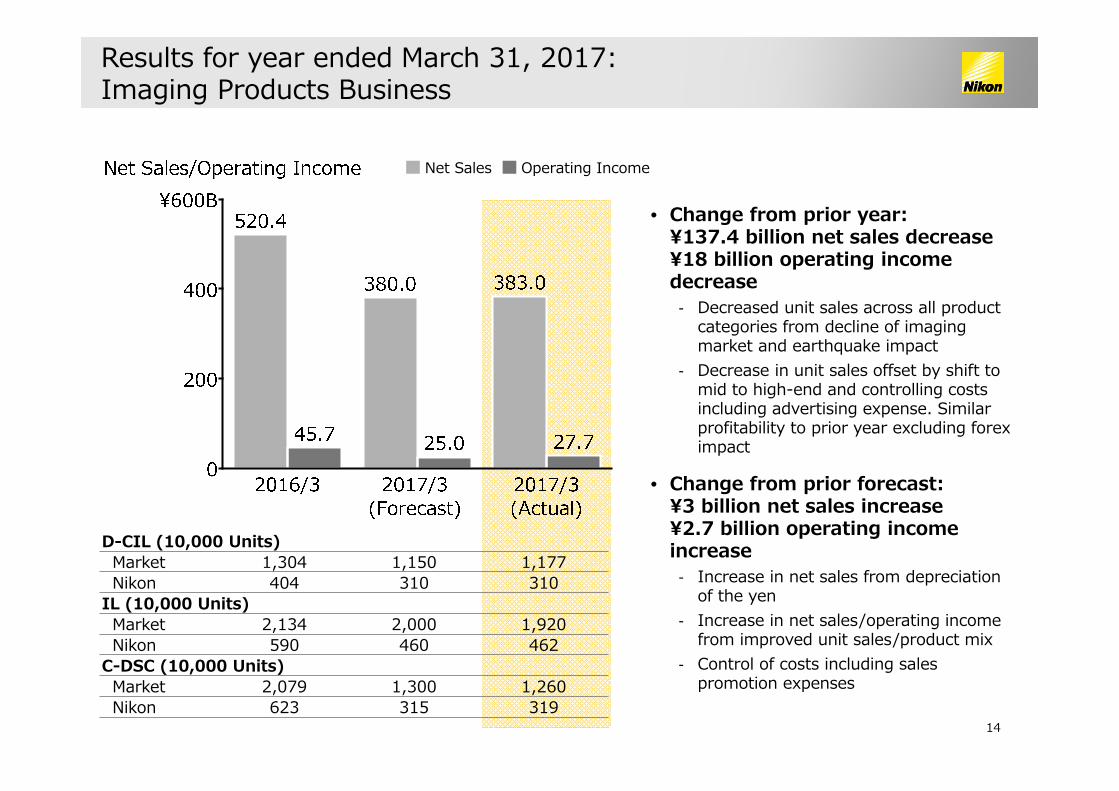
Results for year ended March 31, 2017:Imaging Products Business
• Change from prior year: ¥137.4 billion net sales decrease¥18 billion operating income decrease- Decreased unit sales across all product
categories from decline of imaging market and earthquake impact
- Decrease in unit sales offset by shift to mid to high-end and controlling costs including advertising expense. Similar profitability to prior year excluding forex impact
• Change from prior forecast: ¥3 billion net sales increase¥2.7 billion operating income increase- Increase in net sales from depreciation
of the yen- Increase in net sales/operating income
from improved unit sales/product mix- Control of costs including sales
promotion expenses
D-CIL (10,000 Units)Market 1,304 1,150 1,177Nikon 404 310 310
IL (10,000 Units)Market 2,134 2,000 1,920Nikon 590 460 462
C-DSC (10,000 Units)Market 2,079 1,300 1,260Nikon 623 315 319
Net Sales Operating Income

15
• Change from prior year:¥3.8 billion net sales decrease¥2.5 billion operating income decrease- Decrease in net sales from appreciation
of the yen- MS: Improvement in product costs of
Biological Microscopes offset by initial investment in regenerative medicine
- Industrial Metrology: Decline in unit sales from market slow-down and increase in sales expense
• Change from prior forecast: ¥2.6 billion net sales decrease¥0.7 billion operating income decrease- MS:Decrease in net sales and operating
income from delayed US government budget effect
- Industrial Metrology: Decrease in net sales and operating income from market slow-down
- Decline in sales partially offset by controlling expenses
Net Sales Operating Income
Results for year ended March 31, 2017:Instruments Business

16
Results for year ended March 31, 2017:Medical Business
• Change from prior year:¥1.9 billion net sales increase¥0.1 billion operating income increase- Stable performance of Optos fundus
camera business: Operating Margin 20%
- Continued operating loss due to initial investment for future business
• Change from prior forecast: ¥1.2 billion net sales increase¥1.5 billion operating income increase- Operating income improvement from
increased high margin fundus camera sales in the US
- Reduced expenses
Net Sales Operating Income

17
Agenda
•Financial results for the year ended March 2017
•Progress in Restructuring plan
•Forecast for the year ending March 2018

18
Progress of restructuring initiatives
Precision Equipment Business
• Completion of headcount optimization including re-assignment towards change in business structure
• Advancing R&D expense reduction and profit focused production/sales structure
• Executed rationalization of inventory
Imaging Products Business
• Completion of domestic headcount rationalization including re-assignment• Target a profit-structure able to sustain profit in a declining market by
initiating a fundamental review of costs
Optical Function
Centralization
• Consolidation of optical components manufacturing to Tochigi Nikon: Progress on integration of organization/business to enhance functions
• Established Optical Engineering Division and consolidated optical product development and design functions
Headquarters• Near completion of headcount optimization including re-assignment • Continued consideration to streamline organization
Management DNA Rewiring
• Launch ROE/ROIC based new business performance management process• Step-up consideration of governance system improvement
¥20 billion fixed costs reduction according to plan
19
Agenda
•Financial results for the year ended March 2017
•Progress in Restructuring plan
•Forecast for the year ending March 2018

20
Forecast for the year ending March 31, 2018:Financial Highlights
Billions of yen2017/3
Japan GAAP (A)2018/3IFRS (B)
Change(A)–(B)
Revenue 748.8 700.0 -48.8Operating
Profit 50.9 45.0 -5.9% vs. Revenue 6.8% 6.4%
Profit before income taxes -2.4 47.0 +49.4
% vs. Revenue -0.3% 6.7%Profit attributable
to owners of parent
-7.1 34.0 +41.1% vs. Revenue -0.9% 4.9%
FCF 56.6 25.0 -31.6
Exchange Rate: US$
EURO¥108¥119
¥110¥120
Impact on Revenue+6.0
Impact on Op. Profit+1.0
Shareholder Returns Policy: Raise dividend payout ratio to 40% or more Annual dividend: to be determined
Note: 2017/3 in Japan GAAP, 2018/3 in International Financial Reporting Standards (IFRS)2018/3 impact to consolidated operating profit from adoption of IFRS: Approx. ¥5 billion

21
Forecast for the year ending March 31, 2018:Financial Highlights by Segment
Billions of yen2017/3
Japan GAAP2018/3
IFRSChange(A)–(B)
Precision Equipment Business
Revenue 247.6 225.0 -9%Operating Profit 51.0 45.0 -6.0
Imaging Products Business
Revenue 383.0 345.0 -10%Operating Profit 27.7 27.0 -0.7
InstrumentsBusiness
Revenue 73.4 80.0 +9%Operating Profit 0.3 3.0 +2.7
Medical Business
Revenue 20.2 21.0 +4%Operating Profit -4.5 -6.0 -1.5
OtherRevenue 24.4 29.0 +19%Operating Profit 4.9 4.0 -0.9
Corporate Expenses Total/Elimination of
Intersegment Transactions
Revenue - - -Operating Profit -28.5 -28.0 +0.5
ConsolidatedRevenue 748.8 700.0 -7%Operating Profit 50.9 45.0 -5.9

22
Forecast for the year ending March 31, 2018:Financial Highlights by Segment (Change from prior year)
0
46
48
50
¥52B
Operating Profit
2017/3Actual
50.9
PrecisionEquipmentBusiness
-6.0
ImagingProductsBusiness
-0.7
InstrumentsBusiness
2.7
MedicalBusiness
-1.5
Other
-0.9
0.5
2018/3Forecast
45.0
CorporateExpenses
Total/Eliminationof Intersegment
Transactions
Note: 2017/3 presented in Japan GAAP, 2018/3 presented in International Financial Reporting Standards (IFRS)

23
Semiconductor Lithography Systems(New/Refurbished, Units)Market (CY16/17) 210 210Nikon 24/10 17/10
FPD Lithography Systems (Units)Market (CY16/17) 128 150Nikon 92 68
Forecast for the year ending March 31, 2018:Precision Equipment Business
• Revenue: ¥22.6 billion decrease- FPD: Decline in revenue from unit
decline‣ Decline in new investment for
mid-to-small sized panels‣ Step-up new line investment for
large sized panels (3 units of G10.5 systems forecasted)
• Operating Profit: ¥6 billion decrease- FPD: Decline in operating profit from
revenue decline/product mix change
- Semiconductor: Expect to achieve break-even‣ Fixed costs reduction realized‣ Reduction in inventory write-
off/write-down
Note: 2017/3 presented in Japan GAAP, 2018/3 presented in International Financial Reporting Standards (IFRS)
Revenue Operating Profit
24
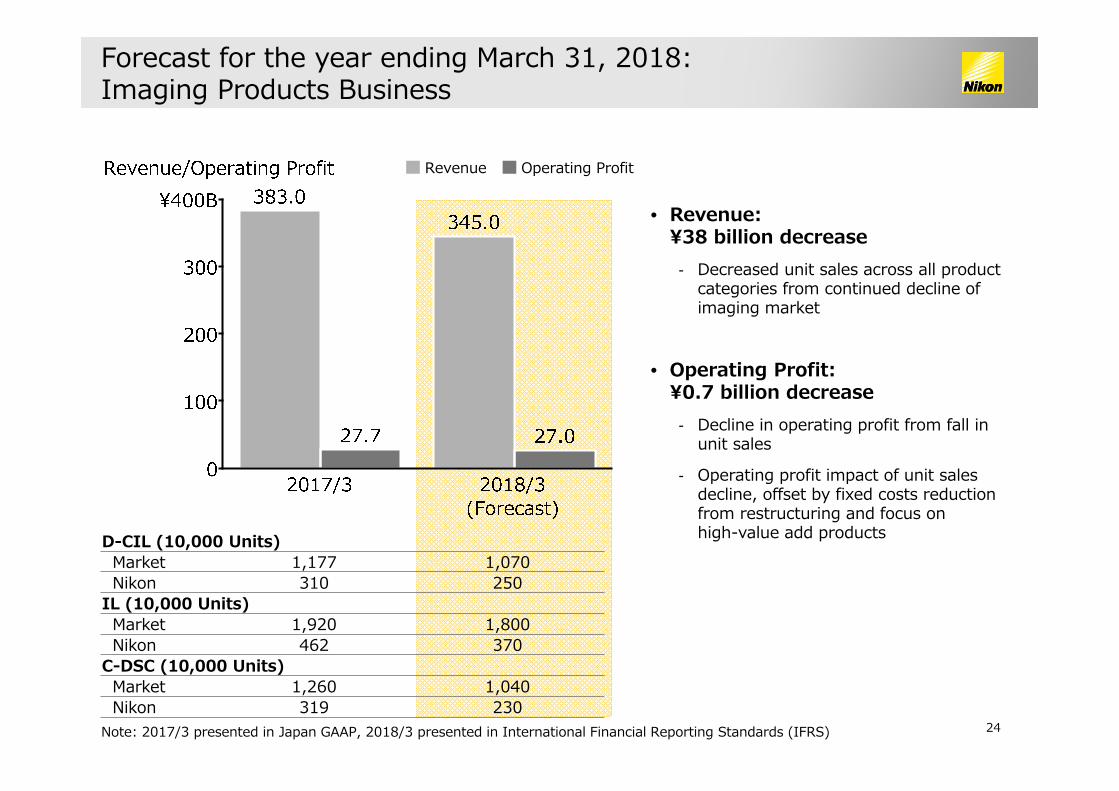
Forecast for the year ending March 31, 2018:Imaging Products Business
D-CIL (10,000 Units)Market 1,177 1,070Nikon 310 250
IL (10,000 Units)Market 1,920 1,800Nikon 462 370
C-DSC (10,000 Units)Market 1,260 1,040Nikon 319 230
• Revenue: ¥38 billion decrease- Decreased unit sales across all product
categories from continued decline of imaging market
• Operating Profit:¥0.7 billion decrease- Decline in operating profit from fall in
unit sales
- Operating profit impact of unit sales decline, offset by fixed costs reduction from restructuring and focus on high-value add products
Note: 2017/3 presented in Japan GAAP, 2018/3 presented in International Financial Reporting Standards (IFRS)
Revenue Operating Profit

25
Forecast for the year ending March 31, 2018:Instruments Business
• Revenue: ¥6.6 billion increase- MS: Increased sales from increased
market share in Biological Microscopes‣ Revenue recorded for regenerative
medicine but time is required to generate profits
- Industrial Metrology: Expanded sales for automotive-related products and semiconductor inspection systems
• Operating Profit:¥2.7 billion increase- Increase in profit from MS/Industrial
Metrology due to rise in net sales
Note: 2017/3 presented in Japan GAAP, 2018/3 presented in International Financial Reporting Standards (IFRS)
Revenue Operating Profit

26
Forecast for the year ending March 31, 2018:Medical Business
• Revenue: ¥0.8 billion increase
- The fundus camera business growth in-line with market expansion
• Operating Profit: ¥1.5 billion decline
- Increased investment to expand business for ophthalmologic diagnosis
Note: 2017/3 presented in Japan GAAP, 2018/3 presented in International Financial Reporting Standards (IFRS)
Revenue Operating Profit


28
Reference Data

29
Forecast for the year ending March 31, 2018:Financial Highlights
Billions of yen2017/3 Actual 2018/3 Forecast
1H 2H 2017/3 1H 2H 2018/3
Revenue 343.7 405.1 748.8 328.0 372.0 700.0
Operating Profit 23.3 27.6 50.9 11.0 34.0 45.0
% vs. Revenue 6.8% 6.8% 6.8% 3.4% 9.1% 6.4%Profit before income taxes 25.8 -28.2 -2.4 12.0 35.0 47.0
% vs. Revenue 7.5% -7.0% -0.3% 3.7% 9.4% 6.7%Profit attributable
to owners of parent
17.7 -24.8 -7.1 6.0 28.0 34.0% vs. Revenue 5.1% -6.1% -0.9% 1.8% 7.5% 4.9%
FCF 56.6 25.0
Exchange Rate: US$
EURO¥105¥118
¥112¥119
¥108¥119
¥110¥120
Note: 2017/3 presented in Japan GAAP, 2018/3 presented in International Financial Reporting Standards (IFRS)

30
Forecast for the year ending March 31, 2018:Financial Highlights by Segment
Billions of yen2017/3 Actual 2018/3 Forecast
1H 2H 2017/3 1H 2H 2018/3Precision
Equipment Business
Revenue 115.3 132.3 247.6 100.0 125.0 225.0Operating Profit 24.4 26.6 51.0 17.0 28.0 45.0
Imaging Products Business
Revenue 178.3 204.7 383.0 170.0 175.0 345.0Operating Profit 15.2 12.5 27.7 10.0 17.0 27.0
Instruments Business
Revenue 30.6 42.8 73.4 34.0 46.0 80.0Operating Profit -1.4 1.7 0.3 ±0 3.0 3.0
Medical Business
Revenue 9.0 11.2 20.2 10.0 11.0 21.0Operating Profit -2.4 -2.1 -4.5 -3.0 -3.0 -6.0
OtherRevenue 10.4 14.0 24.4 14.0 15.0 29.0Operating Profit 1.8 3.1 4.9 2.0 2.0 4.0
Corporate Expenses Total/Elimination of
Intersegment Transactions
Revenue - - - - - -Operating Profit -14.2 -14.3 -28.5 -15.0 -13.0 -28.0
ConsolidatedRevenue 343.7 405.1 748.8 328.0 372.0 700.0Operating Profit 23.3 27.6 50.9 11.0 34.0 45.0
Note: 2017/3 presented in Japan GAAP, 2018/3 presented in International Financial Reporting Standards (IFRS)

31
2017/3: Balance Sheet Breakdown
Cash & deposits
Notes & accountsreceivable-trade
Inventories
OtherCurrent assets
Fixed assets
Totalliabilities
Total net assets
ASSETS LIABILITIES/NET ASSETS
32
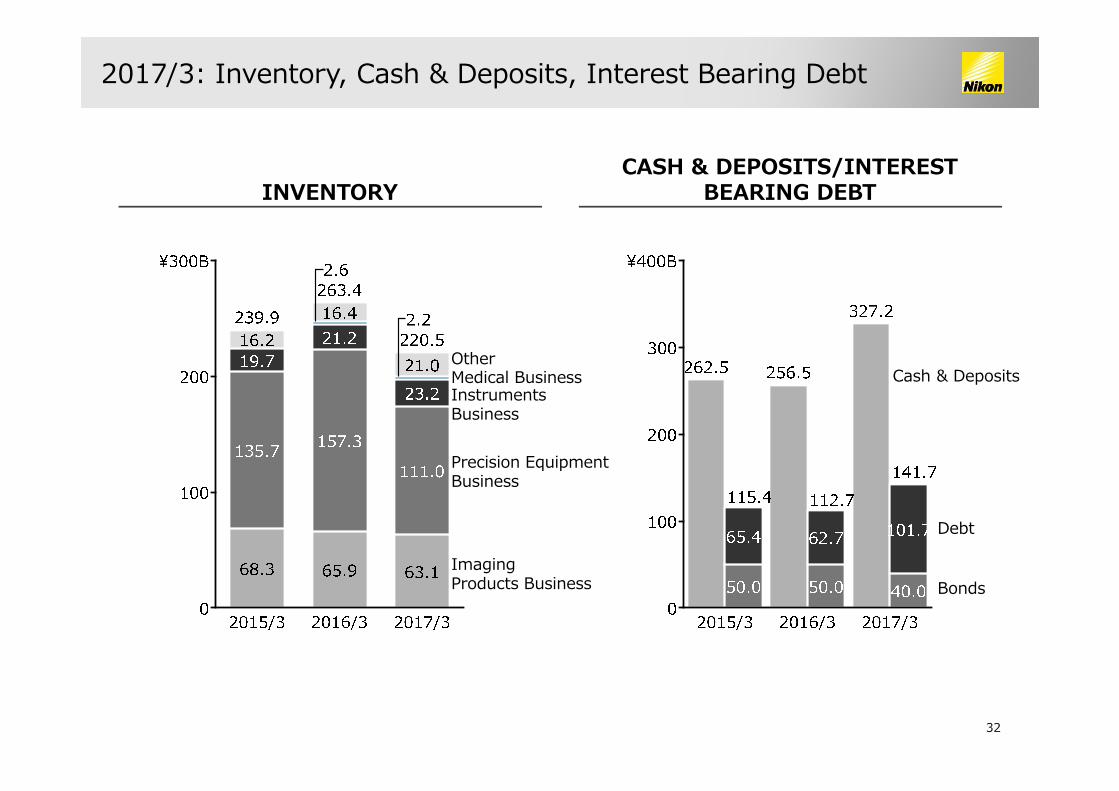
2017/3: Inventory, Cash & Deposits, Interest Bearing Debt
INVENTORYCASH & DEPOSITS/INTEREST
BEARING DEBT
Imaging Products Business
Precision EquipmentBusiness
InstrumentsBusiness
Medical BusinessOther
Cash & Deposits
Debt
Bonds

33
2018/3 Forecast: Capital Expenditures, Depreciation and R&D
CAPITAL EXPENDITURES, DEPRECIATION R&D EXPENSES
Note: Changed to the straight-line method of depreciation from the fiscal year ended March 2015
34
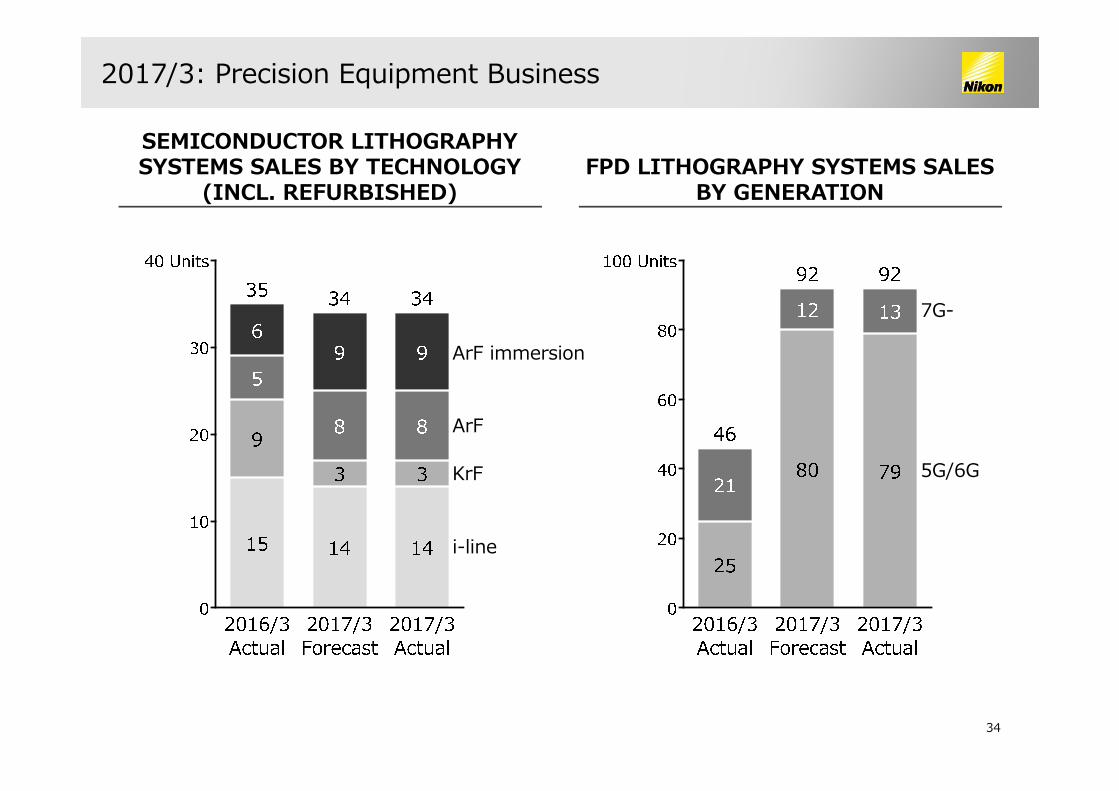
2017/3: Precision Equipment Business
SEMICONDUCTOR LITHOGRAPHYSYSTEMS SALES BY TECHNOLOGY
(INCL. REFURBISHED)FPD LITHOGRAPHY SYSTEMS SALES
BY GENERATION
ArF immersion
ArF
KrF
i-line
7G-
5G/6G

35
2018/3: Precision Equipment Business
SEMICONDUCTOR LITHOGRAPHYSYSTEMS SALES BY TECHNOLOGY
(INCL. REFURBISHED)
ArF immersion
ArF
KrF
i-line
7G-
5G/6G
FPD LITHOGRAPHY SYSTEMS SALES BY GENERATION

36
2018/3 Forecast: Foreign Exchange Impact
Exchange Rate Financial Impact from Fluctuationby 1 yen
18/3Assumption Revenue Operating Profit
US $ ¥110 Approx.¥2.7 billion
Approx.¥0.2 billion
EURO ¥120 Approx.¥0.9 billion
Approx.¥0.5 billion