Embed Size (px)
Citation preview
Copyright (C) 2020 Seven & i Holdings Co., Ltd. All Rights Reserved. 1
April 10, 2020
Seven & i Holdings Co., Ltd.
Financial Results Presentation FY2020
Copyright (C) 2020 Seven & i Holdings Co., Ltd. All Rights Reserved. 2
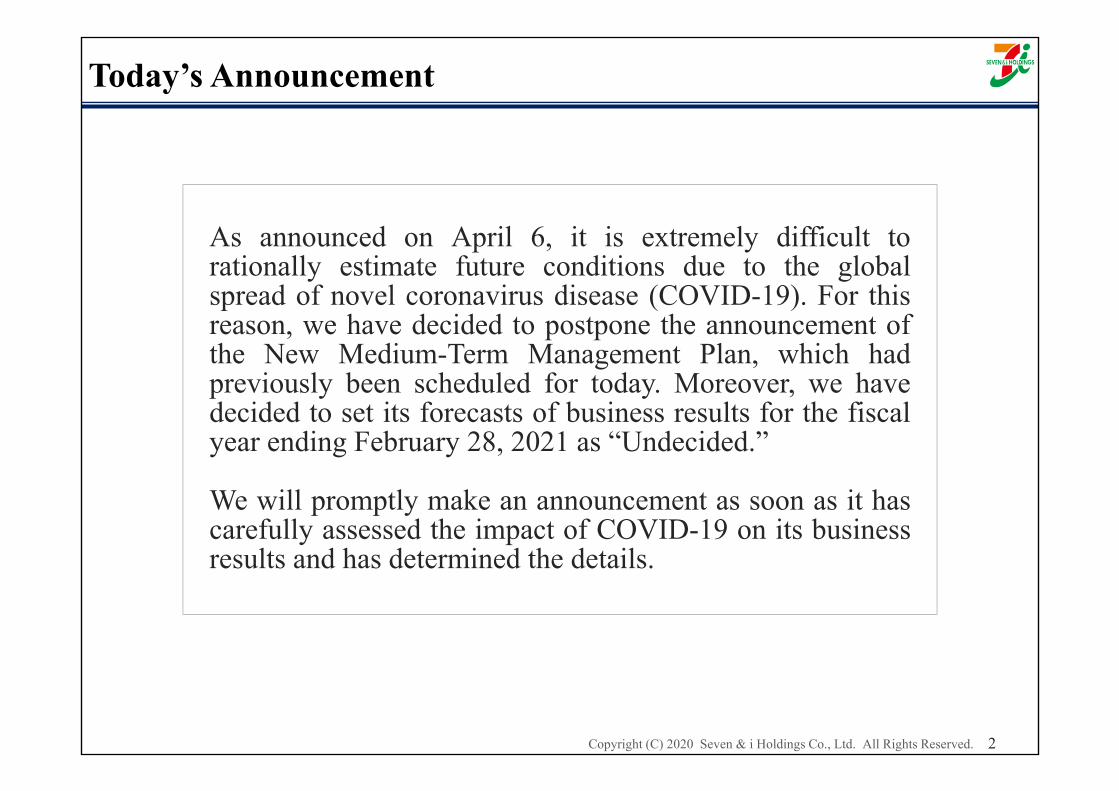
As announced on April 6, it is extremely difficult torationally estimate future conditions due to the globalspread of novel coronavirus disease (COVID-19). For thisreason, we have decided to postpone the announcement ofthe New Medium-Term Management Plan, which hadpreviously been scheduled for today. Moreover, we havedecided to set its forecasts of business results for the fiscalyear ending February 28, 2021 as “Undecided.”
We will promptly make an announcement as soon as it hascarefully assessed the impact of COVID-19 on its businessresults and has determined the details.
Today’s Announcement

Copyright (C) 2020 Seven & i Holdings Co., Ltd. All Rights Reserved. 3
◆YOY Change in Existing Store Sales of Operating Companies (approximations)
Mar. 1-15 Mar. 16-31 March
SEJ 96.5 97.1 96.8 Positive growth at stores in residential areas, but negative growth at stores near stations and sightseeing spots and in business and other such locations
SEI 103.2 89.0 95.7 Increasing negative impact since mid-March, following the declaration of a national emergency in the U.S. on March 13
IY 94.4 95.0 94.7 Positive growth atop stockpiling demand centered on household goods and food, but negative growth in shopping center formats such as Ario
YB 101.3 106.5 103.9 Positive growth mainly due to bulk food purchases in response to stay-home demand
SS* 70.7 63.2 66.6 Drastic downturn in non-essential products (apparel) and cosmetics, crowd avoidance, shorter business hours
7FS 80.0 69.3 74.1 Growth in stay-home consumption, customers refrain from eating out at restaurants
◆Existing Store Sales Increase YOY on March (preliminary basis)
Note) SEJ: Seven-Eleven Japan, SEI: 7-Eleven, Inc., IY: Ito-YokadoYB: York-Benimaru, SS: Sogo & Seibu, 7FS: Seven & i Food Systems
40
70
100
130
January Feb 5 Feb 10 Feb 15 Feb 20 Feb 25 Mar 1 Mar 6 Mar 11 Mar 16 Mar 21 Mar 26 Mar 31
線形 (SEJ) 線形 (SEI) 線形 (IY) 線形 (YB) 線形 (SS) 線形 (7FS)
Feb. 13Announcement of the Japanese government’s 1st responses to COVID-19
Feb. 25Announcement of Basic PoliciesforCOVID-19 Disease Control
(%)
Feb. 27Request for temporary closure of elementary, middle and high schools
SEJ IY YB SS 7FS (Denny’s)
Mar. 2 Start of temporary school closuresMar. 25-26 News conferences held by governorof Tokyo metropolitan area
SEI
Mar. 10Announcement of 2nd response to COVID-19
Impact of Novel Corona Virus
* Excluding the sale of corporate outside sales division
(%)
Copyright (C) 2020 Seven & i Holdings Co., Ltd. All Rights Reserved. 4
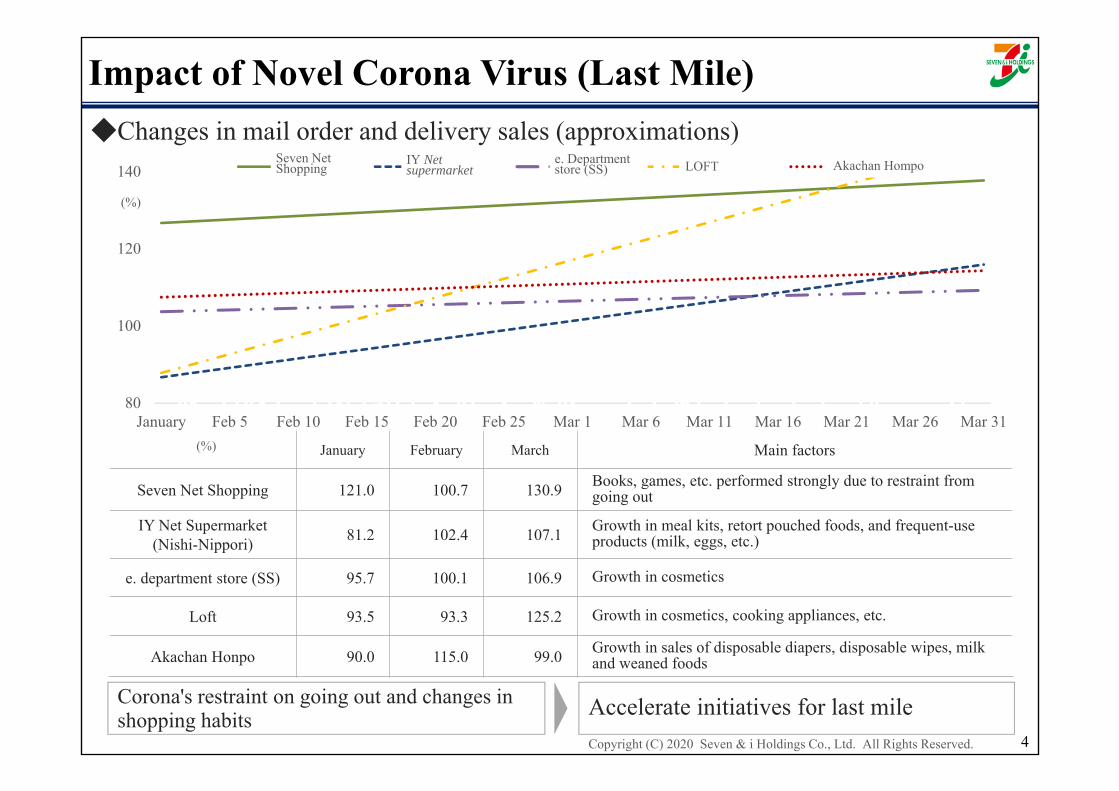
◆Changes in mail order and delivery sales (approximations)
Corona's restraint on going out and changes in shopping habits Accelerate initiatives for last mile
Impact of Novel Corona Virus (Last Mile)
January February March Main factors
Seven Net Shopping 121.0 100.7 130.9 Books, games, etc. performed strongly due to restraint from going out
IY Net Supermarket (Nishi-Nippori) 81.2 102.4 107.1 Growth in meal kits, retort pouched foods, and frequent-use
products (milk, eggs, etc.)
e. department store (SS) 95.7 100.1 106.9 Growth in cosmetics
Loft 93.5 93.3 125.2 Growth in cosmetics, cooking appliances, etc.
Akachan Honpo 90.0 115.0 99.0 Growth in sales of disposable diapers, disposable wipes, milk and weaned foods
(%)
80
100
120
140
January Feb 5 Feb 10 Feb 15 Feb 20 Feb 25 Mar 1 Mar 6 Mar 11 Mar 16 Mar 21 Mar 26 Mar 31
線形 (7NS) 線形 (IYNS) 線形 (SS) 線形 (LOFT) 線形 (AH)Akachan HompoIY Netsupermarket
Seven Net Shopping LOFTe. Department
store (SS)
(%)
Copyright (C) 2020 Seven & i Holdings Co., Ltd. All Rights Reserved. 5
FY2019 FY2020 YOY(%)
Change vs. plan (%)
Change
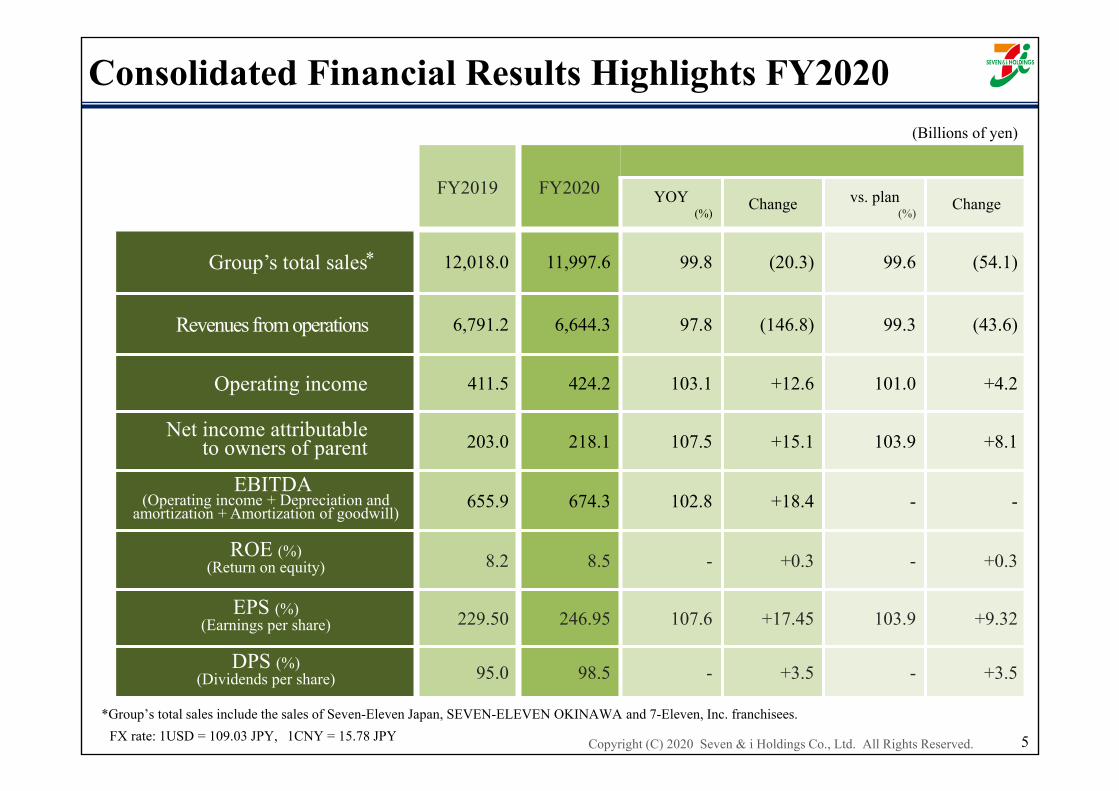
Group’s total sales 12,018.0 11,997.6 99.8 (20.3) 99.6 (54.1)
Revenues from operations 6,791.2 6,644.3 97.8 (146.8) 99.3 (43.6)
Operating income 411.5 424.2 103.1 +12.6 101.0 +4.2
Net income attributable to owners of parent 203.0 218.1 107.5 +15.1 103.9 +8.1
EBITDA(Operating income + Depreciation and
amortization + Amortization of goodwill)655.9 674.3 102.8 +18.4 - -
ROE (%)(Return on equity) 8.2 8.5 - +0.3 - +0.3
EPS (%)(Earnings per share) 229.50 246.95 107.6 +17.45 103.9 +9.32
DPS (%)(Dividends per share) 95.0 98.5 - +3.5 - +3.5
*
Consolidated Financial Results Highlights FY2020
*Group’s total sales include the sales of Seven-Eleven Japan, SEVEN-ELEVEN OKINAWA and 7-Eleven, Inc. franchisees.FX rate: 1USD = 109.03 JPY, 1CNY = 15.78 JPY
(Billions of yen)

Copyright (C) 2020 Seven & i Holdings Co., Ltd. All Rights Reserved. 6
424.2
411.5
(1.7)
(1.1)
(1.9)
+0.73
(2.9)
+0.13
+9.7
+9.8
FY2020
Eliminations/corporate
Others
Specialtystore
Financialservices
Departmentstore
Superstore
OverseasCVS
DomesticCVS
FY2019 Main factors in YOY changes
Improved SEJ’s sales and GPM and optimized SG&A expenses
SEI existing store sales and GPM growth
Other companies struggled while profits ofIY and YB increased
SS existing store sales and GPM decreased
Earnings improvement at overseas subsidiary
7&i Food Systems struggled, etc.
-
Increase in CRM-related expenses
Profit increased by ¥12.6B led by CVS operations in Japan and North America
+12.6
Operating Income Changes FY2020 (Billions of yen)

Copyright (C) 2020 Seven & i Holdings Co., Ltd. All Rights Reserved.
Operating income Net income attributableto owners of parent
YOY Change YOY Change
Seven-Eleven Japan 253.9 103.6 +8.8 169.6 110.7 +16.4
7-Eleven, Inc. 121.6 109.5 +10.5 83.1 107.2 +5.5
[Millions of dollar] [1,115] 110.9 [+109] [763] 108.6 [+60]
Ito-Yokado 6.5 138.5 +1.8 1.6 - +9.5
York-Benimaru〈incl. Life Foods*〉
16.8 101.0 +0.16 9.2 90.0 (1.0)
Sogo & Seibu 0.17 5.3 (3.0) (7.5) - (7.8)
7
(Billions of yen, %)
FY2020 Results for Major Operating Companies
* Life Foods is a wholly owned subsidiary which produces and sells delicatessen in York-Benimaru stores.The combined operating income and net income attributable to owners of parent for York-Benimaru and Life Foods represents internal management reporting figures.

Copyright (C) 2020 Seven & i Holdings Co., Ltd. All Rights Reserved.
Seven-Eleven JapanSEJ
8
Copyright (C) 2020 Seven & i Holdings Co., Ltd. All Rights Reserved. 9
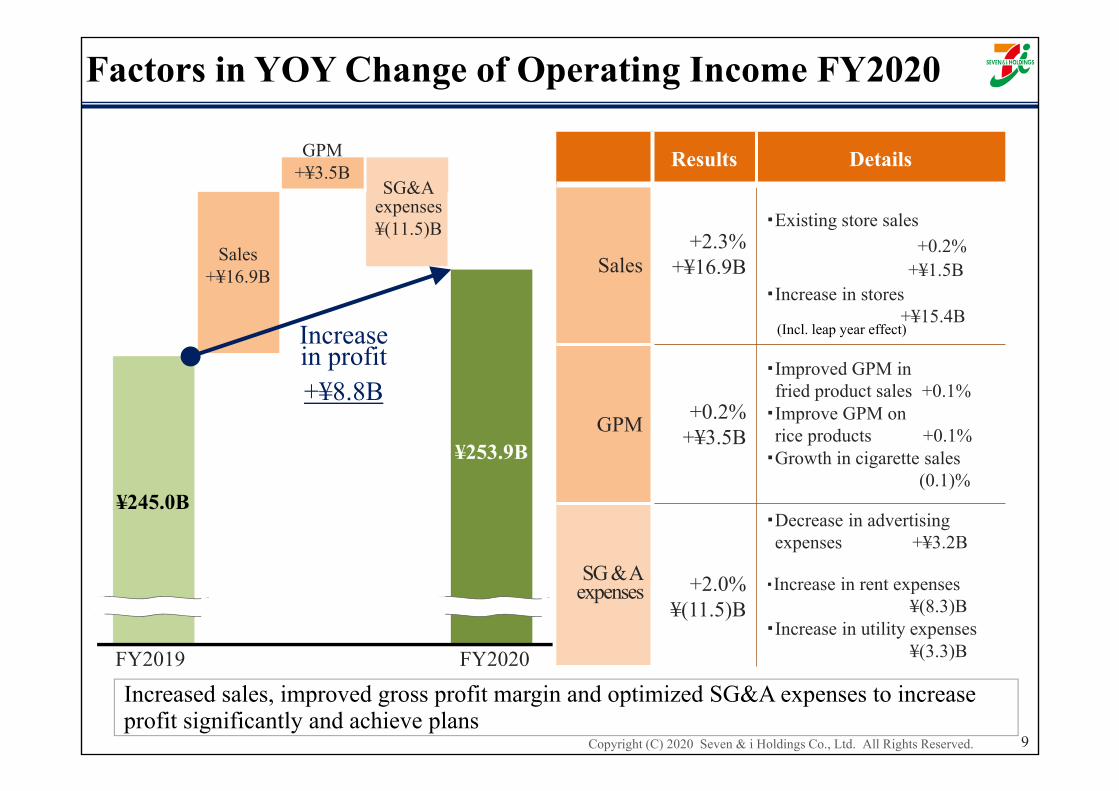
Factors in YOY Change of Operating Income FY2020
Results Details
Sales+2.3%
+¥16.9B
・Existing store sales+0.2%
+¥1.5B・Increase in stores
+¥15.4B
GPM +0.2%+¥3.5B
・Improved GPM in fried product sales +0.1%
・Improve GPM onrice products +0.1%
・Growth in cigarette sales(0.1)%
SG & Aexpenses +2.0%
¥(11.5)B
・Decrease in advertising expenses +¥3.2B
・Increase in rent expenses¥(8.3)B
・Increase in utility expenses¥(3.3)B
(Incl. leap year effect)
FY2019 FY2020
Increased sales, improved gross profit margin and optimized SG&A expenses to increase profit significantly and achieve plans
Increasein profit+¥8.8B
¥253.9B
¥245.0B
Sales+¥16.9B
GPM+¥3.5B
SG&Aexpenses¥(11.5)B

Copyright (C) 2020 Seven & i Holdings Co., Ltd. All Rights Reserved.
(0.6)
(0.4)
(0.2)
±0.0
+0.2
+0.4
Q1 Q2 Q3 Q4 Q1 Q2 Q3 Q4
Processed foods & Miscellaneous (incl. tobacco)
Fresh foods & daily foods
10
(%)
■FY2020 resultsCategories YOY Change
Total +0.15Impact of tobacco (0.07)Fresh foods, daily foods +0.24
Fried products +0.08
Rice products +0.05
Noodles +0.02
Sandwiches +0.02
Desserts +0.02
Others +0.05
Alcoholic beverages +0.02Confectionary, processed foods ±0.00
Miscellaneous (0.01)
Ice cream, soft drink (0.03)
Sales of fresh food and daily product increased due to continuous renewal that includes quality improvement
FY 2019 FY 2020
Feb. 2019rice balls complete renewal
Oct. 2018the increase of cigarette prices
Sep. 2018GPM improved for all fried products
YOY Change in Gross Profit Margin
Copyright (C) 2020 Seven & i Holdings Co., Ltd. All Rights Reserved.
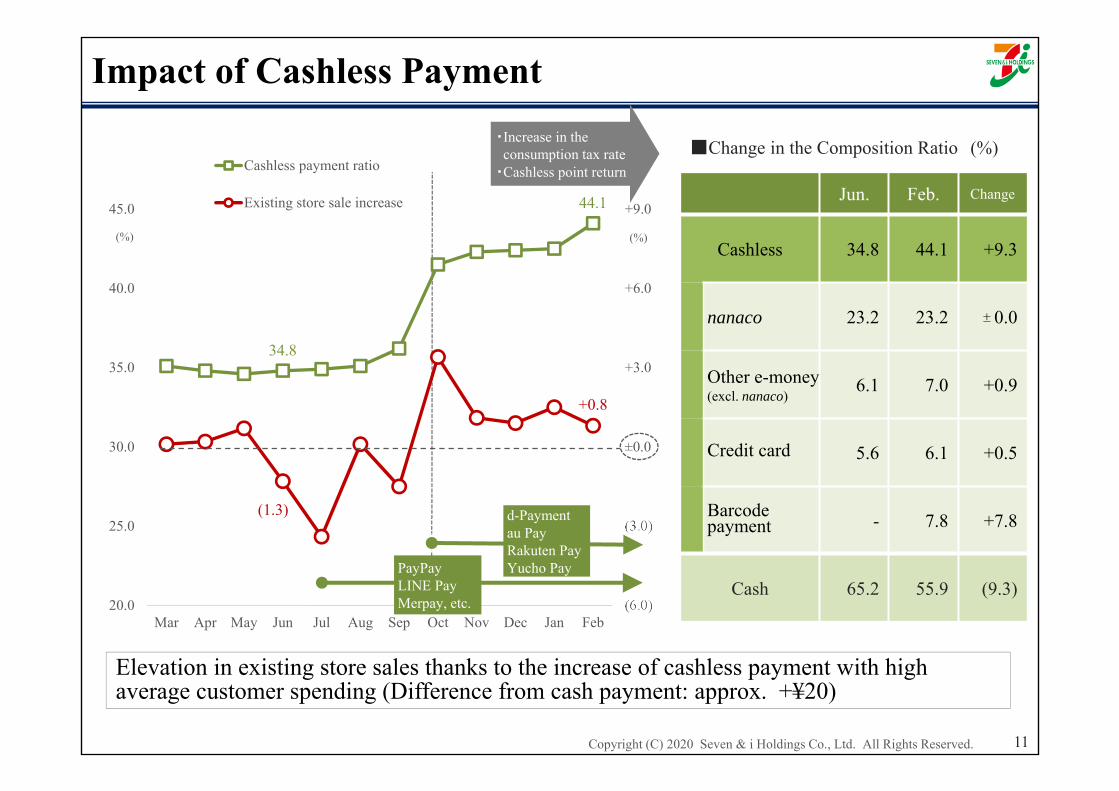
34.8
44.1
(1.3)
+0.8
(6.0)
(3.0)
±0.0
+3.0
+6.0
+9.0
20.0
25.0
30.0
35.0
40.0
45.0
Mar Apr May Jun Jul Aug Sep Oct Nov Dec Jan Feb
Cashless payment ratio
Existing store sale increase
11
Impact of Cashless Payment
(%)
PayPayLINE PayMerpay, etc.
・Increase in the consumption tax rate
・Cashless point return
d-Paymentau PayRakuten PayYucho Pay
(%)
Jun. Feb. Change
Cashless 34.8 44.1 +9.3
nanaco 23.2 23.2 ±0.0
Other e-money(excl. nanaco)
6.1 7.0 +0.9
Credit card 5.6 6.1 +0.5
Barcodepayment - 7.8 +7.8
Cash 65.2 55.9 (9.3)
■Change in the Composition Ratio (%)
Elevation in existing store sales thanks to the increase of cashless payment with high average customer spending (Difference from cash payment: approx. +¥20)
Copyright (C) 2020 Seven & i Holdings Co., Ltd. All Rights Reserved.
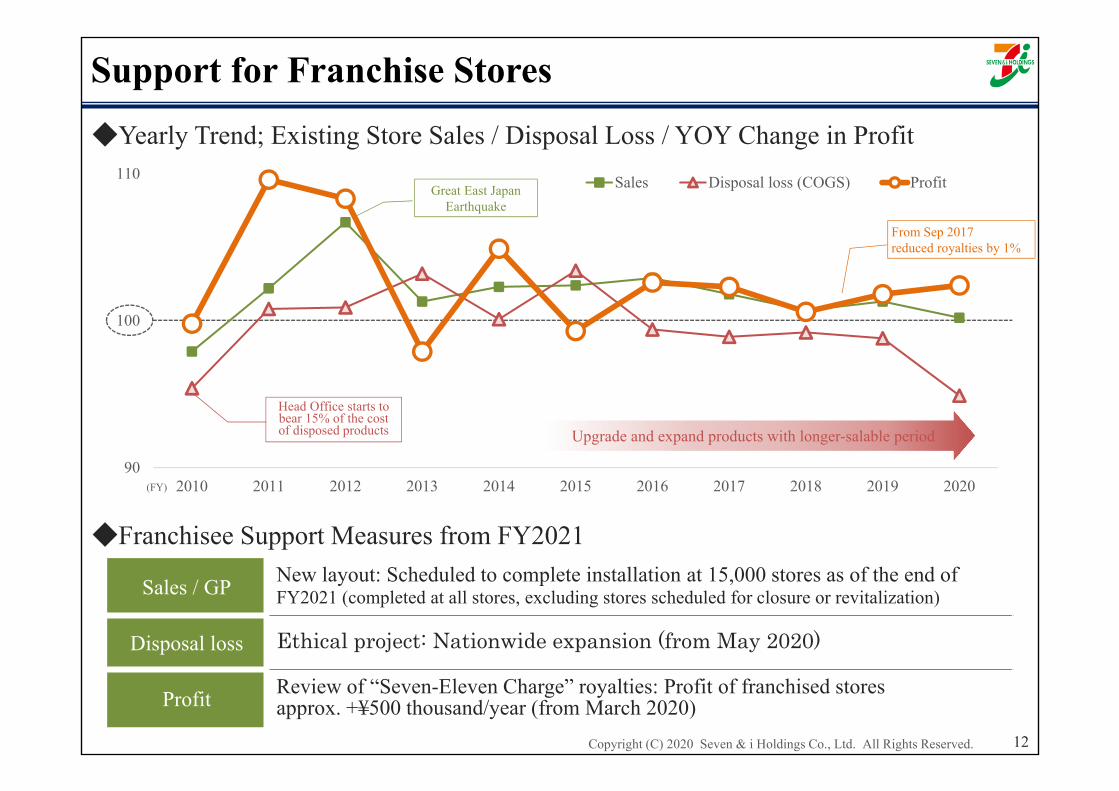
Sales / GP New layout: Scheduled to complete installation at 15,000 stores as of the end of FY2021 (completed at all stores, excluding stores scheduled for closure or revitalization)
Disposal loss Ethical project: Nationwide expansion (from May 2020)
Profit Review of “Seven-Eleven Charge” royalties: Profit of franchised stores approx. +¥500 thousand/year (from March 2020)
◆Yearly Trend; Existing Store Sales / Disposal Loss / YOY Change in Profit
12
◆Franchisee Support Measures from FY2021
Support for Franchise Stores
90
100
110
2010 2011 2012 2013 2014 2015 2016 2017 2018 2019 2020
Sales Disposal loss (COGS) ProfitGreat East Japan Earthquake
Head Office starts to bear 15% of the cost of disposed products Upgrade and expand products with longer-salable period
From Sep 2017reduced royalties by 1%
(FY)
Copyright (C) 2020 Seven & i Holdings Co., Ltd. All Rights Reserved.
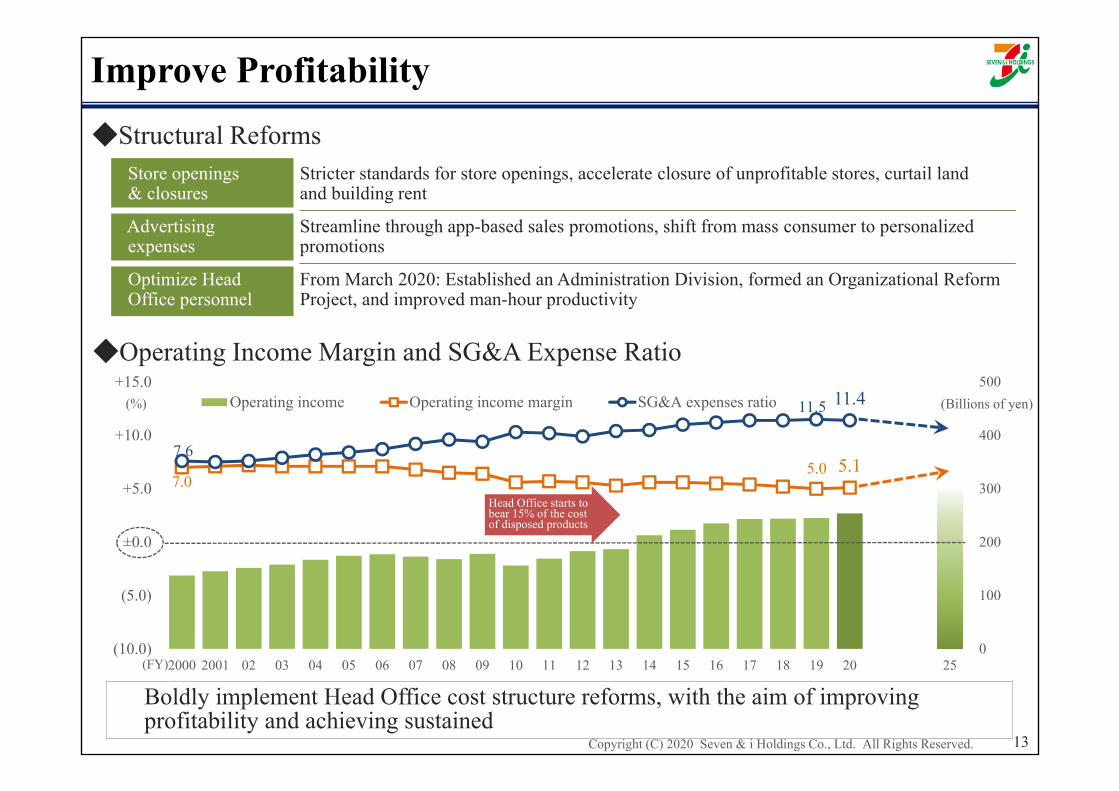
7.05.0 5.1
7.6
11.5 11.4
0
100
200
300
400
500
(10.0)
(5.0)
±0.0
+5.0
+10.0
+15.0
2000 2001 02 03 04 05 06 07 08 09 10 11 12 13 14 15 16 17 18 19 20 25
Operating income Operating income margin SG&A expenses ratio(%) (Billions of yen)
13
(FY)
Boldly implement Head Office cost structure reforms, with the aim of improving profitability and achieving sustained
Head Office starts to bear 15% of the cost of disposed products
◆Structural Reforms
◆Operating Income Margin and SG&A Expense Ratio
Store openings& closures
Stricter standards for store openings, accelerate closure of unprofitable stores, curtail landand building rent
Advertising expenses
Streamline through app-based sales promotions, shift from mass consumer to personalized promotions
Optimize Head Office personnel
From March 2020: Established an Administration Division, formed an Organizational Reform Project, and improved man-hour productivity
Improve Profitability
Copyright (C) 2020 Seven & i Holdings Co., Ltd. All Rights Reserved.
7-Eleven, Inc.SEI
14
Copyright (C) 2020 Seven & i Holdings Co., Ltd. All Rights Reserved. 15
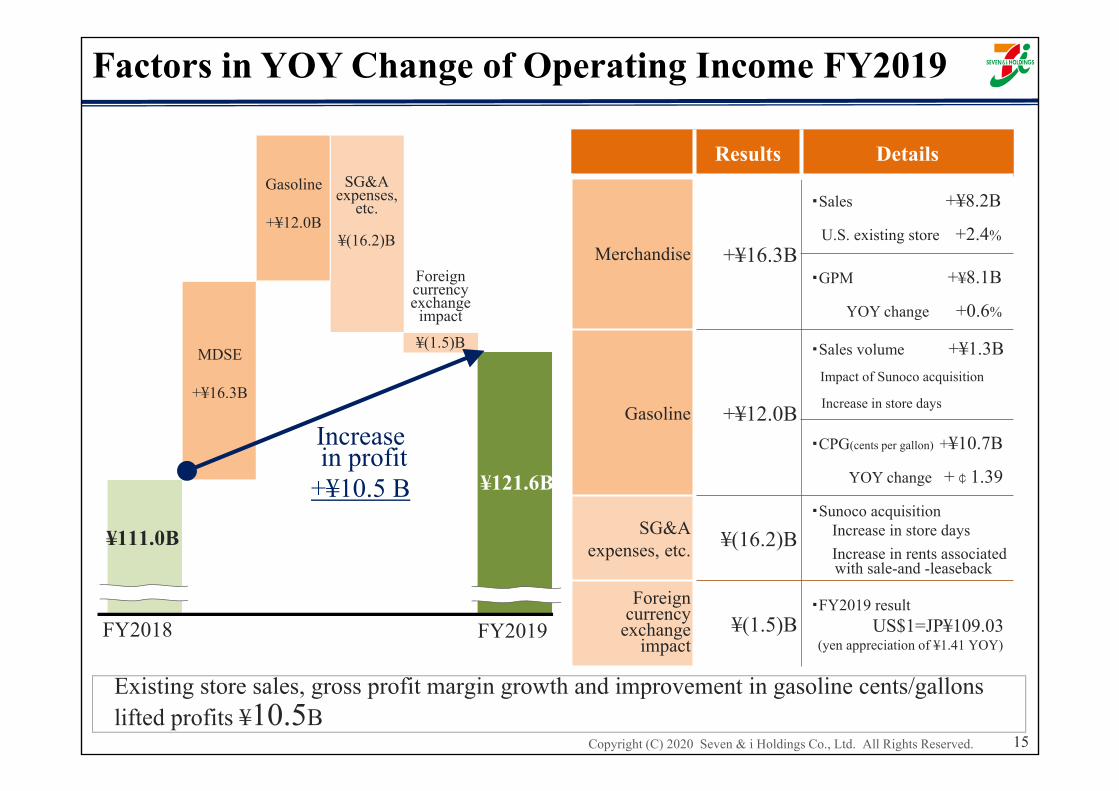
Results Details
Merchandise +¥16.3B
・Sales +¥8.2B
U.S. existing store +2.4%
・GPM +¥8.1B
YOY change +0.6%
Gasoline +¥12.0B
・Sales volume +¥1.3BImpact of Sunoco acquisition
Increase in store days
・CPG(cents per gallon) +¥10.7B
YOY change +¢1.39
SG&Aexpenses, etc. ¥(16.2)B
・Sunoco acquisitionIncrease in store daysIncrease in rents associatedwith sale-and -leaseback
Foreign currency
exchange impact
¥(1.5)B・FY2019 result
US$1=JP¥109.03(yen appreciation of ¥1.41 YOY)
Factors in YOY Change of Operating Income FY2019
Existing store sales, gross profit margin growth and improvement in gasoline cents/gallons lifted profits ¥10.5B
FY2018 FY2019
¥111.0B
¥121.6B
Increasein profit
+¥10.5 B
MDSE
+¥16.3B
Gasoline
+¥12.0B
SG&A expenses,
etc.
¥(16.2)B
Foreigncurrencyexchange
impact
¥(1.5)B
Copyright (C) 2020 Seven & i Holdings Co., Ltd. All Rights Reserved. 16
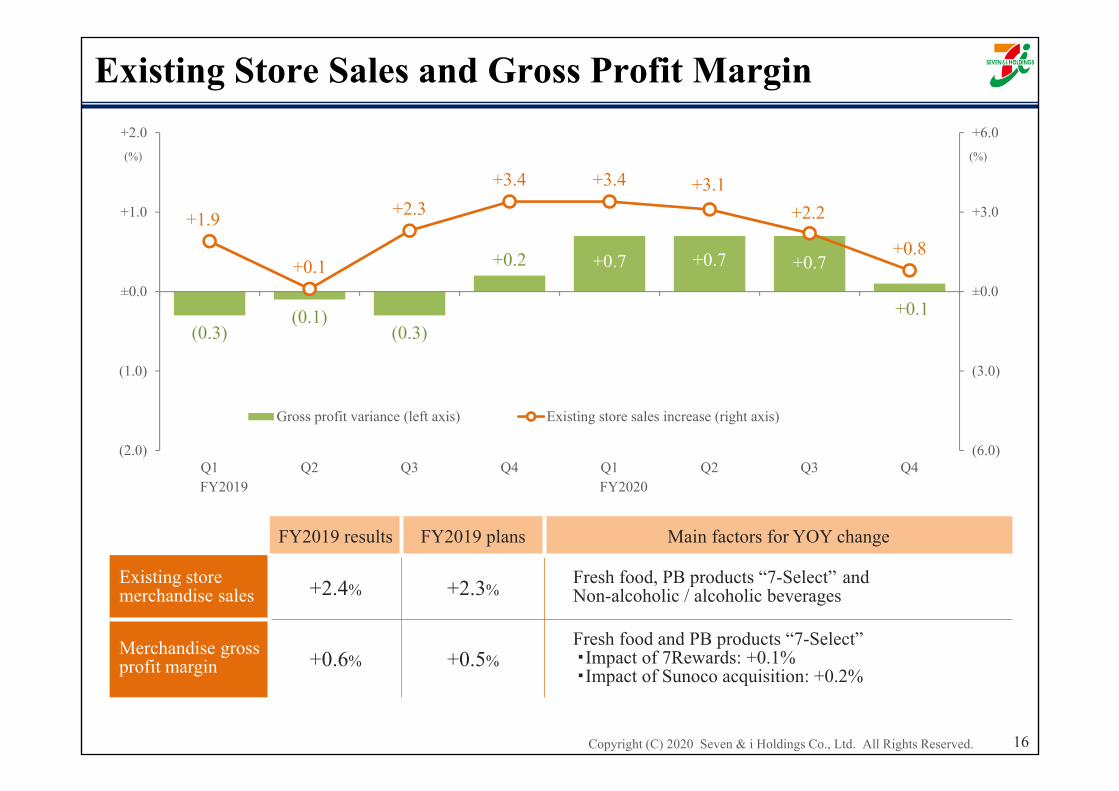
FY2019 results FY2019 plans Main factors for YOY change
Existing storemerchandise sales +2.4% +2.3%
Fresh food, PB products “7-Select” and Non-alcoholic / alcoholic beverages
Merchandise gross profit margin +0.6% +0.5%
Fresh food and PB products “7-Select”・Impact of 7Rewards: +0.1%・Impact of Sunoco acquisition: +0.2%
(0.3)(0.1)
(0.3)
+0.2 +0.7 +0.7 +0.7
+0.1
+1.9
+0.1
+2.3+3.4 +3.4 +3.1
+2.2
+0.8
(6.0)
(3.0)
±0.0
+3.0
+6.0
(2.0)
(1.0)
±0.0
+1.0
+2.0
Q1 Q2 Q3 Q4 Q1 Q2 Q3 Q4
Gross profit variance (left axis) Existing store sales increase (right axis)
(%) (%)
Existing Store Sales and Gross Profit Margin
FY2019 FY2020

Copyright (C) 2020 Seven & i Holdings Co., Ltd. All Rights Reserved.
0
100
200
300
400
500
Q1 Q2 Q3 Q4 Q1 Q2 Q3 Q4 Q1 Q2 Q3 Q4
17
(MM$)
Gasoline Gross Profit
Gasoline GP grew consistently due to favorable CPG, which offset a decline in gallons sold
Gasoline GP exceeded both last year’s record and the plan
◆Gasoline Gross Profit Jan. 23, 2018Acquired Sunoco FY2020 results
vs. previous year 107.0%
vs. plan 104.6%
Trended above previous year, even after the Sunoco acquisition ran its course
(6)
(3)
0
3
6
80
90
100
110
120
Q1 Q2 Q3 Q4 Q1 Q2 Q3 Q4
YOY difference in CPG (right axis) Gallon sold per store YOY (left axis)
◆YOY: CPG change and Average Gallon Sold Per Store
Jan. 23, 2018Acquired Sunoco
(¢)(%)
FY2019 FY2020
FY2018 FY2019 FY2020

Copyright (C) 2020 Seven & i Holdings Co., Ltd. All Rights Reserved.
4,099
5,075 1,476
1,766
1,300
1,500
1,700
3,500
4,000
4,500
5,000
5,500
2007 2008 2009 2010 2011 2012 2013 2014 2015 2016 2017 2018 2019 2020
APSD (left axis) MDSE GP/store/day (right axis)
18
1,999
6,050
0
2,000
4,000
6,000
8,000
10,000
2007 2008 2009 2010 2011 2012 2013 2014 2015 2016 2017 2018 2019 2020
No. of acquired stores No. of stores at the end of fiscal terms(stores)
*Merchandise APSD ($) × Merchandise margin (%)
Net increase in stores opened
organically:1,633
◆Merchandise APSD and Merchandise GP per Store
◆Break Down of No. of Stores
Promote strategic M&As
No. of Stores, Merchandise APSD and Merchandise GP
(FY)
(FY)
Total No. of stores:
9,682
*
($) ($)
*Acquired stores: Number of operational stores as of each fiscal year-end, among the stores acquired since FY2011 for which data is available.

Copyright (C) 2020 Seven & i Holdings Co., Ltd. All Rights Reserved.
275
1,005
1,115 11.1
24.0
0.0
5.0
10.0
15.0
20.0
25.0
200
400
600
800
1,000
1,200
2007 2008 2009 2010 2011 2012 2013 2014 2015 2016 2017 2018 2019 2020
Operating income at SEI (left axis)
Composition ratio (right axis)
◆Trend in SEI Operating Income and Its Ratio* of Consolidated Operating Income
*Composition ratio is calculated in terms of consolidated operating income after amortization of goodwill on a yen basis.
(1) Strengthen merchandise centered onfresh food (2) Implement effective M&A activities
(3) Promote franchising (4) Ensure steady profits in the gasoline business
19
Profit Contribution
($MM)
(FY)
(%)
Continue to further improve profitability and drive Group-wide growth

Copyright (C) 2020 Seven & i Holdings Co., Ltd. All Rights Reserved. 20
Ito-YokadoIY

Copyright (C) 2020 Seven & i Holdings Co., Ltd. All Rights Reserved. 21
602億円
3.7億円
Operating income rose ¥1.8 B and hit the plan owing to improved GPM and curtailmentof SG&A expenses (Net income turned positive for the first time in six fiscal years)
Factors in YOY Change of Operating Income FY2020
Results Details
Operating revenues
(4.1)%
¥(12.7)B
・Decline in store countDecrease in 2 stores YOY
・Existing store increase incl. tenants
(1.0)%[Directly operated stores (2.9)%]
Grossoperating
profit
+0.1%+¥1.1B
・GPM of directly operatedsales +0.3%
・Decrease in gross operating profit margin due to increase in tenant composition ratio
SG&Aexpenses
(4.4)%
+¥13.4B
・Decrease in personnel cost+¥7.4B
・Decrease in rent expenses+¥3.2B
・Decrease in advertising & decoration expense
+¥1.8B
Increasein profit+¥1.8B
SG&Aexpenses +¥13.4B
Sales¥(12.7)B
Grossoperating
profit+¥1.1B
¥6.5B¥4.7B
FY2020FY2019

Copyright (C) 2020 Seven & i Holdings Co., Ltd. All Rights Reserved. 22
*Out of the ¥2.5 billion increase in operating income, the effect of the leap year is estimated to be ¥0.5 billion
Store openings &
closures
¥(0.44)B
Storesnot yet
implemented
+¥1.1B
Operating income rose ¥2.5B driven by profitability improvement at stores that have already implemented structural reforms
Factors in YOY Change of Operating Income Q4 FY2020
FY2020FY2019
Results Details
Storeopenings
& closures¥(0.44)B ・Store openings FY2020
Increase in 3 stores YOY
Structurally reformed
stores+¥1.1B ・Delivered earnings growth in
4Q alone atop improved gross profit and reduced expenses
Stores not yet
structurally reformed
+¥1.8B
・FY2020 structurally reformed stores +¥7.3B
・Structurally reformed storesbefore FY2019
+¥1.0B
Increasein profit+¥2.5B
¥7.4B
¥4.9B
Structurally reformed
stores(61 stores)
+¥1.8 B

Copyright (C) 2020 Seven & i Holdings Co., Ltd. All Rights Reserved. 23
0
10
20
30
40
-90 90- 95- 100- 105- 110-
Stores not yet structurally reformedStructurally reformed stores
(composition ratio %)
(YOY %)
◆IY Comparison Ratio of YOY Change in Existing Store Sales (February 2020)
Sales YOY incl. tenants February* FY2020
Structurally reformed stores 102.8% 100.4%
Stores not yet structurally reformed 98.8% 96.3%
IY total 101.1% 99.0%
Structural reforms were implemented at a total of 61 stores until the end of FY2020
Figures improved for IY as a whole, driven bystructurally reformed stores
◆Contribution to Operating Income
Structurally reformed storesChange in operating income from the previous year (after allocation of Head
Office costs)
FY2020
+¥1.2B
Accelerate horizontal deployment from the current fiscal year onwards
Achievements of Store Structural Reform
* Figures are management figures excluding leap-year effects

Copyright (C) 2020 Seven & i Holdings Co., Ltd. All Rights Reserved.
・Strengthen merchandising based on integrated manufacturing, distribution salesIntroduceProcess center & Central kitchen
・Synergies through the integration of merchandising across companiesYMT: New merchandising in the
Tokyo metropolitan areaIY : Merchandising for
THE PRICESG : Merchandising for differ-
rentiation and high quality・FOC labor-efficient register system, lockers, etc.
Seek to improve profitability by streamlining the supply chain, while collaborating with the IY food business in the future
◆Reorganization of 7&i Tokyo Metropolitan Area Food Supermarket
24
Transferred 20 stores of Shokuhinkan and THE PRICE to the new company York Co., Ltd. (June 1)
Business Structural Reforms
IY
Specialty storebusinesses
Lifestyle businesses
Food businesses
Shokuhinkan&
THE PRICE
Shokuhinkan&
THE PRICE York Mart
THE G
AR
DEN
JIYU
GA
OK
A
FOR
ECA
ST
(Note) YMT: York Mart, IY: Ito-Yokado, SG: SHELL GARDEN, Shokuhinkan: Food specialty store of IY, THE PRICE: Discount store format of IY, FORECAST: Food supermarket operator of 7&i Group with new business format
June 1new company
York Co., Ltd.
Copyright (C) 2020 Seven & i Holdings Co., Ltd. All Rights Reserved.
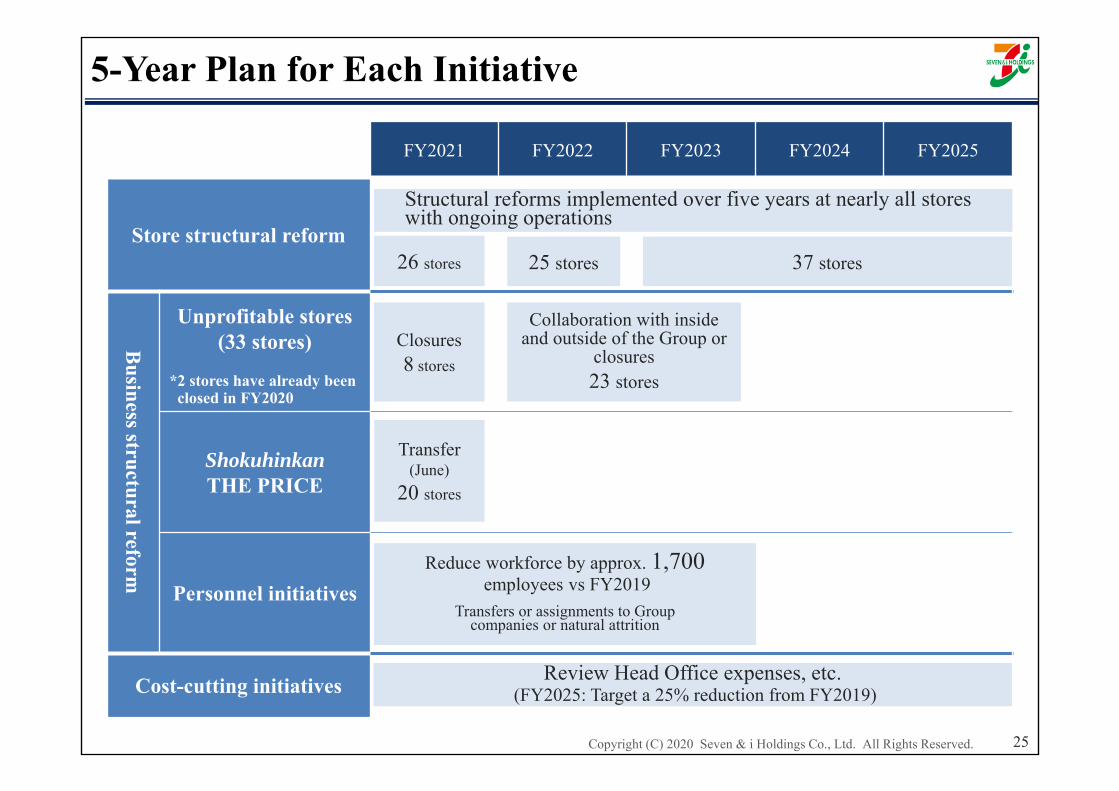
FY2021 FY2022 FY2023 FY2024 FY2025
Store structural reform
Business structural reform
Unprofitable stores(33 stores)
*2 stores have already been closed in FY2020
ShokuhinkanTHE PRICE
Personnel initiatives
Cost-cutting initiatives
5-Year Plan for Each Initiative
Reduce workforce by approx. 1,700employees vs FY2019
Transfers or assignments to Groupcompanies or natural attrition
Review Head Office expenses, etc.(FY2025: Target a 25% reduction from FY2019)
Structural reforms implemented over five years at nearly all storeswith ongoing operations
Closures8 stores
Collaboration with inside and outside of the Group or
closures23 stores
Transfer(June)
20 stores
26 stores 37 stores25 stores
25
Copyright (C) 2020 Seven & i Holdings Co., Ltd. All Rights Reserved.
Sogo & SeibuSS
26
Copyright (C) 2020 Seven & i Holdings Co., Ltd. All Rights Reserved. 27
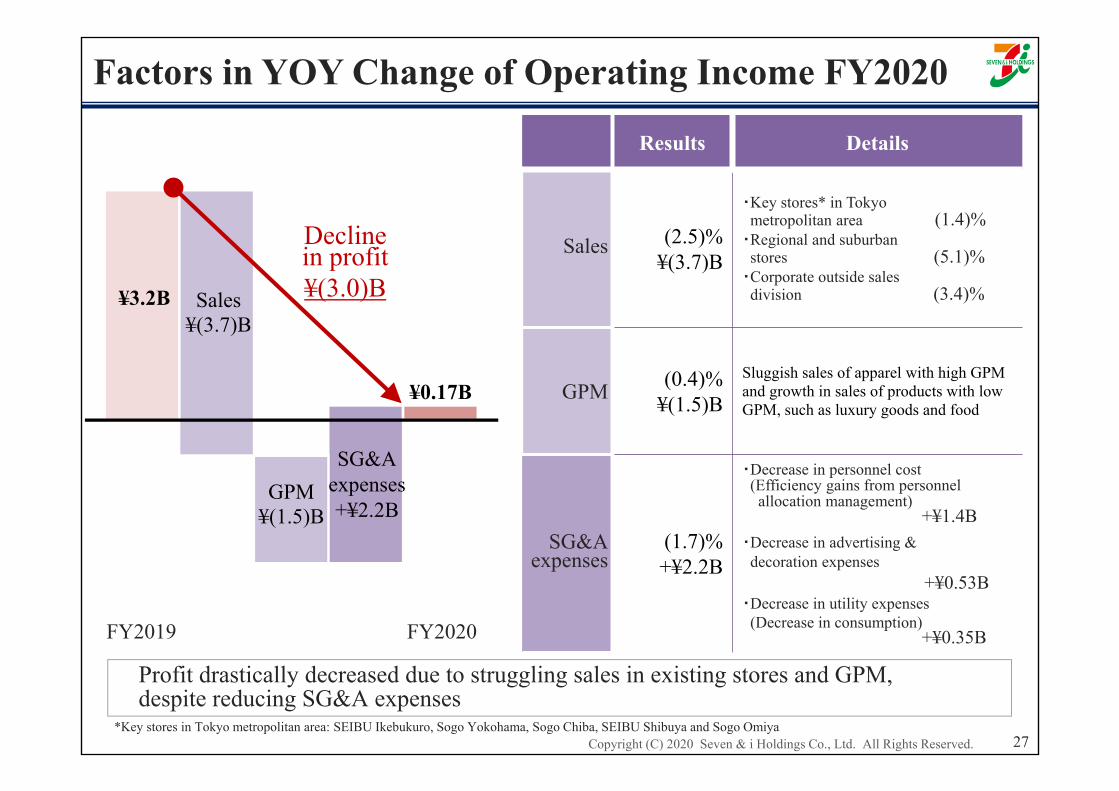
Profit drastically decreased due to struggling sales in existing stores and GPM, despite reducing SG&A expenses
Factors in YOY Change of Operating Income FY2020
Results Details
Sales (2.5)%¥(3.7)B
▪Key stores* in Tokyo metropolitan area (1.4)%▪Regional and suburbanstores (5.1)%▪Corporate outside salesdivision (3.4)%
GPM (0.4)%¥(1.5)B
Sluggish sales of apparel with high GPM and growth in sales of products with low GPM, such as luxury goods and food
SG&Aexpenses
(1.7)%+¥2.2B
▪Decrease in personnel cost(Efficiency gains from personnel allocation management)
+¥1.4B▪Decrease in advertising & decoration expenses
+¥0.53B▪Decrease in utility expenses(Decrease in consumption)
+¥0.35BFY2020FY2019
Declinein profit¥(3.0)B¥3.2B
¥0.17B
Sales¥(3.7)B
GPM¥(1.5)B
SG&Aexpenses+¥2.2B
*Key stores in Tokyo metropolitan area: SEIBU Ikebukuro, Sogo Yokohama, Sogo Chiba, SEIBU Shibuya and Sogo Omiya
Copyright (C) 2020 Seven & i Holdings Co., Ltd. All Rights Reserved.
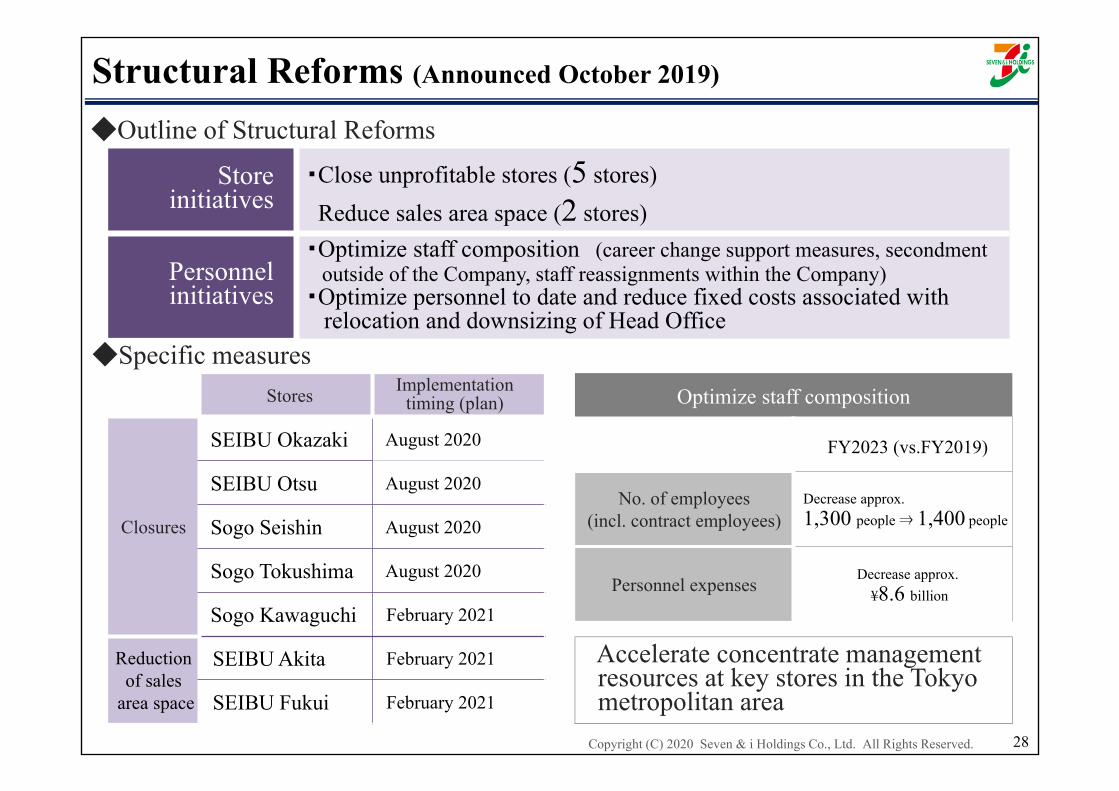
Structural Reforms (Announced October 2019)
28
Store initiatives
・Close unprofitable stores (5 stores)Reduce sales area space (2 stores)
Personnelinitiatives
・Optimize staff composition (career change support measures, secondmentoutside of the Company, staff reassignments within the Company)
・Optimize personnel to date and reduce fixed costs associated with relocation and downsizing of Head Office
Stores Implementation timing (plan)
Closures
SEIBU Okazaki August 2020
SEIBU Otsu August 2020
Sogo Seishin August 2020
Sogo Tokushima August 2020
Sogo Kawaguchi February 2021
Reductionof sales
area space
SEIBU Akita February 2021
SEIBU Fukui February 2021
Optimize staff composition
FY2023 (vs.FY2019)
No. of employees(incl. contract employees)
Decrease approx. 1,300 people ⇒ 1,400 people
Personnel expenses Decrease approx.¥8.6 billion
Accelerate concentrate management resources at key stores in the Tokyo metropolitan area
◆Outline of Structural Reforms
◆Specific measures

Copyright (C) 2020 Seven & i Holdings Co., Ltd. All Rights Reserved.
Digital & Financial Strategies
29

Copyright (C) 2020 Seven & i Holdings Co., Ltd. All Rights Reserved.
Foster understanding of individual customer needs and strengthen relationships through purchase, payment and customer data
30
◆Target StatusImprove customer satisfaction
Improve customers’ LTV
New customer inflowFrequency of store visitsIncrease in basket size
UX improvementDigital and finance
◆Basic ConceptDigital strategy Financial strategy
Deepen CRM ・Expand 7iD collaborations・Digital coupon distribution (Beacon)
Upgrade and expand services
・IY’s Net Supermarket andSEJ’s Net Convenience Store・Delivery lockers
Improve productivity
・Improve efficiency of store operationsAI-based ordering, unmannedstores, etc.
・Supply chain management
ATMs・Added value through new services
Smartphone payment, facial recognition
Credit cards
・Upgrade and expand service menu (cashing, revolving payments, credit, etc.)・Contactless payment (Type A/B)・Link 7iD and customers’ financial information
nanaco(e-money)
・Strengthen mobile nanaco
One to One marketing New shopping experiencesNew financial productsand services
Digital & Financial Strategies
Comprehensive security platform

Copyright (C) 2020 Seven & i Holdings Co., Ltd. All Rights Reserved. 31
It’s bothersome to open yoursmartphone at the register.
Credit cardsContactless payment (Type A/B)
It’s bothersome to search for coupons when you don’t have
your smartphone open.
Coupons will open automatically when youenter a store with Beacon
You cannot visit a storeYou cannot visit a store
while it is open
Online supermarketsDelivery lockers at CVSConsider: Proposal to link card to 7iD
Strive to improve UX by offering new value propositions based on digital technology
◆Improvement measures to address pain points felt by customers and the benefits of these measures
・New customer inflow・Frequency of store visits
・Frequency of store visits・Basket size
・New customer inflow・Basket size
Improve UX Using Digital Technology
Copyright (C) 2020 Seven & i Holdings Co., Ltd. All Rights Reserved.
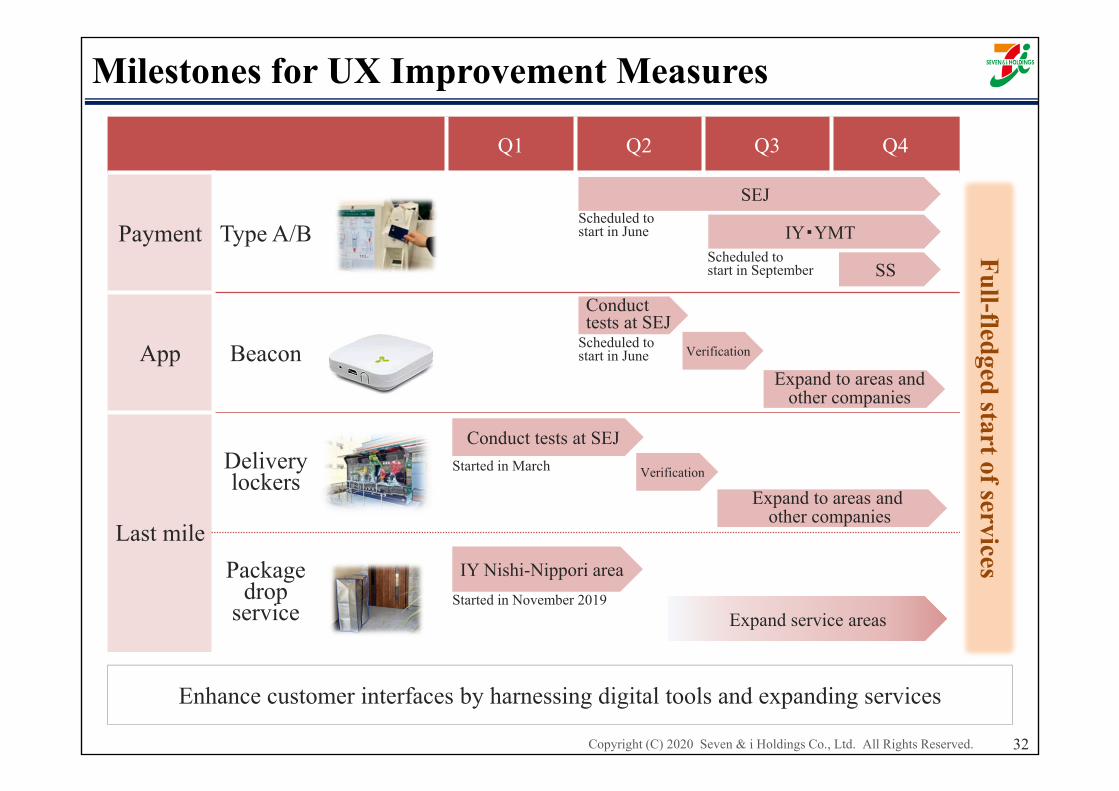
Q1 Q2 Q3 Q4
Payment Type A/B
App Beacon
Last mile
Delivery lockers
Package drop
service
SEJ
IY・YMT
SS
Conduct tests at SEJ
Verification
Expand to areas and other companies
Conduct tests at SEJ
Verification
Expand to areas andother companies
Expand service areas
IY Nishi-Nippori area
Full-fledged start of services
Started in March
Enhance customer interfaces by harnessing digital tools and expanding services
Scheduled tostart in June
32
Milestones for UX Improvement Measures
Scheduled tostart in September
Scheduled tostart in June
Started in November 2019
Copyright (C) 2020 Seven & i Holdings Co., Ltd. All Rights Reserved.
Corporate Governance
33
Copyright (C) 2020 Seven & i Holdings Co., Ltd. All Rights Reserved. 34
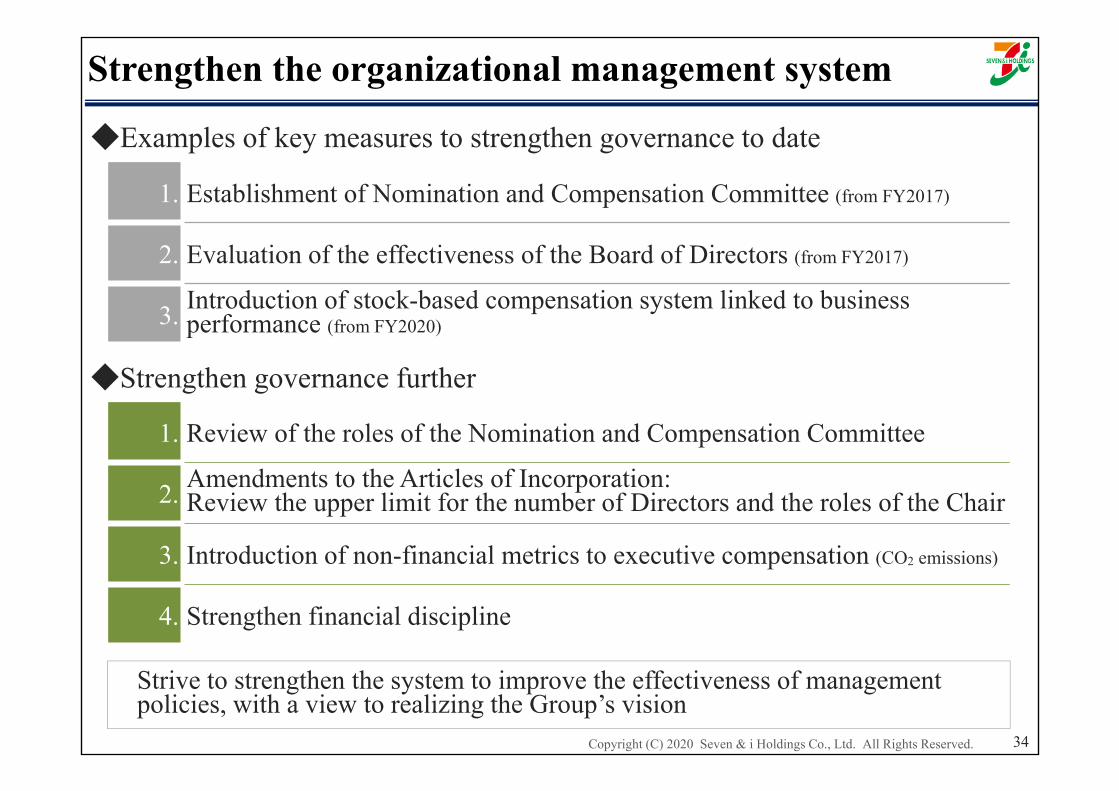
Strive to strengthen the system to improve the effectiveness of management policies, with a view to realizing the Group’s vision
◆Examples of key measures to strengthen governance to date
1. Establishment of Nomination and Compensation Committee (from FY2017)
2. Evaluation of the effectiveness of the Board of Directors (from FY2017)
3. Introduction of stock-based compensation system linked to business performance (from FY2020)
◆Strengthen governance further
1. Review of the roles of the Nomination and Compensation Committee
2. Amendments to the Articles of Incorporation:Review the upper limit for the number of Directors and the roles of the Chair
3. Introduction of non-financial metrics to executive compensation (CO2 emissions)
4. Strengthen financial discipline
Strengthen the organizational management system
Copyright (C) 2020 Seven & i Holdings Co., Ltd. All Rights Reserved.
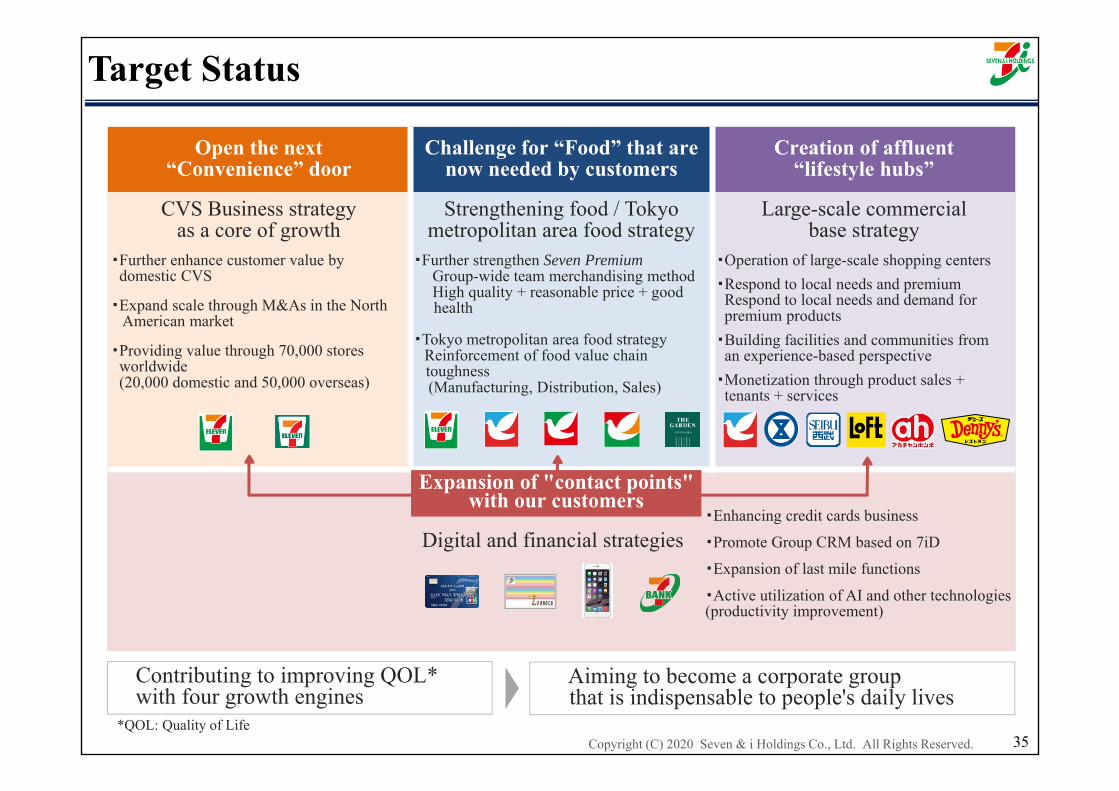
Target Status
Contributing to improving QOL* with four growth engines
35
Open the next“Convenience” door
Challenge for “Food” that are now needed by customers
Creation of affluent“lifestyle hubs”
CVS Business strategyas a core of growth
Strengthening food / Tokyo metropolitan area food strategy
Large-scale commercialbase strategy
・Further enhance customer value bydomestic CVS
・Expand scale through M&As in the North American market
・Providing value through 70,000 stores worldwide (20,000 domestic and 50,000 overseas)
・Further strengthen Seven PremiumGroup-wide team merchandising methodHigh quality + reasonable price + good health
・Tokyo metropolitan area food strategyReinforcement of food value chain toughness(Manufacturing, Distribution, Sales)
・Operation of large-scale shopping centers・Respond to local needs and premium Respond to local needs and demand for premium products・Building facilities and communities froman experience-based perspective・Monetization through product sales + tenants + services
Digital and financial strategies・Enhancing credit cards business
・Promote Group CRM based on 7iD
・Expansion of last mile functions
・Active utilization of AI and other technologies (productivity improvement)
Expansion of "contact points" with our customers
Aiming to become a corporate groupthat is indispensable to people's daily lives
*QOL: Quality of Life

Copyright (C) 2020 Seven & i Holdings Co., Ltd. All Rights Reserved.
Financial Policy
36
Copyright (C) 2020 Seven & i Holdings Co., Ltd. All Rights Reserved. 37
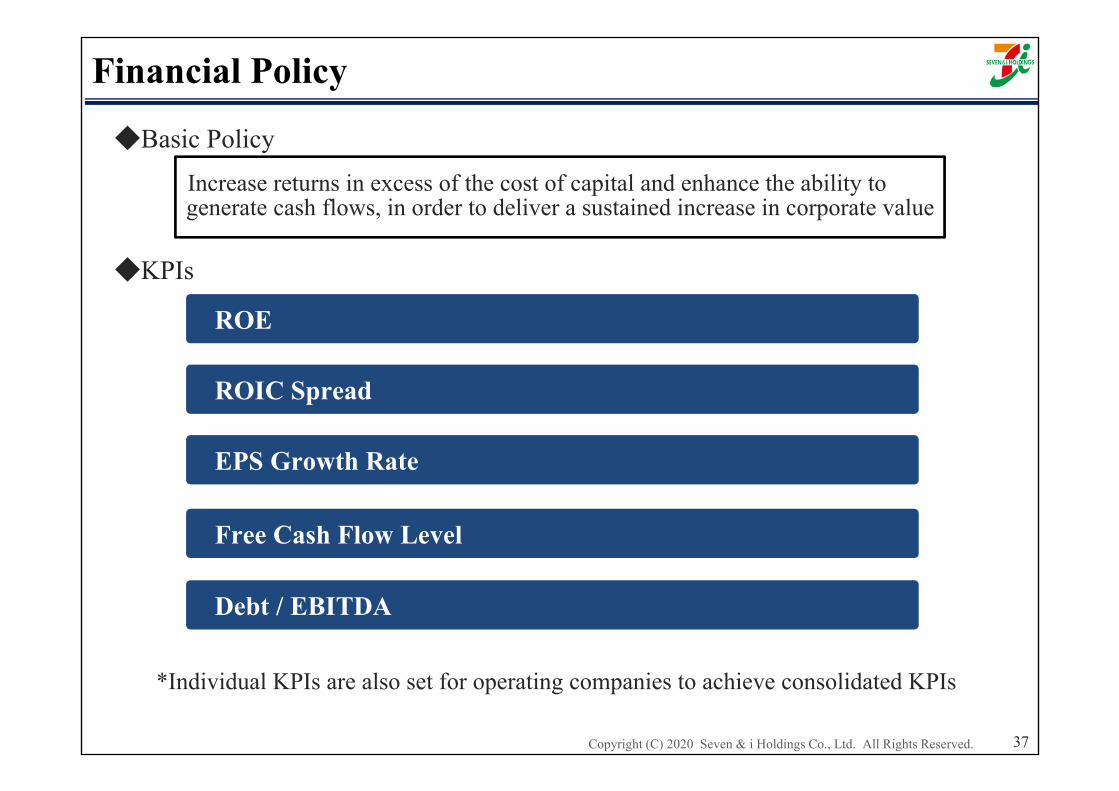
◆Basic PolicyIncrease returns in excess of the cost of capital and enhance the ability togenerate cash flows, in order to deliver a sustained increase in corporate value
◆KPIs
*Individual KPIs are also set for operating companies to achieve consolidated KPIs
ROE
Free Cash Flow Level
ROIC Spread
Debt / EBITDA
EPS Growth Rate
Financial Policy
Copyright (C) 2020 Seven & i Holdings Co., Ltd. All Rights Reserved. 38
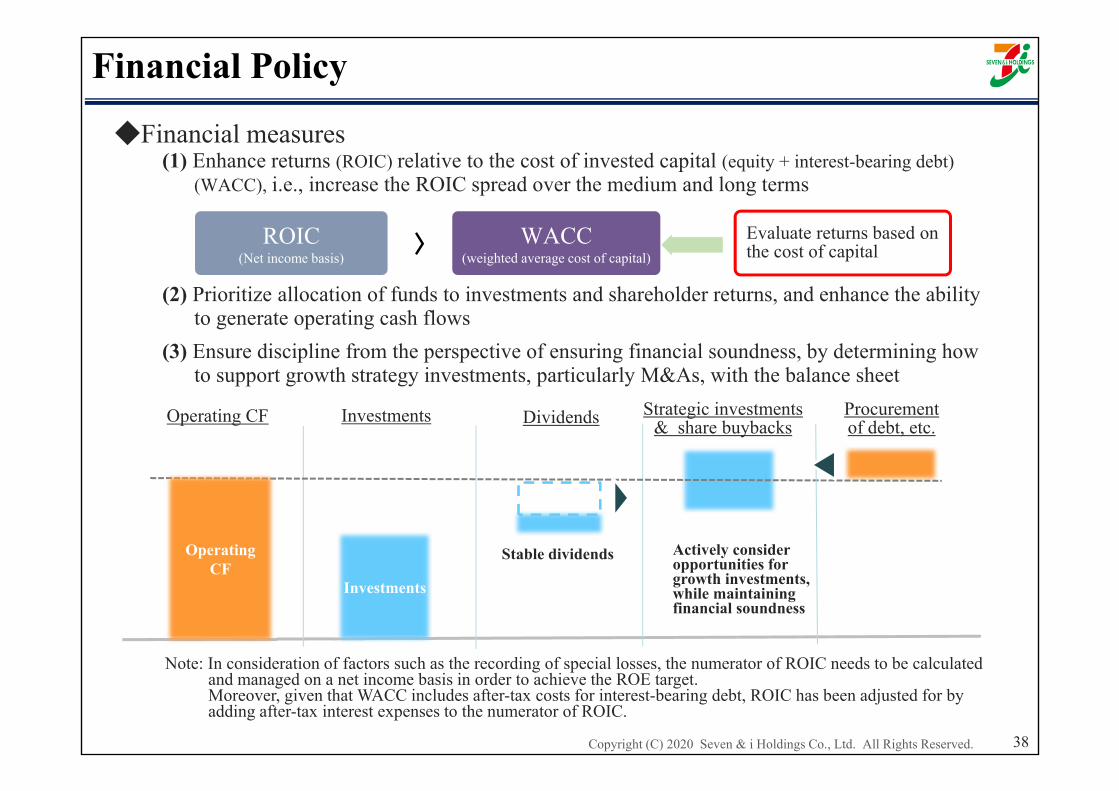
◆Financial measures(1) Enhance returns (ROIC) relative to the cost of invested capital (equity + interest-bearing debt)
(WACC), i.e., increase the ROIC spread over the medium and long terms
(2) Prioritize allocation of funds to investments and shareholder returns, and enhance the abilityto generate operating cash flows
(3) Ensure discipline from the perspective of ensuring financial soundness, by determining howto support growth strategy investments, particularly M&As, with the balance sheet
〉ROIC(Net income basis)
WACC(weighted average cost of capital)
Evaluate returns based on the cost of capital
Operating CF
Actively consider opportunities for growth investments, while maintaining financial soundness
Stable dividendsOperatingCF
Investments
DividendsInvestments Procurementof debt, etc.
Strategic investments & share buybacks
Note: In consideration of factors such as the recording of special losses, the numerator of ROIC needs to be calculated and managed on a net income basis in order to achieve the ROE target.Moreover, given that WACC includes after-tax costs for interest-bearing debt, ROIC has been adjusted for by adding after-tax interest expenses to the numerator of ROIC.
Financial Policy

Copyright (C) 2020 Seven & i Holdings Co., Ltd. All Rights Reserved.
45 45 47.5 47.5
45 45 47.5 51
90 9095 98.5
0
20
40
60
80
100
FY2017 FY2018 FY2019 FY2020 FY2021
Interim dividens
Year-end dividens
(yen)
39
Consolidated dividends payout ratio target
Provide stable dividends by maintaining a dividend payout ratio at the level of 40% of consolidated net income
Share buybacks Consider flexibly conducting share buybacks while taking into consideration the level of free cash flow
Dividends Policy
Dividendspayout
ratio (%)82.3 43.9 41.4 39.9 -
(Forecast)

Copyright (C) 2020 Seven & i Holdings Co., Ltd. All Rights Reserved.
A p p e n d i x
40
Copyright (C) 2020 Seven & i Holdings Co., Ltd. All Rights Reserved.
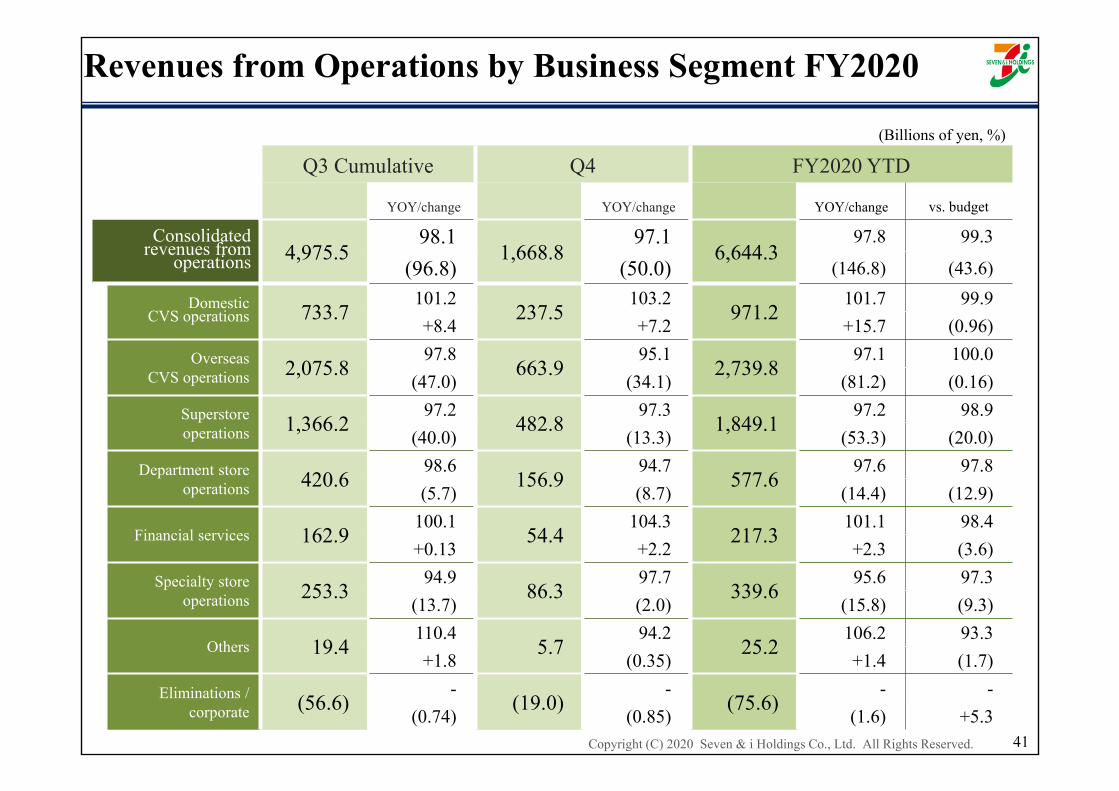
Q3 Cumulative Q4 FY2020 YTD
YOY/change YOY/change YOY/change vs. budget
Consolidatedrevenues from
operations 4,975.598.1
1,668.897.1
6,644.397.8 99.3
(96.8) (50.0) (146.8) (43.6)
Domestic CVS operations 733.7
101.2237.5
103.2971.2
101.7 99.9+8.4 +7.2 +15.7 (0.96)
OverseasCVS operations 2,075.8
97.8663.9
95.12,739.8
97.1 100.0(47.0) (34.1) (81.2) (0.16)
Superstore operations 1,366.2
97.2482.8
97.31,849.1
97.2 98.9(40.0) (13.3) (53.3) (20.0)
Department store operations 420.6
98.6156.9
94.7577.6
97.6 97.8(5.7) (8.7) (14.4) (12.9)
Financial services 162.9100.1
54.4104.3
217.3101.1 98.4
+0.13 +2.2 +2.3 (3.6)
Specialty store operations 253.3
94.986.3
97.7339.6
95.6 97.3(13.7) (2.0) (15.8) (9.3)
Others 19.4110.4
5.794.2
25.2106.2 93.3
+1.8 (0.35) +1.4 (1.7)
Eliminations / corporate (56.6)
-(19.0)
-(75.6)
- -(0.74) (0.85) (1.6) +5.3
41
Revenues from Operations by Business Segment FY2020
(Billions of yen, %)

Copyright (C) 2020 Seven & i Holdings Co., Ltd. All Rights Reserved.
Q3 Cumulative Q4 FY2020 YTD
YOY/change YOY/change YOY/change vs. budget
Consolidatedrevenues from
operations 319.0104.9
105.198.0
424.2103.1 101.0
+14.8 (2.1) +12.6 +4.2
Domestic CVS operations 200.1
107.356.4
93.7256.6
104.0 102.1+13.6 (3.8) +9.8 +5.2
OverseasCVS operations 76.4
111.425.5
108.0102.0
110.6 99.3+7.8 +1.9 +9.7 (0.69)
Superstore operations 7.980.2
13.3118.5
21.3100.6 81.6
(1.9) +2.0 +0.13 (4.7)
Department store operations (1.9)
-2.7
66.50.79
21.3 17.0(1.5) (1.3) (2.9) (3.9)
Financial services 41.797.1
11.9119.7
53.6101.4 115.8
(1.2) +1.9 +0.73 +7.3
Specialty store operations 4.0
75.80.61
47.34.6
70.2 57.9(1.3) (0.68) (1.9) (3.4)
Others 1.575.1
0.012.6
1.558.5 62.2
(0.50) (0.59) (1.1) (0.94)
Eliminations / corporate (10.8)
-(5.4)
-(16.2)
- -(0.15) (1.6) (1.7) +5.5
42
Operating Income by Business Segment FY2020
(Billions of yen, %)

Copyright (C) 2020 Seven & i Holdings Co., Ltd. All Rights Reserved.
Q3 Cumulative Q4 FY2020 YTD
YOY/change YOY/change YOY/change vs. budget
Seven-Eleven Japan 198.4
107.055.4
93.0253.9
103.6 101.6
+13.0 (4.1) +8.8 +3.9
7-Eleven, Inc. 91.1110.5
30.5106.7
121.6109.5 99.2
+8.6 +1.9 +10.5 (0.94)
[Millions of dollar] [835]111.0
[280]110.8
[1,115]110.9 100.1
[+82] [+27] [+109] [+1.2]
Ito-Yokado (0.89)-
7.4151.1
6.5138.5 100.3
(0.69) +2.5 +1.8 +0.02
York-Benimaru〈incl. Life Foods*〉
11.1105.7
5.792.9
16.8101.0 92.3
+0.60 (0.44) +0.16 (1.4)
Sogo & Seibu (2.6)-
2.766.4
0.175.3 4.1
(1.6) (1.4) (3.0) (4.0)
*
43
* Life Foods is a wholly owned subsidiary which produces and sells delicatessen in York-Benimaru stores.The combined operating income for York-Benimaru and Life Foods represents internal management reporting figures.
Operating Income for Major Operating Companies FY2020(Billions of yen)

Copyright (C) 2020 Seven & i Holdings Co., Ltd. All Rights Reserved.
Assets(Main items only)
Feb. 28 2019
Feb. 292020 change
Current assets 2,326.4 2,471.9 +145.4
Cash and bank deposits 1,314.5 1,357.7 +43.1
Cash and due from banks at Seven Bank 775.4 846.2 +70.7
Notes and accounts receivable-trade 95.6 153.0 +57.3
Non-current assets 3,468.5 3,522.5 +54.0
Property and equipment 2,118.6 2,183.3 +64.7
Buildings and structures, net 954.0 992.3 +38.2
Land 751.6 746.9 (4.7)
Intangible assets 608.4 608.8 +0.39
Investments and other assets 741.3 730.2 (11.1)
Deferred assets 0.10 2.4 +2.3
Total assets 5,795.0 5,996.8 +201.8
Liabilities and net assets(Main items only)
Feb. 28 2019
Feb. 292020 change
Total liabilities 3,122.5 3,239.6 +117.0
Current liabilities 1,992.7 2,157.1 +164.4
Notes and accounts payable, trade 411.6 410.7 (0.8)
Short-term loans 143.1 129.4 (13.7)
Current portion of bondsCurrent portion of long-term loans 156.6 168.4 +11.7
Deposits received 174.0 228.4 +54.3
Deposit received in banking business 588.3 655.0 +66.6
Non-current liabilities 1,129.8 1,082.4 (47.3)
Bonds 361.9 281.9 (79.9)
Long-term loans 443.4 403.1 (40.2)
Total net assets 2,672.4 2,757.2 +84.7
Total liabilities and net assets 5,795.0 5,996.8 +201.8
44
Consolidated B/S Summary (As of Feb. 29, 2020)
(Billions of yen)
Note) ASBJ Statement No. 28 has been adopted and reflected retroactively in the figures for the fiscal year ended February 28, 2019
Copyright (C) 2020 Seven & i Holdings Co., Ltd. All Rights Reserved.
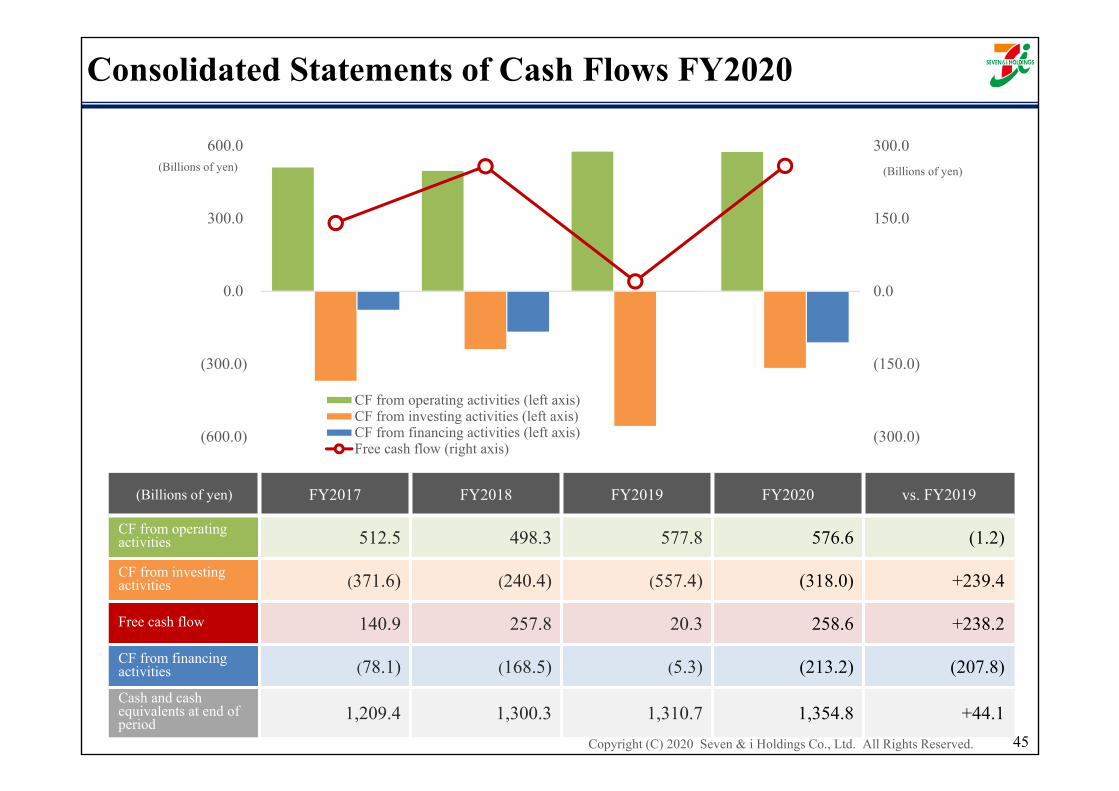
(Billions of yen) FY2017 FY2018 FY2019 FY2020 vs. FY2019
CF from operating activities 512.5 498.3 577.8 576.6 (1.2)
CF from investingactivities (371.6) (240.4) (557.4) (318.0) +239.4
Free cash flow 140.9 257.8 20.3 258.6 +238.2
CF from financing activities (78.1) (168.5) (5.3) (213.2) (207.8)Cash and cash equivalents at end of period
1,209.4 1,300.3 1,310.7 1,354.8 +44.145
Consolidated Statements of Cash Flows FY2020
(Billions of yen)(Billions of yen)
(300.0)
(150.0)
0.0
150.0
300.0
(600.0)
(300.0)
0.0
300.0
600.0
2016年度 2017年度 2018年度 2019年度
CF from operating activities (left axis)CF from investing activities (left axis)CF from financing activities (left axis)Free cash flow (right axis)
Copyright (C) 2020 Seven & i Holdings Co., Ltd. All Rights Reserved.
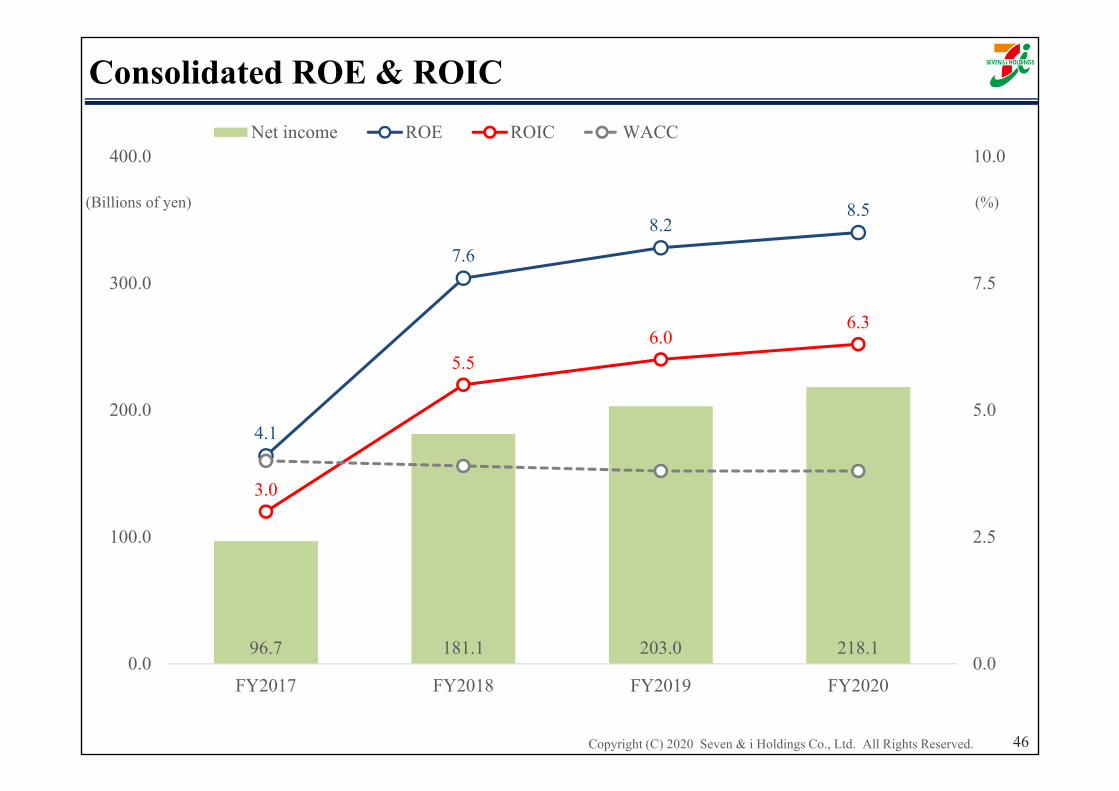
96.7 181.1 203.0 218.1
4.1
7.6 8.2
8.5
3.0
5.5 6.0
6.3
0.0
2.5
5.0
7.5
10.0
0.0
100.0
200.0
300.0
400.0
FY2017 FY2018 FY2019 FY2020
Net income ROE ROIC WACC
46
(Billions of yen) (%)
Consolidated ROE & ROIC

Copyright (C) 2020 Seven & i Holdings Co., Ltd. All Rights Reserved.
1,048.4 983.01,105.1
982.9
588.2 621.4 655.9 674.3
1.78
1.581.68
1.46
0.0
400.0
800.0
1,200.0
1,600.0
0.0
0.5
1.0
1.5
2.0
FY2017 FY2018 FY2019 FY2020
Debt EBITDA Debt/EBITDA multiple
47
(Reference) Debt / EBITDA Multiple
(Billions of yen)
Copyright (C) 2020 Seven & i Holdings Co., Ltd. All Rights Reserved. 48
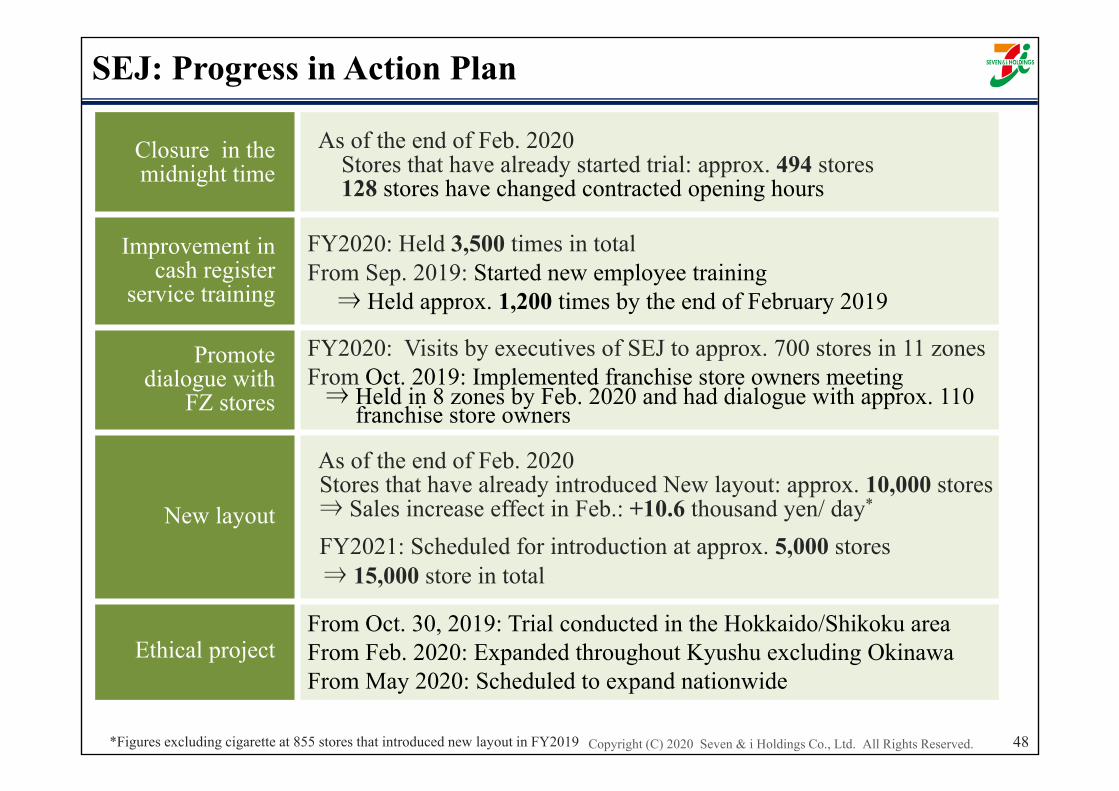
SEJ: Progress in Action Plan
*Figures excluding cigarette at 855 stores that introduced new layout in FY2019
Closure in themidnight time
As of the end of Feb. 2020Stores that have already started trial: approx. 494 stores128 stores have changed contracted opening hours
Improvement in cash register
service training
FY2020: Held 3,500 times in totalFrom Sep. 2019: Started new employee training
⇒ Held approx. 1,200 times by the end of February 2019
Promote dialogue with
FZ stores
FY2020: Visits by executives of SEJ to approx. 700 stores in 11 zonesFrom Oct. 2019: Implemented franchise store owners meeting ⇒ Held in 8 zones by Feb. 2020 and had dialogue with approx. 110
franchise store owners
New layout
As of the end of Feb. 2020Stores that have already introduced New layout: approx. 10,000 stores⇒ Sales increase effect in Feb.: +10.6 thousand yen/ day*
FY2021: Scheduled for introduction at approx. 5,000 stores⇒ 15,000 store in total
Ethical projectFrom Oct. 30, 2019: Trial conducted in the Hokkaido/Shikoku area From Feb. 2020: Expanded throughout Kyushu excluding OkinawaFrom May 2020: Scheduled to expand nationwide
Copyright (C) 2020 Seven & i Holdings Co., Ltd. All Rights Reserved. 49
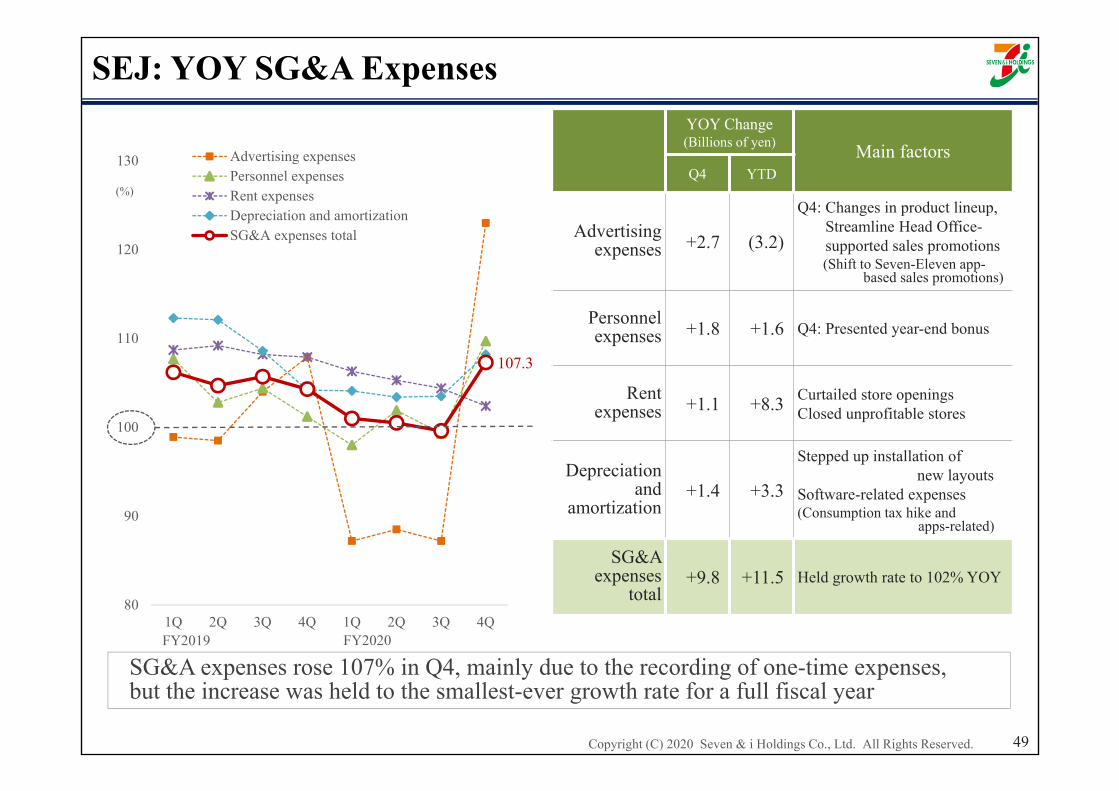
(%)
SG&A expenses rose 107% in Q4, mainly due to the recording of one-time expenses, but the increase was held to the smallest-ever growth rate for a full fiscal year
YOY Change(Billions of yen) Main factorsQ4 YTD
Advertisingexpenses +2.7 (3.2)
Q4: Changes in product lineup, Streamline Head Office-supported sales promotions(Shift to Seven-Eleven app-
based sales promotions)
Personnelexpenses +1.8 +1.6 Q4: Presented year-end bonus
Rent expenses +1.1 +8.3 Curtailed store openings
Closed unprofitable stores
Depreciation and
amortization+1.4 +3.3
Stepped up installation of new layouts
Software-related expenses(Consumption tax hike and
apps-related)
SG&A expenses
total+9.8 +11.5 Held growth rate to 102% YOY
FY2019 FY2020
SEJ: YOY SG&A Expenses
107.3
80
90
100
110
120
130
1Q 2Q 3Q 4Q 1Q 2Q 3Q 4Q
Advertising expensesPersonnel expensesRent expensesDepreciation and amortizationSG&A expenses total
Copyright (C) 2020 Seven & i Holdings Co., Ltd. All Rights Reserved.
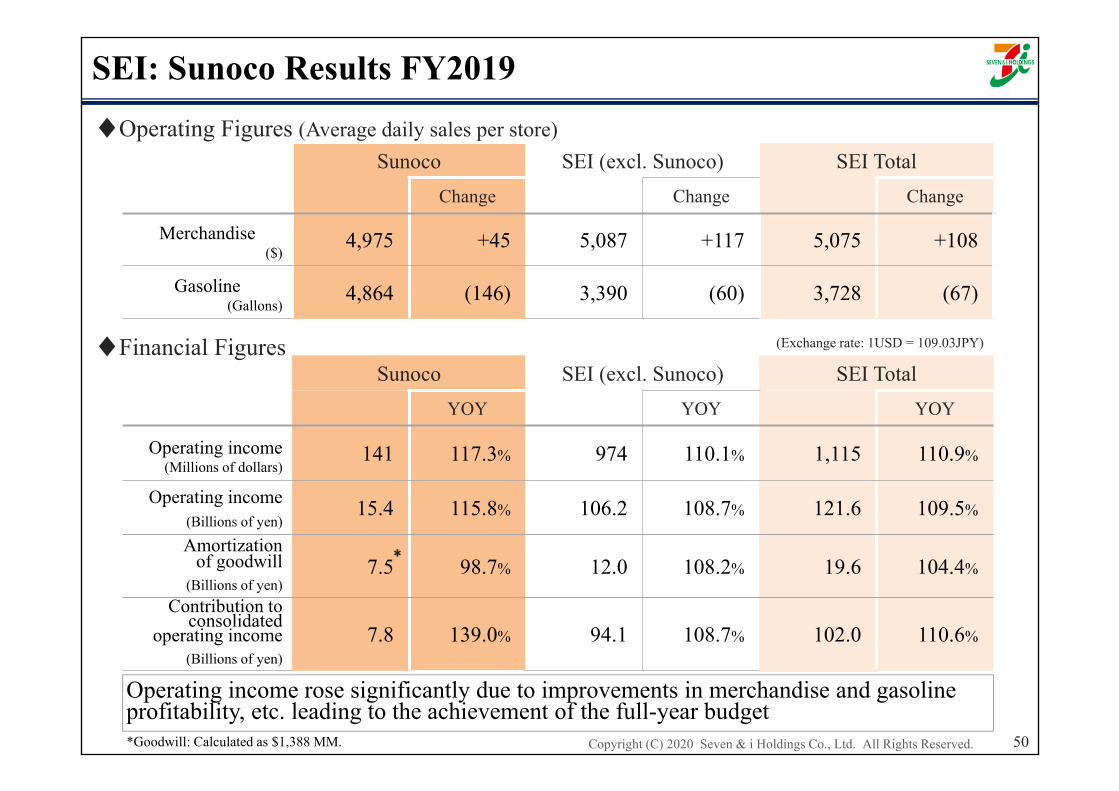
Sunoco SEI (excl. Sunoco) SEI TotalChange Change Change
Merchandise($)
4,975 +45 5,087 +117 5,075 +108
Gasoline(Gallons)
4,864 (146) 3,390 (60) 3,728 (67)
(Exchange rate: 1USD = 109.03JPY)
Sunoco SEI (excl. Sunoco) SEI TotalYOY YOY YOY
Operating income(Millions of dollars)
141 117.3% 974 110.1% 1,115 110.9%
Operating income(Billions of yen)
15.4 115.8% 106.2 108.7% 121.6 109.5%
Amortizationof goodwill
(Billions of yen)7.5 98.7% 12.0 108.2% 19.6 104.4%
Contribution to consolidated
operating income(Billions of yen)
7.8 139.0% 94.1 108.7% 102.0 110.6%
*
SEI: Sunoco Results FY2019
♦Operating Figures (Average daily sales per store)
♦Financial Figures
*Goodwill: Calculated as $1,388 MM. 50
Operating income rose significantly due to improvements in merchandise and gasoline profitability, etc. leading to the achievement of the full-year budget
Copyright (C) 2020 Seven & i Holdings Co., Ltd. All Rights Reserved.
This document contains certain statements based on the Company’s current plans, estimates,strategies, and beliefs; all statements that are not historical fact are forward-lookingstatements. These statements represent the judgments and hypotheses of the Company’smanagement based on currently available information. It is possible that the Company’sfuture performance will differ from the contents of these forward-looking statements.Accordingly, there is no assurance that the forward-looking statements in this document willprove to be accurate.


![[Viol_o Dueto] Ferdinando Carulli - 24 Duos Progressivos](https://img.pdfslide.net/doc/110x75/55cf982c550346d033960967/violo-dueto-ferdinando-carulli-24-duos-progressivos.jpg)