Embed Size (px)
Citation preview

Financial Results Press Conference 2017Financial Results Press Conference 2017
S fStrategy and Business Performance Frankfurt, 26 April 2017

Company Representatives and TopicsSIMONA Management BoardSIMONA Management Board
Wolfgang Moyses, Chairman of the
Press Officers: Eric SchönelChairman of the
Management BoardCEO
Eric SchönelHead of Marketing & Communication
Ingrid Hahn
Dirk Möller, Deputy Chairman of the
Ingrid HahnPersonal Assistant to the CEO
Sarah RohrChairman of the Management BoardCOO
Marketing & Communication
Fredy Hiltmann, Member of the Management BoardCFO
2
Agenda
1. Business Performance 2016 Wolfgang Moyses2 A l Fi i l St t t 2016 F d Hilt2. Annual Financial Statements 2016 Fredy Hiltmann3. 1st Quarter 2017 Fredy Hiltmann4. Strategic Development and
Fields of Activity Wolfgang Moyses5. Outlook 2017 Wolfgang Moyses6. Questions and Answers
3
The 2016 Financial Year
"Revenue target met – Earnings target exceeded"
4

Business Performance 2016Global business climateGlobal business climate
USAEconomic growth fell short of expectations (low
Germany
Economic growth fell short of expectations (lowenergy prices, anaemic investment spending on plant/equipment, strong dollar)
GermanySolid growth, higher capital expenditure on plant/equipment, strong construction industry, hardly any impetus from chemical and mechanical engineering industrymechanical engineering industry
Western Europe/Eastern EuropeStable development, Spain records stronggrowth, Italy/France treading water
Asia and PacificGrowth in China in line with governmentGrowth in China in line with government targets, structural change towards services in full swing, property market remains a considerable risk, emerging Asian markets with 4 per cent growth on average
5
4 per cent growth on average
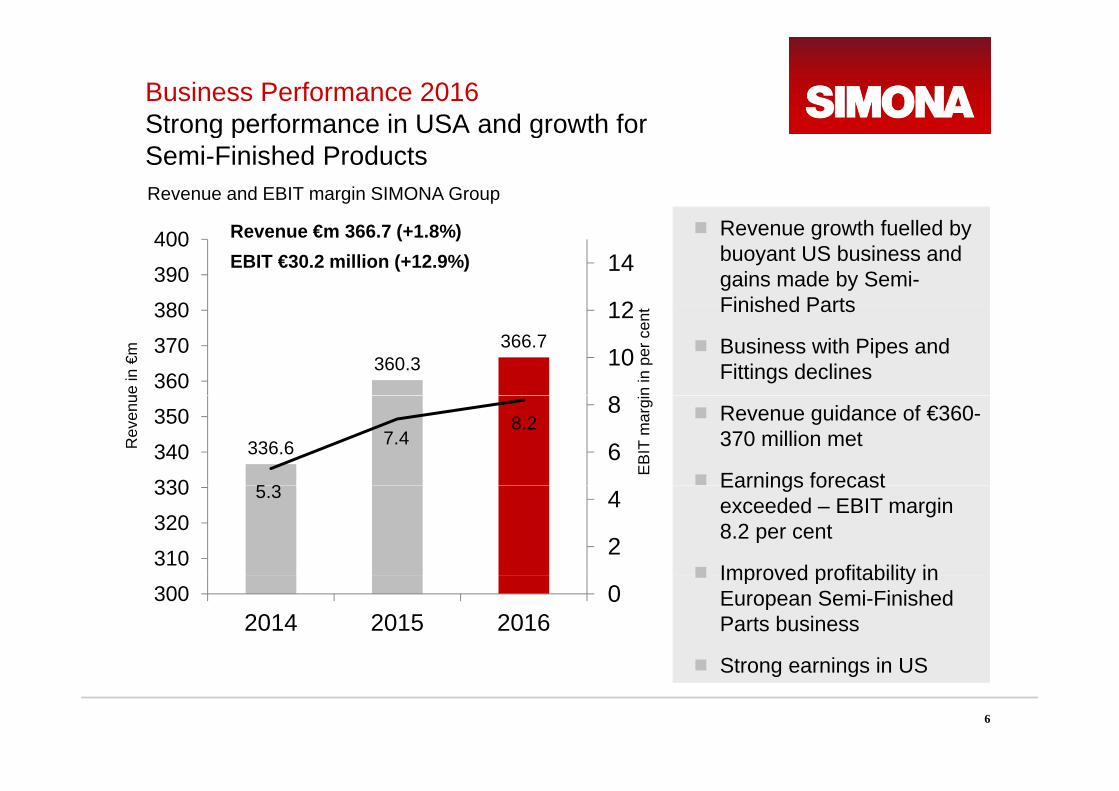
Business Performance 2016Strong performance in USA and growth forStrong performance in USA and growth forSemi-Finished ProductsRevenue and EBIT margin SIMONA Group
12
14
380390400
EBIT €30.2 million (+12.9%) Revenue growth fuelled by
buoyant US business and gains made by Semi-Finished Parts
Revenue €m 366.7 (+1.8%)
360.3366.7
8
10
12
360370
380 Finished Parts
Business with Pipes and Fittings declines
ue in
€m
n in
per
cen
t
336.6
5 3
7.48.2
6
8
330340
350 Revenue guidance of €360-370 million met
Earnings forecast
Rev
enu
EB
IT m
argi
5.3
2
4
310
320330 Earnings forecast
exceeded – EBIT margin 8.2 per cent
Improved profitability in0300
2014 2015 2016
Improved profitability in European Semi-Finished Parts business
Strong earnings in US
6
Strong earnings in US

Business Performance 2016Gains in United States – Europe stable – AsiaGains in United States – Europe stable – Asia makes up ground
Europe €257 million 2%Revenue by region (in per cent)
Europe €257 million -2%Pipes and Fittings business weakPositive performance for Semi-Finished Parts,
particularly in Spain and ItalyModerate growth in Eastern Europe
18 23 25
5 5 5
GermanyGood performance for Semi-Finished ProductsDecline due to weak Pipes and Fittings business77 72 Decline due to weak Pipes and Fittings business
Americas €90 million +10%
77 72 70
Solid growth for Industrial ProductsDynamic growth in Aviation businessRevenue and earnings targets exceeded2014 2015 2016
Europe Americas Asia and Pacific
Asia and Pacific €19 million +12%Very weak first halfSolid growth for the year after resurgenceSuccessful start for Indian subsidiary
Allocated acc. to place of registered office of revenue-generating business unit
7
Successful start for Indian subsidiary

Business Performance 2016Growth for Semi-Finished ProductsGrowth for Semi Finished Products– Decline for Pipes and Fittings
+5%
Semi-Finished and Finished Products
-8%
Pipes and Fittings
+5%
€290 million
-8%
€77 million
Revenue share 79%
Revenue share 21%
Absence of project business in Europe (brown coal)
Business with industrial products and drainage systems up slightly
Growth in Germany despite sluggish performance of mechanical and chemical engineering industry
Business with building products and semi- drainage systems up slightlyBusiness with building products and semi-finished parts for aircraft remains dynamic
New portfolio of high-performance plastics
8

Annual Financial Statements 2016
Revenue growth of close to 2% Revenue growth of close to 2% Improvement in EBIT margin from 7.4% to 8.2%
Significant earnings contribution from the US Foreign exchange gains, but much less pronounced than a year ago Income from sale of operating facility in France
S b t ti l h Substantial cash resources Solid balance sheet and financing
9

Annual Financial Statements 2016EarningsEarnings
in €m 2016 2015 Changein €m 2016 2015 Change
Revenue 366 7 100% 360 3 100% 6 3 2%Revenue 366.7 100% 360.3 100% 6.3 2%Other income 8.6 2.3% 11.1 3.1% -2.5 -23%Changes in inventories -0.1 0.0% 1.7 0.5% -1.9 -108%Cost of materials 196.7 53.7% 202.2 56.1% -5.5 -3%Staff costs 72.4 19.7% 70.8 19.6% 1.6 2%Depreciation/amortisation 13 7 3 7% 13 4 3 7% 0 3 2%Depreciation/amortisation 13.7 3.7% 13.4 3.7% 0.3 2%Other expenses 62.2 17.0% 60.0 16.7% 2.1 4%
EBIT 30.2 8.2% 26.7 7.4% 3.4 13%Net finance cost -2.2 -0.5% -2.0 -0.5% -0.2 5%Income taxes 8.6 2.3% 7.5 2.1% 1.1 15%
Profit for the period 19 5 5 3% 17 3 4 8% 2 2 13%
10
Profit for the period 19.5 5.3% 17.3 4.8% 2.2 13%

Annual Financial Statements 2016Higher revenue in US and improved marginsHigher revenue in US and improved marginsproduce growth in EBIT
in €m Revenue/marginCurrency
‐3.3Other costs
10.8 ‐4.030.2
26.7
11
EBIT 2015 EBIT 2016

Annual Financial Statements 2016Balance sheet total up due to increase in propertyBalance sheet total up due to increase in property, plant and equipment as well as cash
ASSETS in €m 31/12/2016 31/12/2015
Intangible assets 33.9 9% 33.9 11%
Property plant and equipment 116 7 32% 113 8 36%Property, plant and equipment 116.7 32% 113.8 36%
Other non‐current assets 8.2 3% 5.7 1%
Non‐current assets 158.8 44% 153.4 48%
Inventories 69.2 19% 66.9 21%
Trade receivables 52.2 14% 51.1 16%
Other current assets 4.2 1% 10.4 4%
Cash and cash equivalents 74.8 21% 31.9 10%
A h ld f l 3 8 1% 4 7 1%Assets held for sale 3.8 1% 4.7 1%
Current assets 204.2 56% 165.0 52%
Total assets 363.0 100% 318.4 100%
12
Total assets 363.0 100% 318.4 100%

Annual Financial Statements 2016Higher equity increase in pension provisions andHigher equity, increase in pension provisions and financial liabilities
EQUITY AND LIABILITIES in €m 31/12/2016 31/12/2015EQUITY AND LIABILITIES in €m 31/12/2016 31/12/2015Equity 192.0 53% 182.6 57%Financial liabilities 22.1 6% 3.9 1%Provisions for pensions 101.6 28% 89.7 28%Other provisions 2.7 1% 2.7 1%Other liabilities 3.2 1% 2.4 1%Non‐current liabilities 129.6 36% 98.7 31%Financial liabilities 3.4 1% 2.9 1%Provisions for pensions 1 7 0% 1 7 1%Provisions for pensions 1.7 0% 1.7 1%Other provisions 1.6 0% 2.0 1%Trade payables 15.2 4% 11.7 4%Oth li biliti 19 5 5% 18 8 6%Other liabilities 19.5 5% 18.8 6%Current liabilities 41.4 11% 37.1 12%Total assets 363.0 100% 318.4 100%
13
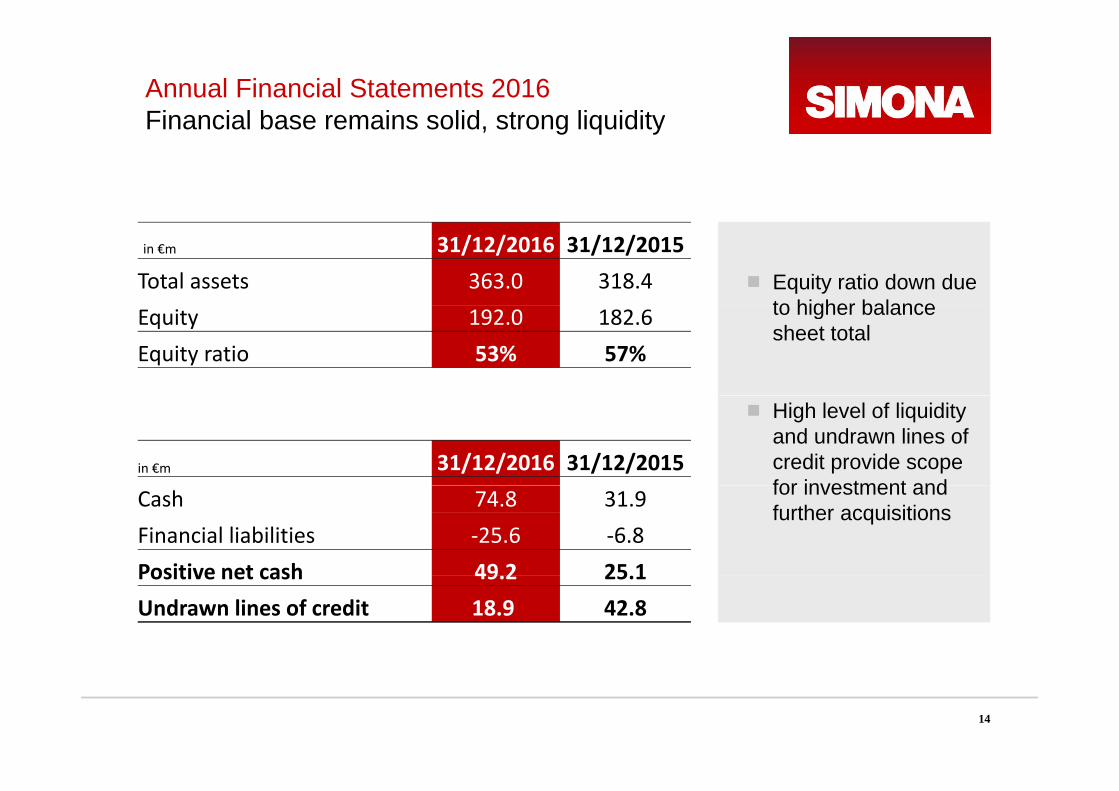
Annual Financial Statements 2016 Financial base remains solid strong liquidityFinancial base remains solid, strong liquidity
Equity ratio down due to higher balance
in €m 31/12/2016 31/12/2015Total assets 363.0 318.4
to higher balance sheet total
Equity 192.0 182.6Equity ratio 53% 57%
High level of liquidity and undrawn lines of credit provide scope for investment and
in €m 31/12/2016 31/12/2015for investment and further acquisitionsCash 74.8 31.9
Financial liabilities ‐25.6 ‐6.8Positive net cash 49 2 25 1Positive net cash 49.2 25.1Undrawn lines of credit 18.9 42.8
14

Annual Financial Statements 2016Higher cash flow from operating activitiesHigher cash flow from operating activities
Group cash flows 2016 2015
in €m
Cash and cash equivalents 1 January 31.9 21.3
Cash and cash equivalents 31 December 74.8 31.9
Change in cash and cash equivalents 42.9 10.6Change in cash and cash equivalents 42.9 10.6
Net cash from operating activities 42.2 37.3Net cash from operating activities 42.2 37.3
Net cash used in investing activities ‐11.7 ‐22.1
Net cash from/(used in) financing activities 12.4 ‐5.7Net cash from/(used in) financing activities 12.4 5.7
Influence of forex movements on liquidity ‐0.1 1.1
Change in cash and cash equivalents 42 9 10 6
15
Change in cash and cash equivalents 42.9 10.6
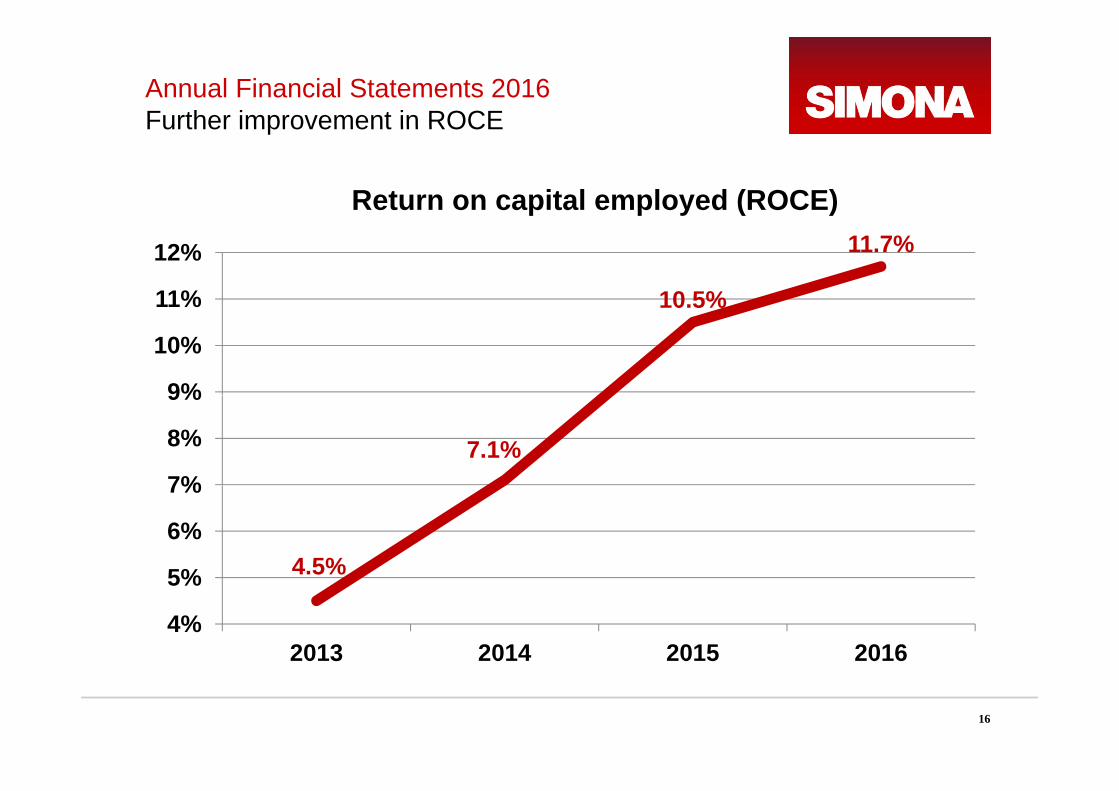
Annual Financial Statements 2016Further improvement in ROCEFurther improvement in ROCE
Return on capital employed (ROCE)
10.5%
11.7%
11%
12%
10.5%
9%
10%
11%
7.1%7%
8%
9%
4.5%5%
6%
7%
4%
5%
2013 2014 2015 2016
16

Annual Financial Statement 2016SIMONA stockSIMONA stock
50014
Earnings per share €32.48(prev. year: €28.78)
400
45012
Dividend proposal€12.00 per share = €7.2 millioncorresponds to 48% of SIMONA AG's annual profit
300
350
8
10
31 D
ec. I
n €
r sha
rein
€
AG s annual profit
Dividend yield 2.7%(prev. year: 2.7%)
Sh i i J 2017150
200
250
6
Shar
e pr
ice
3
Div
iden
d pe
r
Share price in January 2017 above €500 for the first time
50
100
150
2
4
0
50
0
1992
1993
1994
1995
1996
1997
1998
1999
2000
2001
2002
2003
2004
2005
2006
2007
2008
2009
2010
2011
2012
2013
2014
2015
2016
17
Dividend Share price
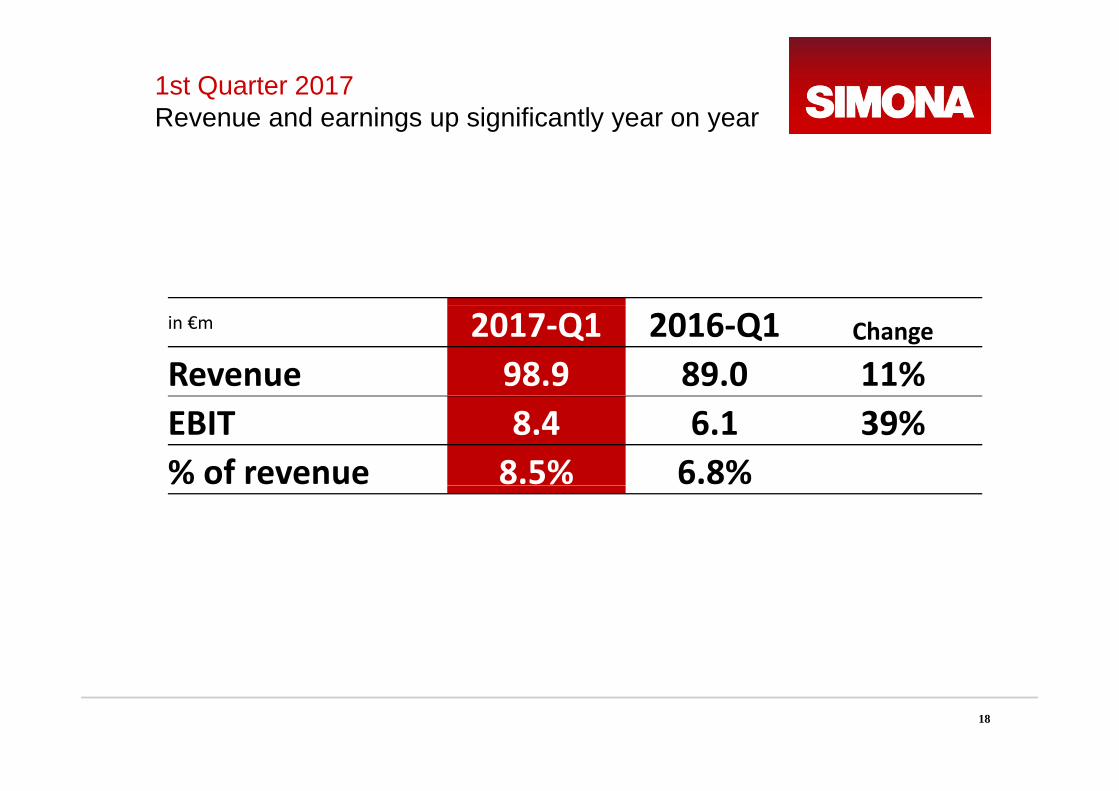
1st Quarter 2017 Revenue and earnings up significantly year on yearRevenue and earnings up significantly year on year
in €m 2017‐Q1 2016‐Q1 Change
Revenue 98.9 89.0 11%EBIT 8.4 6.1 39%% of revenue 8.5% 6.8%
18
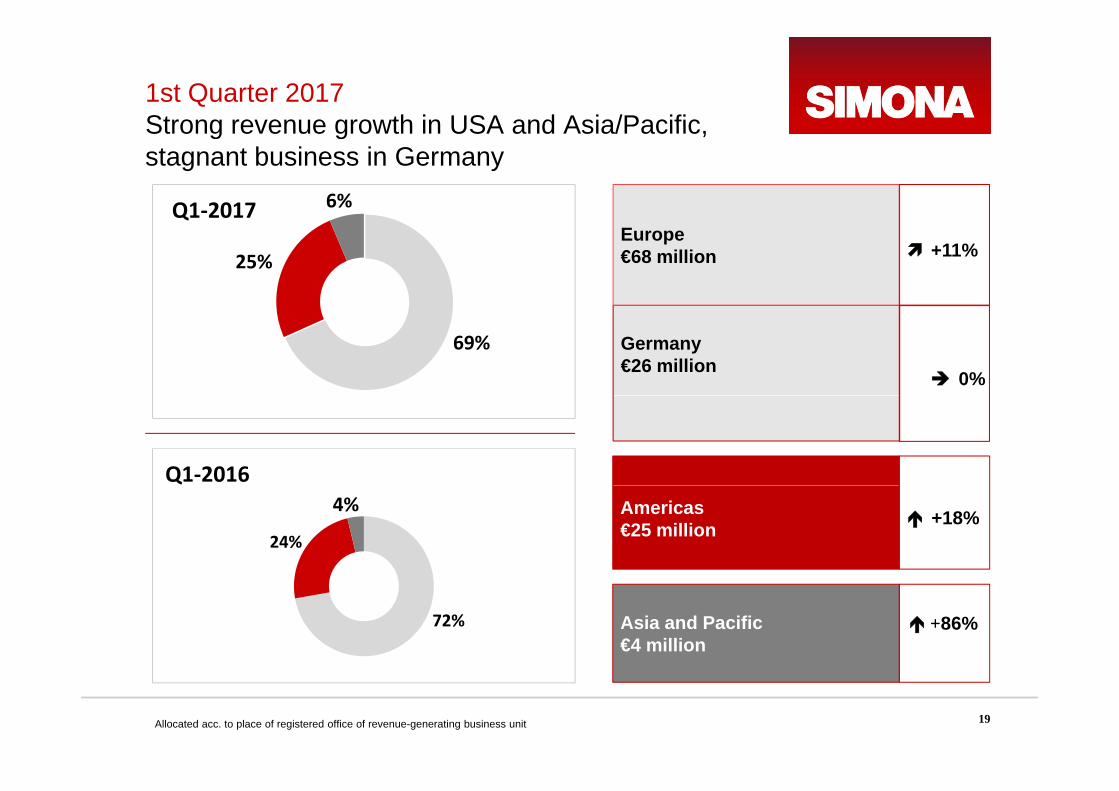
1st Quarter 2017Strong revenue growth in USA and Asia/PacificStrong revenue growth in USA and Asia/Pacific,stagnant business in Germany
6%Q1‐2017Europe€68 million +11%25%
Q1 2017
Germany€26 million
0%
69%
Q1‐2016Americas€25 million +18%
24%
4%
Asia and Pacific€4 million
+86%72%
19Allocated acc. to place of registered office of revenue-generating business unit

1st Quarter 2017Improved EBIT driven by revenue growth and fewerImproved EBIT driven by revenue growth and fewer negative currency effects
in €m 1.4 ‐4.04.9 Currency
Other costsRevenue/marginmargin
8.4
6.1
EBIT Q1‐2016 EBIT Q1‐2017
20
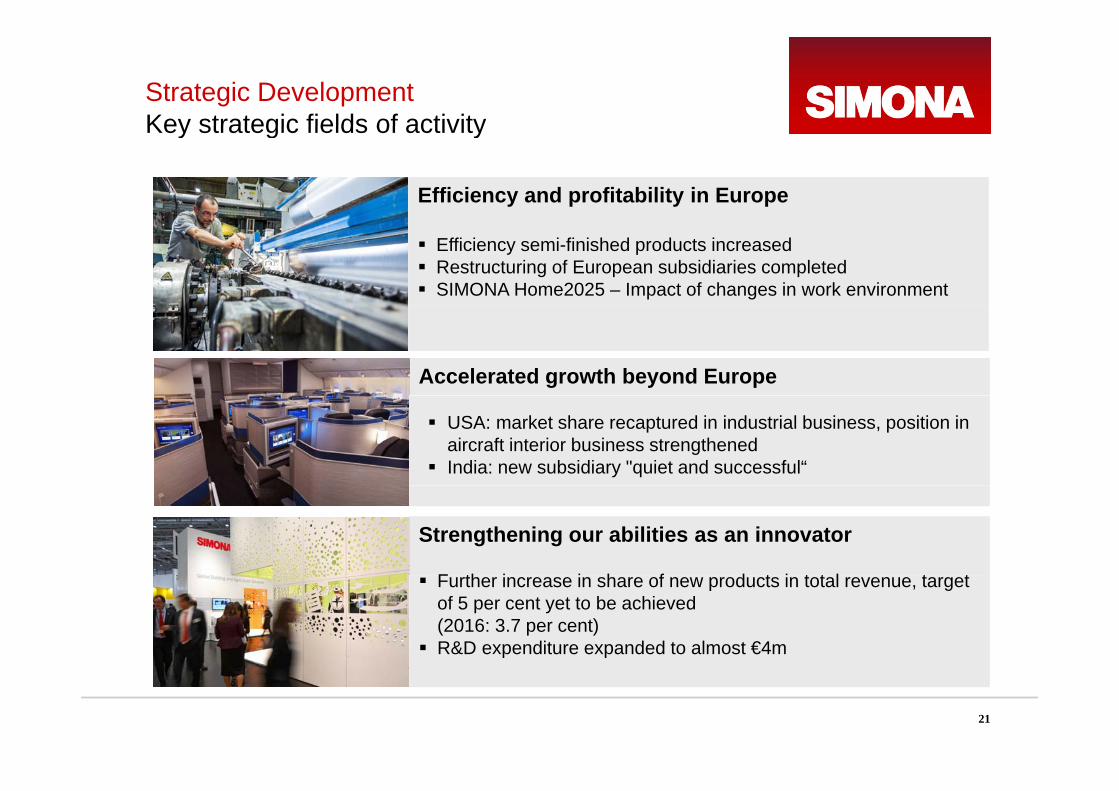
Strategic DevelopmentKey strategic fields of activity
Efficiency and profitability in Europe
Key strategic fields of activity
Efficiency semi-finished products increased Restructuring of European subsidiaries completed SIMONA Home2025 – Impact of changes in work environment
Accelerated growth beyond Europe
USA: market share recaptured in industrial business, position in aircraft interior business strengthened
India: new subsidiary "quiet and successful“
Strengthening our abilities as an innovator
F th i i h f d t i t t l t t Further increase in share of new products in total revenue, target of 5 per cent yet to be achieved (2016: 3.7 per cent)
R&D expenditure expanded to almost €4m
21

Strategic Development What are our objectives for 2017?What are our objectives for 2017?
EuropeEurope Semi-finished Products: further improvement of profitability Growth pipes and fittings
Asia and Pacific “how to make money“ Sustained development of organization Sustained development of organization
USAUSA Access to global mass transport Invest in operational excellence Archbald
22

Strategic DevelopmentSIMONA 2025
Strategic milestones
SIMONA 2025
Strategic milestones
Business model Industry 4.0 Digitalisation Digitalisation Commodities vs. specialties
Leading global plastics processor
M&A in 3 hemispheres(Europe, USA, Asia)
23
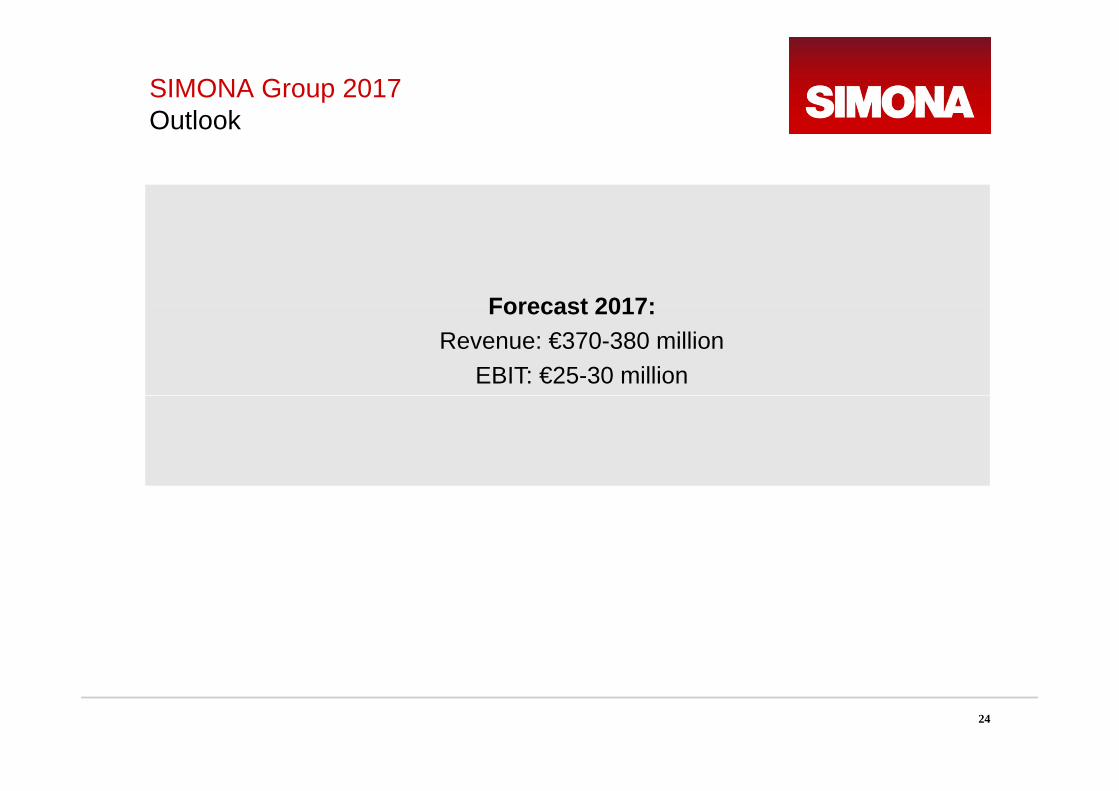
SIMONA Group 2017 OutlookOutlook
Forecast 2017:Forecast 2017:Revenue: €370-380 million
EBIT: €25-30 million
24
![Financial Results, Results Press Release, Results Presentation & Limited Review Report June 30, 2015 [Company Update]](https://img.pdfslide.net/doc/110x75/577cb2d71a28aba7118c2cab/financial-results-results-press-release-results-presentation-limited-review.jpg)


![Standalone Financial Results, Results Press Release for March 31, 2016 [Result]](https://img.pdfslide.net/doc/110x75/577c7c241a28abe0549976f0/standalone-financial-results-results-press-release-for-march-31-2016-result.jpg)

![Financial Results & Results Press Release for March 31, 2015 (Audited) [Result]](https://img.pdfslide.net/doc/110x75/577cb2c51a28aba7118c2938/financial-results-results-press-release-for-march-31-2015-audited-result.jpg)

![Financial Results & Results Press Release for June 30, 2015 (Standalone) [Result]](https://img.pdfslide.net/doc/110x75/577cb2a31a28aba7118c1f0c/financial-results-results-press-release-for-june-30-2015-standalone-result.jpg)

![Results Press Release & Earnings Call [Company Update]](https://img.pdfslide.net/doc/110x75/577cb4a51a28aba7118c983a/results-press-release-earnings-call-company-update.jpg)

![Financial Results & Results Press Release for Dec 31, 2015 [Result]](https://img.pdfslide.net/doc/110x75/577ca5401a28abea748b70f9/financial-results-results-press-release-for-dec-31-2015-result.jpg)

![Results Press Release & Presentation [Company Update]](https://img.pdfslide.net/doc/110x75/577ca5981a28abea748b9926/results-press-release-presentation-company-update.jpg)


![Results Press Release [Company Update]](https://img.pdfslide.net/doc/110x75/5695cedc1a28ab9b028b8547/results-press-release-company-update-56a6ce492878c.jpg)