Embed Size (px)
Citation preview

FINANCIAL SECTION
Boise School Districts financials are presented using a pyramid approach that begins at a broad level and describes more detail as each level of the pyramid is addressed. This pyramid begins with a summary of the total budget then summarizes operating fund data, moving into individual funds, and includes program funds detailing trends and personnel allotment.
Each level includes revenues and sources, expenditures, and fund balances and details shifts and changes from the previous year. The section also details if or how debt obligations influence the budget.
Financial Section Contents Governmental Funds .................................................................................................................................. 41 Special Revenue Funds .............................................................................................................................. 41 Debt Service Fund ...................................................................................................................................... 42 Capital Projects Fund ................................................................................................................................. 42 Fund Details and Illustrations ............................................................................................................... 43-50
Capital High School
Revenue.......................................................................................................................................................44 Expenditures................................................................................................................................................52 All Other Funds...........................................................................................................................................76

BSD - 2019-2020 Annual Budget
Financial Section Page 41
DESCRIPTION OF GOVERNMENTAL FUNDS
The District uses the following funds for fiscal year 2019-20:
GOVERNMENTAL FUNDS 100 General Fund – Accounts for revenues used for financing the current, ordinary, and recurring operations of the
District. This fund accounts for activities that are not required to be in a different fund.
SPECIAL REVENUE FUNDS 220 Federal Forest Fund – Revenues received from the federal government for the sale of timber on federal forest
lands located within the District boundaries.
231 Just for Kids Fund – Revenues are generated for a before and after school care program operated at thirteen sites throughout the District.
235 2020 Strategic Plan Fund – The Board of Trustees established a fund to use for implementation of Plan 2020.
236 Medicaid Fund – Revenue collected as result of eligible Medicaid services and billings. Expenditures related to Special Education Services.
238 Private Grant Fund – These are revenues from local companies and organizations used for a specific purpose (i.e. City of Boise, Benchmark and Community Foundation).
241 Driver Education Fund – Fund used to account for revenues and expenditures for District sponsored driver’s education programs throughout the year.
244 State Miscellaneous Fund – Fund used to account for revenues received for specific purposes mandated by the State. The Limited English Proficient and Gifted and Talented programs are accounted in this fund.
245 Technology – Revenues received from the State of Idaho used to purchase equipment related to classroom technology and to train teachers in the use of technology.
246 Tobacco Tax - Revenues received from the State of Idaho used to hire counselors and purchase materials to provide counseling and training related to the prevention of tobacco use, this fund also provides a resource for safety and security.
251 Title I - Disadvantaged – Revenues are used to hire staff and purchase supplies to support the reading and math program for at risk students.
255 Title I – Neglected and Delinquent – Revenues are used to purchase materials and for staff to assist with students in the Ada County Juvenile Detention Center and Victory Academy.
257 Title VI-B Special Education – Revenues used for staff, materials, and equipment and professional services to supplement the special education program in the District.
258 Title VI-B Preschool – Revenues are used for staff, materials, equipment and professional service to supplement the preschool (3 to 5 years old) special education program in the District.
260 The Title IV-A includes a grant that is part of the National Every Student Succeeds Act (ESSA). Part A, Student Support and Academic Enrichments Grants authorizes three activity areas. The District focus is on the area of supporting safe and health students.
263 Carl Perkins Vocational and Applied Technology Education – Revenues are used to purchase materials and equipment for professional technical programs for students in special populations.
264 Title III Language Instruction for Limited English Proficient – Revenue used to improve student achievement.
272 Title II Improving Teacher Quality – Revenues are used for in-service, teacher recruitment, and classroom management processes.
287 Vocational Rehabilitation Grant – Revenues generated by the State Division of Vocational Rehabilitation for payment of wages to students working in the community.

BSD - 2019-2020 Annual Budget
Financial Section Page 42
289 Miscellaneous Federal Programs – This fund has numerous federal programs including: Refugee, Homeless Education Grant, and the Arts Grant.
290 School Nutrition Program – Revenues used for the personnel, activities, and supplies for providing breakfast and lunch for students and staff.
DEBT SERVICE FUND 310 Bond Interest and Redemption Fund – Local property tax levy revenues are used to redeem bonds and for bond
interest expense.
CAPITAL PROJECTS FUND 410 Capital Construction Fund – In March 2017, voters approved the issuance of a 172.5-million-dollar bond to provide
facility improvements for All 48 schools, plus major building projects for 22 schools. The bond will put more than $155 million into 22 major capital projects, including building six new schools on their current sites, a new school in the Harris Ranch area, as well as expansion of the District's Professional-Technical Education center to offer Electrical, Plumbing and Heating-Air Conditioning job training classes.
425 School Plant Facilities Fund – The 1988 supplemental tax levy was passed in the amount of 3 million dollars to provide funds for site acquisitions, buildings, building renovations including all heating, lighting, ventilation and sanitation facilities and appliances necessary for maintaining and operating the buildings of the District. The taxes received in the General Fund are transferred to the Plant Facilities Fund by action of the Board authorizing the transfer each year. In addition to property tax revenue, Idaho lottery proceeds are also deposited in this plant facility fund.
Capital High School Graduation 2018

BSD - 2019-2020 Annual Budget
Financial Section Page 43
FUND DETAILS AND ILLUSTRATIONS General Fund Expenditures per Average Daily Attendance (ADA) Boise School District per ADA for general fund expenditures for school year 2018-19 spent more dollars per student than the State of Idaho. Below is a table and graph that compares the amount of dollars spent per student for BSD, state and nationally.
Year
District Ranking in State per pupil expenditures
General Fund Expenditures Per ADA
State Boise Nation
2011-12 58 5,933 7,422 11,632 2012-13 59 6,157 7,759 11,503 2013-14 60 6,136 7,781 11,330 2014-15 58 6,302 8,046 11,630 2015-16 58 6,324 8,193 11,930
2016-17 60 6,809 8,550 12,410
2017-18 64 7,104 8,948 12,570 2018-19* NA $7,350 $9,200 $13,500
*Estimate
Financial Section Page 44
RevenuesGeneral Fund
2019-20All Other Funds
2019-20Total
2019-20Total
2018-19Percent of
ChangeLocal Revenue $99,057,027 24,994,800 124,051,827 $115,725,982 7.19%State Revenue 145,174,334 5,783,431 150,957,765 148,386,180 1.73%Federal Revenue 62,912 20,172,546 20,235,458 21,628,791 -6.44%Other Sources 296,093 79,857,000 80,153,093 7,666,838 945.45%Use of Fund Balance 2,182,566 1,092,500 3,275,066 40,198,511 -91.85%
Total Revenues $246,772,932 $131,900,277 $378,673,209 $333,606,302 13.51%
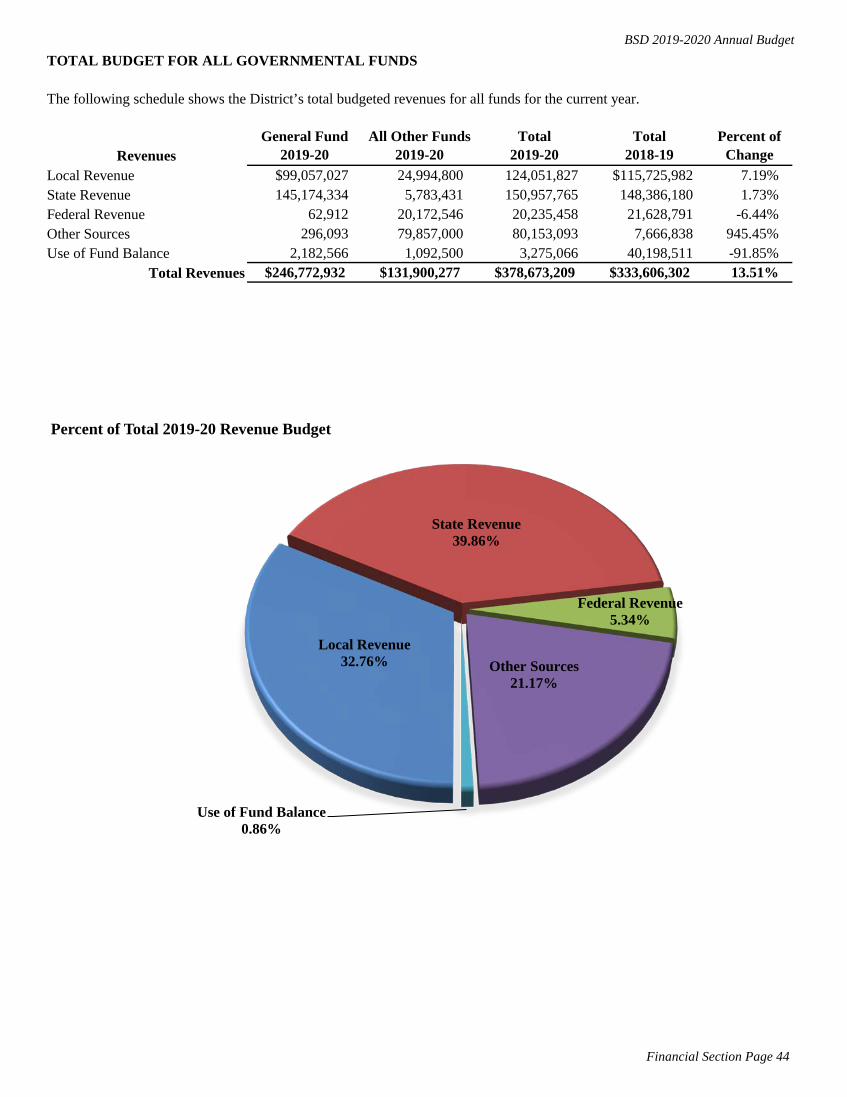
BSD 2019-2020 Annual BudgetTOTAL BUDGET FOR ALL GOVERNMENTAL FUNDS
The following schedule shows the District’s total budgeted revenues for all funds for the current year.
Local Revenue32.76%
State Revenue39.86%
Federal Revenue5.34%
Other Sources21.17%
Use of Fund Balance0.86%
Percent of Total 2019-20 Revenue Budget

BSD 2019-2020 Annual Budget
Financial Section Page 45
TOTAL BUDGET FOR ALL GOVERNMENTAL FUNDS
ExpendituresGeneral Fund
2019-20All Other Funds
2019-20Total
2019-20Total
2018-19Percent of
ChangeSalaries $153,902,221 $14,285,687 $168,187,908 $162,144,590 3.73%Benefits 54,213,902 5,533,582 59,747,484 57,523,655 3.87%Purchased Services 18,972,506 5,967,911 24,940,417 24,833,286 0.43%Supplies & Materials 10,834,223 7,038,837 17,873,060 18,524,667 -3.52%Capital Outlay 818,080 34,941,922 35,760,002 41,179,400 -13.16%Debt Retirement 0 16,388,050 16,388,050 13,261,550 23.58%Insurance & Judgments 675,000 4,000 679,000 677,300 0.25%Transfers 7,357,000 296,093 7,653,093 7,666,838 -0.18%Unappropriated Fund Balance 0 47,444,195 47,444,195 7,795,016 508.65%
Total Expenditures $246,772,932 $131,900,277 $378,673,209 $333,606,302 13.51%
The following schedule shows the District’s total budgeted expenditures for all funds for the current year.
Salaries44.42%
Benefits15.78%
Purchased Services6.59%
Supplies & Materials4.72%
Capital Outlay9.44%
Debt Retirement4.33%
Insurance & Judgments0.18%
Transfers2.02%
Unappropriated Fund Balance
12.53%
Percent of Total 2019-20 Expenditure Budget

BSD 2019-2020 Annual Budget
Financial Section Page 46
TOTAL BUDGET FOR ALL GOVERNMENTAL FUNDS
RevenuesLocal Revenue $124,051,827 $115,725,982 $102,513,847 $100,481,795 $94,690,301State Revenue 150,957,765 148,386,180 144,839,459 137,571,756 129,355,477Federal Revenue 20,235,458 21,628,791 20,678,010 20,827,271 20,617,533Other Sources 80,153,093 7,666,838 0 15,878 206,625Use of Fund Balance 3,275,066 40,198,511 0 0 0
Total Revenues $378,673,209 $333,606,302 $268,031,316 $258,896,700 $244,869,936
ExpendituresSalaries $168,187,908 $162,144,590 $155,480,680 $148,930,468 $141,573,804Benefits 59,747,484 57,523,655 51,713,156 51,785,565 50,227,336Purchased Services 24,940,417 24,833,286 18,801,308 19,952,049 19,619,908Supplies & Materials 17,873,060 18,524,667 17,062,400 15,679,332 14,284,419Capital Outlay 35,760,002 41,179,400 49,753,913 11,185,193 10,473,663Debt Retirement 16,388,050 13,261,550 13,890,869 11,530,479 11,095,663Insurance & Judgments 679,000 677,300 544,857 539,456 499,583Transfers 7,653,093 7,666,838 0 0 0Unappropriated Fund Balance 47,444,195 7,795,016 0 0 0
Total Expenditures $378,673,209 $333,606,302 $307,247,183 $259,602,542 $247,774,376
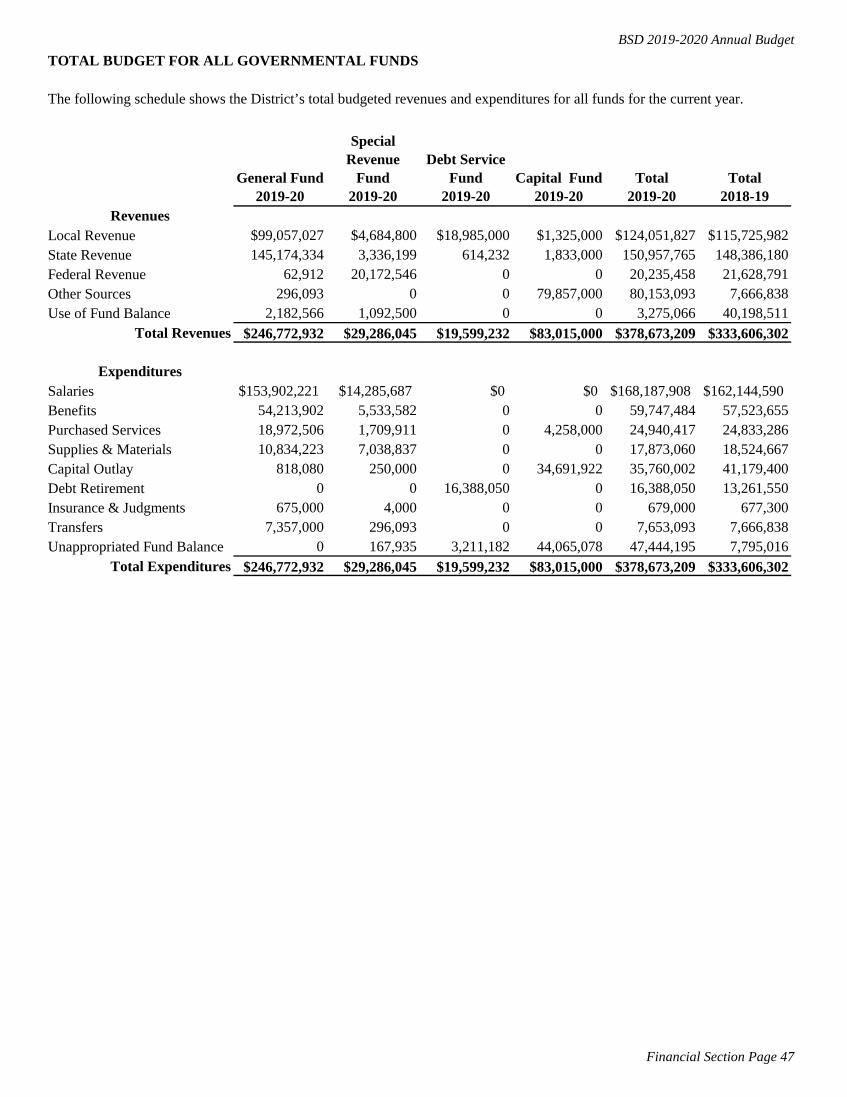
The following schedule shows the District’s total budgeted revenues and expenditures for all funds for the proposed budget,
Total Budgeted2018-19
Total Actual2017-18
Total Actual2016-17
Total Budgeted2019-20
Total Actual2015-16
BSD 2019-2020 Annual Budget
Financial Section Page 47
TOTAL BUDGET FOR ALL GOVERNMENTAL FUNDS
RevenuesLocal Revenue $99,057,027 $4,684,800 $18,985,000 $1,325,000 $124,051,827 $115,725,982State Revenue 145,174,334 3,336,199 614,232 1,833,000 150,957,765 148,386,180Federal Revenue 62,912 20,172,546 0 0 20,235,458 21,628,791Other Sources 296,093 0 0 79,857,000 80,153,093 7,666,838Use of Fund Balance 2,182,566 1,092,500 0 0 3,275,066 40,198,511
Total Revenues $246,772,932 $29,286,045 $19,599,232 $83,015,000 $378,673,209 $333,606,302
ExpendituresSalaries $153,902,221 $14,285,687 $0 $0 $168,187,908 $162,144,590Benefits 54,213,902 5,533,582 0 0 59,747,484 57,523,655Purchased Services 18,972,506 1,709,911 0 4,258,000 24,940,417 24,833,286Supplies & Materials 10,834,223 7,038,837 0 0 17,873,060 18,524,667Capital Outlay 818,080 250,000 0 34,691,922 35,760,002 41,179,400Debt Retirement 0 0 16,388,050 0 16,388,050 13,261,550Insurance & Judgments 675,000 4,000 0 0 679,000 677,300Transfers 7,357,000 296,093 0 0 7,653,093 7,666,838Unappropriated Fund Balance 0 167,935 3,211,182 44,065,078 47,444,195 7,795,016
Total Expenditures $246,772,932 $29,286,045 $19,599,232 $83,015,000 $378,673,209 $333,606,302
The following schedule shows the District’s total budgeted revenues and expenditures for all funds for the current year.
General Fund2019-20
Special Revenue
Fund2019-20
Debt Service Fund
2019-20Capital Fund
2019-20Total
2019-20Total
2018-19

BSD 2019-2020 Annual Budget
Financial Section Page 48
GENERAL FUND REVENUE
Revenues
Current YearAdopted Budget
2018-19Proposed Budget
2019-20Amount of
ChangePercent of
ChangeLocal Revenue $92,825,646 $99,057,027 $6,231,381 6.71%State Revenue 142,470,126 145,174,334 $2,704,208 1.90%Federal Revenue 69,194 62,912 -$6,282 -9.08%Other Sources 309,838 296,093 -$13,745 -4.44%Use of Fund Balance 2,038,218 2,182,566 $144,348 7.08%
Total Revenues $237,713,022 $246,772,932 $9,059,910 3.81%
The following schedule shows the District’s general fund budgeted revenues for the current year.
Local Revenue40.14%
State Revenue58.83%
Federal Revenue0.03%
Other Sources0.12%
Use of Fund Balance0.88%
Percent of Total 2019-20 General Fund Revenue Budget

BSD 2019-2020 Annual Budget
Financial Section Page 49
GENERAL FUND REVENUE
LOCAL SOURCES
Taxes-Supplemental
Taxes-Tort Levy
Penalty on Delinquent Taxes
Earnings on Investments
Rentals
Community Activities
Other Local
Tuition From Individuals
2018-19 2018-19 2019-20 Difference % Increase2015-16 2016-17 2017-18 Adopted Projected Adopted 2018-19 to 2018-19 to
LOCAL SOURCES Actual Actual Actual Budget Budget Budget 2019-20 2019-20Property Tax-General $59,429,463 $63,294,747 $68,217,250 $79,425,529 $78,930,520 $84,635,481 $5,209,952 6.56%Taxes-Supplemental 14,458,000 14,458,000 10,708,000 10,708,000 10,708,000 10,708,000 $0 0.00%Taxes-Tort Levy 189,983 131,606 212,465 321,168 321,168 350,000 $28,832 8.98%Penalty On Delinquent Taxes 212,612 209,758 162,064 165,000 165,000 135,000 -$30,000 -18.18%Earnings On Investments 195,192 382,768 790,129 611,000 1,200,000 1,210,000 $599,000 98.04%Rentals 268,989 233,839 284,539 317,649 317,649 325,000 $7,351 2.31%Community Activities 193,187 150,050 184,051 120,000 120,000 130,000 $10,000 8.33%Other Local 490,643 526,289 532,685 441,000 441,000 453,500 $12,500 2.83%Tuition From Districts In Idaho 82,645 71,463 106,049 74,800 74,800 112,000 $37,200 49.73%Tuition From Individuals 591,735 648,132 686,384 641,500 641,500 998,046 $356,546 55.58%
Total Local Sources $76,112,449 $80,106,652 $81,883,616 $92,825,646 $92,919,637 $99,057,027 $6,231,381 6.71%
Property Tax-General Maintenance and OperationsRevenue from property tax levy to support general maintenance and operations.
Revenue from a tax levy approved by the electorate of the District. The District has four supplemental levies: a levy for $2,948,000 passed in 1983 for general operations; a levy for $1,760,000 passed in 1988 for general operations; a $3,000,000 levy passed in 1988 to provide funds for the purpose of acquiring, purchasing or improving school sites or remodeling or replacing any existing building or furnishing and equipping any building; and a $3,000,000 levy passed in 1995 to provide computer and technological equipment and training for the schools. The District had a temporary five year supplemental levy that was approved by the voters in March 2012. This levy expired in 2016-17.
The general property tax revenue has increased as the market value continues to increase in Ada County. Delinquent tax penalties are lower due to taxpayers making more timely property tax payments. Earnings rates have increased from a 1.5%. to 2.5%. Anticipate increased tuition for the new all day kindergarten programs added this year.
Interest earned on available funds. Interest earnings from special revenue funds are recorded in the general fund, unless specifically required to be recorded elsewhere.
Local Source Revenue Analysis/Trends
Miscellaneous other income from local sources. This includes Medicaid billings, book fines, property damage, parent education fees and prior year rebates.
The District charges other Idaho districts tuition for students from those Districts who attend Boise schools. The main source of revenue is for the participation by Kuna School District students in the Professional Technical Program.
The District charges tuition for several programs: (1) Summer school fees are charged for the Secondary Summer School Program, the Elementary Summer School Program and the Summer Music Program (2) Fees are charged for the Evening School Program (3) and for All Day Kindergarten.
Tuition From Districts in Idaho
Revenue from a tax levy to provide for the comprehensive liability insurance plan.
Revenue earned as a result of penalties or interest added to the payment of delinquent taxes.
Fees charged for use of the District facilities and land in accordance with District rental policy. Includes payments from the City of Boise for the community centers located in three elementary schools and the lease with IDLA for space in the new DTEC building.
Fees charged for participation in the Community Education program.

BSD 2019-2020 Annual Budget
Financial Section Page 50
GENERAL FUND REVENUE
COUNTY SOURCES
STATE SOURCES
Vocational Program
FEDERAL SOURCES
2018-19 2018-19 2019-20 Difference % Increase2015-16 2016-17 2017-187 Adopted Projected Adopted 2018-19 to 2018-19 to
COUNTY SOURCES Actual Actual Actual Budget Budget Budget 2019-20 2019-20County $20,000 $0 $0 $0 $0 $0 $0 0.00%
Total County Sources $20,000 $0 $0 $0 $0 $0 $0 0.00%STATE SOURCESBase Support Program $100,536,433 $106,466,950 $111,166,279 $113,196,423 $112,191,841 $114,285,069 $1,088,646 0.96%Benefit Program 13,462,501 14,131,596 14,812,602 15,139,389 15,139,389 15,819,746 680,357 4.49%Transportation Program 5,404,823 5,579,093 5,584,087 5,700,000 5,987,185 5,847,526 147,526 2.59%Other State Support 3,997,201 5,404,300 6,527,229 6,634,535 6,634,535 7,565,934 931,399 14.04%Vocational Program 1,120,403 951,647 1,015,367 1,076,892 1,076,892 933,172 -143,720 -13.35%Revenue in Lieu of Taxes 722,890 722,890 722,890 722,887 722,887 722,887 0 0.00%
Total State Support $125,244,251 $133,256,476 $139,828,454 $142,470,126 $141,752,729 $145,174,334 $2,704,208 1.90%
FEDERAL SOURCESRestricted Federal Revenue $68,257 $70,526 $71,033 $69,194 $69,194 $62,912 -$6,282 -9.08%
Total Federal Sources $68,257 $70,526 $71,033 $69,194 $69,194 $62,912 -$6,282 -9.08%
The amount of entitlement, based on the funding formula in Idaho Code, for the payment of Social Security taxes and Public Employee Retirement contributions for eligible employees. Amount is directly related to the Salary Based Apportionment allocation. The amount paid is 19.59% of the salary Based Apportionment Allocation.
Revenue provided for funding professional technical education programs. Funding is for vocational reimbursable materials and allocation for the Dennis Technical Education Center.
County receipts for the shared program located at Victory Academy. This cooperative payment was eliminated in FY 2015-16.
Base Support ProgramThe amount of entitlement is based on attendance (units) and instructional and pupil personnel staff placement on the new career ladder and allocation for administrative and classified salary apportionment. This category also includes discretionary funding for the general maintenance and operations of the District. Funds are distributed based on a formula provided in Idaho Code.
Benefit Program
Transportation Program
Restricted Federal RevenueFunds provided from federal agencies to support specific programs. The funding in this category is from the US Army for the ROTC program.
Governmental Source Revenue Analysis/TrendsThe Idaho Legislature increased overall State funding for public schools for 2019-20 by 5.8%. Discretionary dollars were increased 3.4% and additional funds were appropriated to implement year 5 of the career ladder compensation allocation for teachers and pupil personnel. The State increased the salary allocation for administrators and classified personnel by 3%. The Idaho Legislature appropriated additional dollars for literacy intervention and payment of teacher master premiums. The State also appropriated dollars for continued enrollment growth throughout the State.
Payment is limited to 50% of the previous year's allowable costs for transporting students and a block grant of 35%. Once the transportation allocation is determined the allocation is reduced by 10% per Idaho Code. If a district is over the state average for cost per mile or cost per student, reimbursement is limited to the higher of 103% of the state average for cost per mile or cost per pupil for 2018-19.
Other State SupportIncludes payment for leadership, professional development, technology support, literacy remediation, career counseling, tuition equivalency for the juvenile detention center, serious emotional disturbed allotment, court ordered tuition and other special legislative or State Department of Education initiatives.

BSD 2019-2020 Annual Budget
Financial Section Page 51
GENERAL FUND REVENUE
OTHER INCOMESale of Fixed Assets
TRANSFERS IN
2018-19 2018-19 2019-20 Difference % Increase2015-16 2016-17 2017-18 Adopted Projected Adopted 2018-19 to 2018-19 to
OTHER INCOME Actual Actual Actual Budget Budget Budget 2019-20 2019-20Sale of Fixed Assets $206,625 $0 $0 $0 $0 $0 $0 0.00%
Total Other Income $206,625 $0 $0 $0 $0 $0 $0 0.00%TRANSFERS INFederal $276,518 $318,135 $299,618 $309,838 $309,838 $296,093 -$13,745 -4.44%
Total Transfers In $276,518 $318,135 $299,618 $309,838 $309,838 $296,093 -$13,745 -4.44%Total Revenues and Transfers In $201,928,100 $213,751,789 $222,082,721 $235,674,804 $235,051,398 $244,590,366 $8,915,562 3.78%
GENERAL FUND RESOURCES AND USES OF RESOURCES
USES OF RESOURCES
Required Fund Balance and Contingency
Estimated undesignated fund balance June 30, 2020 $2,933,587
Board policy requires a revenue and expenditure contingency to be set aside to absorb any unpredicted revenue shortfall, to maintain cash flow, to minimize borrowing needs and provide for any unanticipated expenditures. The amount that is required to be set aside for cash flow, revenue reductions and unanticipated expenditures is a minimum of 5.5% of the general fund budget. -13,572,511
-2,182,566Use of undesignated fund balance to balance the 2019-20 budget.
Fund Balance
Estimated Fund Balance at July 1, 2019In order to include the un-appropriated fund balance and expenditure contingency in the budget, we are including an estimated fund balance as a resource. The fund balance is not an annual revenue source for the general fund. $18,688,664
Revenue from the sale of the homes built by the professional technical education students. The District restructured the program in 2015-16 and residential homes are not being constructed for resale at this time.
Governmental Source Revenue Analysis/Trends
Funds transferred from Federal programs to provide for the costs of processing the various transactions of the program. The indirect cost rate is established by the State Department of Education based on financial reports submitted by the District. The 2019-20 approved restricted indirect cost rate is 1.48%.

BSD 2019-2020 Annual Budget
Financial Section Page 52
GENERAL FUND EXPENDITURES
General FundObject Expenditures
Budget2018-19
Budget2019-20
Amount ofChange
Percent ofChange
Salaries $147,949,330 $153,902,221 $5,952,891 4.02%Benefits 51,960,124 54,213,902 2,253,778 4.34%Purchased Services 18,471,735 18,972,506 500,771 2.71%Supplies & Materials 10,470,433 10,834,223 363,790 3.47%Capital Outlay 829,400 818,080 -11,320 -1.36%Debt Retirement 0 0 0 0.00%Insurance & Judgments 675,000 675,000 0 0.00%Transfers 7,357,000 7,357,000 0 0.00%
Total Expenditures $237,713,022 $246,772,932 $9,059,910 3.81%
Salaries62.37%
Benefits21.97%
Purchased Services7.69%
Supplies & Materials4.39%
Capital Outlay0.33%
Insurance & Judgments0.27%
Transfers2.98%
Percent of Total 2019-20 General Fund Expenditures by Object

BSD 2019-2020 Annual Budget
Financial Section Page 53
GENERAL FUND EXPENDITURES
General FundProgram Expenditures
Budget2018-19
Budget2019-20
Amount ofChange
Percent ofChange
Instruction $145,659,545 $151,793,510 $6,133,965 4.21%Support Services 30,167,097 31,061,272 894,175 2.96%District/ Board Administration 1,145,731 1,164,060 18,329 1.60%Business Operations 4,408,027 4,593,791 185,764 4.21%Building Administration 14,182,173 14,868,031 685,858 4.84%Building Maint & Security 24,302,214 25,047,508 745,294 3.07%Transportation 9,240,268 9,555,591 315,323 3.41%Non-Instruction 600,967 682,169 81,202 13.51%Capital Assets 650,000 650,000 0 0.00%Debt Service 0 0 0 0.00%Transfers Out 7,357,000 7,357,000 0 0.00%
Total Expenditures $237,713,022 $246,772,932 $9,059,910 3.81%
Instruction61.51%
Support Services12.59%
District/ Board Administration0.47%
Business Operations1.86%
Building Administration6.02%
Building Maint & Security10.15%
Transportation3.87%
Non-Instruction0.28%
Capital Assets0.26%
Transfers Out2.98%
Percent of Total 2019-20 General Fund Expenditures By Program

BSD 2019-2020 Annual Budget
Financial Section Page 54
GENERAL FUND EXPENDITURES
Adopted Projected Adopted 2018-19 to 2018-19 toActual Actual Actual Budget Actual Budget 2019-20 2019-20
Salaries $37,751,231 $38,748,011 $39,850,779 $40,935,106 $40,939,356 $42,255,698 $1,320,592 3.23%Employee Benefits 12,723,457 12,754,794 12,602,777 13,829,970 13,829,970 14,382,374 552,404 3.99%Purchased Services 333,372 315,644 311,938 381,100 367,733 366,100 -15,000 -3.94%Supplies and Materials $1,195,392 $1,468,650 $2,067,645 1,903,190 1,868,418 2,080,980 177,790 9.34%Capital Objects 0 0 0 0 0 0 0 0.00%
Total $52,003,452 $53,287,099 $54,833,140 $57,049,366 $57,005,477 $59,085,152 $2,035,786 3.57%Program Analysis/Trends
FTE Allotment: Certified 619
Classified 104.0
Adopted Projected Adopted 2018-19 to 2018-19 toActual Actual Actual Budget Actual Budget 2019-20 2019-20
Salaries $33,875,551 $36,798,060 $38,735,808 $40,026,323 $39,692,323 $41,239,591 $1,213,268 3.03%Employee Benefits 11,455,332 12,174,588 12,283,620 13,341,640 13,341,640 13,805,598 463,958 3.48%Purchased Services 419,893 438,976 436,982 440,925 444,076 534,225 93,300 21.16%Supplies and Materials 1,728,381 1,807,489 2,066,538 2,634,443 2,856,097 2,709,655 75,212 2.85%Capital Objects 0 0 0 0 0 0 0 0.00%Insurance and Judgments 0 0 0 0 0 0 0 0.00%
Total $47,479,157 $51,219,113 $53,522,948 $56,443,331 $56,334,136 $58,289,069 $1,845,738 3.27%Program Analysis/Trends
FTE Allotment: Certified 634
Classified 22
Difference
ELEMENTARY PROGRAM (512)
SECONDARY PROGRAM (515)
2015-16 2016-17 2017-182018-19 2018-19 2019-20 Difference % Increase
The instruction and learning experiences concerned with knowledge, skills, appreciation, attitudes and behaviors appropriate for students enrolled inkindergarten through sixth grades. This program includes: ESL-elementary staff, elementary music, physical education, regular year IRI/mathtutoring, elementary math coaches and reading specialists.
The instruction and learning experiences concerned with knowledge, skills, appreciation, attitudes and behavior needed by students enrolled in gradelevels seven through twelve. This program includes: ESL-secondary staff, secondary music, the AVID program, ROTC program and ISATremediation expenditures.
2016-17% Increase
2015-16 2017-182018-19 2018-19 2019-20

BSD 2019-2020 Annual Budget
Financial Section Page 55
GENERAL FUND EXPENDITURES
Adopted Projected Adopted 2018-19 to 2018-19 toActual Actual Actual Budget Actual Budget 2019-20 2019-20
Salaries $2,519,075 $2,362,486 $2,321,201 $2,568,867 $2,582,867 $2,692,951 $124,084 4.83%Employee Benefits 770,498 734,010 685,715 832,815 832,815 867,398 34,583 4.15%Purchased Services 0 0 0 1,500 1,544 1,500 0 0.00%Supplies and Materials 41,005 30,440 62,340 78,508 97,908 139,602 61,094 77.82%Capital Objects 0 0 0 0 0 0 0 0.00%
Total $3,330,578 $3,126,936 $3,069,256 $3,481,690 $3,515,134 $3,701,451 $219,761 6.31%Program Analysis/Trends
FTE Allotment: Certified 34
Classified 3
Adopted Projected Adopted 2018-19 to 2018-19 toActual Actual Actual Budget Actual Budget 2019-20 2019-20
Salaries $835,855 $829,418 $931,207 $999,125 $1,304,679 $1,347,020 $347,895 34.82%Employee Benefits 293,085 295,852 315,142 356,909 356,909 474,732 117,823 33.01%Purchased Services 73,994 125,449 128,285 146,000 155,776 146,000 0 0.00%Supplies and Materials 483,949 524,104 628,428 623,727 613,183 623,727 0 0.00%Capital Objects 0 0 0 0 0 0 0 0.00%Insurance and Judgments 0 0 0 0 0 0 0 0.00%
Total $1,686,883 $1,774,823 $2,003,063 $2,125,761 $2,430,547 $2,591,479 $465,718 21.91%Program Analysis/Trends -
FTE Allotment: Certified 22
Classified 1
ALTERNATIVE PROGRAM (517)
VOCATIONAL TECHNICAL PROGRAM (519)
2019-20 Difference % Increase
The instruction and learning experiences concerned with preparing students to meet challenging academic standards as well as industry skill standardswhile preparing students for broad-based careers. The costs associated with the Dehryl Dennis Professional Technical Center are included in thisprogram, as well as the monies allocated from the state for vocational education.
The instruction and learning experiences appropriate for students who meet the definition of "At-Risk Youth" for the primary purpose of having each student obtain a high school diploma. Included in this program are the Summer Alternative programs, the Evening School program and Frank Church High School. The program offerings at Frank Church High School include the BASE program and Marian Pritchett School.
2015-16 2016-17 2017-182018-19 2018-19 2019-20 Difference % Increase
2015-16 2016-17 2017-182018-19 2018-19

BSD 2019-2020 Annual Budget
Financial Section Page 56
GENERAL FUND EXPENDITURES
Adopted Projected Adopted 2018-19 to 2018-19 toActual Actual Actual Budget Actual Budget 2019-20 2019-20
Salaries $10,779,984 $11,770,072 $12,578,164 $12,941,077 $12,941,077 $13,874,621 $933,544 7.21%Employee Benefits 4,497,307 4,840,216 4,934,192 5,556,054 5,556,054 5,965,536 409,482 7.37%Purchased Services 26,042 40,853 135,049 59,250 57,313 59,250 0 0.00%Supplies and Materials 175,674 157,588 162,764 185,000 166,141 185,000 0 0.00%Capital Objects 0 0 0 0 0 0 0 0.00%
Total $15,479,007 $16,808,730 $17,810,170 $18,741,381 $18,720,585 $20,084,407 $1,343,026 7.17%Program Analysis/Trends
FTE Allotment: Certified 145
Classified 234
Adopted Projected Adopted 2018-19 to 2018-19 toActual Actual Actual Budget Actual Budget 2019-20 2019-20
Salaries $564,136 $600,572 $601,879 $621,074 $621,074 $733,231 $112,157 18.06%Employee Benefits 219,935 227,516 218,859 242,976 242,976 283,448 40,472 16.66%Purchased Services 0 0 0 0 0 0 0 0.00%Supplies and Materials 10,859 10,759 9,759 12,000 12,000 12,000 0 0.00%Capital Objects 0 0 0 0 0 0 0 0.00%
Total $794,930 $838,847 $830,496 $876,050 $876,050 $1,028,679 $152,629 17.42%Program Analysis/Trends -
FTE Allotment: Certified 12
Classified 4
EXCEPTIONAL PROGRAM (521)
PRESCHOOL PROGRAM (522)
2019-20 Difference % Increase
The instructional activities and services of teachers and classroom assistants who work to meet the needs of exceptional preschool children. Thisprogram has approximately 12 teachers and 4.0 special education assistants.
The instructional activities and services of teachers and assistants who work to meet the needs of exceptional children. This program hasapproximately 145 certified teachers and 234 special education assistants.
Increased staffing allocation.
2015-16 2016-17 2017-182018-19 2018-19 2019-20 Difference % Increase
2015-16 2016-17 2017-182018-19 2018-19

BSD 2019-2020 Annual Budget
Financial Section Page 57
GENERAL FUND EXPENDITURES
Adopted Projected Adopted 2018-19 to 2018-19 toActual Actual Actual Budget Actual Budget 2019-20 2019-20
Salaries $1,525,944 $1,618,098 $1,819,636 $1,853,893 $1,853,893 $1,887,364 $33,471 1.81%Employee Benefits 486,337 512,652 559,995 610,292 610,292 635,577 25,285 4.14%Purchased Services 34,327 33,473 2,160 3,800 1,800 10,800 7,000 184.21%Supplies and Materials 20,476 21,945 39,304 39,000 40,768 29,000 -10,000 -25.64%Capital Objects 0 0 0 0 0 0 0 0.00%
Total $2,067,084 $2,186,168 $2,421,096 $2,506,985 $2,506,753 $2,562,741 $55,756 2.22%Program Analysis/Trends
Certified 28.6Classified -
Adopted Projected Adopted 2018-19 to 2018-19 toActual Actual Actual Budget Actual Budget 2019-20 2019-20
Salaries $1,475,892 $1,444,307 $1,507,989 $1,743,428 $1,756,181 $1,701,613 -$41,815 -2.40%Employee Benefits 245,761 240,074 255,057 350,999 350,999 362,611 11,612 3.31%Purchased Services 120,144 102,628 129,730 241,180 207,536 241,180 0 0.00%Supplies and Materials 146,494 239,378 189,200 132,500 156,175 132,500 0 0.00%Capital Objects 0 0 32,230 0 0 0 0 0.00%
Total $1,988,291 $2,026,387 $2,114,206 $2,468,107 $2,470,891 $2,437,904 -$30,203 -1.22%Program Analysis/Trends
FTE Allotment: Elementary Coaches 187Secondary Coaches 521
Increased base salary amounts by 3%.
GIFTED AND TALENTED PROGRAM (524)
INTERSCHOLASTIC PROGRAM (531)
Instructional activities and learning experiences for students identified as being gifted and talented. The District has approximately 724 elementarychildren that have been identified as gifted. The District offers full time gifted classrooms, pull out gifted programs and a full time highly giftedprogram. This program has approximately 28 certified teachers.
2019-20 Difference % Increase
2015-16 2016-17 2017-182018-19 2018-19 2019-20 Difference % Increase
2015-16 2016-17 2017-182018-19 2018-19
The extra-curricular programs and activities which supplement the instructional curriculum program. These programs involve student participation incompetitive interscholastic events which are scheduled or sponsored by the school. Included in this program are salaries and benefits for coaches,contracted referee services for junior high officials, maintenance fees for Dona Larsen park and emergency medical transportation services. TheDistrict also provides equipment money for each junior and senior high school.
Increased one GATE position. Inservice and training supplies will be paid with State GATE funding, which is in a Special Revenue Fund.

BSD 2019-2020 Annual Budget
Financial Section Page 58
GENERAL FUND EXPENDITURES
Adopted Projected Adopted 2018-19 to 2018-19 toActual Actual Actual Budget Actual Budget 2019-20 2019-20
Salaries $540,936 $557,686 $561,683 $624,309 $624,309 $610,359 -$13,950 -2.23%Employee Benefits 109,264 112,739 113,853 127,968 127,968 128,852 884 0.69%Purchased Services 0 0 0 0 0 0 0 0.00%Supplies and Materials 0 0 0 0 0 0 0 0.00%Capital Objects 0 0 0 0 0 0 0 0.00%
Total $650,200 $670,425 $675,536 $752,277 $752,277 $739,211 -$13,066 -1.74%Program Analysis/Trends -
FTE Allotment: Certified -
Classified -
Adopted Projected Adopted 2018-19 to 2018-19 toActual Actual Actual Budget Actual Budget 2019-20 2019-20
Salaries $536,103 $490,540 $473,524 $826,598 $826,598 $817,345 -$9,253 -1.12%Employee Benefits 89,914 83,961 80,821 169,453 169,453 174,175 4,722 2.79%Purchased Services 10,421 6,234 233 4,650 4,650 4,650 0 0.00%Supplies and Materials 4,844 26,487 5,218 15,000 15,000 15,000 0 0.00%Capital Objects 0 0 0 0 0 0 0 0.00%
Total $641,282 $607,221 $559,796 $1,015,701 $1,015,701 $1,011,170 -$4,531 -0.45%Program Analysis/Trends -
FTE Allotment: Certified -
Classified -
SCHOOL ACTIVITY PROGRAM (532)
SUMMER SCHOOL PROGRAM (541)
2016-17 2017-182018-19 2018-19 2019-20
School sponsored activities which are an adjunct to the instructional curriculum. This category includes music stipends, elementary safety patrol, andsecondary department head increments.
Difference % Increase2015-16
Programs of instruction offered during the summer not considered part of or eligible for the state educational support program. The District offersSecondary Summer School, Summer Music, Elementary Summer School, and Summer Tutoring Classes.
2015-16 2016-17 2017-182018-19 2018-19 2019-20 Difference % Increase

BSD 2019-2020 Annual Budget
Financial Section Page 59
GENERAL FUND EXPENDITURES
Adopted Projected Adopted 2018-19 to 2018-19 toActual Actual Actual Budget Actual Budget 2019-20 2019-20
Salaries $148,788 $156,892 $104,820 $142,483 $162,483 $180,568 $38,085 26.73%Employee Benefits 63,741 60,421 37,611 54,013 54,013 79,279 25,266 46.78%Purchased Services 1,367 1,209 1,767 0 0 0 0 0.00%Supplies and Materials 0 0 0 2,400 2,400 2,400 0 0.00%Capital Objects 0 0 0 0 0 0 0 0.00%
Total $213,896 $218,521 $144,198 $198,896 $218,896 $262,247 $63,351 31.85%Program Analysis/Trends -
FTE Allotment: Certified 2
Classified 3
Adopted Projected Adopted 2018-19 to 2018-19 toActual Actual Actual Budget Actual Budget 2019-20 2019-20
Salaries $6,540,488 $6,860,156 $7,249,464 $7,455,332 $7,459,332 $7,753,607 $298,275 4.00%Employee Benefits 2,211,233 2,265,862 2,291,982 2,667,319 2,667,319 2,694,696 27,377 1.03%Purchased Services 59,512 61,896 89,095 187,920 138,539 193,484 5,564 2.96%Supplies and Materials 59,745 58,603 60,464 115,510 130,188 118,141 2,631 2.28%Capital Objects 0 0 0 0 0 0 0 0.00%
Total $8,870,978 $9,246,517 $9,691,005 $10,426,081 $10,395,378 $10,759,928 $333,847 3.20%Program Analysis/Trends
FTE Allotment: Certified 111
Classified 33
DETENTION CENTER PROGRAM (546)
ATTENDANCE, GUIDANCE AND HEALTH PROGRAMS (611)
The instructional program provided for juvenile offenders housed in the Ada County Juvenile Detention Center and juveniles court-ordered to theVictory Academy located at Frank Church High School. This program has 2 certified teachers and 3 classroom assistants.
The personnel, activities, services and programs designed to (1) assist the students and parents to meet school attendance requirements, (2) provideindividual and group counseling and guidance, and (3) assist in meeting student health needs. The District has approximately 76 counselors, 32nurses, 15 health technicians and one dental hygienist funded in this program. This program also funds 16 support staff and 2 supervisors.
2015-16 2016-17 2017-182018-19 2018-19 2019-20 Difference % Increase
2019-20 Difference % Increase2015-16 2016-17 2017-18
2018-19 2018-19

BSD 2019-2020 Annual Budget
Financial Section Page 60
GENERAL FUND EXPENDITURES
Adopted Projected Adopted 2018-19 to 2018-19 toActual Actual Actual Budget Actual Budget 2019-20 2019-20
Salaries $5,449,787 $5,707,886 $6,011,066 $6,183,126 $6,191,536 $6,547,803 $364,677 5.90%Employee Benefits 1,684,043 1,747,537 1,750,127 1,976,837 1,977,937 2,088,491 111,654 5.65%Purchased Services 47,770 35,943 33,171 50,500 50,990 59,000 8,500 16.83%Supplies and Materials 57,798 51,282 62,021 47,000 47,000 47,000 0 0.00%Capital Objects 0 0 0 0 0 0 0 0.00%
Total $7,239,398 $7,542,648 $7,856,385 $8,257,463 $8,267,463 $8,742,294 $484,831 5.87%
FTE Allotment: Certified 92
Classified 1
Adopted Projected Adopted 2018-19 to 2018-19 toActual Actual Actual Budget Actual Budget 2019-20 2019-20
Salaries $2,182,806 $2,401,504 $2,583,271 $2,836,539 $2,840,489 $2,796,105 -$40,434 -1.43%Employee Benefits 582,433 649,398 663,962 831,901 832,223 813,183 -18,718 -2.25%Purchased Services 211,334 231,762 278,054 311,644 333,322 313,562 1,918 0.62%Supplies and Materials 46,536 43,886 42,550 38,140 39,640 48,155 10,015 26.26%Capital Objects 0 0 0 0 0 0 0 0.00%
Total $3,023,109 $3,326,550 $3,567,837 $4,018,224 $4,045,674 $3,971,005 -$47,219 -1.18%
FTE Allotment: Certified 10.5
Classified 13
2018-19 2018-19
Personnel, activities and services for assisting the instructional staff in planning, developing, training and evaluating learning experiences for students. Included in this category are salaries and benefits for supervisors, curriculum writers and theme readers. Also included are expenditures for staffdevelopment and school improvement. The majority of the leadership stipends are paid out of this program.
SPECIAL SERVICES PROGRAM (616)
INSTRUCTIONAL IMPROVEMENT PROGRAM (621)
2017-182016-172015-162019-20 Difference % Increase
The personnel, activities and services designed to assist exceptional students and to assist the staff members who work with the Exceptional Program.Included in this program are the salaries and benefits for special education supervisors, social workers, community resources specialists,psychologists, speech language pathologists and therapists.
Program Analysis/TrendsReduced one administrative support position and the Data Accountability Supervisor position.
Program Analysis/Trends
2018-19 2018-19 2019-20 Difference % Increase2015-16 2016-17 2017-18

BSD 2019-2020 Annual Budget
Financial Section Page 61
GENERAL FUND EXPENDITURES
Adopted Projected Adopted 2018-19 to 2018-19 toActual Actual Actual Budget Actual Budget 2019-20 2019-20
Salaries $1,878,607 $1,932,538 $2,030,497 $2,110,448 $2,110,448 $2,182,694 $72,246 3.42%Employee Benefits 845,192 856,908 825,006 933,873 933,873 960,749 26,876 2.88%Purchased Services 22,839 25,279 23,872 22,000 18,244 22,000 0 0.00%Supplies and Materials 379,889 410,316 435,340 458,456 468,712 458,508 52 0.01%Capital Objects 0 0 0 0 0 0 0 0.00%
Total $3,126,527 $3,225,041 $3,314,715 $3,524,777 $3,531,277 $3,623,951 $99,174 2.81%
FTE Allotment: Certified 14
Classified 52
Adopted Projected Adopted 2018-19 to 2018-19 toActual Actual Actual Budget Actual Budget 2019-20 2019-20
Salaries $1,336,687 $1,374,186 $1,331,320 $1,402,967 $1,402,967 $1,434,805 $31,838 2.27%Employee Benefits 397,963 409,198 383,814 428,333 428,333 444,411 16,078 3.75%Purchased Services 315,884 178,554 57,574 323,500 323,500 346,500 23,000 7.11%Supplies and Materials 1,507,442 1,603,056 1,812,555 1,785,752 1,856,651 1,738,378 -47,374 -2.65%Capital Objects 0 0 0 0 0 0 0 0.00%
Total $3,557,976 $3,564,995 $3,585,263 $3,940,552 $4,011,451 $3,964,094 $23,542 0.60%
FTE Allotment: Certified -
Classified 18
EDUCATIONAL MEDIA PROGRAM (622)
INSTRUCTIONAL TECHNOLOGY PROGRAM (623)
Personnel, activities and services concerned with the teaching and use of the resources available in the school library, media, and visual center. Thiscategory basically includes 1 FTE library supervisor, 14 secondary teacher-librarians and 52 library assistants.
2015-16 2016-17 2017-182018-19 2018-19
Program Analysis/Trends
Technology personnel and activities and services for the purpose of supporting instruction. This program includes 18 technology personnel thatsupport district-wide networks, hardware and software applications, including instructional software and administrative software. Stipends forbuilding technology coordinators and staff working on the District-wide help desk. In addition to staff expenditures, this program also includesinstructional technology equipment, instructional software, and the costs associated with the fiber network.
2015-16 2016-17% Increase
Program Analysis/TrendsIncreased purchased services for additional computer support contracts.
2017-182018-19 2018-19 2019-20 Difference
2019-20 Difference % Increase

BSD 2019-2020 Annual Budget
Financial Section Page 62
GENERAL FUND EXPENDITURES
Adopted Projected Adopted 2018-19 to 2018-19 toActual Actual Actual Budget Actual Budget 2019-20 2019-20
Salaries $49,980 $55,864 $54,528 $55,412 $62,412 $57,351 $1,939 3.50%Employee Benefits 17,738 18,712 18,202 19,645 19,645 20,382 737 3.75%Purchased Services 440,503 435,440 272,348 387,000 406,637 368,000 -19,000 -4.91%Supplies and Materials 14,378 14,081 11,887 12,000 14,000 12,000 0 0.00%Capital Objects 0 0 0 0 0 0 0 0.00%
Total $522,599 $524,097 $356,965 $474,057 $502,694 $457,733 -$16,324 -3.44%
FTE Allotment: Certified -
Classified 1
Adopted Projected Adopted 2018-19 to 2018-19 toActual Actual Actual Budget Actual Budget 2019-20 2019-20
Salaries $455,261 $480,668 $499,567 $516,796 $516,796 $538,758 $21,962 4.25%Employee Benefits 121,739 127,331 128,152 145,878 145,878 153,569 7,691 5.27%Purchased Services 6,344 9,447 6,835 6,500 6,500 11,500 5,000 76.92%Supplies and Materials 2,598 1,721 610 2,500 2,500 2,500 0 0.00%Capital Objects 0 0 0 0 0 0 0 0.00%
Total $585,942 $619,167 $635,164 $671,674 $671,674 $706,327 $34,653 5.16%
FTE Allotment: Certified 2
Classified 3
BOARD OF EDUCATION PROGRAM (631)
DISTRICT ADMINISTRATION PROGRAM (632)
Purchased services are decreased for election costs.
2019-20 Difference % Increase
2015-16 2016-17 2017-182018-19 2018-19 2019-20 Difference % Increase
Program Analysis/Trends
Programs or activities of the elected Board of Trustees designed to assist staff members in performing duties as directed by law or established by StateBoard of Education or District board policy. Purchased services include procurement of legal and audit services.
Program Analysis/Trends
The program to provide general administration and executive leadership for the implementation of school policy and the supervision and managementof the District. The superintendent, deputy superintendent, public affairs office and district-wide switchboard are included in this program.
2015-16 2016-17 2017-182018-19 2018-19

BSD 2019-2020 Annual Budget
Financial Section Page 63
GENERAL FUND EXPENDITURES
Adopted Projected Adopted 2018-19 to 2018-19 toActual Actual Actual Budget Actual Budget 2019-20 2019-20
Salaries $9,481,524 $10,014,903 $10,464,810 $10,678,428 $10,678,428 $11,132,695 $454,267 4.25%Employee Benefits 3,081,627 3,173,346 3,184,671 3,441,807 3,441,807 3,650,821 209,014 6.07%Purchased Services 23,464 43,664 25,799 50,808 51,319 73,260 22,452 44.19%Supplies and Materials 20,397 6,668 9,969 11,130 17,380 11,255 125 1.12%Capital Objects 0 0 0 0 0 0 0 0.00%
Total $12,607,012 $13,238,582 $13,685,250 $14,182,173 $14,188,934 $14,868,031 $685,858 4.84%Program Analysis/Trends -
FTE Allotment: Certified 80
Classified 81
Adopted Projected Adopted 2018-19 to 2018-19 toActual Actual Actual Budget Actual Budget 2019-20 2019-20
Salaries $1,175,556 $1,295,064 $1,343,425 $1,509,381 $1,509,381 $1,508,872 -$509 -0.03%Employee Benefits 392,067 396,557 417,128 496,943 496,943 506,248 9,305 1.87%Purchased Services 88,700 80,470 101,510 188,650 192,429 163,850 -24,800 -13.15%Supplies and Materials 79,342 88,018 41,066 67,600 70,800 66,900 -700 -1.04%Capital Objects 0 0 0 0 0 0 0 0.00%Insurance 202,712 228,354 199,984 300,000 250,000 300,000 0 0.00%
Total $1,938,377 $2,088,463 $2,103,114 $2,562,574 $2,519,553 $2,545,870 -$16,704 -0.65%
FTE Allotment: Certified 1
Classified 23.5
SCHOOL ADMINISTRATIVE PROGRAM (641)
Purchased Servcies decreased to reduced contracted services needed in the HR Department.
The program concerned with the fiscal operations of the District. This program includes budgeting, purchasing, receiving, paying for goods andservices, paying employees, human resources, District wellness program and other activities associated with the prudent management of Districtresources. This program includes 3 supervisors, 2 administrators and 19 support staff.
2015-16 2016-17 2017-182018-19 2018-19 2019-20 Difference % Increase
BUSINESS ADMINISTRATION PROGRAM (651)
The personnel, activities and services for directing and managing the operation of the schools in the District. This program includes area directors, allprincipals, assistant principals, and building secretarial support.
2015-16Difference % Increase
Program Analysis/Trends
2016-17 2017-182018-19 2018-19 2019-20

BSD 2019-2020 Annual Budget
Financial Section Page 64
GENERAL FUND EXPENDITURES
Adopted Projected Adopted 2018-19 to 2018-19 toActual Actual Actual Budget Actual Budget 2019-20 2019-20
Salaries $343,303 $317,922 $292,734 $463,185 $463,185 $473,131 $9,946 2.15%Employee Benefits 176,242 179,313 193,493 229,440 229,440 232,810 3,370 1.47%Purchased Services 34,503 15,962 14,462 44,000 44,000 44,000 0 0.00%Supplies and Materials 10,493 13,960 9,373 22,660 22,660 22,660 0 0.00%Capital Objects 0 0 0 0 0 0 0 0.00%
Total $564,541 $527,157 $510,061 $759,285 $759,285 $772,601 $13,316 1.75%
FTE Allotment: Certified -
Classified 14
Adopted Projected Adopted 2018-19 to 2018-19 toActual Actual Actual Budget Actual Budget 2019-20 2019-20
Salaries $383,451 $369,248 $374,736 $388,204 $388,204 $406,796 $18,592 4.79%Employee Benefits 108,520 111,070 110,469 121,265 121,265 127,489 6,224 5.13%Purchased Services 18,518 26,959 36,199 19,700 19,700 19,700 0 0.00%Supplies and Materials 295,145 500,692 486,195 556,999 631,924 721,335 164,336 29.50%Capital Objects 0 0 0 0 0 0 0 0.00%
Total $805,634 $1,007,969 $1,007,599 $1,086,168 $1,161,093 $1,275,320 $189,152 17.41%
FTE Allotment: Certified 1
Classified 4
CENTRAL SERVICES PROGRAM (655)
The program for receiving, disbursing, accounting and charging various programs of the District for materials, supplies and equipment which arepurchased, stored and inventoried in general or centralized storage. This program includes the delivery functions associated with the District whichinclude mail, music program setup, and surplus equipment processing. The program also includes the wages for one full time equivalent for theDistrict copy center and 14 warehouse workers.
Activities concerned with supporting the District's information technology systems, including supporting networks, maintaining administrativeinformation systems and processing data for administrative and managerial purposes. This program includes the District-wide administrator and fourtechnology support staff.
2015-16 2016-17 2017-182018-19 2018-19 2019-20 Difference % Increase
Program Analysis/Trends
TECHNOLOGY ADMINISTRATION SERVICES PROGRAM (656)
Program Analysis/Trends
2016-17 2017-18
Software costs that have been previously paid by individual programs have now been budgeted and reported in this area, per direction from the SDE.Also increased costs to purchase additional cyber security software.
Difference % Increase2018-19 2018-19 2019-202015-16

BSD 2019-2020 Annual Budget
Financial Section Page 65
GENERAL FUND EXPENDITURES
Adopted Projected Adopted 2018-19 to 2018-19 toActual Actual Actual Budget Actual Budget 2019-20 2019-20
Salaries $3,603,362 $4,072,035 $3,954,545 $6,798,267 $6,798,499 $7,135,108 $336,841 4.95%Employee Benefits 2,448,453 2,408,140 2,773,368 3,212,644 3,212,644 3,272,346 59,702 1.86%Purchased Services 4,432,826 4,521,163 4,273,786 5,073,512 4,833,762 5,024,755 -48,757 -0.96%Supplies and Materials 294,711 327,914 341,165 349,194 368,638 367,398 18,204 5.21%Capital Objects 0 0 0 0 0 0 0 0.00%Insurance 288,638 305,127 338,781 375,000 375,000 375,000 0 0.00%
Total $11,067,990 $11,634,379 $11,681,646 $15,808,617 $15,588,543 $16,174,607 $365,990 2.32%
FTE Allotment: Certified -
Classified 199.5
Adopted Projected Adopted 2018-19 to 2018-19 toActual Actual Actual Budget Actual Budget 2019-20 2019-20
Salaries $0 $0 $0 $0 $0 $0 $0 0.00%Employee Benefits 0 0 0 0 0 0 0 0.00%Purchased Services 76,997 75,553 20,206 10,000 0 10,000 0 0.00%Supplies and Materials 0 0 0 0 0 0 0 0.00%Capital Objects 0 0 0 0 0 0 0 0.00%Insurance 0 0 0 0 0 0 0 0.00%
Total $76,997 $75,553 $20,206 $10,000 $0 $10,000 $0 0.00%Program Analysis/Trends -
FTE Allotment: Certified -
Classified -
BUILDINGS CARE AND UPKEEP PROGRAM (661)The program concerned with the daily custodial needs and the utility services for all school buildings in the District. This program also includesbuilding insurance and other building care costs. This program funds approximately 194 full time custodians, 5.5 supervisors and provides forsummer labor.
Increased for 6 new custodians and increasing work days for part time custodians.
2019-20 Difference % Increase
Program Analysis/Trends
2015-16 2016-17 2017-182018-19 2018-19
2015-16 2016-17 2017-182018-19 2018-19
MAINTENANCE BUILDINGS -NON STUDENT OCCUPIED (663)The program concerned with the daily custodial needs and the utility services for all buildings that are not utilized by students in the District. This program also includes building insurance and other building care costs.
2019-20 Difference % Increase

BSD 2019-2020 Annual Budget
Financial Section Page 66
GENERAL FUND EXPENDITURES
GENERAL MAINTENANCE OF BUILDINGS AND EQUIPMENT PROGRAM (664)
Adopted Projected Adopted 2018-19 to 2018-19 toActual Actual Actual Budget Actual Budget 2019-20 2019-20
Salaries $4,038,084 $4,314,380 $4,926,934 $2,814,522 $2,814,522 $3,009,748 $195,226 6.94%Employee Benefits 1,248,762 1,296,401 950,870 1,092,633 1,092,633 1,148,707 56,074 5.13%Purchased Services 1,103,657 942,169 1,601,672 1,051,590 997,236 1,079,618 28,028 2.67%Supplies and Materials 693,645 787,384 842,481 837,800 1,412,854 830,000 -7,800 -0.93%Capital Objects 79,076 363,010 197,047 179,400 312,775 168,080 -11,320 -6.31%
Total $7,163,224 $7,703,343 $8,519,004 $5,975,945 $6,630,020 $6,236,153 $260,208 4.35%
FTE Allotment: Certified -
Classified 54.5
Adopted Projected Adopted 2018-19 to 2018-19 toActual Actual Actual Budget Actual Budget 2019-20 2019-20
Salaries $587,141 $627,177 $663,046 $699,317 $699,317 $779,246 $79,929 11.43%Employee Benefits 267,398 278,882 278,499 312,647 312,647 342,162 29,515 9.44%Purchased Services 39,888 163,025 140,920 235,000 200,650 262,000 27,000 11.49%Supplies and Materials 226,842 210,854 155,183 246,700 271,165 281,500 34,800 14.11%Capital Objects 0 0 0 0 0 0 0 0.00%
Total $1,121,269 $1,279,937 $1,237,648 $1,493,664 $1,483,779 $1,664,908 $171,244 11.46%
FTE Allotment: Certified -
Classified 18
Difference % Increase2016-17 2017-18
2018-19 2018-19 2019-20
Program Analysis/TrendsPurchased services increased for crack sealing and parking lot and playground maintenance. Grounds supply budget increased for lawn care products.
The program concerned with the physical maintenance of buildings and equipment in the District. This program includes annual repairs,modifications and improvements necessary to provide safe facilities and equipment. This program includes 46 maintenance workers, 5 support staffand 3.5 supervisors.
2015-16 2016-17 2017-182018-19 2018-19 2019-20 Difference % Increase
GENERAL MAINTENANCE OF GROUNDS PROGRAM (665)The program concerned with the maintenance of all sites in the District. This program includes snow removal, landscaping and other general groundsservices. This program pays for 18 grounds keepers.
Program Analysis/Trends
2015-16

BSD 2019-2020 Annual Budget
Financial Section Page 67
GENERAL FUND EXPENDITURES
Adopted Projected Adopted 2018-19 to 2018-19 toActual Actual Actual Budget Actual Budget 2019-20 2019-20
Salaries $344,485 $355,988 $380,982 $465,502 $465,702 $507,215 $41,713 8.96%Employee Benefits 127,482 131,323 133,181 171,106 171,106 190,125 19,019 11.12%Purchased Services 77,275 53,963 64,859 106,800 93,302 180,300 73,500 68.82%Supplies and Materials 17,421 61,655 208,556 270,580 411,503 84,200 -186,380 -68.88%Capital Objects 0 0 0 0 0 0 0 0.00%
Total $566,663 $602,929 $787,578 $1,013,988 $1,141,613 $961,840 -$52,148 -5.14%Program Analysis/Trends -
FTE Allotment: Certified 1
Classified 7
Adopted Projected Adopted 2018-19 to 2018-19 toActual Actual Actual Budget Actual Budget 2019-20 2019-20
Salaries $147,556 $154,376 $164,991 $169,711 $169,711 $177,774 $8,063 4.75%Employee Benefits 52,112 53,913 54,183 59,657 59,657 62,364 2,707 4.54%Purchased Services 7,292,158 7,082,992 7,502,040 8,426,821 8,150,953 8,725,218 298,397 3.54%Supplies and Materials 19,600 16,889 19,395 19,940 19,940 21,590 1,650 8.27%Capital Objects 0 0 0 0 0 0 0 0.00%
Total $7,511,426 $7,308,171 $7,740,608 $8,676,129 $8,400,261 $8,986,946 $310,817 3.58%
FTE Allotment: Certified -
Classified 3
SECURITY PROGRAM (667)
PUPIL TO SCHOOL TRANSPORTATION PROGRAM (681)
Difference % Increase
The program for maintaining order and control in schools and on school property. This program includes a District-wide security specialist and sevensecurity officers. Each high school has one security officer, with the exception of Borah, which has two. This program also funds the security andsafety manager for the District.
The program concerned with transporting students to and from school, between schools within the District and instructional field trips. The Statesupport program provides for reimbursement of transportation at 85% or 50% depending on the type of expenditure and block grant. The block grantwill be calculated using the prior year's per unit grant amount and the current year's units. Statewide transportation and enrollment growth will beapplied to the final grant amount. This revenue is paid by the State the following year and is shown as Transportation Support. The District contractsfor pupil transportation, however the District employs 2 support staff and 1 supervisor to oversee and manage the contract.
2015-16 2016-17 2017-182018-19 2018-19 2019-20
Program Analysis/TrendsPurchased services increased for higher contracted fuel costs. Fuel costs have been budgeted at $3.05 per gallon, prior year budget was $2.75 pergallon. Estimated a 2.9% increase in CPI for bussing contract.
2019-20 Difference % Increase2015-16 2016-17 2017-18
2018-19 2018-19

BSD 2019-2020 Annual Budget
Financial Section Page 68
GENERAL FUND EXPENDITURES
Adopted Projected Adopted 2018-19 to 2018-19 toActual Actual Actual Budget Actual Budget 2019-20 2019-20
Salaries $0 $0 $0 $0 $0 $0 $0 0.00%Employee Benefits 0 0 0 0 0 0 0 0.00%Purchased Services 490,250 481,581 450,966 564,139 564,139 568,645 4,506 0.80%Supplies and Materials 0 0 1,175 0 0 0 0 0.00%Capital Objects 0 0 0 0 0 0 0 0.00%
Total $490,250 $481,581 $452,141 $564,139 $564,139 $568,645 $4,506 0.80%Program Analysis/Trends -
FTE Allotment: Certified -
Classified -
Adopted Projected Adopted 2018-19 to 2018-19 toActual Actual Actual Budget Actual Budget 2019-20 2019-20
Salaries $0 $0 $0 $0 $0 $0 $0 0.00%Employee Benefits 256,696 274,192 289,053 305,000 305,000 305,000 0 0.00%Purchased Services 0 0 0 0 0 0 0 0.00%Supplies and Materials 4,304 2,990 0 0 0 70,000 70,000 0.00%Capital Objects 0 0 0 0 0 0 0 0.00%
Total $261,000 $277,182 $289,053 $305,000 $305,000 $375,000 $70,000 22.95%Program Analysis/Trends -
FTE Allotment: Certified -
Classified -
PUPIL ACTIVITY TRANSPORTATION PROGRAM (682)
FOOD SERVICES PROGRAM (710)
Increased the supply budget to cover bad debt associated with unpaid meal charges,
Difference % Increase
2015-16 2016-17 2017-182018-19 2018-19 2019-20 Difference % Increase
The program established to provide transportation services to approved athletic or activity events and to provide other transportation services noteligible for reimbursement under the state transportation support program. This program includes the costs associated with paying approximately 34contracted crossing guards.
The program for the personnel and activities for providing meals to students. Idaho code requires payments for Social Security taxes for employeesproviding these services under the National Food Services Program to be paid by the General Fund Food Services Program. These payments meet orexceed the amount required under the local matching funds provision in the National Food Services Law.
2019-202015-16 2016-17 2017-18
2018-19 2018-19

BSD 2019-2020 Annual Budget
Financial Section Page 69
GENERAL FUND EXPENDITURES
Adopted Projected Adopted 2018-19 to 2018-19 toActual Actual Actual Budget Actual Budget 2019-20 2019-20
Salaries $101,863 $110,072 $114,902 $119,910 $119,910 $120,152 $242 0.20%Employee Benefits 36,302 37,915 36,502 40,107 40,107 40,769 662 1.65%Purchased Services 113,933 106,127 88,638 133,246 118,246 143,409 10,163 7.63%Supplies and Materials 1,182 760 1,206 2,704 2,704 2,839 135 4.99%Capital Objects 0 0 0 0 0 0 0 0.00%
Total $253,280 $254,874 $241,248 $295,967 $280,967 $307,169 $11,202 3.78%Program Analysis/Trends -
FTE Allotment: Certified -
Classified 2.25
Adopted Projected Adopted 2018-19 to 2018-19 toActual Actual Actual Budget Actual Budget 2019-20 2019-20
Salaries $0 $0 $0 $0 $0 $0 $0 0.00%Employee Benefits 0 0 0 0 0 0 0 0.00%Purchased Services 0 0 0 0 0 0 0 0.00%Supplies and Materials 0 0 0 0 0 0 0 0.00%Capital Objects 129,872 49,613 35,707 650,000 165,095 650,000 0 0.00%
Total $129,872 $49,613 $35,707 $650,000 $165,095 $650,000 $0 0.00%
FTE Allotment: Certified -
Classified -
2019-20 Difference % Increase
COMMUNITY SERVICES PROGRAM (720)
CAPITAL ASSET ACQUISITION PROGRAM (810)
Program Analysis/Trends
Purchased Services increased because of increase in the Valley Ride Contract and postage for Community Education.
The process of coming into ownership, control or possession of assets intended for continued use over relatively long periods of time. This programincludes constructing or remodeling school plant facilities that are student occupied. The State Department of Education requires Districts to trackcapital expenditures that are spent on student occupied buildings separately from those that are not student occupied.
2015-16 2016-17 2017-182018-19 2018-19
Services and activities to provide non-instructional programs for the school community as a whole or some segment of the community. Included inthis program are (1) the Community Education program which provides classes for all ages, (2) the Parent Education program and (3) the Boise CityBUS program for alternative transportation for some secondary students. The Community Education and Parent Education programs generate feeswhich are recorded as revenue.
2019-20 Difference % Increase2015-16 2016-17 2017-18
2018-19 2018-19

BSD 2019-2020 Annual Budget
Financial Section Page 70
GENERAL FUND EXPENDITURES
Adopted Projected Adopted 2018-19 to 2018-19 toActual Actual Actual Budget Actual Budget 2019-20 2019-20
Salaries $0 $0 $0 $0 $0 $0 $0 0.00%Employee Benefits 0 0 0 0 0 0 0 0.00%Purchased Services 0 0 0 0 0 0 0 0.00%Supplies and Materials 0 0 0 0 0 0 0 0.00%Capital Objects 664,192 527,628 732,980 0 0 0 0 0.00%
Total $664,192 $527,628 $732,980 $0 $0 $0 $0 0.00%Program Analysis/Trends -
FTE Allotment: Certified -
Classified -Program Analysis/Trends
Adopted Projected Adopted 2018-19 to 2018-19 toActual Actual Actual Budget Actual Budget 2019-20 2019-20
Salaries $0 $0 $0 $0 $0 $0 $0 0.00%Employee Benefits 0 0 0 0 0 0 0 0.00%Purchased Services 0 0 0 0 0 0 0 0.00%Supplies and Materials 0 0 0 0 0 0 0 0.00%Capital Objects 0 0 0 0 0 0 0 0.00%Debt Retirement 0 0 0 0 0 0 0 0.00%
Total $0 $0 $0 $0 $0 $0 $0 0.00%Program Analysis/Trends -
FTE Allotment: Certified -
Classified -
CAPITAL ASSET ACQUISITION PROGRAM -NON STUDENT OCCUPIED (811)
The servicing of debt through payment of principal and interest. The District has not had debt payments since 2012-13.
2015-16 2016-17 2017-182018-19 2018-19 2019-20 Difference % Increase
DEBT SERVICE PROGRAM (910)
The process of coming into ownership, control or possession of assets intended for continued use over relatively long periods of time. This programincludes constructing or remodeling school plant facilities that are not occupied by students.
2019-20 Difference % Increase2015-16 2016-17 2017-18
2018-19 2018-19

BSD 2019-2020 Annual Budget
Financial Section Page 71
GENERAL FUND EXPENDITURES
Adopted Projected Adopted 2018-19 to 2018-19 toActual Actual Actual Budget Actual Budget 2019-20 2019-20
Salaries $0 $0 $0 $0 $0 $0 $0 0.00%Employee Benefits 0 0 0 0 0 0 0 0.00%Purchased Services 0 0 0 0 0 0 0 0.00%Supplies and Materials 0 0 0 0 0 0 0 0.00%Capital Objects 0 0 0 0 0 0 0 0.00%Interfund Transfers 3,000,000 4,500,000 4,500,000 7,357,000 10,862,000 7,357,000 0 0.00%
Total $3,000,000 $4,500,000 $4,500,000 $7,357,000 $10,862,000 $7,357,000 $0 0.00%
$201,483,016 $212,370,646 $220,535,080 $237,713,022 $241,322,340 $246,772,932 $9,059,910 3.81%
% Increase
FUND TRANSFERS (920)
Total Expenditures and Transfers Out
The transactions which withdraw money from one fund and place it in another fund. The primary transfer for the District is from the General Fund tothe Plant and Facilities Fund for a voter approved levy for maintaining facilities. For 2018-19, the District anticipates transferring addtional funds tothe Plant Facility fund to assist in construction costs for the gym additions.
2015-16 2016-17 2017-182018-19 2018-19 2018-19 Difference

BSD 2019-2020 Annual Budget
Financial Section Page 72
SalariesEmployee Benefits
Purchased Services
Supplies and Materials
Capital Outlay
Debt Service Insurance Transfers Total
2018-19 % of
Budget
2019-20 % of
Budget$42,255,698 $14,382,374 $366,100 $2,080,980 $0 $0 $0 $0 $59,085,152 24.00% 23.94%
% Program 71.52% 24.34% 0.62% 3.52% 0.00% 0.00% 0.00% 0.00%% Object 0.00% 26.53% 1.93% 19.21% 0.00% 0.00% 0.00% 0.00%
17.12% 5.83% 0.15% 0.84% 0.00% 0.00% 0.00% 0.00%41,239,591 13,805,598 534,225 2,709,655 0 0 0 0 58,289,069 23.74% 23.62%
% Program 70.75% 23.68% 0.92% 4.65% 0.00% 0.00% 0.00% 0.00%% Object 26.80% 25.47% 2.82% 25.01% 0.00% 0.00% 0.00% 0.00%
16.71% 5.59% 0.22% 1.10% 0.00% 0.00% 0.00% 0.00%2,692,951 867,398 1,500 139,602 0 0 0 0 3,701,451 1.46% 1.50%
% Program 72.75% 23.43% 0.04% 3.77% 0.00% 0.00% 0.00% 0.00%% Object 1.75% 1.60% 0.01% 1.29% 0.00% 0.00% 0.00% 0.00%
1.09% 0.35% 0.00% 0.06% 0.00% 0.00% 0.00% 0.00%
1,347,020 474,732 146,000 623,727 0 0 0 0 2,591,479 0.89% 1.05%% Program 51.98% 18.32% 5.63% 24.07% 0.00% 0.00% 0.00% 0.00%
% Object 0.88% 0.88% 0.77% 5.76% 0.00% 0.00% 0.00% 0.00%0.55% 0.19% 0.06% 0.25% 0.00% 0.00% 0.00% 0.00%
13,874,621 5,965,536 59,250 185,000 0 0 0 0 20,084,407 7.88% 8.14%% Program 69.08% 29.70% 0.30% 0.92% 0.00% 0.00% 0.00% 0.00%
% Object 9.02% 11.00% 0.31% 1.71% 0.00% 0.00% 0.00% 0.00%5.62% 2.42% 0.02% 0.07% 0.00% 0.00% 0.00% 0.00%
733,231 283,448 0 12,000 0 0 0 0 1,028,679 0.37% 0.42%% Program 71.28% 27.55% 0.00% 1.17% 0.00% 0.00% 0.00% 0.00%
% Object 0.48% 0.52% 0.00% 0.11% 0.00% 0.00% 0.00% 0.00%0.30% 0.11% 0.00% 0.00% 0.00% 0.00% 0.00% 0.00%
1,887,364 635,577 10,800 29,000 0 0 0 0 2,562,741 1.05% 1.04%% Program 73.65% 24.80% 0.42% 1.13% 0.00% 0.00% 0.00% 0.00%
% Object 1.23% 1.17% 0.06% 0.27% 0.00% 0.00% 0.00% 0.00%0.76% 0.26% 0.00% 0.01% 0.00% 0.00% 0.00% 0.00%
1,701,613 362,611 241,180 132,500 0 0 0 0 2,437,904 1.04% 0.99%% Program 69.80% 14.87% 9.89% 5.43% 0.00% 0.00% 0.00% 0.00%
% Object 1.11% 0.67% 1.27% 1.22% 0.00% 0.00% 0.00% 0.00%0.69% 0.15% 0.10% 0.05% 0.00% 0.00% 0.00% 0.00%
610,359 128,852 0 0 0 0 0 0 739,211 0.32% 0.30%% Program 82.57% 17.43% 0.00% 0.00% 0.00% 0.00% 0.00% 0.00%
% Object 0.40% 0.24% 0.00% 0.00% 0.00% 0.00% 0.00% 0.00%0.25% 0.05% 0.00% 0.00% 0.00% 0.00% 0.00% 0.00%
817,345 174,175 4,650 15,000 0 0 0 0 1,011,170 0.43% 0.41%% Program 80.83% 17.23% 0.46% 1.48% 0.00% 0.00% 0.00% 0.00%
% Object 0.53% 0.32% 0.02% 0.14% 0.00% 0.00% 0.00% 0.00%0.33% 0.07% 0.00% 0.01% 0.00% 0.00% 0.00% 0.00%
180,568 79,279 0 2,400 0 0 0 0 262,247 0.08% 0.11%% Program 68.85% 30.23% 0.00% 0.92% 0.00% 0.00% 0.00% 0.00%
% Object 0.12% 0.15% 0.00% 0.02% 0.00% 0.00% 0.00% 0.00%0.07% 0.03% 0.00% 0.00% 0.00% 0.00% 0.00% 0.00%
7,753,607 2,694,696 193,484 118,141 0 0 0 0 10,759,928 4.39% 4.36%% Program 72.06% 25.04% 1.80% 1.10% 0.00% 0.00% 0.00% 0.00%
% Object 5.04% 4.97% 1.02% 1.09% 0.00% 0.00% 0.00% 0.00%3.14% 1.09% 0.08% 0.05% 0.00% 0.00% 0.00% 0.00%
6,547,803 2,088,491 59,000 47,000 0 0 0 0 8,742,294 3.47% 3.54%% Program 74.90% 23.89% 0.67% 0.54% 0.00% 0.00% 0.00% 0.00%
% Object 4.25% 3.85% 0.31% 0.43% 0.00% 0.00% 0.00% 0.00%2.65% 0.85% 0.02% 0.02% 0.00% 0.00% 0.00% 0.00%
2,796,105 813,183 313,562 48,155 0 0 0 0 3,971,005 1.69% 1.61%% Program 70.41% 20.48% 7.90% 1.21% 0.00% 0.00% 0.00% 0.00%
% Object 1.82% 1.50% 1.65% 0.44% 0.00% 0.00% 0.00% 0.00%1.13% 0.33% 0.13% 0.02% 0.00% 0.00% 0.00% 0.00%
Preschool Exceptional Child
GENERAL FUND EXPENDITURES
Elementary
% Total BudgetSecondary
% Total BudgetAlternative
% Total BudgetVocational-Technical
% Total Budget
Exceptional Child
% Total Budget
Summary by Program and by Object
Attendance/ Guide/ Health
% Total Budget
Gifted & Talented
% Total BudgetInterscholastic
% Total BudgetSchool Activity
% Total BudgetSummer School
% Total BudgetDetention Center
% Total Budget
% Total BudgetSpecial Services
% Total BudgetInstructional Improvement
% Total Budget
BSD 2019-2020 Annual Budget
Financial Section Page 73
SalariesEmployee Benefits
Purchased Services
Supplies and Materials
Capital Outlay
Debt Service Insurance Transfers Total
2018-19 % of
Budget
2019-20 % of
Budget
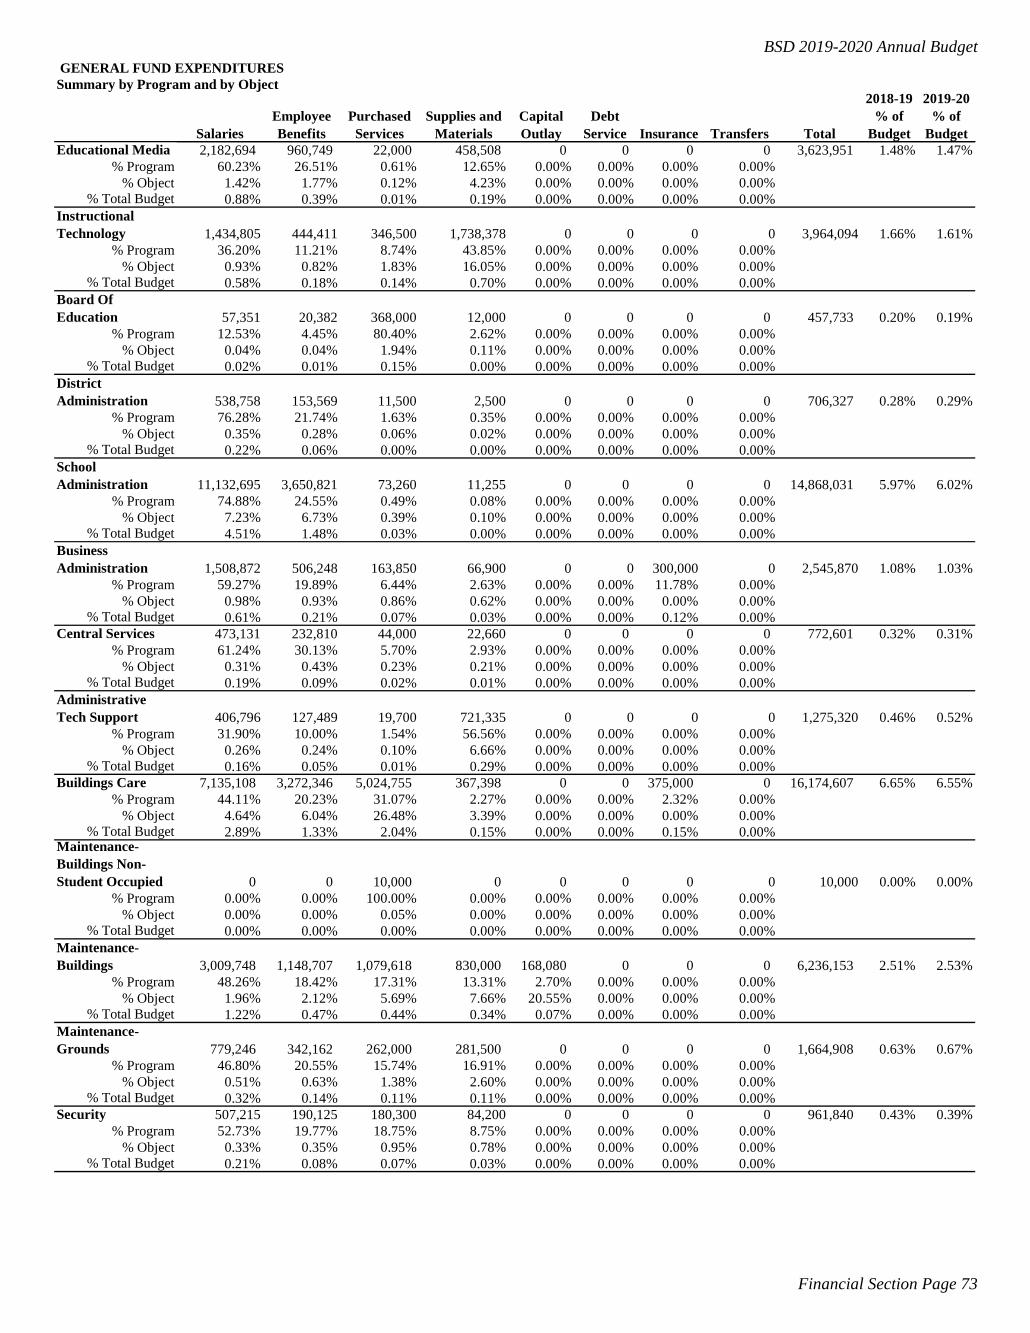
GENERAL FUND EXPENDITURESSummary by Program and by Object
2,182,694 960,749 22,000 458,508 0 0 0 0 3,623,951 1.48% 1.47%% Program 60.23% 26.51% 0.61% 12.65% 0.00% 0.00% 0.00% 0.00%
% Object 1.42% 1.77% 0.12% 4.23% 0.00% 0.00% 0.00% 0.00%0.88% 0.39% 0.01% 0.19% 0.00% 0.00% 0.00% 0.00%
1,434,805 444,411 346,500 1,738,378 0 0 0 0 3,964,094 1.66% 1.61%% Program 36.20% 11.21% 8.74% 43.85% 0.00% 0.00% 0.00% 0.00%
% Object 0.93% 0.82% 1.83% 16.05% 0.00% 0.00% 0.00% 0.00%0.58% 0.18% 0.14% 0.70% 0.00% 0.00% 0.00% 0.00%
57,351 20,382 368,000 12,000 0 0 0 0 457,733 0.20% 0.19%% Program 12.53% 4.45% 80.40% 2.62% 0.00% 0.00% 0.00% 0.00%
% Object 0.04% 0.04% 1.94% 0.11% 0.00% 0.00% 0.00% 0.00%0.02% 0.01% 0.15% 0.00% 0.00% 0.00% 0.00% 0.00%
538,758 153,569 11,500 2,500 0 0 0 0 706,327 0.28% 0.29%% Program 76.28% 21.74% 1.63% 0.35% 0.00% 0.00% 0.00% 0.00%
% Object 0.35% 0.28% 0.06% 0.02% 0.00% 0.00% 0.00% 0.00%0.22% 0.06% 0.00% 0.00% 0.00% 0.00% 0.00% 0.00%
11,132,695 3,650,821 73,260 11,255 0 0 0 0 14,868,031 5.97% 6.02%% Program 74.88% 24.55% 0.49% 0.08% 0.00% 0.00% 0.00% 0.00%
% Object 7.23% 6.73% 0.39% 0.10% 0.00% 0.00% 0.00% 0.00%4.51% 1.48% 0.03% 0.00% 0.00% 0.00% 0.00% 0.00%
1,508,872 506,248 163,850 66,900 0 0 300,000 0 2,545,870 1.08% 1.03%% Program 59.27% 19.89% 6.44% 2.63% 0.00% 0.00% 11.78% 0.00%
% Object 0.98% 0.93% 0.86% 0.62% 0.00% 0.00% 0.00% 0.00%0.61% 0.21% 0.07% 0.03% 0.00% 0.00% 0.12% 0.00%
473,131 232,810 44,000 22,660 0 0 0 0 772,601 0.32% 0.31%% Program 61.24% 30.13% 5.70% 2.93% 0.00% 0.00% 0.00% 0.00%
% Object 0.31% 0.43% 0.23% 0.21% 0.00% 0.00% 0.00% 0.00%0.19% 0.09% 0.02% 0.01% 0.00% 0.00% 0.00% 0.00%
406,796 127,489 19,700 721,335 0 0 0 0 1,275,320 0.46% 0.52%% Program 31.90% 10.00% 1.54% 56.56% 0.00% 0.00% 0.00% 0.00%
% Object 0.26% 0.24% 0.10% 6.66% 0.00% 0.00% 0.00% 0.00%0.16% 0.05% 0.01% 0.29% 0.00% 0.00% 0.00% 0.00%
7,135,108 3,272,346 5,024,755 367,398 0 0 375,000 0 16,174,607 6.65% 6.55%% Program 44.11% 20.23% 31.07% 2.27% 0.00% 0.00% 2.32% 0.00%
% Object 4.64% 6.04% 26.48% 3.39% 0.00% 0.00% 0.00% 0.00%2.89% 1.33% 2.04% 0.15% 0.00% 0.00% 0.15% 0.00%
0 0 10,000 0 0 0 0 0 10,000 0.00% 0.00%% Program 0.00% 0.00% 100.00% 0.00% 0.00% 0.00% 0.00% 0.00%
% Object 0.00% 0.00% 0.05% 0.00% 0.00% 0.00% 0.00% 0.00%0.00% 0.00% 0.00% 0.00% 0.00% 0.00% 0.00% 0.00%
3,009,748 1,148,707 1,079,618 830,000 168,080 0 0 0 6,236,153 2.51% 2.53%% Program 48.26% 18.42% 17.31% 13.31% 2.70% 0.00% 0.00% 0.00%
% Object 1.96% 2.12% 5.69% 7.66% 20.55% 0.00% 0.00% 0.00%1.22% 0.47% 0.44% 0.34% 0.07% 0.00% 0.00% 0.00%
779,246 342,162 262,000 281,500 0 0 0 0 1,664,908 0.63% 0.67%% Program 46.80% 20.55% 15.74% 16.91% 0.00% 0.00% 0.00% 0.00%
% Object 0.51% 0.63% 1.38% 2.60% 0.00% 0.00% 0.00% 0.00%0.32% 0.14% 0.11% 0.11% 0.00% 0.00% 0.00% 0.00%
507,215 190,125 180,300 84,200 0 0 0 0 961,840 0.43% 0.39%% Program 52.73% 19.77% 18.75% 8.75% 0.00% 0.00% 0.00% 0.00%
% Object 0.33% 0.35% 0.95% 0.78% 0.00% 0.00% 0.00% 0.00%0.21% 0.08% 0.07% 0.03% 0.00% 0.00% 0.00% 0.00%
District Administration
Educational Media
% Total BudgetInstructional Technology
% Total BudgetBoard Of Education
% Total Budget
Maintenance-Buildings Non-Student Occupied
% Total BudgetSchool Administration
% Total BudgetBusiness Administration
% Total BudgetCentral Services
% Total BudgetAdministrative Tech Support
% Total BudgetBuildings Care
% Total Budget
% Total BudgetMaintenance-Buildings
% Total BudgetMaintenance-Grounds
% Total BudgetSecurity
% Total Budget

BSD 2019-2020 Annual Budget
Financial Section Page 74
SalariesEmployee Benefits
Purchased Services
Supplies and Materials
Capital Outlay
Debt Service Insurance Transfers Total
2018-19 % of
Budget
2019-20 % of
Budget
GENERAL FUND EXPENDITURESSummary by Program and by Object
177,774 62,364 8,725,218 21,590 0 0 0 0 8,986,946 3.65% 3.64%% Program 1.98% 0.69% 97.09% 0.24% 0.00% 0.00% 0.00% 0.00%
% Object 0.12% 0.12% 45.99% 0.20% 0.00% 0.00% 0.00% 0.00%0.07% 0.03% 3.54% 0.01% 0.00% 0.00% 0.00% 0.00%
0 0 568,645 0 0 0 0 0 568,645 0.24% 0.23%% Program 0.00% 0.00% 100.00% 0.00% 0.00% 0.00% 0.00% 0.00%
% Object 0.00% 0.00% 3.00% 0.00% 0.00% 0.00% 0.00% 0.00%0.00% 0.00% 0.23% 0.00% 0.00% 0.00% 0.00% 0.00%
0 305,000 0 70,000 0 0 0 0 375,000 0.13% 0.15%% Program 0.00% 0.00% 0.00% 0.00% 0.00% 0.00% 0.00% 0.00%
% Object 0.00% 0.56% 0.00% 0.65% 0.00% 0.00% 0.00% 0.00%0.00% 0.12% 0.00% 0.03% 0.00% 0.00% 0.00% 0.00%
120,152 40,769 143,409 2,839 0 0 0 0 307,169 0.12% 0.12%% Program 39.12% 13.27% 46.69% 0.92% 0.00% 0.00% 0.00% 0.00%
% Object 0.08% 0.08% 0.76% 0.03% 0.00% 0.00% 0.00% 0.00%0.05% 0.02% 0.06% 0.00% 0.00% 0.00% 0.00% 0.00%
0 0 0 0 650,000 0 0 0 650,000 0.27% 0.26%% Program 0.00% 0.00% 0.00% 0.00% 100.00% 0.00% 0.00% 0.00%
% Object 0.00% 0.00% 0.00% 0.00% 79.45% 0.00% 0.00% 0.00%0.00% 0.00% 0.00% 0.00% 0.26% 0.00% 0.00% 0.00%
0 0 0 0 0 0 0 0 0 0.00% 0.00%% Program 0.00% 0.00% 0.00% 0.00% 0.00% 0.00% 0.00% 0.00%
% Object 0.00% 0.00% 0.00% 0.00% 0.00% 0.00% 0.00% 0.00%0.00% 0.00% 0.00% 0.00% 0.00% 0.00% 0.00% 0.00%
0 0 0 0 0 0 0 0 0 0.00% 0.00%% Program 0.00% 0.00% 0.00% 0.00% 0.00% 0.00% 0.00% 0.00%
% Object 0.00% 0.00% 0.00% 0.00% 0.00% 0.00% 0.00% 0.00%0.00% 0.00% 0.00% 0.00% 0.00% 0.00% 0.00% 0.00%
0 0 0 0 0 0 0 7,357,000 7,357,000 3.09% 2.98%% Program 0.00% 0.00% 0.00% 0.00% 0.00% 0.00% 0.00% 100.00%
% Object 0.00% 0.00% 0.00% 0.00% 0.00% 0.00% 0.00% 0.00%0.00% 0.00% 0.00% 0.00% 0.00% 0.00% 0.00% 2.98%
$153,902,221 $54,213,902 $18,972,506 $10,834,223 $818,080 $0 $675,000 $7,357,000 $246,772,932 100.00% 100.00%
62.37% 21.97% 7.69% 4.39% 0.33% 0.00% 0.27% 2.98% 100.00% % of Total Budget
Food Services
School Transportation
% Total BudgetActivity Transportation
% Total Budget
Total Budget by Object
% Total BudgetCommunity Services
% Total BudgetCapital Assets
% Total BudgetCapital Assets Non-Student
% Total BudgetDebt Service
% Total BudgetTransfers
% Total Budget

BSD 2019-2020 Annual Budget
Financial Section Page 75
School Name
School Enrollment 11/6/2018
Basic Allocation In-Service
Special Ed
School Lunch
ChargeableSupplies
Total Allocation
Custodial Supplies
Library Materials
Athletic Allotment Grand Total
Elementary Schools Adams 334 $15,030 $1,068 $900 $546 $3,006 20,550$ $2,225 $3,588 $0 26,363$ Amity 526 23,670 1,452 2,460 1,491 4,734 33,807 4,536 4,788 0 43,131 Collister 241 10,845 882 570 315 2,169 14,781 1,217 3,006 0 19,004 Cynthia Mann 375 16,875 1,150 1,920 1,617 3,375 24,937 3,175 3,844 0 31,956 Garfield 353 15,885 1,106 2,250 3,234 3,177 25,652 3,482 3,706 0 32,840 Grace Jordan 498 22,410 1,396 2,520 3,444 4,482 34,252 3,616 4,613 0 42,481 Hawthorne 329 14,805 1,058 2,190 2,163 2,961 23,177 2,202 3,556 0 28,935 Hidden Springs 334 15,030 1,068 900 126 3,006 20,130 2,392 5,000 0 27,522 Highlands 297 13,365 994 480 21 2,673 17,533 2,195 3,356 0 23,084 Hillcrest 356 16,020 1,112 2,340 3,003 3,204 25,679 2,032 3,725 0 31,436 Horizon 586 26,370 1,572 3,030 4,158 5,274 40,404 4,306 5,163 0 49,873 Jefferson 266 11,970 932 1,050 2,772 2,394 19,118 3,334 3,163 0 25,615 Koelsch 381 17,145 1,162 1,800 3,696 3,429 27,232 2,712 3,881 0 33,825 Liberty 520 23,400 1,440 2,010 987 4,680 32,517 3,060 4,750 0 40,327 Longfellow 341 15,345 1,082 960 630 3,069 21,086 1,733 3,631 0 26,450 Lowell 322 14,490 1,044 1,530 1,407 2,898 21,369 2,413 3,513 0 27,295 Madison ECD 59 2,655 518 1,830 0 531 5,534 1,023 0 0 6,557 Maple Grove 478 21,510 1,356 2,010 1,848 4,302 31,026 2,529 4,488 0 38,043 Monroe 314 14,130 1,028 1,170 1,617 2,826 20,771 1,829 3,463 0 26,063 Morley Nelson 578 26,010 1,556 3,150 4,452 5,202 40,370 4,536 5,113 0 50,019 Mountain View 333 14,985 1,066 1,530 1,827 2,997 22,405 1,909 3,581 0 27,895 Owyhee 214 9,630 828 1,110 1,008 1,926 14,502 2,155 2,838 0 19,495 Pierce Park 316 14,220 1,032 1,050 1,323 2,844 20,469 2,409 3,475 0 26,353 Riverside 726 32,670 1,852 2,310 924 6,534 44,290 4,423 6,038 0 54,751 Roosevelt 321 14,445 1,042 990 651 2,889 20,017 1,930 3,506 0 25,453 Shadow Hills 560 25,200 1,520 2,430 2,184 5,040 36,374 3,946 5,000 0 45,320 Trail Wind 640 28,800 1,680 1,890 546 5,760 38,676 3,781 5,500 0 47,957 Valley View 405 18,225 1,210 990 1,974 3,645 26,044 2,587 4,031 0 32,662 Washington 307 13,815 1,014 1,170 294 2,763 19,056 2,114 3,419 0 24,589 White Pine 504 22,680 1,408 2,340 2,268 4,536 33,232 2,701 4,650 0 40,583 Whitney 617 27,765 1,634 2,700 4,872 5,553 42,524 4,617 5,356 0 52,497 Whittier 515 23,175 1,430 1,260 3,570 4,635 34,070 4,536 4,719 0 43,325 W.H. Taft 310 13,950 1,020 1,800 3,339 2,790 22,899 3,905 3,438 0 30,242 Elementary - 32, Pre-School - 1
Totals 13,256 $596,520 $39,712 $56,640 $62,307 $119,304 $874,483 $95,560 $131,898 $0 $1,101,941Secondary SchoolsEast Junior 748 $38,896 $1,896 $1,920 $1,806 $0 44,518$ $5,290 $6,175 $6,500 62,483$ Fairmont Junior 809 42,068 2,018 3,810 5,061 0 52,957 6,414 6,556 6,500 72,427 Hillside Junior 659 34,268 1,718 2,250 3,171 0 41,407 5,946 5,619 6,500 59,472 Les Bois Junior 771 40,092 1,942 1,560 1,890 0 45,484 5,269 6,319 6,500 63,572 North Junior 978 50,856 2,356 1,860 2,352 0 57,424 5,394 7,613 6,500 76,931
Riverglen Junior & TVMSC 683 35,516 1,766 2,520 2,163 0 41,965 5,507 7,438 6,500 61,410 South Junior 690 35,880 1,780 2,640 4,641 0 44,941 5,353 5,813 6,500 62,607 West Junior 866 45,032 2,132 2,370 3,129 0 52,663 6,934 6,913 6,500 73,010
Totals 6,204 $322,608 $15,608 $18,930 $24,213 $0 $381,359 $46,107 $52,446 $52,000 $531,912Boise Senior 1,510 $78,520 $3,420 $3,600 $3,255 $0 88,795$ $11,724 $10,938 $30,000 141,457$ Borah Senior 1,533 79,716 3,466 4,260 6,468 0 93,910 13,441 11,081 30,000 148,432 Capital Senior 1,327 69,004 3,054 4,860 5,103 0 82,021 9,733 9,794 30,000 131,548 Timberline Senior 1,380 71,760 3,160 3,120 2,625 0 80,665 10,553 10,125 30,000 131,343 Frank Church Senior 408 21,216 1,216 3,510 4,410 7,000 37,352 7,152 6,500 0 51,004
Totals 6,158 $320,216 $14,316 $19,350 $21,861 $7,000 $382,743 $52,603 $48,438 $120,000 $603,784
All Total 25,618 $1,239,344 $69,636 $94,920 $108,381 $126,304 $1,638,585 $194,270 $232,782 $172,000 $2,237,637
GENERAL FUND EXPENDITURES 2019-20 School Supply Allocations
Sr. High Schools - 5
Jr. High Schools - 8
Schools are allocated money for supplies, equipment, field trips and professional development based on fall enrollment, number of special education students and the freeand reduced lunch populations. Budget Officers for each school determine how the money should be budgeted within their own school buildings. Enrollment totals do notinclude all Special Programs, i.e. Professional Tech., and Dual Enrolled

BSD 2019-2020 Annual Budget
Financial Section Page 76
SPECIAL REVENUE, DEBT SERVICE and CAPITAL FUNDS
RevenuesBudget2018-19
Budget2019-20
Amount ofChange
Percent ofChange
Local Revenue $22,900,336 $24,994,800 $2,094,464 9.15%State Revenue 5,916,054 5,783,431 -132,623 -2.24%Federal Revenue 21,559,597 20,172,546 -1,387,051 -6.43%Other Sources 7,357,000 79,857,000 72,500,000 985.46%Use of Fund Balance 38,160,293 1,092,500 -37,067,793 -97.14%
Total Revenues $95,893,280 $131,900,277 36,006,997 37.55%
The following schedule shows the District’s total budgeted special revenue, debt service and capital project fund revenues for the current year.
Local Revenue18.95%
State Revenue4.38%
Federal Revenue15.29%
Other Sources60.54%
Use of Fund Balance0.83%
Percent of Total 2019-20 All Other Funds Revenue Budget

BSD 2019-2020 Annual Budget
Financial Section Page 77
SPECIAL REVENUE, DEBT SERVICE and CAPITAL FUNDS
ExpendituresBudget2018-19
Budget2019-20
Amount ofChange
Percent ofChange
Salaries $14,195,260 $14,285,687 $90,427 0.64%Benefits 5,563,531 5,533,582 -29,949 -0.54%Purchased Services 6,361,551 5,967,911 -393,640 -6.19%Supplies & Materials 8,054,234 7,038,837 -1,015,397 -12.61%Capital Outlay 40,350,000 34,941,922 -5,408,078 -13.40%Debt Retirement 13,261,550 16,388,050 3,126,500 23.58%Insurance & Judgments 2,300 4,000 1,700 73.91%Transfers 309,838 296,093 -13,745 -4.44%Unappropriated Fund Balance 7,795,016 47,444,195 39,649,179 508.65%
Total Expenditures $95,893,280 $131,900,277 $36,006,997 37.55%
The following schedule shows the District’s total budgeted special revenue, debt service and capital project fund expenditures for the current year.
Salaries10.83%Benefits
4.20%
Purchased Services4.52%
Supplies & Materials5.34%
Capital Outlay26.49%
Debt Retirement12.42% Transfers
0.22%
Unappropriated Fund Balance35.97%
Percent of Total 2019-20 All Other Fund Expenditures Budget

BSD 2019-2020 Annual Budget
Financial Section Page 78
SPECIAL REVENUE FUNDS
Actual Actual Actual Budget BudgetTotal Estimated Revenues $24,153 $1,349 $18,021 $2,000 $2,000 $0 0.00%
Fund Balance Ending $311,308 $312,657 $330,678 $332,678 $334,678Program Analysis/Trends -
Revenues Actual Actual Actual Budget BudgetStudent Fees $1,855,818 $1,708,415 $1,786,804 $1,787,420 $1,683,447 -$103,973 -5.82%Interest Income 1,542 3,210 6,278 4,316 9,171 4,855 112.49%Revenue from Federal Sources 0 0 0 0 0 0 0.00%Use of Fund Balance 0 0 0 0 0 0 0.00%
Total Estimated Revenues $1,857,360 $1,711,625 $1,793,082 $1,791,736 $1,692,618 -$99,118 -5.53%Expenditures
Salaries $1,121,220 $1,023,142 $1,075,157 $1,112,080 $1,056,780 -$55,300 -4.97%Employee Benefits 405,930 342,897 310,744 373,461 304,315 -69,146 -18.51%Purchased Services 38,389 70,593 55,326 101,752 104,165 2,413 2.37%Supplies 158,275 133,371 159,444 165,200 140,914 -24,286 -14.70%Indirect Costs 49,992 47,189 43,559 37,536 35,352 -2,184 -5.82%Capital Asset Program 275,850 317,974 290,274 150,000 0 -150,000 -100.00%
Total Estimated Revenues $2,049,656 $1,935,166 $1,934,504 $1,940,029 $1,641,526 -$298,503 -15.39%Fund Balance Ending $1,437,888 $1,214,347 $1,072,925 $924,632 $975,724
Program Analysis/Trends -
Special revenue funds are used to account for specific local, state, or federal revenues that are restricted by law or regulated as to the type of expenditures allowed.
An actual budget is presented for those special revenue funds which are controlled by the District within broad guidelines. However, for a number of funds that are controlled by grant application documents prescribed by a state or federal agency, only an estimate of the funding to be provided is available at this time. The specific budget categories for these funds will be determined in accordance with grant provisions or specific laws or regulations in conjunction with the state or federal agency providing the funds.
Grants from state and federal agencies may be subject to compliance reviews by the state or federal agency. In addition, these grants are subject to review by the external auditors in accordance with the Uniform Single Audit Act.
A separate Federal Forest Fund is required to account for revenues by the Secure Rural Schools and Community Self Determination Act (also known asthe Craig-Wyden Bill). The federal government appropriates dollars to States where federal forest funds used to be generated for the sale of timber onfederal lands. These funds may be expended for the purchase of school sites or the construction and remodeling of school buildings. The District hasapproximately $330,678 available in this fund for capital construction.
2015-16 2016-17 2017-18 2018-19 2019-20Change % Change
FEDERAL FOREST FUND (220)
The District offers a year round before and after school child care program. The District will operate 13 school age programs at various elementaryschools and serves approximately 700 students. The program is designed to be self-supporting through user fees. The 2019-20 school year tuition rates will increase by 4.9%.
2015-16 2016-17 2017-18 2018-19 2019-20Change % Change

BSD 2019-2020 Annual Budget
Financial Section Page 79
SPECIAL REVENUE FUNDS
Revenues Actual Actual Actual Budget BudgetTransfer from General Fund $0 $0 $0 $0 $0 $0 0.00%Use of Fund Balance 11,225 38,076 0 150,000 150,000 0 0.00%
Total Estimated Revenues $11,225 $38,076 $0 $150,000 $150,000 $0 0.00%Expenditures
Salaries $0 $35,189 $0 $0 $0 $0 0.00%Employee Benefits 0 2,887 0 0 0 0 0.00%Purchased Services 11,225 0 0 150,000 150,000 0 0.00%Supplies 0 0 0 0 0 0 0.00%
Total Estimated Expenditures $11,225 $38,076 $0 $150,000 $150,000 $0 0.00%Fund Balance Ending $386,646 $348,570 $348,570 $198,570 $48,570
Program Analysis/Trends -
Revenues Actual Actual Actual Budget BudgetMedicaid Billings $397,284 $441,501 $584,635 $450,000 $560,000 $110,000 24.44%Use of Fund Balance 0 0 0 0 0 0 0.00%
Total Estimated Revenues $397,284 $441,501 $584,635 $450,000 $560,000 $110,000 24.44%Expenditures
Salaries $148,489 $165,093 $160,920 $156,765 $174,882 $18,117 11.56%Employee Benefits 58,825 55,715 59,922 65,810 68,361 2,551 3.88%Purchased Services 167,415 142,693 126,397 187,425 162,000 -25,425 -13.57%Supplies 205 127,991 47,202 40,000 40,000 0 0.00%
Total Estimated Expenditures $374,934 $491,492 $394,441 $450,000 $445,243 -$4,757 -1.06%Fund Balance Ending $1,372,393 $1,322,402 $1,512,596 $1,512,596 $1,627,353
Program Analysis/Trends
% Change
2015-16
2020 STRATEGIC PLAN FUND (235)
MEDICAID FUND (236)
2015-16 2016-17 2017-18 2018-19 2019-20
2016-17 2017-18
In October 2000, the Board of Trustees established a fund to assist with the implementation of the District's Strategic Plan. The initial contribution tothis fund was $907,875. During the 2019-20 school year, funds will be used to assist in implementing the Strategic Plan priorities which include thecontinuation of the marketing/communication plan. This fund had $348,570 as of July 1, 2018.
This fund was established to account for monies associated with billing the State of Idaho for Medicaid services. The District requires that the first$400,000 of billing receipts be recorded in the general fund. Any amounts above this minimum are recorded in the Medicaid fund to support billingcosts, and provide additional staff and resources to the special education program. The District is paid approximately 61% of the each approved billingamount. The State of Idaho requires District's to cover the State match portion of the billing. This fund covers the cost of three Medicaid billing clerks,two special education assistants, a private duty nurse and a portion of a speech language pathologist. This fund also pays for contracted nursingservices and the lease costs for the STEP program operated on Vista Avenue.
2018-19 2019-20Change % Change
Change

BSD 2019-2020 Annual Budget
Financial Section Page 80
SPECIAL REVENUE FUNDS
Actual Actual Actual Budget BudgetTotal Estimated Revenues $13,500 $223,733 $264,432 $243,000 $252,232 $9,232 3.80%
ExpendituresSalaries $122,895 $130,039 $168,038 $121,340 $137,459 $16,119 13.28%Employee Benefits 37,844 47,541 57,248 60,660 53,773 -6,887 -11.35%Purchased Services 2,506 65 5,993 14,000 14,000 0 0.00%Supplies 1,250 43,944 30,824 45,000 45,000 0 0.00%Indirect Costs 46,637 2,145 2,327 2,000 2,000 0 0.00%
Total Estimated Expenditures $211,132 $223,733 $264,430 $243,000 $252,232 $9,232 3.80%Program Analysis/Trends
Revenues Actual Actual Actual Budget BudgetState Assistance $81,500 $82,834 $86,813 $90,000 $86,250 -$3,750 -4.17%Student Fees 154,771 154,177 167,367 165,600 175,950 10,350 6.25%Sale of Assets 0 15,878 0 0 0 0 0.00%
Total Estimated Revenues $236,271 $252,889 $254,180 $255,600 $262,200 $6,600 2.58%Secondary Programs ExpendituresSalaries $126,457 $148,956 $148,381 $148,352 $154,535 $6,183 4.17%Employee Benefits 17,932 21,536 21,369 30,749 41,983 11,234 36.53%Purchased Services 3,690 3,771 2,200 2,400 2,400 0 0.00%Supplies 40,180 8,761 23,588 20,300 13,900 -6,400 -31.53%Capital Outlay 0 15,087 0 0 0 0 0.00%Insurance 5,801 5,975 6,094 2,300 4,000 1,700 73.91%
Salaries 44,502 37,038 38,608 40,577 35,349 -5,228 -12.88%Employee Benefits 5,994 4,515 5,514 8,410 8,947 537 6.39%Purchased Services 0 0 0 0 0 0 0.00%Supplies 2,607 2,521 3,098 1,000 1,000 0 0.00%
Total Estimated Expenditures $247,163 $248,160 $248,852 $254,088 $262,114 $8,026 3.16%Fund Balance Ending $6,751 $11,480 $16,808 $18,320 $18,406
2015-16
This fund is established to manage small local grants received by the District. The 2019-20 school year budget includes grants from City of Boise forhomeless prevention ($35,000) and the partnership for the preschools offered at Whitney and Hawthorne Elementary Schools ($191,000) , Idaho DrugPrevention Office ($16,000) and special local foundations ($10,000). Grants are usually managed by the school that was awarded the grant.
2015-16 2016-17 2017-18 2018-19 2019-20Change % Change
Instructional Support Programs Expenditures
% Change
The District provides Driver Education programs throughout the year. The summer program has approximately 300 students. The fall thru spring programs haveapproximately 420 students. Each student enrolled in the program must complete 30 hours of classroom instruction, 6 hours of actual driving and 11 hours ofobservation. The District is running twelve classes at one site during the summer of 2019. The District runs fifteen classes at five sites from September thru May.These classes are operated at four high schools and one junior high school.The State of Idaho provides up to $125 per student in funding for this program. The remaining costs are covered by fees charged to the students. The District willcharge $255 per student This program is fully funded by user fees and state reimbursement
GENERAL LOCAL GRANTS FUND (238)
DRIVER EDUCATION FUND (241)
2016-17 2017-18 2018-19 2019-20Change
The City of Boise has continued with the preschool support for 2019-20.

BSD 2019-2020 Annual Budget
Financial Section Page 81
SPECIAL REVENUE FUNDS
State Foundation Grants Actual Actual Actual Budget BudgetTotal Estimated Revenues $510,578 $475,003 $584,008 $577,000 $557,796 -$19,204 -3.33%
ExpendituresSalaries $343,085 $274,315 $353,023 $366,112 $364,824 -$1,288 -0.35%Employee Benefits 124,597 120,273 128,510 157,288 160,461 3,173 2.02%Purchased Services 27,201 30,272 60,661 30,000 24,377 -5,623 -18.74%Supplies 10,837 43,612 34,958 15,000 0 -15,000 -100.00%Indirect Costs 4,858 6,531 6,856 8,600 8,134 -466 -5.42%
Total Estimated Expenditures $510,578 $475,003 $584,008 $577,000 $557,796 -$19,204 -3.33%Program Analysis/Trends -
State Foundation Grants Actual Actual Actual Budget BudgetTotal Estimated Revenues $0 $11,770 $107,131 $44,000 $42,774 -$1,226 -2.79%
ExpendituresSalaries $0 $180 $9,585 $0 $0 $0 0.00%Employee Benefits 0 15 786 0 0 0 0.00%Purchased Services 0 9,797 65,941 44,000 42,774 -1,226 -2.79%Supplies 0 1,778 30,819 0 0 0 0.00%Indirect Costs 0 0 0 0 0 0 0.00%
Total Estimated Expenditures $0 $11,770 $107,131 $44,000 $42,774 -$1,226 -2.79%Program Analysis/Trends -
LIMITED ENGLISH PROFICIENT FUND (244)
% Change
GIFTED AND TALENTED FUND (244)
The State is providing funds to support the Limited English Proficiency (LEP) program. The grant award is based on the number of Limited EnglishProficient students tested on the 2019 Spring ACCESS test times $230. The District tested 2,399 eligible LEP students in April 2019 The prior yearcount was 2,308. The District uses these funds to pay for salaries and benefits for 1.2 certified teachers and 9.7 tutors and interpreters to assist in theLEP programs. The Idaho Legislature appropriated $4.8 million for 2019-20.
The Idaho Legislature allocated $1,000,000 to be distributed by the Superintendent of Public Instruction for professional training and screening forgifted and talented students and instructors. Funding will be distributed based on a formula prescribed by the Superintendent of Public Instruction thatincludes a base amount and an amount based on the number of identified gifted and talented students. The State has directed District's to budget $3,000per school district or charter school, plus $28 per 2019-2020 identified gifted/talented student, limited to 6% of total enrollment. Boise School Districthas 724 gifted and talented students identified in grades 1-6 as of March 2019. When you include the secondary students, the District is paid at the maxof 6% of total enrollment.
2015-16 2016-17 2017-18 2018-19 2019-20Change % Change
2015-16 2016-17 2017-18 2018-19 2019-20Change

BSD 2019-2020 Annual Budget
Financial Section Page 82
SPECIAL REVENUE FUNDS
Actual Actual Actual Budget BudgetTotal Estimated Revenues $1,328,260 $1,563,530 $1,982,600 $2,446,000 $2,368,379 -$77,621 -3.17%
Expenditures Salaries $0 $0 $0 $0 $0 $0 0.00%Employee Benefits 0 0 0 0 0 0 0.00%Purchased Services 0 14,700 4,511 250,000 250,000 0 0.00%Supplies 1,328,260 1,548,830 1,978,089 2,196,000 2,118,379 -77,621 -3.53%
Total Estimated Expenditures $1,328,260 $1,563,530 $1,982,600 $2,446,000 $2,368,379 -$77,621 -3.17%Program Analysis/Trends -
Actual Actual Actual Budget BudgetTotal Estimated Revenues $316,279 $262,940 $340,968 $314,000 $281,000 -$33,000 -10.51%
ExpendituresSalaries $133,190 $135,700 $142,268 $122,619 $101,485 -$21,134 -17.24%Employee Benefits 40,408 43,166 43,152 41,381 39,515 -1,866 -4.51%Purchased Services 28,109 9,176 7,340 0 0 0 0.00%Supplies 114,572 74,898 148,208 150,000 140,000 -10,000 -6.67%Indirect Costs 0 0 0 0 0 0 0.00%
Total Estimated Expenditures $316,279 $262,940 $340,968 $314,000 $281,000 -$33,000 -10.51%Program Analysis/Trends -
PUBLIC SCHOOL TECHNOLOGY FUND (245)
STATE TOBACCO TAX FUND (246)
2015-16 2016-17 2017-18 2018-19 2019-20Change % Change
The Idaho Legislature assessed a tax on tobacco products and allocated a portion of the funds from this tax to be used to provide education for theprevention of tobacco use. This funding has been in place since 1996-97. During the recession these funds were eliminated. The Legislature returned100% of these funds to Districts as of 2015-16 to use for substance abuse prevention and safety and security needs. The District utilizes these funds topay for 1.4 counselors and purchase safety equipment for schools.
Change % Change
The Idaho legislature passed school reform legislation that appropriates money to school Districts to be used on classroom technology, classroomtechnology infrastructure and information management software. For the 2019-20, the Idaho Legislature appropriated $36,500,000 to be allocated fortechnology. Districts were instructed to budget $100 per average daily attendance (ADA) for next year and a base grant of $36,000. It is estimated theDistrict will receive around $2,368,379 to be spent on technology equipment, infrastructure and software. The District will allocate $250,000 of thistotal award for the support of a District-wide instructional management system (IMS).
2015-16 2016-17 2017-18 2018-19 2019-20

BSD 2019-2020 Annual Budget
Financial Section Page 83
SPECIAL REVENUE FUNDS
Actual Actual Actual Budget BudgetTotal Estimated Revenues $4,786,255 $5,146,131 $4,897,900 $4,732,804 $4,674,100 -$58,704 -1.24%
Expenditures Salaries $2,819,672 $2,983,156 $2,977,247 $3,312,963 $3,352,931 $39,968 1.21%Employee Benefits 1,087,203 1,203,712 1,138,016 1,004,898 1,001,525 -3,373 -0.34%Purchased Services 251,940 234,477 318,014 95,000 100,000 5,000 5.26%Supplies 568,671 652,724 398,515 250,000 150,000 -100,000 -40.00%Indirect Costs 58,769 72,062 66,108 69,943 69,644 -299 -0.43%
Total Estimated Expenditures $4,786,255 $5,146,131 $4,897,900 $4,732,804 $4,674,100 -$58,704 -1.24%Program Analysis/Trends -
Actual Actual Actual Budget BudgetTotal Estimated Revenues $142,862 $134,556 $133,421 $20,751 $18,386 -$2,365 -11.40%
ExpendituresSalaries $95,876 $86,685 $88,952 $16,211 $14,185 -$2,026 -12.50%Employee Benefits 38,209 40,303 38,425 4,540 4,201 -339 -7.47%Purchased Services 5,775 5,600 4,200 0 0 0 0.00%Supplies 1,168 0 0 0 0 0 0.00%Indirect Costs 1,834 1,968 1,842 0 0 0 0.00%
Total Estimated Expenditures $142,862 $134,556 $133,419 $20,751 $18,386 -$2,365 -11.40%Program Analysis/Trends
TITLE I-A ESEA IMPROVING BASIC PROGRAMS FUND (251)
TITLE I-D ESEA NEGLECTED AND DELINQUENT CHILDREN FUND (255)
2015-16 2016-17 2017-18 2018-19 2019-20Change % Change
Title I-A provides financial assistance to the District to meet the academic needs of educationally disadvantaged children in targeted schools. Included withthese funds is an obligation to provide services to private schools located within the District. The District allocates Title I dollars to private schools whichhave a socio-economic status of 50% or more low income students to use on school-wide projects. Currently thirteen district schools qualify for Title Ifunding in 2019-20. The funded schools use the money to hire tutors and certified teachers to assist students in areas of reading and mathematics. TheFederal Government determines the allocation to the District based on census poverty data. Allocations to the schools are based on the % of students reportedas part of the Community Eligibility Program (CEP) or the % reported as USDA free and reduced. The District has some flexibility to determine the povertyparameters for schools to qualify for school allocations.
% Change
Amounts have been reduced due to changes in reporting students that are enrolled at Marian Pritchett and Victory Academy. The number of students being incarcerated at the JDC has decreased over the last two years.
The Neglected and Delinquent grant is a sub-grant of the Title I-D ESEA project in the District. This grant is used to supplement the instructionalactivities at the Ada County Juvenile Detention Center (JDC). Adjudicated and delinquent youth are provided educational opportunities as theycomplete their court ordered sentence. The District uses these funds to pay for a .50 FTE academic interventionist at the JDC. The award amount isbased on the number of students living or placed at the JDC. This grant has been reduced as the number of student incarcerated at the JDC hasdecreased considerably over the last two years and Marian Pritchett no longer qualifies for any Delinquent funds.
2015-16 2016-17 2017-18 2018-19 2019-20Change

BSD 2019-2020 Annual Budget
Financial Section Page 84
SPECIAL REVENUE FUNDS
Actual Actual Actual Budget BudgetRevenues $4,810,246 $4,964,942 $5,049,540 $4,904,902 $4,851,245 -$53,657 -1.09%
Carryover Revenues 650,000 723,387 73,387 11.29%Total Estimated Revenues $4,810,246 $4,964,942 $5,049,540 $5,554,902 $5,574,632 $19,730 0.36%
ExpendituresSalaries $3,058,489 $3,186,391 $3,313,178 $3,463,741 $3,530,404 $66,663 1.92%Employee Benefits 1,501,152 1,511,412 1,458,674 1,739,226 1,730,145 -9,081 -0.52%Purchased Services 140,781 150,101 151,394 195,000 195,000 0 0.00%Supplies 48,889 46,423 58,297 73,612 46,000 -27,612 -37.51%Indirect Costs 60,935 70,615 67,997 83,323 73,083 -10,240 -12.29%
Total Estimated Expenditures $4,810,246 $4,964,942 $5,049,540 $5,554,902 $5,574,632 $19,730 0.36%Program Analysis/Trends -
Actual Actual Actual Budget BudgetRevenues $224,359 $229,335 $237,715 $213,750 $215,500 $1,750 0.82%
Carryover Revenues 0 0 0 50,511 54,071 3,560 7.05%Total Estimated Revenues $224,359 $229,335 $237,715 $264,261 $269,571 $5,310 2.01%
ExpendituresSalaries $134,950 $139,695 $153,890 $157,175 $163,032 $5,857 3.73%Employee Benefits 86,424 86,251 79,922 98,286 100,023 1,737 1.77%Purchased Services 0 0 621 0 2,500 2,500 0.00%Supplies 106 0 0 5,000 0 -5,000 -100.00%Indirect Costs 2,879 3,389 3,282 3,800 4,016 216 5.68%
Total Estimated Expenditures $224,359 $229,335 $237,715 $264,261 $269,571 $5,310 2.01%Program Analysis/Trends -
2019-20Change % Change
Title VI-B Preschool funds are provided under the Individuals with Disabilities Education Act (IDEA). These funds are to be used to supplement stateand local funds for the education of three-to-five year old students with disabilities. In order to continue to receive these funds, the District mustdemonstrate that it has maintained or increased the state and local funding for the education of preschool students with disabilities each year. These arefederal funds administered by the State Department of Education in accordance with federal regulations. The District uses these funds to pay for 8special education assistants.
2015-16 2016-17 2017-18 2018-19
TITLE VI-B FUND (257)
TITLE VI-B PRESCHOOL FUND (258)
2015-16 2016-17 2017-18 2018-19 2019-20Change % Change
Title VI-B funds are provided under the Individuals with Disabilities Education Act (IDEA). These funds are to be used to supplement state and local funds for theeducation of students with disabilities. In order to continue to receive these funds, the District must demonstrate that it has maintained or increased the state and localfunding for the education of students with disabilities each year. These are federal funds administered by the State Department of Education in accordance withfederal regulations. Each year the District reports the number of eligible students to the State Department of Education. In November 2018, the District reported3,179 special education students that qualify for Title VI-B funding. The District uses these funds to pay for approximately 97 special education assistants, 14certified teachers, 2 clerical positions, 3 consulting teachers, and 4 special education supervisors. The District also budgets for supplies, purchased services andsoftware contracts. Approximately $51,000 of the allocation is also passed thru to Anser Charter School since they are chartered by the District. Anser reported 34special education students.

BSD 2019-2020 Annual Budget
Financial Section Page 85
SPECIAL REVENUE FUNDS
Revenues Actual Actual Actual Budget BudgetFederal Sources $0 $0 $82,857 $354,486 $424,585 $70,099 19.77%
Total Estimated Revenues $0 $0 $82,857 $354,486 $424,585 $70,099 19.77%Expenditures
Salaries $0 $0 $56,178 $140,915 $298,668 $157,753 111.95%Employee Benefits 0 0 26,679 75,835 121,672 45,837 60.44%Purchased Services 0 0 0 50,000 0 -50,000 -100.00%Supplies 0 0 0 82,419 0 -82,419 -100.00%Indirect Costs 0 0 0 5,317 4,245 -1,072 -20.16%
Total Estimated Expenditures $0 $0 $82,857 $354,486 $424,585 $70,099 19.77%Program Analysis/Trends -
Actual Actual Actual Budget BudgetTotal Estimated Revenues $265,985 $267,813 $278,228 $277,638 $327,000 $49,362 17.78%
ExpendituresSalaries $14,321 $13,307 $0 $18,589 $15,000 -$3,589 -19.31%Employee Benefits 1,249 1,240 0 3,346 3,300 -46 -1.37%Purchased Services 35,168 32,925 28,713 25,000 25,000 0 0.00%Supplies 215,247 220,341 249,515 230,703 283,700 52,997 22.97%Capital Assets 0 0 0 0 0 0 0.00%
Total Estimated Expenditures $265,985 $267,813 $278,228 $277,638 $327,000 $49,362 17.78%Program Analysis/Trends -
The Carl Perkins Vocational Education funds are administered by the Idaho Division of Professional Technical Education in accordance with the CarlPerkins Act of 1990. The emphasis of the program is to provide funding to modernize and expand professional technical programs. This includespurchasing new equipment in the High School Pre-Engineering Program and updating of technology equipment in Junior High Schools. Funding fromthis grant funds stipends paid to teachers that work on updating curriculum to meet the academic standards. This budget allocation is not available asof May 2019.
CARL PERKINS IIC VOCATIONAL EDUCATION FUND (263)
2015-16 2016-17 2017-18 2018-19 2019-20Change % Change
TITLE IV-A STUDENT SUPPORT AND ACADEMIC ENRICHMENT FUND (260) The Title IV-A includes a grant that is part of the National Every Student Succeeds Act (ESSA). Part A, Student Support and Academic EnrichmentsGrants authorizes three activity areas. The District plan is to focus on the area of supporting safe and healthy students (e.g. school mental health, drugand violence prevention, training on trauma-informed practices, health and physical education).
The District expects to receive approximately $424,000 to support student needs by providing services in the Community Centers located in sixlocations throughout the District. Money will be used to pay for six community school coordinators and the Strategic Planning coordinator for allcommunity schools.
2015-16 2016-17 2017-18 2018-19 2019-20Change % Change

BSD 2019-2020 Annual Budget
Financial Section Page 86
SPECIAL REVENUE FUNDS
Actual Actual Actual Budget BudgetRevenues $216,578 $209,970 $327,726 $252,418 $252,731 $313 0.12%
Carryover Revenues 0 0 0 0 0 0 0.00%Total Estimated Revenues $216,578 $209,970 $327,726 $252,418 $252,731 $313 0.12%
ExpendituresSalaries $110,239 $131,116 $161,166 $168,362 $163,334 -$5,028 -2.99%Employee Benefits 57,107 65,886 74,732 80,326 83,767 3,441 4.28%Purchased Services 11,681 2,922 48,184 0 0 0 0.00%Supplies 34,951 6,946 39,209 0 2,944 2,944 0.00%Indirect Costs 2,600 3,100 4,435 3,730 2,686 -1,044 -27.99%
Total Estimated Expenditures $216,578 $209,970 $327,726 $252,418 $252,731 $313 0.12%Program Analysis/Trends -
Actual Actual Actual Budget BudgetTotal Estimated Revenues $1,145,422 $949,381 $752,313 $696,527 $701,541 $5,014 0.72%
ExpendituresSalaries $767,185 $543,224 $463,441 $567,959 $503,900 -$64,059 -11.28%Employee Benefits 137,479 136,954 129,094 117,615 152,094 34,479 29.32%Purchased Services 182,507 196,221 132,141 506 35,257 34,751 6867.79%Supplies 41,706 59,803 17,699 0 0 0 0.00%Indirect Costs 16,545 13,179 9,938 10,447 10,290 -157 -1.50%
Total Estimated Expenditures $1,145,422 $949,381 $752,313 $696,527 $701,541 $5,014 0.72%Program Analysis/Trends -
TITLE III-A ESEA LANGUAGE INSTRUCTION FOR LEP FUND (264) The Title III-A is a grant that is part of the ESSA . The grant focus is on helping Limited English Proficient (LEP) students reach standards. TheDistrict will utilize these funds to pay for 6 full time tutors, interpreters and summer school expenditures. Each District's allocation is based on theprevious year's LEP count. The amount estimated for 2019-20 is $252,000. In addition to the normal Title III-A funding, the federal government alsoappropriates money to Districts that have a large influx of LEP students in a one year period. This funding is referred to as Emergency ImmigrantFunding and is based on students that have been in the country for less than one year. The District reported 177 students for this funding. The Districtmay not receive any emergency funds for 2019-20.
2015-16 2016-17 2017-18 2018-19 2019-20Change % Change
TITLE II-A IMPROVING TEACHER QUALITY FUND (272)
2015-16 2016-17 2017-18 2018-19 2019-20Change % Change
The Title II-A Program Improvement is used in the District for professional development for administrators, teachers and para-professional personnel.The Title II professional development activities will consist of the use of peer assistants and instructional coaches to improve instruction andprofessional development opportunities for teachers and administrators. Per federal guidelines, a portion of these dollars must be allocated to privateschools located within the District boundaries.

BSD 2019-2020 Annual Budget
Financial Section Page 87
SPECIAL REVENUE FUNDS
Revenues Actual Actual Actual Budget BudgetFederal Sources $128,183 $63,499 $48,169 $222,810 $180,000 -$42,810 -19.21%State Sources 0 0 0 0 0 0 0.00%
Total Estimated Revenues $128,183 $63,499 $48,169 $222,810 $180,000 -$42,810 -19.21%Expenditures
Salaries $50,996 $0 $0 $0 $0 $0 0.00%Employee Benefits 32,595 -7 0 0 0 0 0.00%Purchased Services 42,210 61,957 46,994 219,468 176,658 -42,810 -19.51%Supplies 0 0 0 0 0 0 0.00%Indirect Costs 2,382 1,549 1,175 3,342 3,342 0 0.00%
Total Estimated Expenditures $128,183 $63,499 $48,169 $222,810 $180,000 -$42,810 -19.21%Program Analysis/Trends -
Actual Actual Actual Budget BudgetTotal Estimated Revenues $116,781 $150,525 $132,028 $120,000 $107,000 -$13,000 -10.83%
ExpendituresSalaries $75,591 $93,291 $83,310 $81,500 $51,000 -$30,500 -37.42%Employee Benefits 32,712 35,382 27,107 21,700 29,780 8,080 37.24%Purchased Services 2,851 1,603 1,481 0 0 0 0.00%Supplies 4,153 18,290 18,307 15,000 25,000 10,000 66.67%Indirect Costs 1,474 1,959 1,823 1,800 1,220 -580 -32.22%
Total Estimated Expenditures $116,781 $150,525 $132,028 $120,000 $107,000 -$13,000 -10.83%Program Analysis/Trends -
DIVISON OF VOCATIONAL REHABILITATION TRAINING GRANT (287)
GENERAL MISC. FEDERAL GRANTS FUND (289)
2015-16 2016-17 2017-18 2018-19 2019-20Change % Change
The Boise School District has entered into an agreement with the Division of Vocational Rehabilitation to provide training dollars for eligible studentsto obtain work based learning opportunities. The work opportunities must provide workplace readiness training and job instruction in self advocacy.The program has a budget for approximately 120 students to work in the community for up to five hours per week during the school year.
% Change
This fund is established to account for miscellaneous Federal Grants. Many of the grants are small in nature and short-term. Examples of FederalGrants recorded in this fund include Refugee Grants ($82,000), and Homeless Grants ($25,000). Various program managers request these specialgrants and they normally run for one to two years. These grants are issued for innovative proposals to improve how education is delivered or provideadditional opportunities for students within the District.
2015-16 2016-17 2017-18 2018-19 2019-20Change

BSD 2019-2020 Annual Budget
Financial Section Page 88
SPECIAL REVENUE FUNDS
Revenues Actual Actual Actual Budget BudgetEarnings on Investments $10,778 $18,746 $33,966 $30,000 $65,000 $35,000 116.67%Sale of Meals 1,945,906 1,936,692 2,025,456 1,939,000 1,931,000 -8,000 -0.41%Local Other Revenue 0 0 0 0 8,000 0 0.00%Federal Reimbursement for Meals Served 7,990,168 7,584,050 7,643,806 8,361,000 6,941,000 -1,420,000 -16.98%Federal Cash in Lieu ofCommodities Program 698,283 1,055,194 1,005,250 700,000 700,000 0 0.00%From Fund Balance 0 0 0 0 942,500 942,500 0.00%
Total Estimated Revenues $10,645,135 $10,594,682 $10,708,478 $11,030,000 $10,587,500 -$442,500 -4.01%Expenditures
Salaries $3,753,208 $3,983,845 $4,159,833 $4,200,000 $4,221,000 $21,000 0.50%Employee Benefits 1,552,047 1,613,067 1,542,959 1,680,000 1,608,500 -71,500 -4.26%Purchased Services 384,575 379,799 378,946 417,000 396,000 -21,000 -5.04%Supplies 4,094,997 4,200,319 3,954,818 4,765,000 4,032,000 -733,000 -15.38%Capital Outlay 3,402 40,982 77,308 250,000 250,000 0 0.00%Indirect Costs 76,680 94,450 90,273 80,000 80,000 0 0.00%
Total Estimated Expenditures $9,864,909 $10,312,462 $10,204,137 $11,392,000 $10,587,500 -$804,500 -7.06%Fund Balance Ending $3,805,807 $4,088,027 $4,592,368 $4,230,368 $4,230,368
Program Analysis/Trends -
Sites86
4114
984
478
FOOD SERVICES FUND (290)
2015-16 2016-17 2017-18
The food services program is administered by the State Department of Education in accordance with federal regulations. The program provides lunches, breakfasts andsuppers for students in the District. All lunch meals provided are subsidized at .41 cents by the United States Department of Agriculture (USDA). If students meetspecified income guidelines, they may receive meals at free or at reduced rates. The USDA will reimburse $3.10 for each reduced lunch served and $3.50 for a freelunch served. Reimbursement for meals served is based on federal regulations; the amount students are charged for lunches is set by the Board of Trustees. Theprogram is self-supporting except for the cost of Social Security taxes paid from the General Fund. Idaho Code requires the District to pay this amount to comply withfederal regulations specifying a certain contribution of local funds. The District has also budgeted General Funds to cover the cost of emergency meals. School lunchprices for 2019-20 are: senior high $3.00, junior high $3.00, elementary $2.50, and breakfast prices are $1.65 for secondary and $1.40 for elementary. The Districtserves approximately 22,000 meals per day or 4,000,000 meals annually.
2018-19 2019-20Change % Change
Lunch SitesSatellite Sites
Community Eligible SitesBreakfast in the Classroom Breakfast in the Cafeteria
USDA Programs Offered in District 2019-20
Fresh Fruit and Vegetable ProgramsSupper SitesSummer Feeding Sites (Breakfast/Lunch)Summer Feeding Sites (Supper)

BSD 2019-2020 Annual Budget
Financial Section Page 89
DEBT SERVICE FUND (310)
Principal Interest Principal Interest Principal Interest Principal Interest1-Aug-19 6,535,000 $740,750 875,000 $186,175 1,190,000 $2,044,650 11,571,5751-Feb-20 $610,050 $168,675 $2,032,750 $2,000,000 4,811,4751-Aug-20 6,795,000 $610,050 910,000 $168,670 1,215,000 $2,032,750 11,731,4701-Feb-21 $474,150 $150,475 $2,020,600 2,645,2251-Aug-21 7,070,000 $474,150 945,000 $150,475 $2,020,600 10,660,2251-Feb-22 $332,750 $141,025 $2,020,600 2,494,3751-Aug-22 7,355,000 $332,750 965,000 $141,025 $2,020,600 10,814,3751-Feb-23 $148,875 $121,725 $2,020,600 2,291,2001-Aug-23 5,955,000 $148,875 1,005,000 $121,725 $2,020,600 9,251,2001-Feb-24 $101,625 $2,020,600 2,122,2251-Aug-24 4,065,000 $101,625 3,000,000 $2,020,600 9,187,2251-Feb-25 $1,955,600 1,955,6001-Aug-25 5,995,000 $1,955,600 7,950,6001-Feb-26 $1,811,875 1,811,8751-Aug-26 6,280,000 $1,811,875 8,091,8751-Feb-27 $1,656,375 1,656,3751-Aug-27 6,590,000 $1,656,375 8,246,3751-Feb-28 $1,496,625 1,496,6251-Aug-28 6,910,000 $1,496,625 8,406,6251-Feb-29 $1,323,875 1,323,8751-Aug-29 7,255,000 $1,323,875 8,578,8751-Feb-30 $1,142,500 1,142,5001-Aug-30 7,620,000 $1,142,500 8,762,5001-Feb-31 $952,000 952,0001-Aug-31 8,000,000 $952,000 8,952,0001-Feb-32 $752,000 752,0001-Aug-32 8,400,000 $752,000 9,152,0001-Feb-33 $542,000 542,0001-Aug-33 5,135,000 $542,000 5,677,0001-Feb-34 $413,625 413,6251-Aug-34 5,390,000 $413,625 5,803,6251-Feb-35 $278,875 278,8751-Aug-35 5,660,000 $278,875 5,938,8751-Feb-36 $137,375 137,3751-Aug-36 5,945,000 $137,375 6,082,375Total $'s $33,710,000 3,872,400$ $8,765,000 1,553,220$ $84,585,000 47,200,400$ -$ 2,000,000$ $181,686,020
District Debt Capacity - ID Code 33-1103
Rating AA
Rating Aa1Bond Indebtedness 6/30/2019Less Bond Payments 2019-20Plus Est. Bond Issuance July 2019Bond Indebtedness 6/30/2020
Idaho Code 33-801 provides for a bond and interest obligation local property tax levy as is required to satisfy all maturing bond and bond interest obligations. Idaho Code 33-802A provides for the computation of the bond and interest property tax. This law allows Districts to certify up to 21 months of principal and interest payments after the District deducts for cash on hand and any subsidized interest payments as authorized under Idaho Code 33-906. The District has structured the current debt to maintain a level tax rate of .0007 or 70 cents per $1,000 of taxable value. The rate is expected to remain at .000700 in 2019-20. The District will be issuing the final $72.5 million dollars in authorized bonds in July 2019.
Existing debt levels have not had an impact on current operations, nor does the District anticipate future debt levels to have an impact on operations. All debt service payments are made timely and no refunding has occurred to prevent paying on current debt.
The District contracts with Arthur J Gallagher and Company to determine the Districts post-employment retiree benefit liability. As of June 30, 2019 the estimated net "other post employment benefit obligation" for the District is $19.8 million. The District's plan is considered to be unfunded since there are no assets and retiree benefits are paid annually on a cash basis.
Series 2014
$127,060,0008,600,000
$190,960,000
Series 2019
$1,029,995,681
72,500,000
5% of Taxable Market Value 1,421,415,455 Moody's Bond Rating
Series 2017
Less Debt Outstanding 6/30/19 127,060,000 2012B, 2014 & 2017Remaining Debt Capacity $1,294,355,455
Standard & Poor's Bond RatingFull Sept 2018 Market Value $27,398,313,411 2012B, 2014 & 2017
Series 2012B
$28,428,309,092Plus: Urban Renewal Value
Outstanding Debt, Debt Capacity And Bond Ratings as of June 30, 2019
Payment Date
Refunding (R06) Refunding (R07) Estimate
Total

BSD 2019-2020 Annual Budget
Financial Section Page 90
DEBT SERVICE FUND (310)
Revenues Actual Actual Actual Budget BudgetEarnings on Investments $23,174 $55,885 $124,855 $55,000 $135,000 $80,000 145.45%State Sources 343,415 343,415 343,415 885,054 614,232 -270,822 -30.60%Other Financing Sources/Transfers In 0 1,585 0 0 0 0 0.00%Property Tax Revenues 11,943,636 12,924,658 14,364,300 16,187,124 18,850,000 2,662,876 16.45%Use of Fund Balance 0 0 0 0 0 0 0.00%
Total Estimated Revenues $12,310,225 $13,325,543 $14,832,570 $17,127,178 $19,599,232 $2,472,054 14.43%Expenditures
Principal Payment $8,155,000 $8,385,000 $8,730,000 $7,170,000 $8,600,000 $1,430,000 19.94%Interest Payments 2,940,663 2,603,794 5,160,869 6,086,550 7,783,050 1,696,500 27.87%Refunded Debt 0 0 0 0 0 0 0.00%Bond Issuance Costs/Agent Fees 0 0 0 5,000 5,000 0 0.00%
Total Estimated Expenditures $11,095,663 $10,988,794 $13,890,869 $13,261,550 $16,388,050 $3,126,500 23.58%Fund Balance Ending $13,648,450 $15,985,199 $16,926,900 $20,792,528 $24,003,710
Program Analysis/Trends -
The bond equalization is less in 2019-20 because the State did a one time catch up payment for the 2017 bond issue in 2018-19. Estimated first interestpayment on 2019 bonds to be paid in February 2020.
This fund is used to account for resources to pay principal and interest on long-term debt. All revenues from tax levies for the liquidation of bondedindebtedness and all payments of principal and interest on the general obligation bonds are recorded in this fund. The District has three outstandingbonds; Refunded 2012B, 2014 and the 2017 bond issues. The coupon interest rates range from 2% to 5%. The bond equalization for the new bond is$270,818.
2015-16 2016-17 2017-18 2018-19 2019-20Change % Change

BSD 2019-2020 Annual Budget
Financial Section Page 91
CAPITAL PROJECTS FUND
The maintenance will be less as continued repairs will not longer be necessary.
Rebuild of Highlands Elementary approx. 44,000 square feet.
Jan-18 Sep-20 Bond Proceeds
Reduced utility costs The maintenance will be less as continued repairs will not longer be necessary.
Construction of cafeteria at Koelsch and Hawthorne Elementary
Apr-19 Dec-19 Bond Proceeds
Increased utility, custodial and supply budgets
BOND PROCEEEDS FUND (410)
Impact on Facility MaintenanceImpact on General Fund
Rebuild of Mountain View Elementary, 48,000 square feet.
Feb-18 Sep-20 Bond Proceeds
Remodel a portion of Whittier Elementary to a new Community Center
Nov-18 Dec-19 Bond Proceeds
The projects funded from this fund use proceeds from the sale of voter approved bonds. The Board of Trustees approved a 10 year Facility Master Planin November 2016. The plan was developed with the assistance of Dejong/Richter a facility master planning company. The plan evaluated everyschool building in the District and priorities were established as to the most critical needs of the District that need to be addressed over the next 10years. Capital Construction projects were established and maintenance projects were also identified. The capital construction will be managed throughthe Bond Construction Fund (410) and the maintenance will managed through the Plant Facility Fund (425). The bond proceeds account will be usedto pay for all major capital construction projects. The following identifies the proposed capital construction projects for the next year.
Design Start Date
Completion Date Funding Project
Rebuild Pierce Park Elementary Jun-18 Sep-20 Bond Proceeds
The maintenance will be less as continued repairs will not longer be necessary.
Reduced operating and maintenance costs, safer, cleaner learning environment.
The maintenance will be less as continued repairs will not longer be necessary.
Reduced utility costs
Reduced utility costs
The maintenance will be less as continued repairs will not longer be necessary.
Increased utility, custodial and supply budgets
Increased utility, custodial and supply budgets
Remodel existing Cafeterias into classrooms at Hillside and Fairmont Junior Highs.
Sep-18 Sep-19 Bond Proceeds

BSD 2019-2020 Annual Budget
Financial Section Page 92
CAPITAL PROJECTS FUND- BOND PROCEEDS
Revenues Actual Actual Actual Budget BudgetInterest Earnings $0 $110,112 $842,172 $600,000 $1,300,000 $700,000 116.67%Proceeds from Sale of Bonds 0 100,543,271 0 0 72,500,000 72,500,000 0.00%From Prior Year Fund Balance 0 0 0 36,000,000 0 -36,000,000 -100.00%
$0 $100,653,383 $842,172 $36,600,000 $73,800,000 $37,200,000 101.64%
Expenditures
$0 $0 $0 $0 $0 $0 0.00%
0 3,788,053 42,711,227 36,450,000 32,000,000 -4,450,000 -12.21%Total Estimated Expenditures $0 $3,788,053 $42,711,227 $36,450,000 $32,000,000 -$4,450,000 -12.21%
Fund Balance Ending $0 $96,865,330 $54,996,275 $19,146,275 $60,946,275Program Analysis/Trends
Estimated interest at 2.2% * $60 million average carrying balance. Plan to issue the remaining bonds in July 2019.
BOND PROCEEDS (FUND 410)In March 2017, the voters of the Boise District approved the issuance of $172.5 million dollars in bonds to build or rebuild seven new schools,renovate six buildings, construct additions to existing facilities and provide for deferred maintenance within the District. The new schools in manycases will be replacement buildings on the same site. The facility master plan approved by the Board of Trustees covers a period of ten years. TheDistrict planned to sell the bonds in two sales $100 million in 2017 and then the remainder will be sold in 2019. The first projects completed in 2018-19 were rebuilding Whittier and Amity Elementary, adding a 30,000 square foot addition on Timberline High School, remodeling the Boise High gymand music building and construction a 50,000 square foot building for career technical programs and training facilities for District staff. The Districtalso completed the construction of a new gym addition at Fairmont Junior High, Hillside Junior High, Taft Elementary and Maple Grove Elementary.During the 2019-20 school year Pierce Park, Mountain View and Highlands Elementary Schools will be rebuilt on their current sites. The District willalso be constructing a new cafeteria at Koelsch and Hawthorne Elementary schools. Design work will begin on the addition of a gym or cafeteria atJefferson and Hillcrest Elementary schools. Design work will also begin on the rebuild of Valley View Elementary. Additional information on theFacility Master Plan is included in the "Information" section of this budget document.
2015-16 2016-17 2017-18 2018-19 2019-20Change % Change
Total Estimated Revenues and Transfers
General Maint. of Buildings & Equipment
Capital Asset Acquisition Program

BSD 2019-2020 Annual Budget
Financial Section Page 93
CAPITAL PROJECTS FUND
PLANT FACILITY FUND (425)The projects funded from this fund use proceeds from the sale of property, the voter approved supplemental levy in the amount of $3 million annually,transfers from the general fund and the monies received from the State Lottery Commission. The Board of Trustees approved a 10-year FacilityMaster Plan in November 2016. The plan was developed with the assistance of Dejong/Richter a facility master planning company. The planevaluated every school building in the District and priorities were established as to the most critical needs of the District that need to be addressed overthe next 10 years. Capital Construction projects were established and maintenance projects were also identified. The capital construction will bemanaged through the Bond Construction Fund (410) and the maintenance will be managed through the Plant Facility Fund (425). The maintenancework will include HVAC, roofing, electrical, flooring, painting and parking lot improvements. The following identifies the overall proposedmaintenance expenditures for the next year.
Deferred Maintenance BudgetProject
120,000 177,100
Borah High School Main Building Hawthorne Elementary
Flooring/Asbestos removal 1,180,000 Fields/Paint/PlaygroundGeneral Facility Improvements 550,000 Borah High School Industrial Arts Building/Gym
PaintFlooring/Asbestos removal
Monroe ElementaryMonroe ElementaryRiverglen Junior HighRiverglen Junior High
PaintHawthorne ElementaryKoelsch Elementary
Liberty ElementaryLes Bois Junior High
Madison Preschool 65,000 123,044 58,240
Flooring/Asbestos removal
PaintFlooring/Asbestos removalFlooring/Asbestos removalReroof
82,538 109,000
300,000 Reroof 475,000
500,000 400,000
Trailwind Elementary Paint
$ 6,949,922 Total Amount of Projects
200,000 475,000
135,000 Capital High SchoolHidden Springs Elementary
Roof Repairs
Roof RepairsLife/Safety Repairs
Heat Pumps

BSD 2019-2020 Annual Budget
Financial Section Page 94
CAPITAL PROJECTS FUND
Revenues Actual Actual Actual Budget BudgetLocal Revenue $48,277 $55,000 $429,968 $20,000 $25,000 $5,000 25.00%State Lottery Proceeds 1,531,194 1,575,789 1,566,072 1,560,000 1,833,000 273,000 17.50%Transfer From General Funds 3,000,000 4,500,000 5,150,000 7,357,000 7,357,000 0 0.00%Sale of Assets 0 0 0 0 0 0 0.00%From Prior Year Fund Balance 0 0 0 1,500,000 0 -1,500,000 -100.00%
$4,579,471 $6,130,789 $7,146,040 $10,437,000 $9,215,000 -$1,222,000 -11.71%Expenditures
General Maint. of Buildings & Equipment $0 $629,008 $2,815,637 $4,580,000 $4,258,000 -$322,000 -7.03%Capital Asset Acquisition Program 9,321,271 6,610,546 4,243,021 3,500,000 2,691,922 -808,078 -23.09%
Total Estimated Expenditures $9,321,271 $7,239,554 $7,058,658 $8,080,000 $6,949,922 -$1,130,078 -13.99%Fund Balance Ending $4,552,432 $3,443,667 $3,531,049 $4,388,049 $6,653,127
Program Analysis/Trends -
The 1988 a supplemental tax levy was passed to provide funds for acquiring, purchasing, and/or improving a school site or sites, remodeling orreplacing any existing building, furnishing and equipping any building or buildings, including all lighting, ventilation and sanitation facilities andappliances necessary to maintaining and operating the buildings of the District.
In 1991, the Board of Trustees authorized an automatic transfer of the $3 million supplemental levy from the General Fund to the Plant Facility Fund.These funds are used for improving facilities within the District. In addition to the voter approved supplemental levy, this fund also receives lotteryproceeds, proceeds from the sale of District property and transfers from the general fund as approved by the Board of Trustees.
Idaho Code specifies that no expenditure may be authorized from the Plant and Facility Fund unless the estimated cost of the project shall exceed$5,000. Deferred maintenance projects identified in the Facility Master Plan will be managed through this fund. These projects include roofreplacements and repairs, upgrades to HVAC, safety upgrades, plumbing repairs, painting, flooring and general maintenance.
PLANT AND FACILITY (FUND 425)
2015-16 2016-17 2017-18 2018-19 2019-20Change % Change
Total Estimated Revenues and Transfers

Financial Section Page 95
BSD 2019-2020 Annual Budget
Page Intentionally Blank