Embed Size (px)
Citation preview

Financial Services Cloud UserGuide
Salesforce, Winter ’22
@salesforcedocsLast updated: September 23, 2021

© Copyright 2000–2021 salesforce.com, inc. All rights reserved. Salesforce is a registered trademark of salesforce.com, inc.,as are other names and marks. Other marks appearing herein may be trademarks of their respective owners.

CONTENTS
Deliver Financial Services for High-Touch Client Relationships . . . . . . . . . . . . . . . . . . . . 1
Key Terms . . . . . . . . . . . . . . . . . . . . . . . . . . . . . . . . . . . . . . . . . . . . . . . . . . . . . . . . . . . 1Use the Home Page to Take Charge of Your Day . . . . . . . . . . . . . . . . . . . . . . . . . . . . . . . . . 2Filter Client and Household Lists . . . . . . . . . . . . . . . . . . . . . . . . . . . . . . . . . . . . . . . . . . . . 4View Client and Household Profiles . . . . . . . . . . . . . . . . . . . . . . . . . . . . . . . . . . . . . . . . . . 4Monitor Your Book of Business with Dashboards . . . . . . . . . . . . . . . . . . . . . . . . . . . . . . . . . 6Get the Data You Need with Reports . . . . . . . . . . . . . . . . . . . . . . . . . . . . . . . . . . . . . . . . . 7What Client Data Can I See? . . . . . . . . . . . . . . . . . . . . . . . . . . . . . . . . . . . . . . . . . . . . . . . 7
Set Up Clients, Households, and Relationships . . . . . . . . . . . . . . . . . . . . . . . . . . . . . . 8
Create a Client or Prospect . . . . . . . . . . . . . . . . . . . . . . . . . . . . . . . . . . . . . . . . . . . . . . . 8Add Education Details . . . . . . . . . . . . . . . . . . . . . . . . . . . . . . . . . . . . . . . . . . . . . . . . . . 10Add Employment Details . . . . . . . . . . . . . . . . . . . . . . . . . . . . . . . . . . . . . . . . . . . . . . . . 11Add Identification Documents . . . . . . . . . . . . . . . . . . . . . . . . . . . . . . . . . . . . . . . . . . . . . 11Create a Household from the Account Tab . . . . . . . . . . . . . . . . . . . . . . . . . . . . . . . . . . . . 11Create a Household from a Client Profile . . . . . . . . . . . . . . . . . . . . . . . . . . . . . . . . . . . . . 12Add Household Members and Relationships . . . . . . . . . . . . . . . . . . . . . . . . . . . . . . . . . . 12Add an Extended Relationship to a Client or Household . . . . . . . . . . . . . . . . . . . . . . . . . . . 14
Act on Client Relationships with the Actionable Relationship Center (ARC) . . . . . . . . . . 17
Get to Know ARC . . . . . . . . . . . . . . . . . . . . . . . . . . . . . . . . . . . . . . . . . . . . . . . . . . . . . 18Types of Relationships in ARC . . . . . . . . . . . . . . . . . . . . . . . . . . . . . . . . . . . . . . . . . . . . . 26ARC Integrations . . . . . . . . . . . . . . . . . . . . . . . . . . . . . . . . . . . . . . . . . . . . . . . . . . . . . 27
Enter and View Financial Data . . . . . . . . . . . . . . . . . . . . . . . . . . . . . . . . . . . . . . . . . . 29
Manually Add a Financial Account . . . . . . . . . . . . . . . . . . . . . . . . . . . . . . . . . . . . . . . . . 29View Financial Account Transactions . . . . . . . . . . . . . . . . . . . . . . . . . . . . . . . . . . . . . . . . 30View Financial Account Billing Statements . . . . . . . . . . . . . . . . . . . . . . . . . . . . . . . . . . . . 30View Holdings Within an Investment Account . . . . . . . . . . . . . . . . . . . . . . . . . . . . . . . . . . 30Add Holdings to an Investment Account . . . . . . . . . . . . . . . . . . . . . . . . . . . . . . . . . . . . . . 31Manually Create Securities Records . . . . . . . . . . . . . . . . . . . . . . . . . . . . . . . . . . . . . . . . . 31Add an Asset or Liability . . . . . . . . . . . . . . . . . . . . . . . . . . . . . . . . . . . . . . . . . . . . . . . . 32Add a Financial Goal . . . . . . . . . . . . . . . . . . . . . . . . . . . . . . . . . . . . . . . . . . . . . . . . . . 32Add a Financial Account Role . . . . . . . . . . . . . . . . . . . . . . . . . . . . . . . . . . . . . . . . . . . . . 32
Manage Client Interactions . . . . . . . . . . . . . . . . . . . . . . . . . . . . . . . . . . . . . . . . . . . . 33
Create a Case from Financial Accounts . . . . . . . . . . . . . . . . . . . . . . . . . . . . . . . . . . . . . . 33Track Client Interactions . . . . . . . . . . . . . . . . . . . . . . . . . . . . . . . . . . . . . . . . . . . . . . . . 34
Track Leads and Opportunities . . . . . . . . . . . . . . . . . . . . . . . . . . . . . . . . . . . . . . . . . 35

Create a Wallet Share Opportunity . . . . . . . . . . . . . . . . . . . . . . . . . . . . . . . . . . . . . . . . . 35Create a Lead . . . . . . . . . . . . . . . . . . . . . . . . . . . . . . . . . . . . . . . . . . . . . . . . . . . . . . . 35Convert a Lead to a Client . . . . . . . . . . . . . . . . . . . . . . . . . . . . . . . . . . . . . . . . . . . . . . . 36
Work with Compliant Data Sharing . . . . . . . . . . . . . . . . . . . . . . . . . . . . . . . . . . . . . . 37
Add Participants to Records . . . . . . . . . . . . . . . . . . . . . . . . . . . . . . . . . . . . . . . . . . . . . . 37Manage Participants for Private Opportunities . . . . . . . . . . . . . . . . . . . . . . . . . . . . . . . . . 38View Record Access Levels . . . . . . . . . . . . . . . . . . . . . . . . . . . . . . . . . . . . . . . . . . . . . . 38
Use Financial Services Cloud Tableau CRM Solutions . . . . . . . . . . . . . . . . . . . . . . . . . 40
Use Analytics for Wealth Management . . . . . . . . . . . . . . . . . . . . . . . . . . . . . . . . . . . . . . 41Use Analytics for Insurance . . . . . . . . . . . . . . . . . . . . . . . . . . . . . . . . . . . . . . . . . . . . . . 59Use Insurance Claims and Policy Analytics Dashboards . . . . . . . . . . . . . . . . . . . . . . . . . . . 66Use Analytics for Retail Banking . . . . . . . . . . . . . . . . . . . . . . . . . . . . . . . . . . . . . . . . . . . 72Use Consumer Banking Starter Analytics . . . . . . . . . . . . . . . . . . . . . . . . . . . . . . . . . . . . . 73Use Wealth Starter Analytics . . . . . . . . . . . . . . . . . . . . . . . . . . . . . . . . . . . . . . . . . . . . . 74Use the Client Segmentation App . . . . . . . . . . . . . . . . . . . . . . . . . . . . . . . . . . . . . . . . . . 75
Contents

DELIVER FINANCIAL SERVICES FOR HIGH-TOUCH CLIENTRELATIONSHIPS
EDITIONS
Financial Services Cloud isavailable in LightningExperience.
Available in: Professional,Enterprise, and Unlimitededitions.
Financial Services Cloud is a reimagined front office. Get a clean, aggregated view of the mostrelevant, actionable client information without logging in to a dozen systems throughout the day.Accelerate your productivity with technology and digital workflows that reduce the time you spendon routine, administrative tasks. Focus instead on delivering the highly personalized, proactiveservice that your clients expect.
Start with the basics of managing your client book for deeper engagement and more profitableclient relationships.
Key Terms
Certain terms can have multiple meanings within a financial services context. It’s important toclarify what we mean when you encounter terms such as account or client in our app.
Use the Home Page to Take Charge of Your Day
The home page is tailored to your needs and gives you instant access to the most pressing items on your to-do list. What are yourpriorities today? What’s next? What’s pending?
Filter Client and Household Lists
View filtered lists of people and households based on similar interests or financial characteristics to quickly navigate to their profiles.
View Client and Household Profiles
A profile provides a full picture of a client’s or household’s financial past, present, and future. In a single view, you can monitorfinancial accounts, visualize personal and household relationships, manage goals, and review activity history.
Monitor Your Book of Business with Dashboards
Dashboards help you see at a glance your engagement with clients and the potential to bring in more business.
Get the Data You Need with Reports
Reports provide you with detailed information on clients and opportunities to bring in more business.
What Client Data Can I See?
The Salesforce security and sharing model ensures flexibility and the appropriate levels of access to client data. Ask your Salesforceadmin for details about how data visibility is defined for your teams.
Key Terms
EDITIONS
Financial Services Cloud isavailable in LightningExperience.
Available in: Professional,Enterprise, and Unlimitededitions.
Certain terms can have multiple meanings within a financial services context. It’s important to clarifywhat we mean when you encounter terms such as account or client in our app.
AccountAccount can refer to a client, household, or business. Not to be confused with a financial account.
ClientA person or organization that does business with your firm in the past, present, or future. Seealso person.
CustomerUsed interchangeably with client. See also person.
1

Financial accountAn investment account, bank account, insurance policy, or other type of financial account. In some financial services applications,financial accounts are the central unit of organization. Other applications, including Financial Services Cloud, treat clients or familygroups as the central unit.
Household
A type of relationship group that includes people and business entities who have direct relationships with one another. Within thisgroup, financials are summarized at the household level. Salesforce doesn’t track directly how members within a household arerelated. Roles within a household, such as client, spouse, or dependent, define relationships.
People associated with the household but outside of it are related contacts, such as lawyers, accountants, or tax planners. Organizationalentities that are associated with a household but don’t roll up any financials to the household are related accounts. These relatedaccounts include businesses or households.
In client and household profiles, household (relationship group) members appear together. These members are clearly separatedfrom other associated entities or extended relationships.
IndividualSee person.
PersonA client, customer, prospect, or contact whose details are maintained by your firm. Financial Services Cloud stores data about peopleusing either an individual or person account model.
ProspectA person or organization with the potential to become a client.
Use the Home Page to Take Charge of Your Day
EDITIONS
Financial Services Cloud isavailable in LightningExperience.
Available in: Professional,Enterprise, and Unlimitededitions.
The home page is tailored to your needs and gives you instant access to the most pressing itemson your to-do list. What are your priorities today? What’s next? What’s pending?
Your home page can differ depending on how your organization implements Financial ServicesCloud and on any customizations made by your admin.
2
Use the Home Page to Take Charge of Your DayDeliver Financial Services for High-Touch Client Relationships

• Referral Performance (1) shows how opportunities look for the quarter.
• Assistant (2) offers alerts about leads assigned to you for the day and opportunities requiring attention.
• Interaction Summaries (3) shows a list of interaction summaries for all accounts (if enabled). Interaction Summaries captures structurednotes of client or partner interactions and lets you share them with stakeholders in a compliant manner.
• Scheduler (4) shows scheduled and pending service appointments from Salesforce Scheduler (if enabled). Salesforce Schedulersimplifies and optimizes appointment scheduling.
• Key tasks and actions (5) shows important information, including:
– Summary of Referrals Assigned to Me: Provides an overview of converted and rejected referrals and top areas of interest.
– Referrals Assigned to Me: Shows you the top referral for action.
– My Top Referrers: Shows who has been providing you with the best referrals.
– Opportunities and Leads: Helps you track ways to deepen and grow your book of business.
– Today’s Events: Shows the next five items on your calendar for the day. Past events drop off as the day progresses.
– Tasks: Lists upcoming tasks. Lets you mark tasks as complete. If you remain on the page, you can reopen completed tasks.Refreshing the page removes completed tasks from the view.
– Birthdays: Lists the clients celebrating birthdays in the next seven days.
SEE ALSO:
Events and Calendars
Track Client Interactions
3
Use the Home Page to Take Charge of Your DayDeliver Financial Services for High-Touch Client Relationships

Filter Client and Household Lists
EDITIONS
Financial Services Cloud isavailable in LightningExperience.
Available in: Professional,Enterprise, and Unlimitededitions.
View filtered lists of people and households based on similar interests or financial characteristics toquickly navigate to their profiles.
Tip: The My Clients and My Groups list views are a good starting point because they showall clients and households in your book of business. These list views are on the Accounts tab.
• See which list views your Salesforce admin has made available by selecting the list view nameat the top of the page.
• To sort, click a column header.
• Change the filter criteria to dynamically update your view of My Clients or My Groups,segmenting clients by marketing segments, age, or birthdays.
1. To expand the list of criteria you can filter by, click the Filters icon.
2. For each filter that you want to change, select the filter, edit the criteria, and then click Done.
Important: If you’re filtering by a currency value, specify a currency ISO code, such as USD or GBP, before the value. Forexample, GBP100000. The ISO code must be one of your firm’s active currencies.
3. Click Apply.The list view refreshes with your updated filter criteria.
For now, you can’t save your changes to a list view that you’ve edited.
• View up to 25 records per page and a maximum of approximately 2,000 items per list view.
If you can’t access some items because the list view contains more items than the maximum, narrow your filter criteria.
SEE ALSO:
Find and View Your Data
View Client and Household Profiles
EDITIONS
Financial Services Cloud isavailable in LightningExperience.
Available in: Professional,Enterprise, and Unlimitededitions.
A profile provides a full picture of a client’s or household’s financial past, present, and future. In asingle view, you can monitor financial accounts, visualize personal and household relationships,manage goals, and review activity history.
4
Filter Client and Household ListsDeliver Financial Services for High-Touch Client Relationships

Your tabs and field names and their order can differ from what you see here based on how your Salesforce admin has customized them.However, the layout of sections within a profile page can’t be changed.
Highlights panel (1)See the last and next scheduled interaction at a glance.
Activity (2)View timelines of next steps and past activities, create tasks and events, and log client communications.
Details (3)Quickly access details without leaving the profile page. Tabs on the profile pages offer similar views, with slight differences betweenthe client and household profiles. For clients, view summaries of Know Your Client information, employment, and contact information.For households, view high-level summaries of total financial assets. To edit Details information, use the Edit button in the highlightspanel.
Financials or Financial Accounts (4)Track financial accounts by the predefined categories of investment accounts, bank accounts, and insurance policies. Also trackassets and liabilities.
Relationships (5)Manage the network of relationships in a household. Add new household members. Add people from outside of the household asrelated contacts. For households, you can add other households or business entities as related accounts. You can edit or deleteassociated contacts and accounts.
Referrals (6)Get a summary of referral performance along with details of referrals and expressed interest.
Goals (7)Track what matters to your clients for goal-based planning.
Chatter (8)Use the Chatter feed to share information and collaborate with other team members who manage client relationships.
5
View Client and Household ProfilesDeliver Financial Services for High-Touch Client Relationships

Related (9)See comprehensive summaries of financial accounts, tangible assets, liabilities, and related lists, such as opportunities, cases, notes,and attachments. This view can be handy for onboarding when you want to quickly enter a series of financial accounts, goals,opportunities, and relationships.
SEE ALSO:
View Client and Household Profiles
Activity Timeline
Share Updates with People in Chatter
Monitor Your Book of Business with Dashboards
EDITIONS
Financial Services Cloud isavailable in LightningExperience.
Available in: Professional,Enterprise, and Unlimitededitions.
Dashboards help you see at a glance your engagement with clients and the potential to bring inmore business.
1. On the navigation menu, click the Dashboards list view.
2. Click All Folders.
• Public Dashboards contains:
– My Book of Business - Overview—Manage your existing book of business with insightsabout AUM, wallet share, held-away assets, and financial account totals by client.
– My Book of Business - Engagement Opportunities—Deepen client relationships bytracking upcoming client reviews, birthdays, and other relationship touchpoints.
– My Book of Business - Sales & Opportunities—Grow your book of business by identifying new AUM opportunities andfocusing your sales process on hitting targets.
• Referrals Dashboards contains:
– My Top Referrers—Discover the internal and external referrers who are bringing you the most new business.
– Referral Performance by User—Track the performance of referrals you made and the referrals assigned to you.
3. Select a dashboard.
To get the latest data, click Refresh.
SEE ALSO:
Reports and Dashboards
6
Monitor Your Book of Business with DashboardsDeliver Financial Services for High-Touch Client Relationships

Get the Data You Need with Reports
EDITIONS
Financial Services Cloud isavailable in LightningExperience.
Available in: Professional,Enterprise, and Unlimitededitions.
Reports provide you with detailed information on clients and opportunities to bring in more business.
1. In the navigation menu, go to the Reports list view.
2. Click All Folders, and choose Advisor Reports, My Top Referrers , or Referral Performance.
3. Select a report.
To get the latest data, click Refresh.
SEE ALSO:
Reports and Dashboards
What Client Data Can I See?
The Salesforce security and sharing model ensures flexibility and the appropriate levels of access to client data. Ask your Salesforce adminfor details about how data visibility is defined for your teams.
7
Get the Data You Need with ReportsDeliver Financial Services for High-Touch Client Relationships

SET UP CLIENTS, HOUSEHOLDS, AND RELATIONSHIPS
EDITIONS
Financial Services Cloud isavailable in LightningExperience.
Available in: Professional,Enterprise, and Unlimitededitions.
Create records for clients, households, and their extended network of relationships so that youmaintain a rich, holistic view of your book of business.
Create a Client or Prospect
Financial Services Cloud gives you two ways to create clients or prospects.
Add Education Details
You can store details about a client’s education history.
Add Employment Details
You can store details about a client’s employment history.
Add Identification Documents
You can store details about documents used to identify a client.
Create a Household from the Account Tab
Use households to track groups of clients, businesses, and trusts who have a direct relationship with one another and shared financials.A household is a type of relationship group. Your Salesforce admin can create other relationship group types to fit your businessrequirements.
Create a Household from a Client Profile
Capture the full richness of a client’s relationships by adding multiple households. If you can’t add a client to more than one household,ask your Salesforce admin to enable the multiple relationship groups custom setting. A household is a type of relationship group.Your Salesforce admin can create other relationship group types to fit your business requirements.
Add Household Members and Relationships
Add members to a household, and relate businesses, trusts, and other people to the household members. Define how to summarizethe members’ activity and financials at the household level.
Add an Extended Relationship to a Client or Household
Better visualize clients’ relationships with people outside of their household. Track the other professionals who advise clients abouttheir financial lives. Also track clients’ affiliations with owned businesses and other organizational entities.
Create a Client or Prospect
EDITIONS
Financial Services Cloud isavailable in LightningExperience.
Available in: Professional,Enterprise, and Unlimitededitions.
Financial Services Cloud gives you two ways to create clients or prospects.
Your Salesforce admin can set up record types to fit your business needs. Work with the addedrecord types as you would with standard client or prospect records.
Create a Client or Prospect from the Accounts Tab
When you want to track engagement with a new client or prospect, create a profile.
Create a Client or Prospect with the Individual Builder
When your implementation uses the person model, use the Create Individual builder to addclients or prospects, and optionally add them to a relationship group.
8

Create a Client or Prospect from the Accounts Tab
EDITIONS
Financial Services Cloud isavailable in LightningExperience.
Available in: Professional,Enterprise, and Unlimitededitions.
When you want to track engagement with a new client or prospect, create a profile.
1. On the Accounts tab, click New.
2. Select Individual or Person account.
3. For the account name, enter the client’s name.
4. Select a status.
• For a client, select Active.
• For a prospect, select Prospect.
• For a client that you’re onboarding, select Onboarding.
5. Enter other relevant information and save the information.
Note: You can’t delete clients and prospects.
Create a Client or Prospect with the Individual Builder
EDITIONS
Financial Services Cloud isavailable in LightningExperience.
Available in: Professional,Enterprise, and Unlimitededitions.
When your implementation uses the person model, use the Create Individual builder to add clientsor prospects, and optionally add them to a relationship group.
In the Create Individual builder, complete this information about the client or prospect.
• Account details
• Contact details
• Relationship group details (optional)
1. Click Home.
2. In the Create Individual section, click New.
3. For the account name, enter the client or prospect’s name.
4. Select a status.
• For a client, select Active.
• For a prospect, select Prospect.
• For a client that you’re onboarding, select Onboarding.
5. (Optional) Enter the remaining client or prospect details, and then click Save & Next.
6. (Optional) Enter the client or prospect’s contact details, and then click one of the following.
9
Create a Client or Prospect from the Accounts TabSet Up Clients, Households, and Relationships

• To finish creating the client or prospect, click Save.
• To add the client or prospect to a relationship group, click Save & Next.
7. To designate this client or prospect as the primary household member, select Primary Member.
Designating a primary member is not required, but a household can have only one primary member.
8. Select the member role that the client or prospect fills within the household.
• If the role is primary household member, select Client. You can select more than one role.
• If the role isn’t primary household member, select the member’s role relative to the primary household member’s role. Forexample, Dependent or Spouse.
9. If you want to roll up activities and information for the client or prospect, select Primary Group.
• Roll-up items are summarized at the household level for all members who have this household as their primary group.
• To add the member’s related business to the household, designate the household as the member’s primary group. As a memberof the household, the related business’s activities and information are also summarized at the household level.
10. If you enabled this household as a primary group, select which activities and information to roll up when summarizing data at thehousehold level.
Note: You can select more than one item to roll up for the client.
11. Save your changes.
SEE ALSO:
Create a Household from a Client Profile
Add Education Details
EDITIONS
Financial Services Cloud isavailable in LightningExperience.
Available in: Professional,Enterprise, and Unlimitededitions.
You can store details about a client’s education history.
1. In the client’s profile, open the Related tab.
2. In the Education section, click New.
3. If the client isn’t the correct one, remove the client, and select another client or create one.
4. Enter the education institution name and, optionally, the other details.
5. Save the information.
10
Add Education DetailsSet Up Clients, Households, and Relationships
Add Employment Details
EDITIONS
Financial Services Cloud isavailable in LightningExperience.
Available in: Professional,Enterprise, and Unlimitededitions.
You can store details about a client’s employment history.
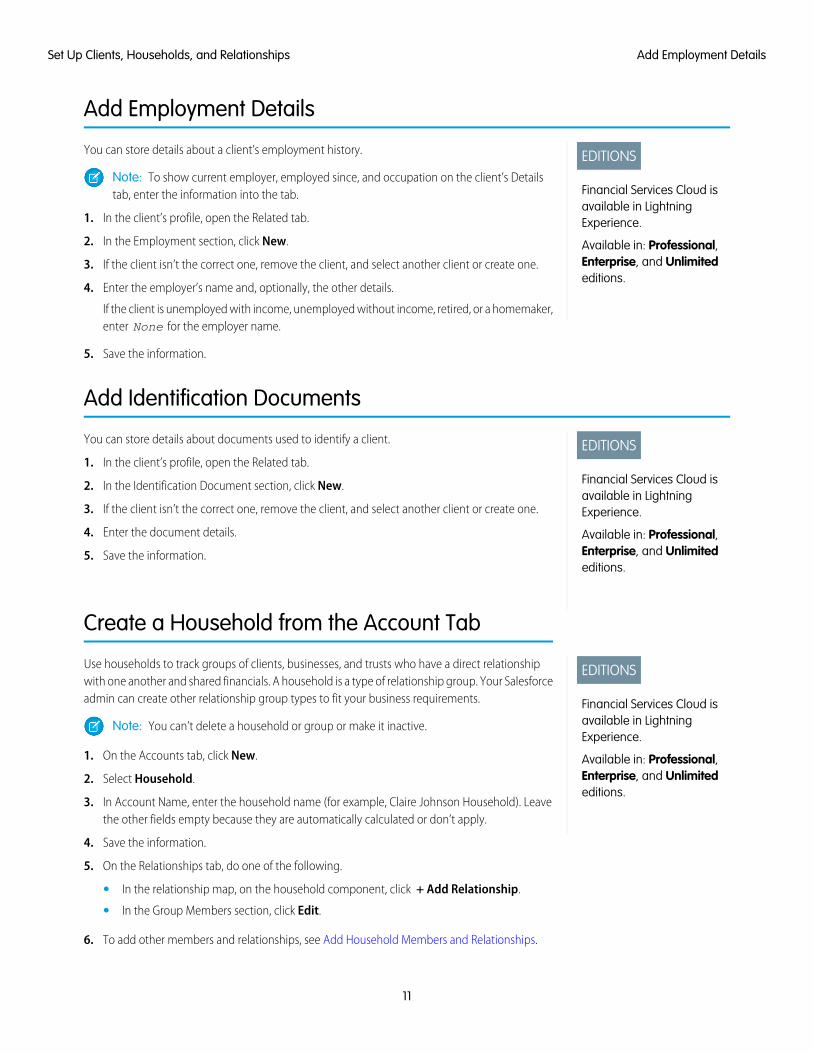
Note: To show current employer, employed since, and occupation on the client’s Detailstab, enter the information into the tab.
1. In the client’s profile, open the Related tab.
2. In the Employment section, click New.
3. If the client isn’t the correct one, remove the client, and select another client or create one.
4. Enter the employer’s name and, optionally, the other details.
If the client is unemployed with income, unemployed without income, retired, or a homemaker,enter None for the employer name.
5. Save the information.
Add Identification Documents
EDITIONS
Financial Services Cloud isavailable in LightningExperience.
Available in: Professional,Enterprise, and Unlimitededitions.
You can store details about documents used to identify a client.
1. In the client’s profile, open the Related tab.
2. In the Identification Document section, click New.
3. If the client isn’t the correct one, remove the client, and select another client or create one.
4. Enter the document details.
5. Save the information.
Create a Household from the Account Tab
EDITIONS
Financial Services Cloud isavailable in LightningExperience.
Available in: Professional,Enterprise, and Unlimitededitions.
Use households to track groups of clients, businesses, and trusts who have a direct relationshipwith one another and shared financials. A household is a type of relationship group. Your Salesforceadmin can create other relationship group types to fit your business requirements.
Note: You can’t delete a household or group or make it inactive.
1. On the Accounts tab, click New.
2. Select Household.
3. In Account Name, enter the household name (for example, Claire Johnson Household). Leavethe other fields empty because they are automatically calculated or don’t apply.
4. Save the information.
5. On the Relationships tab, do one of the following.
• In the relationship map, on the household component, click + Add Relationship.
• In the Group Members section, click Edit.
6. To add other members and relationships, see Add Household Members and Relationships.
11
Add Employment DetailsSet Up Clients, Households, and Relationships

You can add members from the Relationships tab on the household profile or, if your instance uses the individual model, with the CreateIndividual builder.
SEE ALSO:
Add Household Members and Relationships
Create a Household from a Client Profile
EDITIONS
Financial Services Cloud isavailable in LightningExperience.
Available in: Professional,Enterprise, and Unlimitededitions.
Capture the full richness of a client’s relationships by adding multiple households. If you can’t adda client to more than one household, ask your Salesforce admin to enable the multiple relationshipgroups custom setting. A household is a type of relationship group. Your Salesforce admin cancreate other relationship group types to fit your business requirements.
Note: You can’t delete a household or group or make it inactive.
1. From a client or business profile, click the Relationships tab.
2. Do one of the following.
• In the Primary Group section, click New.
Note: If the client has a primary group, it appears as the section name. You can edit the primary group. A client can haveonly one primary group.
• On the relationship map, click + Add Group.
• In the Relationships Group section, click New.
3. For the account name, enter the household name (for example, Claire Johnson Household). Leave the other fields empty.
4. Click Save & Next.
5. To add other members and relationships, see Add Household Members and Relationships.
You can add members from the Relationships tab on the household profile or, if your instance uses the individual model, with the CreateIndividual builder.
SEE ALSO:
Create a Client or Prospect with the Individual Builder
Add Household Members and Relationships
Add Household Members and Relationships
EDITIONS
Financial Services Cloud isavailable in LightningExperience.
Available in: Professional,Enterprise, and Unlimitededitions.
Add members to a household, and relate businesses, trusts, and other people to the householdmembers. Define how to summarize the members’ activity and financials at the household level.
Note: If you can’t add a client to more than one household, ask your Salesforce admin toenable the multiple relationship groups custom setting.
1. Do one of the following.
• Create a Household from the Account Tab
• Create a Household from a Client Profile
12
Create a Household from a Client ProfileSet Up Clients, Households, and Relationships

Add Members to a HouseholdGet a full picture of the client’s household by adding members.
1. In Create Relationship Group for Member Name, enter a client’s name, or click + New Contact.
For a new contact, do the following.
a. Select the Individual or Person Account record type, and click Next.
b. Enter the contact’s last name and other information.
c. Save the information.
2. Select the member’s role.
• If the member is the primary household member, select Client. You can select more than one role for each member.
• If the member is not the primary household member, select the member’s role relative to the primary household member’s role,such as Dependent or Spouse.
3. If you want to roll up activities and objects for this member, select Primary Group.
• Rollup items are summarized at the household level for all members who have this household as their primary group.
• Designating a household as a primary group for a member enables you to add the member’s related businesses and trusts tothe household. As a member of the household, the related business or trust’s activities and objects are summarized at thehousehold level.
13
Add Members to a HouseholdSet Up Clients, Households, and Relationships

4. If you enabled this household as a primary group for the member, select which activities and objects, such as financial accounts orfinancial goals, to roll up when summarizing data at the household level.
Note: You can select more than one item for each member.
5. To designate this person as the primary household member, select Primary Member.
Designating a primary member is not required, but a household can have only one primary member.
6. To add another member to the household, click + Add Row, and enter the required information.
Relate a Member’s Business or Trust to Their HouseholdCapture a client’s related financial interests by adding details for their businesses and trusts.
1. In the section Do the Members Have Relationships With Other Accounts?, under Related Member, select a household member.
Note:
• To relate businesses or trusts to the member, this household must be the member’s primary household. Related businessand trust activities and objects can be summarized at the household level.
• You can add a business or trust to a member in only one primary group.
2. Under Member Role, select the role that describes how the member is associated with the related business or trust.
3. Under Account Name, select a member’s related business or trust or click + New Account and enter the details for the business ortrust.
4. Enable Add to Group to roll up the business’s or trust’s activities and objects to the household.
5. To relate another business or trust to the household, click + Add Row, and complete the information.
Relate a Member to Another PersonCapture a client’s full relationship network by adding people related to the client.
1. In the section Do the Members Have Relationships with Other People?, under Related Member, select a household member.
2. Under Member Role, select the related role that describes how the contact is associated with the related member.
3. Under Contact Name, select the member’s related contact or click + New Contact and enter the contact’s details.
4. To relate another person to a household member, click + Add Row, and complete the information.
Add an Extended Relationship to a Client or Household
EDITIONS
Financial Services Cloud isavailable in LightningExperience.
Available in: Professional,Enterprise, and Unlimitededitions.
Better visualize clients’ relationships with people outside of their household. Track the otherprofessionals who advise clients about their financial lives. Also track clients’ affiliations with ownedbusinesses and other organizational entities.
Relate a Contact to a Client or Household
Add a lawyer, accountant, or other professional as a related contact. If the business contact isnew, create a business account for the contact—every contact belongs to an account inSalesforce. Then associate the contact with a client or household by creating a contact for thebusiness account.
14
Relate a Member’s Business or Trust to Their HouseholdSet Up Clients, Households, and Relationships
Relate a Business, Trust, or Another Household to a Household
Associate a business, trust, or another household with a household to track the full picture of a household’s relationships.
Relate a Contact to a Client or Household
EDITIONS
Financial Services Cloud isavailable in LightningExperience.
Available in: Professional,Enterprise, and Unlimitededitions.
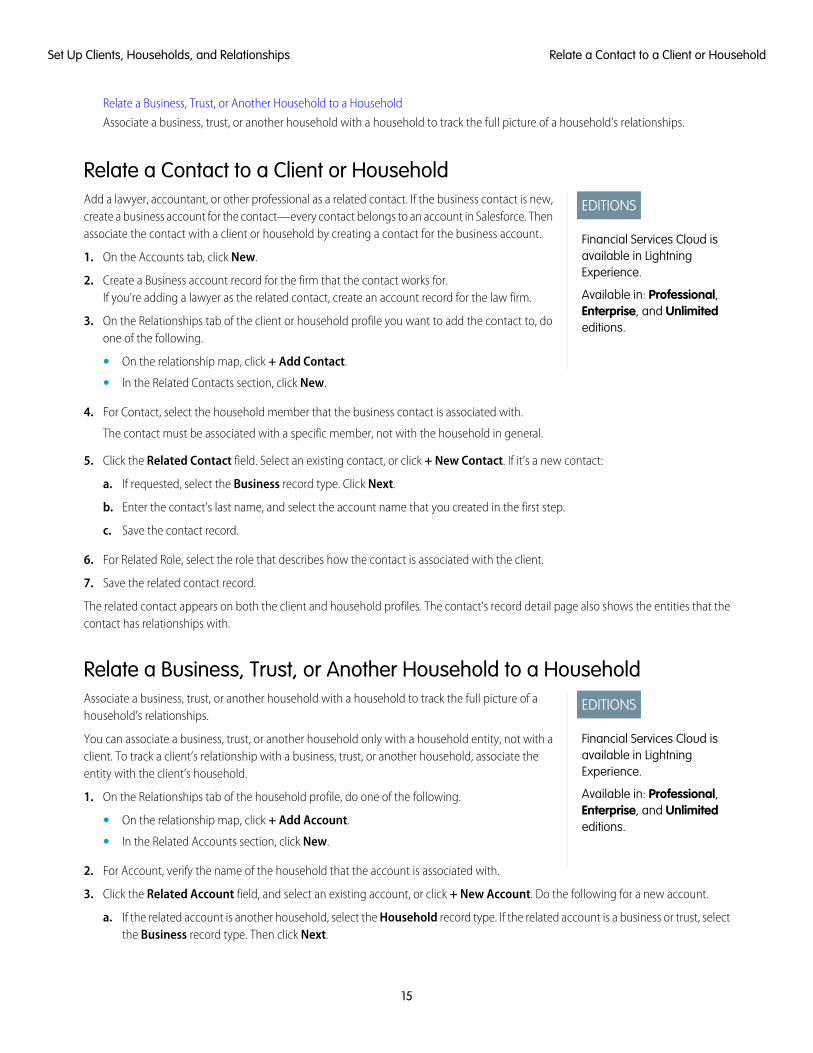
Add a lawyer, accountant, or other professional as a related contact. If the business contact is new,create a business account for the contact—every contact belongs to an account in Salesforce. Thenassociate the contact with a client or household by creating a contact for the business account.
1. On the Accounts tab, click New.
2. Create a Business account record for the firm that the contact works for.If you’re adding a lawyer as the related contact, create an account record for the law firm.
3. On the Relationships tab of the client or household profile you want to add the contact to, doone of the following.
• On the relationship map, click + Add Contact.
• In the Related Contacts section, click New.
4. For Contact, select the household member that the business contact is associated with.
The contact must be associated with a specific member, not with the household in general.
5. Click the Related Contact field. Select an existing contact, or click + New Contact. If it’s a new contact:
a. If requested, select the Business record type. Click Next.
b. Enter the contact’s last name, and select the account name that you created in the first step.
c. Save the contact record.
6. For Related Role, select the role that describes how the contact is associated with the client.
7. Save the related contact record.
The related contact appears on both the client and household profiles. The contact’s record detail page also shows the entities that thecontact has relationships with.
Relate a Business, Trust, or Another Household to a Household
EDITIONS
Financial Services Cloud isavailable in LightningExperience.
Available in: Professional,Enterprise, and Unlimitededitions.
Associate a business, trust, or another household with a household to track the full picture of ahousehold’s relationships.
You can associate a business, trust, or another household only with a household entity, not with aclient. To track a client’s relationship with a business, trust, or another household, associate theentity with the client’s household.
1. On the Relationships tab of the household profile, do one of the following.
• On the relationship map, click + Add Account.
• In the Related Accounts section, click New.
2. For Account, verify the name of the household that the account is associated with.
3. Click the Related Account field, and select an existing account, or click + New Account. Do the following for a new account.
a. If the related account is another household, select the Household record type. If the related account is a business or trust, selectthe Business record type. Then click Next.
15
Relate a Contact to a Client or HouseholdSet Up Clients, Households, and Relationships

b. Enter the account’s name and other optional information.
c. Save the account record.
4. For Related Role, search for the role that describes how the account is associated with the household.
5. Save the related account record.
16
Relate a Business, Trust, or Another Household to aHousehold
Set Up Clients, Households, and Relationships

ACT ON CLIENT RELATIONSHIPS WITH THE ACTIONABLERELATIONSHIP CENTER (ARC)
EDITIONS
Financial Services Cloud isavailable in LightningExperience.
Available in: Professional,Enterprise, and Unlimitededitions.
Financial services industry success is built on developing and maintaining deep and trusted clientrelationships. The Actionable Relationship Center (ARC) gives you a one-stop visualization of yourrelevant client relationships so you can act on new information.
Note: ARC must be enabled by your admin. If you don't see ARC on your client profiles, askyour admin to enable it. Learn more
With ARC, you can explore client relationship layers and related records, whether for B2C or B2Bcontexts. Consider the following common financial services scenarios.
B2C
A wealth advisor advises a high-net-worth client who invests in a charitable trust. The advisor can use ARC to see trusts and charitieswithin the context of the companies that the client’s family is invested in. And the advisor can also see the relationships of the client’srelatives and their accounts.
B2B
An investment banker advises a large technology corporation that plans to make several acquisitions. The organization’s hierarchyinvolves layers of subsidiaries, executive teams, and professional services contractors, such as law firms and accounting firms. The bankercan use ARC to organize all the information.
17

Get to Know ARC
ARC is your one-stop shop for visualizing and managing your client’s related accounts and contacts. Here’s what you must know toget started.
Types of Relationships in ARC
ARC helps users understand relationships among people and businesses by presenting them in an interactive display component.Each relationship type is displayed differently in the interactive ARC visualization.
ARC Integrations
Extend the functionality of ARC using integrations with other features. When available, these features appear in the ARC side panel.
Get to Know ARC
EDITIONS
Financial Services Cloud isavailable in LightningExperience.
Available in: Professional,Enterprise, and Unlimitededitions.
ARC is your one-stop shop for visualizing and managing your client’s related accounts and contacts.Here’s what you must know to get started.
Navigate ARC
You can access ARC from any account in the Financial Services Cloud, control how to view ARC,and see your client’s details, all in one place.
Manage Client Records and Relationships
Conveniently create and manage client records and relationships directly in ARC.
Navigate ARC
EDITIONS
Financial Services Cloud isavailable in LightningExperience.
Available in: Professional,Enterprise, and Unlimitededitions.
You can access ARC from any account in the Financial Services Cloud, control how to view ARC,and see your client’s details, all in one place.
Your view can differ depending on your personalization and any customization by your admin.
Access ARC1. Navigate to the account that you want to view. You can select an account from the Accounts
tab in the navigation bar or you can search for an account by name in the search bar.
2. Select the ARC tab.
18
Get to Know ARCAct on Client Relationships with the Actionable RelationshipCenter (ARC)
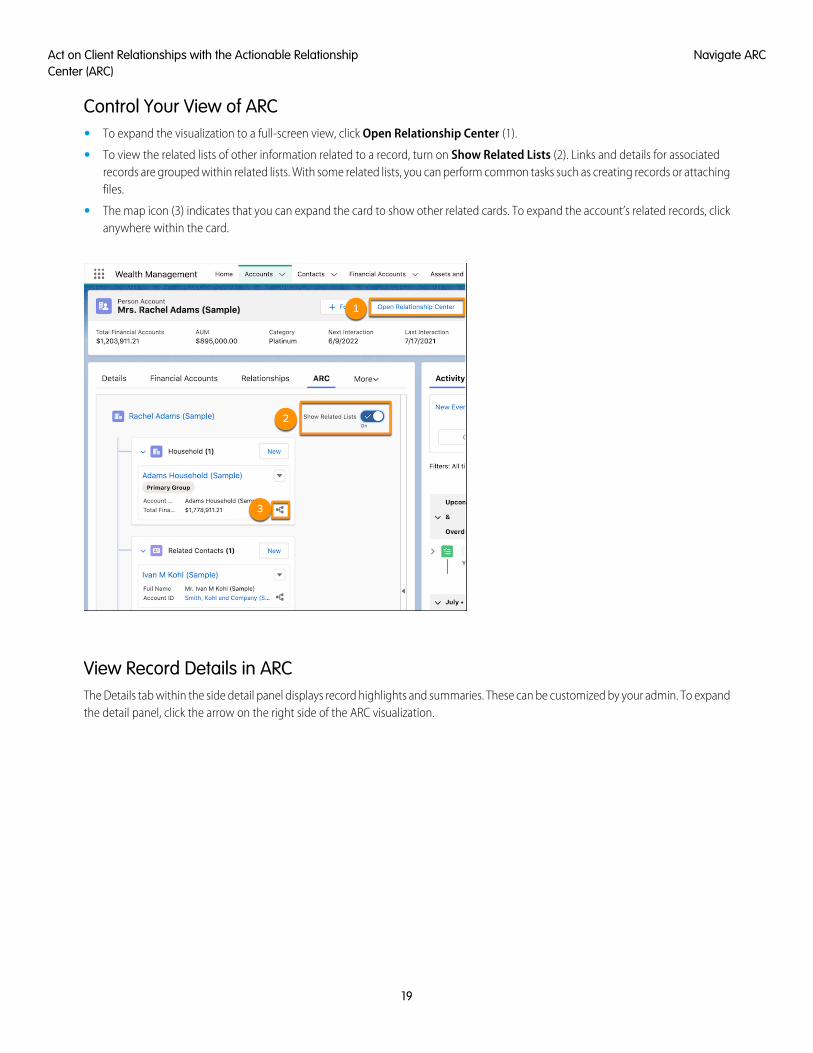
Control Your View of ARC• To expand the visualization to a full-screen view, click Open Relationship Center (1).
• To view the related lists of other information related to a record, turn on Show Related Lists (2). Links and details for associatedrecords are grouped within related lists. With some related lists, you can perform common tasks such as creating records or attachingfiles.
• The map icon (3) indicates that you can expand the card to show other related cards. To expand the account’s related records, clickanywhere within the card.
View Record Details in ARCThe Details tab within the side detail panel displays record highlights and summaries. These can be customized by your admin. To expandthe detail panel, click the arrow on the right side of the ARC visualization.
19
Navigate ARCAct on Client Relationships with the Actionable RelationshipCenter (ARC)

Use the Details tab to conveniently access the same quick actions that are available for the record type. To access quick actions, click thearrow to expand the dropdown menu.
20
Navigate ARCAct on Client Relationships with the Actionable RelationshipCenter (ARC)

SEE ALSO:
Manage Client Records and Relationships
Types of Relationships in ARC
ARC Integrations
Key Terms
Manage Client Records and Relationships
EDITIONS
Financial Services Cloud isavailable in LightningExperience.
Available in: Professional,Enterprise, and Unlimitededitions.
Conveniently create and manage client records and relationships directly in ARC.
Your view can differ depending on your personalization and any customization by your admin.
You can conveniently manage client records and relationships directly from the ARC visualizationin the following ways.
Create a Household in ARC
ARC makes creating households even easier by allowing you to create a household directlyfrom ARC’s visualization.
Create Records and Relationships in ARC
You can create records directly from the ARC visualization.
Edit a Record in ARC
You can edit records that appear in ARC directly on the ARC record card.
Edit or Delete a Relationship in ARC
You can edit records that appear in ARC directly on the ARC record card.
Add a Record to a Related List in ARC
You can view and add items to related lists associated with an account or household directly in ARC.
SEE ALSO:
ARC Integrations
Types of Relationships in ARC
Create a Household in ARC
EDITIONS
Financial Services Cloud isavailable in LightningExperience.
Available in: Professional,Enterprise, and Unlimitededitions.
ARC makes creating households even easier by allowing you to create a household directly fromARC’s visualization.
You can create a household from an account in ARC.
1. Navigate to the account you want to add to a household.
Note: You can select an account from the Accounts tab in the navigation bar or you cansearch for an account by name in the search bar.
2. Select the ARC tab.
3. Find the Household card.
21
Manage Client Records and RelationshipsAct on Client Relationships with the Actionable RelationshipCenter (ARC)

4. Click the New button on the top right of the card.
5. In the Account field, select + New Account.
6. Select Household.
7. Click Next, then enter the information for the household.
8. Click Save.
Create Records and Relationships in ARC
EDITIONS
Financial Services Cloud isavailable in LightningExperience.
Available in: Professional,Enterprise, and Unlimitededitions.
You can create records directly from the ARC visualization.
1. On the account page, click the ARC tab.
2. To select the type of relationship, click New. The available relationships depend on your admin’sconfiguration settings.
22
Manage Client Records and RelationshipsAct on Client Relationships with the Actionable RelationshipCenter (ARC)

3. To add a record, select either + New Account or + New Contact. To add an existing record, search for the account or contact nameby entering it into the respective field.
4. Select a record type.
5. Complete the required fields in the New Account form.
Edit a Record in ARC
EDITIONS
Financial Services Cloud isavailable in LightningExperience.
Available in: Professional,Enterprise, and Unlimitededitions.
You can edit records that appear in ARC directly on the ARC record card.
1. Navigate to the record card for the record you want to edit.
2. Click the dropdown arrow, and select Edit.
3. Change information on the record form as desired.
4. Make your changes, and click Save.
23
Manage Client Records and RelationshipsAct on Client Relationships with the Actionable RelationshipCenter (ARC)

Edit or Delete a Relationship in ARC
EDITIONS
Financial Services Cloud isavailable in LightningExperience.
Available in: Professional,Enterprise, and Unlimitededitions.
You can edit records that appear in ARC directly on the ARC record card.
1. In ARC, navigate to the relevant relationship card.
2. Click the dropdown arrow.
3. To edit a relationship, select Edit Relationship, make your changes, and save.
4. To delete a relationship, select Remove Relationship.
Add a Record to a Related List in ARC
EDITIONS
Financial Services Cloud isavailable in LightningExperience.
Available in: Professional,Enterprise, and Unlimitededitions.
You can view and add items to related lists associated with an account or household directly inARC.
1. In ARC, navigate to the account you want to add a related record to, and click the ARC tab.
2. If your related lists aren’t visible, enable the Show Related Lists toggle.
24
Manage Client Records and RelationshipsAct on Client Relationships with the Actionable RelationshipCenter (ARC)

3. Find the Related List card that best suits the record you want to add, and click New.
Note: Your Related List options are the same options that appear on the Related tab of the record page. ARC shows up to 10related lists, and the available options appear below the other ARC elements.
4. If the record is new, complete the standard form for the related list. If it’s an existing record, you can search for it in the form. Forexample, to add an existing insurance policy to an account’s insurance policy related list, search for the policy number in the popup.
25
Manage Client Records and RelationshipsAct on Client Relationships with the Actionable RelationshipCenter (ARC)
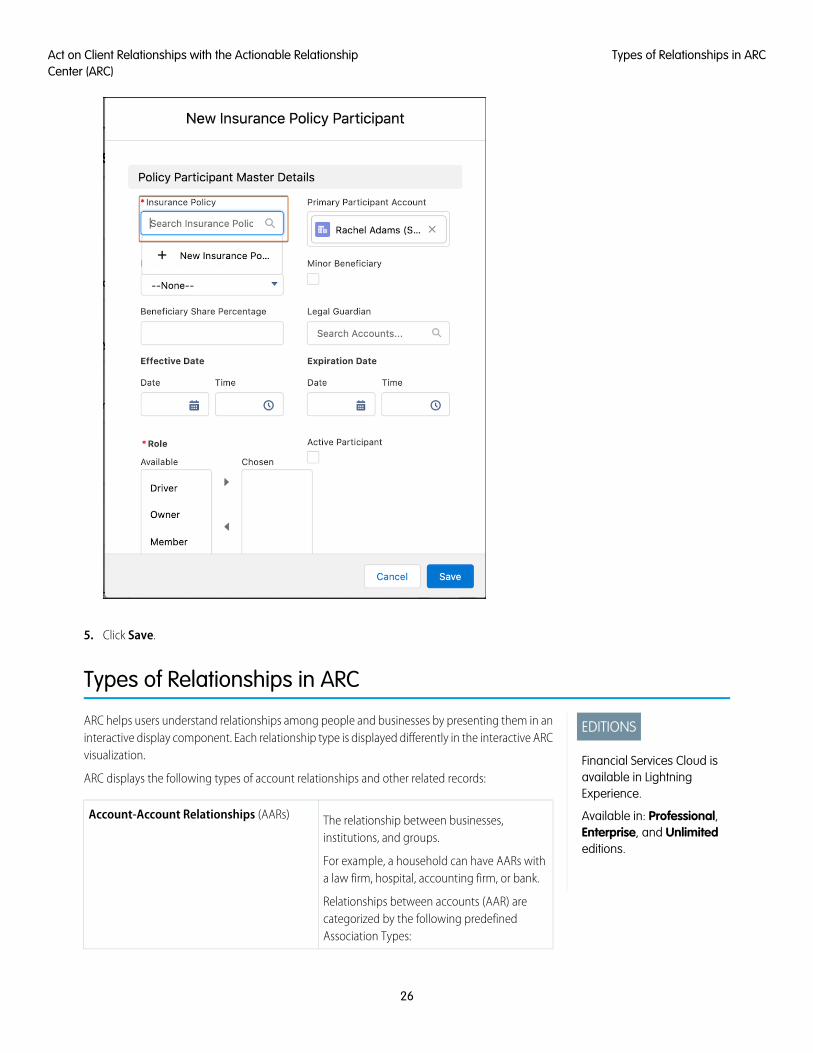
5. Click Save.
Types of Relationships in ARC
EDITIONS
Financial Services Cloud isavailable in LightningExperience.
Available in: Professional,Enterprise, and Unlimitededitions.
ARC helps users understand relationships among people and businesses by presenting them in aninteractive display component. Each relationship type is displayed differently in the interactive ARCvisualization.
ARC displays the following types of account relationships and other related records:
The relationship between businesses,institutions, and groups.
For example, a household can have AARs witha law firm, hospital, accounting firm, or bank.
Account-Account Relationships (AARs)
Relationships between accounts (AAR) arecategorized by the following predefinedAssociation Types:
26
Types of Relationships in ARCAct on Client Relationships with the Actionable RelationshipCenter (ARC)

• Group: Indicates that an Account is a group that contains otheraccounts. For example, a parent company account can havea Group Relationship with one or more subsidiary accounts.Or, a household can be a group with related members.
• Member: Indicates that the first account belongs to the secondaccount in some way. For example, a person account can bea member of a household account.
• Peer: Indicates that the primary and secondary accounts arerelated, but don’t contain or control each other. For example,a business account can have a Peer relationship to anotherbusiness that is an important supplier.
The relationship between a person and a business or other account.ACRs can aggregate contact details in a group account. Assign
Account-Contact Relationships (ACRs)
roles to contacts in a group account, such as primary, spouse, anddependent.
For example, a business can have an ACR with the person who actsas the business’ vendor.
The relationship between two people that aren’t within the samehousehold or account. CCR relationships help you develop referrals,leads, and opportunities.
For example, the relationship between a borrower and a lendercan be a CCR.
Contact-Contact Relationships (CCRs)
ARC Integrations
EDITIONS
Financial Services Cloud isavailable in LightningExperience.
Available in: Professional,Enterprise, and Unlimitededitions.
Extend the functionality of ARC using integrations with other features. When available, these featuresappear in the ARC side panel.
Note: Your admin must configure these integrations. You won’t see these options if youradmin hasn’t configured them.
• Compliant Data Sharing: on page 37 Compliant data sharing allows an account or opportunityrecord owner to share a record with other relevant users.
• Einstein Relationship Insights: Einstein Relationship Insights displays intelligentrecommendations from the web that enable you to expand your relationship networks withinARC. With ERI, you can uncover hidden relationships, create records for valid recommendations,and dismiss invalid recommendations.
27
ARC IntegrationsAct on Client Relationships with the Actionable RelationshipCenter (ARC)

28
ARC IntegrationsAct on Client Relationships with the Actionable RelationshipCenter (ARC)

ENTER AND VIEW FINANCIAL DATA
EDITIONS
Financial Services Cloud isavailable in LightningExperience.
Available in: Professional,Enterprise, and Unlimitededitions.
Create records for clients’ financial accounts and their underlying holdings, assets, liabilities, andfinancial goals.
The types of financial accounts available vary between the Retail Banking and Wealth Managementapps. Also, your Salesforce admin can increase or restrict the types of accounts available.
Manually Add a Financial Account
Information for an investment account, bank account, or insurance policy is typically updatedautomatically from an external system. However, you can also manually create a financialaccount.
View Financial Account Transactions
Use the financial account’s Related items to view its transactions.
View Financial Account Billing Statements
Use the financial account’s Related items to view its billing statements.
View Holdings Within an Investment Account
You can view the holdings of an investment account.
Add Holdings to an Investment Account
You can add purchase history and details about financial holdings in an investment account.
Manually Create Securities Records
Enter information about securities, such as stocks or bonds. While this data is typically updated automatically from external systems,here’s how to enter a securities record manually.
Add an Asset or Liability
You can add information about tangible assets, such as real estate or collectibles, or liabilities, such as mortgages or loans.
Add a Financial Goal
Create a financial goal to track a client’s progress toward major purchases, retirement savings, or other life goals. You can only createsavings-oriented goals. You can’t create a goal for paying down a debt. You also can’t associate a goal with a specific financial account.
Add a Financial Account Role
Enter information about a client’s involvement with a financial account, such as joint owner, a beneficiary, or trustee.
Manually Add a Financial Account
EDITIONS
Financial Services Cloud isavailable in LightningExperience.
Available in: Professional,Enterprise, and Unlimitededitions.
Information for an investment account, bank account, or insurance policy is typically updatedautomatically from an external system. However, you can also manually create a financial account.
1. On the Financials (Retail Banking) or Financial Accounts (Wealth Management) tab of the clientor household profile, click New in the section for the account you want to create.
2. Enter the relevant information.
The Primary Owner can be a household member or an organizational entity. It can’t be ahousehold.
29

For an investment account, if your firm manages or administers the account, select Managed. This setting rolls up the accountbalance to the household's assets under management (AUM) field. If the account is an in-house product, make sure that HeldAway is not selected.
3. Save the information.
You can edit or delete a financial account from the Financials tab and Financial Accounts tab.
If you created the financial account from the client profile and the client’s financial account information is summarized at thehousehold level, the account is visible in the household profile. If the financial account is jointly owned, the full balance is displayedin each account owner's profile.
However, if some or all account owners belong to the same household and their financial account summaries roll up to the primarygroup, the balance is counted only once in the summary calculation.
If the primary owner is an organization, the balance is included in the client’s household rollup summary if Include in Group isenabled on the organization's relationship with the client.
SEE ALSO:
Create a Wallet Share Opportunity
View Financial Account Transactions
EDITIONS
Financial Services Cloud isavailable in LightningExperience.
Available in: Professional,Enterprise, and Unlimitededitions.
Use the financial account’s Related items to view its transactions.
1. On the Financials (Retail Banking) or Financial Accounts (Wealth Management) tab of the clientor household profile, click the name of the financial account you want to view.
2. On the Related tab, locate the Financial Account Transactions item.
3. If necessary, click View All to see all transactions.
View Financial Account Billing Statements
EDITIONS
Financial Services Cloud isavailable in LightningExperience.
Available in: Professional,Enterprise, and Unlimitededitions.
Use the financial account’s Related items to view its billing statements.
1. On the Financials (Retail Banking) or Financial Accounts (Wealth Management) tab of the clientor household profile, click the name of the financial account you want to view billing statementsfor.
2. On the Related tab, locate the Billing Statements item.
3. If necessary, click View All to see all statements.
4. To view a statement, click it.
View Holdings Within an Investment Account
You can view the holdings of an investment account.
30
View Financial Account TransactionsEnter and View Financial Data
• On the Financial Accounts tab of the client or household profile, click the arrow icon to the left of the investment account name toexpand the list of investments.
If you don’t see an icon, holdings information isn’t available.
SEE ALSO:
Add Holdings to an Investment Account
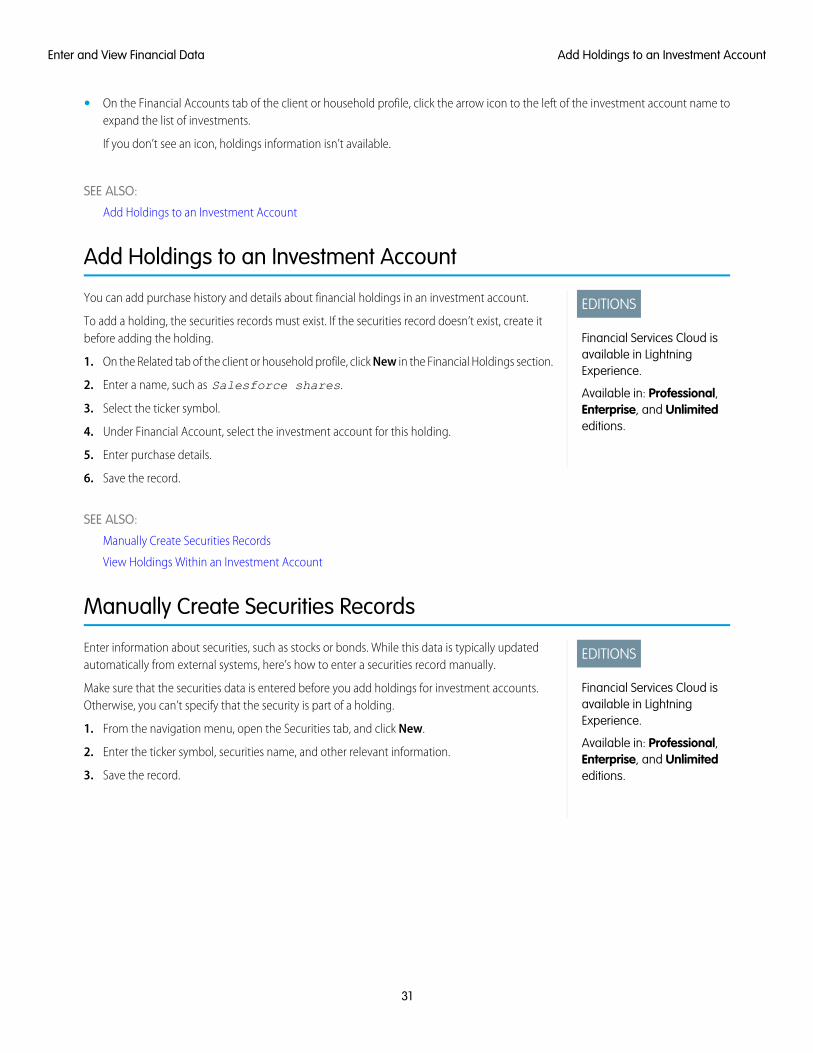
Add Holdings to an Investment Account
EDITIONS
Financial Services Cloud isavailable in LightningExperience.
Available in: Professional,Enterprise, and Unlimitededitions.
You can add purchase history and details about financial holdings in an investment account.
To add a holding, the securities records must exist. If the securities record doesn’t exist, create itbefore adding the holding.
1. On the Related tab of the client or household profile, click New in the Financial Holdings section.
2. Enter a name, such as Salesforce shares.
3. Select the ticker symbol.
4. Under Financial Account, select the investment account for this holding.
5. Enter purchase details.
6. Save the record.
SEE ALSO:
Manually Create Securities Records
View Holdings Within an Investment Account
Manually Create Securities Records
EDITIONS
Financial Services Cloud isavailable in LightningExperience.
Available in: Professional,Enterprise, and Unlimitededitions.
Enter information about securities, such as stocks or bonds. While this data is typically updatedautomatically from external systems, here’s how to enter a securities record manually.
Make sure that the securities data is entered before you add holdings for investment accounts.Otherwise, you can’t specify that the security is part of a holding.
1. From the navigation menu, open the Securities tab, and click New.
2. Enter the ticker symbol, securities name, and other relevant information.
3. Save the record.
31
Add Holdings to an Investment AccountEnter and View Financial Data
Add an Asset or Liability
EDITIONS
Financial Services Cloud isavailable in LightningExperience.
Available in: Professional,Enterprise, and Unlimitededitions.
You can add information about tangible assets, such as real estate or collectibles, or liabilities, suchas mortgages or loans.
1. On the Financials (Retail Banking), Financial Accounts (Wealth Management), or Related tab ofthe client or household profile, click New in the Assets and Liabilities section.
2. Select Asset or Liability.
3. Enter the information and save the record.
Add a Financial Goal
EDITIONS
Financial Services Cloud isavailable in LightningExperience.
Available in: Professional,Enterprise, and Unlimitededitions.
Create a financial goal to track a client’s progress toward major purchases, retirement savings, orother life goals. You can only create savings-oriented goals. You can’t create a goal for paying downa debt. You also can’t associate a goal with a specific financial account.
1. On the Goals tab of the client or household profile, click New in the Goals Summary section.
2. Enter a name for the goal.
3. Select the household member who is the goal’s primary owner.
4. Enter the relevant information and save the record.
If you created the goal from the client profile and the client’s goals are summarized at thehousehold level, the goal is also visible in the household profile.
You can edit or delete a goal in the Goals tab or the Related tab.
Add a Financial Account Role
EDITIONS
Financial Services Cloud isavailable in LightningExperience.
Available in: Professional,Enterprise, and Unlimitededitions.
Enter information about a client’s involvement with a financial account, such as joint owner, abeneficiary, or trustee.
1. On the Financials (Retail Banking) or Financial Accounts (Wealth Management) tab of the clientprofile, click New in the Financial Account Roles section.
2. Select the financial account and the role that describes the client’s involvement.
3. Enter the relevant information and save the record.
Note: On the Related tab of the client profile, you can see all the financial account rolesthat the client has. The Related list includes the Primary Owner and Joint Owner roles,which are created and updated automatically when you indicate that the client is a primaryor joint owner on a financial account record.
32
Add an Asset or LiabilityEnter and View Financial Data

MANAGE CLIENT INTERACTIONS
EDITIONS
Financial Services Cloud isavailable in LightningExperience.
Available in: Professional,Enterprise, and Unlimitededitions.
It's easy to track tasks, client communications, and account-related issues.
Create a Case from Financial Accounts
Create a case for questions, feedback, and other issues related to financial accounts. You canthen track the case on the financial account or client profile page.
Track Client Interactions
Track tasks and events and log client communications to maintain a history of your clientinteractions.
Create a Case from Financial Accounts
EDITIONS
Financial Services Cloud isavailable in LightningExperience.
Available in: Professional,Enterprise, and Unlimitededitions.
Create a case for questions, feedback, and other issues related to financial accounts. You can thentrack the case on the financial account or client profile page.
1. From a client’s profile, click Financial Accounts.
2. Next to a financial account name, from the dropdown menu, select New Case.
3. Enter the information about the case.
4. Save your changes.
The case is associated with the client’s financial account.
33

SEE ALSO:
Set Up and Manage Cases
Track Client Interactions
EDITIONS
Financial Services Cloud isavailable in LightningExperience.
Available in: Professional,Enterprise, and Unlimitededitions.
Track tasks and events and log client communications to maintain a history of your client interactions.
1. On the client profile, go to the Activity tab.
2. On the appropriate tab, schedule a task or event, send an email, or log a call.If a client’s tasks or events are included in their household’s rollup summary, they are alsodisplayed on the household profile’s Activities Related List on the Related tab.
Consider the following when tracking client interactions.
• Your Salesforce admin can designate which activities affect the Last Interaction and NextInteraction dates that you see on the client and household profiles. Ask your admin for details.
• You enter Last Review and Next Review dates manually. These dates are not calculatedautomatically based on a client’s review frequency. Last Review and Next Review dates are not related to the client’s task or eventdates, even if a task or event is a review meeting.
SEE ALSO:
Tasks
34
Track Client InteractionsManage Client Interactions

TRACK LEADS AND OPPORTUNITIES
EDITIONS
Financial Services Cloud isavailable in LightningExperience.
Available in: Professional,Enterprise, and Unlimitededitions.
Quickly create wallet share opportunities, track prospects, and convert leads.
Create a Wallet Share Opportunity
To track a wallet share opportunity, create an opportunity record for a financial account.
Create a Lead
Create a lead record to track a prospect.
Convert a Lead to a Client
You can convert a lead record to a client record.
Create a Wallet Share Opportunity
EDITIONS
Financial Services Cloud isavailable in LightningExperience.
Available in: Professional,Enterprise, and Unlimitededitions.
To track a wallet share opportunity, create an opportunity record for a financial account.
1. On the Financials (Retail Banking) or Financial Accounts (Wealth Management) tab on the clientprofile, select the actions icon next to the name of the financial account.
2. Select New Opportunity (Wallet Share).
3. Enter the name and stage, adjust the close date if necessary, and add any other relevant details.
4. Save the record.
SEE ALSO:
Opportunities
Create a Lead
EDITIONS
Financial Services Cloud isavailable in LightningExperience.
Available in: Professional,Enterprise, and Unlimitededitions.
Create a lead record to track a prospect.
1. From the navigation bar, go to the Leads list view, and click New.
2. Select the appropriate lead record type, and click Next.
3. Enter the name, company name, lead status, and other relevant details.
4. Save the information.
35

Convert a Lead to a Client
EDITIONS
Financial Services Cloud isavailable in LightningExperience.
Available in: Professional,Enterprise, and Unlimitededitions.
You can convert a lead record to a client record.
1. On the lead detail page, click Convert.
2. Click in Account Name, and select New Account.
3. Select the Individual record type, and click Next.
4. Enter relevant details.
5. Save the new account.
6. If you want to create an opportunity record associated with the converted lead, enter anopportunity name.
7. Click Convert.
8. Close the confirmation message, or click Go to Leads to create more lead records.
36
Convert a Lead to a ClientTrack Leads and Opportunities

WORK WITH COMPLIANT DATA SHARING
EDITIONS
Financial Services Cloud isavailable in LightningExperience.
Available in: Professional,Enterprise, and Unlimitededitions.
Administrators can enable Compliant Data Sharing for Account and Opportunity objects.Administrators and compliance managers then configure data sharing roles with associated accesslevels to adhere to compliance with regulations and company policies. An account or opportunityrecord owner shares a record with other relevant users.
A participant is an internal user who’s been assigned a Participant Role for a record. The participantrole assigned to the participant determines their record access level.
Add Participants to Records for Compliant Data Sharing
Record owners and non-owner participants who have edit access to a record can assignparticipants to that record.
Manage Participants for Private Opportunities in Compliant Data Sharing
When an opportunity is private, it can’t be shared with Compliant Data Sharing.
View Users with Compliant Data Sharing Record Access
To see all the users who have access to a record you own, use the Sharing button on the record’s detail page.
Add Participants to Records for Compliant Data Sharing
EDITIONS
Financial Services Cloud isavailable in LightningExperience.
Available in: Professional,Enterprise, and Unlimitededitions.
Record owners and non-owner participants who have edit access to a record can assign participantsto that record.
Records for objects that have Compliant Data Sharing enabled show participants in a related list.Add a participant to a record using the participant related list.
Note: If the relevant related list isn’t on your page layout, talk to your Salesforce administrator.
Note: A record can have a maximum of 20 participants.
1. From the object detail page, click the Related tab.
2. In the Account Participants or Opportunity Participants related list, click New. In the windowthat opens, the Account or Opportunity field is set to the current record.
3. Enter the name of an active participant role in Participant Role, and select the role from the list.
Note: Participant Roles aren’t shared between objects. Enter an account participant role for an account record or an opportunityparticipant role for an opportunity record.
4. Enter notes or instructions to users about this role in Comments.
5. Select a user or a participant group in Member.
Note: A user must have the Use Compliant Data Sharing Permission to be an account or opportunity participant.
a. To add a user, select People from the dropdown list.
b. To add a participant group, select Group from the dropdown list.
37

c. Enter the name of the user or participant group to add, and select it from the dropdown list.
Note: If you select a user who doesn’t have the Use Compliant Data Sharing permission, you receive an error when youclick Save.
6. Select Active. If Active is disabled, no share table entries are created. If Active is enabled, share table entries are created when theorg-wide sharing default is less than the sharing access defined by the selected participant role.
7. Click Save.
SEE ALSO:
Financial Services Cloud Administrator Guide : Configure Page Layouts for Compliant Data Sharing
Manage Participants for Private Opportunities in Compliant DataSharing
EDITIONS
Financial Services Cloud isavailable in LightningExperience.
Available in: Professional,Enterprise, and Unlimitededitions.
When an opportunity is private, it can’t be shared with Compliant Data Sharing.
You can’t assign opportunity participants to an opportunity set to Private.
If an opportunity record has opportunity participants with associated share table entries, the sharetable records are deleted when Private is enabled for the opportunity. The opportunity participantrecords aren’t deleted when Private is enabled for the opportunity.
Note: We recommend that you delete all opportunity participants for an opportunity beforeenabling Private for that opportunity.
If a private opportunity has opportunity participants and Private is disabled, share table recordsaren’t generated even when the associated participant role access is greater than that granted byorganization-wide defaults. To create share table records for an existing opportunity participant of a previously private opportunity:
• Delete and recreate the opportunity participant.
• Edit the opportunity participant record, deselect Active and save your work. Then edit the same opportunity participant record,select Active, and save your work.
View Users with Compliant Data Sharing Record Access
EDITIONS
Financial Services Cloud isavailable in LightningExperience.
Available in: Professional,Enterprise, and Unlimitededitions.
To see all the users who have access to a record you own, use the Sharing button on the record’sdetail page.
The Sharing Detail page in Salesforce Classic shows users with access to a record, their level ofaccess, and the reason they have access. The share table entries for Compliant Data Sharing showa sharing reason of Compliant Data Sharing.
Note: You must be an administrator or the record owner to see the Sharing button on arecord’s detail page.
Note: Non-owner users only have sharing table records when their assigned level of accessexceeds that granted by default in your org.
To see users with access to a specific account or opportunity record:
1. In Salesforce Classic click the Accounts or Opportunities tab.
38
Manage Participants for Private Opportunities in CompliantData Sharing
Work with Compliant Data Sharing

2. To see all records:
a. For account records on the Accounts or tab, click All Accounts and click Go.
b. For opportunity records, on the Opportunities or tab, click All Opportunities and click Go.
3. Select the account or opportunity name to view.
4. Click Sharing. The list shows of users with access to the record. Account participant and opportunity participant users are shownwith a sharing reason of Compliant Data Sharing.
5. To see an expanded list of users, including administrators, with access to the record, click Expand List.
6. In the expanded view, click Why? next to a user for details about how this user obtained their access level.
SEE ALSO:
Financial Services Cloud Administrator Guide : Add the Sharing Button to Page Layouts
39
View Users with Compliant Data Sharing Record AccessWork with Compliant Data Sharing

USE FINANCIAL SERVICES CLOUD TABLEAU CRMSOLUTIONS
EDITIONS
Available in LightningExperience for an extra costin Professional, Enterprise,and Unlimited Editions
Financial Services Cloud offers you advanced analytics solutions based on Tableau CRM to help yougrow and manage your business. Tableau CRM for Financial Services, a comprehensive set of TableauCRM dashboards, helps financial service executives and managers, advisors, and personal bankersmanage their books of business with insights about client goals and satisfaction, leads, and referrals.Client Segmentation App, which replaces the dashboards formerly available through the FinancialServices Cloud Advisor Analytics tab, helps financial advisors identify high-potential clients foroutreach.
Use Analytics for Wealth Management
Analytics for Wealth Management gives financial advisors, personal bankers, and managers a complete customer intelligence solution.
Use Analytics for Insurance
Analytics for Insurance dashboards give insurance agents and managers a complete customer intelligence solution.
Use Insurance Claims and Policy Analytics Dashboards
Insurance Claims and Policy Analytics dashboards give you actionable insights that enable you to effectively manage your claims,quotes, and policies.
Use Analytics for Retail Banking
Analytics for Retail Banking dashboards visualize all the metrics and key performance indicators (KPIs) personal bankers require togrow client relationships.
Use Consumer Banking Starter Analytics
The Consumer Banking Starter Analytics gets you started with a dashboard personal bankers can use to move clients up the valuechain.
Use Wealth Starter Analytics
The Wealth Starter Analytics app helps financial advisors get started fast analyzing the success of your financial services business.
Use the Client Segmentation App
Client Segmentation App dashboards help you gain insights across your book of business to deepen client relations. It’s enabled bya license that provides restricted access to Tableau CRM features.
SEE ALSO:
Personalize the Navigation Bar in Lightning Experience
Explore Data and Take Action with Tableau CRM
Track Client Interactions
40
Use Analytics for Wealth Management
EDITIONS
Available in LightningExperience for an extra costin Professional, Enterprise,and Unlimited Editions
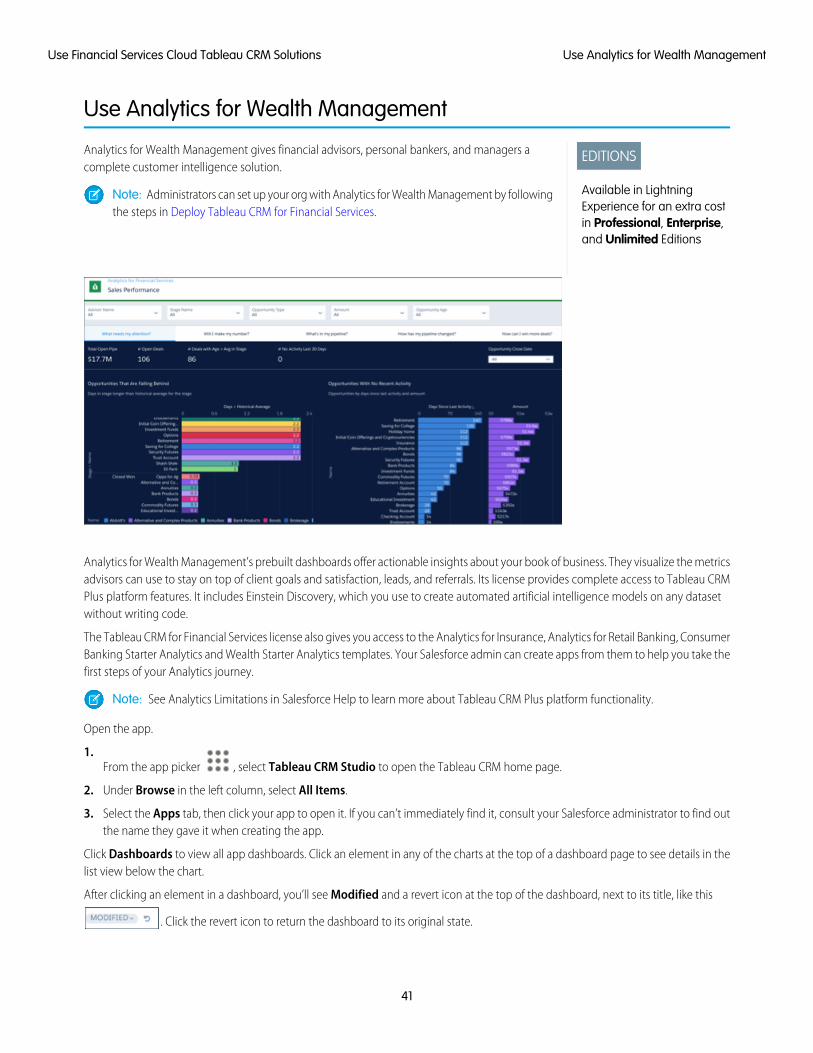
Analytics for Wealth Management gives financial advisors, personal bankers, and managers acomplete customer intelligence solution.
Note: Administrators can set up your org with Analytics for Wealth Management by followingthe steps in Deploy Tableau CRM for Financial Services.
Analytics for Wealth Management’s prebuilt dashboards offer actionable insights about your book of business. They visualize the metricsadvisors can use to stay on top of client goals and satisfaction, leads, and referrals. Its license provides complete access to Tableau CRMPlus platform features. It includes Einstein Discovery, which you use to create automated artificial intelligence models on any datasetwithout writing code.
The Tableau CRM for Financial Services license also gives you access to the Analytics for Insurance, Analytics for Retail Banking, ConsumerBanking Starter Analytics and Wealth Starter Analytics templates. Your Salesforce admin can create apps from them to help you take thefirst steps of your Analytics journey.
Note: See Analytics Limitations in Salesforce Help to learn more about Tableau CRM Plus platform functionality.
Open the app.
1.From the app picker , select Tableau CRM Studio to open the Tableau CRM home page.
2. Under Browse in the left column, select All Items.
3. Select the Apps tab, then click your app to open it. If you can’t immediately find it, consult your Salesforce administrator to find outthe name they gave it when creating the app.
Click Dashboards to view all app dashboards. Click an element in any of the charts at the top of a dashboard page to see details in thelist view below the chart.
After clicking an element in a dashboard, you’ll see Modified and a revert icon at the top of the dashboard, next to its title, like this
. Click the revert icon to return the dashboard to its original state.
41
Use Analytics for Wealth ManagementUse Financial Services Cloud Tableau CRM Solutions

In dashboard pages with a details table, take action from the table by rolling the cursor over an item in the Name column. Then, clickthe disclosure triangle at the right and select an action from the menu that appears.
Dashboards for Financial Advisors and Personal BankersView these dashboards by clicking Financial Advisor Home. Advisors and personal bankers start here for summary metrics about thestate of the business. Click Open Dashboard beneath the summaries to drill into details behind the summary metrics.
Client Acquisition dashboard. Target high-opportunity leads for immediate action and provides insights into leads/referral sources,conversion rates, and trending. Organized into the following pages:
• What needs attention? Identifies leads that have stalled, or have had no activity, for immediate action.
• Lead/Referral Sources. Identifies high opportunity leads and referrals.
• Tracking leads/referrals. Visualizes what’s happened to leads and how far they’ve proceeded if they haven’t converted yet.
• Conversion. Shows the kinds of leads and referrals you’ve had most success with by product, time, and number of touches or activities.
• Lead pipeline trending. Provides insight into how leads have changed over time and flow of leads in and out of the pipe in betweenthose two snapshots. Select different dates in the filters at left to change the time period.
See additional detail on page 48.
Client Interactions dashboard. Identify clients who may require immediate action and track and understand the results of clientmanagement activities. Organized into the following pages:
• Overview. Shows clients that may have been neglected and their importance according to assets under management (AUM) or othermetrics. Also shows days since last contact with clients, clients whose AUM has dropped, and clients with overdue tasks.
• Activity History. Shows how an advisor has spent their time according to activity type and time period.
• Activity Outcomes. Shows the results of activities. Click any week to see clients that you met that week and metrics for those clients,including AUM, deposits, wallet share, and assets under advisement.
See additional detail on page 50.
Events and Seminars dashboard. Track the performance of events and seminars. Start by visualizing attendance across events overtime, and then drill into event performance by costs, response rates, and conversion rates. Data comes from the Campaign object, wherecampaign type is Event.
See additional detail on page 51.
My Book of Business dashboard. Start with an overview of your financial book of business and how it has changed over time. Includesalerts to changes compared to last month, quarter, and year. Drill into data through the following pages:
• Product Portfolio Mix. Provides insight into which products provide the opportunity to boost sales based on current and historic mix.
• Transactions. Shows the net inflow to and outflow from your portfolio and identifies clients who have added or withdrawn fromtheir accounts.
• Earnings and Fees. Visualizes advisor commissions and fees and revenues for the entire organization
See additional detail on page 45.
My Clients dashboard. Identify clients for appropriate action based on recency of interactions with them, attrition risk, or portfoliovalue. Organized into the following pages:
• Who needs my attention? Single out clients at risk of possible attrition or who may need extra attention. Shows clients who havewithdrawn funds, lost funds in the market, or logged cases with customer service.
• Who are my top clients? Organizes specific clients based on their wallet share and length of relationship with the company so youcan see which ones require most attention.
42
Use Analytics for Wealth ManagementUse Financial Services Cloud Tableau CRM Solutions

• What demographics do I serve? Helps you better understand the profile of a typical client and high-net-worth clients. Categorizesclients by net worth, length of relationship, geography, and other criteria.
• Are clients reaching their goals? Identify clients who may need help progressing toward their financial goals. Shows progress towardgoals by client type, percent completion of goals, and size of goals.
See additional detail on page 47.
My Households dashboard. Similar to My Clients, except focused on households. Not all metrics from accounts roll up to the householdlevel, so shows separate pages for only top households and demographics.
See additional detail on page 52.
Sales Performance dashboard. Visualize progress toward sales goals over time. Organized into the following pages:
• What needs my attention? Highlights high-value opportunities that require immediate action from the team. Shows opportunitiesthat have stayed in a stage longer than the average for the stage, and those where there's no recent activity.
• Will I make my number? Shows your team's progress toward quota, including your target and the number of business days left in theperiod. View quarter-over-quarter and year-over-year historic comparisons and select new or existing customers. View contributionsof individual team members by selecting them from the Advisor Name global filter at the top.
• What's in my pipeline? To help you zero in on high-opportunity segments of the pipeline, shows open pipe by stage, market segment,and opportunity type. Also shows total open pipe and open deals.
• How has my pipeline changed? Trends your pipeline, showing how it has changed between two dates (for example, quarter to date)for opportunities that are forecast to close within a specific time period. Change the Pipeline Start and End Date filter to view dealsfor a preset period (year, quarter, month, and so on), or select a custom period.
• How can I win more deals? Visualizes how and why advisors, bankers, and managers can win more deals (or lose them) by marketsegment and opportunity type, and over time.
See additional detail on page 53.
Dashboards for Executives and ManagersManagers and executives start here to evaluate the performance of the performance of advisors and bankers who report to them at theteam/office and regional levels. Team key performance indicators include assets under management, closed won business, andleads/referrals. Click Open Dashboard beneath the summaries to drill into details behind the KPIs. The dashboards assume a structureof State City Advisor, with filters for each category. You can customize them to reflect your own hierarchy if it’s different.
Team Book of Business dashboard. Provides a team view of the book of business. Organized into the following pages:
• Team Leaderboard. The default page, ranking team members according to total AUM, total financial accounts, and new AUM.
• Regional View. Ranks performance by geographic location.
• Drivers of Success. View correlations between performance and activities. Select performance metrics such as $AUM or #Clients andsee the correlation with progress metrics related to any activity, lead, or opportunity.
• Comparative Trend. Review advisor progress over time so you can see how each team member performs in their first few months oras compared to their peers.
• 1-on-1 Helper. Provides performance metrics and rankings for your personal bankers.
Team Sales Performance dashboard. Evaluate each advisor's performance with focus on whether they will make their quotas. Rankteam members using three different metrics and track performance of each advisor for the quarter. And drill down to individualopportunities in the details table. Select Opportunity Processing to evaluate advisor efficiency.
Team Client Acquisition dashboard. Evaluate advisor effectiveness at bringing new clients into the business. The main chart showshow each team member’s leads progress through the pipeline. The secondary charts show conversion rates and the number of touches
43
Use Analytics for Wealth ManagementUse Financial Services Cloud Tableau CRM Solutions

required to convert leads and referrals. Select Events and Seminars to view the effectiveness of those activities at a regional and officelevel based on attendance, costs, conversion rates, and other KPIs.
Dashboards for EmbeddingTableau CRM for Financial Services includes dashboards that can be embedded and accessed in Lightning Experience pages. YourSalesforce administrator can embed the dashboards for your organization.
Home. Intended for providing top-level metrics and insights to advisors through the Financial Services Cloud Wealth Managementapplication. It can be embedded anywhere you want to view Tableau CRM insights. It includes two tabs:
• Current Clients. Shows key client metrics, such as number of clients, households, balances, and AUM, for the current and previousmonth. Also displays clients with the larges and smallest AUM change over the past seven days.
• Growing My Business. Shows you the number of open leads/referrals and helps you determine if you can make your quarterlysales numbers.
Financial Account. Shows an account’s history and assets under management, total financial assets, and client net worth. Intended foraccess through a financial accounts record page.
Goal. Shows a client’s progress toward a financial goal, for example saving for college education or retirement. Includes the targetamount, percent completion, and elapsed time. Intended for access through a financial goals record page.
Lead & Referral. Intended for access through a lead or referral record page. Includes a carousel with four cards.
• Lead Source. Shows your success converting leads from a particular source. Includes the source of the lead and the percentagecompletion rate of leads from that source. Also shows comparison to your average conversion rate for leads from all sources.
• Product Interest. Shows your success converting leads for a particular product.
• Is this lead/referral receiving enough attention? Shows length of time a lead has been open and activities for the lead comparedwith activities for all leads.
• Is this lead/referral progressing as expected? Indicates whether a lead is ahead of or behind the overall conversion rate for allleads from the source.
Opportunity. Intended for access through a product record page. Includes a carouselwith three cards.
• Product Win Rate. Helps you gauge the opportunity for selling the product. Shows the win rate for a product in comparison to thewin rate for all your products. Also tells you the rank for that product’s win rate compared to all your products. (Shown for a 401 K.)
• Total Closed Business. Shows closed business for the product.
• Opportunity Progress: Age in Stage. Shows the progress of the opportunity through stages in your selling process.
Intended for access through a product record page.
44
Use Analytics for Wealth ManagementUse Financial Services Cloud Tableau CRM Solutions

Use the My Book of Business Dashboard
Financial advisers: Start with an overview of your financial book of business and how it has changed over time. Get alerts aboutchanges compared to last month, quarter, and year. And dig deeper to see which of your products are used the most, deposits andwithdrawals over time, and earnings by product and over time.
Use the My Clients Dashboard
Financial advisors can use this dashboard to identify clients for appropriate action based on recency of interactions with them,attrition risk, or portfolio value. Start by viewing client activities that indicate they need attention from you. Then dig deeper to seeyour top clients, profile your client population, and see if clients are reaching their financial goals.
Use the Client Acquisition Dashboard
Target high-opportunity leads for immediate action and get insights into leads/referral sources, conversion rates, and trending.
Use the Client Interactions Dashboard
Financial advisors: Make sure you’re taking the actions that retain clients by getting instant insight into the results of your clientmanagement activities. Learn how you’re spending time, see who’s overdue for attention, and understand which activities have themost positive results. Use the dashboard’s KPIs to identify clients who may need immediate action from you to keep them loyal andsatisfied.
Use the Events and Seminars Dashboard
Understand the impact of events and seminars on your business. Metrics across the top show top-level numbers for your events,including average conversion rate and cost per conversion for event attendees and average attendance rate.
Use the My Households Dashboard
Identify households for appropriate action based on portfolio value. Start by viewing households by their wallet share and the lengthof time they’ve worked with you. Dig deeper to view households sorted by their AUM category and size. Not all metrics from accountsroll up to the household level, so the dashboard shows separate pages for top households and demographics.
Use the Sales Performance Dashboard
Visualize progress toward sales goals over time. Start by learning which opportunities could use your attention to move them alongthe sales process. Then get insight into whether you’re going to be able to make your quota and evaluate your pipeline to learnabout opportunities you can accelerate. Finally evaluate ways to turn more opportunities into wins.
Use the Team Book of Business Dashboard
Provides a team view of the book of business. Start with a top-level view of total and per-client/per-advisor average assets undermanagement (AUM), value of accounts, number of clients, and average wallet share. Filter by city, state, and advisor to refine yourview. Then dive into details in the dashboard’s pages.
Analytics for Wealth Management Dashboard Glossary
Learn the contents and use of metrics, filters, and other common dashboard elements. Keep this glossary open in a separate windowas you use the dashboards.
SEE ALSO:
Consumer Banking Starter Analytics Template
Tableau CRM Limitations
Use the My Book of Business DashboardFinancial advisers: Start with an overview of your financial book of business and how it has changed over time. Get alerts about changescompared to last month, quarter, and year. And dig deeper to see which of your products are used the most, deposits and withdrawalsover time, and earnings by product and over time.
45
Use the My Book of Business DashboardUse Financial Services Cloud Tableau CRM Solutions
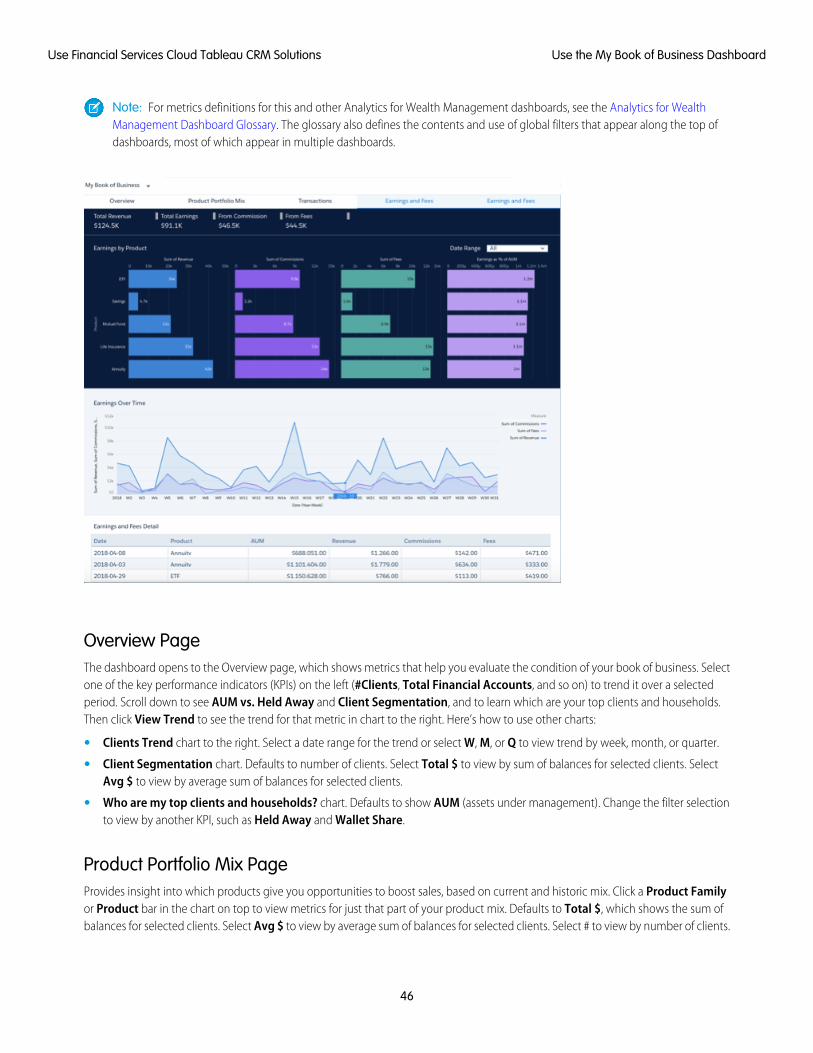
Note: For metrics definitions for this and other Analytics for Wealth Management dashboards, see the Analytics for WealthManagement Dashboard Glossary. The glossary also defines the contents and use of global filters that appear along the top ofdashboards, most of which appear in multiple dashboards.
Overview PageThe dashboard opens to the Overview page, which shows metrics that help you evaluate the condition of your book of business. Selectone of the key performance indicators (KPIs) on the left (#Clients, Total Financial Accounts, and so on) to trend it over a selectedperiod. Scroll down to see AUM vs. Held Away and Client Segmentation, and to learn which are your top clients and households.Then click View Trend to see the trend for that metric in chart to the right. Here’s how to use other charts:
• Clients Trend chart to the right. Select a date range for the trend or select W, M, or Q to view trend by week, month, or quarter.
• Client Segmentation chart. Defaults to number of clients. Select Total $ to view by sum of balances for selected clients. SelectAvg $ to view by average sum of balances for selected clients.
• Who are my top clients and households? chart. Defaults to show AUM (assets under management). Change the filter selectionto view by another KPI, such as Held Away and Wallet Share.
Product Portfolio Mix PageProvides insight into which products give you opportunities to boost sales, based on current and historic mix. Click a Product Familyor Product bar in the chart on top to view metrics for just that part of your product mix. Defaults to Total $, which shows the sum ofbalances for selected clients. Select Avg $ to view by average sum of balances for selected clients. Select # to view by number of clients.
46
Use the My Book of Business DashboardUse Financial Services Cloud Tableau CRM Solutions
The Product Mix Over Time chart defaults to showing your product mix for all time. You can change that to a specific time period bychanging the Date Range filter.
Transactions PageView your portfolio inflow and outflow according to selections in the filters along the top. Defaults to showing the past 12 weeks. ClickM to view by month, Q to view by quarter. Also, see which clients have made large deposits and withdrawals. Select a transaction typeto focus on credits or debits, or change the date range to view changes during a specific time period. The page also shows the following.
• Top section
– Total Deposits. Sum of client deposit amounts.
– Total Withdrawals. Sum of client withdrawal amounts.
– Net. Total deposits - total withdrawals.
• Clients with Large Deposits and Withdrawals chart. Defaults to sorting from large to small withdrawals. Select Deposits to sortfrom large to small deposits.
Earnings and Fees Page
Note: The charts on this page visualize data about fees and commissions from an external .CSV data file. If the dashboard doesn’trender, consult your Salesforce administrator.
See revenues, commissions, fees, and earnings as percentage of AUM for the entire organization or a selected advisor, according toselections from filters along top. Defaults to all time. Zero in on a specific time period by changing the Date Range filter. Charts showthe following:
• Earnings by Product chart. Shows revenue, commissions, fees, and earnings as percent of AUM for all your financial products.
• Earnings Over Time chart. Shows earnings over time. Defaults to 31 weeks. Focus on a time period by changing selection in DateRange filter in the Earnings by Product chart.
SEE ALSO:
Import Earnings and Fees Data to Tableau CRM for Financial Services Apps
Use the My Clients DashboardFinancial advisors can use this dashboard to identify clients for appropriate action based on recency of interactions with them, attritionrisk, or portfolio value. Start by viewing client activities that indicate they need attention from you. Then dig deeper to see your topclients, profile your client population, and see if clients are reaching their financial goals.
Note: For metrics definitions for this and other Analytics for Wealth Management dashboards, see the Analytics for WealthManagement Dashboard Glossary. The glossary also defines the contents and use of global filters that appear along the top ofdashboards, most of which appear in multiple dashboards.
47
Use the My Clients DashboardUse Financial Services Cloud Tableau CRM Solutions

Who Needs My Attention? PageThe dashboard opens to this page, which lets you single out clients at risk of possible attrition or who may need extra attention. Set thefilters at left to see clients with large withdrawals or historically low AUM (because of market losses). Also quickly learn about clientswho’ve logged support cases or whose accounts you haven’t reviewed in a while. View the results by quarter or by year.
In the chart on the right, click any bar to view details for a client in the Client List Detail table below.
Who Are My Top Clients? PageOrganizes specific clients based on their wallet share and length of relationship with the company to help you prioritize who shouldreceive your attention. Select Top 50, Top 100, or All to change the selection. Click a bubble in the chart to see details about the clientin the table below.
What Demographics Do I Serve? PageProfiles typical client and high-net-worth clients. Categorizes clients by net worth, length of relationship, geography, and other criteria.In either the top or bottom chart groups, select # to view by number of clients or $ to view by asset totals. Click a chart element (bar,map, circle segment) to view details in the table below.
Are Clients Reaching Their Goals? PageIdentify clients who may need help progressing toward their financial goals. Shows progress toward goals by client type, percentcompletion of goals, and size of goals. Change Filter by % Complete selection to sort clients according to how far along they are inachieving their goals. Change Years Until Target selection to sort by how long they have until they reach their goals. Click a bar orbubble to view details in the table below.
Use the Client Acquisition DashboardTarget high-opportunity leads for immediate action and get insights into leads/referral sources, conversion rates, and trending.
48
Use the Client Acquisition DashboardUse Financial Services Cloud Tableau CRM Solutions

Note: For metrics definitions for this and other Analytics for Wealth Management dashboards, see the Analytics for WealthManagement Dashboard Glossary. The glossary also defines the contents and use of global filters that appear along the top ofdashboards, most of which appear in multiple dashboards.
Adjust the Rating and Lead and Referral Status filters at the top to zero in on your hottest leads. Change the time period for the LastActivity filter to get more precise information about how your team is working with leads to close them.
What Needs Attention? PageOpens to the What Needs Attention? page, which helps identify leads that have stalled or have had no activity for immediate action.Click an element in the Who should I call today? chart and view leads in that category in the Leads and Referrals Details table below.For example, click the bar for the highest amount in By Expected Value to view just the potentially most valuable leads in the detailstable. Then help move the lead along by rolling the cursor over a name, clicking the disclosure triangle, and selecting an action (NewTask, New Event, Log a Call, and so on).
Lead/Referral Sources PageCombines metrics about lead referral sources and your best referrers to help you identify the best opportunities. Click a section of theWhere do leads/referrals come from? chart to view best referrers for that source in Who are my best referrers?. Or click a bar inWho are my best referrers? to see sources for that referrers leads in Where do leads/referrals come from?. Scroll down to getspecifics for each lead in the details table.
Tracking Leads/Referrals PageSee what’s happened to leads and how far they’ve proceeded if they haven’t converted yet. Click a bar in Select a created date andthen view status of leads from that period in Where are these leads now?. Or click an element in Where are these leads now? tosee when leads in that status were created. To expand the time period, select M (month) or Q (quarter).
Conversion PageShown above. Follow the lead conversion process for your team. Chart at top-left shows your conversion rate over time. Top-right chartshows the average days leads spend in stages of the conversion process, for example Creation to first touch. Charts below show
49
Use the Client Acquisition DashboardUse Financial Services Cloud Tableau CRM Solutions

products with most successful conversion rates and the effect of the number of touches on conversion. Click a bar for a product to seethe number of touches for conversions for that product. To learn about products that take the fewest or most touches to convert, clicka bar in How many touches to convert? and view results for each product in Which product interests convert more?
Lead Pipeline Trending PageChoose a start and end date to trend data about leads between those two dates. The waterfall chart depicts the flow of leads in and outof the pipe during the period you select.
Metrics for Waterfall Chart
• # Start. Number of open leads as of selected start date.
• # New Leads. Number of leads created between selected start and end dates.
• # Converted. Number of leads converted between selected start and end dates.
• # Disqualified. Number of leads disqualified between selected start and end dates.
• # End. Number of open leads as of selected end date.
Use the Client Interactions DashboardFinancial advisors: Make sure you’re taking the actions that retain clients by getting instant insight into the results of your clientmanagement activities. Learn how you’re spending time, see who’s overdue for attention, and understand which activities have themost positive results. Use the dashboard’s KPIs to identify clients who may need immediate action from you to keep them loyal andsatisfied.
Note: For metrics definitions for this and other Analytics for Wealth Management dashboards, see the Analytics for WealthManagement Dashboard Glossary. The glossary also defines the contents and use of global filters that appear along the top ofdashboards, most of which appear in multiple dashboards.
Overview PageShows clients that may have been neglected and their importance according to AUM or other metrics. Also shows days since last contactwith clients, clients whose AUM has dropped, and clients with overdue tasks. Click a bubble representing a client in the top chart tolearn if they’re due immediate attention and for details to use when you contact them.
50
Use the Client Interactions DashboardUse Financial Services Cloud Tableau CRM Solutions
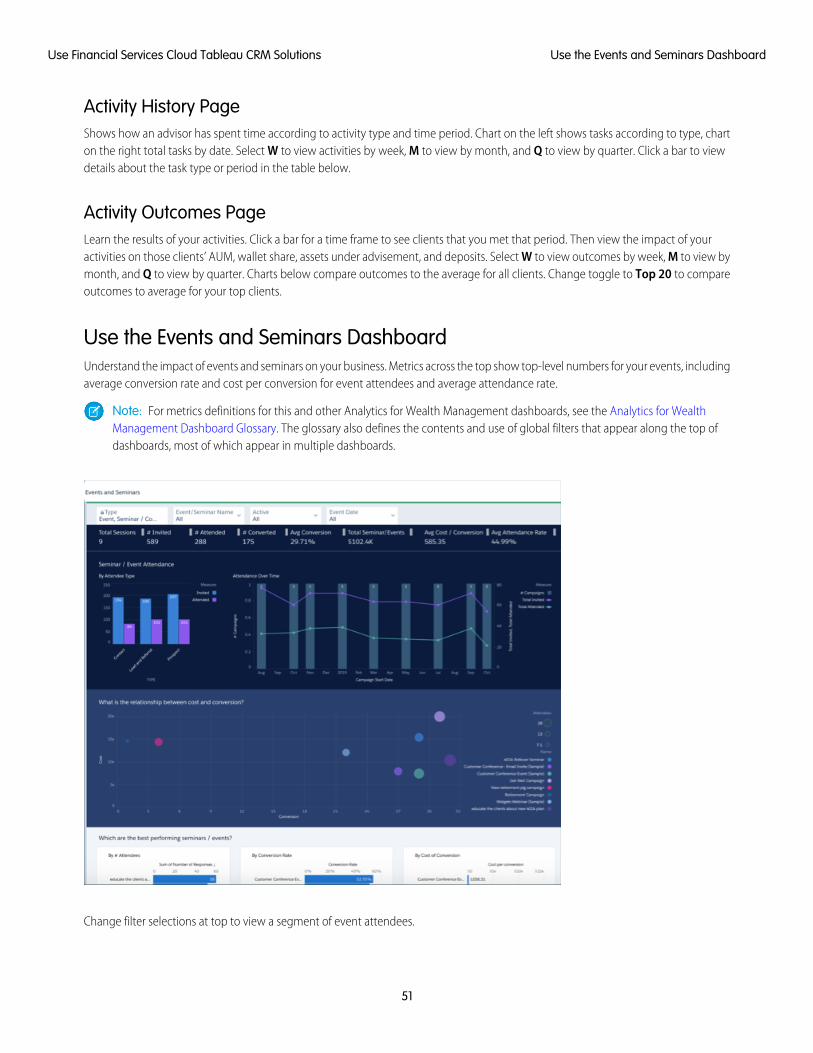
Activity History PageShows how an advisor has spent time according to activity type and time period. Chart on the left shows tasks according to type, charton the right total tasks by date. Select W to view activities by week, M to view by month, and Q to view by quarter. Click a bar to viewdetails about the task type or period in the table below.
Activity Outcomes PageLearn the results of your activities. Click a bar for a time frame to see clients that you met that period. Then view the impact of youractivities on those clients’ AUM, wallet share, assets under advisement, and deposits. Select W to view outcomes by week, M to view bymonth, and Q to view by quarter. Charts below compare outcomes to the average for all clients. Change toggle to Top 20 to compareoutcomes to average for your top clients.
Use the Events and Seminars DashboardUnderstand the impact of events and seminars on your business. Metrics across the top show top-level numbers for your events, includingaverage conversion rate and cost per conversion for event attendees and average attendance rate.
Note: For metrics definitions for this and other Analytics for Wealth Management dashboards, see the Analytics for WealthManagement Dashboard Glossary. The glossary also defines the contents and use of global filters that appear along the top ofdashboards, most of which appear in multiple dashboards.
Change filter selections at top to view a segment of event attendees.
51
Use the Events and Seminars DashboardUse Financial Services Cloud Tableau CRM Solutions
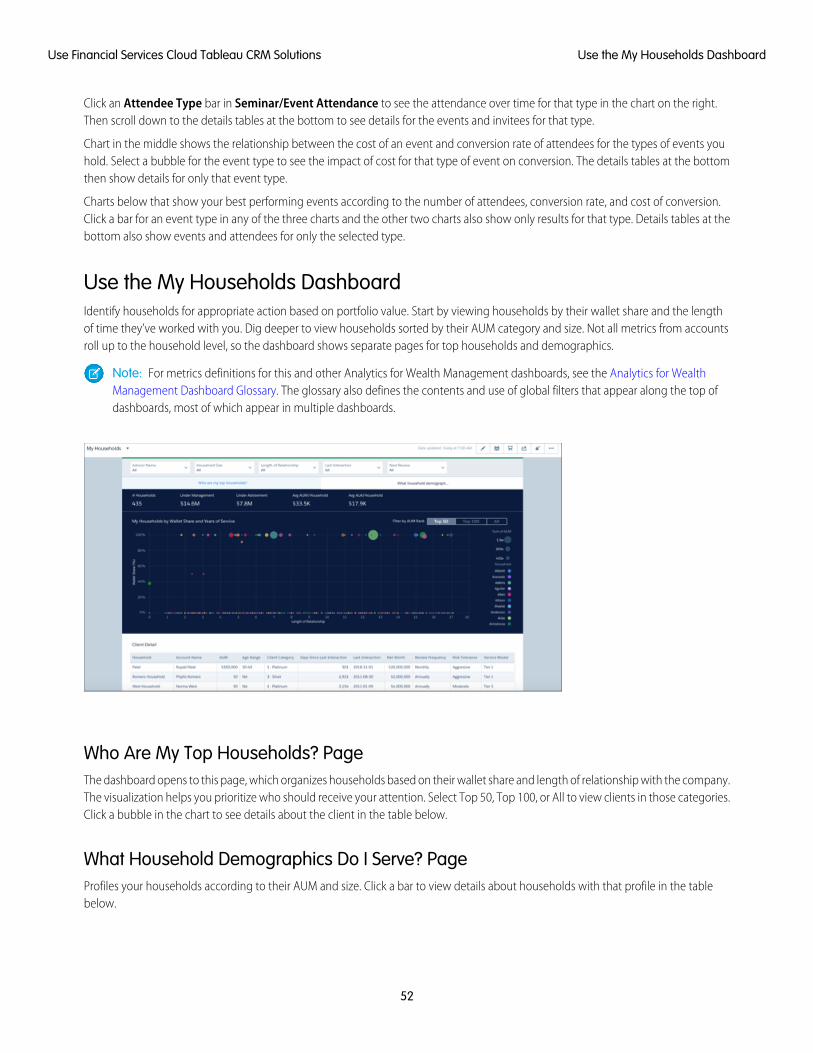
Click an Attendee Type bar in Seminar/Event Attendance to see the attendance over time for that type in the chart on the right.Then scroll down to the details tables at the bottom to see details for the events and invitees for that type.
Chart in the middle shows the relationship between the cost of an event and conversion rate of attendees for the types of events youhold. Select a bubble for the event type to see the impact of cost for that type of event on conversion. The details tables at the bottomthen show details for only that event type.
Charts below that show your best performing events according to the number of attendees, conversion rate, and cost of conversion.Click a bar for an event type in any of the three charts and the other two charts also show only results for that type. Details tables at thebottom also show events and attendees for only the selected type.
Use the My Households DashboardIdentify households for appropriate action based on portfolio value. Start by viewing households by their wallet share and the lengthof time they’ve worked with you. Dig deeper to view households sorted by their AUM category and size. Not all metrics from accountsroll up to the household level, so the dashboard shows separate pages for top households and demographics.
Note: For metrics definitions for this and other Analytics for Wealth Management dashboards, see the Analytics for WealthManagement Dashboard Glossary. The glossary also defines the contents and use of global filters that appear along the top ofdashboards, most of which appear in multiple dashboards.
Who Are My Top Households? PageThe dashboard opens to this page, which organizes households based on their wallet share and length of relationship with the company.The visualization helps you prioritize who should receive your attention. Select Top 50, Top 100, or All to view clients in those categories.Click a bubble in the chart to see details about the client in the table below.
What Household Demographics Do I Serve? PageProfiles your households according to their AUM and size. Click a bar to view details about households with that profile in the tablebelow.
52
Use the My Households DashboardUse Financial Services Cloud Tableau CRM Solutions
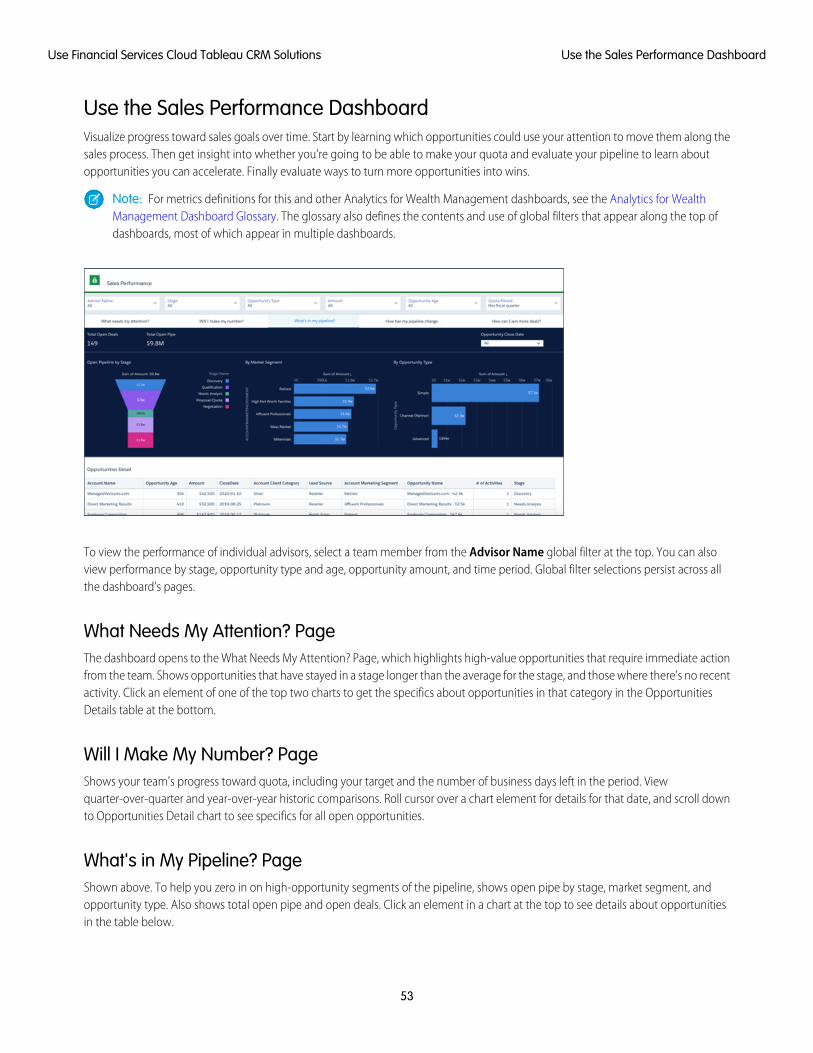
Use the Sales Performance DashboardVisualize progress toward sales goals over time. Start by learning which opportunities could use your attention to move them along thesales process. Then get insight into whether you’re going to be able to make your quota and evaluate your pipeline to learn aboutopportunities you can accelerate. Finally evaluate ways to turn more opportunities into wins.
Note: For metrics definitions for this and other Analytics for Wealth Management dashboards, see the Analytics for WealthManagement Dashboard Glossary. The glossary also defines the contents and use of global filters that appear along the top ofdashboards, most of which appear in multiple dashboards.
To view the performance of individual advisors, select a team member from the Advisor Name global filter at the top. You can alsoview performance by stage, opportunity type and age, opportunity amount, and time period. Global filter selections persist across allthe dashboard’s pages.
What Needs My Attention? PageThe dashboard opens to the What Needs My Attention? Page, which highlights high-value opportunities that require immediate actionfrom the team. Shows opportunities that have stayed in a stage longer than the average for the stage, and those where there's no recentactivity. Click an element of one of the top two charts to get the specifics about opportunities in that category in the OpportunitiesDetails table at the bottom.
Will I Make My Number? PageShows your team's progress toward quota, including your target and the number of business days left in the period. Viewquarter-over-quarter and year-over-year historic comparisons. Roll cursor over a chart element for details for that date, and scroll downto Opportunities Detail chart to see specifics for all open opportunities.
What's in My Pipeline? PageShown above. To help you zero in on high-opportunity segments of the pipeline, shows open pipe by stage, market segment, andopportunity type. Also shows total open pipe and open deals. Click an element in a chart at the top to see details about opportunitiesin the table below.
53
Use the Sales Performance DashboardUse Financial Services Cloud Tableau CRM Solutions

How Has My Pipeline Changed? PageTrends your pipeline, showing how it has changed between two dates (for example, quarter to date) for opportunities forecast to closewithin a specific time period. Change the Pipeline Start and End Date filter to view deals for a preset period (year, quarter, month,and so on), or select a custom period.
Metrics for Waterfall Chart
• Start. Value ($) of opportunities open at the start of selected period.
• New. Value ($) of opportunities created during selected period.
• Reopen. Value ($) of opportunities reopened during selected period.
• Expanded. Total increase in value ($) of open opportunities whose value has increased and are scheduled to close during selectedperiod.
• Moved In. Value ($) of opportunities with close dates that shifted to close during selected period.
• Moved Out. Value ($) of opportunities with close dates originally within selected period that shifted out of selected period.
• Reduce. Total decrease in value ($) of open opportunities whose value has decreased and are scheduled to close during selectedperiod.
• Closed Won. Value ($) of opportunities that are closed and won during selected period.
• Closed Lost. Value ($) of opportunities that are closed and lost during selected period.
• Today. Value ($) of opportunities open today or at end of selected period.
How Can I Win More Deals? PageVisualizations help you understand how to win more deals. Top charts compare won and lost opportunities and show your team’s winrate over time. Use Understanding Win Rate chart below to help understand what drives your win rate. Change the two selections inthe chart to see what factors combine to increase or decrease win rate. Click a bubble in Win Rate Mix and view results for thatcombination in Deals Won/Lost. For example, the combination of the a specific market segment (millennials, retirees, high net worth,and so on) and an opportunity type (such as simple or complex) may result in a higher win rate. Look for opportunities with thatcombination to increase your win rate.
Use the Team Book of Business DashboardProvides a team view of the book of business. Start with a top-level view of total and per-client/per-advisor average assets undermanagement (AUM), value of accounts, number of clients, and average wallet share. Filter by city, state, and advisor to refine your view.Then dive into details in the dashboard’s pages.
Note: For metrics definitions for this and other Analytics for Wealth Management dashboards, see the Analytics for WealthManagement Dashboard Glossary. The glossary also defines the contents and use of global filters that appear along the top ofdashboards, most of which appear in multiple dashboards.
54
Use the Team Book of Business DashboardUse Financial Services Cloud Tableau CRM Solutions

Team Leaderboard PageOpens to the Team Leaderboard page and its leaderboard. Defaults to ranking members of your team by total AUM, total financialaccounts, and new AUM. View other metrics by making selections in the Choose Metric(s) filter. View details about each advisor in thetable below the leaderboard.
Metrics in Choose Metric(s) filter
• Total AUM. Total of assets under management.
• Total Financial Accounts. Sum of financial accounts for households.
• New Accounts AUM (QTD). Total of assets under management for accounts opened in current quarter.
• Total AUA. Total assets under advisement.
• # Clients. Total number of clients.
• # Households. Total number of households.
• Average AUM/Client. Sum of AUM / Number of clients.
• Average AUM/Household. Sum of AUM / Number of households.
• Average Wallet Share. Average wallet share
Regional View PageRanks performance by state and city. Defaults to measuring performance according to AUM. Use the Choose Metric filter to viewperformance according to other metrics. Click an element from either the By State or Top Cities charts to view details about advisorsin those locales.
Drivers of Success PageView correlations between various factors and performance. Use the filters at the top to select metrics for an activity, lead/referral, oropportunity, a time period, and a KPI. Chart then shows you how the activity, lead/referral/ or opportunity metric influences the selectedKPI for that time.
Metrics in first Explore the relationship between filter
55
Use the Team Book of Business DashboardUse Financial Services Cloud Tableau CRM Solutions

• Activity: # Activities. Count of activities.
• Activity: # Meetings. Count of meetings.
• Activity: # Emails. Count of emails.
• Activity: # Calls. Count of calls.
• Lead/Referral: Average Days Until First Touch. Days between date of creation of lead and date of first activity.
• Lead/Referral: Average # Touches. Average touches per lead.
• Lead/Referral: Average Days Until Conversion. Average number of days between date of creation and date of conversion.
• Lead/Referral: Conversion Rate. Converted leads / Total leads.
• Opportunity: # of Opportunities Created. Count of opportunities.
• Opportunity: # of Opportunities Closed Won. Count of opportunities with status of Closed Won.
• Opportunity: Win Rate. Opportunities with status of Close Won / Opportunities
• Opportunity: Average Days Until Closed Won. Average of the opportunity age for opportunities with status of Closed Won.
• Client: Average # of Goals Per Client. Count of goals / Number of clients.
• Client: Average # of Financial Accounts. Count of financial accounts / Number of clients.
Comparative Trend PageClick a bar for advisors in the left-hand chart to view their performance over time in the right chart. Defaults to showing weekly performanceaccording to AUM. Change the selection in the Choose Metric filter to view performance by other metrics. Change the period for thetrend with the Date Range filter, or change the time segment from weekly to monthly by clicking M or Q.
1-on-1 Helper PageProvides performance metrics and rankings for advisors on your team to help you get ready to coach them. Select an advisor from themenu at top-center or click a bar next to their name in a chart to view KPIs for the advisor. KPIs include AUM, total value of financialaccounts, average wallet share, referral conversion rate, and more.
Analytics for Wealth Management Dashboard GlossaryLearn the contents and use of metrics, filters, and other common dashboard elements. Keep this glossary open in a separate windowas you use the dashboards.
Note: Partial listing. Includes metrics for the following dashboards:
• Client Acquisition
• Client Interactions
• My Book of Business
• My Clients
• My Households
• Sales Performance
Last update: November 7, 2019.
56
Analytics for Wealth Management Dashboard GlossaryUse Financial Services Cloud Tableau CRM Solutions

Global FiltersA subset of these filters appears across the top of the app’s dashboards depending on the dashboard’s contents. They’re listed alphabeticallyhere. Select one, many, or all values in each filter. The selection changes metrics across all parts of the dashboard you’re currently viewing.
Revert to default values by clicking the Return to Initial View icon to the right of the dashboard name.
Account Name. Select the accounts you’d like to analyze.
Active. Select whether the event(s) you view are active or not.
Advisor Name. Shows the name of the current user of the app. For managers of advisors, this filter shows names of advisors theymanage. For advisors, selection is locked to themselves.
Amount. Set the range for deal amounts.
Date. Set a date range for client data.
Event Date. Set period for events to view.
Household Size. Set the range for the size of households you’d like to view.
Investment Experience. Select clients by how experienced they are as investors.
Investment Objectives. Select clients by their investment objectives.
Last Activity. Set period for lead’s last activity to view only leads with activities during that time.
Last Interaction. Set period for client’s last interaction to view only clients with interactions during that time.
Lead and Referral Source. Select the sources for leads.
Lead and Referral Status. Select status of leads in the closing process.
Length of Relationship. Set the range of time households have worked with you to view only households during that time.
Marketing Segment. Values from Marketing Segment field in Account object.
Next Review. Set period for next scheduled review to view only households set for review during that time.
Opportunity Age. Set the range for age of opportunities.
Opportunity Type. Select types of opportunities.
Rating. Select lead rating.
Record Type. Select a lead type.
Seminar/Event Name. Select the seminars or events to view.
Service Model. Select clients according to their service model.
Stage. Select stages in the opportunity closing process.
Type (Events and Seminars). Select the types of seminars or events type to view.
Metrics GlossaryMetrics for the Tableau CRM for Financial Services app appear in one or many dashboards, depending on the dashboards’ contents. Theyare listed alphabetically here.
A-E
Attainment (quota). (Total amount of closed won opportunities/ My quota) * 100
# Attended. Count of invitees to events defined by filter selections who responded to invitations.
Average Time to Convert (Days). Average of days between creation and conversion dates for converted leads with status of Qualified.
57
Analytics for Wealth Management Dashboard GlossaryUse Financial Services Cloud Tableau CRM Solutions
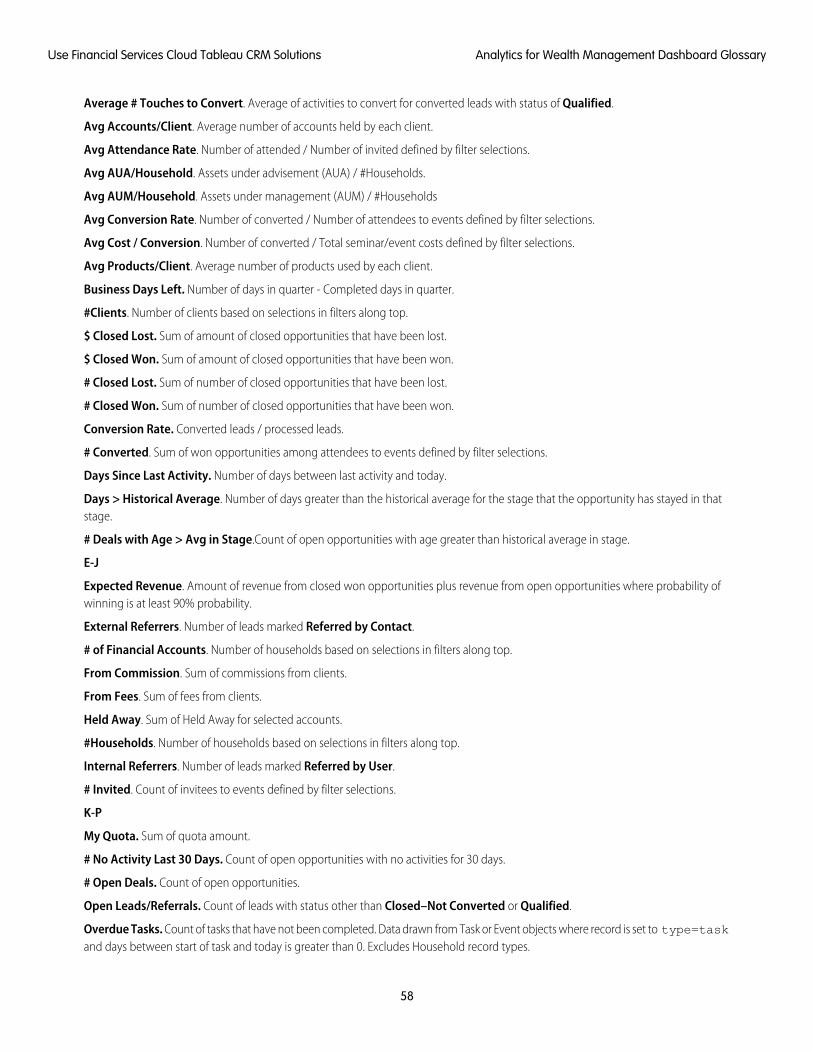
Average # Touches to Convert. Average of activities to convert for converted leads with status of Qualified.
Avg Accounts/Client. Average number of accounts held by each client.
Avg Attendance Rate. Number of attended / Number of invited defined by filter selections.
Avg AUA/Household. Assets under advisement (AUA) / #Households.
Avg AUM/Household. Assets under management (AUM) / #Households
Avg Conversion Rate. Number of converted / Number of attendees to events defined by filter selections.
Avg Cost / Conversion. Number of converted / Total seminar/event costs defined by filter selections.
Avg Products/Client. Average number of products used by each client.
Business Days Left. Number of days in quarter - Completed days in quarter.
#Clients. Number of clients based on selections in filters along top.
$ Closed Lost. Sum of amount of closed opportunities that have been lost.
$ Closed Won. Sum of amount of closed opportunities that have been won.
# Closed Lost. Sum of number of closed opportunities that have been lost.
# Closed Won. Sum of number of closed opportunities that have been won.
Conversion Rate. Converted leads / processed leads.
# Converted. Sum of won opportunities among attendees to events defined by filter selections.
Days Since Last Activity. Number of days between last activity and today.
Days > Historical Average. Number of days greater than the historical average for the stage that the opportunity has stayed in thatstage.
# Deals with Age > Avg in Stage.Count of open opportunities with age greater than historical average in stage.
E-J
Expected Revenue. Amount of revenue from closed won opportunities plus revenue from open opportunities where probability ofwinning is at least 90% probability.
External Referrers. Number of leads marked Referred by Contact.
# of Financial Accounts. Number of households based on selections in filters along top.
From Commission. Sum of commissions from clients.
From Fees. Sum of fees from clients.
Held Away. Sum of Held Away for selected accounts.
#Households. Number of households based on selections in filters along top.
Internal Referrers. Number of leads marked Referred by User.
# Invited. Count of invitees to events defined by filter selections.
K-P
My Quota. Sum of quota amount.
# No Activity Last 30 Days. Count of open opportunities with no activities for 30 days.
# Open Deals. Count of open opportunities.
Open Leads/Referrals. Count of leads with status other than Closed–Not Converted or Qualified.
Overdue Tasks. Count of tasks that have not been completed. Data drawn from Task or Event objects where record is set to type=taskand days between start of task and today is greater than 0. Excludes Household record types.
58
Analytics for Wealth Management Dashboard GlossaryUse Financial Services Cloud Tableau CRM Solutions

Processed Leads/Referrals. Count of leads with status of Closed–Not Converted or Qualified.
Q-Z
Total Activities. Count of activities. Data drawn from households with Task or Event objects. Excludes Household record types.
Total Calls. Count of calls. Data drawn from Task or Event objects where record is set to type=call. Excludes Household recordtypes.
Total Closed Deals. Count of closed opportunities.
Total Closed Won. Sum of amounts of closed won opportunities.
Total Converted. Count of converted leads with status of Qualified.
Total Disqualified. Count of leads with status of Closed–Not Converted.
Total Earnings. Sum of commissions from clients + Sum of fees from clients.
Total Emails. Count of emails. Data drawn from Task or Event objects where record is set to type=email. Excludes Household recordtypes.
Total Financial Accounts (My Book of Business). Sum of Balance field for clients selected using filters on top.
Total Leads/Referrals. Count of leads.
Total Open Deals. Sum of number of open opportunities.
Total Open Pipe. Sum of amount of open opportunities.
#Total Products. Number of financial account types based on filter selections.
Total Revenue. Sum of revenue from clients.
Total Seminar/Events Cost. Sum of actual cost of events defined by filter selections.
Total Sessions. Count of events defined by filter selections.
Total Tasks. Count of tasks. Data drawn from households with Task or Event objects where record is set to type=task.
Under Advisement. Sum of Assets Under Advisement (AUA) for selected accounts.
Under Management. Sum of Assets Under Management (AUM) for selected clients.
Wallet Share. Sum of AUM for selected clients / (Sum of AUM for selected clients + Sum of Held Away for selected client).
Win Rate. Value ($) of closed opportunities that have been won / Value ($) of all closed opportunities.
With Activity in 30 Days. Count of leads with status other than Closed–Not Converted or Qualified and with an activity in the last30 days.
Use Analytics for Insurance
Analytics for Insurance dashboards give insurance agents and managers a complete customer intelligence solution.
Note: Tableau CRM for Insurance is included with Tableau CRM for Financial Services, which is available at an extra charge forcustomers with Financial Services Cloud Basic or Standard licenses and the FSCAnalyticsPlus (Tableau CRM for Financial Services)license. See Deploy Tableau CRM for Financial Services for complete deployment instructions.
The Analytics for Insurance app powers agents with practical insights on their sales performance and enables them to be more efficientin sales execution. They can grow written premiums by using app dashboards to segment the customer base and get insights onupsell/cross-sell opportunities. And the app powers managers with insights on their team’s performance and what makes the topperformers different to help them coach team members.
Open the app.
59
Use Analytics for InsuranceUse Financial Services Cloud Tableau CRM Solutions
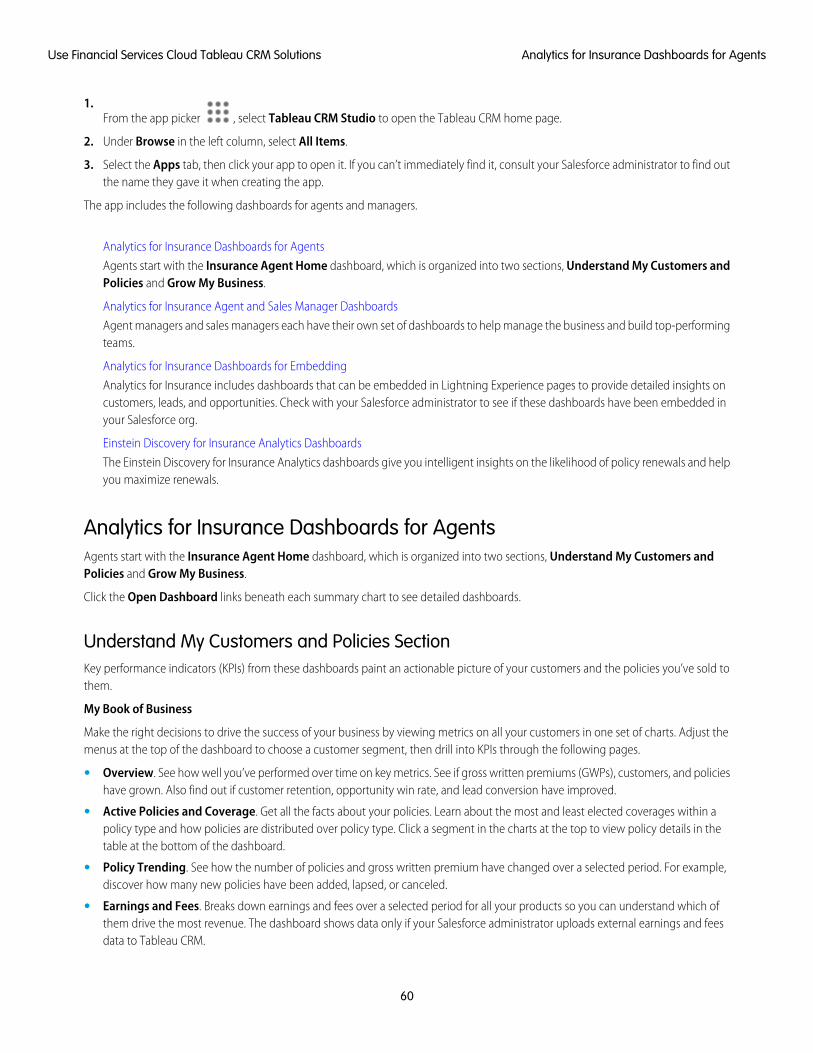
1.From the app picker , select Tableau CRM Studio to open the Tableau CRM home page.
2. Under Browse in the left column, select All Items.
3. Select the Apps tab, then click your app to open it. If you can’t immediately find it, consult your Salesforce administrator to find outthe name they gave it when creating the app.
The app includes the following dashboards for agents and managers.
Analytics for Insurance Dashboards for Agents
Agents start with the Insurance Agent Home dashboard, which is organized into two sections, Understand My Customers andPolicies and Grow My Business.
Analytics for Insurance Agent and Sales Manager Dashboards
Agent managers and sales managers each have their own set of dashboards to help manage the business and build top-performingteams.
Analytics for Insurance Dashboards for Embedding
Analytics for Insurance includes dashboards that can be embedded in Lightning Experience pages to provide detailed insights oncustomers, leads, and opportunities. Check with your Salesforce administrator to see if these dashboards have been embedded inyour Salesforce org.
Einstein Discovery for Insurance Analytics Dashboards
The Einstein Discovery for Insurance Analytics dashboards give you intelligent insights on the likelihood of policy renewals and helpyou maximize renewals.
Analytics for Insurance Dashboards for AgentsAgents start with the Insurance Agent Home dashboard, which is organized into two sections, Understand My Customers andPolicies and Grow My Business.
Click the Open Dashboard links beneath each summary chart to see detailed dashboards.
Understand My Customers and Policies SectionKey performance indicators (KPIs) from these dashboards paint an actionable picture of your customers and the policies you’ve sold tothem.
My Book of Business
Make the right decisions to drive the success of your business by viewing metrics on all your customers in one set of charts. Adjust themenus at the top of the dashboard to choose a customer segment, then drill into KPIs through the following pages.
• Overview. See how well you’ve performed over time on key metrics. See if gross written premiums (GWPs), customers, and policieshave grown. Also find out if customer retention, opportunity win rate, and lead conversion have improved.
• Active Policies and Coverage. Get all the facts about your policies. Learn about the most and least elected coverages within apolicy type and how policies are distributed over policy type. Click a segment in the charts at the top to view policy details in thetable at the bottom of the dashboard.
• Policy Trending. See how the number of policies and gross written premium have changed over a selected period. For example,discover how many new policies have been added, lapsed, or canceled.
• Earnings and Fees. Breaks down earnings and fees over a selected period for all your products so you can understand which ofthem drive the most revenue. The dashboard shows data only if your Salesforce administrator uploads external earnings and feesdata to Tableau CRM.
60
Analytics for Insurance Dashboards for AgentsUse Financial Services Cloud Tableau CRM Solutions

My Customers
Understand who your customers are so you segment them and market to them more effectively. KPIs are organized into two pages.
• Who Are My Top Customers? See which of your customers have high profitability, high premiums, or low claims.
• How many customers gained? Learn if you’re gaining or losing customers over time, and how many you’re gaining and losing.
• What Demographics Do I Serve? Get a breakdown of your customers by Marketing segment, premium value group, age, gender,and location.
Customer Interactions
Shows you the best ways to interact with customers. Visualizations show how you divide time between tasks and events and if thoseactivities involve high- or low-value customers.
Renewals & Cancellations
Insights into your policies reveal clients who are up for immediate renewal. You can also find out who’s already renewed and who’scanceled so you can take appropriate action. Get all the details about your policies through the following pages.
• Policies Up for Renewal. See policies and premium due for renewal in the next 30 days, and learn which high-value customers aredue for renewal soon. Also identify policies in the grace period so you can take action to boost renewal rates.
• Renewed Policies. Find out your clients’ renewal rates and premiums from renewed policies.
• Canceled Policies. Discover why customers cancel policies. Also see the value of premiums lost for specific cancellation reasons,such as the insured requesting cancellation or nonpayment.
Claims
Get a detailed picture of your claims, starting with an overview of your claims by age, size, and customers’ gross written premium. Adjustthe filters at the top to focus on a specific segment of your customers. Then dig deeper into claims data in the following pages.
• Open Claims. Click a bar for a claim number in the Claims by Estimated Size and Claims by Customer Gross Written Premiumcharts to focus on details for that claim. Use the visualizations to answer the following questions:
– Which claims are open for longer than average closure time?
– Which customers have high estimated claim amounts?
– Which high-premium customers have open claims?
• Claims Over Time. Evaluate the trend of claims, claims severity, and loss ratio over time and average time to process claims.
Note: If there’s no data in the Financial Account Transaction object, you see insights based on Claims to GWP instead of LossRatio.
• Claims by Demography. Identify specific market segments, geographies, or customer demographics with higher claims,
• Claims Acceptance. Get answers to the following:
– How many claims are approved versus rejected over time?
– What is the claim approval rate based on policy type and claim amount?
Product Analysis
What are your top-selling products? Which products sell most in your market segments and locations? What products are most profitable?Get answers to these questions and more in the following pages.
• Product Portfolio Mix. Start here to learn the number and value of premiums distributed over all your products and learn howyour product mix has changed.
• Products and Market Segment. Shows products that sell the best to specific marketing segments. Filter according to the segmentyou want to view, such as millennials, women, or high-net-worth customers.
61
Analytics for Insurance Dashboards for AgentsUse Financial Services Cloud Tableau CRM Solutions

• Product Profitability. Learn which products result in the highest profit. Also see average profits per product, total profits, and otherKPIs about profitability.
• Regional View. Select states or ZIP codes to see the top products in specific locales.
Household Analysis
Get insights about households that help you effectively manage your books of business, identify high-value households, and discoveropportunities to increase revenue.
• Book of Business: Learn how your business is doing based on various household and claims KPIs, and effectively manage yourbooks of business.
• My Households: Analyze your households and identify households with high gross written premium. Also, see how your householdsare performing based on the policies owned, approved claim amount, profitability, and Loss Ratio.
Note: If there’s no data in the Financial Account Transaction object, you see insights based on Claims to GWP instead of LossRatio.
• Cross-Sell Opportunities: Gain insights about households based on the policies owned and discover opportunities to sell otherpolicies to households.
Grow My Business SectionInsights to help you grow your customer base and revenue.
Sales Performance
View all your performance KPIs in a single place so you can keep sales moving in the right direction. See which opportunities needattention, learn if you’re on pace to make quota, view your pipeline, and more through these detailed pages.
• What needs my attention? Discover opportunities that are behind schedule compared to average so you can take immediateaction.
• Will I make my number? See how you’re progressing against quota so you can make the necessary adjustments.
• What customers am I selling to? See your open deals with existing customers so you can focus on the ones with highest grosswritten premiums and potential profitability.
• How has my pipeline changed? View your pipeline by quarter or another time period to make sure that deals are moving accordingto plan.
• What is my win rate? Learn your win rate over time and which policy types result in faster wins. Also uncover specific marketsegments where you win more.
Customer Acquisition
Get new customers faster with insights that point you to leads that convert most quickly. Visualizations surface leads to call today, identifypromising sources for leads, and understand the lead conversion process. KPIs are organized into the following pages. Click a segmentin any of the top charts to see details in the details table below them. The Rating column in each details table shows which leads arehot and cold, based on the value from the Rating field in the Lead object.
• What Needs Attention? See who you should call right away based on the number of days since the last contact or the age orexpected value of a lead.
• Lead/Referral Sources. Learn the sources for your leads and the most valuable lead referrers on your team.
• Tracking Leads/Referrals. See how far each of your leads has progressed toward conversion.
• Conversion. See how long it takes to convert leads to business and learn the factors that either slow or speed the process. Also seehow many touches it typically takes to close a lead.
• Lead Pipeline Trending. Pick a start and end date and see how the lead pipeline has changed during that period.
62
Analytics for Insurance Dashboards for AgentsUse Financial Services Cloud Tableau CRM Solutions

Upsell/Cross-Sell
Identify your whitespace, that is the opportunities where you could sell more coverage or products. Dig into details about your opportunitiesthrough the following pages.
• What Policies to Upsell Coverage? Select a policy type to find out its upselling potential.
• Policy List for Upsell. Get a filtered list of policies based on one or more missing coverages.
• What Policy Types Can I Cross-Sell? Learn the size of opportunities for cross-selling specific policy types.
• Customer List for Cross-Sell. Create a list of customers that can be added to cross-selling campaigns, such as selling life insuranceto customers who have automobile coverage.
Analytics for Insurance Agent and Sales Manager DashboardsAgent managers and sales managers each have their own set of dashboards to help manage the business and build top-performingteams.
Note: Additionally, agent managers and sales managers can also access all agent dashboards on page 60.
Dashboards for Agent ManagersStart with Agent Manager Home to get an at-a-glance summary of your team’s performance. See quarterly total gross written premiums,lead conversion rate, and closed won amount for your agents. Click the Open Dashboard links beneath each summary chart to seedetailed dashboards.
Agent Manager: Team Book of Business
Opens to the Team Leaderboard page. Dig into each page to see how your agents are contributing to your bottom line results.
• Team Leaderboard. See how your team’s performing on key business metrics and find out if team members need coaching in anyspecific areas.
• Regional View. Learn who your top and bottom performers are in each geography you manage.
• Drivers of Success. Learn if there’s a correlation between two metrics in driving the business. For example, select # Activities andGross Written Premium to learn if more agent activities result in greater premiums.
• Hunter vs. Farmer. Learn about your team’s most successful hunters—agents who get the most business from new customers.Also learn about the best farmers by seeing who gets the most business from existing customers.
• Comparative Trend. See trends over time for your agents’ KPIs, such as gross written premiums, number of customers, and numberof policies.
• 1–1 Helper. Get ready for individual meetings with your agents by learning how each of their KPIs rank against the rest of the team’sresults.
Agent Manager: Customer Acquisition
Learn which of your agents closes leads most efficiently. Adjust the menus at the top of the dashboard to zero in on a segment of yourleads. Visualizations are organized into the following two pages.
• Which agent has the highest lead conversion? See who has the highest conversion rate and how their rate compares to others’performance. You can also learn how many customer interactions each member of your team needs to convert a lead and theirpipeline and referrals.
• Which agent has the most efficient lead processing? View how long each team member takes to process a lead to understandhow efficient they are.
Agent Manager: Sales Performance
63
Analytics for Insurance Agent and Sales ManagerDashboards
Use Financial Services Cloud Tableau CRM Solutions

Get a complete picture of your team’s sales results. See who your sales leaders are and understand your win rate. Also see how everyone’sspending their time and see which deals your focusing on and which have the best chance of closing. KPIs are organized into thefollowing pages.
• Sales Performance - Closed Deals. View a leaderboard to see who closes the most deals and learn how your top performerscompare with other team members over time.
• What is our win-loss ratio overall and by agent? Find out which market segments you win more and which sources give youthe best leads. Also compare your win rate for new business versus existing business.
• Opportunity processing. See which team members process opportunities most efficiently. Also find out if team members can sellfaster to specific market segments.
• Where are we spending time? Is your team spending more time on high value opportunities? Also, how many activities do topperformers spend per $1,000 compared to low performers?
• What deals are we focusing on? Find out if there are any neglected opportunities languishing in a selected stage so you can takeaction to have an agent accelerate the deal.
Dashboards for Sales ManagersSales Managers have their own home dashboard and versions of sales performance dashboards to help manage their teams to success.
Sales Manager Home
Sales managers get a summary review of sales results for all their agencies, then dig deeper for fine-grained insights. Click the OpenDashboard links beneath each summary chart to see detailed dashboards.
Sales Manager: Team Book of Business
See Agent Manager: Team Book of Business earlier in this topic. Includes the same KPIs, but for agencies instead of agents.
Sales Manager: Customer Acquisition
See Agent Manager: Customer Acquisition earlier in this topic. Includes the same KPIs, but for agencies instead of agents.
Sales Manager: Sales Performance
See Agent Manager: Sales Performance earlier in this topic. Includes the same KPIs, but for agencies instead of agents.
Analytics for Insurance Dashboards for EmbeddingAnalytics for Insurance includes dashboards that can be embedded in Lightning Experience pages to provide detailed insights oncustomers, leads, and opportunities. Check with your Salesforce administrator to see if these dashboards have been embedded in yourSalesforce org.
Note: If there’s no data in the Financial Account Transaction object, you see insights based on Claims to Gross Written Premium(GWP) instead of Loss Ratio in your embedded dashboards.
Book of BusinessEmbed in an Account or Contact page layout to get an overview of your book of business. Shows the book of business for an agency oragent. Also shows gross written premiums, policies, renewal rate, loss ratio, claims value, and number of claims.
64
Analytics for Insurance Dashboards for EmbeddingUse Financial Services Cloud Tableau CRM Solutions

CustomerEmbed in a Customer page layout to see how a customer’s GWP and loss ratio compare to your average customer. Click the arrow tothe right to open the next panel, which shows how many claims the customer has filed. The second panel also shows the approvedclaim cost and how long their claims have been open.
Distributor Book of BusinessIntended for embedding in the sales manager Home page. Analyze the book of business for each of your distributors and whitespace—thatis, upsell and resell opportunities—for distributors and customers. The Book of Business tab (default) shows sales by policy type andterritory and total sales and other key performance indicators (KPIs) for the distributor selected from the Agency Name filter. Click theWhitespace tab to see a breakdown of the types of policies sold by each of your distributors. Set the GWP filter to get the top distributorsand analyze upsell/resell opportunities for those distributors. The chart reveals which distributors sold few or no policies of certain typesto suggest opportunities to upsell or resell those types of policies. Click Customers to see the same breakdown by customer.
Distributor Sales PerformanceIntended to give distributors a summary of KPIs by embedding in Account and Contact records pages. Selections from the global filtersapply to all the four dashboard tabs. Opens to the Sales tab, which shows performance by sales and renewals of policy types. Click theClaims tab to view performance by claims and loss ratio by policy type. The Customer Interaction tab shows time spent with customersand the number of weekly activities. Whitespace shows a breakdown of the types of policies sold to each of your customers.
Key DistributorsIntended for embedding in the sales manager Home page. See the leaderboard of distributors based on multiple KPIs. Default viewshows performance by gross written premium. Click the tabs below that chart to see how distributors perform according to policy count,loss ratio, and GWP growth.
Lead/ReferralEmbed in a Lead page layout to get insight into how likely you’re to convert the lead based on its source and the level of interest in theproduct. Click the arrow on the right to view the number of activities associated with the lead to see if you give it enough attention.Click the arrow again to learn days until conversion for the lead to be sure it’s progressing as expected.
OpportunityEmbed in an Opportunity page layout to learn the factors that influence win rate for a specific opportunity. Also see where the opportunitystands in the closing process and how its progress compares to other opportunities.
HouseholdEmbed in an Account page to learn about the household’s policies and claims when compared to the average of all households. Thedashboard shows how the household is based on its gross written premium and loss ratio. Also, identify claims that are open for morethan the average claim processing time.
65
Analytics for Insurance Dashboards for EmbeddingUse Financial Services Cloud Tableau CRM Solutions

Einstein Discovery for Insurance Analytics Dashboards
EDITIONS
Available for an extracharge in Professional,Performance, andUnlimited editions that haveFinancial Services Cloud forInsurance enabled.
The Einstein Discovery for Insurance Analytics dashboards give you intelligent insights on thelikelihood of policy renewals and help you maximize renewals.
Note: If the Einstein Discovery for Insurance Analytics app isn’t available in your org, directyour administrator to, Deploy Tableau CRM for Financial Services. To get predictions on thelikelihood of policy renewals, your admin must create the app from the Einstein Discoveryfor Insurance Analytics template.
The Einstein Discovery for Insurance Analytics app includes two dashboards:
• Likelihood to Renew Policies
• Likelihood to Renew Policy - Embedded
Note: To see data in your dashboards, make sure you have policies that are up for renewal in the next 90 days.
Likelihood to Renew Policies
Identify the likelihood of policy renewals, and focus on policies with high gross written premium and low renewal probability. Thedashboard charts answer the following questions.
• Which policies are at risk of not being renewed?
• What’s the likelihood of policy renewals?
Likelihood to Renew Policy - Embedded
Embed this dashboard on the Account page to get actionable insights on the renewal probability of policies.
• Which policies are at risk of not being renewed?
• What’s the likelihood of policy renewals?
Use Insurance Claims and Policy Analytics Dashboards
EDITIONS
Available for an additionalcost in: Enterprise,Performance, andUnlimited Editions that haveFinancial Services Cloud forInsurance enabled
Insurance Claims and Policy Analytics dashboards give you actionable insights that enable you toeffectively manage your claims, quotes, and policies.
Note: Insurance Claims and Policy Analytics is available at an extra charge for customerswith Financial Services Cloud Basic or Standard licenses and the FSCAnalyticsPlus (TableauCRM for Financial Services) license. For complete deployment instructions, see Deploy TableauCRM for Financial Services.
1. To open the Tableau CRM home page, from the App Launcher, select Tableau CRM Studio.
2. Under Browse in the left column, select All Items.
3. In the Apps tab, select your app.
Confirm the name of the app with your Salesforce admin if necessary.
4. To see the app’s dashboard list, click Dashboards.
Claims Handler DashboardThe Claims Handler dashboard gives you actionable insights on open claims and tasks that help you to efficiently manage your workload.
The dashboard answers these questions:
66
Einstein Discovery for Insurance Analytics DashboardsUse Financial Services Cloud Tableau CRM Solutions

• How many open tasks are overdue or due tomorrow?
• Do I have any regulatory tasks open?
• Are there any open tasks related to high-severity claims?
• What are the high-priority tasks that I must focus on today?
• How many claims are open for more than the average claim settling time?
• What are the high-severity open claims?
• What’s the distribution of claims by Loss Type?
Claims Team Leader DashboardThe Claims Team Leader dashboard lets you track your team’s performance and ensure that the team members comply with the SLAs.With insights into the key metrics, you can forecast your staffing better.
The dashboard answers these questions:
• How’s my team performing based on the key metrics for claims and tasks?
• What’s the distribution of claims by status?
Producer DashboardThe Producer dashboard helps you to identify tasks, quotes, and policies that need your attention.
The dashboard answers these questions:
• How many open tasks are overdue or due tomorrow?
• Are there any high-priority tasks open?
• How many quotes and policy-related tasks are open?
• How many quotes are open? And for how long are they open?
• What’s the estimated commission on a quote?
• Which policies are up for renewal in the next 30 or 60 days?
• Which policies have high gross written premium?
Producer Performance DashboardThe Producer Performance dashboard gives insights on your performance based on key metrics for quotes and policies.
The dashboard answers these questions:
• What are the key metrics for my Book of Business?
• How am I doing based on the key metrics?
• How much did I earn in commissions?
Key Performance Indicators
Learn the definitions and calculations of key metrics shown in Insurance Claims and Policy Analytics.
67
Use Insurance Claims and Policy Analytics DashboardsUse Financial Services Cloud Tableau CRM Solutions
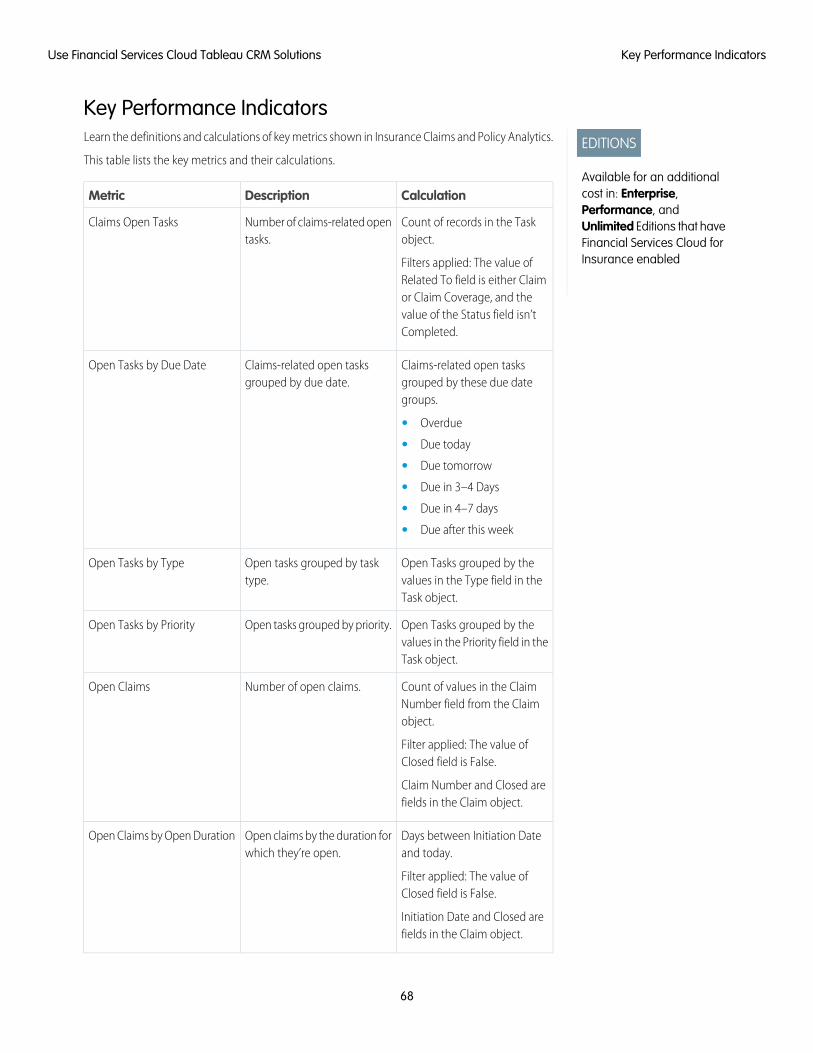
Key Performance Indicators
EDITIONS
Available for an additionalcost in: Enterprise,Performance, andUnlimited Editions that haveFinancial Services Cloud forInsurance enabled
Learn the definitions and calculations of key metrics shown in Insurance Claims and Policy Analytics.
This table lists the key metrics and their calculations.
CalculationDescriptionMetric
Count of records in the Taskobject.
Filters applied: The value ofRelated To field is either Claimor Claim Coverage, and the
Number of claims-related opentasks.
Claims Open Tasks
value of the Status field isn’tCompleted.
Claims-related open tasksgrouped by these due dategroups.
Claims-related open tasksgrouped by due date.
Open Tasks by Due Date
• Overdue
• Due today
• Due tomorrow
• Due in 3–4 Days
• Due in 4–7 days
• Due after this week
Open Tasks grouped by thevalues in the Type field in theTask object.
Open tasks grouped by tasktype.
Open Tasks by Type
Open Tasks grouped by thevalues in the Priority field in theTask object.
Open tasks grouped by priority.Open Tasks by Priority
Count of values in the ClaimNumber field from the Claimobject.
Filter applied: The value ofClosed field is False.
Number of open claims.Open Claims
Claim Number and Closed arefields in the Claim object.
Days between Initiation Dateand today.
Filter applied: The value ofClosed field is False.
Open claims by the duration forwhich they’re open.
Open Claims by Open Duration
Initiation Date and Closed arefields in the Claim object.
68
Key Performance IndicatorsUse Financial Services Cloud Tableau CRM Solutions

CalculationDescriptionMetric
Average of (Days between Finalized Dateand Initiation Date for all claims)
Filters applied: The value of the Closed fieldis True, and a value exists in the FinalizedDate field.
Average time taken to settle a claim.Average Claim Settling Time
Finalized Date, Initiation Date, and Closedare fields in the Claim object.
Open Claims grouped by the values in theStatus field in the Claim object.
Open claims grouped by status.Open Claims by Status
Open Claims grouped by the values in theLoss Type field in the Claim object.
Open claims grouped by loss type.Open Claims by Loss Type
Count of records in the Task object.
Filters applied: The value of Related To fieldis either Insurance Policy or Quote, and thevalue of the Status field isn’t Completed.
Number of open tasks related to insurancepolicies or quotes.
Open Tasks
Related To and Status are fields in the Taskobject.
Insurance Policy or Quote-related open tasksgrouped by these due dates.
Insurance policy or quote-related open tasksgrouped by due date.
Open Tasks by Due Date
• Overdue
• Due today
• Due tomorrow
• Due in 3–4 Days
• Due in 4–7 days
• Due after this week
Open tasks grouped by the values in thePriority field.
Open tasks grouped by priority.Open Tasks by Priority
Count of records in the Quote object.
Filters applied: End Date field doesn’t havea value. Or, the End Date field value is
Number of open quotes.Open Quotes
greater than or equal to today, and theStatus field value isn’t Issued, Rejected, orDenied.
Open quotes grouped by these openduration groups.
Open quotes grouped by the open durationgroups.
Open Quotes by Open Duration Groups
• Quotes open for less than 2 days
• Quotes open for 2–7 days
• Quotes open for 1–2 weeks
69
Key Performance IndicatorsUse Financial Services Cloud Tableau CRM Solutions

CalculationDescriptionMetric
• Quotes open for 3–4 weeks
• Quotes open for more than 4 weeks
Open quotes grouped by the durationbetween the Effective Date and today.
Filter applied: The value of the Status fieldisn’t Issued, Rejected, or Denied.
Open quotes by open duration.Open Quotes by Open Duration
Effective Date and Status are fields in theQuote object.
Sum of Commission Amount field values forall Open Quotes.
Commission amount for an open quote.Quoted Commission
Count of records in the Insurance Policyobject.
Filters applied: The value of the FinalRenewal Date field is in the selected
Number of policies that are up for renewalin the selected duration.
Policies Up For Renewal
duration. If the Final Renewal Date doesn’thave a value, the Renewal Date field isconsidered. The value of the Status field isn’tTerminated, Canceled, or CustomerRejected.
Duration in days between the Final RenewalDate and today.
When the Final Renewal Date field doesn’thave a value: Duration in days between the
Number of days before the policy renewaldue date.
Days to Renewal
Renewal Date and today. Final Renewal Dateand Renewal Date are fields in the InsurancePolicy object.
Sum of Gross Written Premium values in theInsurance Policy object.
Total gross written premium of all policies.Gross Written Premium
Sum of all Total Commission Amount fieldvalues in the Insurance Policy object.
Filter applied: The value of the Effective Datefield is in the selected duration.
Total commission amount from insurancepolicies.
Earned Commissions
Total Commission Amount and EffectiveDate are fields in the Insurance Policy object.
(Count of records in the Insurance Policyobject with a value in the Source Quote
Percentage of quotes converted to policies.Quote Conversion Rate
field)/(Count of records in the Quote object)* 100
70
Key Performance IndicatorsUse Financial Services Cloud Tableau CRM Solutions

CalculationDescriptionMetric
Filter applied: The value of the Effective Datefield is in the selected duration.
Policies Renewed * 100/(Policies Renewed+ Policies Not Renewed)
Policies Renewed: Count of Insurance Policyrecords where the Final Renewal Date or
Percentage of policies renewed.Policy Renewal Rate
Renewal Date field value is in the selectedduration, and a value exists in the DateRenewed field.
Policies Not Renewed: Count of InsurancePolicy records where the Final Renewal Datefield value or Renewal Date field value is inthe selected duration. The Date Renewedfield doesn’t have a value and the Statusfield value is Terminated, Cancelled, orCustomer Rejected.
(Sum of Gross Written Premium of InsurancePolicy records with a value in the SourceQuote field)/(GWP of all Quotes) * 100
Filter applied: The value of the Effective Datefield is in the selected duration.
Percentage of quotes converted to policiesbased on premium.
Quote Conversion Rate based on Amount
(Sum of Gross Written Premium of PoliciesRenewed * 100)/(Sum of Gross Written
Percentage of policies renewed based onpremium.
Policy Renewal Rate based on GWP
Premium of Policies Renewed + Sum ofGross Written Premium of Policies NotRenewed)
Policies Renewed: Count of Insurance Policyrecords where the Final Renewal Date orRenewal Date field value is in the selectedduration, and a value exists in the DateRenewed field.
Policies Not Renewed: Count of InsurancePolicy records where the Final Renewal Datefield value or Renewal Date field value is inthe selected duration. The Date Renewedfield doesn’t have a value and the Statusfield value is Terminated, Cancelled, orCustomer Rejected.
71
Key Performance IndicatorsUse Financial Services Cloud Tableau CRM Solutions
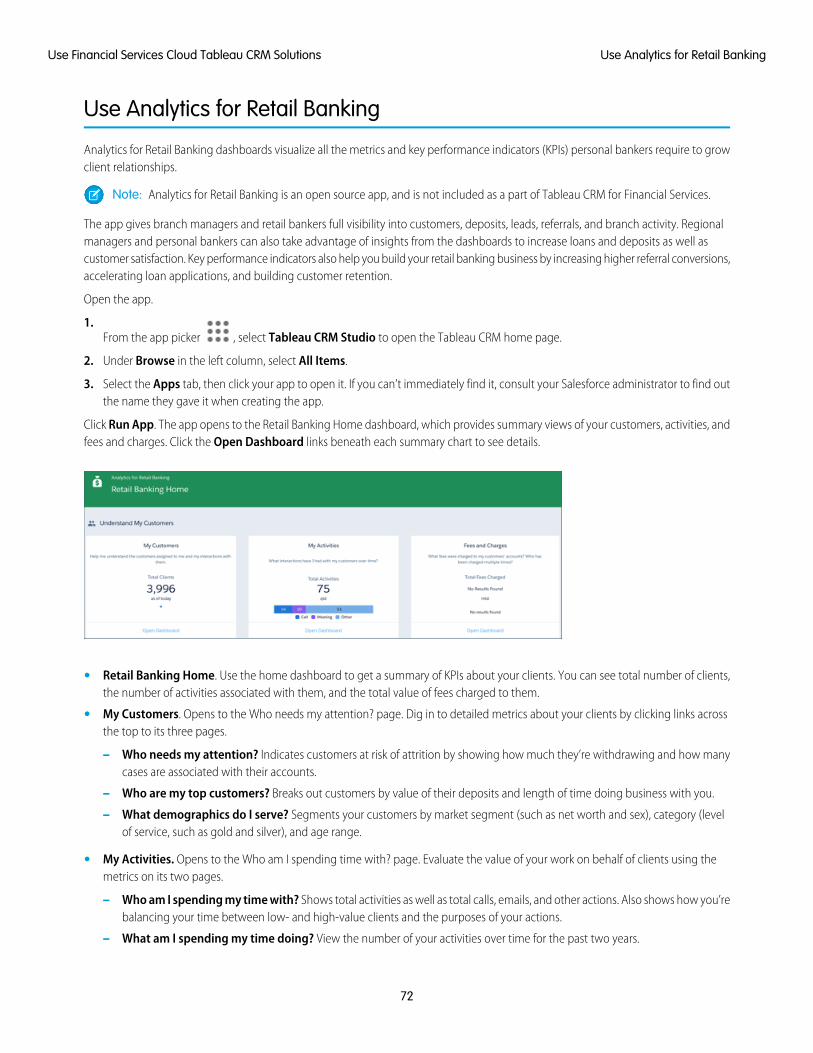
Use Analytics for Retail Banking
Analytics for Retail Banking dashboards visualize all the metrics and key performance indicators (KPIs) personal bankers require to growclient relationships.
Note: Analytics for Retail Banking is an open source app, and is not included as a part of Tableau CRM for Financial Services.
The app gives branch managers and retail bankers full visibility into customers, deposits, leads, referrals, and branch activity. Regionalmanagers and personal bankers can also take advantage of insights from the dashboards to increase loans and deposits as well ascustomer satisfaction. Key performance indicators also help you build your retail banking business by increasing higher referral conversions,accelerating loan applications, and building customer retention.
Open the app.
1.From the app picker , select Tableau CRM Studio to open the Tableau CRM home page.
2. Under Browse in the left column, select All Items.
3. Select the Apps tab, then click your app to open it. If you can’t immediately find it, consult your Salesforce administrator to find outthe name they gave it when creating the app.
Click Run App. The app opens to the Retail Banking Home dashboard, which provides summary views of your customers, activities, andfees and charges. Click the Open Dashboard links beneath each summary chart to see details.
• Retail Banking Home. Use the home dashboard to get a summary of KPIs about your clients. You can see total number of clients,the number of activities associated with them, and the total value of fees charged to them.
• My Customers. Opens to the Who needs my attention? page. Dig in to detailed metrics about your clients by clicking links acrossthe top to its three pages.
– Who needs my attention? Indicates customers at risk of attrition by showing how much they’re withdrawing and how manycases are associated with their accounts.
– Who are my top customers? Breaks out customers by value of their deposits and length of time doing business with you.
– What demographics do I serve? Segments your customers by market segment (such as net worth and sex), category (levelof service, such as gold and silver), and age range.
• My Activities. Opens to the Who am I spending time with? page. Evaluate the value of your work on behalf of clients using themetrics on its two pages.
– Who am I spending my time with? Shows total activities as well as total calls, emails, and other actions. Also shows how you’rebalancing your time between low- and high-value clients and the purposes of your actions.
– What am I spending my time doing? View the number of your activities over time for the past two years.
72
Use Analytics for Retail BankingUse Financial Services Cloud Tableau CRM Solutions

• Fees and Charges. Opens to the What fees were charged? page. Get details about fees charged to your clients. Use filters acrossthe top to sort metrics according to banker, fee types, reversed fees, fee amounts, and time period.
– What fees were charged? Review the amount of fees charged over time and reversed fees based on selected filters.
– Which customers were charged? Charts at top show what type of customers (according to balance size) paid the most feesand how many times fees were charged. Bottom chart shows total balance, fee amounts, and percent of reversed fees for eachclient.
• Customer Acquisition. Opens to the What needs attention? Page. Get input about the clients most in need of attention by reviewingclient accounts according to activity level, age, and expected value. Filters across the top let you look at client accounts accordingto banker, record type, status, rating, and source.
– Lead/referral sources. See the sources of your leads (partner referral, phone inquiry, and so on). Also learn about your bestreferrers so you can zero in on promising leads.
– Tracking leads/referrals. Learn the status of leads started on a selected date.
– Conversion. Shows overall lead conversion rate and processing time. Zero in on a single banker by setting the Banker Namefilter.
– Lead Pipeline Trending. Visualize your lead pipeline for a selected period. Includes beginning and end lead totals, and thenumber of leads added, converted, and disqualified.
• My Referrals. Get insights into how you can increase referral conversion. Find out how your referrals impact the business by learningtheir conversion rate and the amounts of balances and loans coming from them. Also find out which recipients of your referrals aremost likely to convert them.
From the app, open the Branch Management dashboard to get a comprehensive view of your employees’ activities at differentbranches. From this dashboard, you see the clients, total balance, lead conversion, and closed wins for employees at all your branchlocations. These insights allow you to improve branch operations and see how the expertise of employees is distributed across branches.
Use Consumer Banking Starter Analytics
The Consumer Banking Starter Analytics gets you started with a dashboard personal bankers can use to move clients up the value chain.
Note: Consumer Banking Starter Analytics is included with Tableau CRM for Financial Services, which is available at an extra chargefor customers with Financial Services Cloud Basic or Standard licenses and the FSCAnalyticsPlus (Tableau CRM for Financial Services)license. See Deploy Tableau CRM for Financial Services for complete deployment instructions.
The Consumer Banking Starter Analytics app helps personal bankers grow assets under management (AUM) and cross-sell financialservices products. Visualizations include client AUM, held away, and market share. You also get insight into referrals and opportunitiesto help start new relationships.
1.From the app picker , select Analytics Studio to open the Tableau CRM home page.
2. Under Browse in the left column, select All Items.
3. Select the Apps tab, then click Consumer Banking Starter Analytics. If you can’t immediately find it, consult your Salesforce administratorto find out the name they gave it when creating the app.
73
Use Consumer Banking Starter AnalyticsUse Financial Services Cloud Tableau CRM Solutions

The app’s Consumer Banking dashboard opens to the Client List page. View the other pages by clicking the links across the top.
• Client List. Use this page to segment your client list according to key characteristics. View client market segments (high net worth,gender, and so on) and the status of their relationships (active, prospect, dormant, and so on). You can also filter by individual client,their risk tolerance, investment objectives, and financial interests. And view details about each of your clients, including the totalvalue of their financial accounts.
• Referrals. Shows status of referrals over time, including the number created and converted, conversion rate, and the revenuegenerated. You can also see if referrals have been contacted and if they’re close to converting to client status. Also, view the typesof services clients say they’re interested in.
• Opportunities. Use the metrics on this page to see the total pipeline value, closed won and lost business, and win rate. Also, seedetails for each opportunity, including stage, amount, and forecast category.
• Activities. See breakdowns of your team’s activities. View metrics for activities according to their purpose (client retention, onboarding,and prospecting) and type (such as call, meeting, email). Also see activities for each account
Use Wealth Starter Analytics
The Wealth Starter Analytics app helps financial advisors get started fast analyzing the success of your financial services business.
Note: Wealth Starter Analytics is included with Tableau CRM for Financial Services, which is available at an extra charge forcustomers with Financial Services Cloud Basic or Standard licenses and the FSCAnalyticsPlus (Tableau CRM for Financial Services)license. See Deploy Tableau CRM for Financial Services for complete deployment instructions.
74
Use Wealth Starter AnalyticsUse Financial Services Cloud Tableau CRM Solutions

The app dashboard’s prebuilt visualizations provides actionable insights to help you deepen client relationships and increase assetsunder management (AUM). Align your actions with current client goals, engage new clients using the proper channels, and segmentclients so you can provide personalized services to them.
Open the app.
1.From the app picker , select Tableau CRM Studio to open the Tableau CRM home page.
2. Under Browse in the left column, select All Items.
3. Select the Apps tab, then click your app to open it. If you can’t immediately find it, consult your Salesforce administrator to find outthe name they gave it when creating the app.
The app opens to its My Book of Business dashboard, which shows a wealth of data visualizations about your business interactions.Summary metrics include Total Assets, AUM, Held Away, and Wallet Share. Filter them by account, risk tolerance, investments objectives,and financial interests. The dashboard includes five views, each of them letting you dig deep into your business metrics:
• Accounts (shown). Toggle between accounts and holdings. View accounts by market category, segment, and status.
• Client Interactions. View activities and engagements by status and type as well as according to whether they’re completed orupcoming. Also see if interactions relate to onboarding, retention, or prospecting.
• My Pipeline. View the pipeline by stage and forecast category and see list of all opportunities. Also review forecast, win rate, andclosed won business.
• Cases. View case status as well accounts with cases according to AUM and days since case creation.
• Marketing Programs. View campaigns sorted by value or size, type, and status. Also see list of campaign members and clients andprospects to campaigns.
Use the Client Segmentation App
EDITIONS
Available in: Enterprise andUnlimited Editions
Client Segmentation App dashboards help you gain insights across your book of business to deepenclient relations. It’s enabled by a license that provides restricted access to Tableau CRM features.
Note: Administrators can set up your org with Client Segmentation App by following thesteps in Deploy the Client Segmentation App.
75
Use the Client Segmentation AppUse Financial Services Cloud Tableau CRM Solutions

Important: If the Financial Services Cloud – Einstein Analytics managed package was installed in your org before February 8,2019: view the dashboards described here through the Financial Services Cloud Advisor Analytics tab. The tab will remain availableuntil June 30, 2019. Customers are advised to work with their Salesforce administrators to remove the tab before then. See“Personalize the Navigation Bar in Lightning Experience” in Salesforce Help. Client Segmentation App replaces the dashboardsformerly available through the Financial Services Cloud Advisor Analytics tab.
Open the app.
1.From the app picker , select Tableau CRM Studio to open the Tableau CRM home page.
2. Under Browse in the left column, select All Items.
3. Select the Apps tab, then click your app to open it. If you can’t immediately find it, consult your Salesforce administrator to find outthe name they gave it when creating the app.
Each dashboard provides a different focus on your book of business. Dashboards are listed in alphabetical order here. They may notappear in the same order in your org.
• Activities. See how activities are impacting your client relationships by analyzing interactions in the context of different activitytypes. Identify gaps and opportunities to improve future engagement.
• Client Goals. Measure client goals by spotting key trends. Create tasks or opportunities in context to client data to help keep clientson track.
• Client List. Get a focused list of clients with robust filtering capabilities that surface financial data points and account details.
• 80/20. Maximize your time by comparing client revenue against advising activities and identify key actions for high-potential clients.
• Financial Accounts. Respond to market conditions in a timely manner by uncovering the types of financial accounts and securitiesthat make up your book of business.
Note: Use of this app is covered by a restricted usage license that gives you limited use of the Tableau CRM platform. See “AnalyticsLimitations” in Salesforce Help to learn more. Financial Services Cloud customers who installed the Einstein Analytics for FinancialServices Cloud package will have access to Client Segmentation dashboards. We have retired the name Einstein Analytics forFinancial Services Cloud.
SEE ALSO:
Tableau CRM Limitations
76
Use the Client Segmentation AppUse Financial Services Cloud Tableau CRM Solutions