Embed Size (px)
Citation preview

FINANCIAL SERVICES RETAIL BANKINGCUSTOMER SEGMENT PERFORMANCE
COGNOS PERFORMANCE
BLUEPRINT
IMPLEMENTATION GUIDE
A WEB-BASED PERFORMANCE
MANAGEMENT APPLICATION

2
INTRODUCTION
This Implementation Guide demonstrates a Web-based planning and reporting process for Retail Banking,
Customer Segment performance using Cognos 8 Planning and Cognos 8 Business Intelligence. Ask most
financial services executives about their key strategies for growth and the same answers tend to pop up:
increase wallet share, improve customer satisfaction and loyalty, the ability to serve small and medium enter-
prises more cost-effectively, and knowing the customer’s needs so that the institution can offer the right
product at the right time.
All of these answers are predicated upon having customer segment or individual customer data available,
using the data to understand the behaviors and profitability of customers or groups of customers, and then
to create strategies and plans that maximize the institution’s success.
The tools to perform these tasks have existed for years, but in most cases, data resides in disparate systems,
customer profitability solutions exist in relative isolation from the financial planning process, customer rela-
tionship management (CRM) solutions have been cost-prohibitive and rarely lived up to their promise, and
initiative planning and tracking has been an afterthought. Consequently, many institutions have failed to
meet their growth and profitability targets.
Despite the inefficient processes found at many banks, a coordinated, efficient approach to driving customer
profitability can be a reality. The first step is to consolidate customer data, storing all relevant transactional,
product, demographic, goal and profile information in an accessible place. Next is applying appropriate report-
ing and analysis tools to the task of understanding as much as possible about customer segments and individ-
ual customers. Once those segments and customers are understood more completely, the bank can use
technology integrated with analysis and reporting capabilities to plan initiatives and set very specific targets that
improve segment profitability. Finally, the bank can monitor the success of its plans and initiatives and feed
information gained back into the process, creating a closed-loop cycle for continual performance improvement.

3
The Cognos Retail Banking Customer Segment Performance Blueprint is an excellent solution for reporting
on customer segments and customers, planning segment-level profitability, and planning initiatives to drive
increased revenue and profitability into a customer segment. It enables retail banks to create profit-and-loss
statements at the customer segment level. The solution allows segment- or customer managers to report on
and analyze profitability down to the customer level or household level, to create regional and product P&Ls
within a customer segment, and to plan sales and marketing initiatives to improve segment results.
Integration with Acorn Systems' activity-based management software ensures granular, accurate profitability
measurement and planning.
The Retail Banking Customer Performance Blueprint comprises three primary components:
• Reporting, analysis, dashboards, and scorecards using Cognos 8 Business Intelligence.
• Planning and forecasting, using Cognos 8 Planning.
• Activity-based costing and management (pre-integrated with Acorn Systems’ Profit Analyzer CI, but
can be used with any ABC or other costing system or methodology).
Using these components, the Blueprint enables customer segment managers, marketing personnel, and other
customer-facing bank employees to receive customer segment information, analyze that information to deter-
mine targets, plan initiatives to drive increased profits into the chosen segment, and manage and update a
customer-segment level P&L. The descriptions below follow that basic workflow: report and analyze cus-
tomers and customer segments, plan initiatives, and manage the customer segment P&L.
The components of profitability are interrelated and act as drivers. For example, an increase in the number
of loan accounts will create more revenue and also drive an increase in the transaction volumes and activi-
ties associated with loan accounts thereby generating an increase in the associated expenses. The Blueprint
and processes described in this Implementation Guide are generic for any commercial/corporate bank, yet
can be configured to support the complex and diverse requirements of any financial institution.

4
CUSTOMER SEGMENT REPORTING, ANALYSIS, DASHBOARDS, AND SCORECARDS
The Retail Banking Customer Segment Performance Blueprint provides a hierarchy of dashboards and reporting
designed to guide the user through deeper and deeper levels of customer- and customer segment detail.
The first level provides a view of all customer segments (Cross-segment Report), which allows the user to under-
stand at a glance how segments are performing across measures such as revenue, contribution margin, and
accounts per customer. In addition, it highlights initiatives proving most successful at driving higher profitability.
Customer Segment Report

The next level in the reporting hierarchy is the Customer Segment Report. This dashboard-style report allows
the user to look within a segment to understand differences across regions and products—both comparatively
and in absolute financial terms. It also incorporates an initiative summary, which reflects initiatives success
within this particular segment.
Customer Segment Report
5

6
The lowest level of reporting is the Customer Report, which displays both key financial information for the
customer as well as profitability measures, such as customer profitability score, customer lifetime value, risk
grade, and products most likely to be purchased next (these measures can be either supplied by an existing
bank profitability system or created independently). There is also a link to the Customer Transactions and
Inquiries Report, which provides detailed information about recent transactions and inquiries.
Customer Report
Transactions Report

INITIATIVE REPORTING, ANALYSIS, DASHBOARDS, AND SCORECARDS
From the customer analysis just performed—whether at cross-segment, segment, or customer level—the bank
user is able to identify exactly which customer segment to target for product or service initiatives. To launch
a new initiative, the user may look at how initiatives have performed historically in order to determine what
initiative to proceed with for the chosen target.
Similar to customer segment reporting, there is an initiative reporting hierarchy. The highest level is a cross-
initiative report, showing key information regarding all initiatives across segments, regions, and products.
Cross-Initiative Summary Report
7

From the Cross-Initiative Report, the user can select a report for a single initiative, which provides an even
greater level of detail on any past initiative.
Initiative Report
8

9
The final initiative report is quite different from the others, in that it provides a guided path to choosing an
effective initiative based on historical data (similar to a “wizard”). Initiative Selection Analysis prompts the
user to select the customer segment for which an initiative is to be executed, then provides a list of the most
profitable products within that segment. The user then has the opportunity to select which product to offer
to the target segment. Based on the product selection, the report then provides a listing of past initiatives—
and the associated marketing media—that have proved most successful in promoting that product, allowing
the user to choose the optimal product—initiative mix.
Initiative Selection Analysis

CONTRIBUTOR APPLICATION OVERVIEW
Performance management systems allow management to articulate goals and provide a measurement process
so that performance against the goals can be tracked and feedback provided. At a corporate level, effort is
made to manage shared services spending rates. At the Customer Segment level, segment managers make
decisions to optimize efficiency and output. Collaboration must occur on a forward-looking basis so that
segment-level decisions are aligned with corporate expectations, and so that variances can be evaluated.
Customer Segment managers need clear targets and goals, and need to understand corporate expectations.
Managers must be able to forecast both operational needs and profitability, and get continuous feedback on
their performance against corporate targets and profitability guidelines. The Financial Services Retail
Banking Customer Segment Performance Blueprint helps meet these needs.
Blueprint Objectives
The Retail Banking Customer Segment Performance Blueprint meets a number of objectives:
1) Establishes clear and concise targets for each segment manager at a profit-and-loss (P&L) level.
2) Establishes clear and concise targets for each segment by product type and customer segment.
3) Calculates revenues and loan losses based on account balances and account levels.
4) Uses Acorn’s activity-based costing engine to calculate activity volumes from historic activity
intensity rates driven by forecasted account activity by product and transaction.
5) Uses derived volume activity to calculate assigned expenses using shared services rates.
6) Provides the ability to enter direct expenses associated with the segment
7) Provides immediate feedback on planning decisions.
8) Allows reporting and analysis by segment, product, and household.
10

KEY COGNOS 8 PLANNING BENEFITS
• Powerful, flexible model development using Cognos Analyst to customize the Retail Banking Customer
Segment Performance Blueprint.
• Web-based deployment of models for process workflow, data collection, and consolidation.
– Real-time workflow.
– Real-time consolidation.
– Real-time browser-based calculations for immediate results.
• Scalable architecture with proven deployments to thousands of line managers.
• Linking functionality to ensure collaboration between all areas of the enterprise.
• Form-based planning with selection boxes to drive application logic and calculations.
• Flexible analysis and report development using industry-leading Cognos 8 Business Intelligence
Representative Workflow
The Retail Banking Customer Segment Performance Blueprint is designed for collaborative use by Corporate
division executives, regional managers, financial planners & analysts, and segment managers to help man-
agers align decisions with corporate.
The following describes basic workflows in which a Segment manager would:
• Review corporate targets for a Customer Segment.
• Plan new Initiatives by product for a Customer Segment to influence forecasted revenues and
Contribution margins.
• Forecast revenue and account activity to align baseline plans and corporate targets.
• Assess impacts on product and customer profitability.
• Evaluate indirect activity-based costs that impacts the segments bottom line.
• Monitor key performance indicators.
• Generate reports and analyses.
11
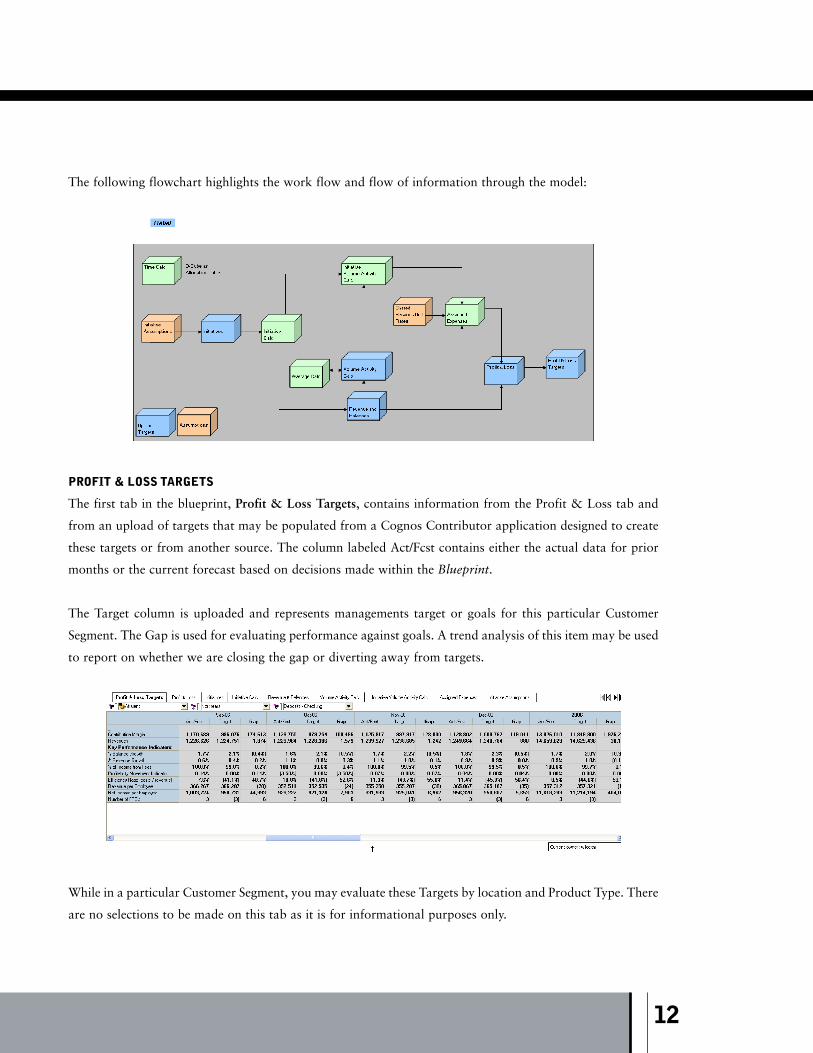
The following flowchart highlights the work flow and flow of information through the model:
PROFIT & LOSS TARGETS
The first tab in the blueprint, Profit & Loss Targets, contains information from the Profit & Loss tab and
from an upload of targets that may be populated from a Cognos Contributor application designed to create
these targets or from another source. The column labeled Act/Fcst contains either the actual data for prior
months or the current forecast based on decisions made within the Blueprint.
The Target column is uploaded and represents managements target or goals for this particular Customer
Segment. The Gap is used for evaluating performance against goals. A trend analysis of this item may be used
to report on whether we are closing the gap or diverting away from targets.
While in a particular Customer Segment, you may evaluate these Targets by location and Product Type. There
are no selections to be made on this tab as it is for informational purposes only.
12

13
PROFIT & LOSS
The second tab of the blueprint, Profit & Loss, consolidates all information developed on the subsequent tabs
and is a complete look at the Customer Segment from the highest level. The Profit & Loss tab also contains
overhead expense information for Finance, Executive, and Human Resources as well as FTE information
linked in from another source. In our case, we uploaded this information from Analyst; this information may
be sourced if available from any other system or model. As in the previous tab, a number of Key Performance
Indicators have been calculated for end-user convenience and information. These indicators have been linked
back to the first tab, Profit and Loss Targets, so that they might be compared to management targets and to
analyze trends. You will notice that the tab has drop-down menus to select both the product group and loca-
tion when analyzing the customer segment.
There are no selections to be made on this tab as it is a consolidation of information from other tabs and
uploads.

INITIATIVES
The third tab of the blueprint, Initiatives, is where are planner has the ability to conduct some what-if analy-
sis and plan Marketing Initiatives by specific products within the customer segment. The ten initiatives avail-
able for planning were derived at by analyzing the Business Intelligence data and choosing those we wished
to give our users the opportunity to plan at. This list could be modified to represent any mix of products
desired and could grow to accommodate additional products. If you were to make changes to this or any
other dimension within the model, be aware that you would lose the ability to use match descriptions within
the data upload links.
14

Prior to coming to this tab, it is advisable, though not necessary, to explore within the Business Intelligence
portal the Initiative Selection Analysis report discussed on page ten of this Implementation Guide. The
report is designed to assist the user in making an intelligent decision regarding which products they should
pursue in an Initiative, as well as the best approach to use to maximize results.
A user’s first choice, on the left, would be the Initiative Type.
Having chosen a type, the user would enter the dollar amounts for their Marketing campaign in the appro-
priate categories. The next area available for edit, those not grayed-out, are the start and end month for the
Initiative, the location(s) where the Initiative is to take place, and the hoped-for number of accounts within
each of the different credit areas. The Blueprint is designed as a Rolling Forecast, but for demonstration pur-
poses has been locked to respond as if the current date is within the first week of October 2006. For that
reason, all data prior to October 2006 will be grayed out to maintain the integrity of historical data. Here
you will notice when choosing a start date, above middle, that it is not possible to start an initiative in a
month that has already passed. When choosing a location for the initiative, you may plan for a single loca-
tion, a region, or all regions.
Finally, having entered data for an initiative, you may enter notes or risks, and then if desired make a selec-
tion in the first column as to the scenario you’d like to use and include within the forecast.
15

INITIATIVES CALC
The fourth tab of the Blueprint, Initiatives Calc, may be hidden from the user if desired. It takes the deci-
sions on the Initiatives tab and extrapolates the data so that it may be fed to the Revenue & Balances tab
(Revenue) and the Initiatives Volume Activity Calc tab (to calculate volume based on number of accounts).
It assures that revenues, accounts, and initiative acquisition costs are recognized in the appropriate time
period.
REVENUE & BALANCES
The fifth tab of the blueprint, Revenue & Balances, manages Customer Segment account Balances, number
of Accounts, and Net New Customers. In this tab, those responsible for forecasting Runoff, New Business,
and Attrition for account balances and New Accounts and Attrition in the number of accounts run appro-
priate forecasts. A forecast is run for each Product Group by Customer Segment, location and Credit rating.
16

To facilitate data entry, the tab may be reoriented as needed. For example, the tab may be reoriented to work
on the Planned Runoff for all product groups in a customer segment, by location, month, and credit rating.
Or for all locations in their Customer Segments for a given product, i.e. Brokerage for 2006:
Fields in GRAY are non-editable and are either locked historical data, data linked over from other tabs, or
items calculated based upon information entered in the white or editable areas As changes are made, they are
highlighted in BLUE along with any cells affected by the change. Balance changes will affect Revenue
numbers and flow through the model to subsequent tabs. Likewise, changes in the Accounts area will affect
income (revenue from new accounts) and drive account related activity volumes. Account-related activity
volumes will affect Assigned Expenses, that is, expenses specifically related to the number and types of
accounts in the model.
17

VOLUME ACTIVITY CALC
The sixth tab, Volume Activity Calc is where the activity-based costing portion of the Blueprint is executed.
In all the other tabs in the model that use products as a dimension, we plan at the Product Type level. In this
tab, we take a deeper view of our products and their associated expenses. While still planning at the
Customer Segment level, we now delve deeper and plan at both a Product and Activity level. We’ll take a
closer look at each dimension separately. In the view below, notice the drop-down box currently showing the
item Customer Inquiry Calls.
This is one of the many activities that might be associated with a specific Product. In fact, when loading data
from Acorn’s activity-based costing engine, many transactions may make up an activity for a specific product
and customer segment. For example, the Activity, Customer Inquiry Calls, would be made up of many dif-
ferent types of transactions. Purchase Inquires, Call Center Balance Inquiries, Call Center Inquiries, and
Inbound Purchase Calls would all be examples of items that are part of the Activity - Customer Inquiry Calls.
The number of times these activities take place for a given product, in a given location, for a given customer
segment during a specific period, in our case monthly, is defined as the Activity Intensity Rate. In other
words, it is not only the transactions that make up the activity, but the number of times an activity might
occur within the month (i.e. a customer might make a Call Center Balance Inquiry twice a month). The
Activity Intensity Rate is determined on a historical basis. By looking at Customer Segment, by month, by
location, by product, and then dividing the total historical activity by the number of accounts associated with
that history we arrive at the Activity Intensity Rate. Then by using a combination of linear extrapolation and
knowledge of any changes management is considering, a forecasted Activity Intensity Rate is developed. This
Activity Intensity Rate is used with the Accounts forecast within the Revenue & Balances tab to forecast
Activity Volumes that will be used to drive Assigned Expenses.
18

Transactions which flow into Activities are based upon specific Products and Customer Segments. Therefore,
we plan at the product level within the Volume Activity Calc tab. Within the Revenue & Balances tab we
plan at the Product Type level. We must therefore link the information between these to differing dimensions.
History we know, thus actuals are loaded directly from Acorn’s activity-based costing engine. We populate
the forecast months by linking the Product Type from the source, Revenue and Balances, to the target dimen-
sion Products. Note that the target dimension, Products, does contain the items planned in the source list (i.e.
Deposits – Checking, Deposits – Savings, Loans - Mortgage etc. are on both lists).
When linking data from our source, Revenue and Balances, we “breakback” or “allocate” the accounts
across products based upon the running three-month average. For instance, if “Deposits – Checking” aver-
aged 12 percent of “Total Deposits” for the previous three months, then that basis would be used to allocate
all forecast months.
In the following two screens, notice how the Average of the Opening Accounts and Closing Accounts ((326
+ 334)/2 or the 330) from the Revenue & Balances tab linked over and allocated to the Loans - Mortgage
area of the Volume Activity Calc tab. All else being equal, Affluent to Affluent, New York to New York, Oct
’06 to Oct ’06, the total for the Product Type and for all grades allocated itself based upon the last three
months actual history
19

Having now linked in the account information, and using the Activity Intensity Rate, we can now calculate
the Activity Volume by product (Online Brokerage Account), customer segment (Affluent), and month for
each activity associated with a given product for a specific location.
It is also worth noting, that by dropping down the activities list, you will note that not all products are asso-
ciated with all activities. So while Online Brokerage Accounts would calculate an activity volume for
Customer Inquiry Calls, Telephone Banking Support, Deposit Origination and Accept Deposit ATM, we
would not have any Activity Volumes associated with Renewals-Call Ctr, and Loan Origination-Call Ctr.
20

Having now calculated the Activity Volume level, we will link that information over to the Assigned Expenses
tab to calculate the assigned expenses.
INITIATIVE VOLUME ACTIVITY CALC
Tab seven, Initiative Volume Activity Calc, like Volume Activity Calc, calculated the Activity Volume for
those products we developed initiatives for on the Initiatives tab. Since we planned the account levels for
these Initiatives at the product, month, and location level, we can link information directly from the
Initiatives Calc tab. The Activity Intensity Rate is linked over from the Volume Activity Calc tab and the
Activity Volumes calculated here are added to those from the Volume Activity Calc tab in the Assigned
Expenses tab.
21

ASSIGNED EXPENSES
Tab eight, Assigned Expenses, is where we calculate expenses driven by account activity. All calculations are
reflective of the choices made in the preceding tabs. It is not necessary to show this information to the user.
We have included this tab as a courtesy for informational purposes. An administrator of the Cognos
Contributor application could decide to hide this tab and allow a user to see the consolidated results in the
Profit & Loss tab. Volumes are fed from the Volume Activity Calc and Initiative Volume Activity Calc tabs.
The Planned Unit Price is linked in from an assumptions tab, Shared Services Unit Rates. The Planned Unit
Price is set at a corporate level based upon historical values and recent initiatives. The Volumes multiplied by
the Planned Unit Prices gives us our costs which are then consolidated appropriately and linked into the
Profit & Loss tab.
22

INITIATIVE ASSUMPTIONS
The ninth tab, Initiative Assumptions, is used to link data into the Initiatives tab based upon the choices made
there. This tab may be hidden by the Contributor Administrator from the end user view if desired.
23

SHARED SERVICES UNIT RATES
The tenth tab in the Financial Services Retail Banking Customer Segment Performance Blueprint is Shared
Services Unit Rates. This is an assumptions tab that contains both the historic rates and the rates being fore-
cast by management. These rates are used in the Assigned Expenses tab and are driven by activity volume.
When developing these rates, management takes into account historical trends, anticipated changes in
processes, and how future hardware and software purchases might affect unit rates. The user has no input
here; and the Cognos Contributor administrator may elect to hide this tab from end-user view.
AVERAGE CALC
The eleventh tab in the model, Average Calc, is used to facilitate the allocation of account information from
the Revenue & Balances tab to the Volume Activity Calc tab based upon a running three-month phasing.
This tab requires no input from the user and may be hidden at the discretion of the Cognos Contributor
administrator.
24

TIME CALC
The twelfth, and final tab in our blueprint is Time Calc. This tab allows for an automated rolling forecast
and requires no input from the user. It may be hidden at the discretion of the Cognos Contributor adminis-
trator. It is used as an allocation table in a number of the links within the model. Some links require that
actual months data be used, others the forecasted months, and still others need to link over the three previ-
ous months for use in our average discussed in linking accounts from the Revenue & Balances tab to the
Volume Activity Calc tab.
ACORN INTEGRATION
Acorn Systems offers Profit Analyzer, Cognos Integration Edition, based on its participation as the develop-
ment and best practices partner for the Cognos Branch Performance Blueprint. Featuring a pre-defined tem-
plate for key data inputs, flexible and extensible process modeling and calculation engine, as well as pre-built
integration to Cognos’ CPM Solution, an organization can achieve rapid time to results.
25

ABOUT THE COGNOS INNOVATION CENTER FOR PERFORMANCE MANAGEMENT
The Cognos Innovation Center was established in North America and
Europe to advance the understanding of proven planning and perform-
ance management techniques, technologies, and practices. The
Innovation Center is dedicated to transforming routine performance
management practices into “next practices” that help cut costs, stream-
line processes, boost productivity, enable rapid response to opportunity,
and increase management visibility.
Staffed globally by experts in planning, technology, and performance
and strategy management, the Innovation Center partners with more
than 600 Cognos customers, academics, industry leaders, and others
seeking to accelerate adoption, reduce risk, and maximize the impact of
technology-enabled performance management practices.