Embed Size (px)
Citation preview
1
A PROGRAMME PROUDLY BROUGHT TO YOU BY
BANK SETA Thornhill Office Park, Block No.15, 94 Bekker
Road, Midrand, 1685
PO Box 11678, Vorna Valley, 1686
Telephone: (011) 805 9661, Fax: (011) 805
8348
114 Grayston Drive,
Sandown, Sandton 2196
P.O. Box 781944, Sandton, 2146
Tel: +27 11 269 8034, Fax: +27 11 269 8163
INSTITUTE OF BANKERS IN
SOUTH AFRICA
P O Box 64120
Marshalltown
2107
FINANCIAL SKILLS FOR
SMALL BUSINESS
Copyright BANKSETA Financial Skills Workshop 1
TABLE OF CONTENTS
INTRODUCTION TO FINANCIAL SKILLS FOR SMALL BUSINESS ..... 4
Overall Outcomes.................................................................................................. 4
Delivery Approach ................................................................................................. 5
LEARNING UNIT ONE ....................................................................................... 6
THE INCOME STATEMENT.............................................................................. 6
Specific Outcomes ................................................................................................ 6
1. WHAT IS AN INCOME STATEMENT? ................................................ 7
2. TERMINOLOGY USED IN THE INCOME STATEMENT ................. 9
A. Example of an Income Statement ................................................................. 9
3. SUMMARY................................................................................................ 16
LEARNING UNIT TWO..................................................................................... 21
THE BALANCE SHEET .................................................................................... 21
Specific Outcomes .............................................................................................. 21
1. WHAT IS A BALANCE SHEET? .......................................................... 22
2. TERMINOLOGY USED IN THE BALANCE SHEET........................ 23
A. Example of an Balance Sheet ..................................................................... 23
3. SUMMARY................................................................................................ 31
LEARNING UNIT THREE ................................................................................ 35
THE CASH FLOW STATEMENT .................................................................... 35
Specific Outcomes .............................................................................................. 35
1. WHAT IS A CASH FLOW STATEMENT?.......................................... 35
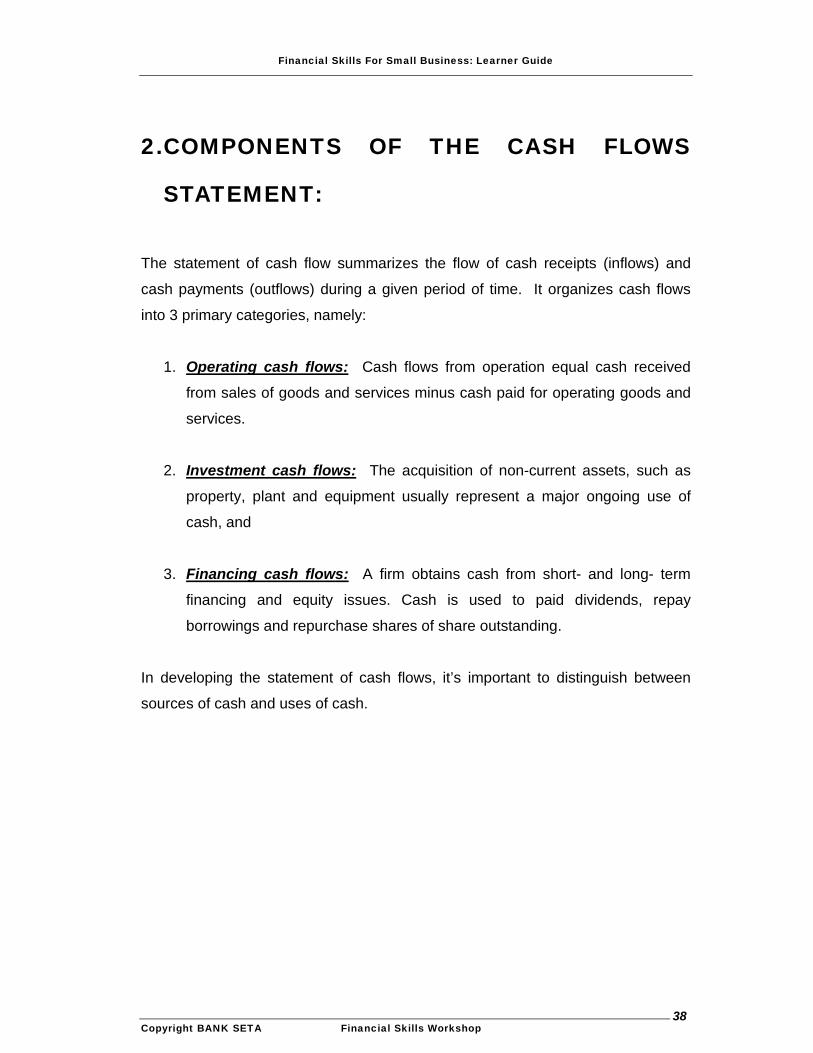
2. COMPONENTS OF THE CASH FLOWS STATEMENT: ................ 38
A. Analysing operating activities: ..................................................................... 39
B. Analysing financing activities:...................................................................... 39
C. Analysing investing activities:...................................................................... 39
4. SUMMARY................................................................................................ 40
LEARNING UNIT FOUR................................................................................... 45
Financial Skills For Small Business: Learner Guide
Copyright BANK SETA Financial Skills Workshop
2
RATIOS ................................................................................................................ 45
Specific Outcomes .............................................................................................. 45
1. WHAT ARE RATIOS? ............................................................................ 46
2. WHAT INFORMATION DO WE GET FROM RATIOS?................... 46
3. LIQUIDITY RATIOS ............................................................................... 47
A. Current Ratio (Working Capital Ratio)........................................................ 47
B. Quick Ratio (The Acid Test) ....................................................................... 47
4. Activity Ratios........................................................................................ 49
A. Average Collection Periods......................................................................... 49
B. Creditors Payment Period ........................................................................... 49
C. Debtors Collection Period............................................................................ 51
D. Stock Turnover (Inventory Turnover Ratio)................................................. 52
5. LEVERAGE RATIOS .............................................................................. 55
A. Debt to Equity .............................................................................................. 55
B. Gearing Ratio or Debt/Equity Ratio............................................................. 56
6. PROFITABILITY RATIOS:.................................................................... 57
A. Gross Profit Margin...................................................................................... 58
B. Net Profit...................................................................................................... 60
C. Return on Total Assets and Return on Equity............................................. 61
i. Return on assets....................................................................................61
ii. Return on Equity ....................................................................................62
7. SUMMARY................................................................................................ 64
LEARNING UNIT FIVE..................................................................................... 66
WORKING CAPITAL ......................................................................................... 66
Specific Outcomes .............................................................................................. 66
1. WHAT IS WORKING CAPITAL? ......................................................... 67
2. WHAT IS THE IMPORTANCE OF WORKING CAPITAL?............. 67
A. Measure of a Business’s Liquidity............................................................... 68
B. A Source Of Funds...................................................................................... 68
C. A Double-Edged Cost.................................................................................. 69
Financial Skills For Small Business: Learner Guide
Copyright BANK SETA Financial Skills Workshop
3
3. WHAT ARE THE MANAGEABLE COMPONENTS OF WORKING
CAPITAL? ............................................................................................................ 69
A. Debtor’s and creditor’s control..................................................................... 69
B. Inventory control .......................................................................................... 69
C. Cash or bank overdraft................................................................................ 71
D. Consequences of excessive cash............................................................... 71
E. Consequences of insufficient cash.............................................................. 71
F. The Cash Cycle ........................................................................................... 72
4. SUMMARY................................................................................................ 73
LEARNING UNIT SIX ....................................................................................... 76
THE GROWING SMALL BUSINESS ............................................................. 76
Specific Outcomes .............................................................................................. 76
1. ANALYSING A SMALL BUSINESS’ GROWTH PATTERN ........... 77
A. What is Overtrading?................................................................................... 77
B. What are the Effects or Results of Overtrading? ........................................ 78
C. What are the Signs of Overtrading when doing a Financial Analysis? ....... 78
2. SUMMARY ...................................................................................................... 80
Financial Skills For Small Business: Learner Guide 2007
Copyright BANKSETA Financial Skills Workshop 4
INTRODUCTION TO FINANCIAL SKILLS
FOR SMALL BUSINESS
elcome to this programme which will introduce you to
financial statements of a small business, which in turn will
enable you to better assess and the financial performance
of the small business.
The overall purpose of the workshop is, therefore, to assist you in acquiring the
applied competence to evaluate the financial performance and the financial
position of a small business.
Overall Outcomes
You will be able to:
1. apply your understanding of the relationships between the Income
Statement, Balance Sheet and the Cash Flow Statement in the
context Small Business Finance.
2. recognise the value of Working Capital management for the small
business.
3. identify the role and importance of Financial Leverage, Liquidity, and
Profitability of the small business by
iii. appraising the capital structure of a small business;
iv. calculating the cost of Capital in the small business and the
influence of tax benefits.
v. evaluating the profitability of Fixed Assets.
vi. calculating and analysing financial ratios for the small business
Financial Skills For Small Business: Learner Guide
Copyright BANK SETA Financial Skills Workshop 5
4. Evaluate Small Business’ performance by:
iii. Identifying the risks associated with a “growing” small business.
iv. Identifying the sources and uses of cash and how it flows in the
small business.
Delivery Approach
The programme is delivered during a half – day workshop. In conjunction
with this learner guide, you will be exposed to an exciting interactive
financial model, that is easy to understand, which is used to integrate the
learning outcomes.
Financial Skills For Small Business: Learner Guide
Copyright BANK SETA Financial Skills Workshop 6
LEARNING UNIT ONE
THE INCOME STATEMENT
SPECIFIC OUTCOMES
By the end of this learning unit will be able to apply your understanding of:
various accounting terms such as income, expenses, cost of sales, gross profit
and net profit.
the items that appear on the income statement.
the flow of transactions through the income statement.
important information contained in an income statement,
………to successfully assess a small business’ profitability.
Financial Skills For Small Business: Learner Guide
Copyright BANK SETA Financial Skills Workshop 7
1.WHAT IS AN INCOME STATEMENT?
The Income Statement, also referred to as the Profit and Loss Account,
presents the historical (transactions that have already taken place) results of the
operations of a business for an accounting period, usually one year.
The elements of business operations and the results thereof may be expressed by
the equation:
REVENUE – EXPENSES = NET INCOME (OR LOSS)
The income statement presents the details of that equation in a practical and
generally accepted format. The extent of the details provided and the grouping of
the revenue and expenses items in the income statement may however, differ
considerably between businesses depending on their nature and size.
Revenues are usually earned by selling goods or providing services to customers.
Expenses are best thought of as the costs incurred by the business in the process
of generating income, e.g.
When a business sells an item, the proceeds are considered as revenue;
the sales/revenue account increases.
Should the business pay a bill for electricity, the expenses account
increases.
Financial Skills For Small Business: Learner Guide
Copyright BANK SETA Financial Skills Workshop 8
In other words, revenues contribute to profits and expenses reduce profits.
This accounting profit (or loss) is based on the accounting concept of matching
and in no way reflects the cash position of the business. The matching concept
demands that when the Income Statement is prepared, only expenses that match
the income received over the accounting period must be shown.
The income statement can be broken up into two parts i.e.
1. THE TRADING ACCOUNT - this account is used to calculate the gross profit
i.e. the profit achieved from trading (the buying and selling or manufacturing of
goods).
2. THE PROFIT AND LOSS ACCOUNT - in which we calculate the net profit i.e.
the profit achieved after deducting expenses from the gross profit and adding
any other income received from non-operating activities. (e.g. interest, rent &
profit on sale of fixed assets)
Financial Skills For Small Business: Learner Guide
Copyright BANK SETA Financial Skills Workshop 9
2.TERMINOLOGY USED IN THE INCOME
STATEMENT
A. Example of an Income Statement
Have a look at the example of an income statement on the following page. Once
you have studied it carefully, turn to page 11 for detailed explanations of each of
the sections.
Financial Skills For Small Business: Learner Guide
Copyright BANK SETA Financial Skills Workshop 10
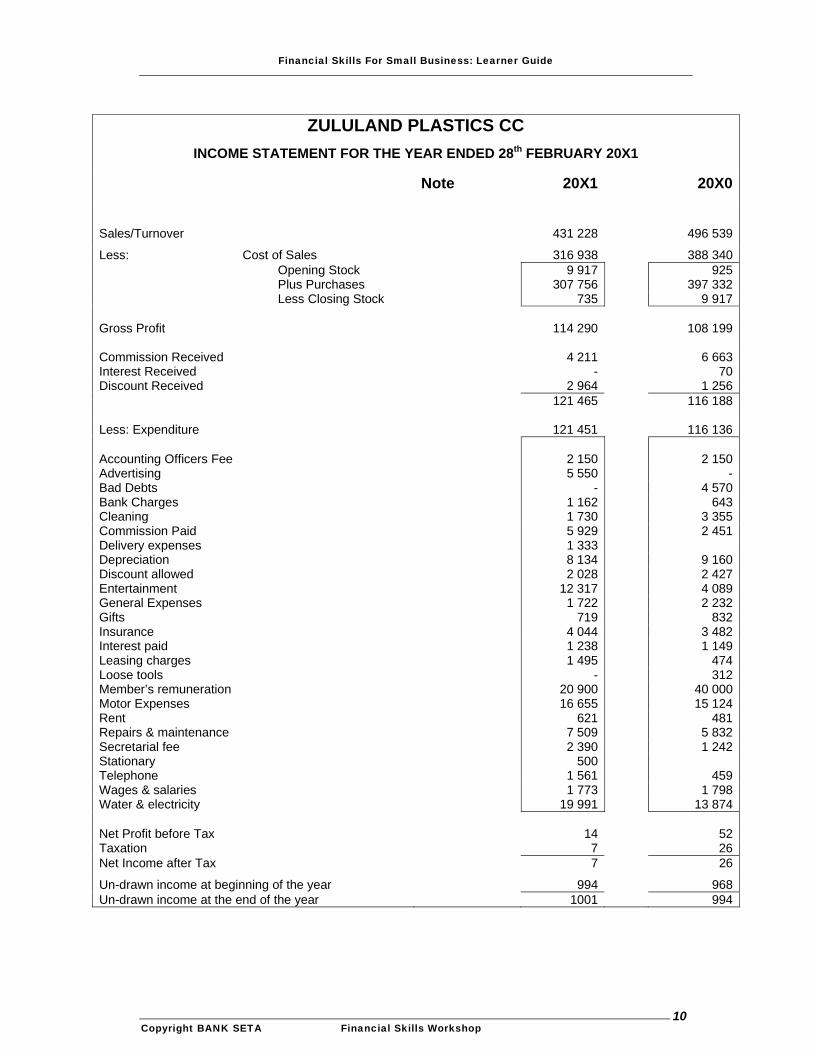
ZULULAND PLASTICS CC INCOME STATEMENT FOR THE YEAR ENDED 28th FEBRUARY 20X1
Note 20X1 20X0 Sales/Turnover 431 228 496 539
Less: Cost of Sales 316 938 388 340 Opening Stock 9 917 925 Plus Purchases 307 756 397 332 Less Closing Stock 735 9 917 Gross Profit 114 290 108 199
Commission Received 4 211 6 663Interest Received - 70Discount Received 2 964 1 256 121 465 116 188 Less: Expenditure 121 451 116 136 Accounting Officers Fee
2 150
2 150
Advertising 5 550 -Bad Debts - 4 570Bank Charges 1 162 643Cleaning 1 730 3 355Commission Paid 5 929 2 451Delivery expenses 1 333 Depreciation 8 134 9 160Discount allowed 2 028 2 427Entertainment 12 317 4 089General Expenses 1 722 2 232Gifts 719 832Insurance 4 044 3 482Interest paid 1 238 1 149Leasing charges 1 495 474Loose tools - 312Member’s remuneration 20 900 40 000Motor Expenses 16 655 15 124Rent 621 481Repairs & maintenance 7 509 5 832Secretarial fee 2 390 1 242Stationary 500 Telephone 1 561 459Wages & salaries 1 773 1 798Water & electricity 19 991 13 874 Net Profit before Tax 14 52Taxation 7 26Net Income after Tax 7 26
Un-drawn income at beginning of the year 994 968Un-drawn income at the end of the year 1001 994
Financial Skills For Small Business: Learner Guide
Copyright BANK SETA Financial Skills Workshop 11
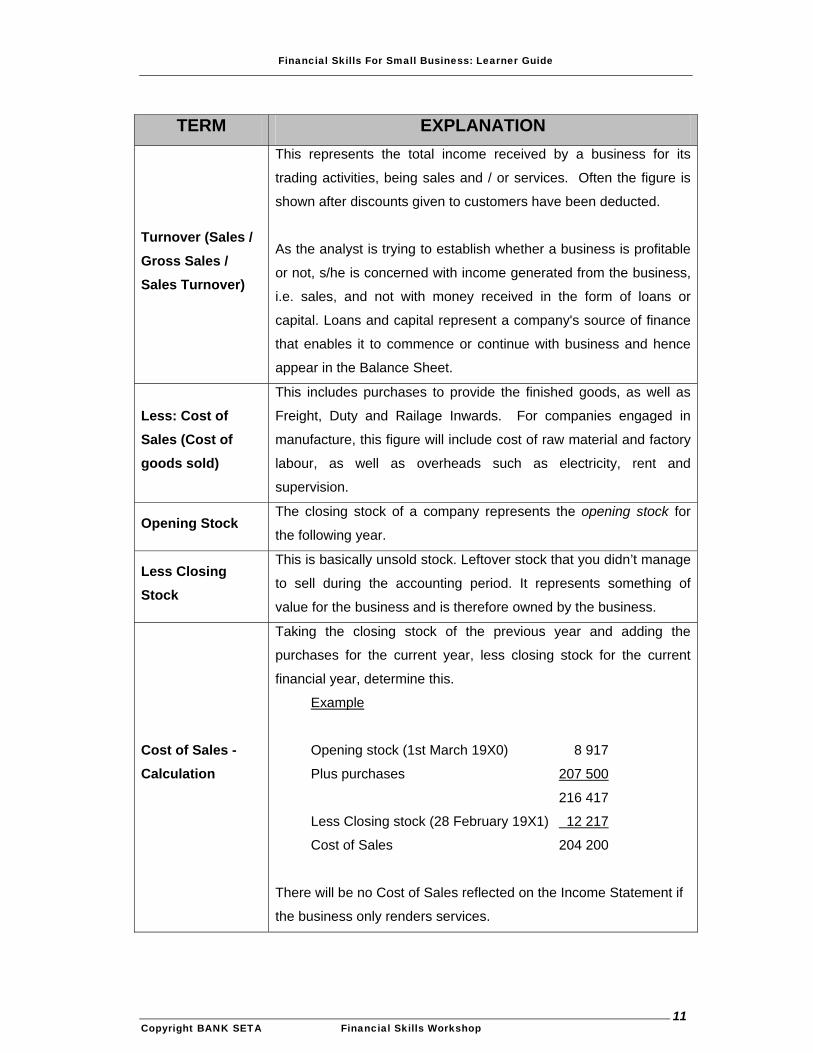
TERM EXPLANATION
Turnover (Sales /
Gross Sales / Sales Turnover)
This represents the total income received by a business for its
trading activities, being sales and / or services. Often the figure is
shown after discounts given to customers have been deducted.
As the analyst is trying to establish whether a business is profitable
or not, s/he is concerned with income generated from the business,
i.e. sales, and not with money received in the form of loans or
capital. Loans and capital represent a company's source of finance
that enables it to commence or continue with business and hence
appear in the Balance Sheet.
Less: Cost of Sales (Cost of goods sold)
This includes purchases to provide the finished goods, as well as
Freight, Duty and Railage Inwards. For companies engaged in
manufacture, this figure will include cost of raw material and factory
labour, as well as overheads such as electricity, rent and
supervision.
Opening Stock The closing stock of a company represents the opening stock for
the following year.
Less Closing Stock
This is basically unsold stock. Leftover stock that you didn’t manage
to sell during the accounting period. It represents something of
value for the business and is therefore owned by the business.
Cost of Sales - Calculation
Taking the closing stock of the previous year and adding the
purchases for the current year, less closing stock for the current
financial year, determine this.
Example
Opening stock (1st March 19X0) 8 917
Plus purchases 207 500
216 417
Less Closing stock (28 February 19X1) 12 217
Cost of Sales 204 200
There will be no Cost of Sales reflected on the Income Statement if
the business only renders services.
Financial Skills For Small Business: Learner Guide
Copyright BANK SETA Financial Skills Workshop 12
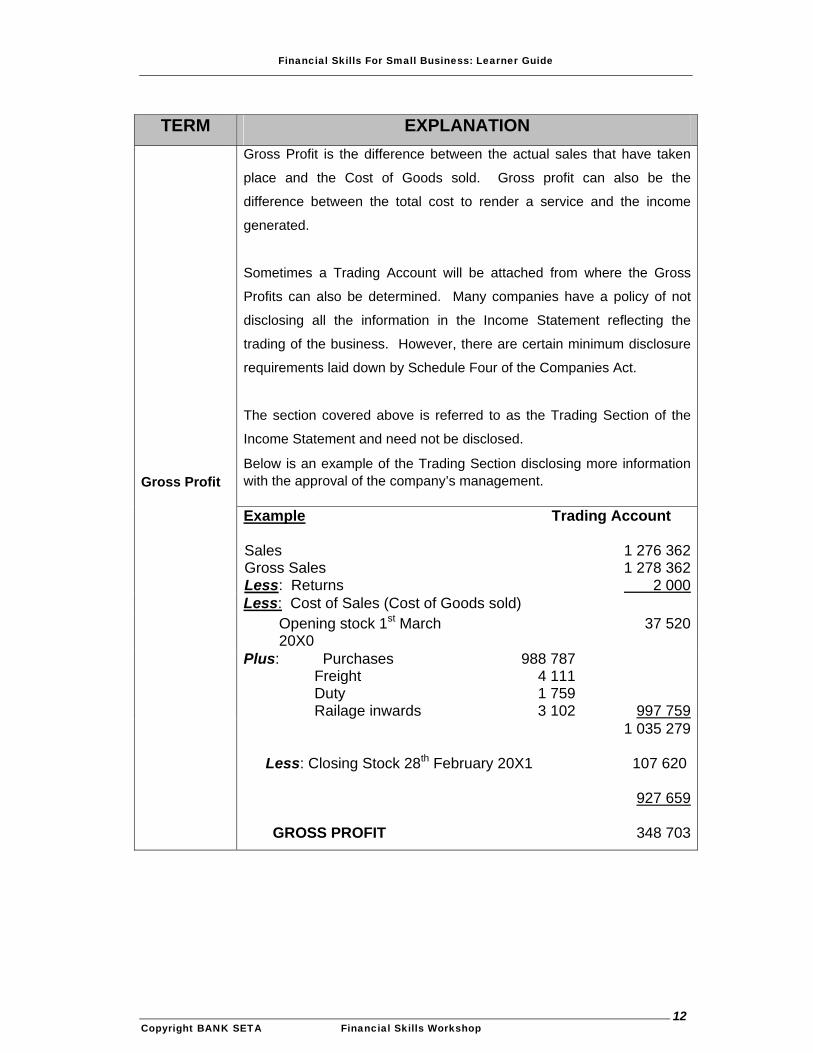
TERM EXPLANATION Gross Profit is the difference between the actual sales that have taken
place and the Cost of Goods sold. Gross profit can also be the
difference between the total cost to render a service and the income
generated.
Sometimes a Trading Account will be attached from where the Gross
Profits can also be determined. Many companies have a policy of not
disclosing all the information in the Income Statement reflecting the
trading of the business. However, there are certain minimum disclosure
requirements laid down by Schedule Four of the Companies Act.
The section covered above is referred to as the Trading Section of the
Income Statement and need not be disclosed.
Below is an example of the Trading Section disclosing more information with the approval of the company’s management. Example
Sales Gross Sales Less: Returns
Trading Account
1 276 3621 278 362 2 000
Less: Cost of Sales (Cost of Goods sold) Opening stock 1st March 20X0
37 520
Plus: Purchases Freight Duty Railage inwards
988 787 4 111 1 759 3 102 997 759
Gross Profit
1 035 279
Less: Closing Stock 28th February 20X1 107 620
927 659
GROSS PROFIT 348 703
Financial Skills For Small Business: Learner Guide
Copyright BANK SETA Financial Skills Workshop 13
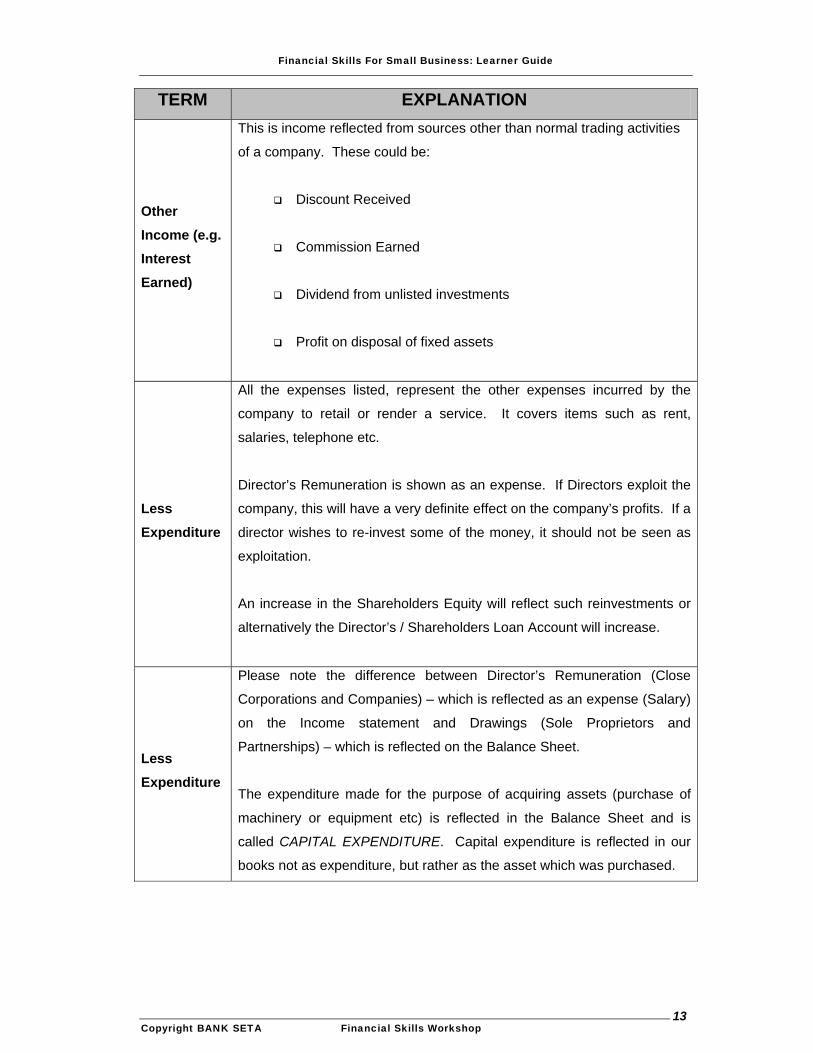
TERM EXPLANATION
Other Income (e.g. Interest Earned)
This is income reflected from sources other than normal trading activities
of a company. These could be:
Discount Received
Commission Earned
Dividend from unlisted investments
Profit on disposal of fixed assets
Less Expenditure
All the expenses listed, represent the other expenses incurred by the
company to retail or render a service. It covers items such as rent,
salaries, telephone etc.
Director’s Remuneration is shown as an expense. If Directors exploit the
company, this will have a very definite effect on the company’s profits. If a
director wishes to re-invest some of the money, it should not be seen as
exploitation.
An increase in the Shareholders Equity will reflect such reinvestments or
alternatively the Director’s / Shareholders Loan Account will increase.
Less Expenditure
Please note the difference between Director’s Remuneration (Close
Corporations and Companies) – which is reflected as an expense (Salary)
on the Income statement and Drawings (Sole Proprietors and
Partnerships) – which is reflected on the Balance Sheet.
The expenditure made for the purpose of acquiring assets (purchase of
machinery or equipment etc) is reflected in the Balance Sheet and is
called CAPITAL EXPENDITURE. Capital expenditure is reflected in our
books not as expenditure, but rather as the asset which was purchased.
Financial Skills For Small Business: Learner Guide
Copyright BANK SETA Financial Skills Workshop 14
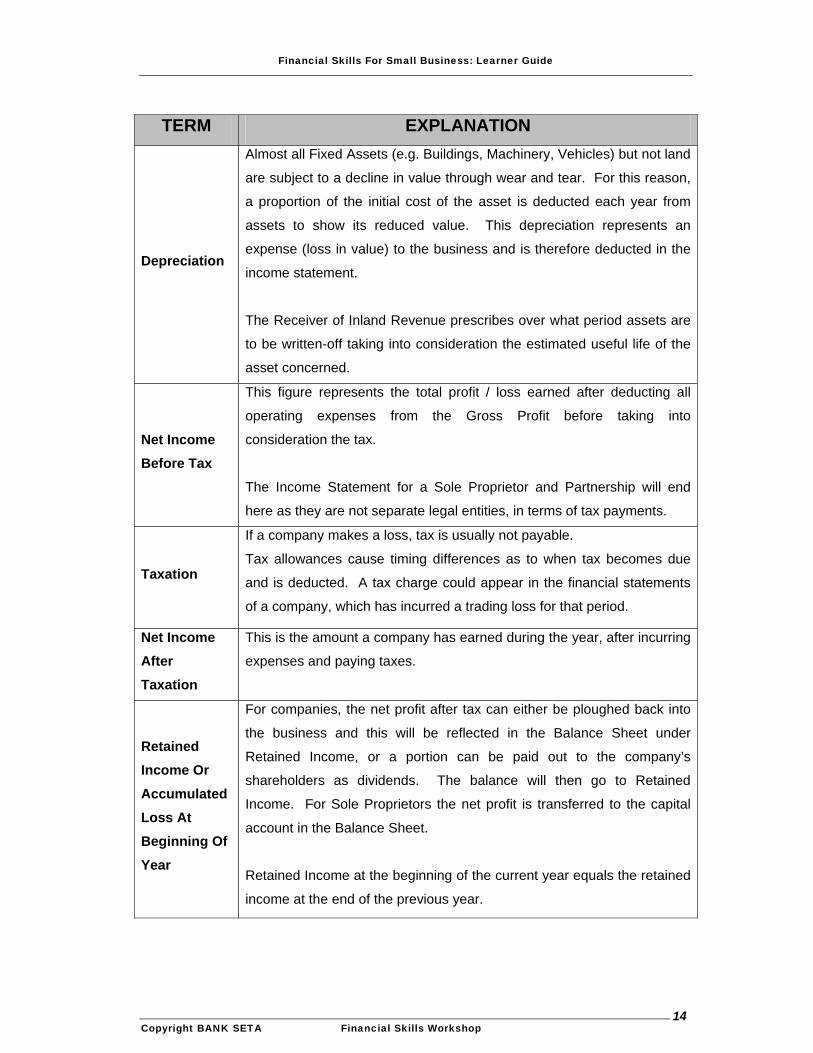
TERM EXPLANATION
Depreciation
Almost all Fixed Assets (e.g. Buildings, Machinery, Vehicles) but not land
are subject to a decline in value through wear and tear. For this reason,
a proportion of the initial cost of the asset is deducted each year from
assets to show its reduced value. This depreciation represents an
expense (loss in value) to the business and is therefore deducted in the
income statement.
The Receiver of Inland Revenue prescribes over what period assets are
to be written-off taking into consideration the estimated useful life of the
asset concerned.
Net Income Before Tax
This figure represents the total profit / loss earned after deducting all
operating expenses from the Gross Profit before taking into
consideration the tax.
The Income Statement for a Sole Proprietor and Partnership will end
here as they are not separate legal entities, in terms of tax payments.
Taxation
If a company makes a loss, tax is usually not payable.
Tax allowances cause timing differences as to when tax becomes due
and is deducted. A tax charge could appear in the financial statements
of a company, which has incurred a trading loss for that period.
Net Income After Taxation
This is the amount a company has earned during the year, after incurring
expenses and paying taxes.
Retained Income Or Accumulated Loss At Beginning Of Year
For companies, the net profit after tax can either be ploughed back into
the business and this will be reflected in the Balance Sheet under
Retained Income, or a portion can be paid out to the company’s
shareholders as dividends. The balance will then go to Retained
Income. For Sole Proprietors the net profit is transferred to the capital
account in the Balance Sheet.
Retained Income at the beginning of the current year equals the retained
income at the end of the previous year.

Financial Skills For Small Business: Learner Guide
Copyright BANK SETA Financial Skills Workshop 15
TERM EXPLANATION
Retained Income
Or Accumulated Loss At Beginning Of Year
Dividends are not a business expense. They are a distribution of
corporate profit, after taxation, to the owners/shareholders. In a
sense, they are a reward to the shareholders for investing in the
Company.
Retained Income Or Accumulated Loss At Beginning Of Year
Example:
Net Income after Taxation R 540 000
Dividends paid R 120 000
Retained Income R 420 000
Retained Income
At The End Of The Year
The retained income at the end of the previous year, plus the net
profits (after tax and dividends) for the current year equals the
Retained Income at the end of the year. This figure is carried over
to the Distributable Reserves in the Balance Sheet.
Financial Skills For Small Business: Learner Guide
Copyright BANK SETA Financial Skills Workshop 16
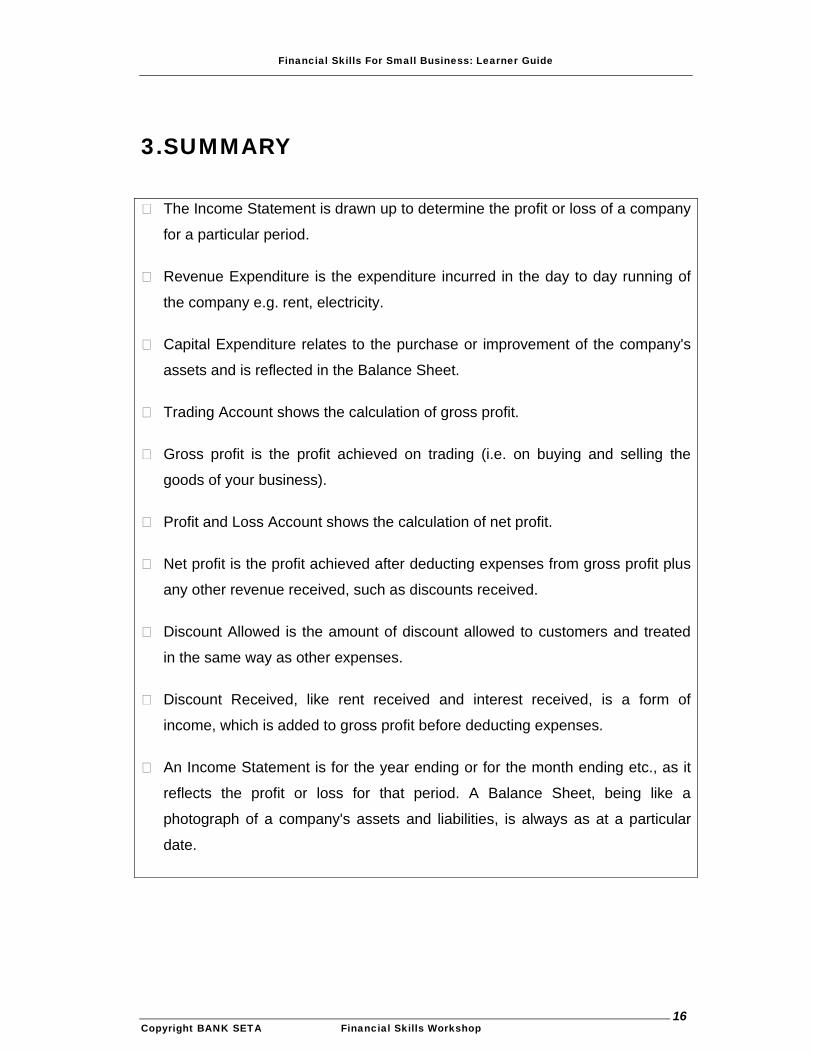
3.SUMMARY
The Income Statement is drawn up to determine the profit or loss of a company
for a particular period.
Revenue Expenditure is the expenditure incurred in the day to day running of
the company e.g. rent, electricity.
Capital Expenditure relates to the purchase or improvement of the company's
assets and is reflected in the Balance Sheet.
Trading Account shows the calculation of gross profit.
Gross profit is the profit achieved on trading (i.e. on buying and selling the
goods of your business).
Profit and Loss Account shows the calculation of net profit.
Net profit is the profit achieved after deducting expenses from gross profit plus
any other revenue received, such as discounts received.
Discount Allowed is the amount of discount allowed to customers and treated
in the same way as other expenses.
Discount Received, like rent received and interest received, is a form of
income, which is added to gross profit before deducting expenses.
An Income Statement is for the year ending or for the month ending etc., as it
reflects the profit or loss for that period. A Balance Sheet, being like a
photograph of a company's assets and liabilities, is always as at a particular
date.
Financial Skills For Small Business: Learner Guide
Copyright BANK SETA Financial Skills Workshop 17
Make your own summaries
here……..
Now let’s practice what we have learnt by completing the activities on the following pages.
Financial Skills For Small Business: Learner Guide
Copyright BANK SETA Financial Skills Workshop 18
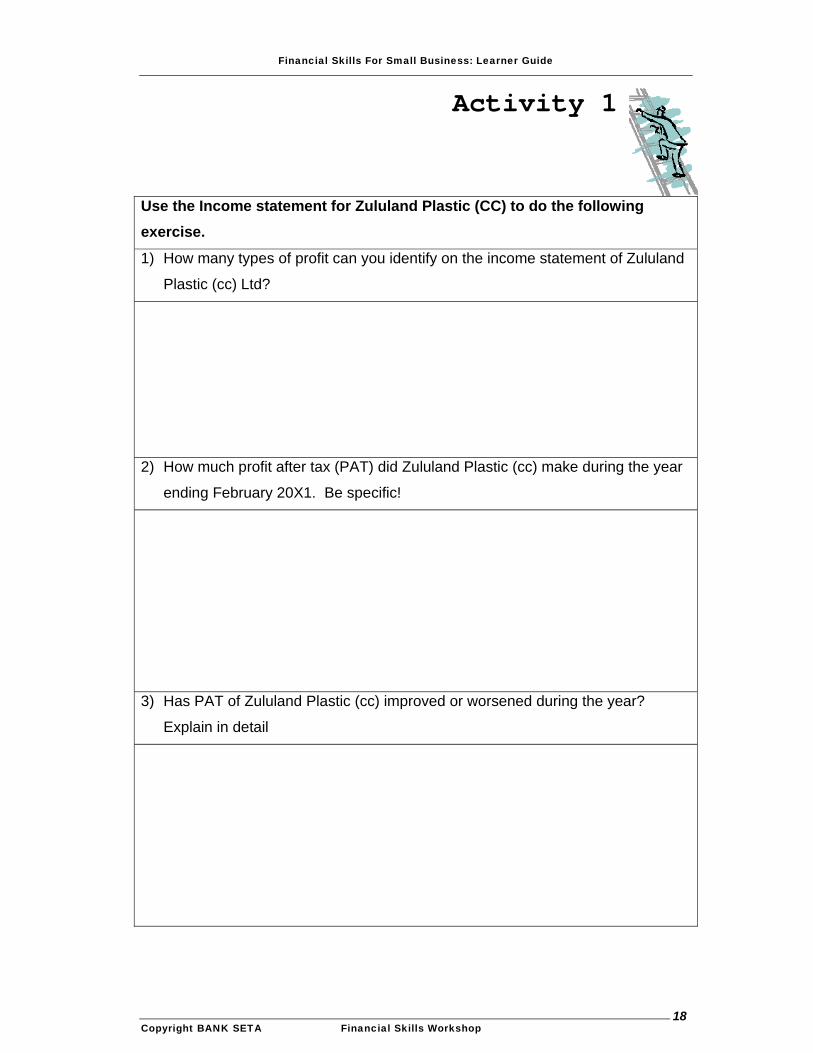
Activity 1
Use the Income statement for Zululand Plastic (CC) to do the following exercise.
1) How many types of profit can you identify on the income statement of Zululand
Plastic (cc) Ltd?
2) How much profit after tax (PAT) did Zululand Plastic (cc) make during the year
ending February 20X1. Be specific!
3) Has PAT of Zululand Plastic (cc) improved or worsened during the year?
Explain in detail
Financial Skills For Small Business: Learner Guide
Copyright BANK SETA Financial Skills Workshop 19
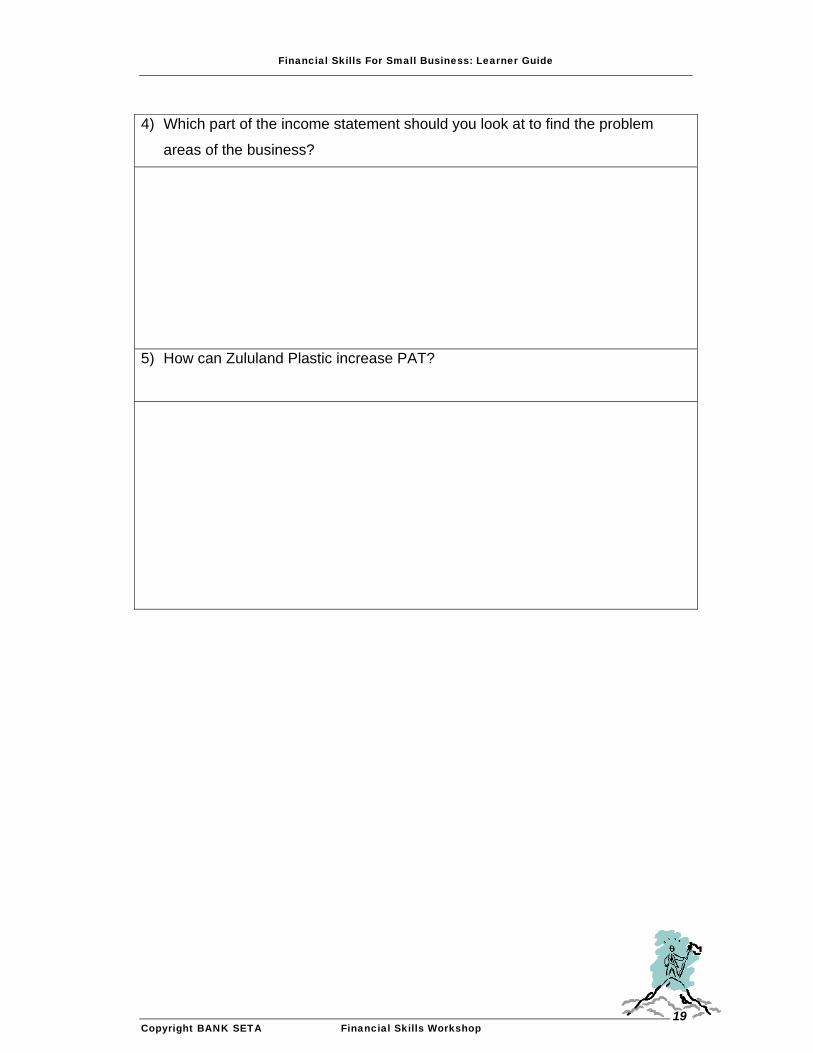
4) Which part of the income statement should you look at to find the problem
areas of the business?
5) How can Zululand Plastic increase PAT?
Financial Skills For Small Business: Learner Guide
Copyright BANK SETA Financial Skills Workshop 20
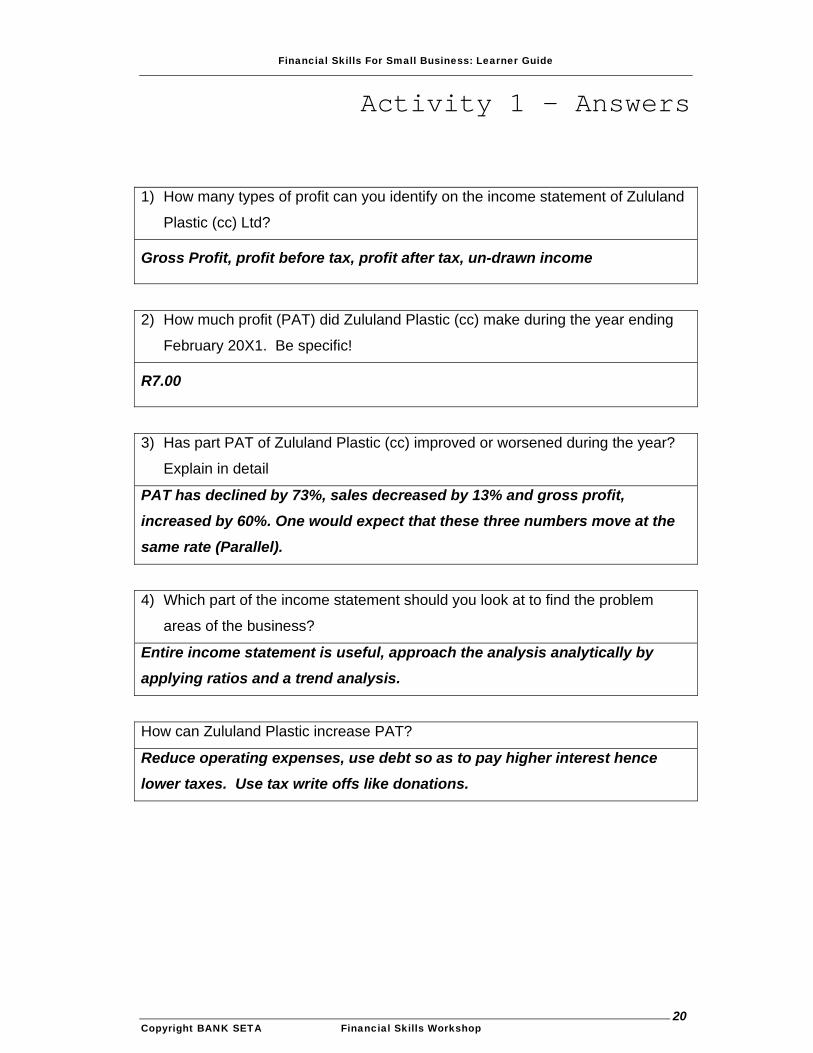
Activity 1 - Answers
1) How many types of profit can you identify on the income statement of Zululand
Plastic (cc) Ltd?
Gross Profit, profit before tax, profit after tax, un-drawn income
2) How much profit (PAT) did Zululand Plastic (cc) make during the year ending
February 20X1. Be specific!
R7.00
3) Has part PAT of Zululand Plastic (cc) improved or worsened during the year?
Explain in detail
PAT has declined by 73%, sales decreased by 13% and gross profit,
increased by 60%. One would expect that these three numbers move at the
same rate (Parallel).
4) Which part of the income statement should you look at to find the problem
areas of the business?
Entire income statement is useful, approach the analysis analytically by
applying ratios and a trend analysis.
How can Zululand Plastic increase PAT?
Reduce operating expenses, use debt so as to pay higher interest hence
lower taxes. Use tax write offs like donations.
Financial Skills For Small Business: Learner Guide
Copyright BANK SETA Financial Skills Workshop 21
LEARNING UNIT TWO
THE BALANCE SHEET
SPECIFIC OUTCOMES
By the end of this learning unit you will be able to apply your ability to:
define various accounting terms such as assets, liabilities and capital.
identify items that appear on the balance sheet.
describe how transactions flow through the balance sheet.
extract the relevant information from a balance sheet
……in order to successfully assess the financial position of a small business.
Financial Skills For Small Business: Learner Guide
Copyright BANK SETA Financial Skills Workshop 22
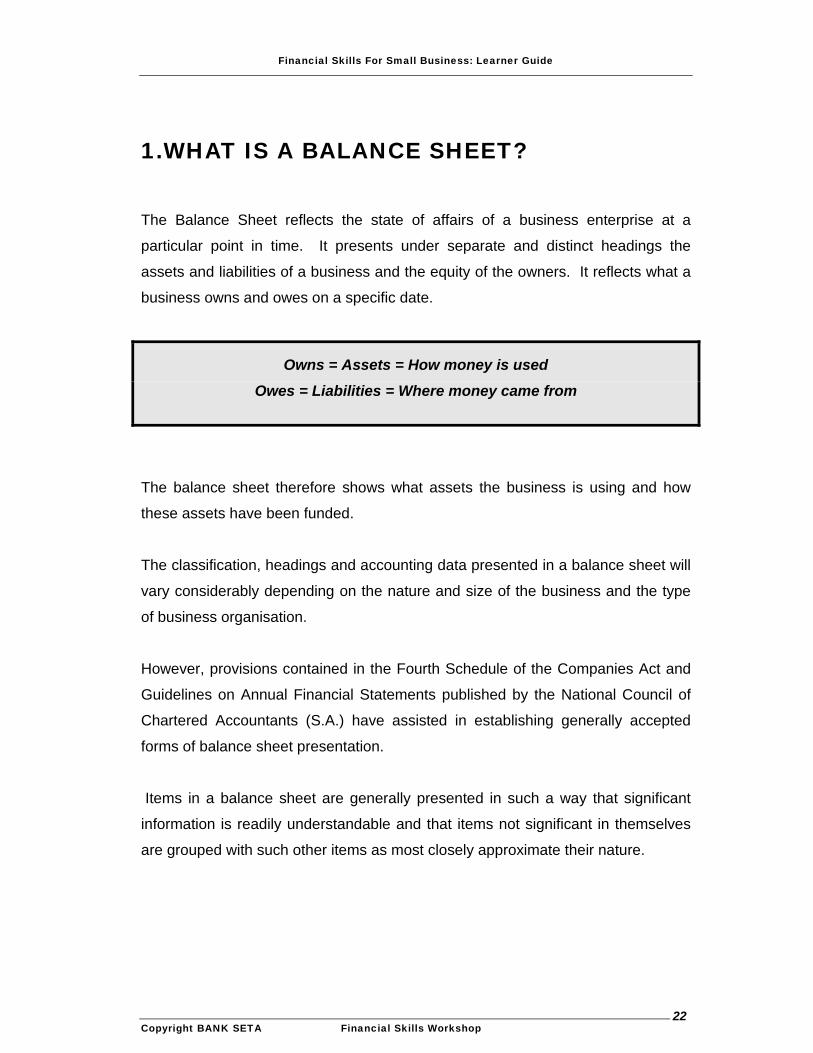
1.WHAT IS A BALANCE SHEET?
The Balance Sheet reflects the state of affairs of a business enterprise at a
particular point in time. It presents under separate and distinct headings the
assets and liabilities of a business and the equity of the owners. It reflects what a
business owns and owes on a specific date.
Owns = Assets = How money is used
Owes = Liabilities = Where money came from
The balance sheet therefore shows what assets the business is using and how
these assets have been funded.
The classification, headings and accounting data presented in a balance sheet will
vary considerably depending on the nature and size of the business and the type
of business organisation.
However, provisions contained in the Fourth Schedule of the Companies Act and
Guidelines on Annual Financial Statements published by the National Council of
Chartered Accountants (S.A.) have assisted in establishing generally accepted
forms of balance sheet presentation.
Items in a balance sheet are generally presented in such a way that significant
information is readily understandable and that items not significant in themselves
are grouped with such other items as most closely approximate their nature.
Financial Skills For Small Business: Learner Guide
Copyright BANK SETA Financial Skills Workshop 23
2.TERMINOLOGY USED IN THE BALANCE
SHEET
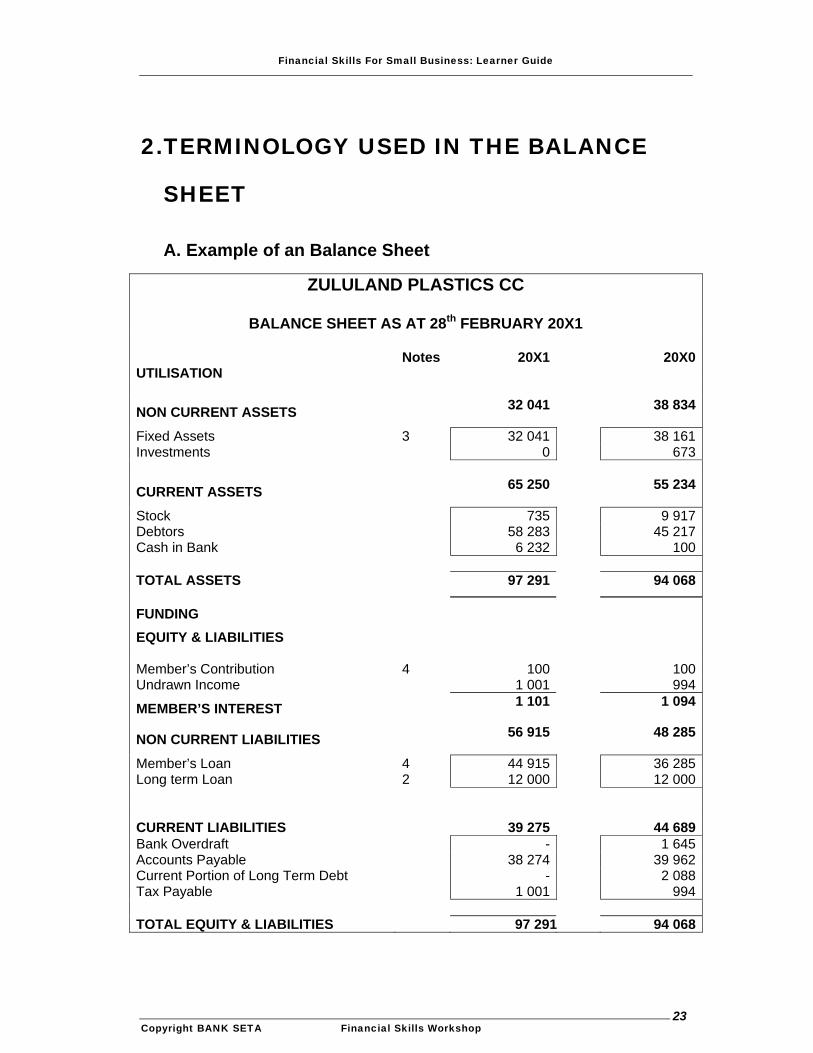
A. Example of an Balance Sheet
ZULULAND PLASTICS CC
BALANCE SHEET AS AT 28th FEBRUARY 20X1 Notes 20X1 20X0UTILISATION
NON CURRENT ASSETS 32 041 38 834
Fixed Assets 3 32 041 38 161Investments 0 673
CURRENT ASSETS 65 250 55 234
Stock 735 9 917Debtors 58 283 45 217Cash in Bank 6 232 100 TOTAL ASSETS 97 291 94 068
FUNDING
EQUITY & LIABILITIES Member’s Contribution 4 100 100Undrawn Income 1 001 994
MEMBER’S INTEREST 1 101 1 094
NON CURRENT LIABILITIES 56 915 48 285
Member’s Loan 4 44 915 36 285Long term Loan 2 12 000 12 000 CURRENT LIABILITIES 39 275 44 689Bank Overdraft - 1 645Accounts Payable 38 274 39 962Current Portion of Long Term Debt - 2 088Tax Payable 1 001 994 TOTAL EQUITY & LIABILITIES 97 291 94 068
Financial Skills For Small Business: Learner Guide
Copyright BANK SETA Financial Skills Workshop 24
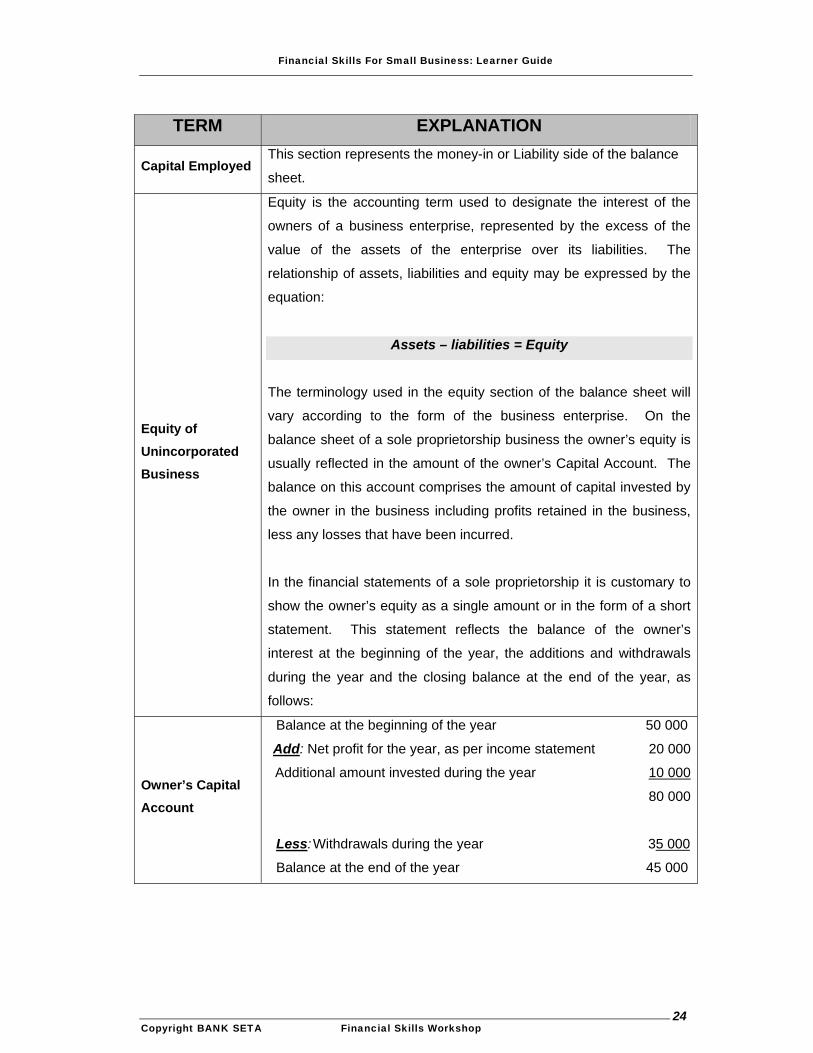
TERM EXPLANATION
Capital Employed This section represents the money-in or Liability side of the balance
sheet.
Equity of Unincorporated Business
Equity is the accounting term used to designate the interest of the
owners of a business enterprise, represented by the excess of the
value of the assets of the enterprise over its liabilities. The
relationship of assets, liabilities and equity may be expressed by the
equation:
Assets – liabilities = Equity
The terminology used in the equity section of the balance sheet will
vary according to the form of the business enterprise. On the
balance sheet of a sole proprietorship business the owner’s equity is
usually reflected in the amount of the owner’s Capital Account. The
balance on this account comprises the amount of capital invested by
the owner in the business including profits retained in the business,
less any losses that have been incurred.
In the financial statements of a sole proprietorship it is customary to
show the owner’s equity as a single amount or in the form of a short
statement. This statement reflects the balance of the owner’s
interest at the beginning of the year, the additions and withdrawals
during the year and the closing balance at the end of the year, as
follows:
Owner’s Capital Account
Balance at the beginning of the year 50 000
Add: Net profit for the year, as per income statement 20 000
Additional amount invested during the year 10 000
80 000
Less: Withdrawals during the year 35 000
Balance at the end of the year 45 000
Financial Skills For Small Business: Learner Guide
Copyright BANK SETA Financial Skills Workshop 25
TERM EXPLANATION
Owner’s Capital Account
On the balance sheet of a partnership business the equities of the
individual partners are kept separate so as to show each partner’s
interest in the business. A distinction is usually made between the
amounts contributed by each partner in the form of capital and the
amounts left in the business on current accounts represented by the
amounts of past profits allocated to the partners and not withdrawn from
the business by them.
Equity of Companies
Share Capital
Capital is the name describing the funds, provided by owners or
shareholders, which is normally used to set up a business. The most
common ways for a company to raise capital is by selling shares in the
company. The investors who buy these shares, are called shareholders
and are in effect all joint owners of the company. By investing in a
company, investors expect a return, which is paid to them in the form of
dividends. This is normally a more profitable investment than ordinary
savings and / or fixed deposit account. There are however a risk
involved of losing money, should the company be declared insolvent
(bankrupt).
Non–Distributable Reserves As the name implies, Non-Distributable Reserves are not available for
distribution by way of dividends. These reserves may not be
distributable because of the provision of the company’s act, the articles
of association of the company, case law, resolutions of the directors or of
resolution by the company in general meeting.
The only Non-Distributable reserve arising from the Companies Act is the
capital redemption reserve fund. The articles of association of a
company may provide that certain profits cannot be distributed by way of
a dividend – for example the profits on the sale of land & buildings, which
were held as a fixed asset. Such profit will be reflected on the income
statement as ‘other income’.
Financial Skills For Small Business: Learner Guide
Copyright BANK SETA Financial Skills Workshop 26
TERM EXPLANATION
Equity of Companies
The directors are usually given the power by the articles of association to
put to reserve such profits as they think necessary and the directors
have the implied authority to treat these as Non-Distributable. Directors
may however decide to reclassify a Non-Distributable reserve as a
distributable reserve in the next balance sheet. This may happen in the
case of a fixed asset replacement reserve.
Distributable Reserve / Retained Income A distributable reserve is defined as any amount, which has been carried
to reserve and which may, in accordance with generally accepted
accounting practice and legal principles, be taken to the income
statement and distributed by way of a dividend. Retained income
represents the accumulated balance of net income less losses arising
from the operations of a business, after taking into account dividends
that have been distributed out of this income. Where there have been
losses and there is a debit balance on the income statement it is
considered that the term “accumulated loss” is most appropriate.
Retained income is transferred from the income statement to the
balance sheet as a distributable reserve.
Shareholders’ Interest / Shareholders’ Equity
When the Share Capital, Non-Distributable Reserves and the
Distributable Reserves are added together the total is called
Shareholders’ Interest. It is the total of all the funds invested into the
company by the shareholders, plus all the profits earned by the company
that have been re-invested in the company.
Long Term Liabilities When a company borrows money over a period of longer than 12
months, such a borrowing becomes a long-term liability.
Financial Skills For Small Business: Learner Guide
Copyright BANK SETA Financial Skills Workshop 27
TERM EXPLANATION
Equity of Companies
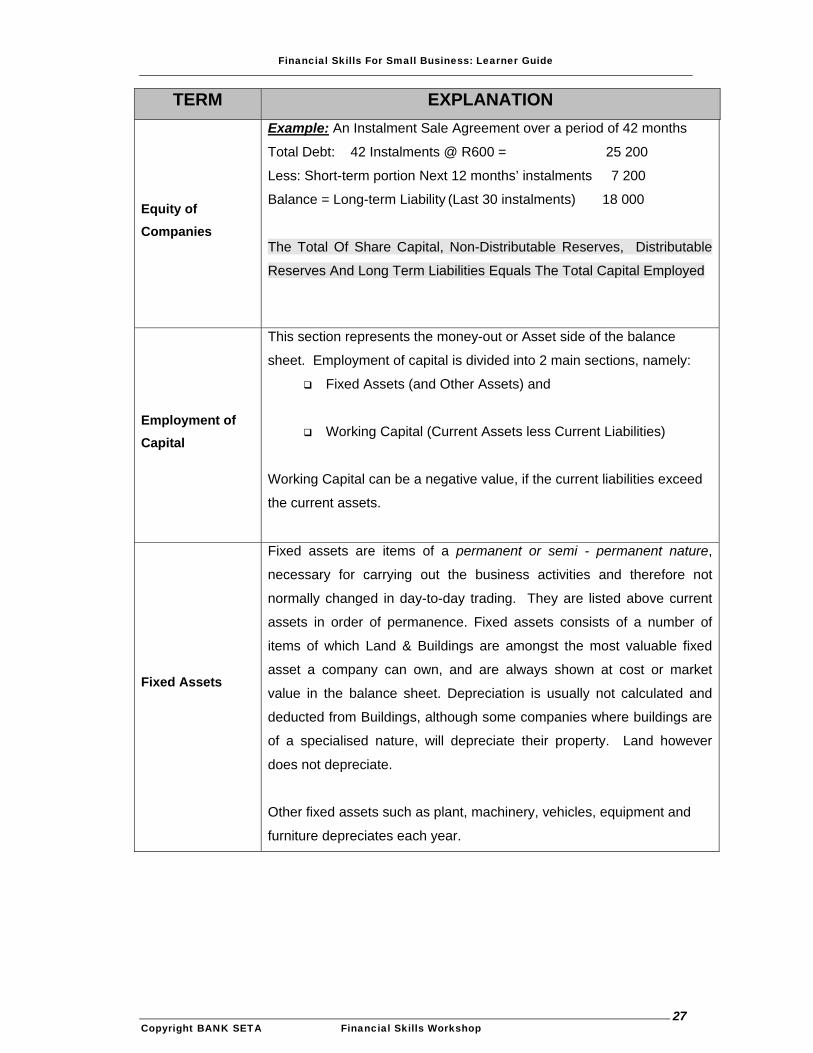
Example: An Instalment Sale Agreement over a period of 42 months
Total Debt: 42 Instalments @ R600 = 25 200
Less: Short-term portion Next 12 months’ instalments 7 200
Balance = Long-term Liability (Last 30 instalments) 18 000
The Total Of Share Capital, Non-Distributable Reserves, Distributable
Reserves And Long Term Liabilities Equals The Total Capital Employed
Employment of Capital
This section represents the money-out or Asset side of the balance
sheet. Employment of capital is divided into 2 main sections, namely:
Fixed Assets (and Other Assets) and
Working Capital (Current Assets less Current Liabilities)
Working Capital can be a negative value, if the current liabilities exceed
the current assets.
Fixed Assets
Fixed assets are items of a permanent or semi - permanent nature,
necessary for carrying out the business activities and therefore not
normally changed in day-to-day trading. They are listed above current
assets in order of permanence. Fixed assets consists of a number of
items of which Land & Buildings are amongst the most valuable fixed
asset a company can own, and are always shown at cost or market
value in the balance sheet. Depreciation is usually not calculated and
deducted from Buildings, although some companies where buildings are
of a specialised nature, will depreciate their property. Land however
does not depreciate.
Other fixed assets such as plant, machinery, vehicles, equipment and
furniture depreciates each year.
Financial Skills For Small Business: Learner Guide
Copyright BANK SETA Financial Skills Workshop 28
TERM EXPLANATION
Other Assets
These are assets, which can neither be classified as fixed and or
current. These are assets that are not used in the business but are also
not for resale. They are usually listed between fixed and current assets
on the balance sheet and often include assets which are intangible (i.e.
cannot touch or see) like goodwill or certain rights. Other assets in this
category are investments, loans to subsidiary companies, listed shares,
patents, royalties, etc.
Goodwill is an intangible value placed on a business’ worth. The
difference between the selling price and the net asset value of a
business is called goodwill. This is an intangible and is normally ignored
for credit assessment purposes. Goodwill can be written off (amortised)
over a period of time.
Current Assets
Current assets are acquired with the intention to sell or use within the
accounted period (i.e. 12 months). They are items acquired or produced for
resale and conversion into cash (or cash itself) - the least liquid usually
being listed first. The most common items found under current items are:
Stock / Inventory Stock will be valued at the lowest of cost or market value. Stock can be in
the form of raw materials, work in progress or finished goods.
Debtors / Accounts receivable People who owe the business money are normally expected to pay their
debt in the short term – 30 to 90 days.
Associated Company Loans (Subsidiary companies or directors or shareholders) These are loans that must be repaid within 12 months. In a sense it is a
debtor.
Cash in Bank All cash on hand and in the bank sometimes include investments
invested for a period less than 12 months. Short-term investments may
also appear under Accounts Receivable or Marketable Securities.
Financial Skills For Small Business: Learner Guide
Copyright BANK SETA Financial Skills Workshop 29
TERM EXPLANATION
Current Assets
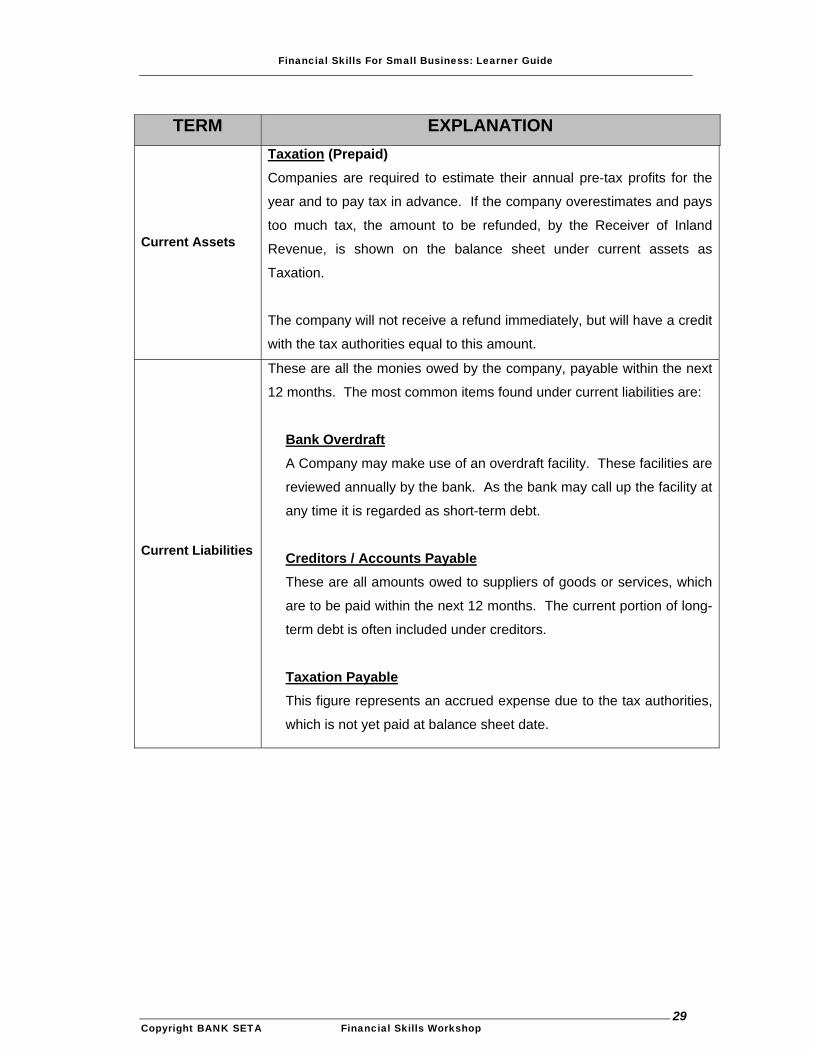
Taxation (Prepaid) Companies are required to estimate their annual pre-tax profits for the
year and to pay tax in advance. If the company overestimates and pays
too much tax, the amount to be refunded, by the Receiver of Inland
Revenue, is shown on the balance sheet under current assets as
Taxation.
The company will not receive a refund immediately, but will have a credit
with the tax authorities equal to this amount.
Current Liabilities
These are all the monies owed by the company, payable within the next
12 months. The most common items found under current liabilities are:
Bank Overdraft A Company may make use of an overdraft facility. These facilities are
reviewed annually by the bank. As the bank may call up the facility at
any time it is regarded as short-term debt.
Creditors / Accounts Payable These are all amounts owed to suppliers of goods or services, which
are to be paid within the next 12 months. The current portion of long-
term debt is often included under creditors.
Taxation Payable This figure represents an accrued expense due to the tax authorities,
which is not yet paid at balance sheet date.
Financial Skills For Small Business: Learner Guide
Copyright BANK SETA Financial Skills Workshop 30
TERM EXPLANATION
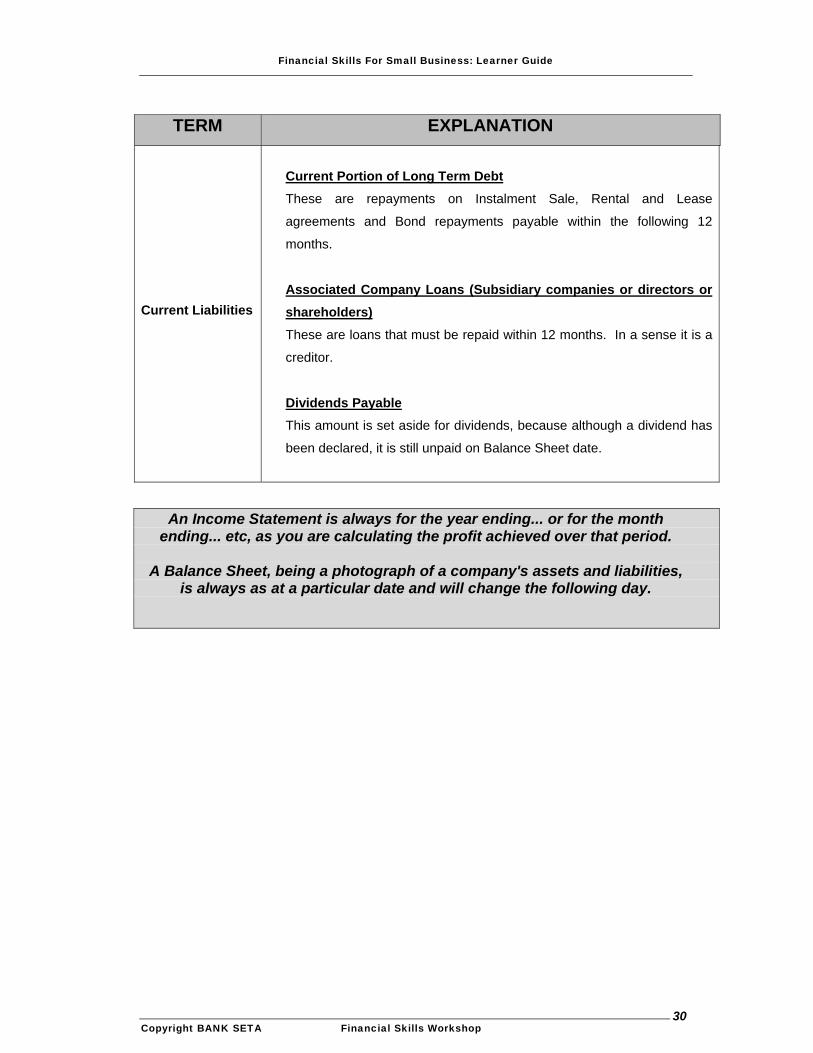
Current Liabilities
Current Portion of Long Term Debt These are repayments on Instalment Sale, Rental and Lease
agreements and Bond repayments payable within the following 12
months.
Associated Company Loans (Subsidiary companies or directors or shareholders) These are loans that must be repaid within 12 months. In a sense it is a
creditor.
Dividends Payable This amount is set aside for dividends, because although a dividend has
been declared, it is still unpaid on Balance Sheet date.
An Income Statement is always for the year ending... or for the month ending... etc, as you are calculating the profit achieved over that period.
A Balance Sheet, being a photograph of a company's assets and liabilities,
is always as at a particular date and will change the following day.
Financial Skills For Small Business: Learner Guide
Copyright BANK SETA Financial Skills Workshop 31
3.SUMMARY
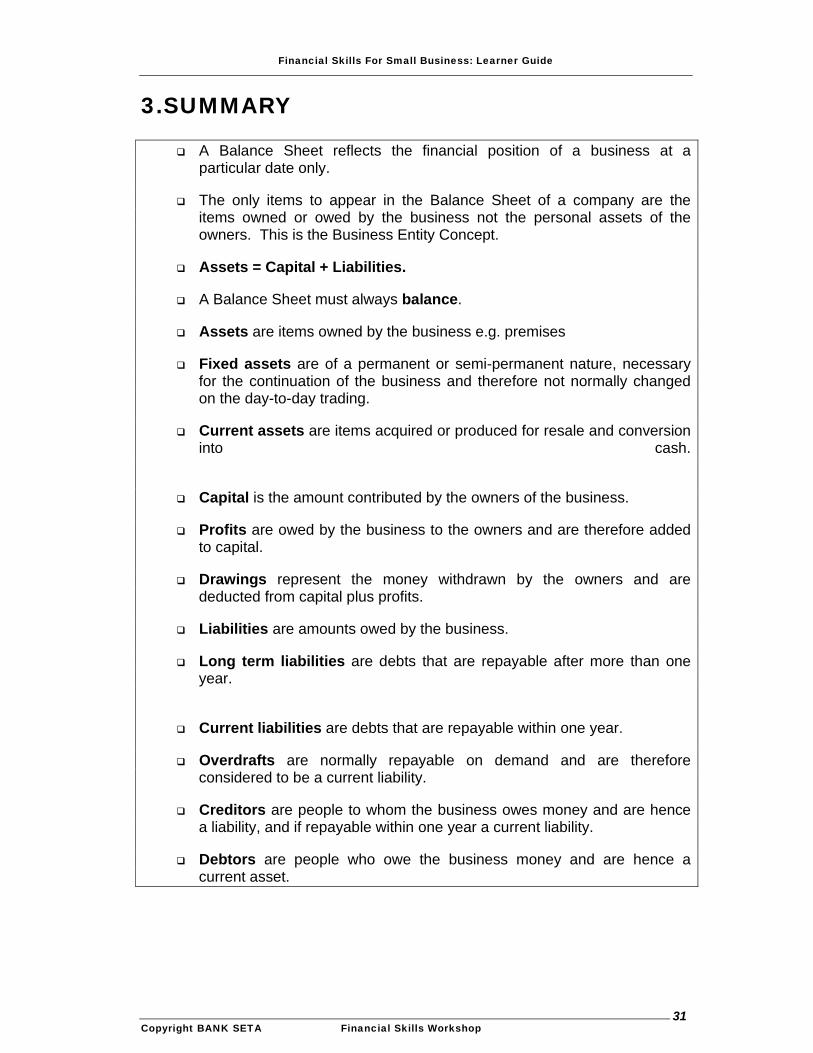
A Balance Sheet reflects the financial position of a business at a particular date only.
The only items to appear in the Balance Sheet of a company are the items owned or owed by the business not the personal assets of the owners. This is the Business Entity Concept.
Assets = Capital + Liabilities.
A Balance Sheet must always balance.
Assets are items owned by the business e.g. premises
Fixed assets are of a permanent or semi-permanent nature, necessary for the continuation of the business and therefore not normally changed on the day-to-day trading.
Current assets are items acquired or produced for resale and conversion into cash.
Capital is the amount contributed by the owners of the business.
Profits are owed by the business to the owners and are therefore added to capital.
Drawings represent the money withdrawn by the owners and are deducted from capital plus profits.
Liabilities are amounts owed by the business.
Long term liabilities are debts that are repayable after more than one year.
Current liabilities are debts that are repayable within one year.
Overdrafts are normally repayable on demand and are therefore considered to be a current liability.
Creditors are people to whom the business owes money and are hence a liability, and if repayable within one year a current liability.
Debtors are people who owe the business money and are hence a current asset.
Financial Skills For Small Business: Learner Guide
Copyright BANK SETA Financial Skills Workshop 32
Make your own summaries
here……..
NOW LET’S PRACTICE WHAT WE HAVE LEARNT BY COMPLETING THE
ACTIVITIES ON THE FOLLOWING PAGES.
Financial Skills For Small Business: Learner Guide
Copyright BANK SETA Financial Skills Workshop 33
Activity 2
Use the Balance Sheet for Zululand Plastic (CC) reflected on page 23 to do the following exercise.
1) Who has provided the money to finance the assets of the business and how
much have they provided in 20X1?
2) If Zululand plastic cc goes into bankruptcy or liquidation today, how much will
the shareholders receive? What assumptions are you making in the above
statement?
3) What are the total assets of the business in 20X1?
4) What are the total liabilities of the business in 20X1?
Financial Skills For Small Business: Learner Guide
Copyright BANK SETA Financial Skills Workshop 34
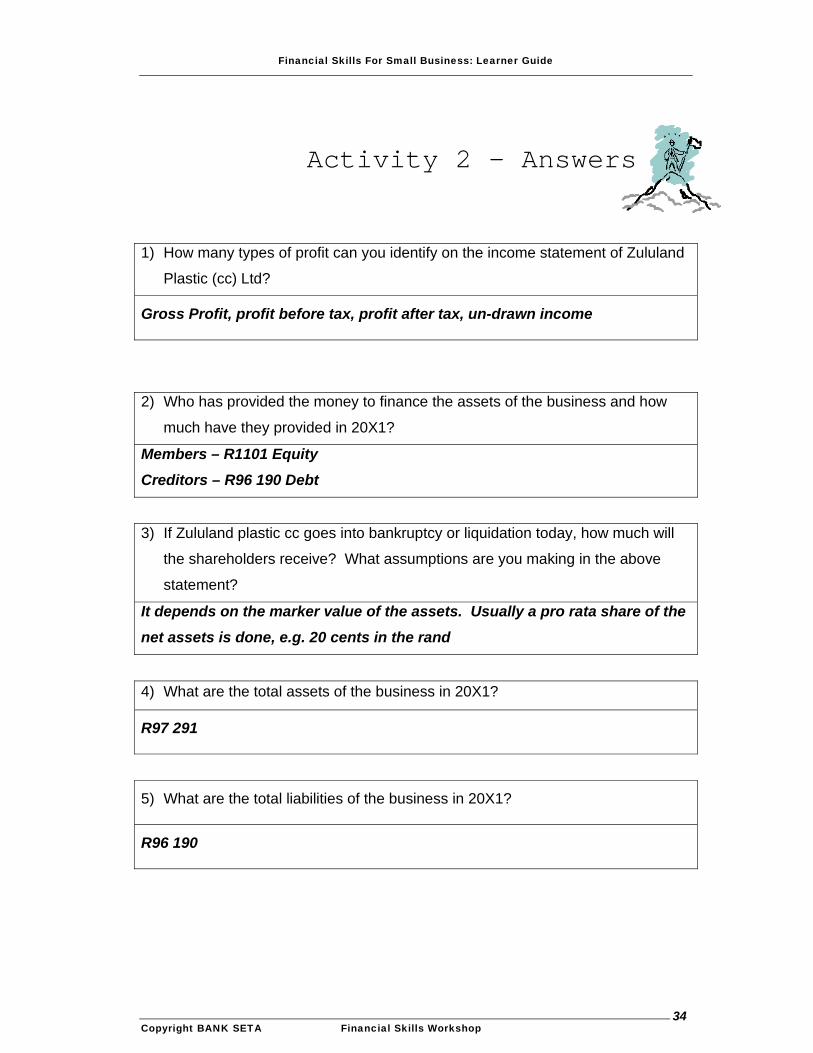
Activity 2 - Answers
1) How many types of profit can you identify on the income statement of Zululand
Plastic (cc) Ltd?
Gross Profit, profit before tax, profit after tax, un-drawn income
2) Who has provided the money to finance the assets of the business and how
much have they provided in 20X1?
Members – R1101 Equity
Creditors – R96 190 Debt
3) If Zululand plastic cc goes into bankruptcy or liquidation today, how much will
the shareholders receive? What assumptions are you making in the above
statement?
It depends on the marker value of the assets. Usually a pro rata share of the
net assets is done, e.g. 20 cents in the rand
4) What are the total assets of the business in 20X1?
R97 291
5) What are the total liabilities of the business in 20X1?
R96 190
Financial Skills For Small Business: Learner Guide
Copyright BANK SETA Financial Skills Workshop 35
LEARNING UNIT THREE
THE CASH FLOW STATEMENT
SPECIFIC OUTCOMES
By the end of this learning unit you will be able to apply your understanding of:
The definitions of a cash flow statement;
The components of a cash flow statement,
……in order to successfully analyse the financial performance of a small business.
1.WHAT IS A CASH FLOW STATEMENT?
Financial Skills For Small Business: Learner Guide
Copyright BANK SETA Financial Skills Workshop 36
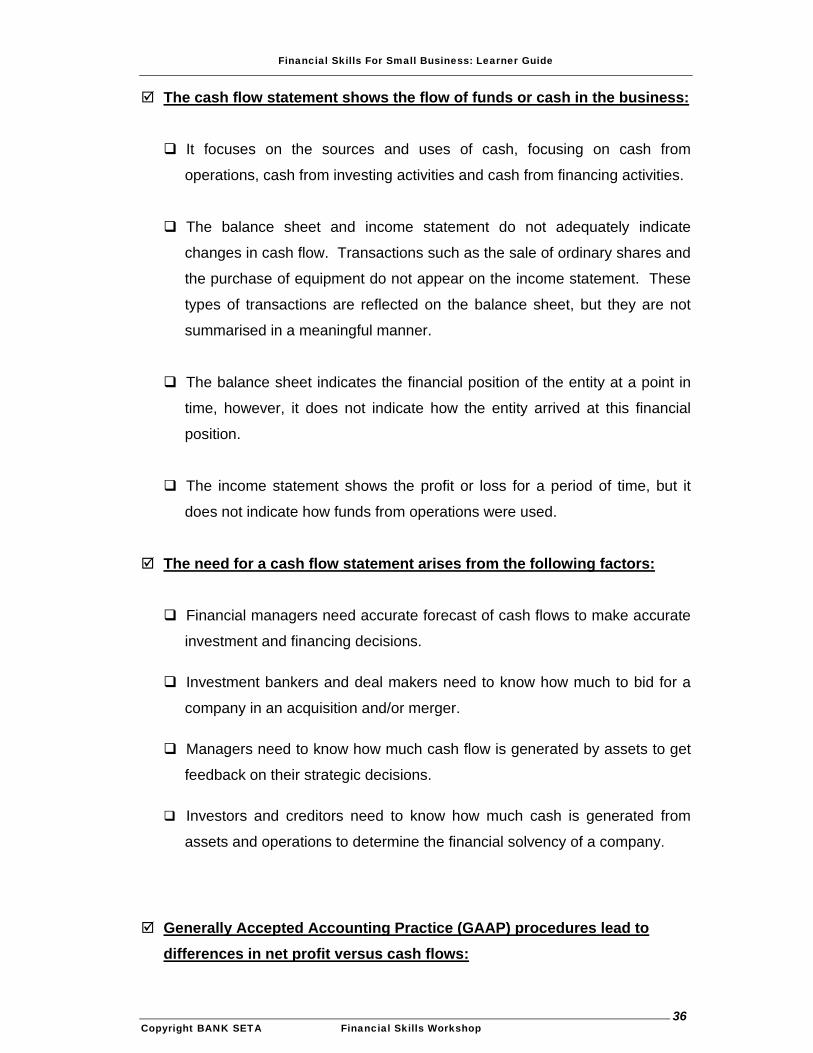
The cash flow statement shows the flow of funds or cash in the business:
It focuses on the sources and uses of cash, focusing on cash from
operations, cash from investing activities and cash from financing activities.
The balance sheet and income statement do not adequately indicate
changes in cash flow. Transactions such as the sale of ordinary shares and
the purchase of equipment do not appear on the income statement. These
types of transactions are reflected on the balance sheet, but they are not
summarised in a meaningful manner.
The balance sheet indicates the financial position of the entity at a point in
time, however, it does not indicate how the entity arrived at this financial
position.
The income statement shows the profit or loss for a period of time, but it
does not indicate how funds from operations were used.
The need for a cash flow statement arises from the following factors:
Financial managers need accurate forecast of cash flows to make accurate
investment and financing decisions.
Investment bankers and deal makers need to know how much to bid for a
company in an acquisition and/or merger.
Managers need to know how much cash flow is generated by assets to get
feedback on their strategic decisions.
Investors and creditors need to know how much cash is generated from
assets and operations to determine the financial solvency of a company.
Generally Accepted Accounting Practice (GAAP) procedures lead to differences in net profit versus cash flows:

Financial Skills For Small Business: Learner Guide
Copyright BANK SETA Financial Skills Workshop 37
Accounting is concerned with presenting the net profit of the firm.
One of the financial manager’s duties is to ensure that the firm always has
sufficient cash flow to meet demands for payments. However, cash flow
does not equal GAAP net profit.
Depreciation and other non-cash items are included in GAAP net profit.
Items are recorded on an accrual basis not when the money actually comes
into the firm.
The use of market values in certain assets and liabilities versus book value.
Financial Skills For Small Business: Learner Guide
Copyright BANK SETA Financial Skills Workshop 38
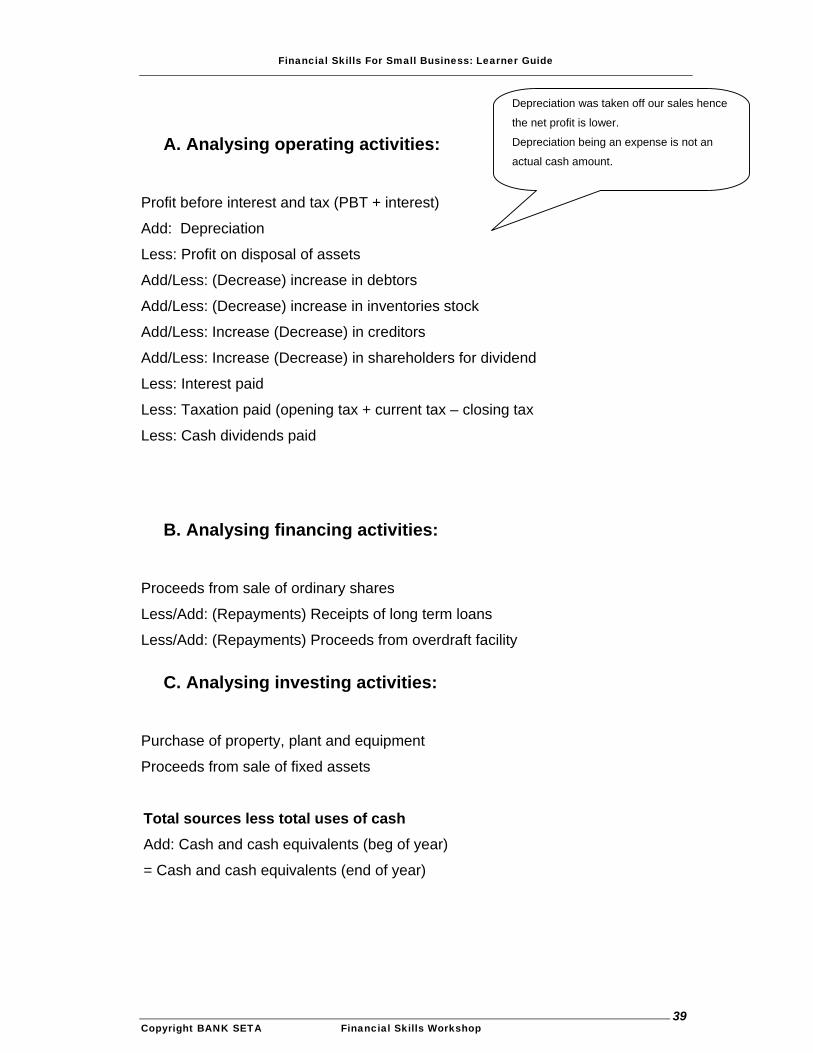
2.COMPONENTS OF THE CASH FLOWS
STATEMENT:
The statement of cash flow summarizes the flow of cash receipts (inflows) and
cash payments (outflows) during a given period of time. It organizes cash flows
into 3 primary categories, namely:
1. Operating cash flows: Cash flows from operation equal cash received
from sales of goods and services minus cash paid for operating goods and
services.
2. Investment cash flows: The acquisition of non-current assets, such as
property, plant and equipment usually represent a major ongoing use of
cash, and
3. Financing cash flows: A firm obtains cash from short- and long- term
financing and equity issues. Cash is used to paid dividends, repay
borrowings and repurchase shares of share outstanding.
In developing the statement of cash flows, it’s important to distinguish between
sources of cash and uses of cash.
Financial Skills For Small Business: Learner Guide
Copyright BANK SETA Financial Skills Workshop 39
Depreciation was taken off our sales hence
the net profit is lower.
Depreciation being an expense is not an
actual cash amount.
A. Analysing operating activities:
Profit before interest and tax (PBT + interest)
Add: Depreciation
Less: Profit on disposal of assets
Add/Less: (Decrease) increase in debtors
Add/Less: (Decrease) increase in inventories stock
Add/Less: Increase (Decrease) in creditors
Add/Less: Increase (Decrease) in shareholders for dividend
Less: Interest paid
Less: Taxation paid (opening tax + current tax – closing tax
Less: Cash dividends paid
B. Analysing financing activities:
Proceeds from sale of ordinary shares
Less/Add: (Repayments) Receipts of long term loans
Less/Add: (Repayments) Proceeds from overdraft facility
C. Analysing investing activities:
Purchase of property, plant and equipment
Proceeds from sale of fixed assets
Total sources less total uses of cash Add: Cash and cash equivalents (beg of year)
= Cash and cash equivalents (end of year)
Financial Skills For Small Business: Learner Guide
Copyright BANK SETA Financial Skills Workshop 40
4.SUMMARY
Make your own summaries
here……..
The cash flow statement for ABC Ltd for the financial year ended 31 March 20X1 is reflected on the next page. Let’s practice.
Financial Skills For Small Business: Learner Guide
Copyright BANK SETA Financial Skills Workshop 41
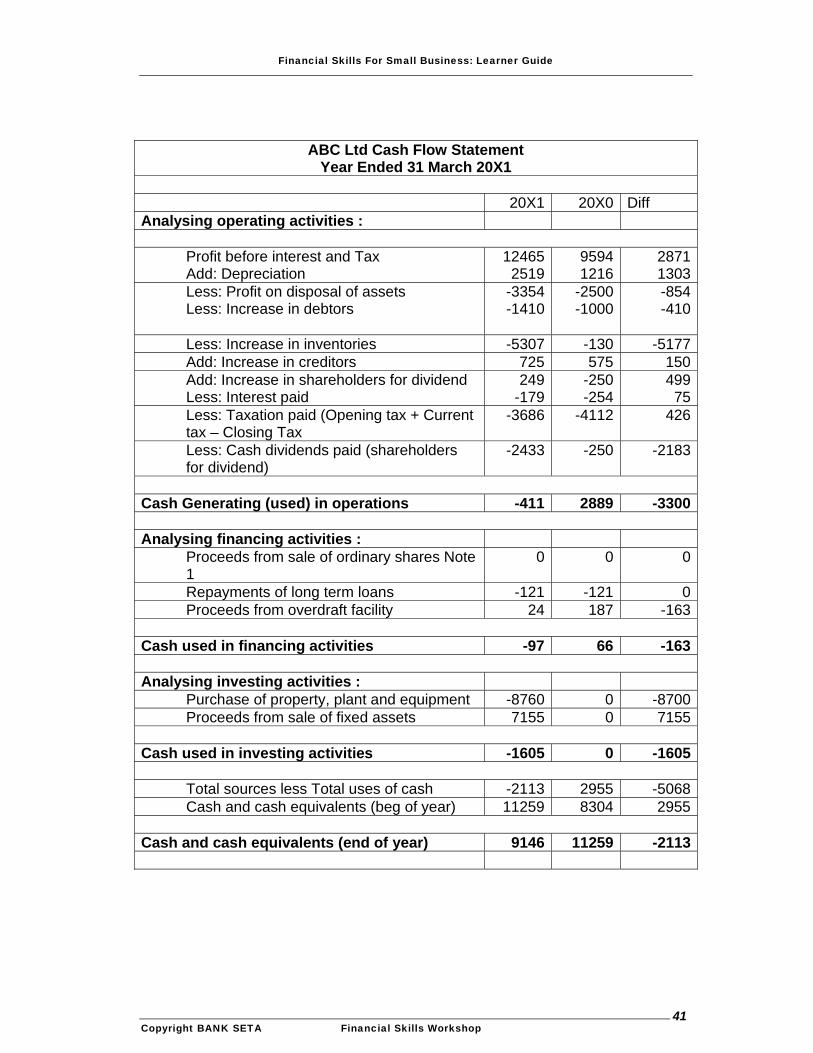
ABC Ltd Cash Flow Statement Year Ended 31 March 20X1
20X1 20X0 Diff Analysing operating activities :
Profit before interest and Tax Add: Depreciation
124652519
9594 1216
28711303
Less: Profit on disposal of assets Less: Increase in debtors
-3354-1410
-2500 -1000
-854-410
Less: Increase in inventories -5307 -130 -5177Add: Increase in creditors 725 575 150Add: Increase in shareholders for dividend Less: Interest paid
249-179
-250 -254
49975
Less: Taxation paid (Opening tax + Current tax – Closing Tax
-3686 -4112
426
Less: Cash dividends paid (shareholders for dividend)
-2433 -250 -2183
Cash Generating (used) in operations -411 2889 -3300 Analysing financing activities :
Proceeds from sale of ordinary shares Note 1
0 0 0
Repayments of long term loans -121 -121 0Proceeds from overdraft facility 24 187 -163
Cash used in financing activities -97 66 -163 Analysing investing activities :
Purchase of property, plant and equipment -8760 0 -8700Proceeds from sale of fixed assets 7155 0 7155
Cash used in investing activities -1605 0 -1605
Total sources less Total uses of cash -2113 2955 -5068Cash and cash equivalents (beg of year) 11259 8304 2955
Cash and cash equivalents (end of year) 9146 11259 -2113
Financial Skills For Small Business: Learner Guide
Copyright BANK SETA Financial Skills Workshop 42
Activity 3
Use cash flow statement of ABC LTD on the previous page to complete the exercise
1) How much cash has been generated from the operations of the business?
2) How much cash has been generated from financing activities during 20X1?
3) How much cash has been generated from the buying and selling non current
(fixed) assets?
4) Has ABC improved or worsened during 20X1 in terms of money generated
operations?
Financial Skills For Small Business: Learner Guide
Copyright BANK SETA Financial Skills Workshop 43
5) How can you tell if ABC is experiencing difficulties (or not) in terms of its
operations?
6) How much cash does ABC have in its bank account as of March 20X1?
7) Is there a way of improving cash from operations without increasing sales?
Financial Skills For Small Business: Learner Guide
Copyright BANK SETA Financial Skills Workshop 44
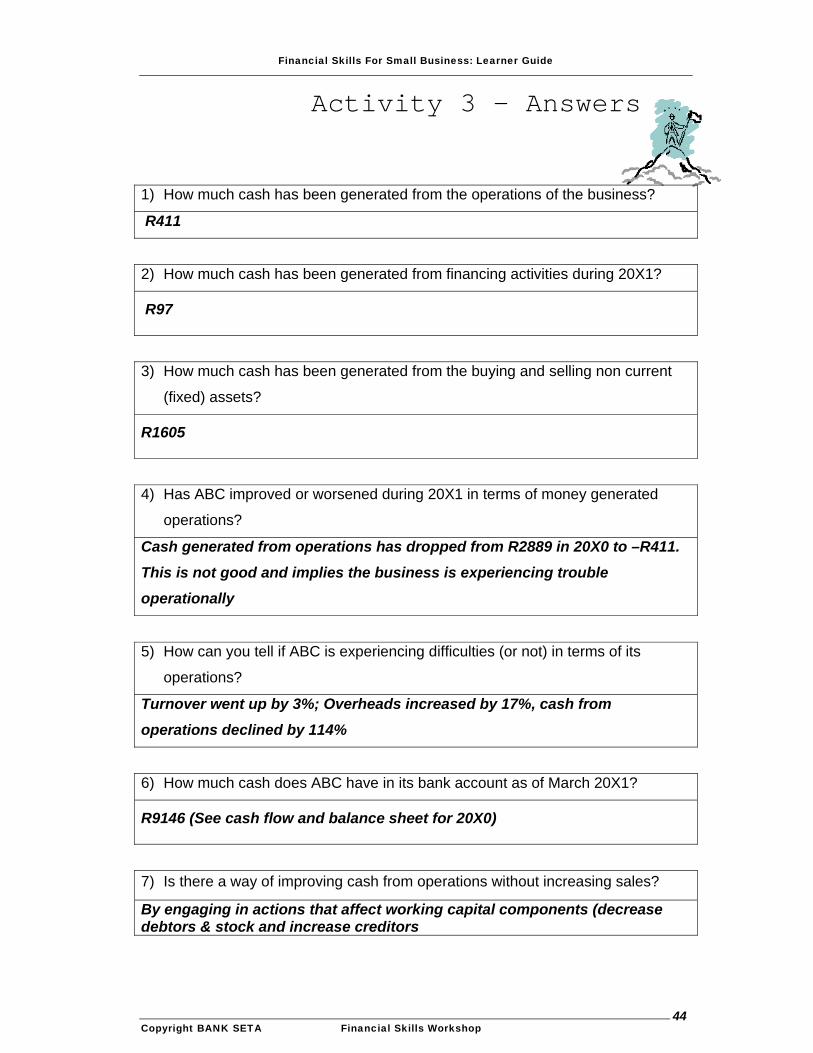
Activity 3 - Answers
1) How much cash has been generated from the operations of the business?
R411
2) How much cash has been generated from financing activities during 20X1?
R97
3) How much cash has been generated from the buying and selling non current
(fixed) assets?
R1605
4) Has ABC improved or worsened during 20X1 in terms of money generated
operations?
Cash generated from operations has dropped from R2889 in 20X0 to –R411.
This is not good and implies the business is experiencing trouble
operationally
5) How can you tell if ABC is experiencing difficulties (or not) in terms of its
operations?
Turnover went up by 3%; Overheads increased by 17%, cash from
operations declined by 114%
6) How much cash does ABC have in its bank account as of March 20X1?
R9146 (See cash flow and balance sheet for 20X0)
7) Is there a way of improving cash from operations without increasing sales?
By engaging in actions that affect working capital components (decrease debtors & stock and increase creditors
Financial Skills For Small Business: Learner Guide
Copyright BANK SETA Financial Skills Workshop 45
LEARNING UNIT FOUR
RATIOS
SPECIFIC OUTCOMES
By the end of this learning unit, you will apply your understanding of:
the purpose of financial analysis.
the critical success factors of a business.
ratios, which assist in analysing critical success factors.
key ratios calculations used to assess the financial position of a
business.
key ratios interpretations used to assess the financial position of a
business.
….in order to assess the financial situation of a business.
Financial Skills For Small Business: Learner Guide
Copyright BANK SETA Financial Skills Workshop 46
1.WHAT ARE RATIOS?
A ratio describes the relationship between two figures and can be shown as a
fraction or a percentage. It is the relationship between certain items in the
Financial Statements. Ratios are accepted as useful aids in assessing managerial
efficiency, profitability and the debt capacity of a company.
2. WHAT INFORMATION DO WE GET FROM
RATIOS?
Ratio analysis essentially provides indicators of past performance in terms of
profitability and operational activity. It also highlights financial strengths and
weaknesses concerning solvency, liquidity and capital structure.
A Ratio itself is of very little value. It’s significance increases when:
It is compared with the same ratio for a series of consecutive years.
Changes in ratios from year to year can be helpful in indicating trends.
It is compared with other ratios in the same financial statements.
It is compared with Industry norms (e.g. by comparing ratios with
another company in the same line of business.)
When several ratios all point in the same direction, the trend cannot be ignored.
A vast number of ratios can be calculated from the data contained in a set of
financial statements. Some ratios are of lesser significance than others, and we
will concentrate on the most important ones, generally used by banks.
We will again use the same income statement and balance sheet of Zululand Plastic – 20X0
Financial Skills For Small Business: Learner Guide
Copyright BANK SETA Financial Skills Workshop 47
3.LIQUIDITY RATIOS
These ratios measure the ability of a company to cover its current liabilities out of
its current assets. The following are the 3 most widely used measures of liquidity:
A. Current Ratio (Working Capital Ratio)
Indicates the extent of the liability of the company to cover it’s current liabilities out
of the proceeds of it’s current assets. It takes into account the length of time it
takes to complete the normal operating cycle of the business. By examining the
amount of cash on hand and other current assets in relation to the maturing
financial obligations, ratio analysis indicates a measure of liquidity.
It is calculated as follows: Current Assets Current Liabilities
= 55 234 = 1.23:1
44 689
Explanation :
For every R1 of Current Liabilities the company has R1.23 in Current Assets. This
ratio shows us what a business’ current assets are in relation to its current
liabilities. It shows the total money available against the total money required over
the short term.
Depending on the type of business a Current Ratio of 2:1 is regarded as
satisfactory. In the event of bankruptcy, and should the book value of the current
assets shrink by 50% on liquidation, the current creditors may still receive full
payment of their debts, provided there are no prior claims or long term creditors.
B. Quick Ratio (The Acid Test)
This ratio measures the ability of the company to pay its current liabilities out of
immediate realisable current assets when there is an urgency to pay creditors. As
Financial Skills For Small Business: Learner Guide
Copyright BANK SETA Financial Skills Workshop 48
stock and other less liquid current assets, such as prepaid expenses, are the least
liquid of assets, we have to exclude them from current assets.
It is calculated as follows: Current Assets – Stock Current Liabilities = 55 234 – 9 917 = 1.01:1
44 689
Explanation: Current Assets minus Stock is referred to as Quick Assets. The company has
R1.01 Quick assets for every R1 Current liabilities.
A Company with a Quick ratio of more than 1:1 should pass the Acid Test, as
there can be little doubt that such a company will be able to meet its current
obligations at short notice. However it is not the ultimate measure, and a
company with a lower ratio can still be liquid.
Clearly this ratio will be lower than the current ratio, but the difference between
the two ratios; i.e. the gap will indicate the extent by which current assets are
made up of stock. The wider the gap between the two ratios, the higher the
proportion of stock and pre-paid expenses to other current assets.
The quick ratio can also assist the analyst in identifying a disproportionate
increase (or decrease) in stock, relative to other current assets.
Financial Skills For Small Business: Learner Guide
Copyright BANK SETA Financial Skills Workshop 49
4. Activity Ratios
A. Average Collection Periods
The most relevant comparison here is between the debtors’ and the creditors’
period. If debts are collected before payments are made to creditors, the business
has much less chance of running into cash flow problems. Conversely, if the
business is paying creditors before receiving cash from debtors, this will place a
strain on cash flow. The wider the gap between debtor receipts and creditor
payments, the more beneficial to the company.
The average collection periods can be calculated in two ways. The analyst can:
Calculate how many times debtors and creditors “turn over” (activity).
Calculate the number of days it takes to pay creditors and receive
payment from debtors (liquidity).
Let us look at each of these calculations, Creditors payment period and Debtor
collection period separately:
B. Creditors Payment Period
This measures the number of days a company takes to settle the amounts they
owe to creditors. The average period of settlement is usually calculated for trade
creditors excluding amounts outstanding in respect of Instalment Sale or Finance
Lease Agreements.
The average amount of outstanding creditors is often determined by adding the
outstanding balances at the beginning and end of the financial year and dividing
the total by 2.
Financial Skills For Small Business: Learner Guide
Copyright BANK SETA Financial Skills Workshop 50
A more satisfactory or correct average may be determined by adding the
outstanding balances at the end of every month during the year and dividing the
total by twelve.
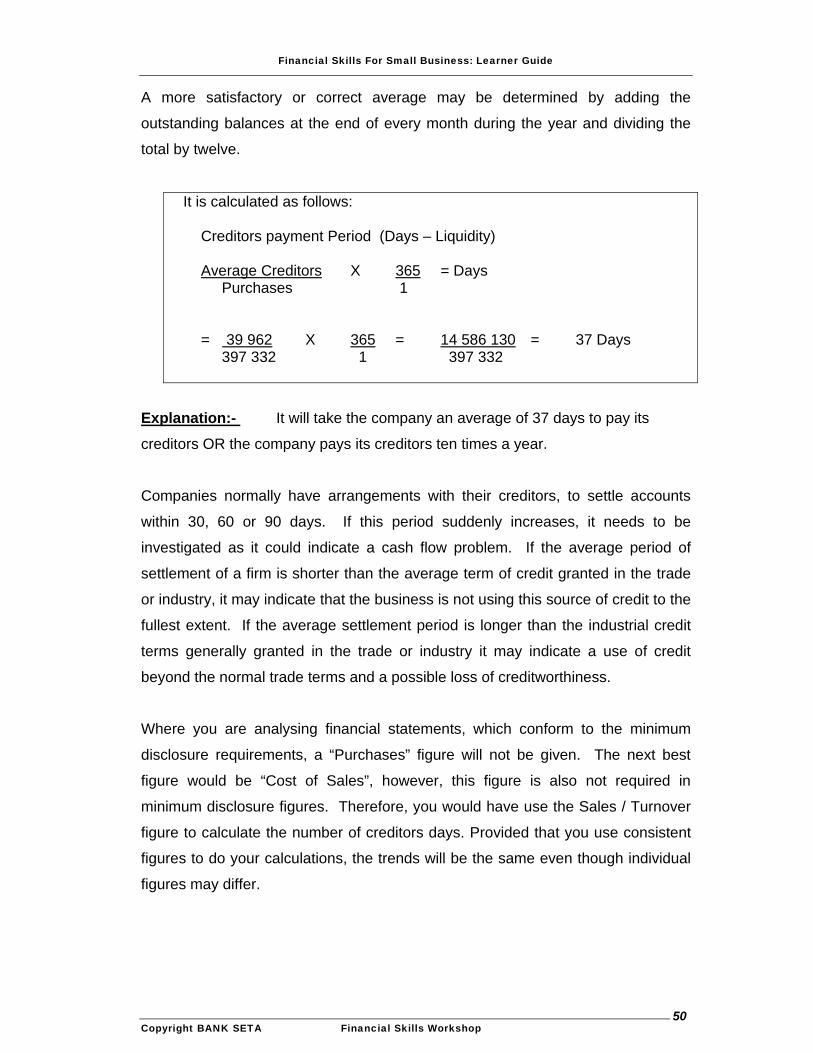
It is calculated as follows: Creditors payment Period (Days – Liquidity)
Average Creditors X 365 = Days Purchases 1 = 39 962 X 365 = 14 586 130 = 37 Days 397 332 1 397 332
Explanation:- It will take the company an average of 37 days to pay its
creditors OR the company pays its creditors ten times a year.
Companies normally have arrangements with their creditors, to settle accounts
within 30, 60 or 90 days. If this period suddenly increases, it needs to be
investigated as it could indicate a cash flow problem. If the average period of
settlement of a firm is shorter than the average term of credit granted in the trade
or industry, it may indicate that the business is not using this source of credit to the
fullest extent. If the average settlement period is longer than the industrial credit
terms generally granted in the trade or industry it may indicate a use of credit
beyond the normal trade terms and a possible loss of creditworthiness.
Where you are analysing financial statements, which conform to the minimum
disclosure requirements, a “Purchases” figure will not be given. The next best
figure would be “Cost of Sales”, however, this figure is also not required in
minimum disclosure figures. Therefore, you would have use the Sales / Turnover
figure to calculate the number of creditors days. Provided that you use consistent
figures to do your calculations, the trends will be the same even though individual
figures may differ.
Financial Skills For Small Business: Learner Guide
Copyright BANK SETA Financial Skills Workshop 51
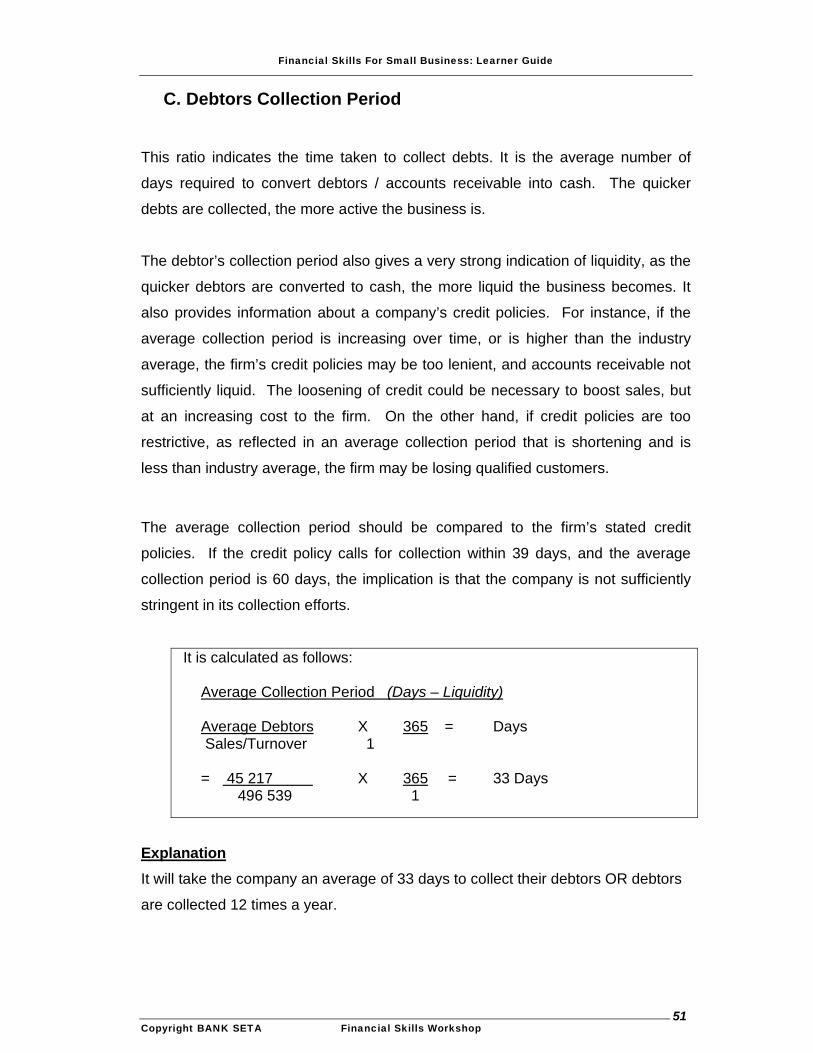
C. Debtors Collection Period
This ratio indicates the time taken to collect debts. It is the average number of
days required to convert debtors / accounts receivable into cash. The quicker
debts are collected, the more active the business is.
The debtor’s collection period also gives a very strong indication of liquidity, as the
quicker debtors are converted to cash, the more liquid the business becomes. It
also provides information about a company’s credit policies. For instance, if the
average collection period is increasing over time, or is higher than the industry
average, the firm’s credit policies may be too lenient, and accounts receivable not
sufficiently liquid. The loosening of credit could be necessary to boost sales, but
at an increasing cost to the firm. On the other hand, if credit policies are too
restrictive, as reflected in an average collection period that is shortening and is
less than industry average, the firm may be losing qualified customers.
The average collection period should be compared to the firm’s stated credit
policies. If the credit policy calls for collection within 39 days, and the average
collection period is 60 days, the implication is that the company is not sufficiently
stringent in its collection efforts.
It is calculated as follows: Average Collection Period (Days – Liquidity) Average Debtors X 365 = Days Sales/Turnover 1 = 45 217 X 365 = 33 Days
496 539 1
Explanation It will take the company an average of 33 days to collect their debtors OR debtors
are collected 12 times a year.
Financial Skills For Small Business: Learner Guide
Copyright BANK SETA Financial Skills Workshop 52
Obviously the shorter the period, the better the firm’s cash flow. Ideally this period
should also be shorter than the credit payment period. It is desirable to first collect
money from the debtors before you have to pay your creditors. Interest could
therefore be earned on the money collected before paying the creditors on due
date.
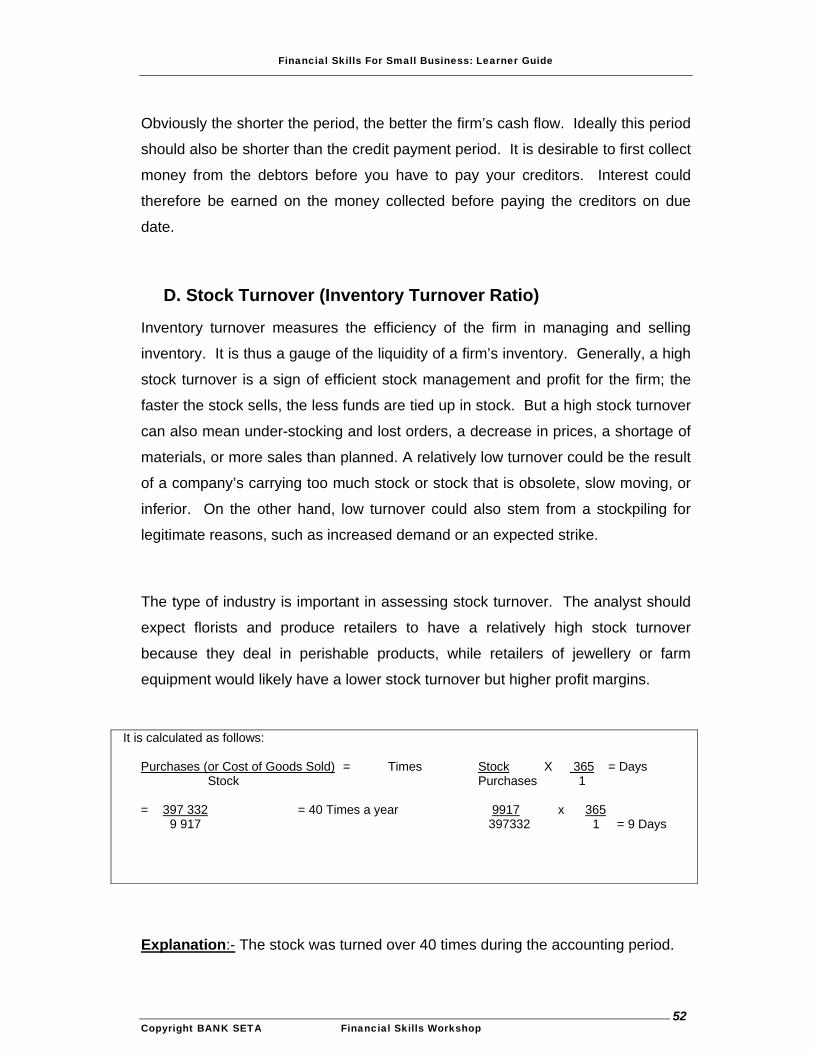
D. Stock Turnover (Inventory Turnover Ratio)
Inventory turnover measures the efficiency of the firm in managing and selling
inventory. It is thus a gauge of the liquidity of a firm’s inventory. Generally, a high
stock turnover is a sign of efficient stock management and profit for the firm; the
faster the stock sells, the less funds are tied up in stock. But a high stock turnover
can also mean under-stocking and lost orders, a decrease in prices, a shortage of
materials, or more sales than planned. A relatively low turnover could be the result
of a company’s carrying too much stock or stock that is obsolete, slow moving, or
inferior. On the other hand, low turnover could also stem from a stockpiling for
legitimate reasons, such as increased demand or an expected strike.
The type of industry is important in assessing stock turnover. The analyst should
expect florists and produce retailers to have a relatively high stock turnover
because they deal in perishable products, while retailers of jewellery or farm
equipment would likely have a lower stock turnover but higher profit margins.
It is calculated as follows:
Purchases (or Cost of Goods Sold) = Times Stock X 365 = Days Stock Purchases 1 = 397 332 = 40 Times a year 9917 x 365 9 917 397332 1 = 9 Days
Explanation:- The stock was turned over 40 times during the accounting period.
Financial Skills For Small Business: Learner Guide
Copyright BANK SETA Financial Skills Workshop 53
The Inventory turnover Ratio is an average for all stock. Some stock will move
faster than others, if different lines are carried.
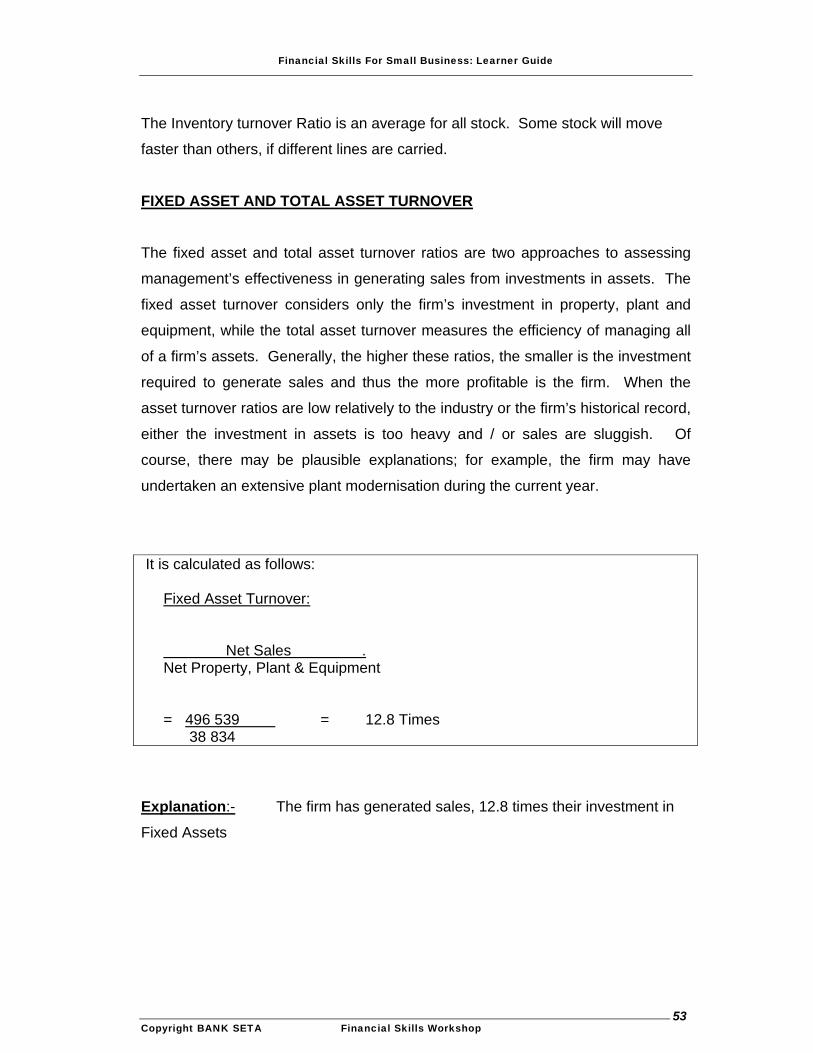
FIXED ASSET AND TOTAL ASSET TURNOVER
The fixed asset and total asset turnover ratios are two approaches to assessing
management’s effectiveness in generating sales from investments in assets. The
fixed asset turnover considers only the firm’s investment in property, plant and
equipment, while the total asset turnover measures the efficiency of managing all
of a firm’s assets. Generally, the higher these ratios, the smaller is the investment
required to generate sales and thus the more profitable is the firm. When the
asset turnover ratios are low relatively to the industry or the firm’s historical record,
either the investment in assets is too heavy and / or sales are sluggish. Of
course, there may be plausible explanations; for example, the firm may have
undertaken an extensive plant modernisation during the current year.
It is calculated as follows:
Fixed Asset Turnover:
Net Sales . Net Property, Plant & Equipment = 496 539 = 12.8 Times 38 834
Explanation:- The firm has generated sales, 12.8 times their investment in
Fixed Assets
Financial Skills For Small Business: Learner Guide
Copyright BANK SETA Financial Skills Workshop 54
Total Asset Turnover:
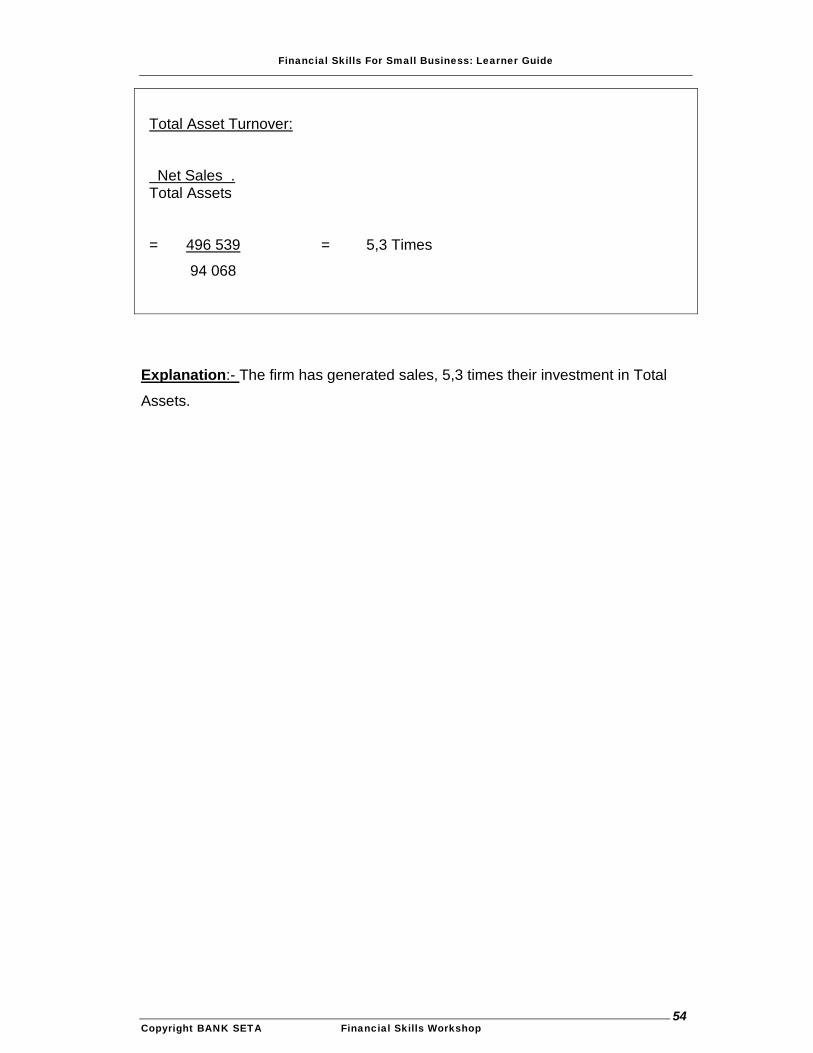
Net Sales . Total Assets
= 496 539 = 5,3 Times
94 068
Explanation:- The firm has generated sales, 5,3 times their investment in Total
Assets.
Financial Skills For Small Business: Learner Guide
Copyright BANK SETA Financial Skills Workshop 55
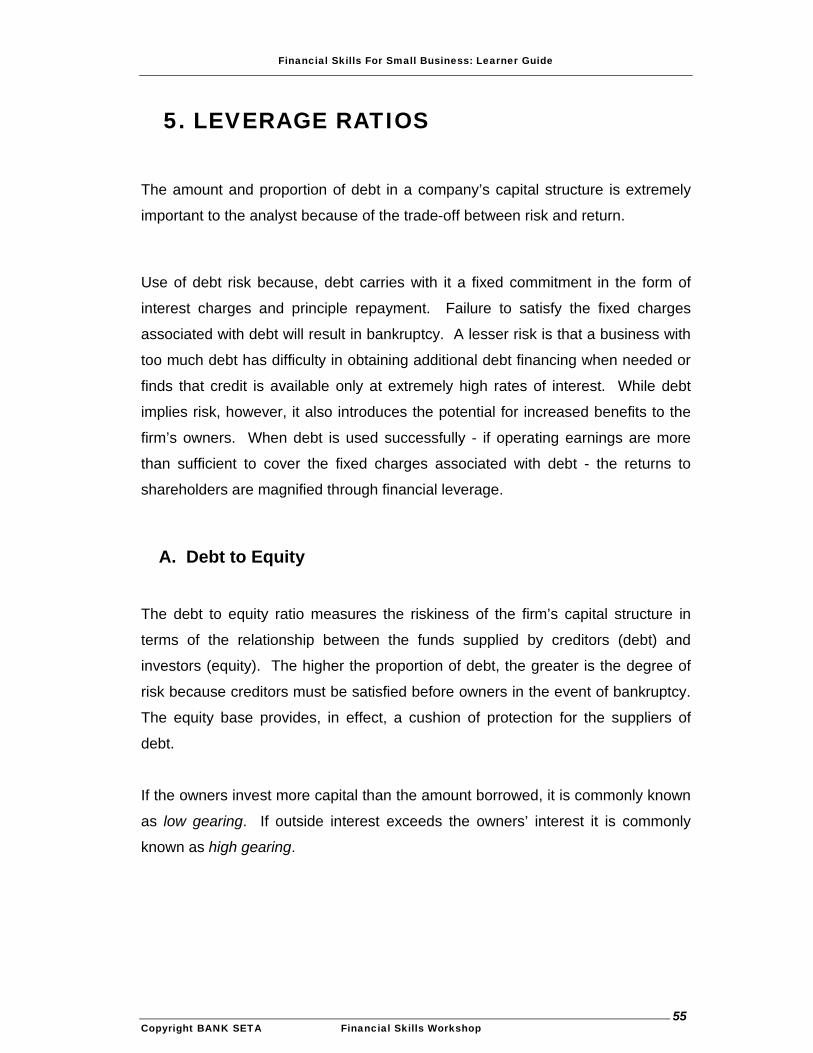
5. LEVERAGE RATIOS
The amount and proportion of debt in a company’s capital structure is extremely
important to the analyst because of the trade-off between risk and return.
Use of debt risk because, debt carries with it a fixed commitment in the form of
interest charges and principle repayment. Failure to satisfy the fixed charges
associated with debt will result in bankruptcy. A lesser risk is that a business with
too much debt has difficulty in obtaining additional debt financing when needed or
finds that credit is available only at extremely high rates of interest. While debt
implies risk, however, it also introduces the potential for increased benefits to the
firm’s owners. When debt is used successfully - if operating earnings are more
than sufficient to cover the fixed charges associated with debt - the returns to
shareholders are magnified through financial leverage.
A. Debt to Equity
The debt to equity ratio measures the riskiness of the firm’s capital structure in
terms of the relationship between the funds supplied by creditors (debt) and
investors (equity). The higher the proportion of debt, the greater is the degree of
risk because creditors must be satisfied before owners in the event of bankruptcy.
The equity base provides, in effect, a cushion of protection for the suppliers of
debt.
If the owners invest more capital than the amount borrowed, it is commonly known
as low gearing. If outside interest exceeds the owners’ interest it is commonly
known as high gearing.
Financial Skills For Small Business: Learner Guide
Copyright BANK SETA Financial Skills Workshop 56
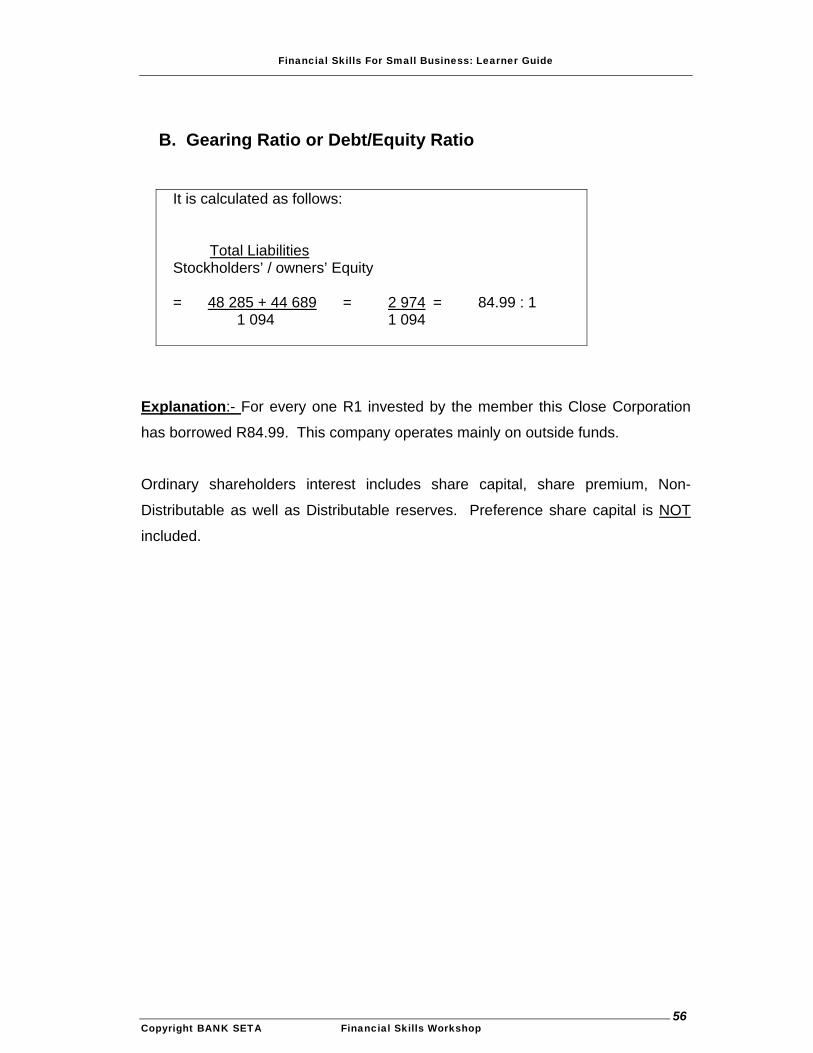
B. Gearing Ratio or Debt/Equity Ratio
It is calculated as follows:
Total Liabilities
Stockholders’ / owners’ Equity
= 48 285 + 44 689 = 2 974 = 84.99 : 1 1 094 1 094
Explanation:- For every one R1 invested by the member this Close Corporation
has borrowed R84.99. This company operates mainly on outside funds.
Ordinary shareholders interest includes share capital, share premium, Non-
Distributable as well as Distributable reserves. Preference share capital is NOT
included.
Financial Skills For Small Business: Learner Guide
Copyright BANK SETA Financial Skills Workshop 57
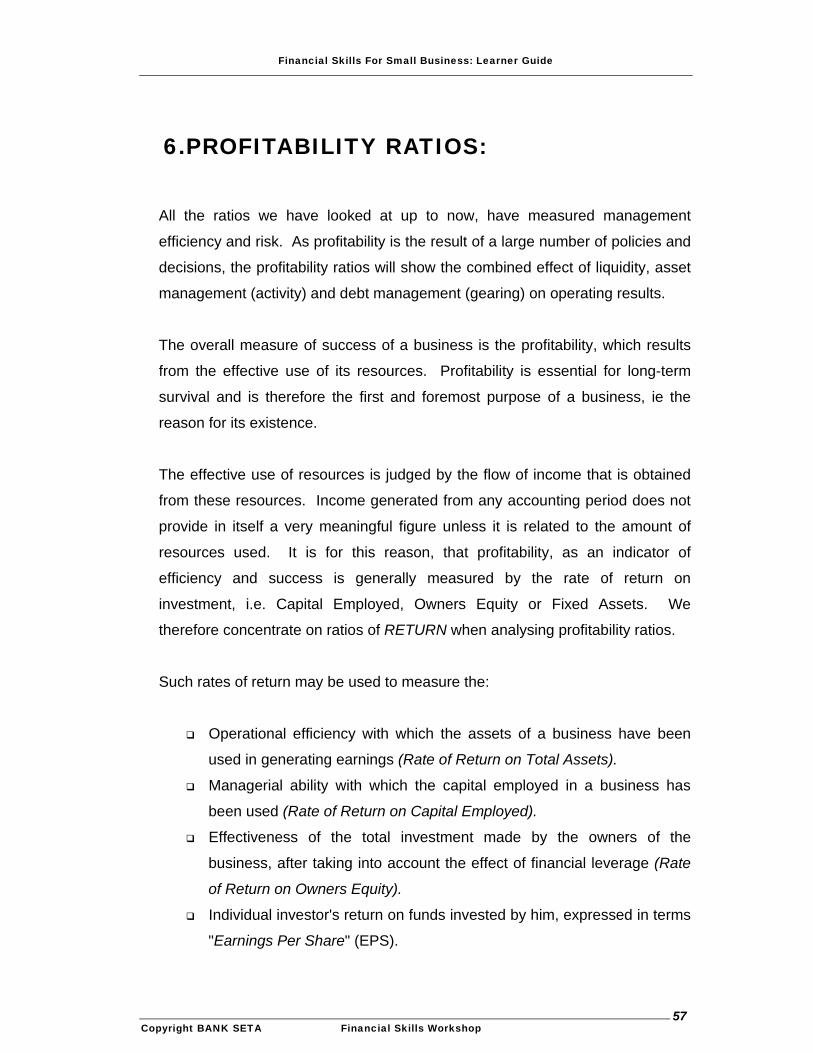
6.PROFITABILITY RATIOS:
All the ratios we have looked at up to now, have measured management
efficiency and risk. As profitability is the result of a large number of policies and
decisions, the profitability ratios will show the combined effect of liquidity, asset
management (activity) and debt management (gearing) on operating results.
The overall measure of success of a business is the profitability, which results
from the effective use of its resources. Profitability is essential for long-term
survival and is therefore the first and foremost purpose of a business, ie the
reason for its existence.
The effective use of resources is judged by the flow of income that is obtained
from these resources. Income generated from any accounting period does not
provide in itself a very meaningful figure unless it is related to the amount of
resources used. It is for this reason, that profitability, as an indicator of
efficiency and success is generally measured by the rate of return on
investment, i.e. Capital Employed, Owners Equity or Fixed Assets. We
therefore concentrate on ratios of RETURN when analysing profitability ratios.
Such rates of return may be used to measure the:
Operational efficiency with which the assets of a business have been
used in generating earnings (Rate of Return on Total Assets).
Managerial ability with which the capital employed in a business has
been used (Rate of Return on Capital Employed).
Effectiveness of the total investment made by the owners of the
business, after taking into account the effect of financial leverage (Rate
of Return on Owners Equity).
Individual investor's return on funds invested by him, expressed in terms
"Earnings Per Share" (EPS).
Financial Skills For Small Business: Learner Guide
Copyright BANK SETA Financial Skills Workshop 58
Different profitability ratios are used in different phases of a company’s ability to
translate Sales into Earnings. It therefore measures the relationship between
the generation of Profit and the actual sales (Turnover).
A. Gross Profit Margin
Measures the difference between cost price and actual selling price of goods.
Commonly referred to as “Mark-up”. It shows the relationship between sales
and the cost of products sold and thus measures the ability of a company to
control costs of stock and to pass along price increases through sales to
customers.
If the gross profit margin remains constant, then the gross profit should rise and
fall proportionately to sales. Analysing movements in the margin, therefore, will
be more fruitful and informative than merely looking at the gross profit figures. It
can also be useful to compare the gross profit margin across similar businesses
although there will often be good reasons for disparity. An improving trend in
the margin is to be welcomed and, as long as overheads are controlled, will
result in an enhanced net profit. Where the trend in the margin is downwards,
the analyst must not automatically assume that disaster is around the corner.
A businessperson may, as a matter of policy, reduce prices and therefore
margins, to improve sales. If the ultimate outcome is a higher gross profit, then
there can be little cause for complaint. However, there may well be some cause
for concern where the margin is falling and questions may have to be asked of
the customer.
One or more of the following could cause any deterioration, in the Gross Profit
Margin:
Failure to pass on higher material or production costs.
Poor buying decisions.
Financial Skills For Small Business: Learner Guide
Copyright BANK SETA Financial Skills Workshop 59
Increased competition on prices.
Pilferage, wastage, returned goods.
Stock valuation has a direct bearing on the calculation of gross profit and
margins. Changes in the method of valuation will change the gross profit and
consequently the ratios.
While the gross margin analysis can give useful information, the gross profit
figure is not always given in Annual Financial Statements, in which case the
analysis cannot be made.
Note that it is impractical to expect a business to show a trend of increasing
gross margins. In essence, the business must endeavour to maintain its
margin, as then any real increase in sales will improve gross profitability.
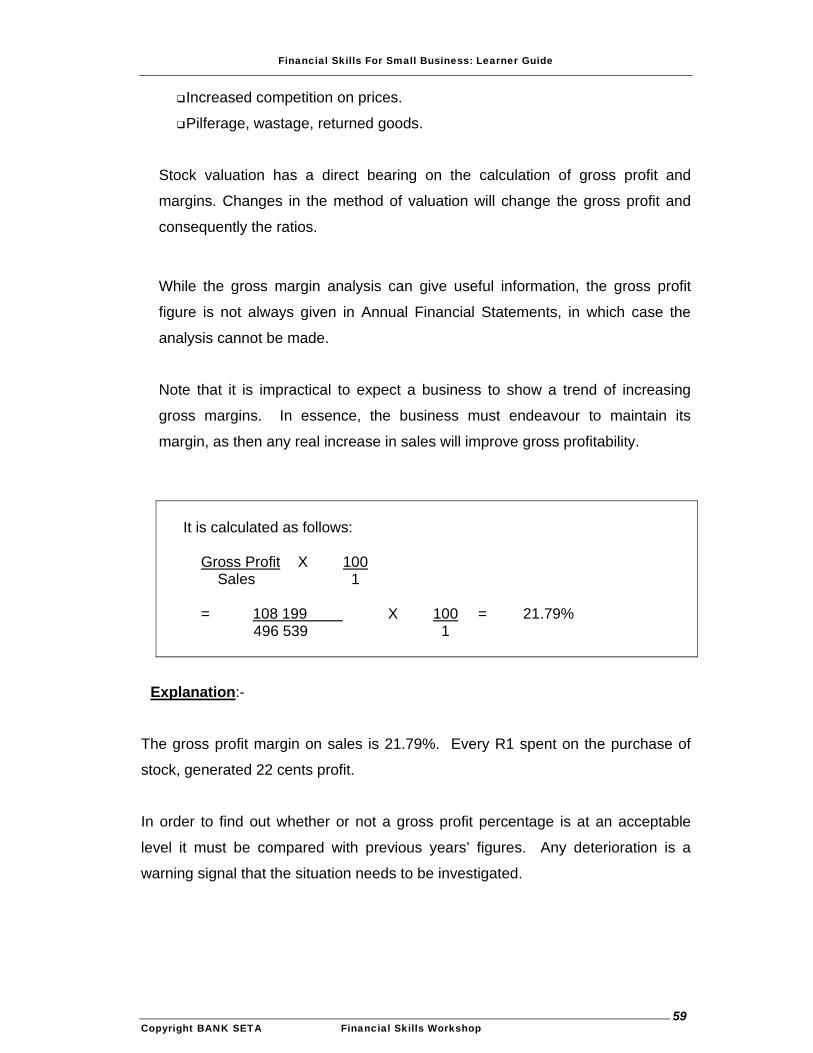
It is calculated as follows:
Gross Profit X 100 Sales 1 = 108 199 X 100 = 21.79% 496 539 1
Explanation:-
The gross profit margin on sales is 21.79%. Every R1 spent on the purchase of
stock, generated 22 cents profit.
In order to find out whether or not a gross profit percentage is at an acceptable
level it must be compared with previous years’ figures. Any deterioration is a
warning signal that the situation needs to be investigated.
Financial Skills For Small Business: Learner Guide
Copyright BANK SETA Financial Skills Workshop 60
B. Net Profit
The net profit margin measures the profitability after consideration of all revenue
and expenses, including non-operating items and income taxes. It is a widely used
measure of performance and is comparable across companies in similar
industries.
The fact that a business works on a very low margin need not necessarily cause
alarm because there are some sectors of industry that work on a basis of high
turnover and low margins, for example supermarkets and motor car dealers.
It is more important to focus on any trend in the margin and whether it compares
well with similar businesses. If you compare the trends in the gross and net
margins you may be able to isolate problems. Where the gross margin is constant
or improving but the net margin is declining, this may indicate a lack of control on
costs or exceptional increases in overheads. It is therefore important to the GAP
between the gross profit margin and the net profit margin.
In analysing the net margin, the question arises whether to use the “Before Tax or
After Tax Net Profit” figures. Remember that tax is a fairly manageable cost, which
can fluctuate dramatically, especially when large allowances are made, for any
reason in a particular year. It is for this reason, that some analysts would use the
“Before Tax” figure.
However, when you are analysing profitability, it is the “bottom line” that is
meaningful and therefore the after tax figure is preferred. There is also a question
as to whether interest should be excluded (EBIT), since interest is a function of the
source of finance and depending on the source of finance used, interest expense
can change dramatically. Most banks appear to favour the Profit after Tax figure.
Financial Skills For Small Business: Learner Guide
Copyright BANK SETA Financial Skills Workshop 61
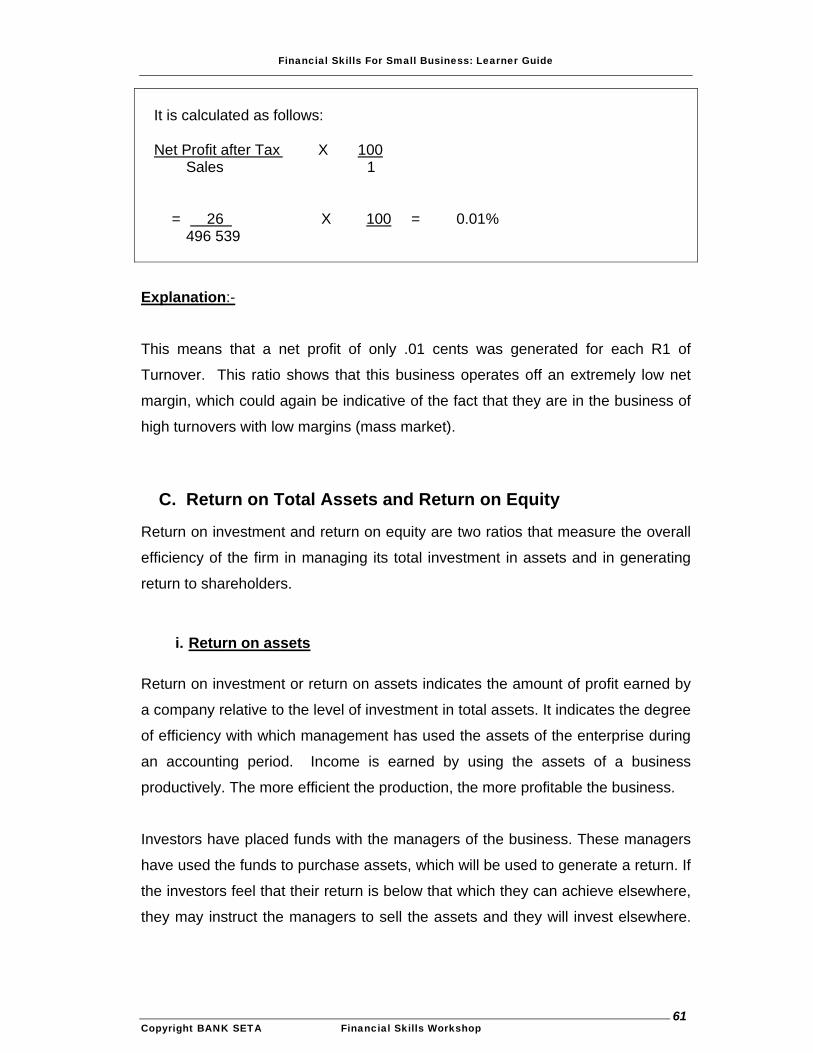
It is calculated as follows:
Net Profit after Tax X 100
Sales 1 = 26 X 100 = 0.01% 496 539
Explanation:-
This means that a net profit of only .01 cents was generated for each R1 of
Turnover. This ratio shows that this business operates off an extremely low net
margin, which could again be indicative of the fact that they are in the business of
high turnovers with low margins (mass market).
C. Return on Total Assets and Return on Equity
Return on investment and return on equity are two ratios that measure the overall
efficiency of the firm in managing its total investment in assets and in generating
return to shareholders.
i. Return on assets
Return on investment or return on assets indicates the amount of profit earned by
a company relative to the level of investment in total assets. It indicates the degree
of efficiency with which management has used the assets of the enterprise during
an accounting period. Income is earned by using the assets of a business
productively. The more efficient the production, the more profitable the business.
Investors have placed funds with the managers of the business. These managers
have used the funds to purchase assets, which will be used to generate a return. If
the investors feel that their return is below that which they can achieve elsewhere,
they may instruct the managers to sell the assets and they will invest elsewhere.
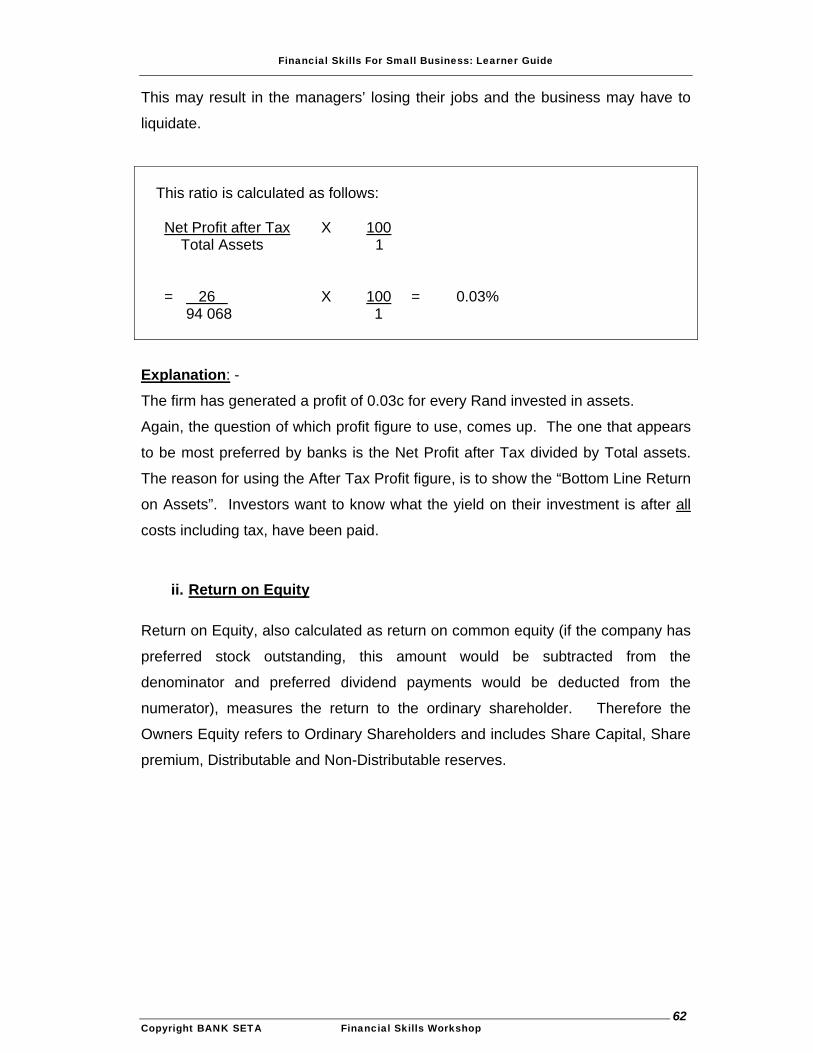
Financial Skills For Small Business: Learner Guide
Copyright BANK SETA Financial Skills Workshop 62
This may result in the managers’ losing their jobs and the business may have to
liquidate.
This ratio is calculated as follows:
Net Profit after Tax X 100 Total Assets 1 = 26 X 100 = 0.03% 94 068 1
Explanation: -
The firm has generated a profit of 0.03c for every Rand invested in assets.
Again, the question of which profit figure to use, comes up. The one that appears
to be most preferred by banks is the Net Profit after Tax divided by Total assets.
The reason for using the After Tax Profit figure, is to show the “Bottom Line Return
on Assets”. Investors want to know what the yield on their investment is after all
costs including tax, have been paid.
ii. Return on Equity
Return on Equity, also calculated as return on common equity (if the company has
preferred stock outstanding, this amount would be subtracted from the
denominator and preferred dividend payments would be deducted from the
numerator), measures the return to the ordinary shareholder. Therefore the
Owners Equity refers to Ordinary Shareholders and includes Share Capital, Share
premium, Distributable and Non-Distributable reserves.
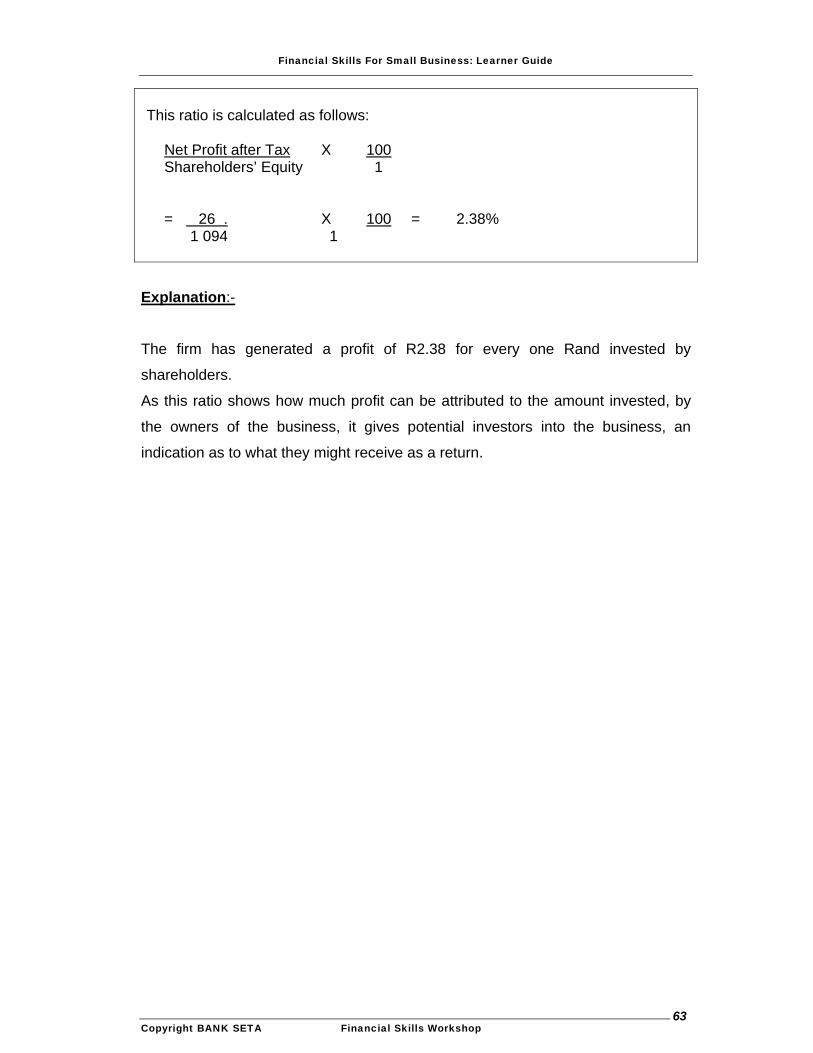
Financial Skills For Small Business: Learner Guide
Copyright BANK SETA Financial Skills Workshop 63
This ratio is calculated as follows:
Net Profit after Tax X 100 Shareholders’ Equity 1 = 26 . X 100 = 2.38% 1 094 1
Explanation:-
The firm has generated a profit of R2.38 for every one Rand invested by
shareholders.
As this ratio shows how much profit can be attributed to the amount invested, by
the owners of the business, it gives potential investors into the business, an
indication as to what they might receive as a return.

Financial Skills For Small Business: Learner Guide
Copyright BANK SETA Financial Skills Workshop 64
7.SUMMARY
Make your own summaries
here……..
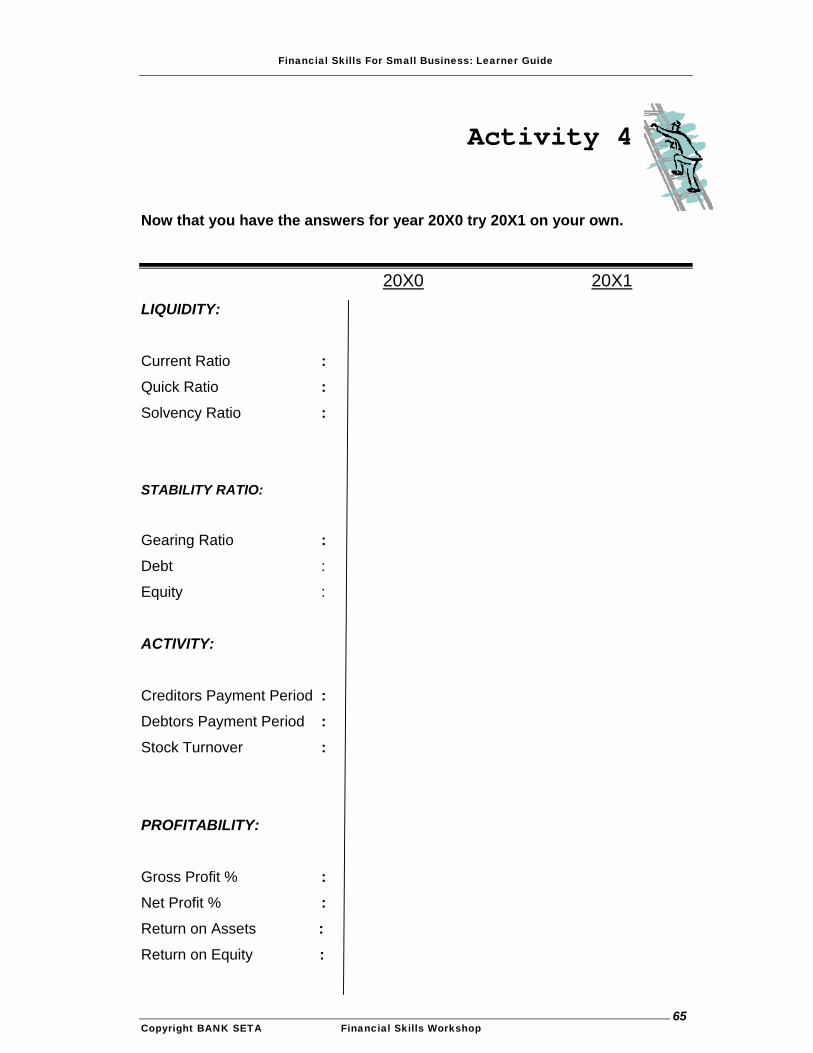
Financial Skills For Small Business: Learner Guide
Copyright BANK SETA Financial Skills Workshop 65
Activity 4
Now that you have the answers for year 20X0 try 20X1 on your own.
20X0 20X1
LIQUIDITY:
Current Ratio :
Quick Ratio : Solvency Ratio :
STABILITY RATIO:
Gearing Ratio :
Debt :
Equity :
ACTIVITY:
Creditors Payment Period : Debtors Payment Period :
Stock Turnover :
PROFITABILITY:
Gross Profit % : Net Profit % : Return on Assets : Return on Equity :
Financial Skills For Small Business: Learner Guide
Copyright BANK SETA Financial Skills Workshop 66
LEARNING UNIT FIVE
WORKING CAPITAL
SPECIFIC OUTCOMES
In this learning unit, you will be able to apply your demonstrated understanding of:
the term “ working capital”;
the importance of working capital in a small business;
the components of working capital, that need to be managed in a
small business.
…….to successfully assess the financial performance of a small business.
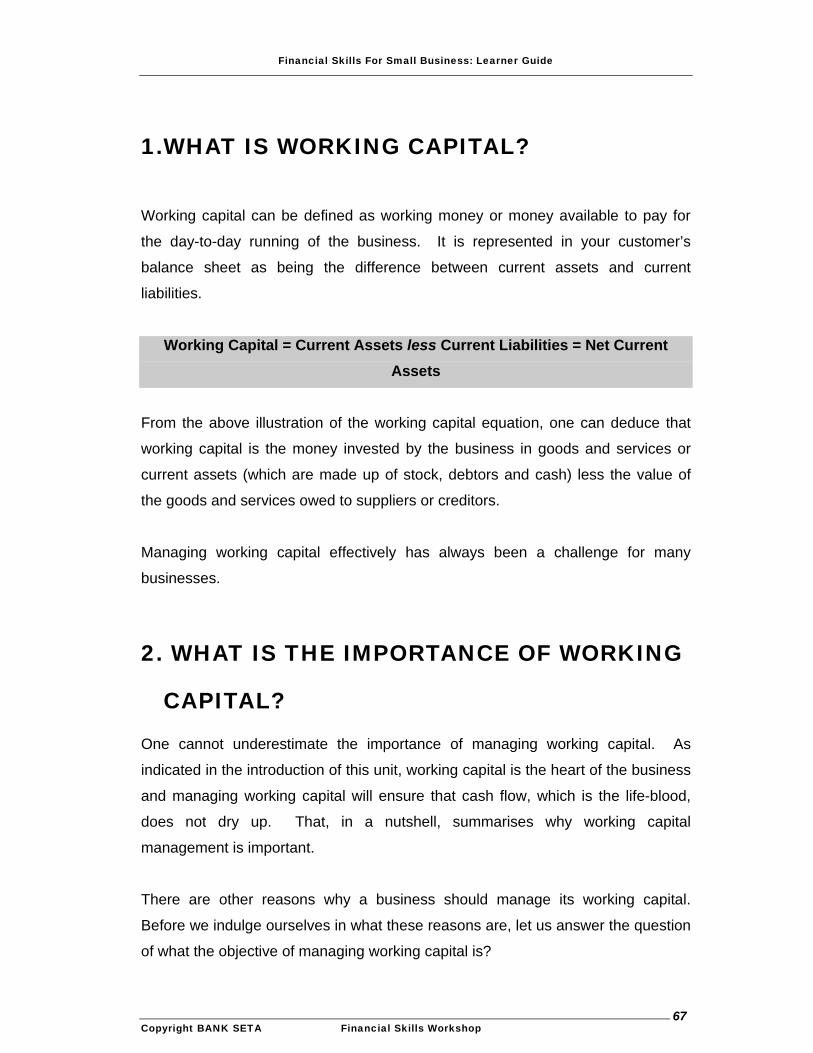
Financial Skills For Small Business: Learner Guide
Copyright BANK SETA Financial Skills Workshop 67
1.WHAT IS WORKING CAPITAL?
Working capital can be defined as working money or money available to pay for
the day-to-day running of the business. It is represented in your customer’s
balance sheet as being the difference between current assets and current
liabilities.
Working Capital = Current Assets less Current Liabilities = Net Current Assets
From the above illustration of the working capital equation, one can deduce that
working capital is the money invested by the business in goods and services or
current assets (which are made up of stock, debtors and cash) less the value of
the goods and services owed to suppliers or creditors.
Managing working capital effectively has always been a challenge for many
businesses.
2. WHAT IS THE IMPORTANCE OF WORKING
CAPITAL?
One cannot underestimate the importance of managing working capital. As
indicated in the introduction of this unit, working capital is the heart of the business
and managing working capital will ensure that cash flow, which is the life-blood,
does not dry up. That, in a nutshell, summarises why working capital
management is important.
There are other reasons why a business should manage its working capital.
Before we indulge ourselves in what these reasons are, let us answer the question
of what the objective of managing working capital is?

Financial Skills For Small Business: Learner Guide
Copyright BANK SETA Financial Skills Workshop 68
As working capital is money invested by the business in goods and services or
current assets, the objective of managing working capital is therefore to limit the
amount of resources committed by the business at any given point in time, whilst
at the same time, ensuring that the operational needs of the business are met.
By committed resources, we mean resources committed in increasing stock,
debtors and even cash itself as well as committed resources towards the payment
of creditors. It must be remembered that the more money tied up in those items,
the less money will be available for other things in the business. Managing
working capital therefore ensures that the money resources are freed.
The reasons why businesses should manage working capital, are as follows:
• It measures a business’s liquidity.
• It is a source of funds.
• It is a double-edged cost.
A. Measure of a Business’s Liquidity
Working capital is a measure of a business’s liquidity, the ability of the business to
meet its short-term obligations when due. The liquidity ratios we covered had to
do with the ability to convert its current assets into cash as quickly as possible.
We found that liquidity had little to do with the quantity of current assets, but rather
about their quality.
B. A Source Of Funds
Working capital is a source of funds to the business, if managed correctly.
Following from the above point, if the quality of those current assets is good and
they are easily converted to cash, the business can then fund itself with very little
reliance on outside funding.
Financial Skills For Small Business: Learner Guide
Copyright BANK SETA Financial Skills Workshop 69
C. A Double-Edged Cost
Managing working capital has a double-edged cost to it, which every business
must be aware of in order to manage it appropriately. An example would be a
business choosing between carrying too much stock and bearing the costs
associated with this, for example storage costs, or carrying too little stock and risk
the cost of stock shortage situations.
The fact that there is a double-edged cost to deciding what levels of current assets
one has in its books, is reason enough why working capital should be managed.
3. WHAT ARE THE MANAGEABLE
COMPONENTS OF WORKING CAPITAL?
A. Debtor’s and creditor’s control
This is usually one area where the cash is tied up.
Effective management of debtors’ and creditors’ control is critical, as the business
can pay for itself in this way. It has to do with the timing of cash outflows to pay
creditors and inflows from collections from debtors.
In the unit called “ratio”, we discussed the debtors’ collection period and the
creditors’ payment period. To apply that to the business will mean ensuring that
debtors are collected before creditors are paid. We will explore this further when
we discuss the working capital cycles later in this section.
B. Inventory control
It is impossible to be everything to everyone. A business should certainly not
attempt to please everyone by carrying inventory of everything, even slow moving
items, just in case a customer may want it in future.
Financial Skills For Small Business: Learner Guide
Copyright BANK SETA Financial Skills Workshop 70
Carrying too much inventory can be very expensive for a business, so is carrying
too little. We will explore these below:
Excessive inventory means cash had to flow out of the business in order to
acquire it. In addition to that, there are other costs associated with holding too
much inventory, for example:
cost of storage.
cost of pilferage and shrinkage very high.
risk due to obsolescence is high especially if it becomes outdated and or
damaged.
buying inventory using borrowed funds attracts interest.
cost of security as you put in place security measures to guard the stock.
cost of stock control.
Carrying too little inventory also has its disadvantages and this needs to be
considered and weighed up against holding too much. These are as follows:
Opportunity cost due to loss in sales as prospective clients go somewhere
else and may never come back.
Stock out situations may mean low productivity as employees sit idle and
yet the business has to meet that fixed cost of paying salaries irrespective.
Businesses, in avoiding such situations, prefer to carry a safety or minimum level
of inventory to ensure that they will not run out. This would be the permanent level
of stock in a business. You will appreciate how discouraging it is to walk into a
business with empty shelves. For a shop to have that respectability it must carry a
certain level of permanent stock. This must not be allowed to fall below a certain
figure.
Financial Skills For Small Business: Learner Guide
Copyright BANK SETA Financial Skills Workshop 71
C. Cash or bank overdraft
We have combined the cash and bank overdraft component, because in practice
the management thereof will fall under the auspices of one person or role in a
business, usually a finance person.
People that manage working capital should be sensitive to the fact that there are
costs involved in holding too much cash, too little or no cash at all, in which case
the business would go into an overdraft position. What it means is that cash
flowing in and out of the business should be watched very carefully to avoid
unnecessary cash shortages or surpluses.
D. Consequences of excessive cash
Working capital funds cannot be placed in a high interest earning account,
because most result in the cash not being readily available. You usually have to
give notice, which is not always possible, as funds may be needed immediately.
What it means is that your extra cash sits in a low interest earning bank account.
The interest earned is almost negligible, meaning a lower return on assets for the
business.
E. Consequences of insufficient cash
If a business carries insufficient cash, it may be forced to borrow to meet its short-
term obligations. The costs will be interest payable on borrowed funds, for
example, an overdraft facility. This interest obligation becomes even higher when
the facility is exceeded through the payment of penalty interest. It becomes a
danger for a business:
when reliance on an overdraft becomes a norm due to inefficient cash
management,
and when interest rates are rising.
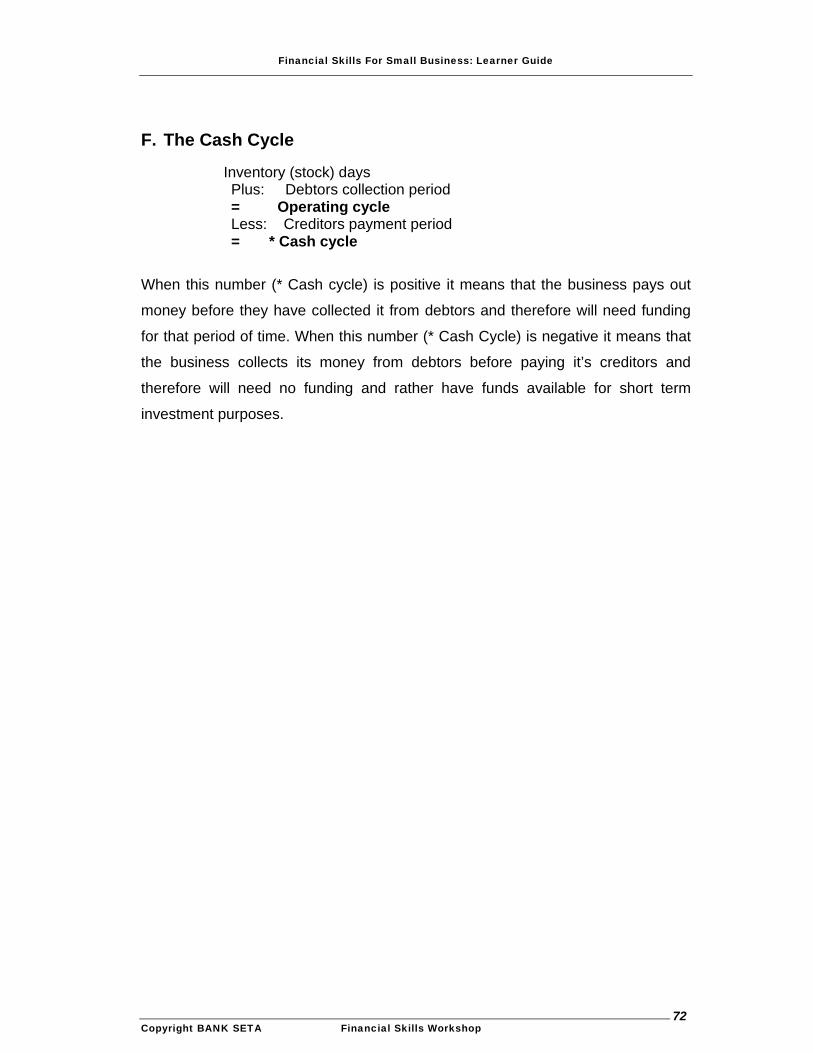
Financial Skills For Small Business: Learner Guide
Copyright BANK SETA Financial Skills Workshop 72
F. The Cash Cycle
Inventory (stock) days Plus: Debtors collection period = Operating cycle Less: Creditors payment period = * Cash cycle
When this number (* Cash cycle) is positive it means that the business pays out
money before they have collected it from debtors and therefore will need funding
for that period of time. When this number (* Cash Cycle) is negative it means that
the business collects its money from debtors before paying it’s creditors and
therefore will need no funding and rather have funds available for short term
investment purposes.
Financial Skills For Small Business: Learner Guide
Copyright BANK SETA Financial Skills Workshop 73
4.SUMMARY
Make your own summaries
here……..
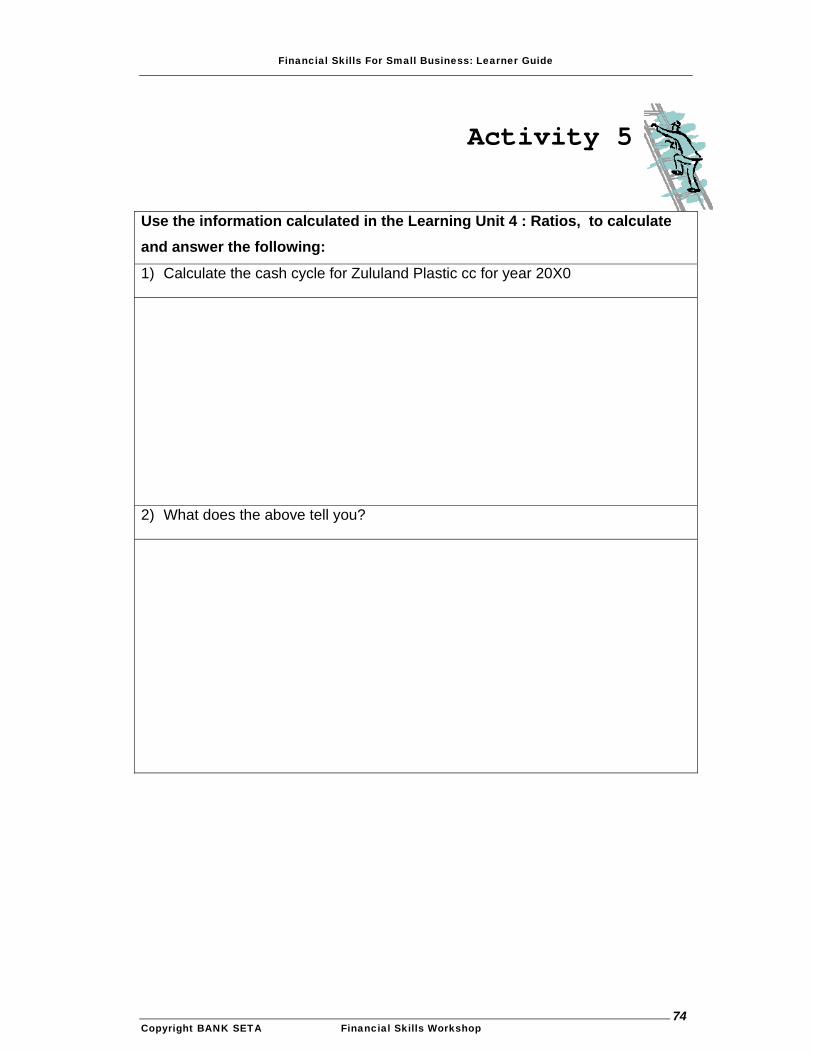
Financial Skills For Small Business: Learner Guide
Copyright BANK SETA Financial Skills Workshop 74
Activity 5
Use the information calculated in the Learning Unit 4 : Ratios, to calculate and answer the following:
1) Calculate the cash cycle for Zululand Plastic cc for year 20X0
2) What does the above tell you?
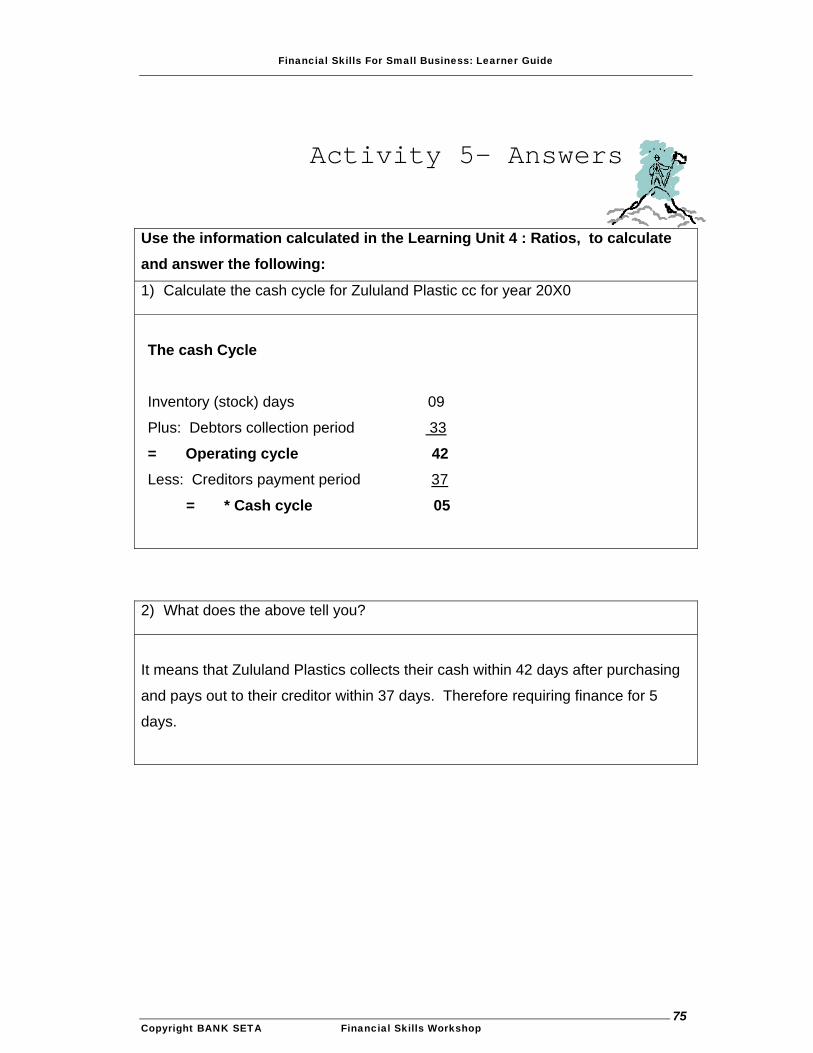
Financial Skills For Small Business: Learner Guide
Copyright BANK SETA Financial Skills Workshop 75
Activity 5– Answers
Use the information calculated in the Learning Unit 4 : Ratios, to calculate and answer the following:
1) Calculate the cash cycle for Zululand Plastic cc for year 20X0
The cash Cycle
Inventory (stock) days 09
Plus: Debtors collection period 33
= Operating cycle 42
Less: Creditors payment period 37
= * Cash cycle 05
2) What does the above tell you?
It means that Zululand Plastics collects their cash within 42 days after purchasing
and pays out to their creditor within 37 days. Therefore requiring finance for 5
days.
Financial Skills For Small Business: Learner Guide
Copyright BANK SETA Financial Skills Workshop 76
LEARNING UNIT SIX
THE GROWING SMALL BUSINESS
SPECIFIC OUTCOMES
In this learning unit, you will be able to :
Define the term “overtrading”;
Identify the signs of overtrading in a small business;
Predict the effects of overtrading on a small business.
….in order to successfully analyse the financial performance of a small business.
Financial Skills For Small Business: Learner Guide
Copyright BANK SETA Financial Skills Workshop 77
1.ANALYSING A SMALL BUSINESS’ GROWTH
PATTERN
A very common experience for bankers when doing financial analysis in the case
of credit risk assessment business applications is to come across the problem of
OVERTRADING.
A. What is Overtrading?
This simply means that the business has too few resources for the turnover, it is
trying to achieve, i.e. it is to maintain a certain scale of operation with insufficient
capital, equipment, etc. It is especially noticeable amongst small to medium sized
fast growing businesses.
It is often experienced that businesses tend to believe that rapid growth and
expansion is the ultimate sign of success. The sad side of this problem is that it is
actually very common to find the very successful businesses operating on a
smaller scale, often to be the ones that run into serious financial difficulties due to
excessive growth and expansion.
When a business overtrades in this way it can be compared to an individual who
constantly strives for a higher lifestyle, but does not have the financial means to
maintain it. It often happens that businesses initiate the problem of future
overtrading during times of prosperity. The severe cash shortages experienced
due to uncontrolled growth and expansion cannot be solved by further contracts
and new business ventures.
Financial Skills For Small Business: Learner Guide
Copyright BANK SETA Financial Skills Workshop 78
B. What are the Effects or Results of Overtrading?
The main effect is that of a shortage of cash, but it will manifest itself in the
following problem areas:
Difficulties to pay wages and salaries.
Pressure on debtors to pay sooner and this can be harmful to customer
relations
Difficulties to pay creditors and in the process the obtaining of goods and
services for purposes of trade and manufacturing, can be negatively
effected.
Special schemes and high interest, unsecured loans are sure signs of
problems with cash flows.
Selling inventory at huge discount to obtain cash.
Inability to replace old and worn-out machinery and equipment will lead to
inefficiency and the eventual loss of customers.
C. What are the Signs of Overtrading when doing a Financial Analysis?
During the process of doing a financial analysis of the business, the following
signs could be pointers in the direction of overtrading:
When the debtor’s collection period is becoming shorter and the creditor’s
payment period longer. A strong trend in this direction must always be of
concern to the analysis especially if the change is quite rapid.
A sharp increase in revenue, turnover, production with no corresponding
increase in the level of working capital.
A trend of decreasing net profit margins, due to increase expenses. If
overtrading continues for a time the gross profit margins will also begin to
decline at a later stage.
Selling of fixed assets to obtain cash resources.
Financial Skills For Small Business: Learner Guide
Copyright BANK SETA Financial Skills Workshop 79
Sharp increase in loans and borrowing from the bank, inventory and
accounts payable without an increase in turnover.
A sharp decline in generating cash resources as seen in the cash flow
statement.
Management’s attitude of “selling at all cost”.
Financial Skills For Small Business: Learner Guide
Copyright BANK SETA Financial Skills Workshop 80
2. SUMMARY
Make your own summaries
here……..
Financial Skills For Small Business: Learner Guide
Copyright BANK SETA Financial Skills Workshop 81
Activity 6
1) Describe in your own words what overtrading means
2) What are the effects/ results of overtrading?
3) What are the signs of overtrading when doing a financial analysis?
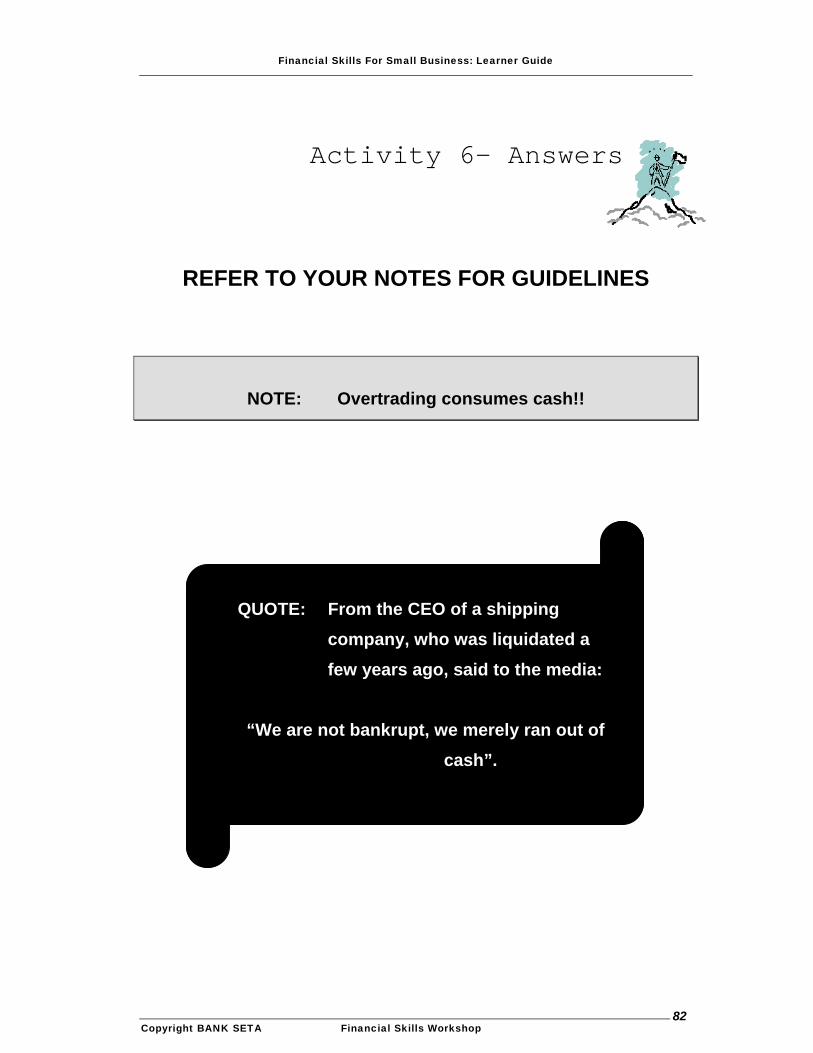
Financial Skills For Small Business: Learner Guide
Copyright BANK SETA Financial Skills Workshop 82
Activity 6– Answers
REFER TO YOUR NOTES FOR GUIDELINES
NOTE: Overtrading consumes cash!!
QUOTE: From the CEO of a shipping
company, who was liquidated a
few years ago, said to the media: “We are not bankrupt, we merely ran out of
cash”.