Embed Size (px)
Citation preview
Financial stability report2007:1
24 May 2007

CHAPTER 1Financial markets
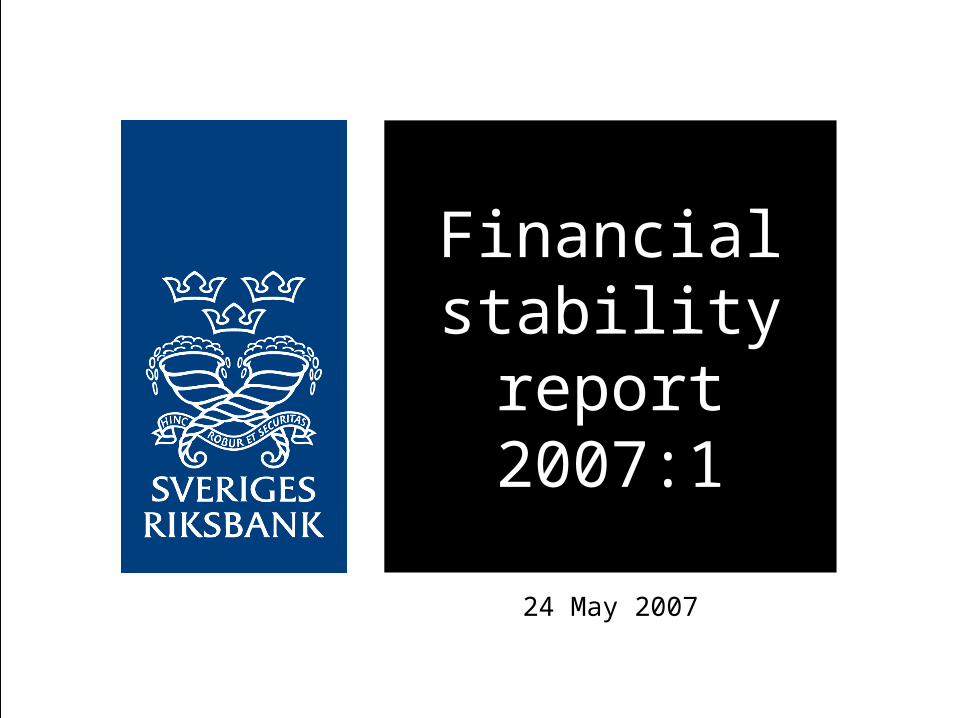
Ten-year government bond ratesPer cent
Chart 1:1 Source: Reuters EcoWin
2
3
4
5
6
7
jan-00 jan-01 jan-02 jan-03 jan-04 jan-05 jan-06 jan-07 jan-08
Sweden Germany USA
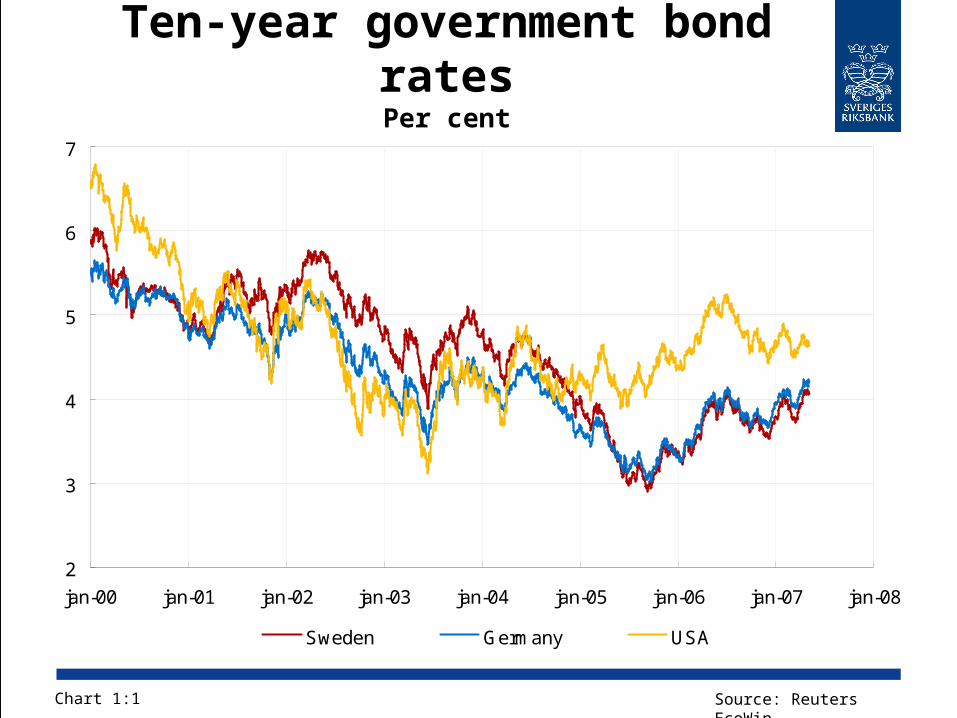
Stock marketsIndex, 2 January 2002 = 100
Chart 1:2 Source: Reuters EcoWin
0
40
80
120
160
200
jan-00 jan-01 jan-02 jan-03 jan-04 jan-05 jan-06 jan-07
Sweden - OMXS30 Europe - Stoxx USA - S&P 500
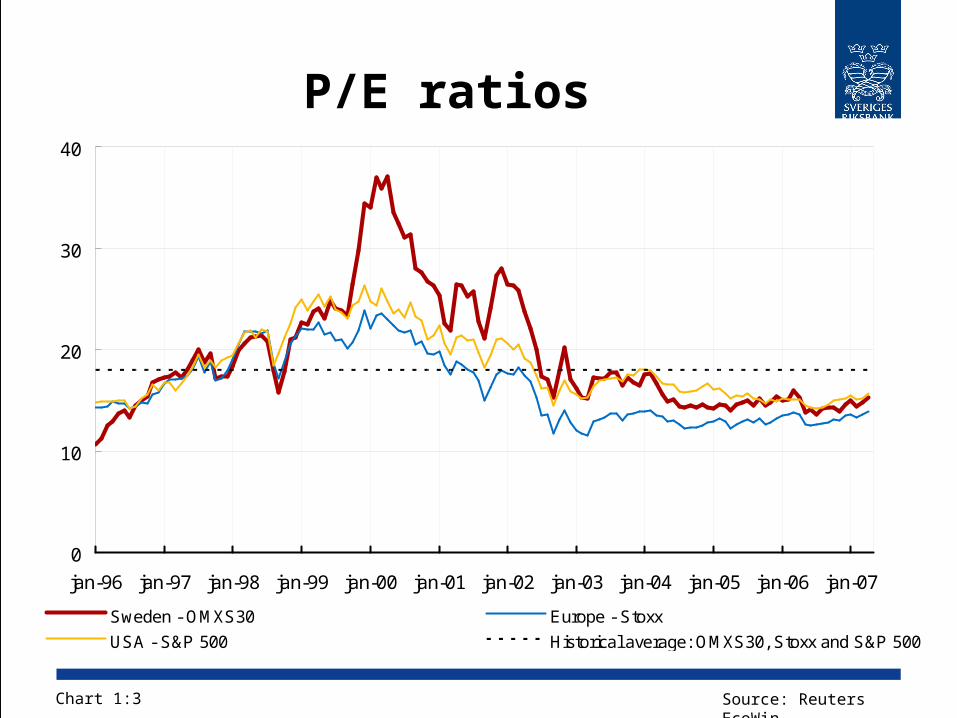
P/E ratios
Chart 1:3 Source: Reuters EcoWin
0
10
20
30
40
jan-96 jan-97 jan-98 jan-99 jan-00 jan-01 jan-02 jan-03 jan-04 jan-05 jan-06 jan-07
Sweden - OMXS30 Europe - Stoxx
USA - S&P 500 Historical average: OMXS30, Stoxx and S&P 500
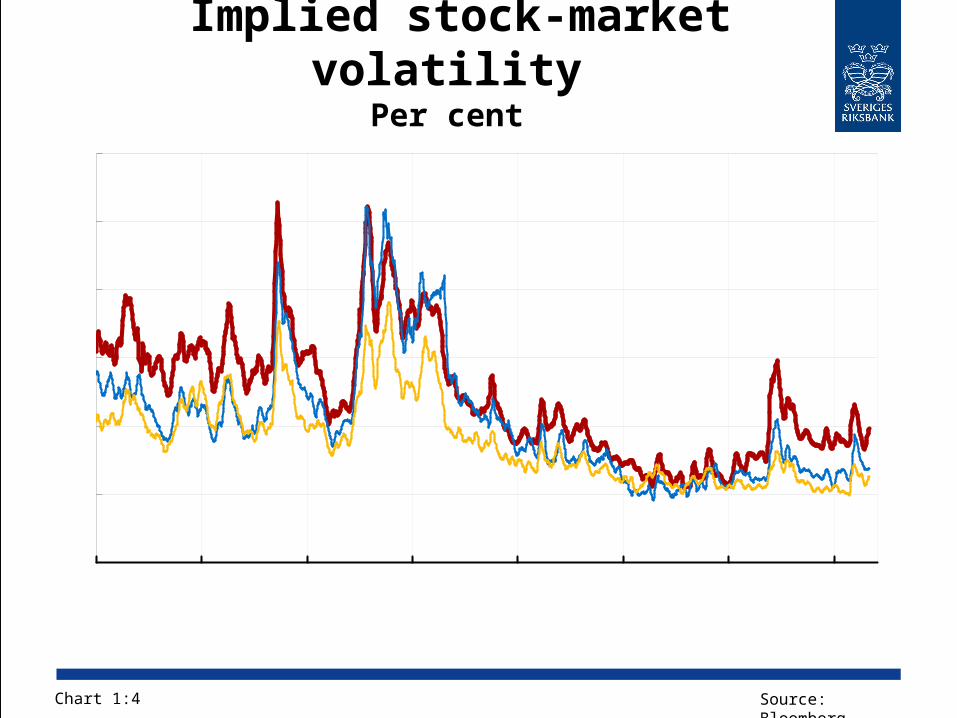
Implied stock-market volatility
Per cent
Chart 1:4 Source: Bloomberg
0
10
20
30
40
50
60
jan-00 jan-01 jan-02 jan-03 jan-04 jan-05 jan-06 jan-07
Sweden - OMXS30 Europa - StoxxUSA - S&P 500 Historical average, OMXS30
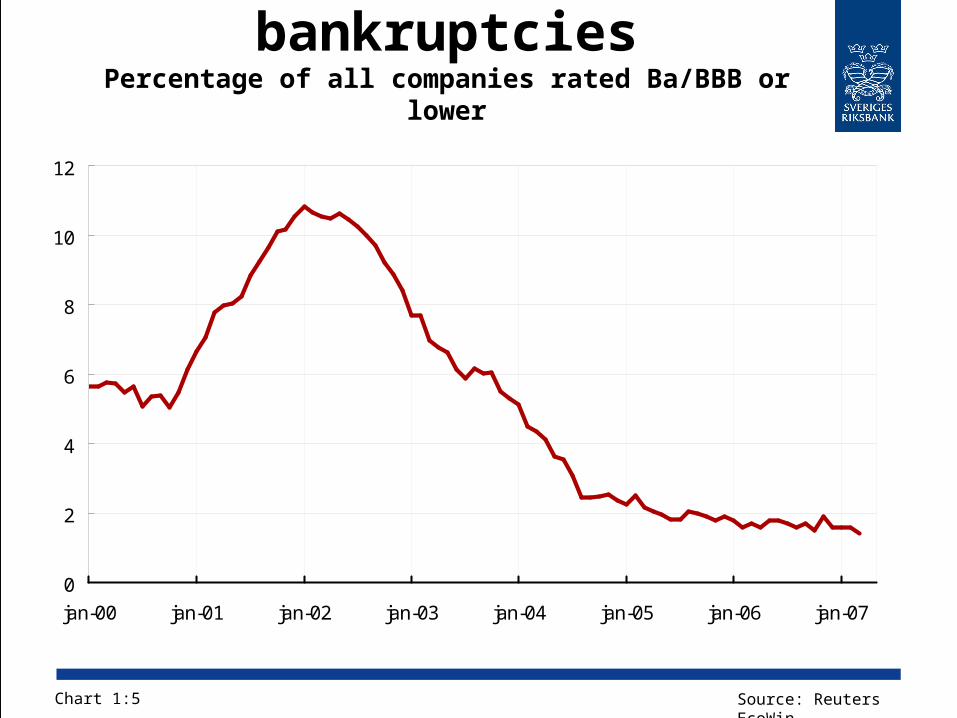
Global level of bankruptcies
Percentage of all companies rated Ba/BBB or lower
Chart 1:5 Source: Reuters EcoWin
0
2
4
6
8
10
12
jan-00 jan-01 jan-02 jan-03 jan-04 jan-05 jan-06 jan-07
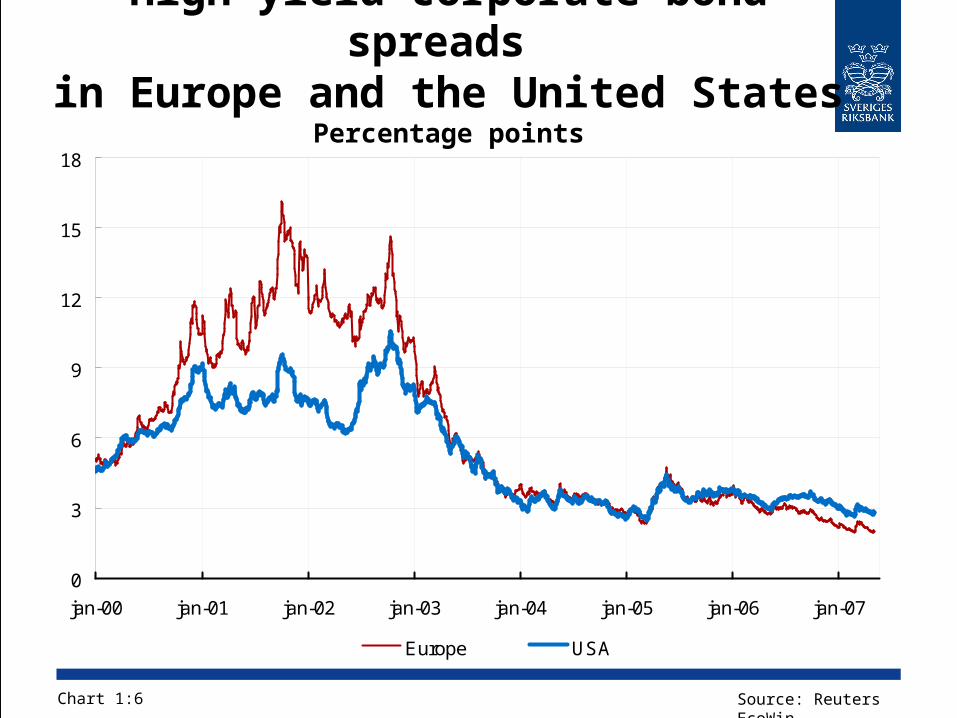
High-yield corporate bond spreads
in Europe and the United StatesPercentage points
Chart 1:6 Source: Reuters EcoWin
0
3
6
9
12
15
18
jan-00 jan-01 jan-02 jan-03 jan-04 jan-05 jan-06 jan-07
Europe USA
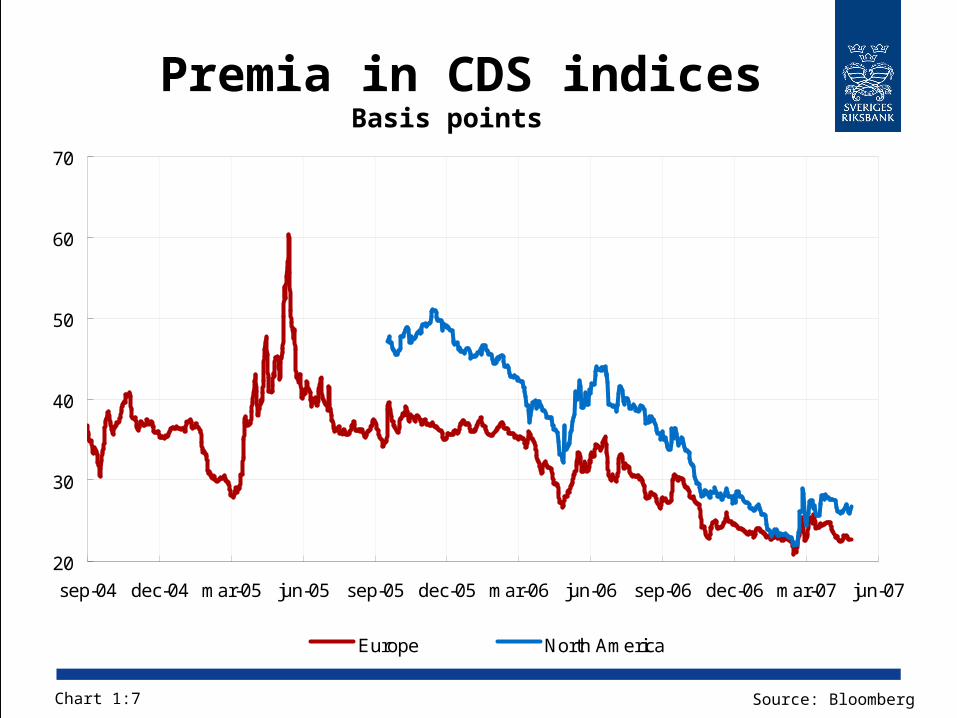
Premia in CDS indicesBasis points
Chart 1:7 Source: Bloomberg
20
30
40
50
60
70
sep-04 dec-04 mar-05 jun-05 sep-05 dec-05 mar-06 jun-06 sep-06 dec-06 mar-07 jun-07
Europe North America
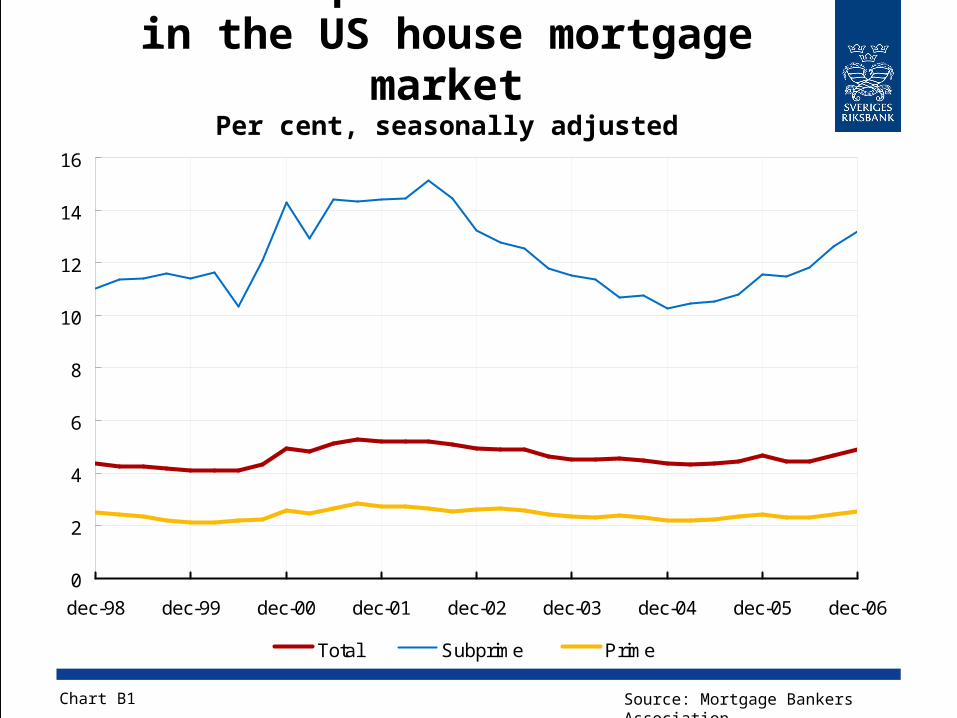
Households with payment problems
in the US house mortgage market
Per cent, seasonally adjusted
Chart B1 Source: Mortgage Bankers Association
0
2
4
6
8
10
12
14
16
dec-98 dec-99 dec-00 dec-01 dec-02 dec-03 dec-04 dec-05 dec-06
Total Subprime Prime

Premia for credit derivatives
on US house mortgage loansBasis points
Chart B2 Source: JP Morgan
0
400
800
1200
1600
2000
aug-06 sep-06 okt-06 nov-06 dec-06 jan-07 feb-07 mar-07 apr-07 maj-07 jun-07
Note. Loans classified as BBB?.Note. Loans classified as BBB−.
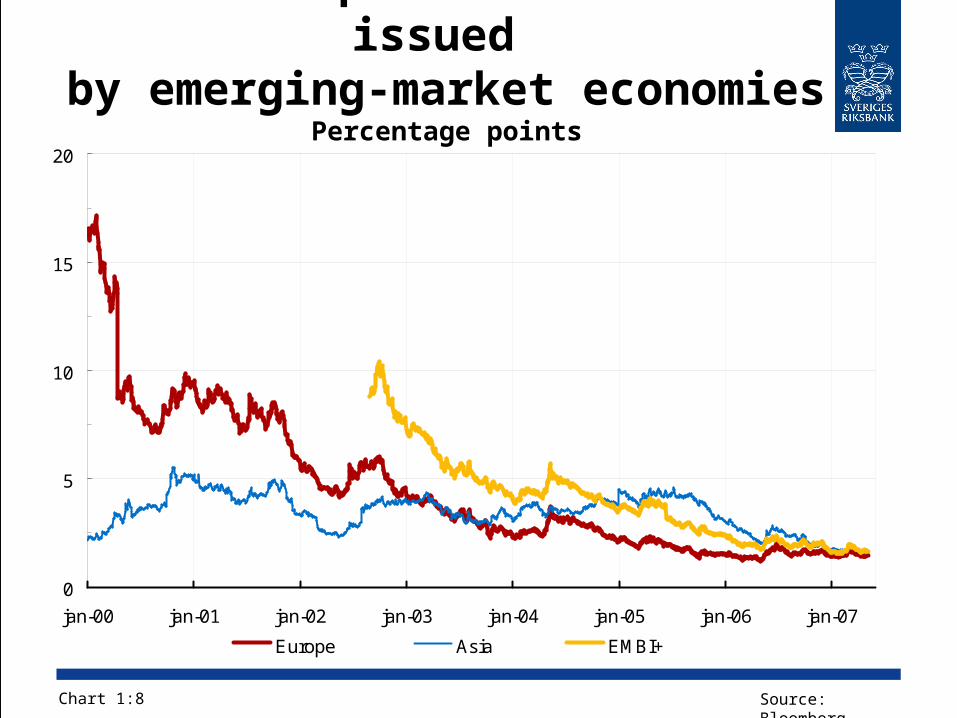
Credit spreads for bonds issued
by emerging-market economiesPercentage points
Chart 1:8 Source: Bloomberg
0
5
10
15
20
jan-00 jan-01 jan-02 jan-03 jan-04 jan-05 jan-06 jan-07
Europe Asia EMBI+
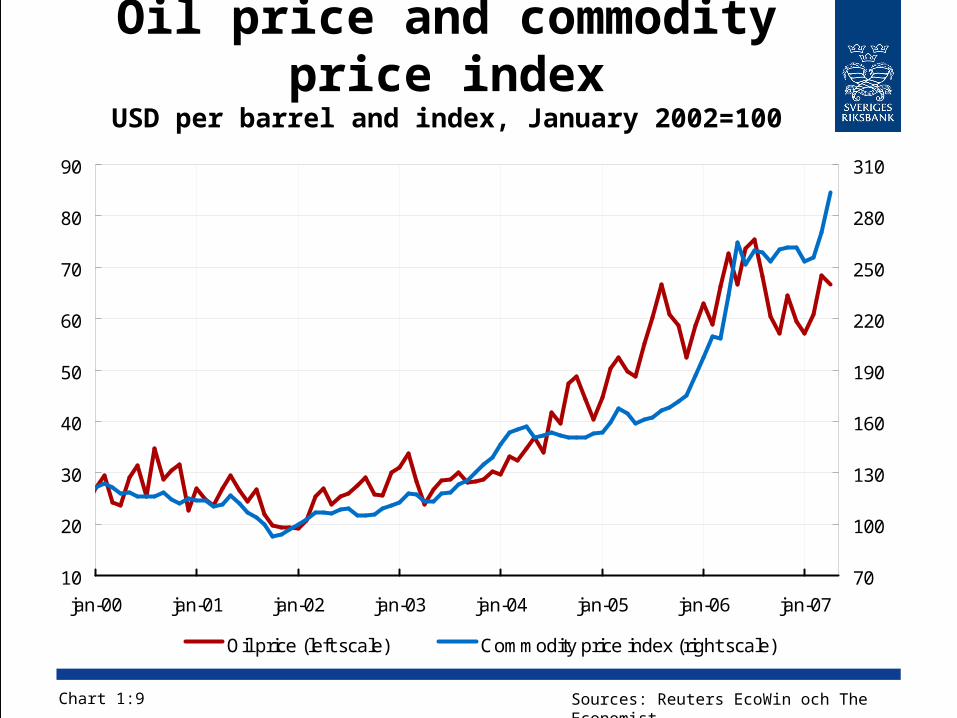
Oil price and commodity price index
USD per barrel and index, January 2002=100
Chart 1:9 Sources: Reuters EcoWin och The Economist
10
20
30
40
50
60
70
80
90
jan-00 jan-01 jan-02 jan-03 jan-04 jan-05 jan-06 jan-07
70
100
130
160
190
220
250
280
310
Oil price (left scale) Commodity price index (right scale)
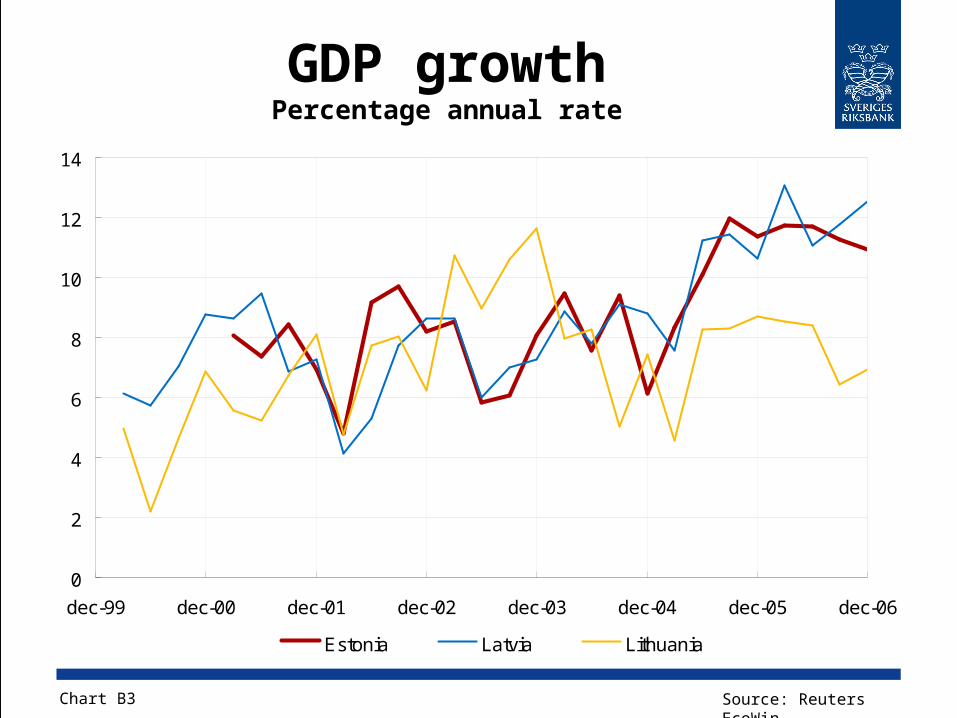
GDP growthPercentage annual rate
Chart B3 Source: Reuters EcoWin
0
2
4
6
8
10
12
14
dec-99 dec-00 dec-01 dec-02 dec-03 dec-04 dec-05 dec-06
Estonia Latvia Lithuania
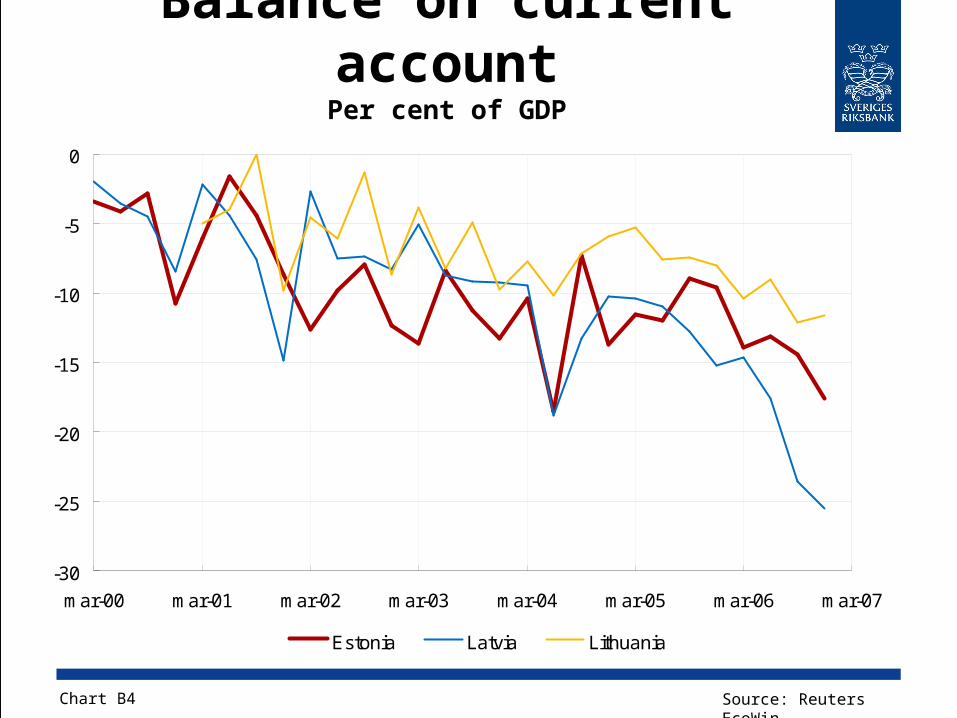
Balance on current accountPer cent of GDP
Chart B4 Source: Reuters EcoWin
-30
-25
-20
-15
-10
-5
0
mar-00 mar-01 mar-02 mar-03 mar-04 mar-05 mar-06 mar-07
Estonia Latvia Lithuania
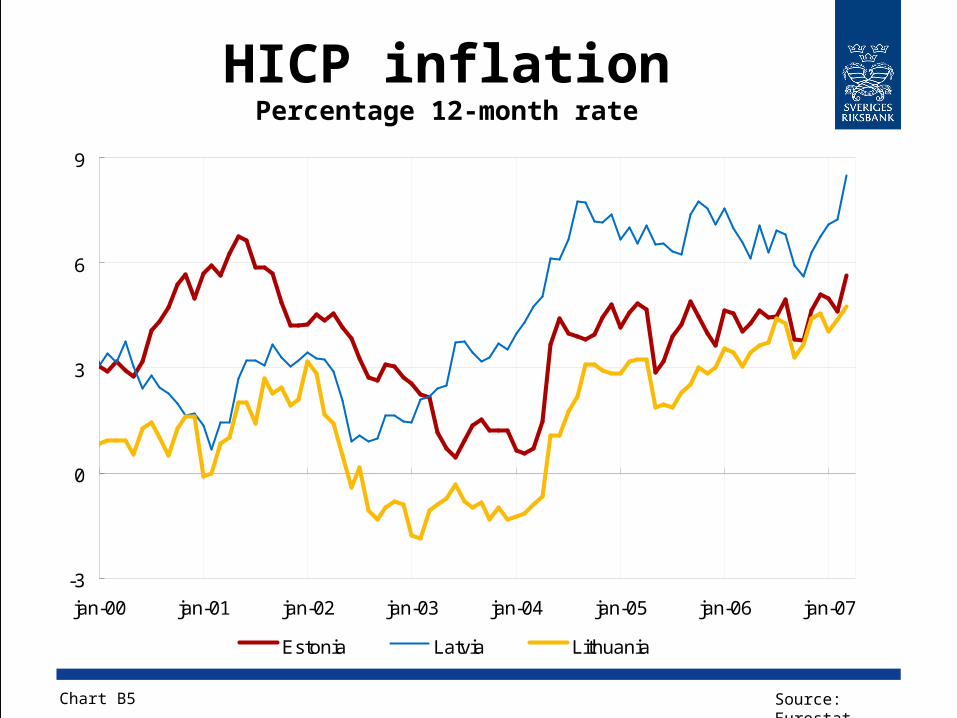
HICP inflationPercentage 12-month rate
Chart B5 Source: Eurostat
-3
0
3
6
9
jan-00 jan-01 jan-02 jan-03 jan-04 jan-05 jan-06 jan-07
Estonia Latvia Lithuania
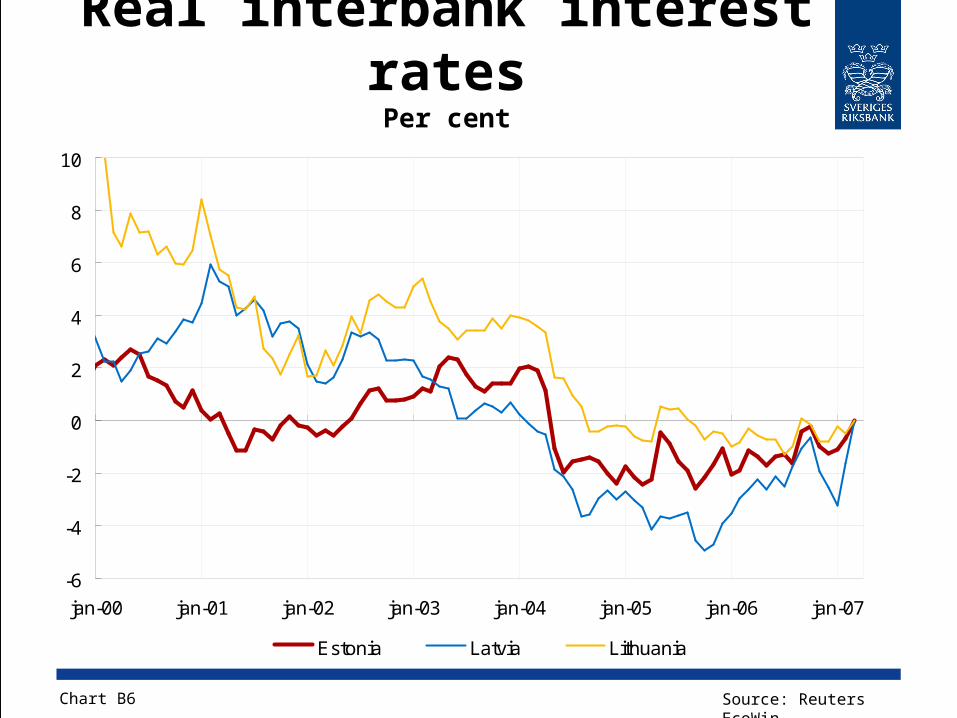
Real interbank interest ratesPer cent
Chart B6 Source: Reuters EcoWin
-6
-4
-2
0
2
4
6
8
10
jan-00 jan-01 jan-02 jan-03 jan-04 jan-05 jan-06 jan-07
Estonia Latvia Lithuania
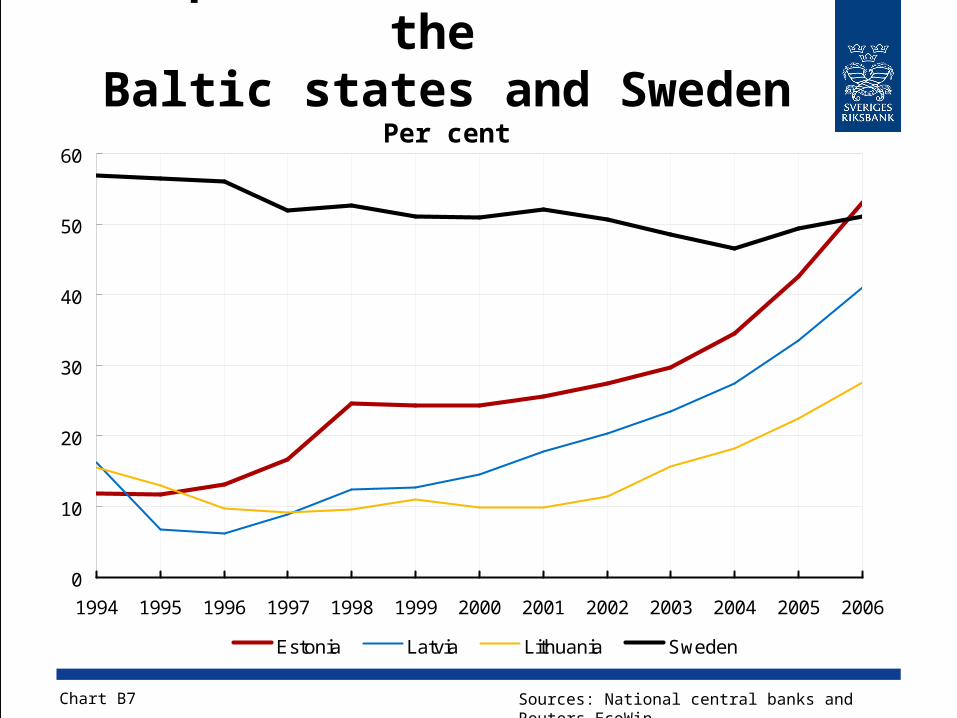
Corporate loan stocks in the
Baltic states and SwedenPer cent
Chart B7 Sources: National central banks and Reuters EcoWin
0
10
20
30
40
50
60
1994 1995 1996 1997 1998 1999 2000 2001 2002 2003 2004 2005 2006
Estonia Latvia Lithuania Sweden

Household sector loan stocks
in the Baltic states and Sweden
Per cent
Chart B8 Sources: National central banks and Reuters EcoWin
0
10
20
30
40
50
60
70
80
1994 1995 1996 1997 1998 1999 2000 2001 2002 2003 2004 2005 2006
Estonia Latvia Lithuania Sweden

CHAPTER 2The Swedish banks´
borrowers
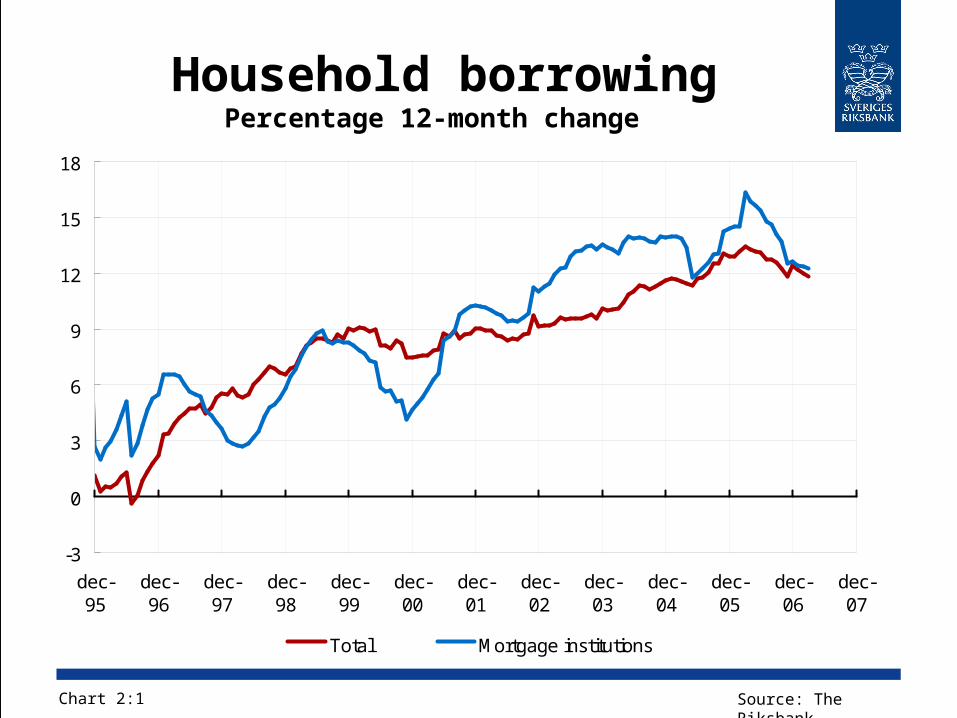
Household borrowingPercentage 12-month change
Chart 2:1 Source: The Riksbank
-3
0
3
6
9
12
15
18
dec-95
dec-96
dec-97
dec-98
dec-99
dec-00
dec-01
dec-02
dec-03
dec-04
dec-05
dec-06
dec-07
Total Mortgage institutions
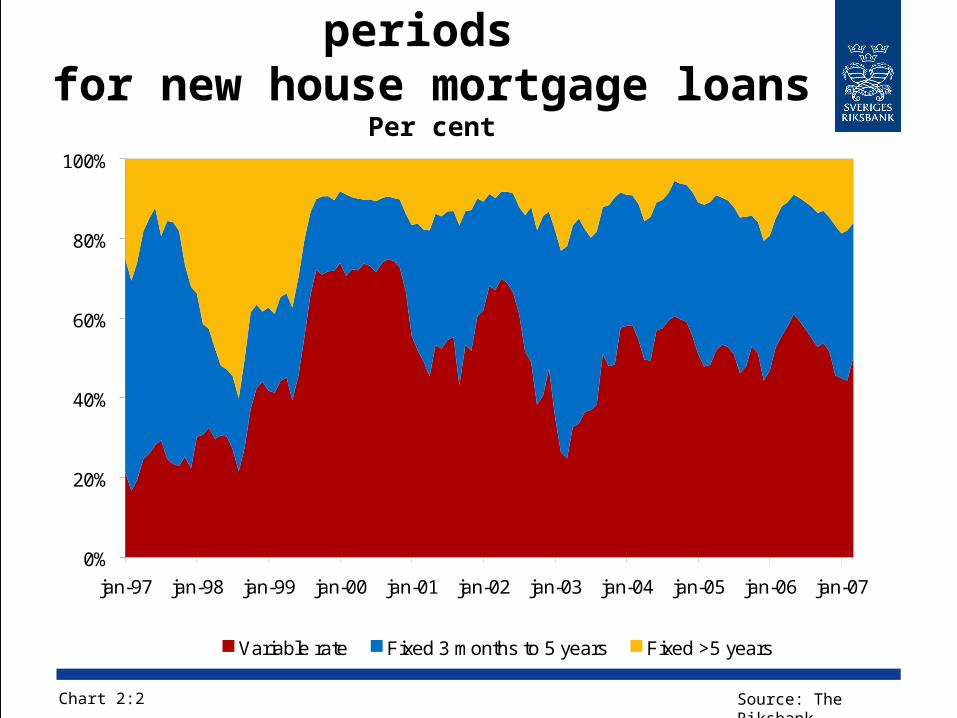
Duration of fixed interest periods
for new house mortgage loansPer cent
Chart 2:2 Source: The Riksbank
0%
20%
40%
60%
80%
100%
jan-97 jan-98 jan-99 jan-00 jan-01 jan-02 jan-03 jan-04 jan-05 jan-06 jan-07
Variable rate Fixed 3 months to 5 years Fixed >5 years
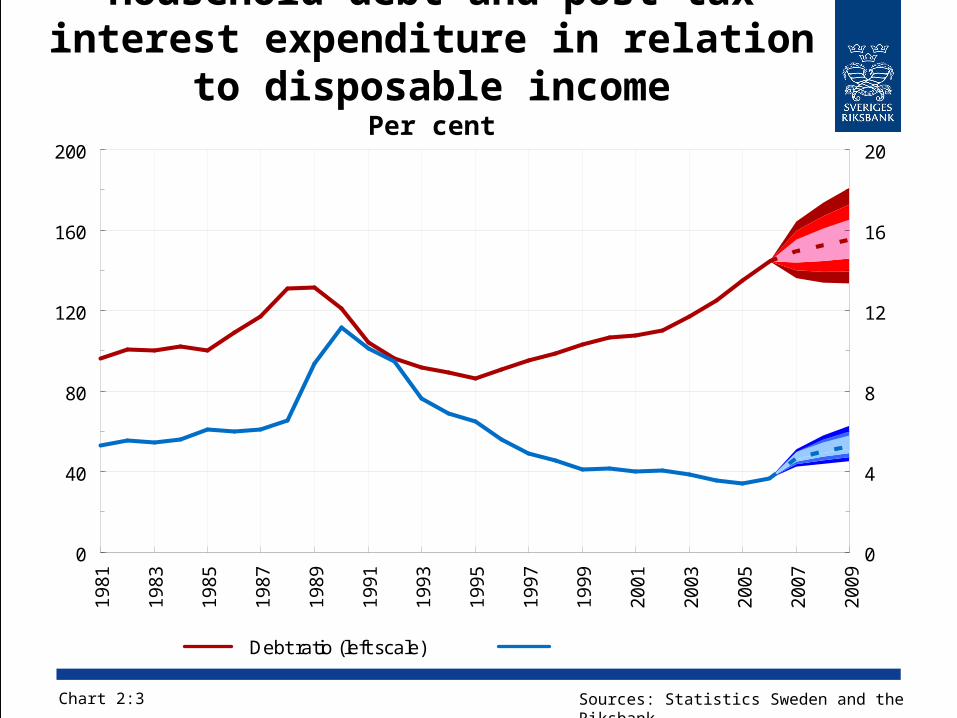
Household debt and post-tax interest expenditure in relation to
disposable incomePer cent
Chart 2:3 Sources: Statistics Sweden and the Riksbank
0
40
80
120
160
200
19
81
19
83
19
85
19
87
19
89
19
91
19
93
19
95
19
97
19
99
20
01
20
03
20
05
20
07
20
09
0
4
8
12
16
20
Debt ratio (left scale) Interest ratio (right scale)
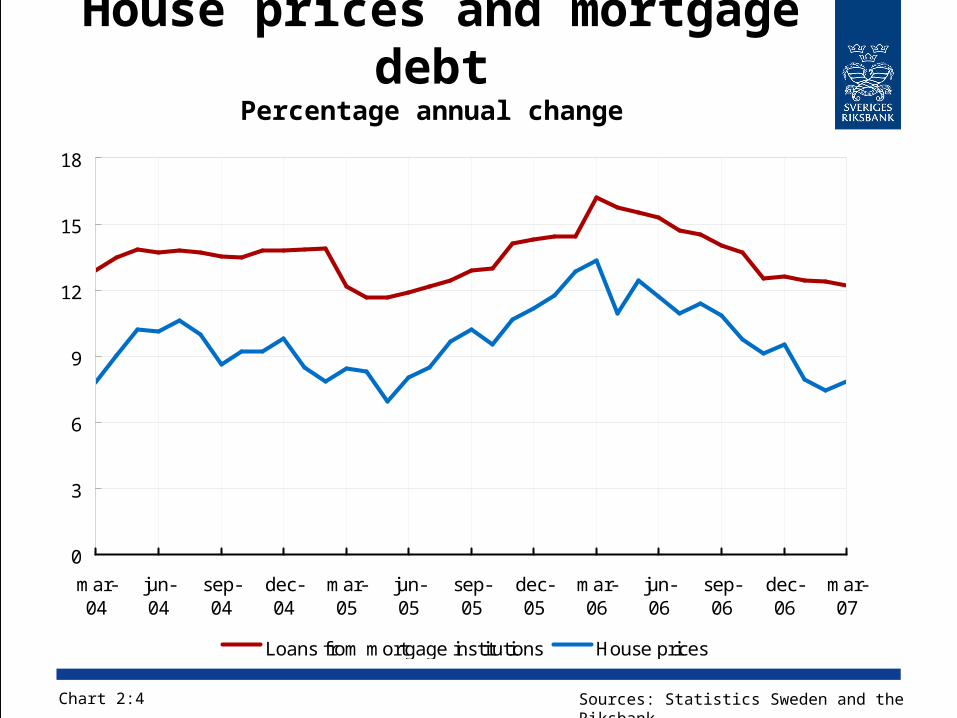
House prices and mortgage debt
Percentage annual change
Chart 2:4 Sources: Statistics Sweden and the Riksbank
0
3
6
9
12
15
18
mar-04
jun-04
sep-04
dec-04
mar-05
jun-05
sep-05
dec-05
mar-06
jun-06
sep-06
dec-06
mar-07
Loans from mortgage institutions House prices
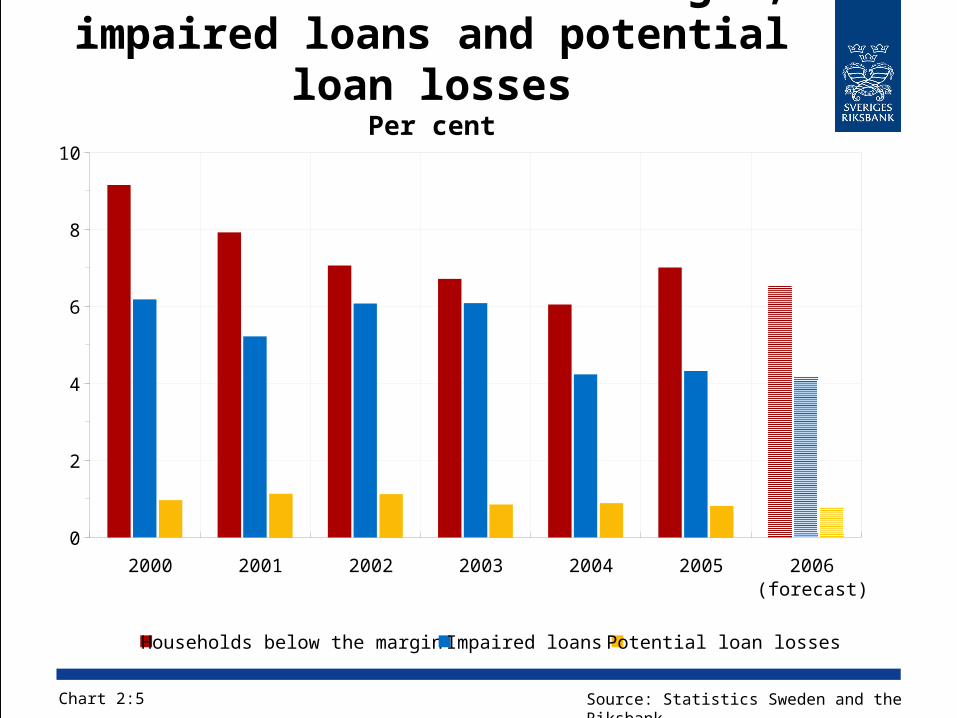
Households below the margin, impaired loans and potential
loan lossesPer cent
Chart 2:5 Source: Statistics Sweden and the Riksbank
0
2
4
6
8
10
2000 2001 2002 2003 2004 2005 2006(forecast)
Households below the margin Impaired loans Potential loan losses
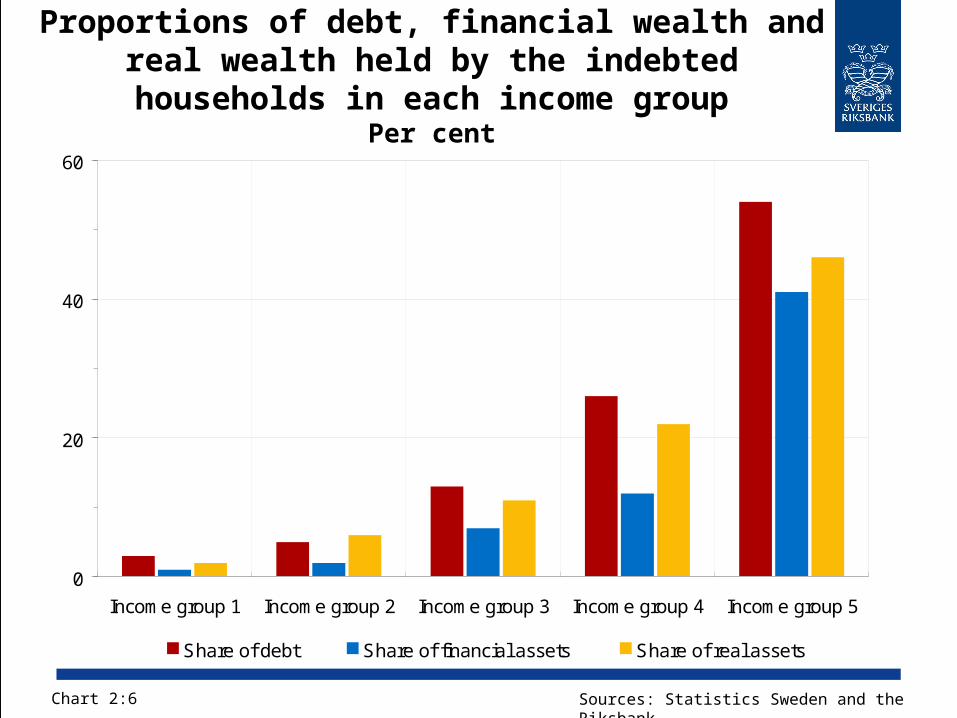
Proportions of debt, financial wealth and real wealth held by the indebted households
in each income groupPer cent
Chart 2:6 Sources: Statistics Sweden and the Riksbank
0
20
40
60
Income group 1 Income group 2 Income group 3 Income group 4 Income group 5
Share of debt Share of financial assets Share of real assets
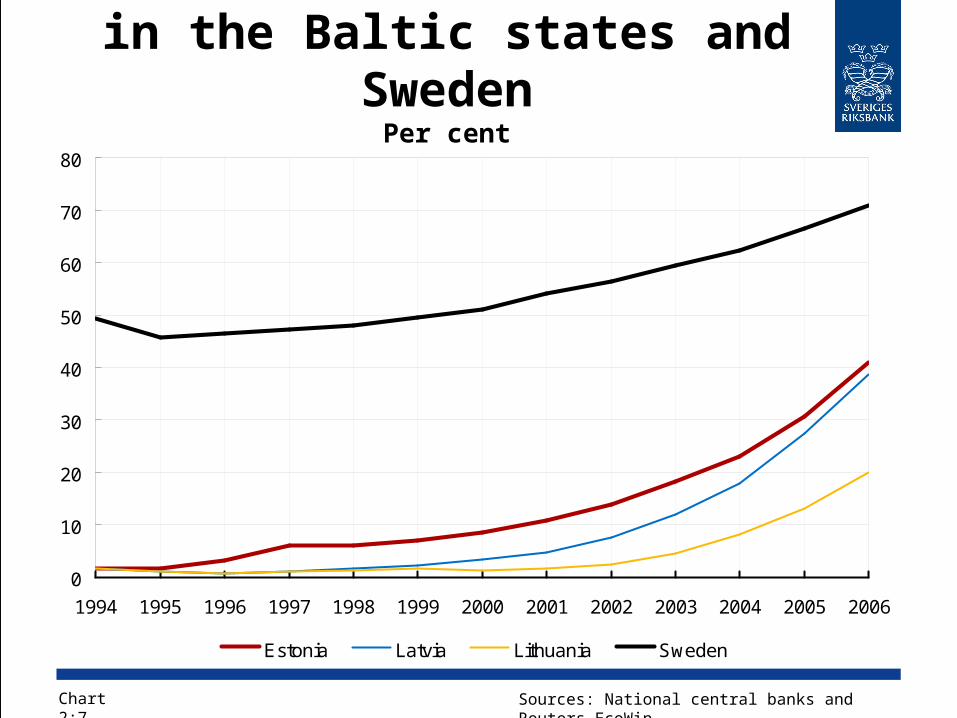
Household sector loan stocks
in the Baltic states and Sweden
Per cent
Chart 2:7 Sources: National central banks and Reuters EcoWin
0
10
20
30
40
50
60
70
80
1994 1995 1996 1997 1998 1999 2000 2001 2002 2003 2004 2005 2006
Estonia Latvia Lithuania Sweden
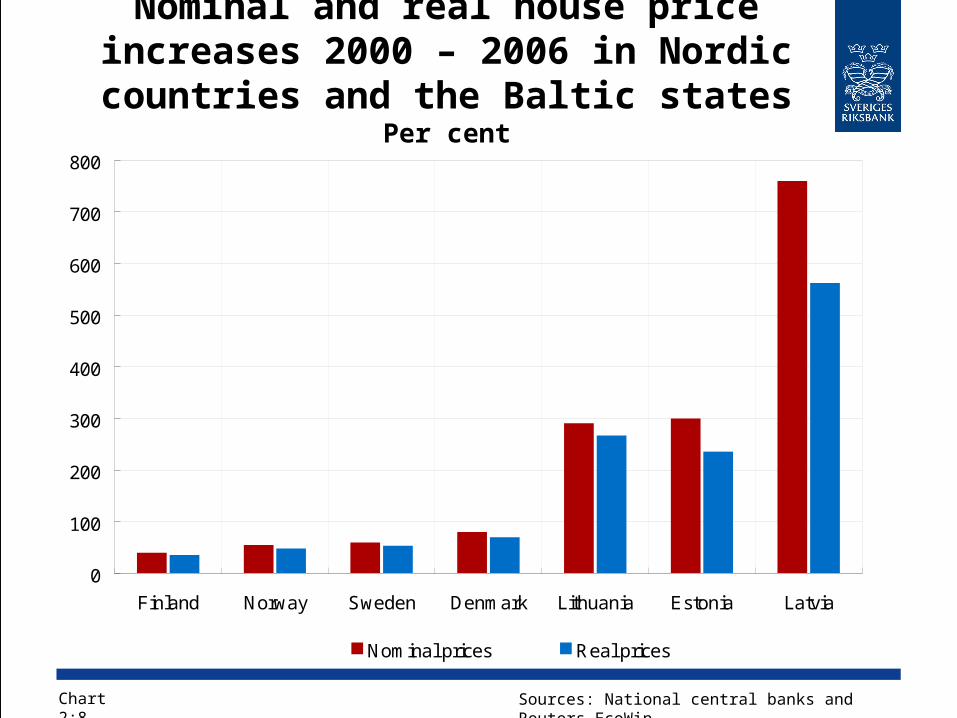
Nominal and real house price increases 2000 – 2006 in Nordic countries and the Baltic states
Per cent
Chart 2:8 Sources: National central banks and Reuters EcoWin
0
100
200
300
400
500
600
700
800
Finland Norway Sweden Denmark Lithuania Estonia Latvia
Nominal prices Real prices
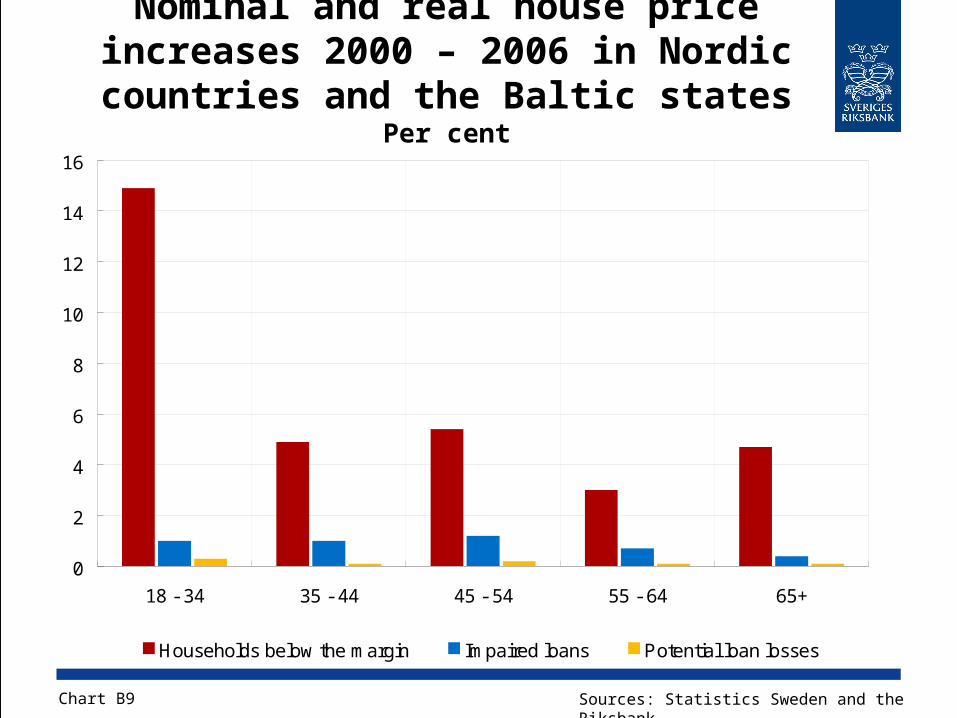
Nominal and real house price increases 2000 – 2006 in Nordic countries and the Baltic states
Per cent
Chart B9
0
2
4
6
8
10
12
14
16
18 - 34 35 - 44 45 - 54 55 - 64 65+
Households below the margin Impaired loans Potential loan losses
Sources: Statistics Sweden and the Riksbank
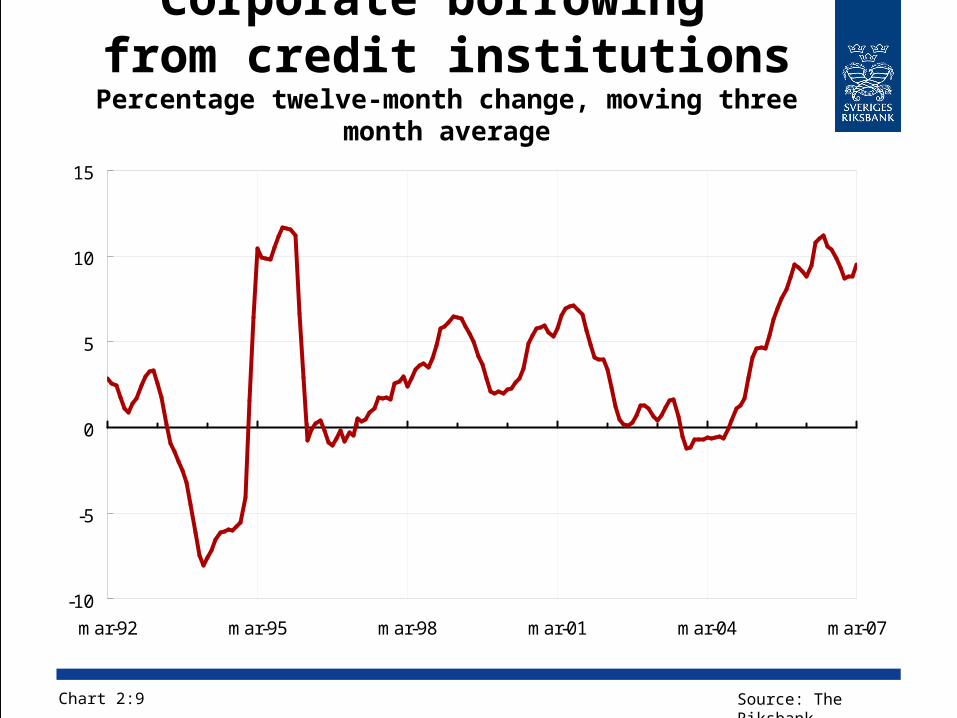
Corporate borrowing from credit institutions
Percentage twelve-month change, moving three month average
Chart 2:9 Source: The Riksbank
-10
-5
0
5
10
15
mar-92 mar-95 mar-98 mar-01 mar-04 mar-07
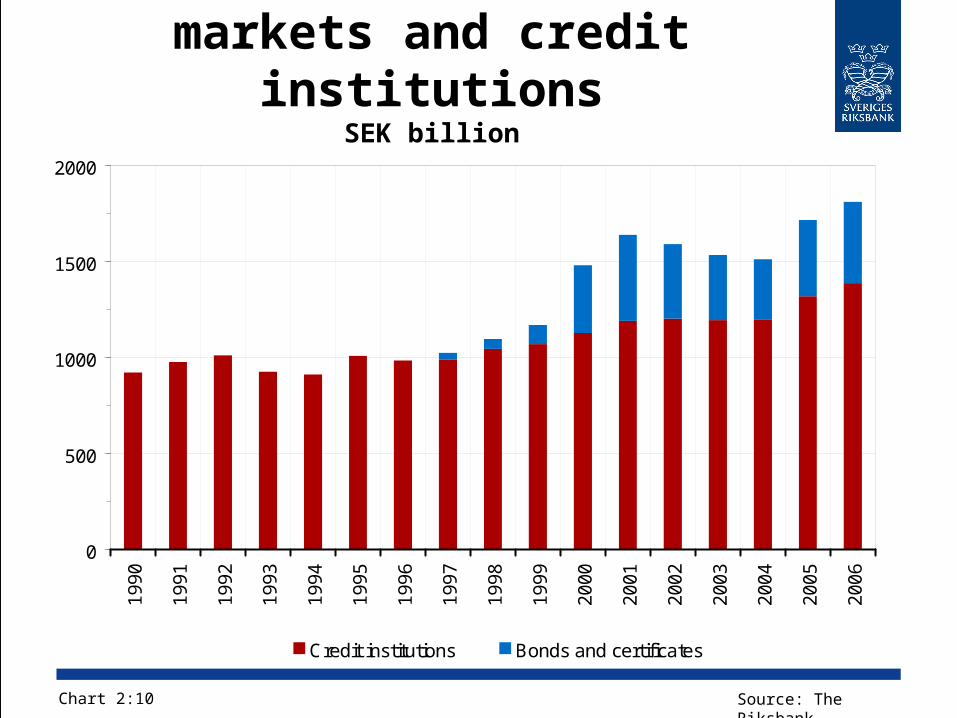
Corporate loans from securities
markets and credit institutions
SEK billion
Chart 2:10 Source: The Riksbank
0
500
1000
1500
2000
19
90
19
91
19
92
19
93
19
94
19
95
19
96
19
97
19
98
19
99
20
00
20
01
20
02
20
03
20
04
20
05
20
06
Credit institutions Bonds and certificates
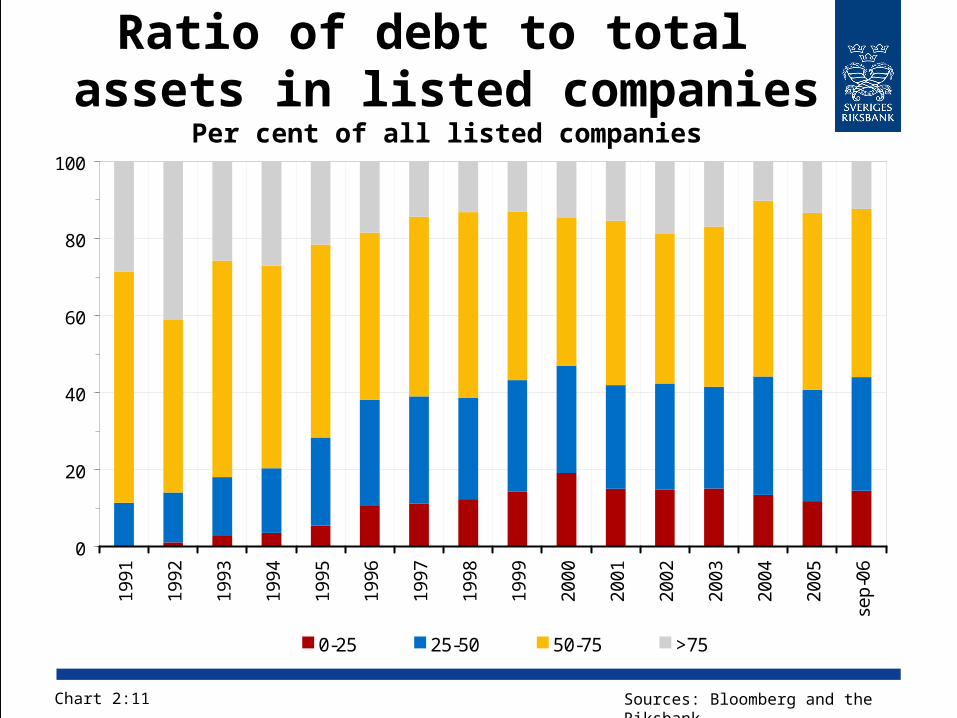
Ratio of debt to total assets in listed companies
Per cent of all listed companies
Chart 2:11 Sources: Bloomberg and the Riksbank
0
20
40
60
80
100
19
91
19
92
19
93
19
94
19
95
19
96
19
97
19
98
19
99
20
00
20
01
20
02
20
03
20
04
20
05
sep
-06
0-25 25-50 50-75 >75
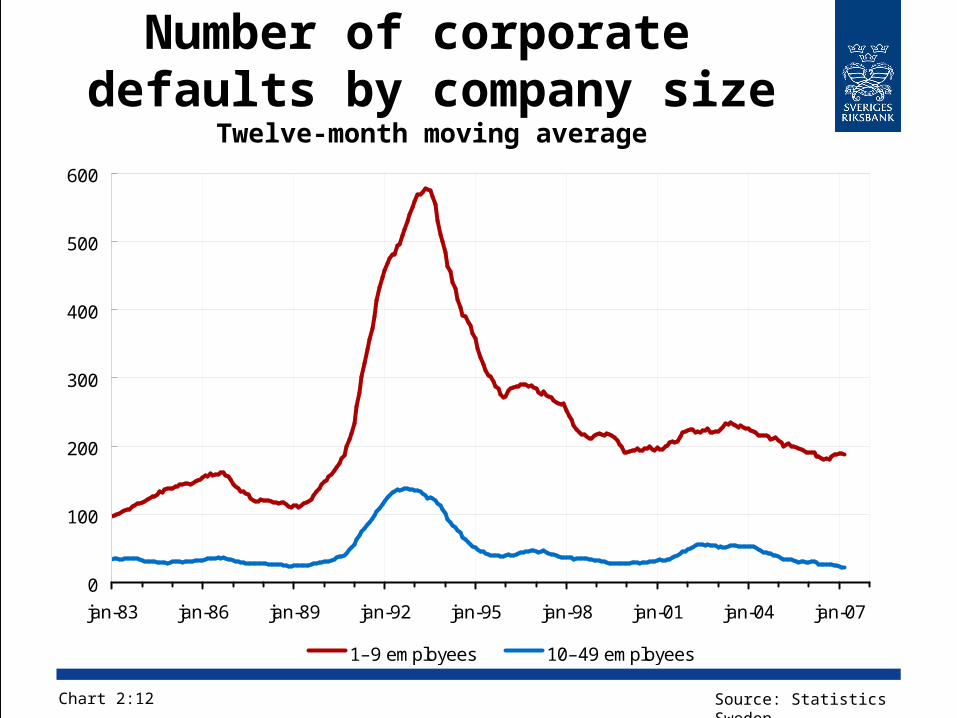
Number of corporate defaults by company size
Twelve-month moving average
Chart 2:12 Source: Statistics Sweden
0
100
200
300
400
500
600
jan-83 jan-86 jan-89 jan-92 jan-95 jan-98 jan-01 jan-04 jan-07
1–9 employees 10–49 employees
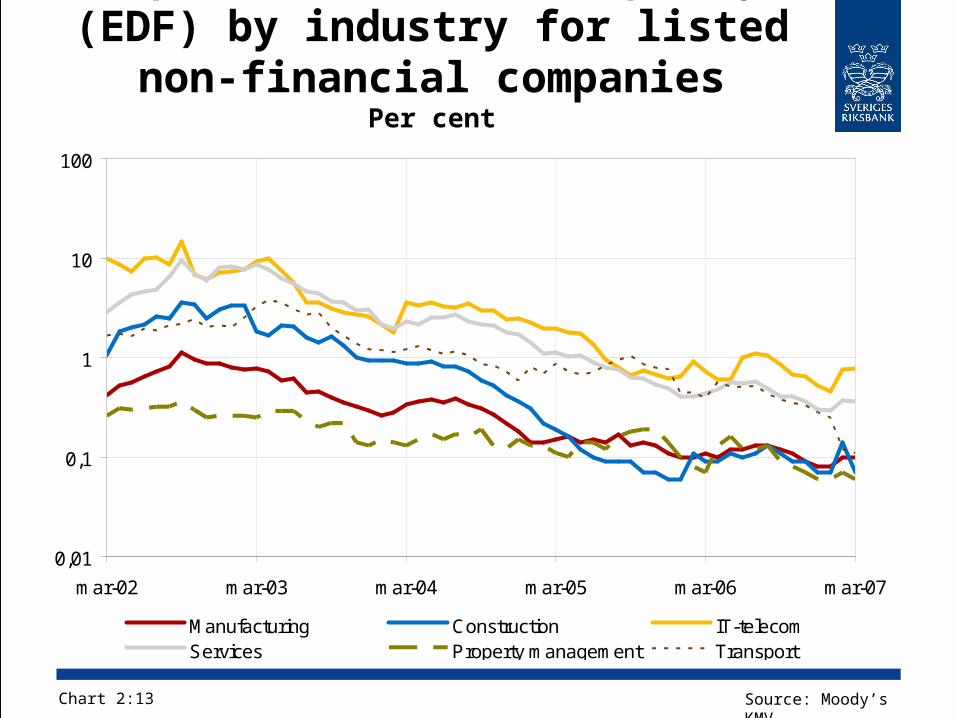
Expected default frequency (EDF) by industry for listed non-
financial companiesPer cent
Chart 2:13 Source: Moody’s KMV
0,01
0,1
1
10
100
mar-02 mar-03 mar-04 mar-05 mar-06 mar-07
Manufacturing Construction IT-telecomServices Property management Transport
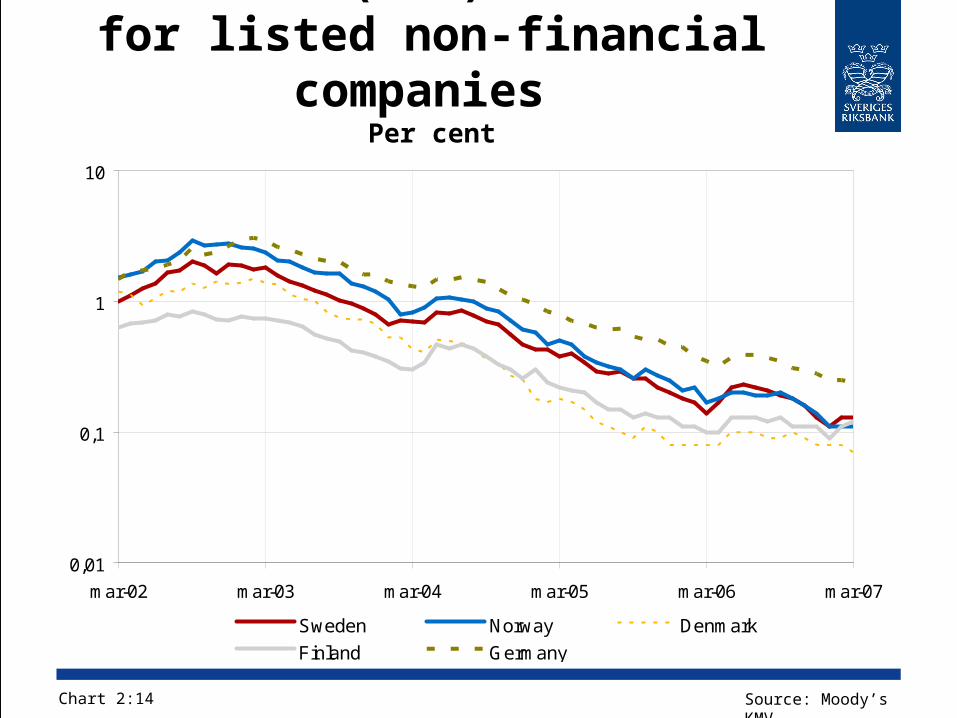
Expected default frequency (EDF)
for listed non-financial companies
Per cent
Chart 2:14 Source: Moody’s KMV
0,01
0,1
1
10
mar-02 mar-03 mar-04 mar-05 mar-06 mar-07
Sweden Norway Denmark
Finland Germany
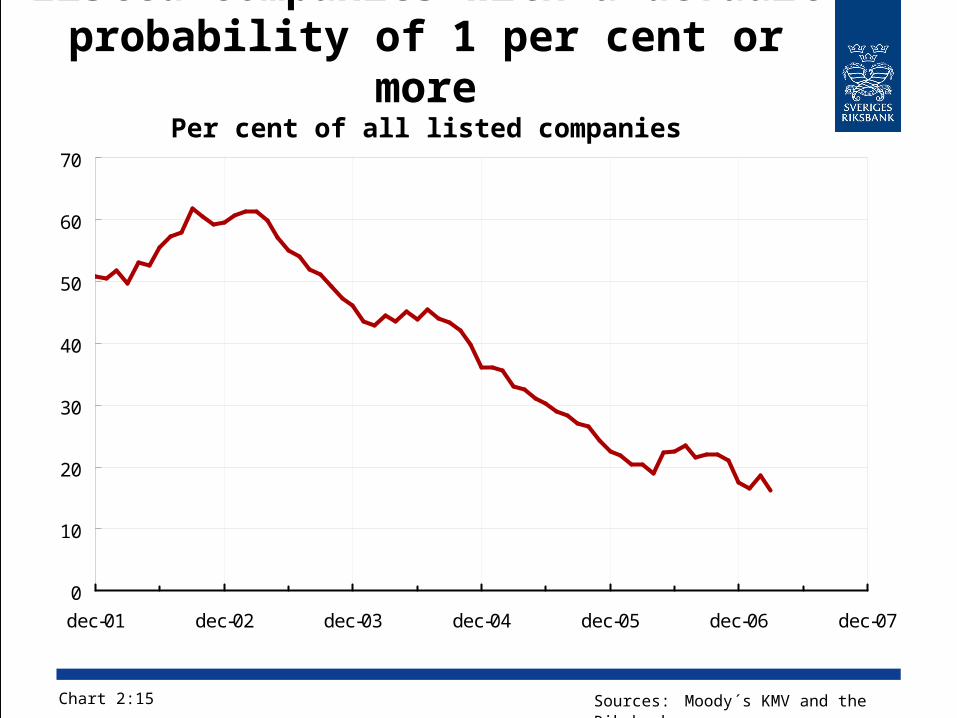
Listed companies with a default probability of 1 per cent or more
Per cent of all listed companies
Chart 2:15 Sources: Moody´s KMV and the Riksbank
0
10
20
30
40
50
60
70
dec-01 dec-02 dec-03 dec-04 dec-05 dec-06 dec-07
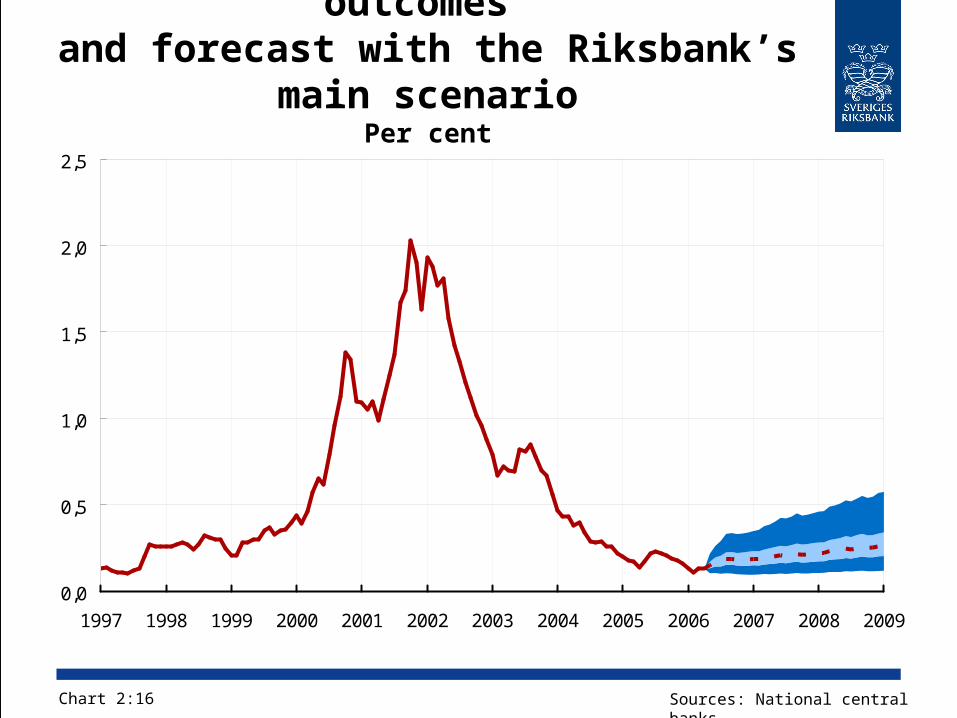
Expected default frequency (EDF), outcomes
and forecast with the Riksbank’s main scenario
Per cent
Chart 2:16 Sources: National central banks
0,0
0,5
1,0
1,5
2,0
2,5
1997 1998 1999 2000 2001 2002 2003 2004 2005 2006 2007 2008 2009
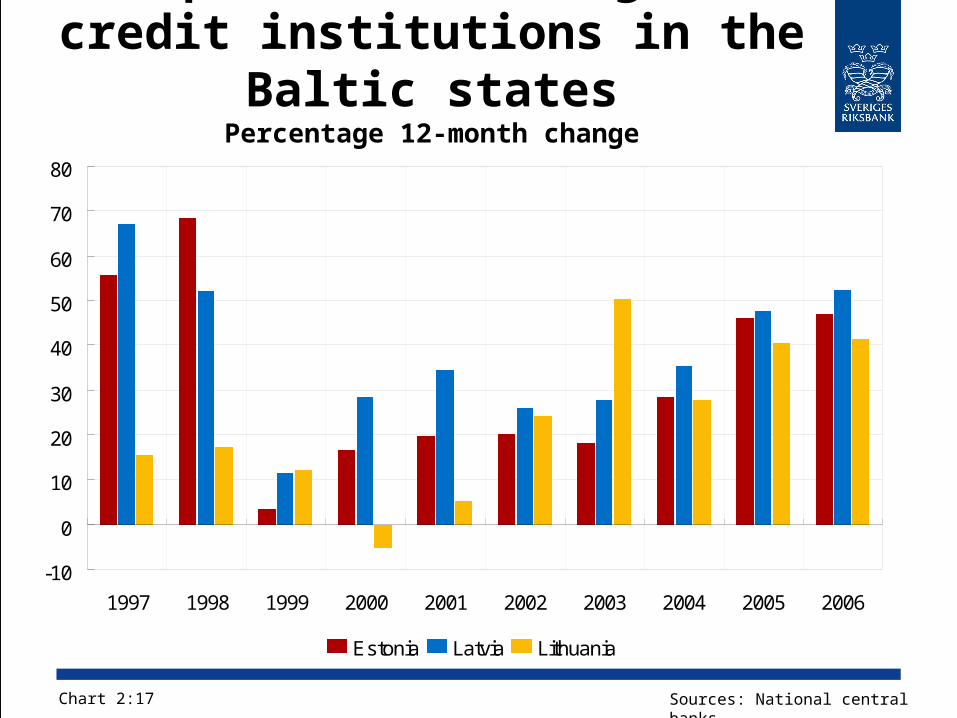
Corporate borrowing from credit institutions in the
Baltic statesPercentage 12-month change
Chart 2:17 Sources: National central banks
-10
0
10
20
30
40
50
60
70
80
1997 1998 1999 2000 2001 2002 2003 2004 2005 2006
Estonia Latvia Lithuania
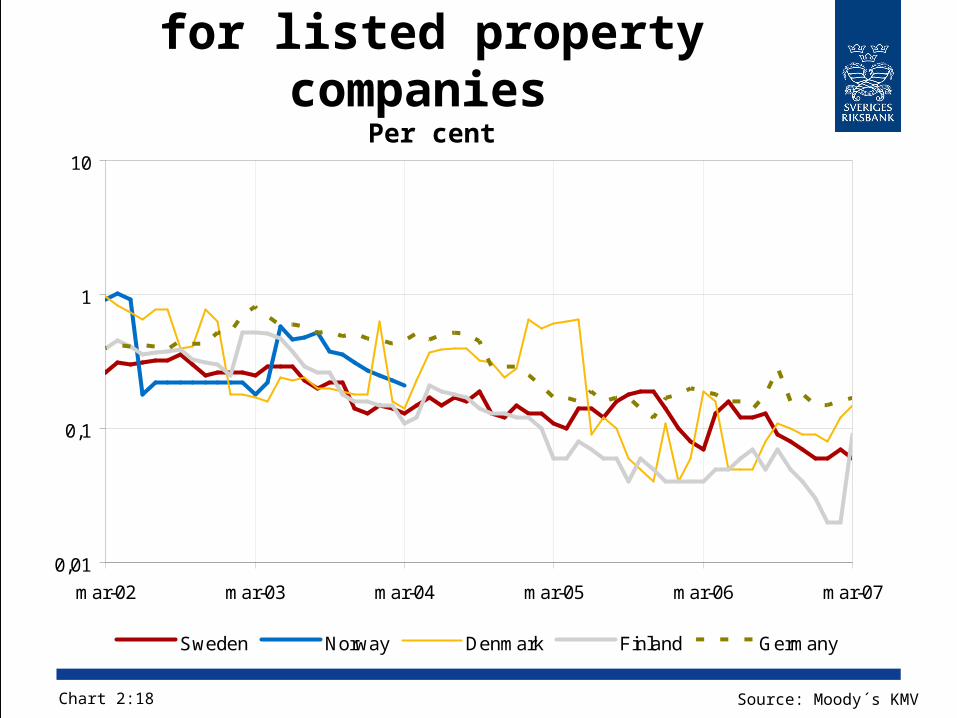
Expected default frequency (EDF)
for listed property companies
Per cent
Chart 2:18 Source: Moody´s KMV
0,01
0,1
1
10
mar-02 mar-03 mar-04 mar-05 mar-06 mar-07
Sweden Norway Denmark Finland Germany
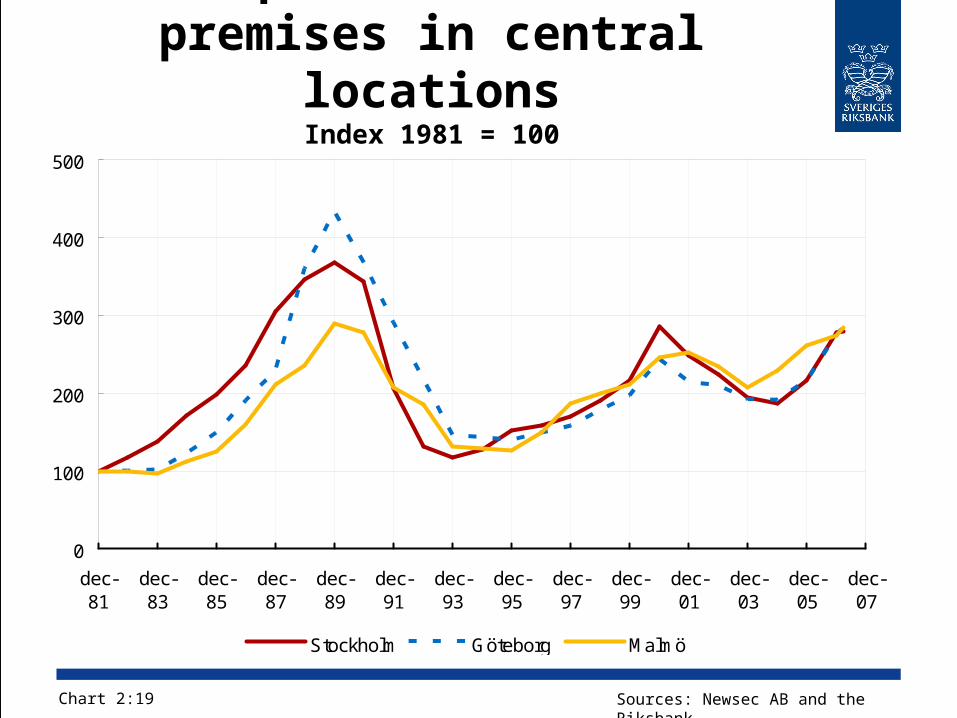
Real prices for office premises in central locations
Index 1981 = 100
Chart 2:19 Sources: Newsec AB and the Riksbank
0
100
200
300
400
500
dec-81
dec-83
dec-85
dec-87
dec-89
dec-91
dec-93
dec-95
dec-97
dec-99
dec-01
dec-03
dec-05
dec-07
Stockholm Göteborg Malmö
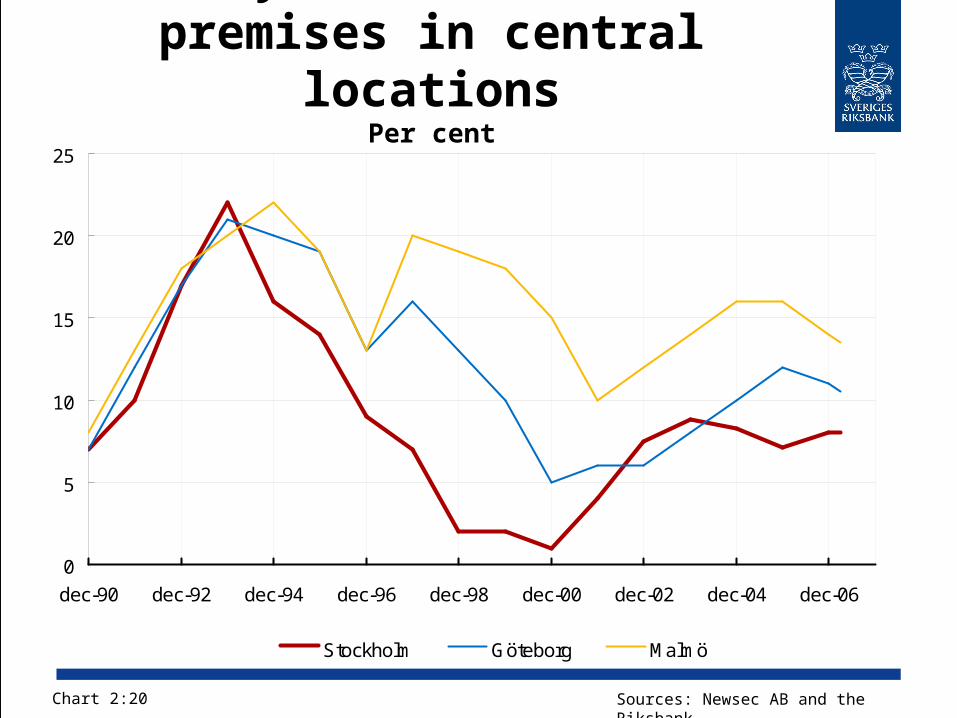
Vacancy rates for office premises in central locations
Per cent
Chart 2:20 Sources: Newsec AB and the Riksbank
0
5
10
15
20
25
dec-90 dec-92 dec-94 dec-96 dec-98 dec-00 dec-02 dec-04 dec-06
Stockholm Göteborg Malmö
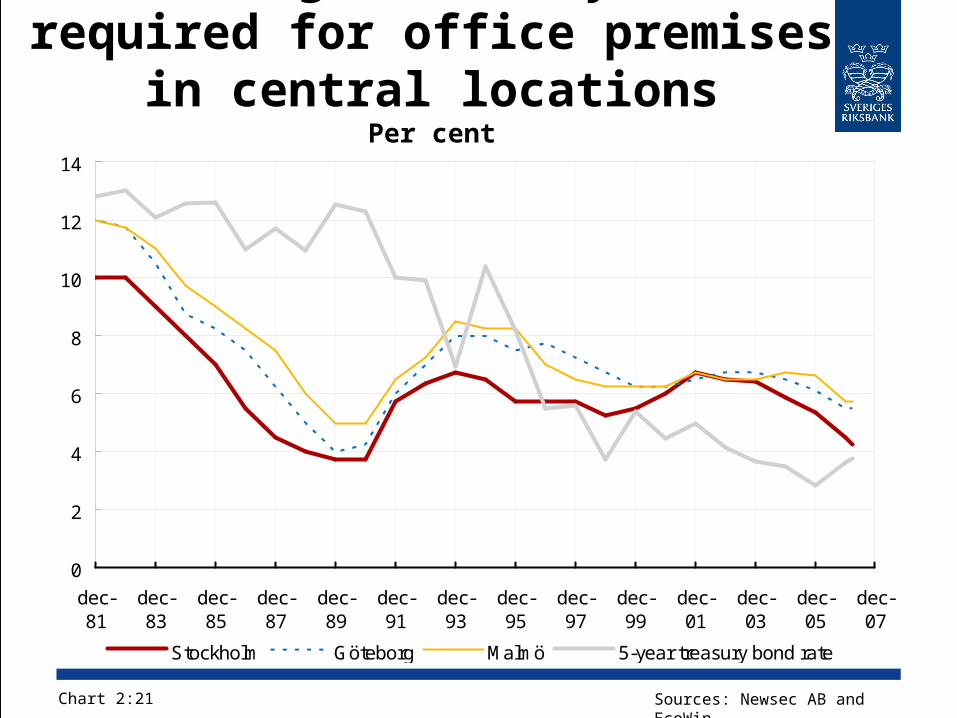
Average direct yield required for office premises in central
locationsPer cent
Chart 2:21 Sources: Newsec AB and EcoWin
0
2
4
6
8
10
12
14
dec-81
dec-83
dec-85
dec-87
dec-89
dec-91
dec-93
dec-95
dec-97
dec-99
dec-01
dec-03
dec-05
dec-07
Stockholm Göteborg Malmö 5-year treasury bond rate
Chapter 3Developments in the
banks
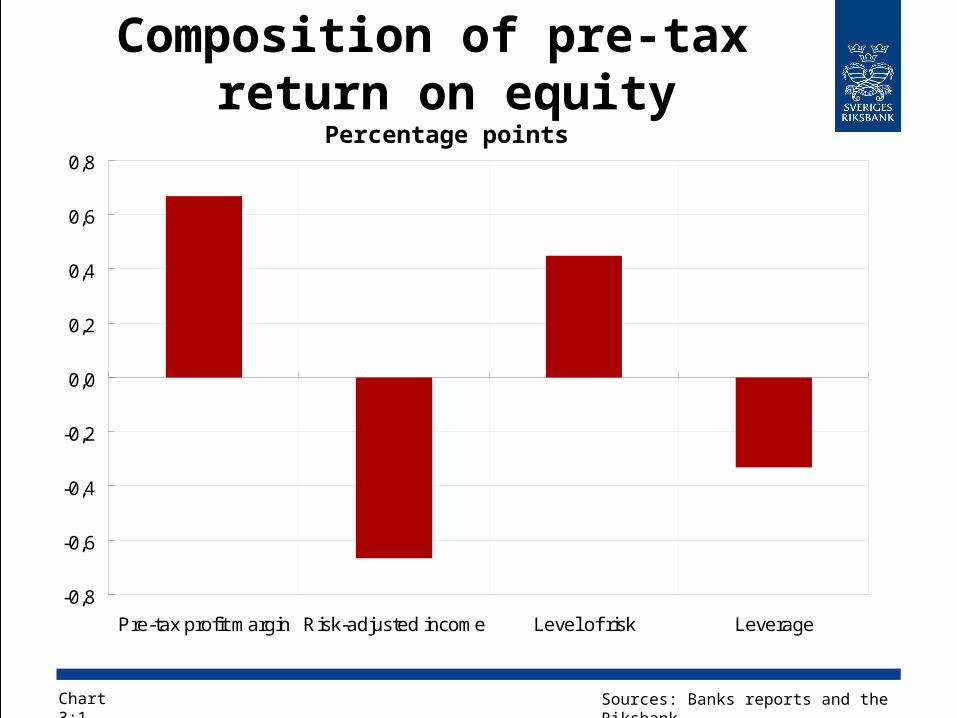
Composition of pre-tax return on equity
Percentage points
Chart 3:1 Sources: Banks reports and the Riksbank
-0,8
-0,6
-0,4
-0,2
0,0
0,2
0,4
0,6
0,8
Pre-tax profit margin Risk-adjusted income Level of risk Leverage
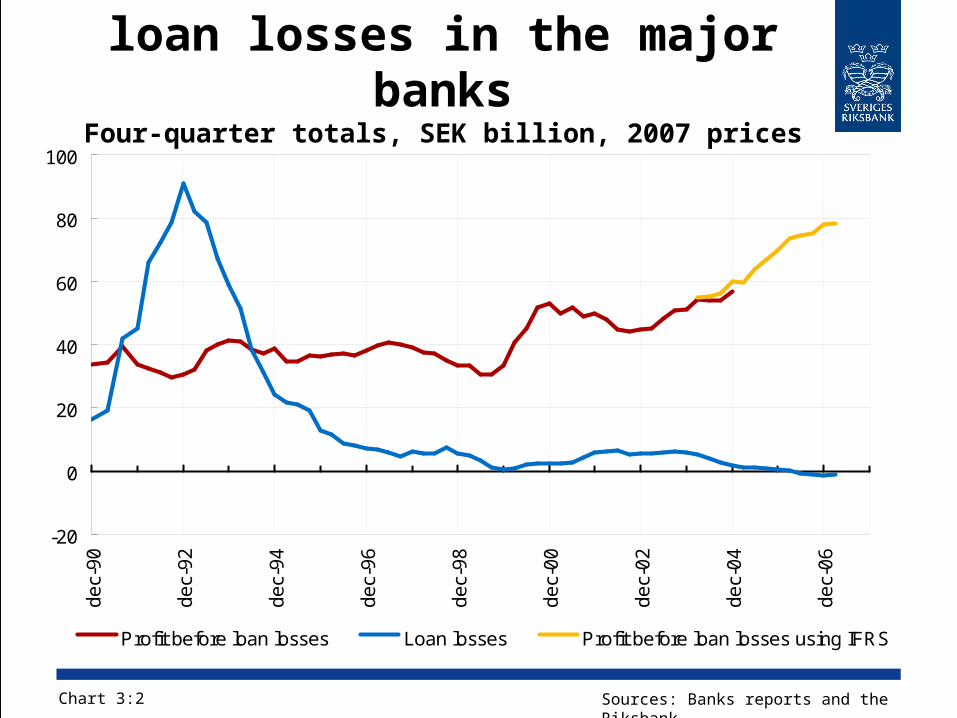
Profit before loan losses and net
loan losses in the major banks
Four-quarter totals, SEK billion, 2007 prices
Chart 3:2 Sources: Banks reports and the Riksbank
-20
0
20
40
60
80
100
de
c-9
0
de
c-9
2
de
c-9
4
de
c-9
6
de
c-9
8
de
c-0
0
de
c-0
2
de
c-0
4
de
c-0
6
Profit before loan losses Loan losses Profit before loan losses using IFRS
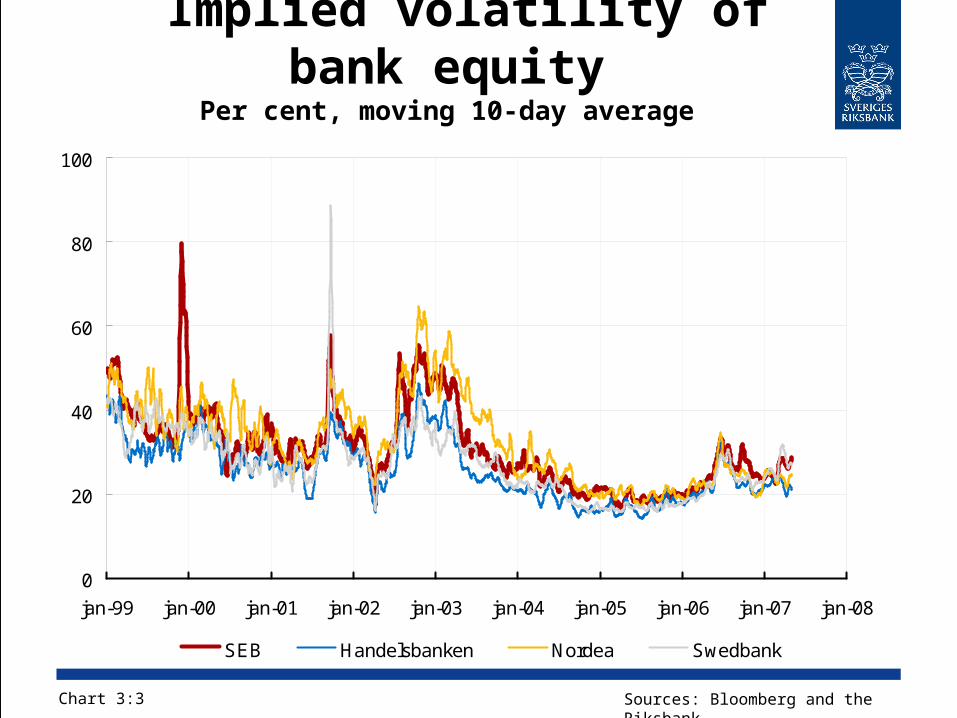
Implied volatility of bank equity
Per cent, moving 10-day average
Chart 3:3 Sources: Bloomberg and the Riksbank
0
20
40
60
80
100
jan-99 jan-00 jan-01 jan-02 jan-03 jan-04 jan-05 jan-06 jan-07 jan-08
SEB Handelsbanken Nordea Swedbank
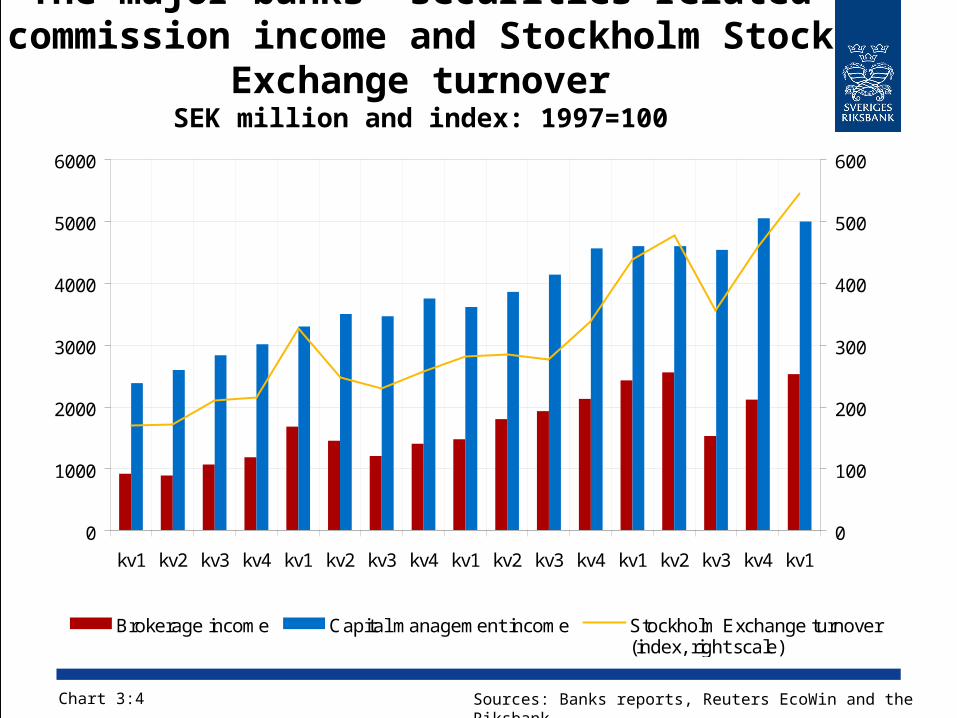
The major banks’ securities-related commission income and Stockholm
Stock Exchange turnoverSEK million and index: 1997=100
Sources: Banks reports, Reuters EcoWin and the RiksbankChart 3:4
0
1000
2000
3000
4000
5000
6000
kv1 kv2 kv3 kv4 kv1 kv2 kv3 kv4 kv1 kv2 kv3 kv4 kv1 kv2 kv3 kv4 kv1
0
100
200
300
400
500
600
Brokerage income Capital management income Stockholm Exchange turnover (index, right scale)
2003 2004 2005 2006 2007
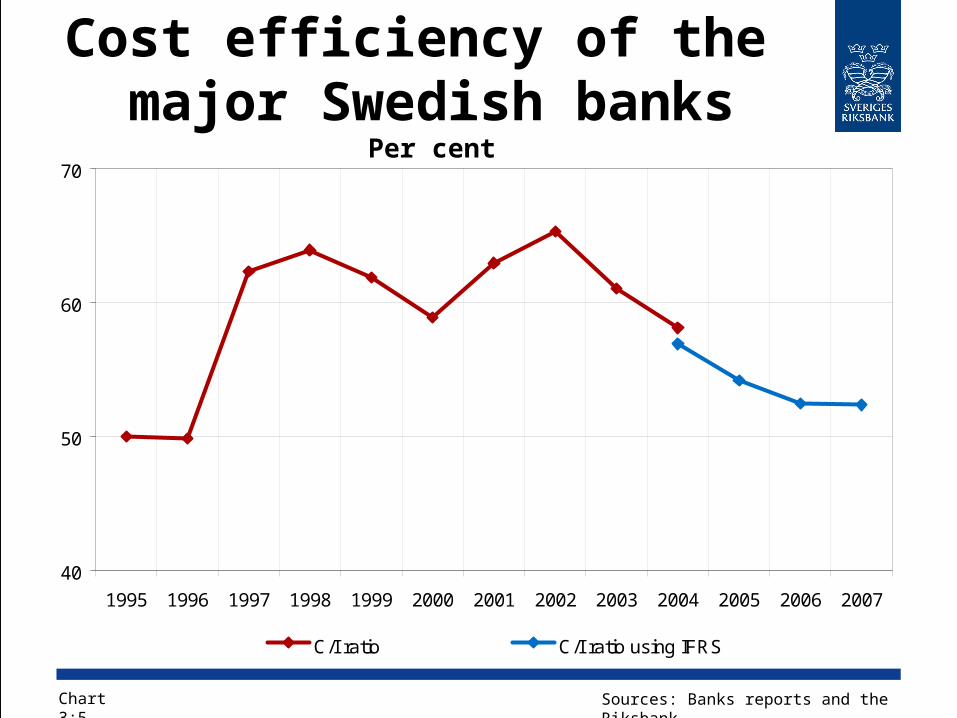
Cost efficiency of the major Swedish banks
Per cent
Chart 3:5 Sources: Banks reports and the Riksbank
40
50
60
70
1995 1996 1997 1998 1999 2000 2001 2002 2003 2004 2005 2006 2007
C/I ratio C/I ratio using IFRS
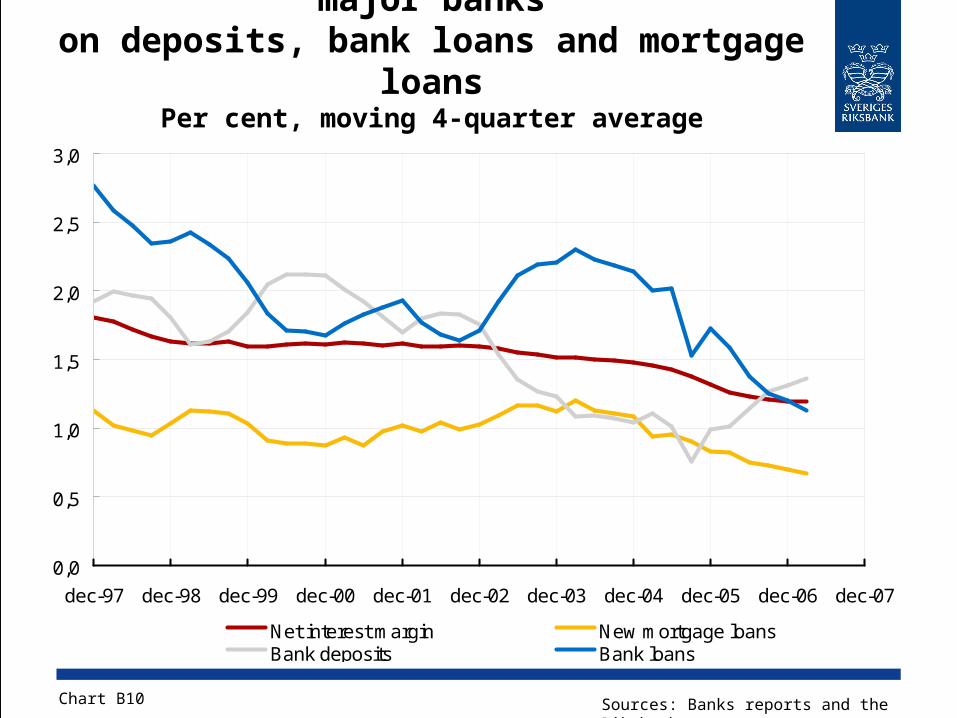
Net interest margin and spreads for the major banks
on deposits, bank loans and mortgage loans
Per cent, moving 4-quarter average
Chart B10 Sources: Banks reports and the Riksbank
0,0
0,5
1,0
1,5
2,0
2,5
3,0
dec-97 dec-98 dec-99 dec-00 dec-01 dec-02 dec-03 dec-04 dec-05 dec-06 dec-07
Net interest margin New mortgage loansBank deposits Bank loans
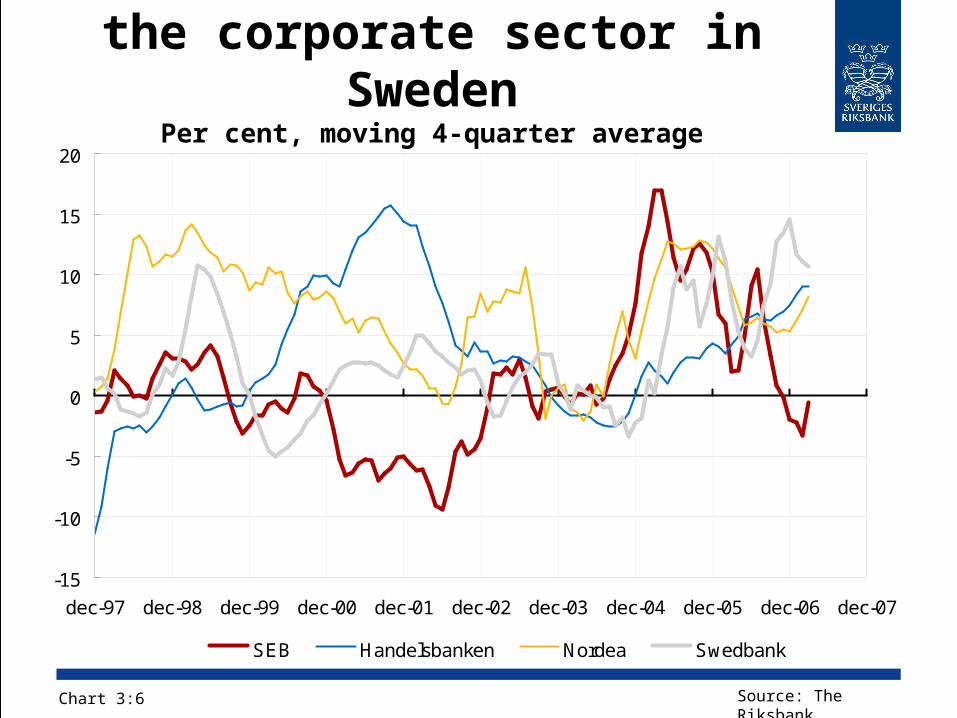
Lending by credit institutions to
the corporate sector in Sweden
Per cent, moving 4-quarter average
Chart 3:6 Source: The Riksbank
-15
-10
-5
0
5
10
15
20
dec-97 dec-98 dec-99 dec-00 dec-01 dec-02 dec-03 dec-04 dec-05 dec-06 dec-07
SEB Handelsbanken Nordea Swedbank
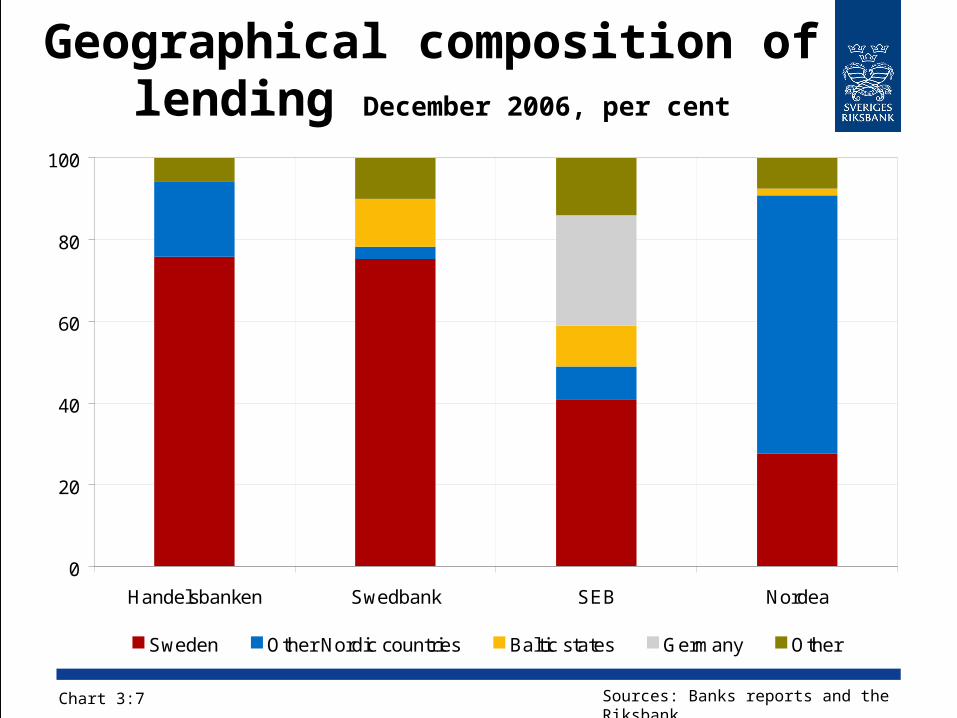
Geographical composition of lending December 2006, per cent
Chart 3:7 Sources: Banks reports and the Riksbank
0
20
40
60
80
100
Handelsbanken Swedbank SEB Nordea
Sweden Other Nordic countries Baltic states Germany Other
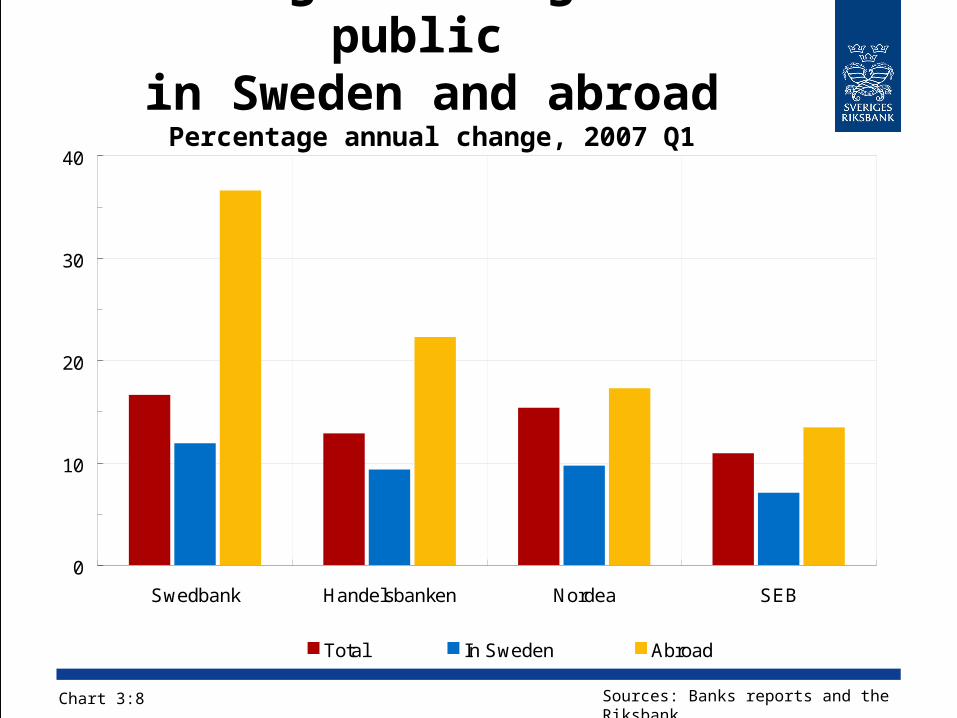
Lending to the general public
in Sweden and abroadPercentage annual change, 2007 Q1
Chart 3:8 Sources: Banks reports and the Riksbank
0
10
20
30
40
Swedbank Handelsbanken Nordea SEB
Total In Sweden Abroad
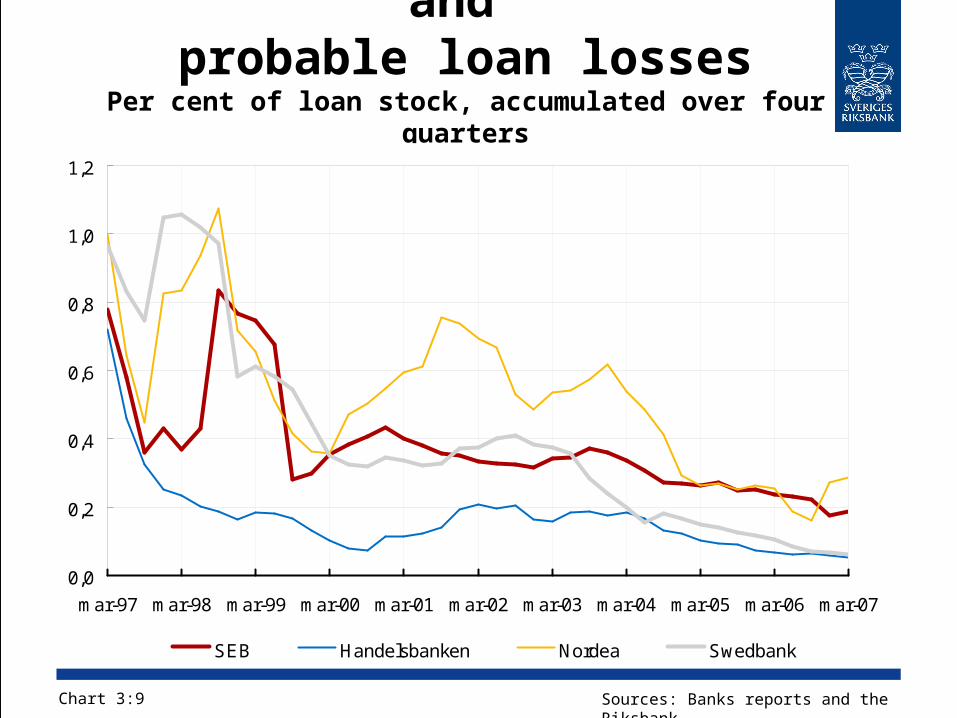
Provisions for incurred and
probable loan lossesPer cent of loan stock, accumulated over four
quarters
Chart 3:9 Sources: Banks reports and the Riksbank
0,0
0,2
0,4
0,6
0,8
1,0
1,2
mar-97 mar-98 mar-99 mar-00 mar-01 mar-02 mar-03 mar-04 mar-05 mar-06 mar-07
SEB Handelsbanken Nordea Swedbank
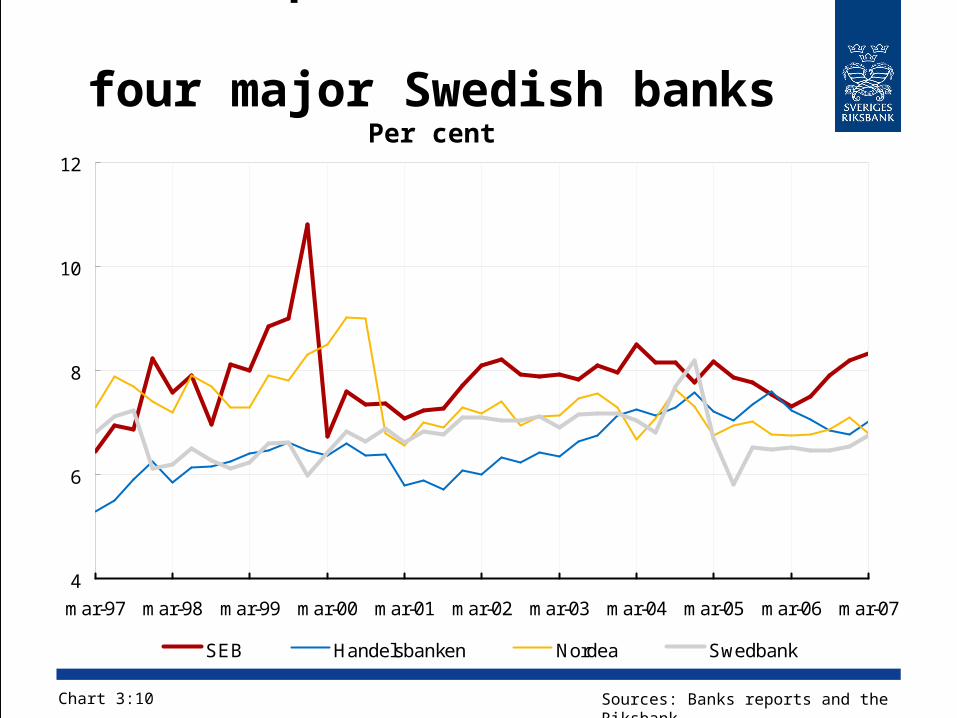
Tier 1 capital ratios of the four major Swedish banks
Per cent
Chart 3:10 Sources: Banks reports and the Riksbank
4
6
8
10
12
mar-97 mar-98 mar-99 mar-00 mar-01 mar-02 mar-03 mar-04 mar-05 mar-06 mar-07
SEB Handelsbanken Nordea Swedbank
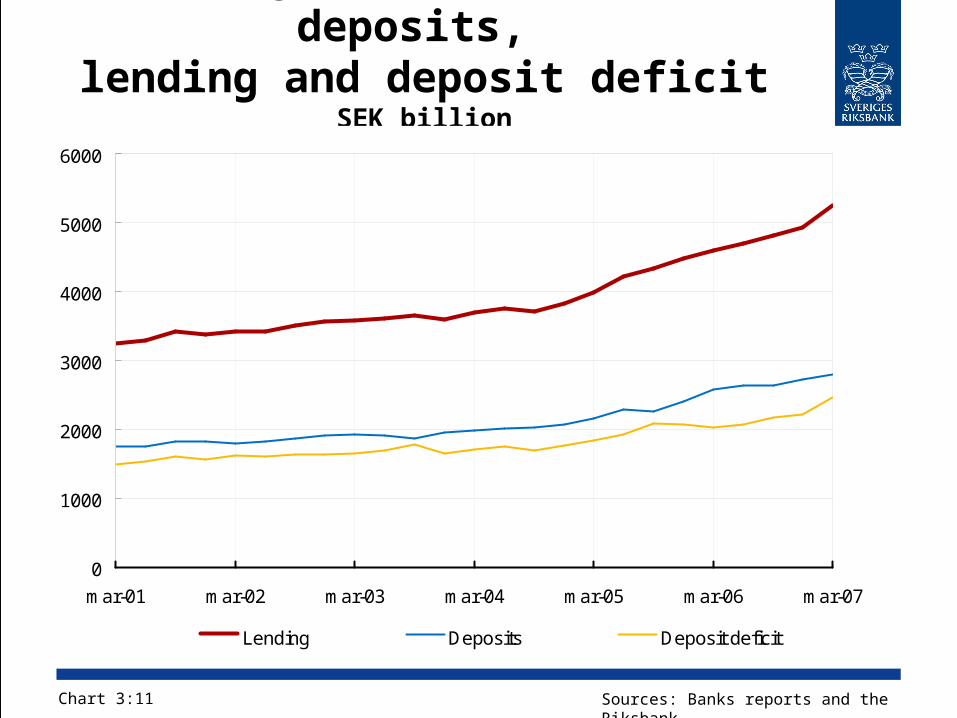
The major Swedish banks’ deposits,
lending and deposit deficitSEK billion
Chart 3:11 Sources: Banks reports and the Riksbank
0
1000
2000
3000
4000
5000
6000
mar-01 mar-02 mar-03 mar-04 mar-05 mar-06 mar-07
Lending Deposits Deposit deficit
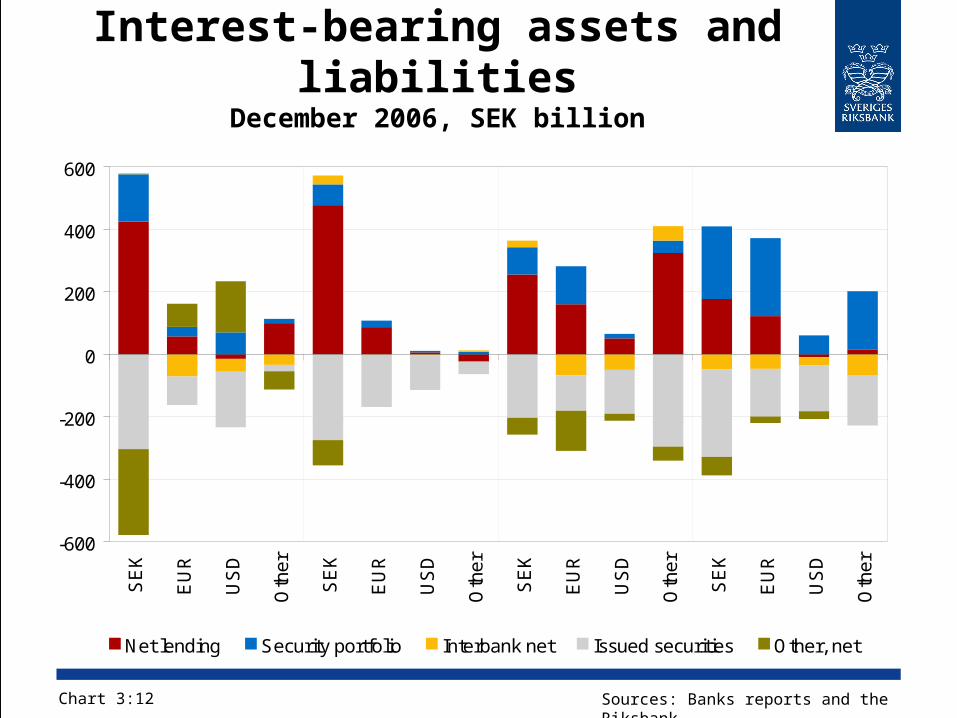
Interest-bearing assets and liabilities
December 2006, SEK billion
Chart 3:12 Sources: Banks reports and the Riksbank
-600
-400
-200
0
200
400
600
SE
K
EU
R
US
D
Oth
er
SE
K
EU
R
US
D
Oth
er
SE
K
EU
R
US
D
Oth
er
SE
K
EU
R
US
D
Oth
er
Net lending Security portfolio Interbank net Issued securities Other, net
Handelsbanken Swedbank Nordea SEB
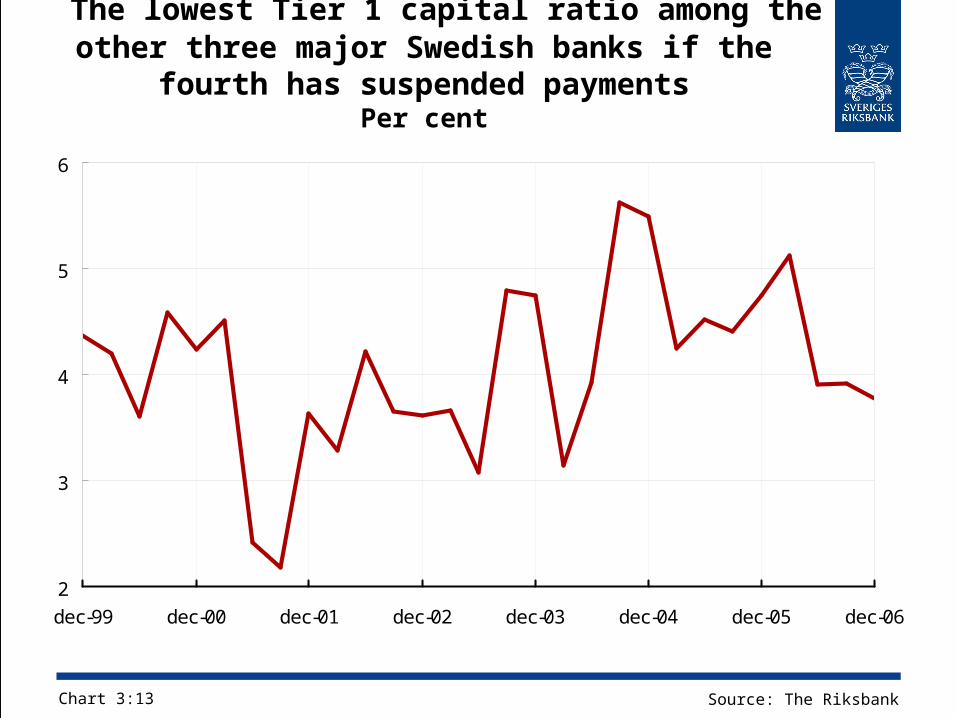
The lowest Tier 1 capital ratio among the other three major Swedish banks if the fourth
has suspended paymentsPer cent
Chart 3:13 Source: The Riksbank
2
3
4
5
6
dec-99 dec-00 dec-01 dec-02 dec-03 dec-04 dec-05 dec-06
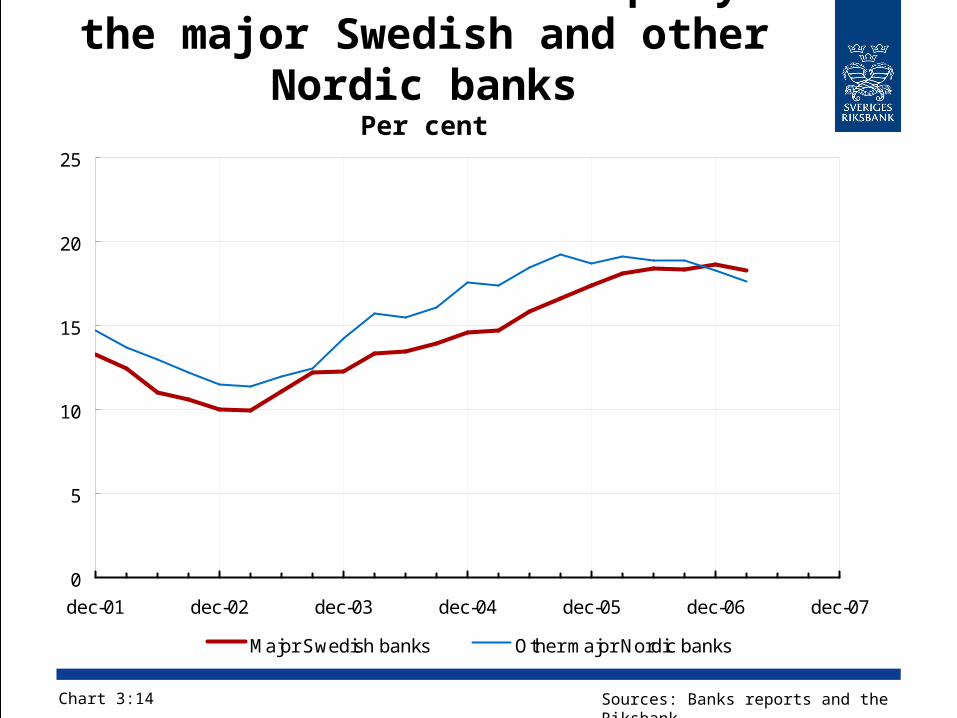
Post-tax returns on equity in the major Swedish and other Nordic
banksPer cent
Chart 3:14 Sources: Banks reports and the Riksbank
0
5
10
15
20
25
dec-01 dec-02 dec-03 dec-04 dec-05 dec-06 dec-07
Major Swedish banks Other major Nordic banks
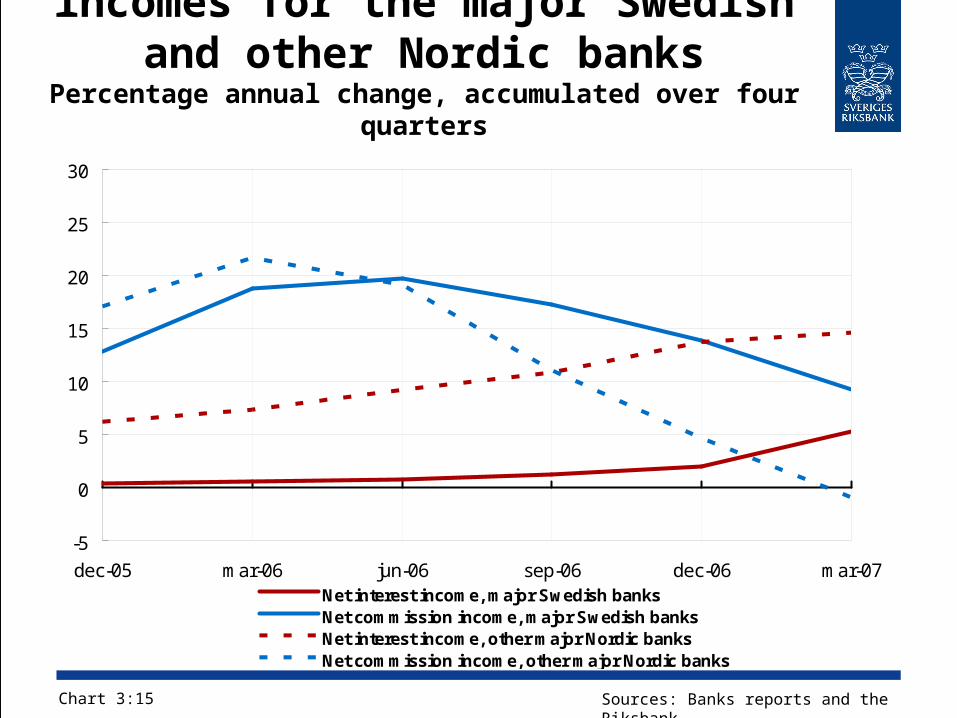
Net interest and commission incomes for the major Swedish
and other Nordic banksPercentage annual change, accumulated over four
quarters
Chart 3:15 Sources: Banks reports and the Riksbank
-5
0
5
10
15
20
25
30
dec-05 mar-06 jun-06 sep-06 dec-06 mar-07Net interest income, major Swedish banksNet commission income, major Swedish banksNet interest income, other major Nordic banksNet commission income, other major Nordic banks
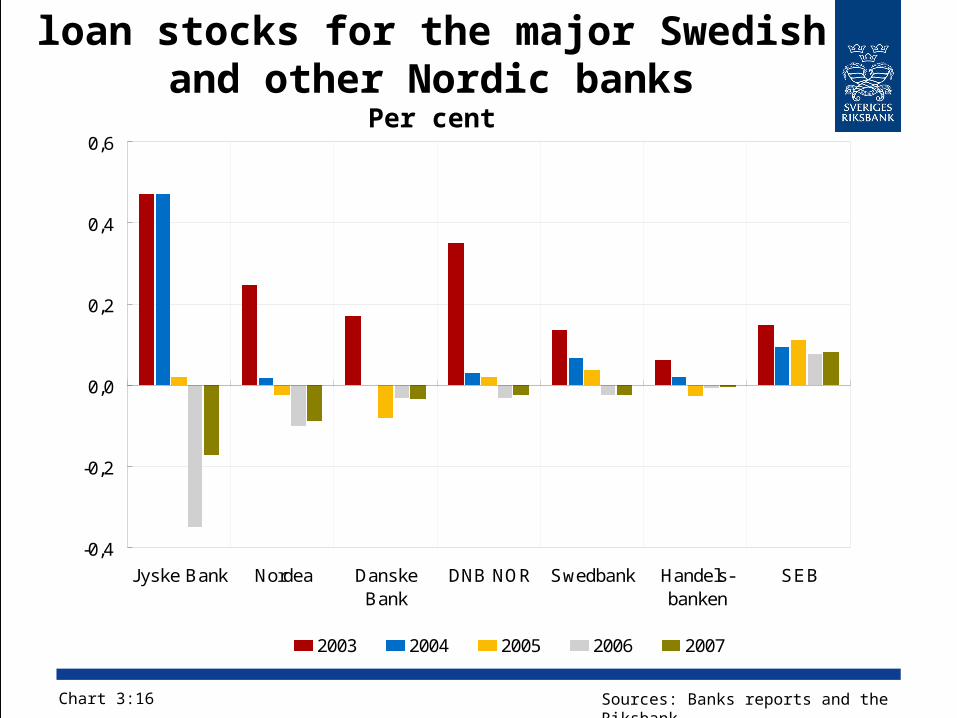
Net loan losses in relation to loan stocks for the major Swedish and
other Nordic banksPer cent
Chart 3:16 Sources: Banks reports and the Riksbank
-0,4
-0,2
0,0
0,2
0,4
0,6
Jyske Bank Nordea DanskeBank
DNB NOR Swedbank Handels-banken
SEB
2003 2004 2005 2006 2007
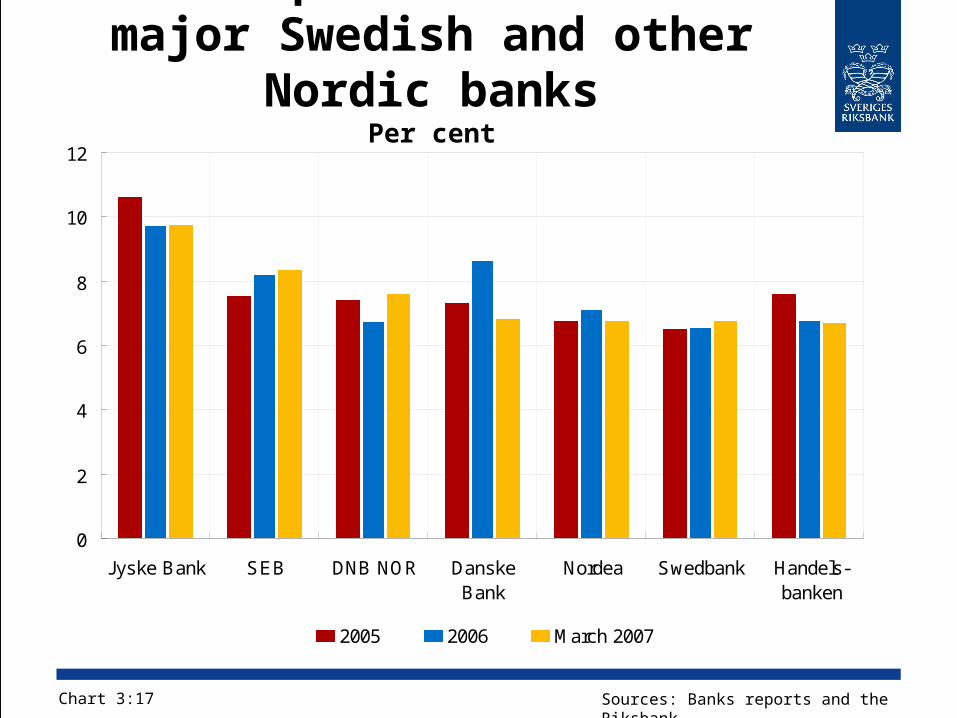
Tier 1 capital ratios of the major Swedish and other
Nordic banksPer cent
Chart 3:17 Sources: Banks reports and the Riksbank
0
2
4
6
8
10
12
Jyske Bank SEB DNB NOR DanskeBank
Nordea Swedbank Handels-banken
2005 2006 March 2007

Bank profits with the scenario
for the Baltic statesExpected profit less the change in expected losses, SEK
million
Chart 3:18 Sources: Banks reports and the Riksbank
0
2000
4000
6000
8000
10000
jan-00 jan-00year 1 year 2 year 3
SEB Swedbank
year 1 year 2 year 3
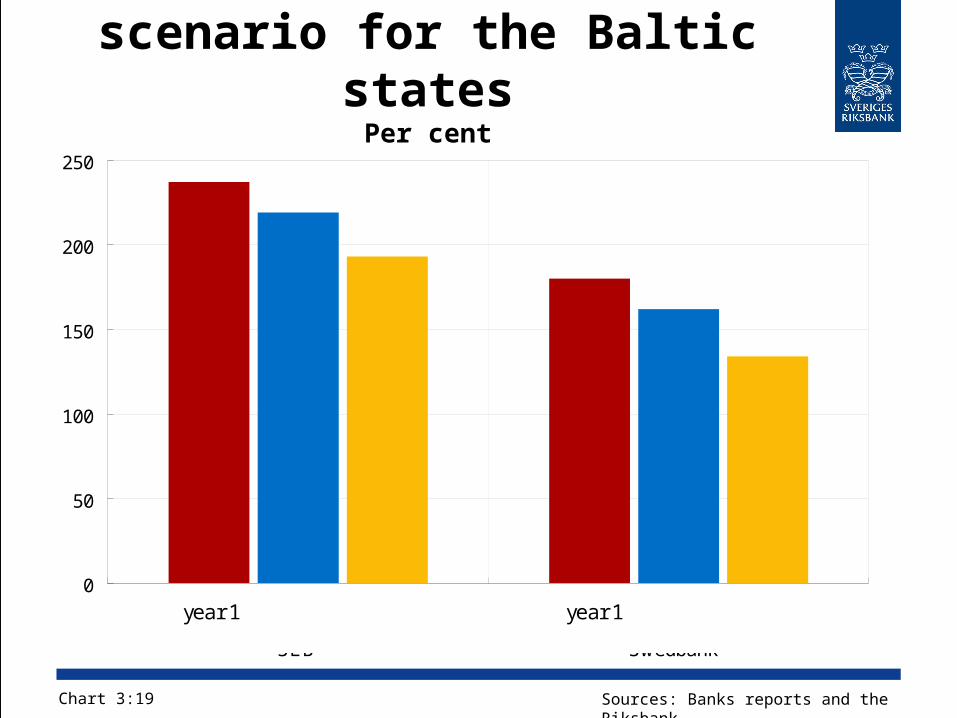
Cover for credit risk with the scenario for the Baltic states
Per cent
Chart 3:19 Sources: Banks reports and the Riksbank
0
50
100
150
200
250
jan-00 jan-00
SEB Swedbank
year 1 year 2 year 3 year 1 year 2 year 3
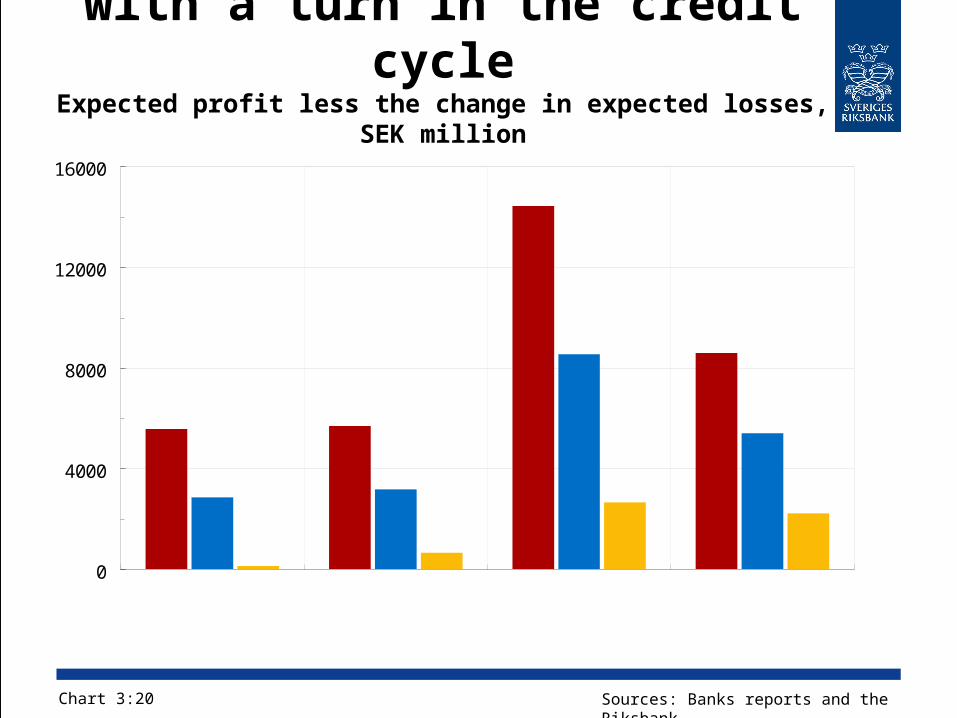
Bank profits in the scenario with a turn in the credit
cycleExpected profit less the change in expected losses,
SEK million
Chart 3:20 Sources: Banks reports and the Riksbank
0
4000
8000
12000
16000
jan-00 jan-00 jan-00 jan-00Year1
Year2
Year3
Year1
Year2
Year3
Year1
Year2
Year3
Year1
Year2
Year3
SEB Swedbank Nordea Handelsbanken
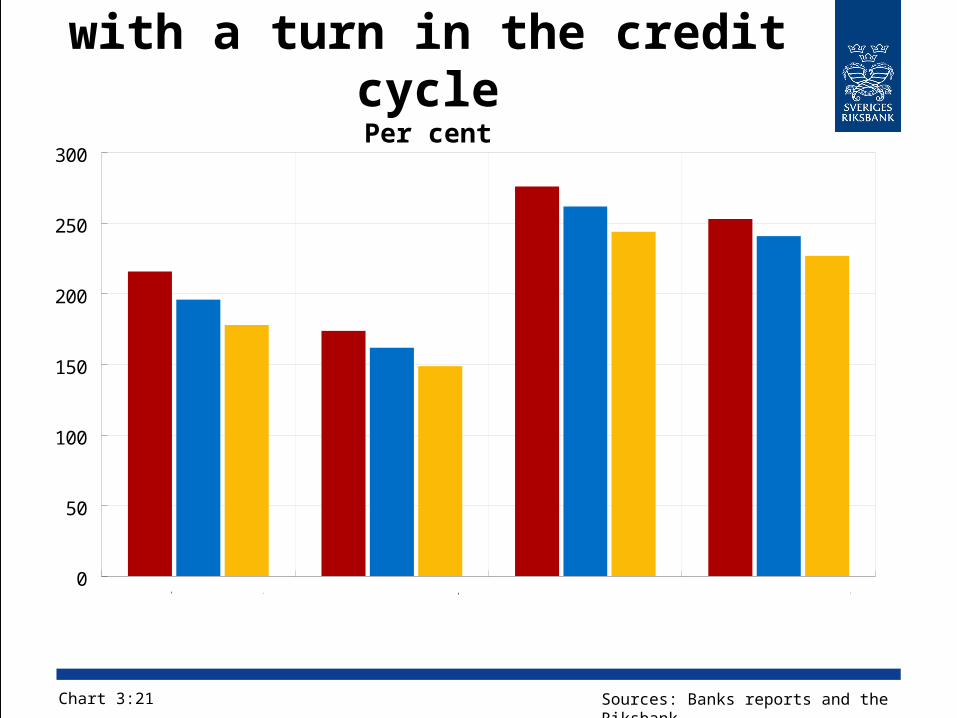
Cover for credit risk in the scenario
with a turn in the credit cyclePer cent
Chart 3:21 Sources: Banks reports and the Riksbank
0
50
100
150
200
250
300
jan-00 jan-00 jan-00 jan-00
SEB Swedbank Nordea Handelsbanken
Year1
Year2
Year3
Year1
Year2
Year3
Year1
Year2
Year3
Year1
Year2
Year3

CHAPTER 4The financial infrastructure
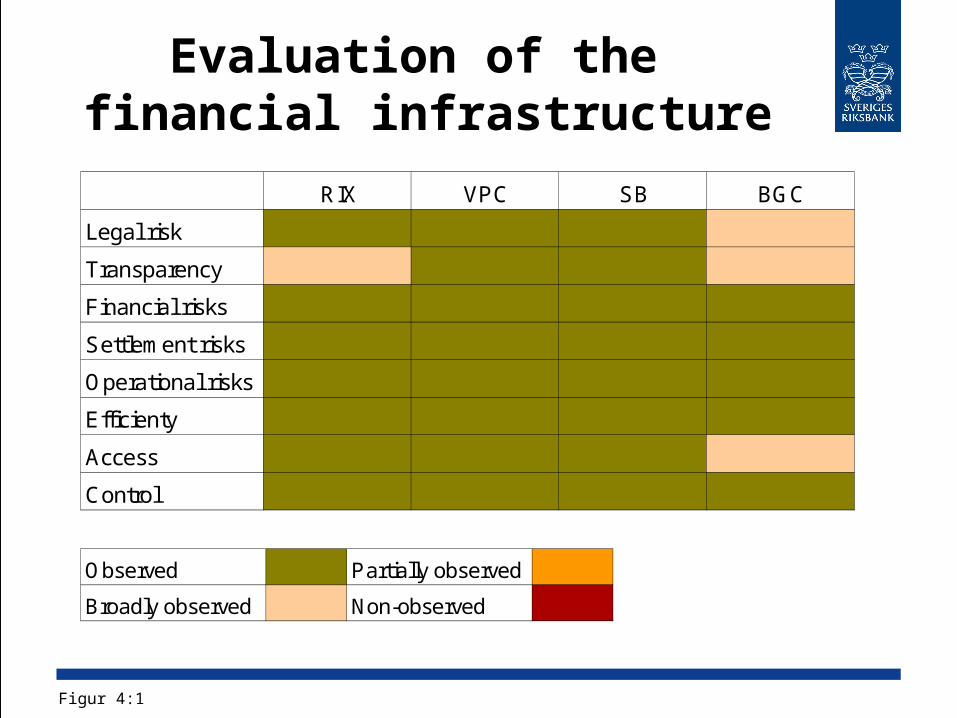
Evaluation of the financial infrastructure
Figur 4:1
RIX VPC SB BGC
Legal risk
Transparency
Financial risks
Settlement risks
Operational risks
Efficienty
Access
Control
Observed Partially observed
Broadly observed Non-observed
ARTICLETrading activity in credit
derivatives and implications for financial stability
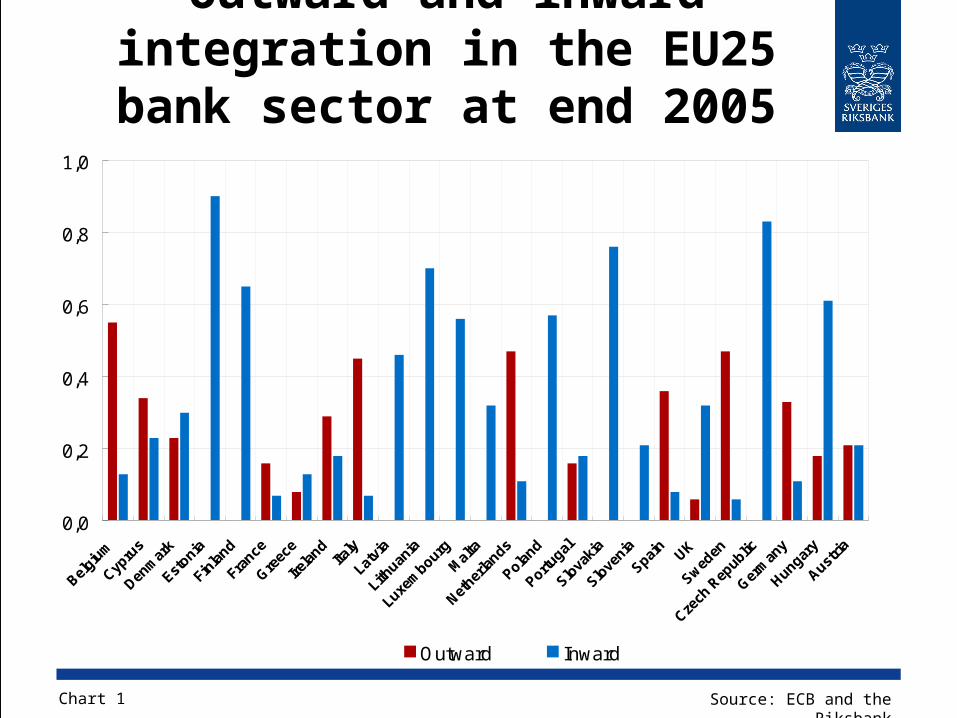
Outward and inward integration in the EU25 bank
sector at end 2005
Chart 1 Source: ECB and the Riksbank
0,0
0,2
0,4
0,6
0,8
1,0
Belgiu
m
Cypru
s
Denm
ark
Estonia
Finla
nd
France
Greec
e
Irela
ndIta
ly
Latvi
a
Lithuan
ia
Luxem
bourgM
alta
Nether
lands
Poland
Portugal
Slova
kia
Slove
nia
Spain
UK
Sweden
Czech
Rep
ublic
Germ
any
Hungary
Austria
Outward Inward