Embed Size (px)
Citation preview
© The McGraw-Hill Companies, Inc., 2016. All rights reserved.
Solutions Manual, Chapter 13 1
Chapter 13 Financial Statement Analysis
Solutions to Questions
13-1 Horizontal analysis examines how a particular item on a financial statement such as sales or cost of goods sold behaves over time. Vertical analysis involves analysis of items on an income statement or balance sheet for a single period. In vertical analysis of the income statement, all items are typically stated as a percentage of sales. In vertical analysis of the balance sheet, all items are typically stated as a percentage of total assets.
13-2 By looking at trends, an analyst hopes to get some idea of whether a situation is improving, remaining the same, or deteriorating. Such analyses can provide insight into what is likely to happen in the future. Rather than looking at trends, an analyst may compare one company to another or to industry averages using common-size financial statements.
13-3 Price-earnings ratios reflect investors’ expectations concerning future earnings. The higher the price-earnings ratio, the greater the growth in earnings investors expect. For this reason, two companies might have the same current earnings and yet have quite different price-earnings ratios. By definition, a stock with current earnings of $4 and a price-earnings ratio of 20 would be selling for $80 per share.
13-4 A rapidly growing tech company would probably have many opportunities to make investments at a rate of return higher than stockholders could earn in other investments. It would be better for the company to invest in such opportunities than to pay out dividends and thus one would expect the company to have a low dividend payout ratio.
13-5 The dividend yield is the dividend per share divided by the market price per share. The other source of return on an investment in stock is increases in market value.
13-6 Financial leverage results from borrowing funds at an interest rate that differs from the rate of return on assets acquired using those funds. If the rate of return on the assets is higher than the interest rate at which the funds were borrowed, financial leverage is positive and stockholders gain. If the return on the assets is lower than the interest rate, financial leverage is negative and the stockholders lose.
13-7 If the company experiences big variations in net cash flows from operations, stockholders might be pleased that the company has no debt. In hard times, interest payments might be very difficult to meet. On the other hand, if investments within the company can earn a rate of return that exceeds the interest rate on debt, stockholders would get the benefits of positive leverage if the company took on debt.
13-8 The market value of a share of common stock often exceeds the book value per share. Book value represents the cumulative effects on the balance sheet of past activities, evaluated using historical prices. The market value of the stock reflects investors’ expectations about the company’s future earnings. For most companies, market value exceeds book value because investors anticipate future earnings growth.
13-9 A 2 to 1 current ratio might not be adequate for several reasons. First, the composition of the current assets may be heavily weighted toward slow-turning and difficult-to-liquidate inventory, or the inventory may contain large amounts of obsolete goods. Second, the receivables may be low quality, including large amounts of accounts that may be difficult to collect.
© The McGraw-Hill Companies, Inc., 2016. All rights reserved.
2 Introduction to Managerial Accounting, 7th Edition
The Foundational 15
1. The earnings per share is computed as follows:
Net incomeEarnings per share =
Average number of common shares outstanding
$92,400= = $0.77 per share
120,000 shares
2. The price-earnings ratio is computed as follows:
Market price per sharePrice-earnings ratio =
Earnings per share
$2.75= = 3.57 (rounded)
$0.77
3. The dividend payout ratio is computed as follows:
Dividends per shareDividend payout ratio =
Earnings per share
$0.55= = 71% (rounded)
$0.77
The dividend yield ratio is computed as follows:
Dividends per shareDividend yield ratio =
Market price per share
$0.55= = 20%
$2.75
© The McGraw-Hill Companies, Inc., 2016. All rights reserved.
Solutions Manual, Chapter 13 3
The Foundational 15 (continued)
4. The return on total assets is computed as follows:
( )
Net income +[Interest expense × (1 - Tax rate)]
Return on total assets = Average total assets
$92,400 + [$8,000 × (1 - 0.30)]
= =21.5%$450,000 + $460,000 /2
5. The return on equity is computed as follows:
Net incomeReturn on = equity Average stockholders' equity
$92,400= = 28%
($320,000 + $340,000)/2
6. The book value per share is computed as follows:
Total stockholders' equityBook value per share =
Number of common shares outstanding
$320,000= = $2.67 per share (rounded)
120,000 shares
7. The working capital and current ratio are computed as follows:
Working capital = Current assets - Current liabilities
= $150,000 - $60,000 = $90,000
Current assets
Current ratio = Current liabilities
$150,000= = 2.50
$60,000
© The McGraw-Hill Companies, Inc., 2016. All rights reserved.
4 Introduction to Managerial Accounting, 7th Edition
The Foundational 15 (continued)
8. The acid-test ratio is computed as follows:
Cash + Marketable securities + Accounts receivable + Short-term notes
Acid-test ratio = Current liabilities
$35,000 + $0 + $60,000 + $0= = 1.58 (rounded)
$60,000
9. The accounts receivable turnover is calculated as follows:
Sales on accountAccounts receivable = turnover Average accounts receivable balance
$700,000= = 12.73 (rounded)
($60,000 + $50,000)/2
The average collection period is computed as follows:
365 daysAverage collection period =
Accounts receivable turnover
365 days= = 28.67 days (rounded)
12.73
10. The inventory turnover is computed as follows:
Cost of goods soldInventory turnover =
Average inventory balance
$400,000= = 6.96 (rounded)
($55,000 + $60,000)/2
The average sale period is computed as follows:
365 daysAverage sale period =
Inventory turnover
365 days= = 52.44 days (rounded)
6.96
© The McGraw-Hill Companies, Inc., 2016. All rights reserved.
Solutions Manual, Chapter 13 5
The Foundational 15 (continued)
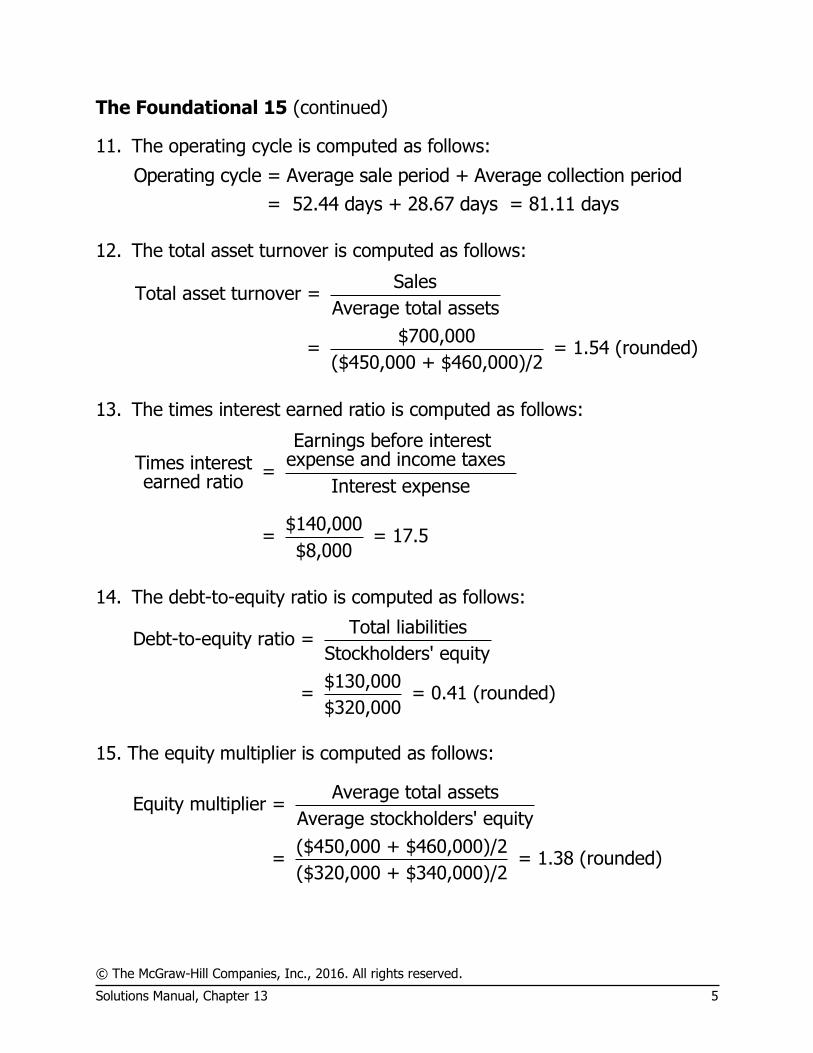
11. The operating cycle is computed as follows:
Operating cycle = Average sale period + Average collection period
= 52.44 days + 28.67 days = 81.11 days
12. The total asset turnover is computed as follows:
SalesTotal asset turnover =
Average total assets
$700,000= = 1.54 (rounded)
($450,000 + $460,000)/2
13. The times interest earned ratio is computed as follows:
Earnings before interest expense and income taxesTimes interest =
earned ratio Interest expense
$140,000= = 17.5
$8,000
14. The debt-to-equity ratio is computed as follows:
Total liabilitiesDebt-to-equity ratio =
Stockholders' equity
$130,000= = 0.41 (rounded)
$320,000
15. The equity multiplier is computed as follows:
Average total assetsEquity multiplier =
Average stockholders' equity
($450,000 + $460,000)/2= = 1.38 (rounded)
($320,000 + $340,000)/2
© The McGraw-Hill Companies, Inc., 2016. All rights reserved.
6 Introduction to Managerial Accounting, 7th Edition
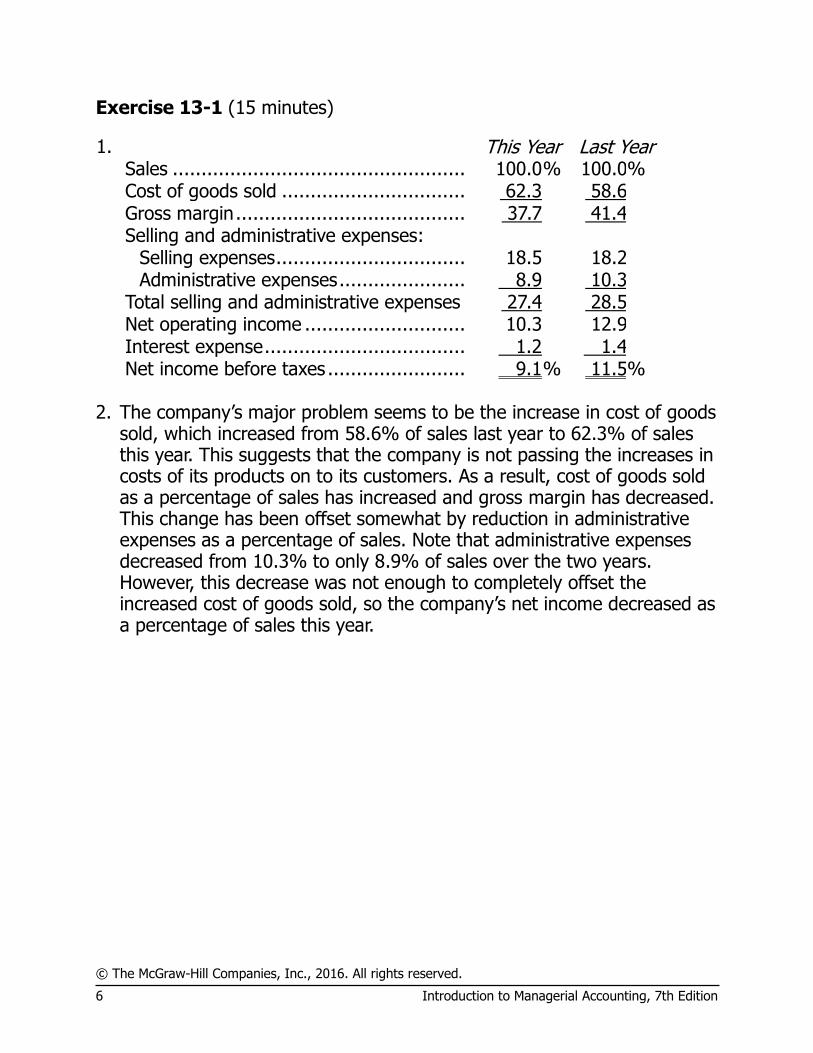
Exercise 13-1 (15 minutes)
1. This Year Last Year Sales ................................................... 100.0 % 100.0 % Cost of goods sold ................................ 62.3 58.6 Gross margin ........................................ 37.7 41.4 Selling and administrative expenses: Selling expenses ................................. 18.5 18.2 Administrative expenses ...................... 8.9 10.3 Total selling and administrative expenses 27.4 28.5 Net operating income ............................ 10.3 12.9 Interest expense ................................... 1.2 1.4 Net income before taxes ........................ 9.1 % 11.5 % 2. The company’s major problem seems to be the increase in cost of goods
sold, which increased from 58.6% of sales last year to 62.3% of sales this year. This suggests that the company is not passing the increases in costs of its products on to its customers. As a result, cost of goods sold as a percentage of sales has increased and gross margin has decreased. This change has been offset somewhat by reduction in administrative expenses as a percentage of sales. Note that administrative expenses decreased from 10.3% to only 8.9% of sales over the two years. However, this decrease was not enough to completely offset the increased cost of goods sold, so the company’s net income decreased as a percentage of sales this year.
© The McGraw-Hill Companies, Inc., 2016. All rights reserved.
Solutions Manual, Chapter 13 7
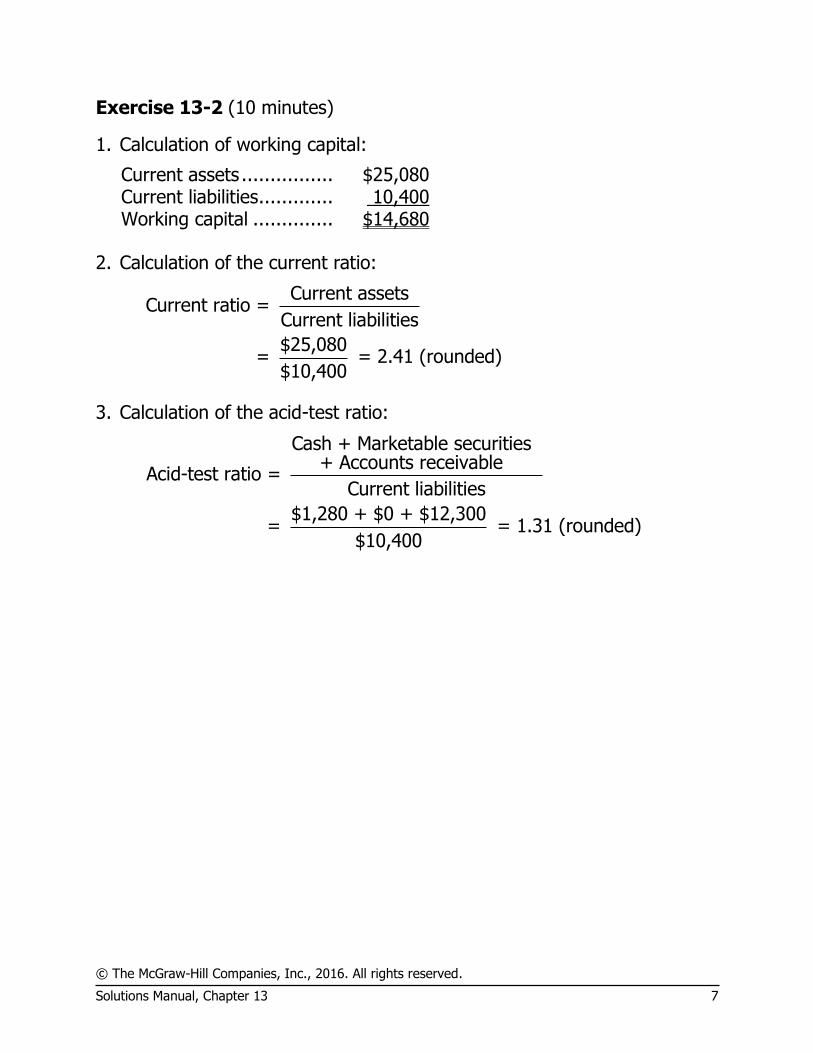
Exercise 13-2 (10 minutes)
1. Calculation of working capital:
Current assets ................ $25,080 Current liabilities ............. 10,400 Working capital .............. $14,680
2. Calculation of the current ratio:
Current assetsCurrent ratio =
Current liabilities
$25,080= = 2.41 (rounded)
$10,400
3. Calculation of the acid-test ratio:
Cash + Marketable securities + Accounts receivable
Acid-test ratio = Current liabilities
$1,280 + $0 + $12,300= = 1.31 (rounded)
$10,400
© The McGraw-Hill Companies, Inc., 2016. All rights reserved.
8 Introduction to Managerial Accounting, 7th Edition
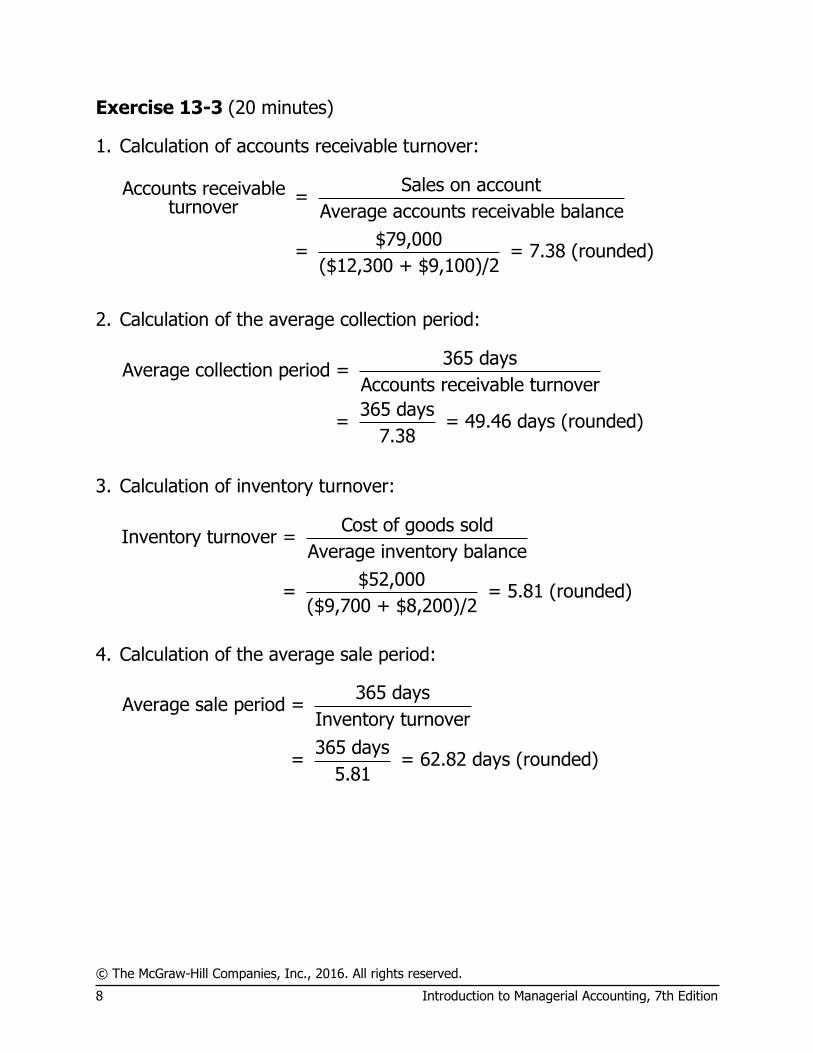
Exercise 13-3 (20 minutes)
1. Calculation of accounts receivable turnover:
Sales on accountAccounts receivable = turnover Average accounts receivable balance
$79,000= = 7.38 (rounded)
($12,300 + $9,100)/2
2. Calculation of the average collection period:
365 daysAverage collection period =
Accounts receivable turnover
365 days= = 49.46 days (rounded)
7.38
3. Calculation of inventory turnover:
Cost of goods soldInventory turnover =
Average inventory balance
$52,000= = 5.81 (rounded)
($9,700 + $8,200)/2
4. Calculation of the average sale period:
365 daysAverage sale period =
Inventory turnover
365 days= = 62.82 days (rounded)
5.81
© The McGraw-Hill Companies, Inc., 2016. All rights reserved.
Solutions Manual, Chapter 13 9
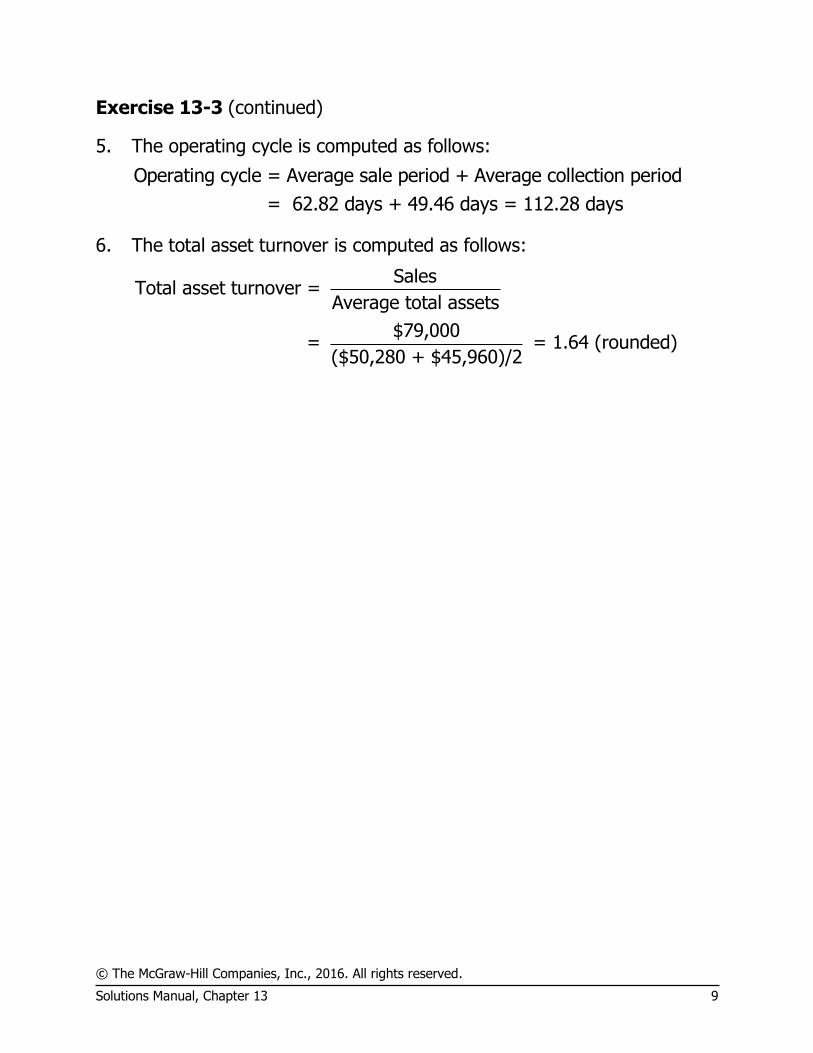
Exercise 13-3 (continued)
5. The operating cycle is computed as follows:
Operating cycle = Average sale period + Average collection period
= 62.82 days + 49.46 days = 112.28 days
6. The total asset turnover is computed as follows:
SalesTotal asset turnover =
Average total assets
$79,000= = 1.64 (rounded)
($50,280 + $45,960)/2
© The McGraw-Hill Companies, Inc., 2016. All rights reserved.
10 Introduction to Managerial Accounting, 7th Edition
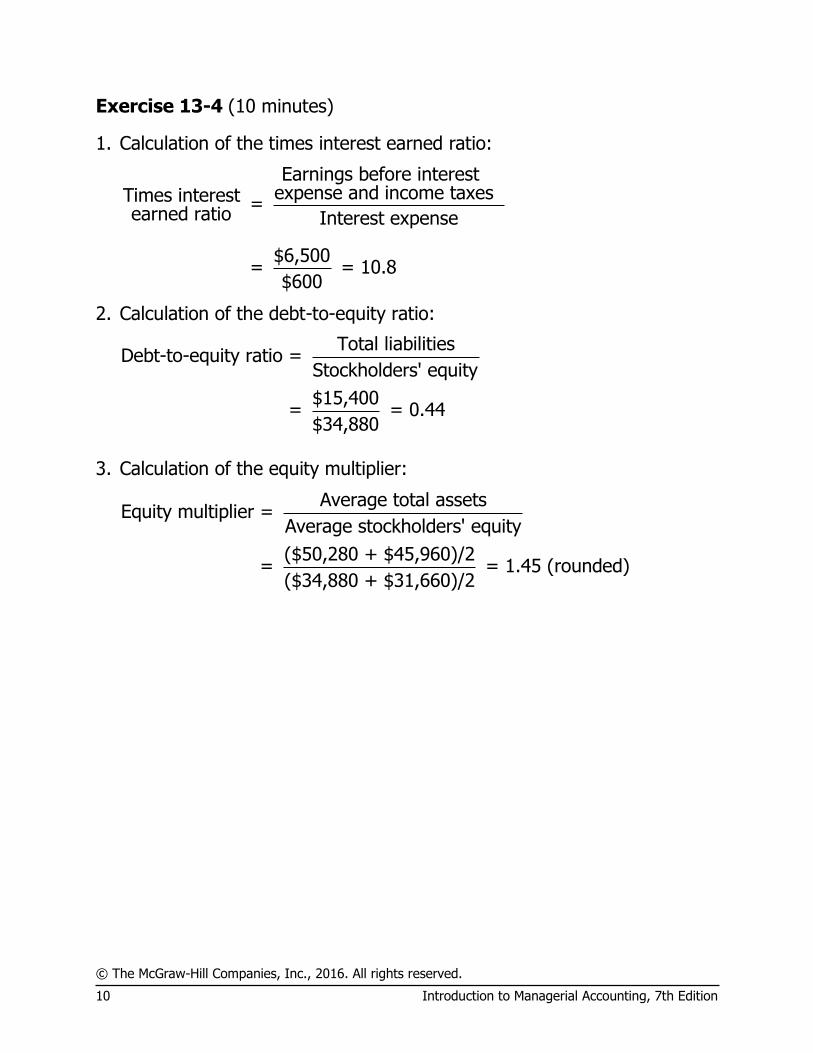
Exercise 13-4 (10 minutes)
1. Calculation of the times interest earned ratio:
Earnings before interest expense and income taxesTimes interest =
earned ratio Interest expense
$6,500= = 10.8
$600
2. Calculation of the debt-to-equity ratio:
Total liabilitiesDebt-to-equity ratio =
Stockholders' equity
$15,400= = 0.44
$34,880
3. Calculation of the equity multiplier:
Average total assetsEquity multiplier =
Average stockholders' equity
($50,280 + $45,960)/2= = 1.45 (rounded)
($34,880 + $31,660)/2
© The McGraw-Hill Companies, Inc., 2016. All rights reserved.
Solutions Manual, Chapter 13 11
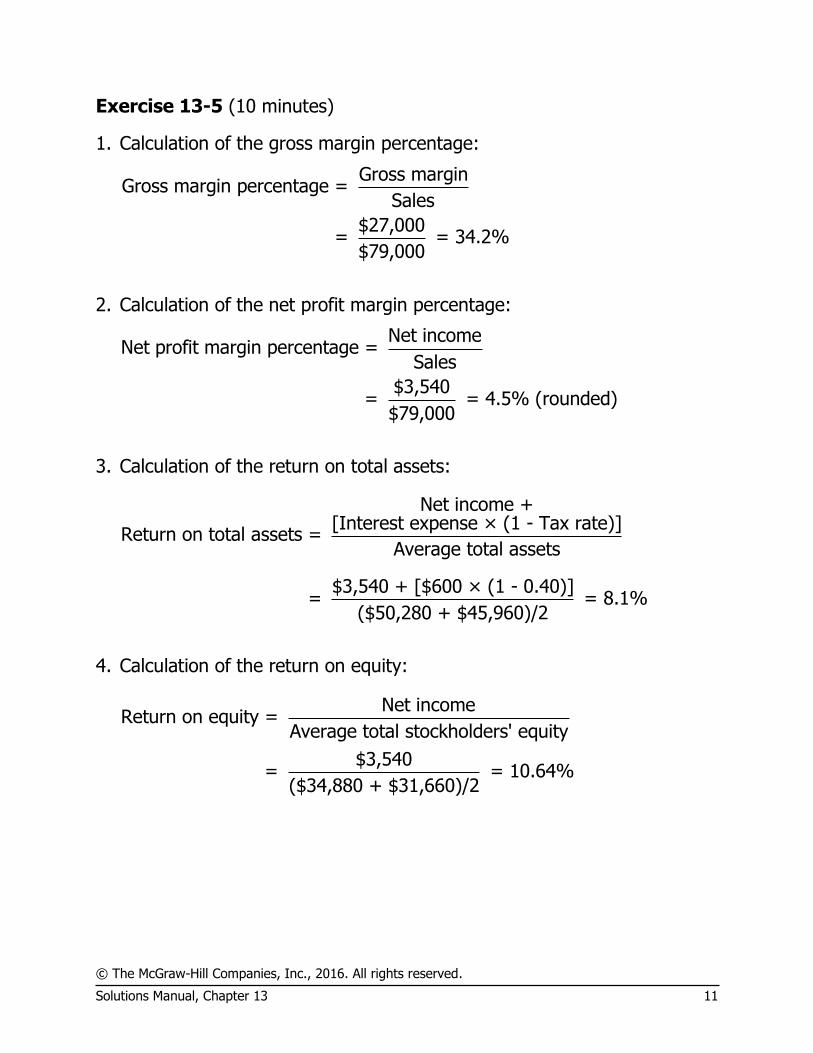
Exercise 13-5 (10 minutes)
1. Calculation of the gross margin percentage:
Gross marginGross margin percentage =
Sales
$27,000= = 34.2%
$79,000
2. Calculation of the net profit margin percentage:
Net incomeNet profit margin percentage =
Sales
$3,540= = 4.5% (rounded)
$79,000
3. Calculation of the return on total assets:
Net income +[Interest expense × (1 - Tax rate)]
Return on total assets = Average total assets
$3,540 + [$600 × (1 - 0.40)]
= = 8.1%($50,280 + $45,960)/2
4. Calculation of the return on equity:
Net incomeReturn on equity =
Average total stockholders' equity
$3,540= = 10.64%
($34,880 + $31,660)/2
© The McGraw-Hill Companies, Inc., 2016. All rights reserved.
12 Introduction to Managerial Accounting, 7th Edition
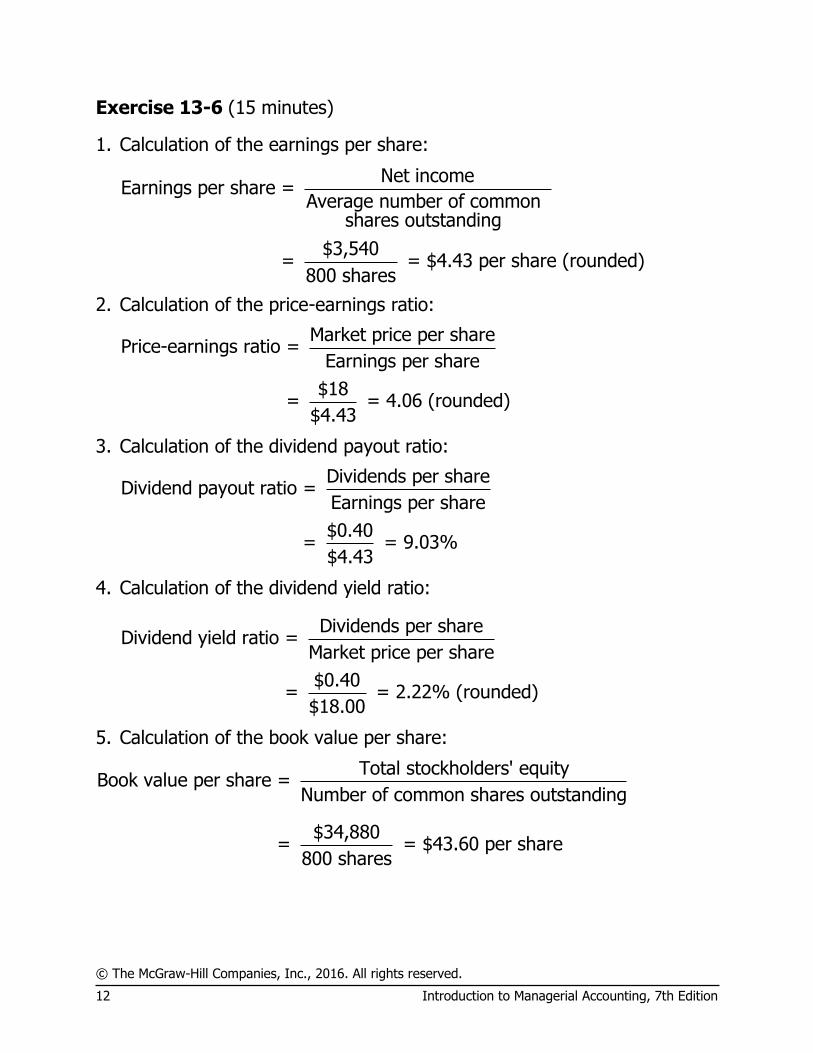
Exercise 13-6 (15 minutes)
1. Calculation of the earnings per share:
Net incomeEarnings per share =
Average number of common shares outstanding
$3,540= = $4.43 per share (rounded)
800 shares
2. Calculation of the price-earnings ratio:
Market price per sharePrice-earnings ratio =
Earnings per share
$18= = 4.06 (rounded)
$4.43
3. Calculation of the dividend payout ratio:
Dividends per shareDividend payout ratio =
Earnings per share
$0.40= = 9.03%
$4.43
4. Calculation of the dividend yield ratio:
Dividends per shareDividend yield ratio =
Market price per share
$0.40= = 2.22% (rounded)
$18.00
5. Calculation of the book value per share:
Total stockholders' equityBook value per share =
Number of common shares outstanding
$34,880= = $43.60 per share
800 shares
© The McGraw-Hill Companies, Inc., 2016. All rights reserved.
Solutions Manual, Chapter 13 13
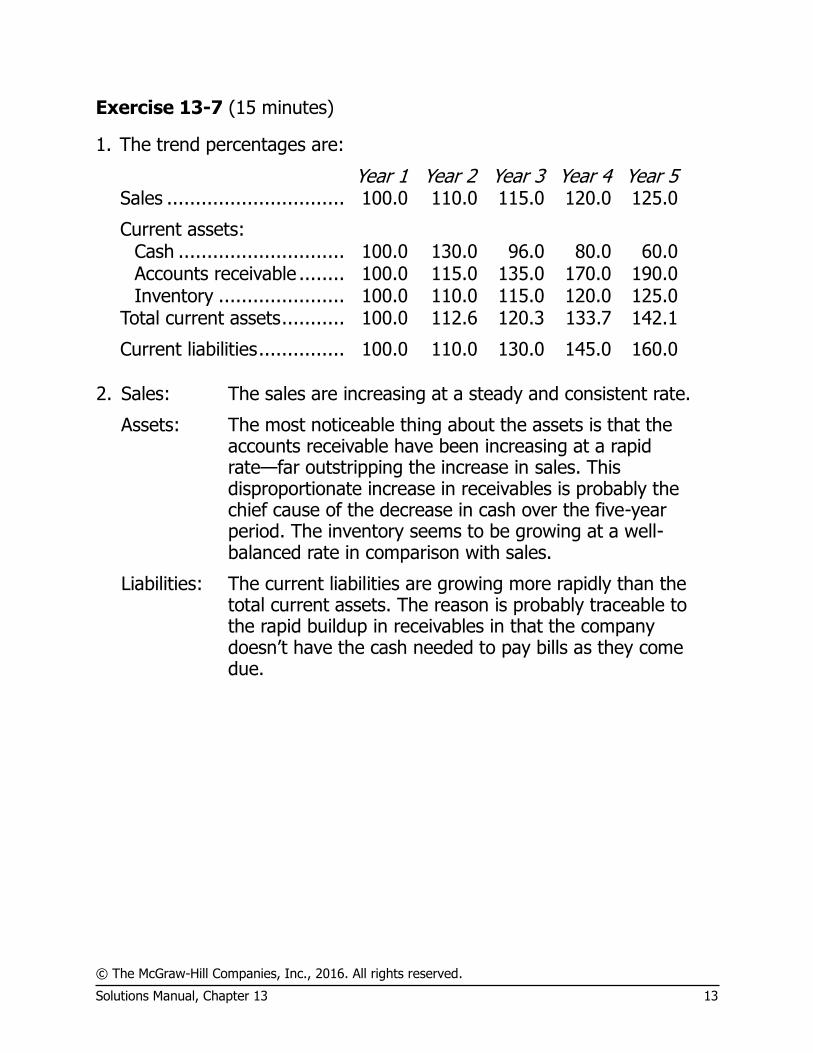
Exercise 13-7 (15 minutes)
1. The trend percentages are:
Year 1 Year 2 Year 3 Year 4 Year 5 Sales ............................... 100.0 110.0 115.0 120.0 125.0
Current assets: Cash ............................. 100.0 130.0 96.0 80.0 60.0 Accounts receivable ........ 100.0 115.0 135.0 170.0 190.0 Inventory ...................... 100.0 110.0 115.0 120.0 125.0
Total current assets ........... 100.0 112.6 120.3 133.7 142.1
Current liabilities ............... 100.0 110.0 130.0 145.0 160.0 2. Sales: The sales are increasing at a steady and consistent rate.
Assets:
The most noticeable thing about the assets is that the accounts receivable have been increasing at a rapid rate—far outstripping the increase in sales. This disproportionate increase in receivables is probably the chief cause of the decrease in cash over the five-year period. The inventory seems to be growing at a well-balanced rate in comparison with sales.
Liabilities:
The current liabilities are growing more rapidly than the total current assets. The reason is probably traceable to the rapid buildup in receivables in that the company doesn’t have the cash needed to pay bills as they come due.
© The McGraw-Hill Companies, Inc., 2016. All rights reserved.
14 Introduction to Managerial Accounting, 7th Edition
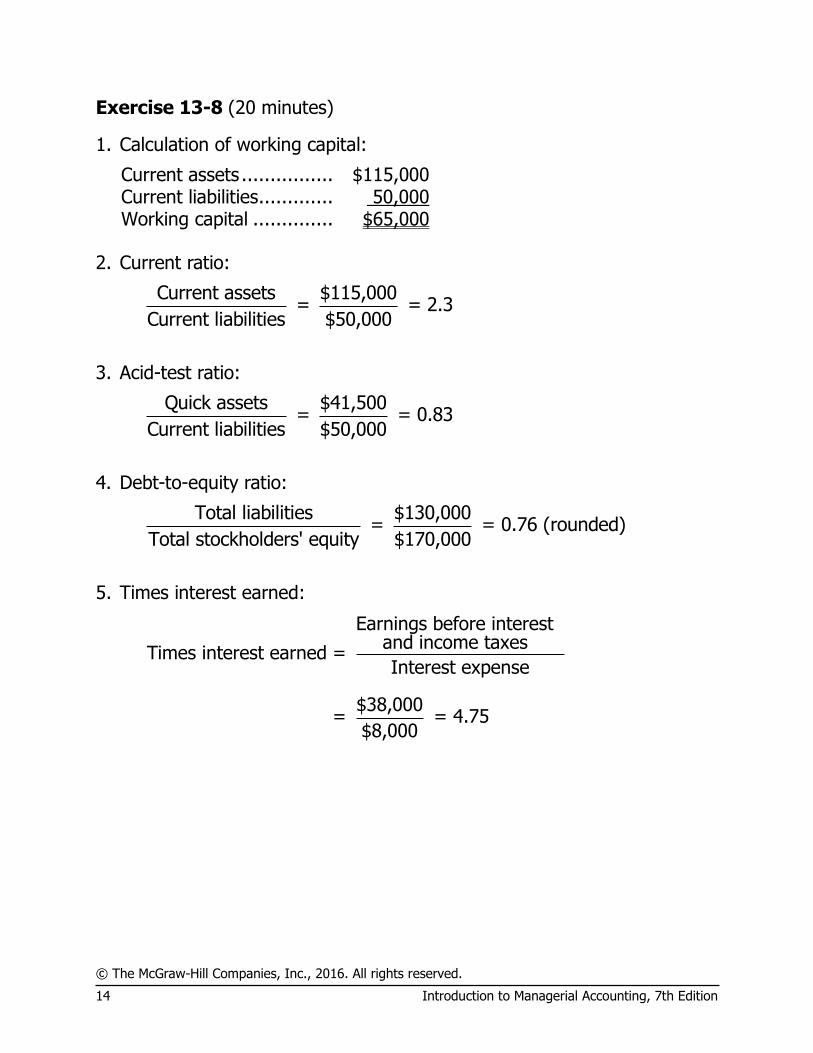
Exercise 13-8 (20 minutes)
1. Calculation of working capital:
Current assets ................ $115,000 Current liabilities ............. 50,000 Working capital .............. $65,000
2. Current ratio:
Current assets $115,000
= = 2.3Current liabilities $50,000
3. Acid-test ratio:
Quick assets $41,500
= = 0.83Current liabilities $50,000
4. Debt-to-equity ratio:
Total liabilities $130,000
= = 0.76 (rounded)Total stockholders' equity $170,000
5. Times interest earned:
Earnings before interest and income taxes
Times interest earned = Interest expense
$38,000= = 4.75
$8,000
© The McGraw-Hill Companies, Inc., 2016. All rights reserved.
Solutions Manual, Chapter 13 15
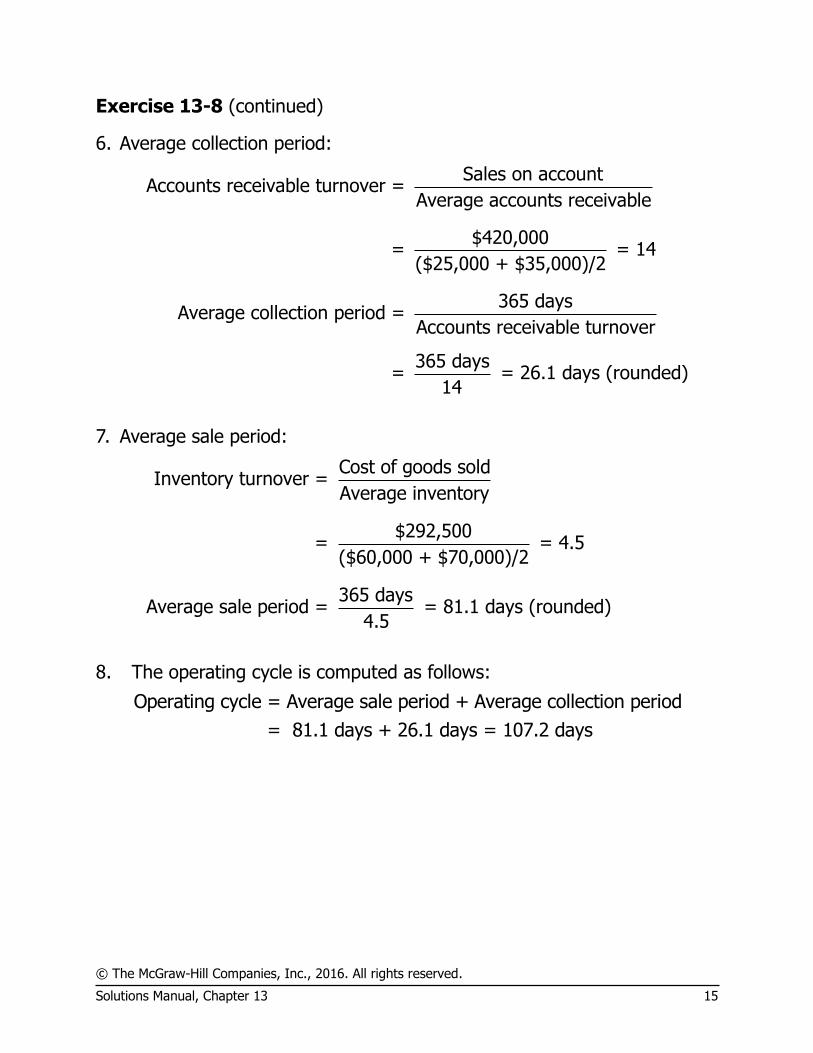
Exercise 13-8 (continued)
6. Average collection period:
Sales on accountAccounts receivable turnover =
Average accounts receivable
$420,000= = 14
($25,000 + $35,000)/2
365 daysAverage collection period =
Accounts receivable turnover
365 days= = 26.1 days (
14rounded)
7. Average sale period:
Cost of goods soldInventory turnover =
Average inventory
$292,500= = 4.5
($60,000 + $70,000)/2
365 daysAverage sale period = = 81.1 days (rounded)
4.5
8. The operating cycle is computed as follows:
Operating cycle = Average sale period + Average collection period
= 81.1 days + 26.1 days = 107.2 days
© The McGraw-Hill Companies, Inc., 2016. All rights reserved.
16 Introduction to Managerial Accounting, 7th Edition
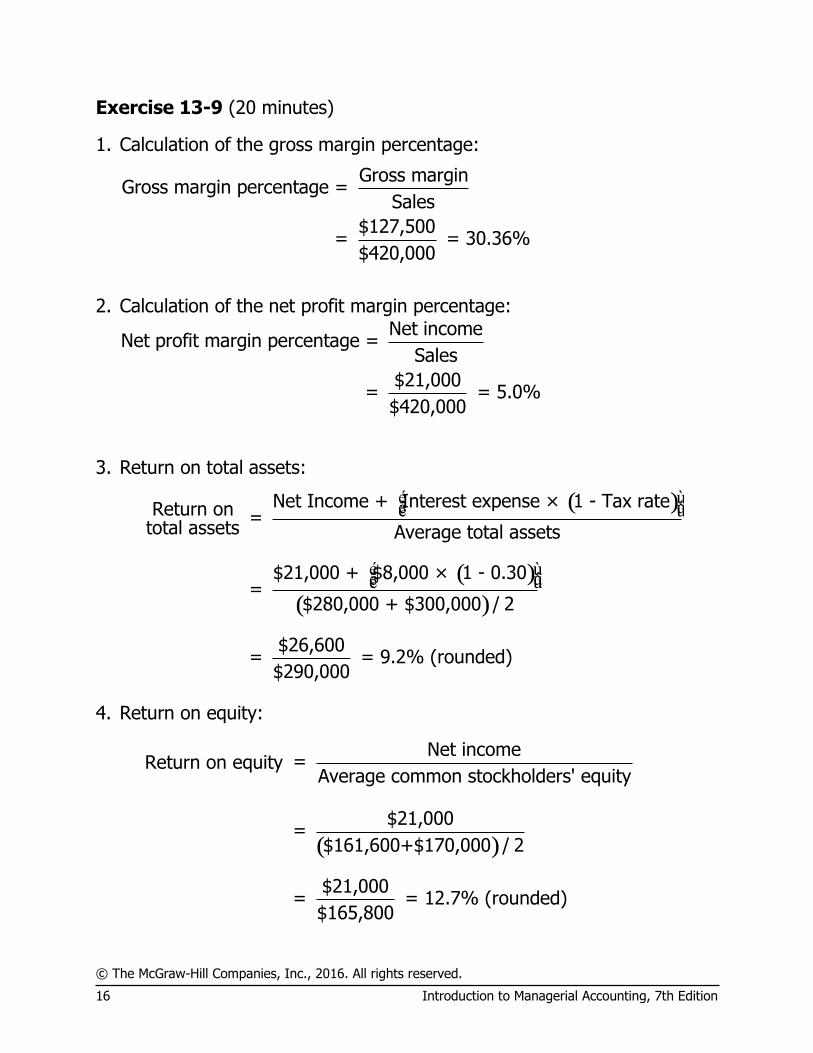
Exercise 13-9 (20 minutes)
1. Calculation of the gross margin percentage:
Gross marginGross margin percentage =
Sales
$127,500= = 30.36%
$420,000
2. Calculation of the net profit margin percentage:
Net incomeNet profit margin percentage =
Sales
$21,000= = 5.0%
$420,000
3. Return on total assets:
( )
( )
( )
Net Income + Interest expense × 1 - Tax rate Return on = total assets Average total assets
$21,000 + $8,000 × 1 - 0.30=
$280,000 + $300,000 / 2
$26,600 = = 9.2% (rounded)
$290,000
é ùê úë û
é ùê úë û
4. Return on equity:
( )
Net income = Return on equity
Average common stockholders' equity
$21,000=
$161,600+$170,000 / 2
$21,000= = 12.7% (rounded)
$165,800
© The McGraw-Hill Companies, Inc., 2016. All rights reserved.
Solutions Manual, Chapter 13 17
Exercise 13-9 (continued)
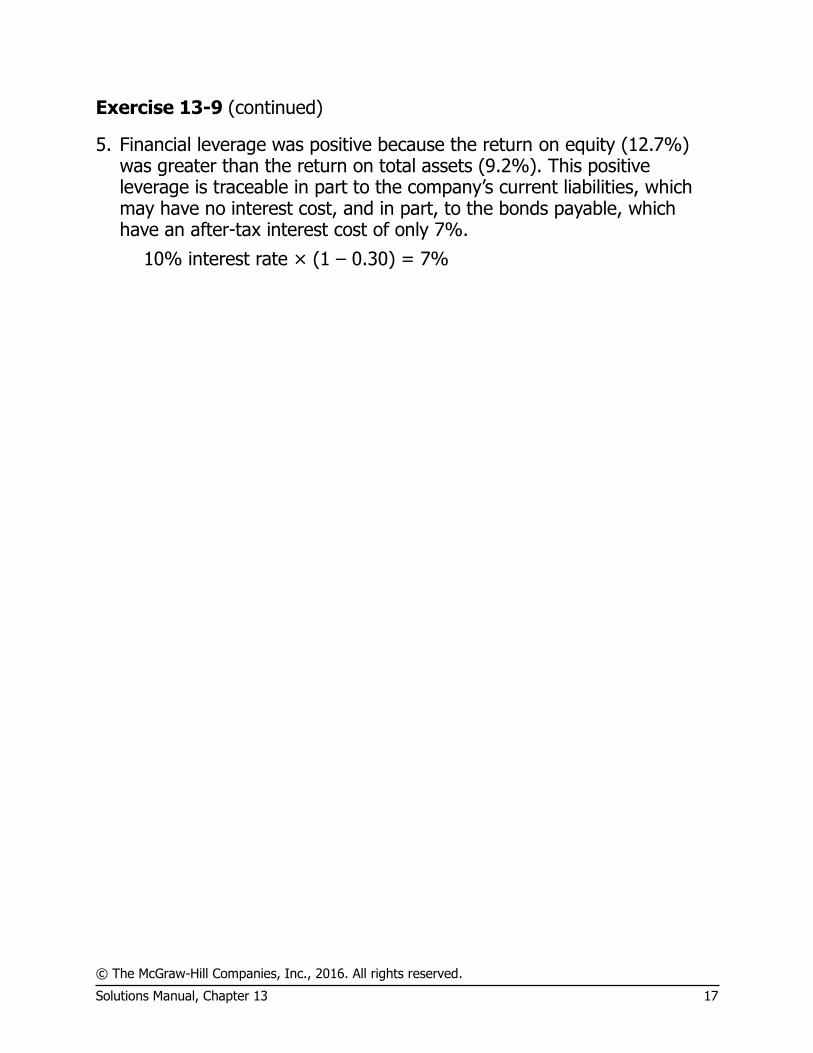
5. Financial leverage was positive because the return on equity (12.7%) was greater than the return on total assets (9.2%). This positive leverage is traceable in part to the company’s current liabilities, which may have no interest cost, and in part, to the bonds payable, which have an after-tax interest cost of only 7%.
10% interest rate × (1 – 0.30) = 7%
© The McGraw-Hill Companies, Inc., 2016. All rights reserved.
18 Introduction to Managerial Accounting, 7th Edition
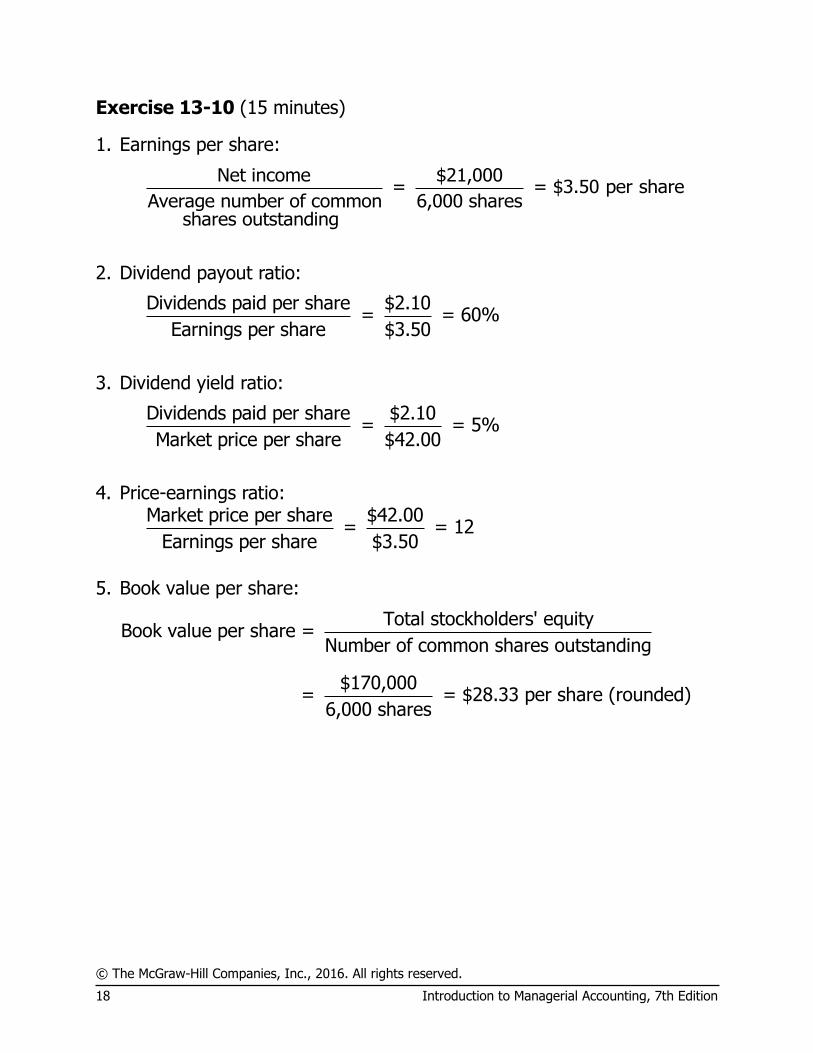
Exercise 13-10 (15 minutes)
1. Earnings per share:
Net income $21,000
= = $3.50 per shareAverage number of common 6,000 shares shares outstanding
2. Dividend payout ratio:
Dividends paid per share $2.10
= = 60%Earnings per share $3.50
3. Dividend yield ratio:
Dividends paid per share $2.10
= = 5%Market price per share $42.00
4. Price-earnings ratio:
Market price per share $42.00
= = 12Earnings per share $3.50
5. Book value per share:
Total stockholders' equityBook value per share =
Number of common shares outstanding
$170,000= = $28.33 per share (rounded)
6,000 shares
© The McGraw-Hill Companies, Inc., 2016. All rights reserved.
Solutions Manual, Chapter 13 19
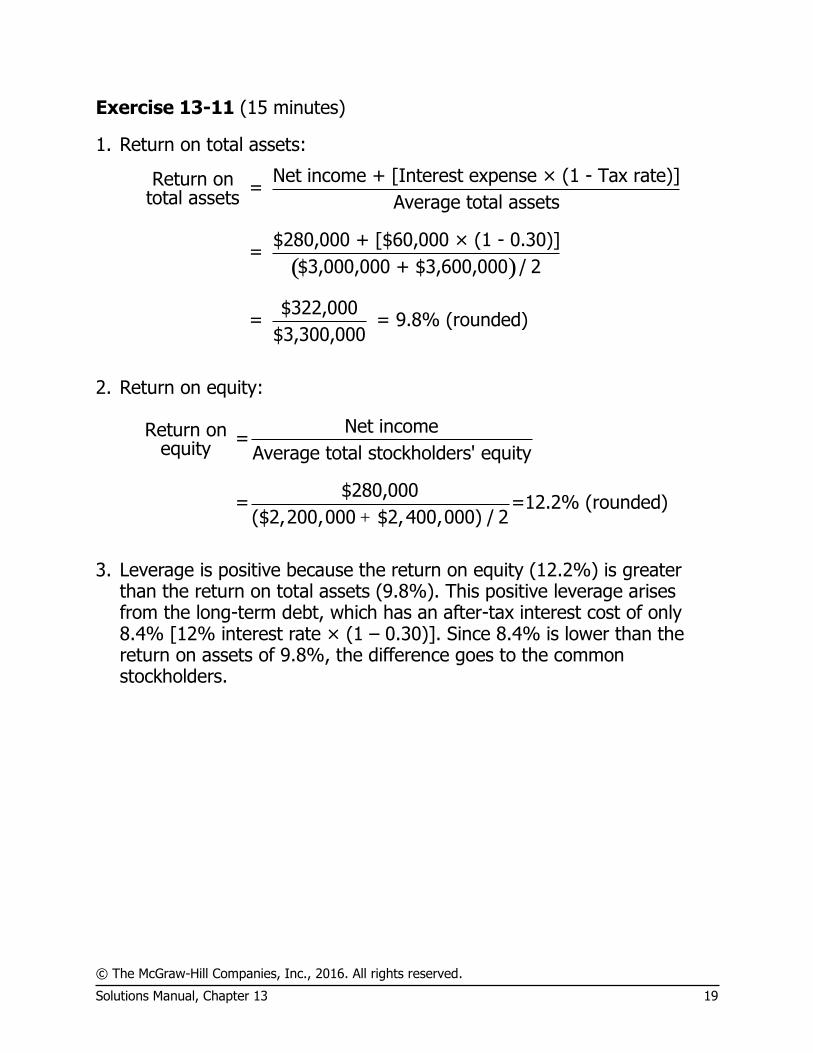
Exercise 13-11 (15 minutes)
1. Return on total assets:
( )
Net income + [Interest expense × (1 - Tax rate)] Return on = total assets Average total assets
$280,000 + [$60,000 × (1 - 0.30)]=
$3,000,000 + $3,600,000 / 2
$322,000= = 9.8% (rounded)
$3,300,000
2. Return on equity:
Net incomeReturn on =equity Average total stockholders' equity
$280,000= =12.2% (rounded)
($2,200,000 $2,400,000) / 2+
3. Leverage is positive because the return on equity (12.2%) is greater
than the return on total assets (9.8%). This positive leverage arises from the long-term debt, which has an after-tax interest cost of only 8.4% [12% interest rate × (1 – 0.30)]. Since 8.4% is lower than the return on assets of 9.8%, the difference goes to the common stockholders.
© The McGraw-Hill Companies, Inc., 2016. All rights reserved.
20 Introduction to Managerial Accounting, 7th Edition
Exercise 13-12 (15 minutes)
1. Current assets ($90,000 + $260,000 + $490,000 + $10,000) ............ $850,000
Current liabilities ($850,000 ÷ 2.5) .............................. 340,000 Working capital .......................................................... $510,000 2. Cash + Marketable securities + Accounts receivableAcid-test =
ratio Current liabilities
$90,000 + $0 + $260,000= = 1.03 (rounded)
$340,000
3. a. Working capital would not be affected by a $40,000 payment on
accounts payable:
Current assets ($850,000 – $40,000) ............ $810,000 Current liabilities ($340,000 – $40,000) ......... 300,000 Working capital ........................................... $510,000
b. The current ratio would increase if the company makes a $40,000
payment on accounts payable:
Current assetsCurrent ratio =
Current liabilities
$810,000= = 2.7
$300,000
© The McGraw-Hill Companies, Inc., 2016. All rights reserved.
Solutions Manual, Chapter 13 21
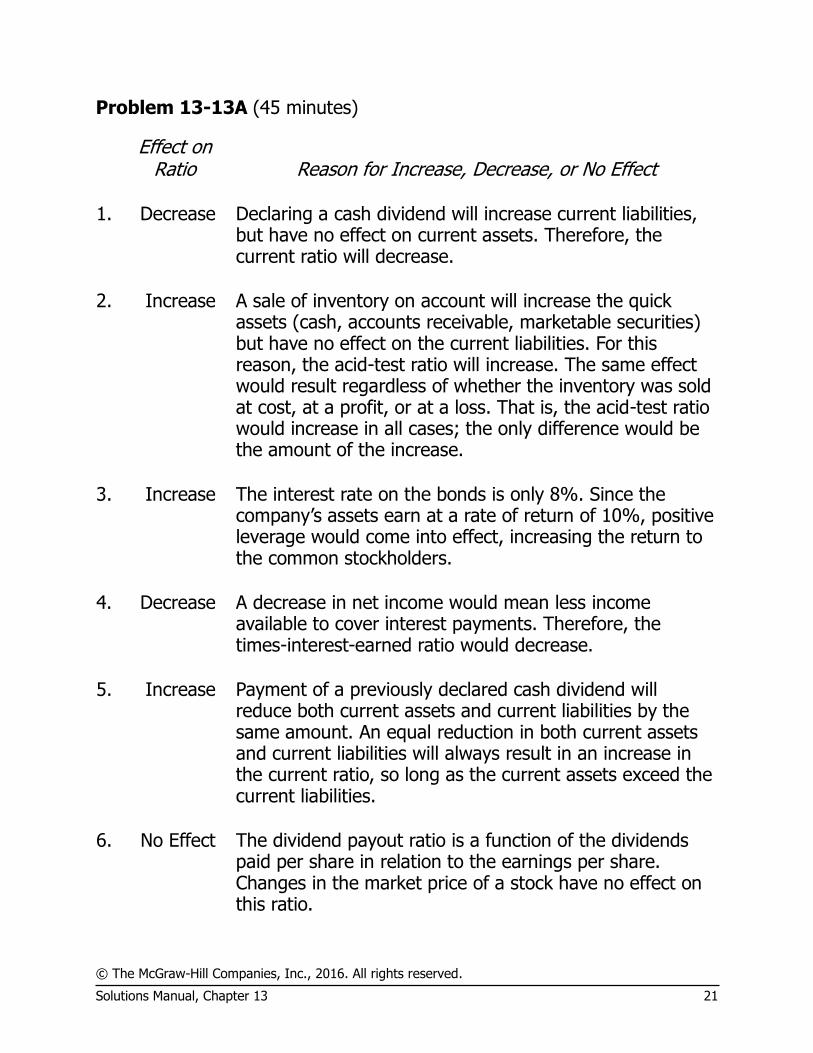
Problem 13-13A (45 minutes)
Effect on Ratio
Reason for Increase, Decrease, or No Effect
1. Decrease
Declaring a cash dividend will increase current liabilities, but have no effect on current assets. Therefore, the current ratio will decrease.
2. Increase
A sale of inventory on account will increase the quick assets (cash, accounts receivable, marketable securities) but have no effect on the current liabilities. For this reason, the acid-test ratio will increase. The same effect would result regardless of whether the inventory was sold at cost, at a profit, or at a loss. That is, the acid-test ratio would increase in all cases; the only difference would be the amount of the increase.
3. Increase
The interest rate on the bonds is only 8%. Since the company’s assets earn at a rate of return of 10%, positive leverage would come into effect, increasing the return to the common stockholders.
4. Decrease
A decrease in net income would mean less income available to cover interest payments. Therefore, the times-interest-earned ratio would decrease.
5. Increase
Payment of a previously declared cash dividend will reduce both current assets and current liabilities by the same amount. An equal reduction in both current assets and current liabilities will always result in an increase in the current ratio, so long as the current assets exceed the current liabilities.
6. No Effect
The dividend payout ratio is a function of the dividends paid per share in relation to the earnings per share. Changes in the market price of a stock have no effect on this ratio.
© The McGraw-Hill Companies, Inc., 2016. All rights reserved.
22 Introduction to Managerial Accounting, 7th Edition
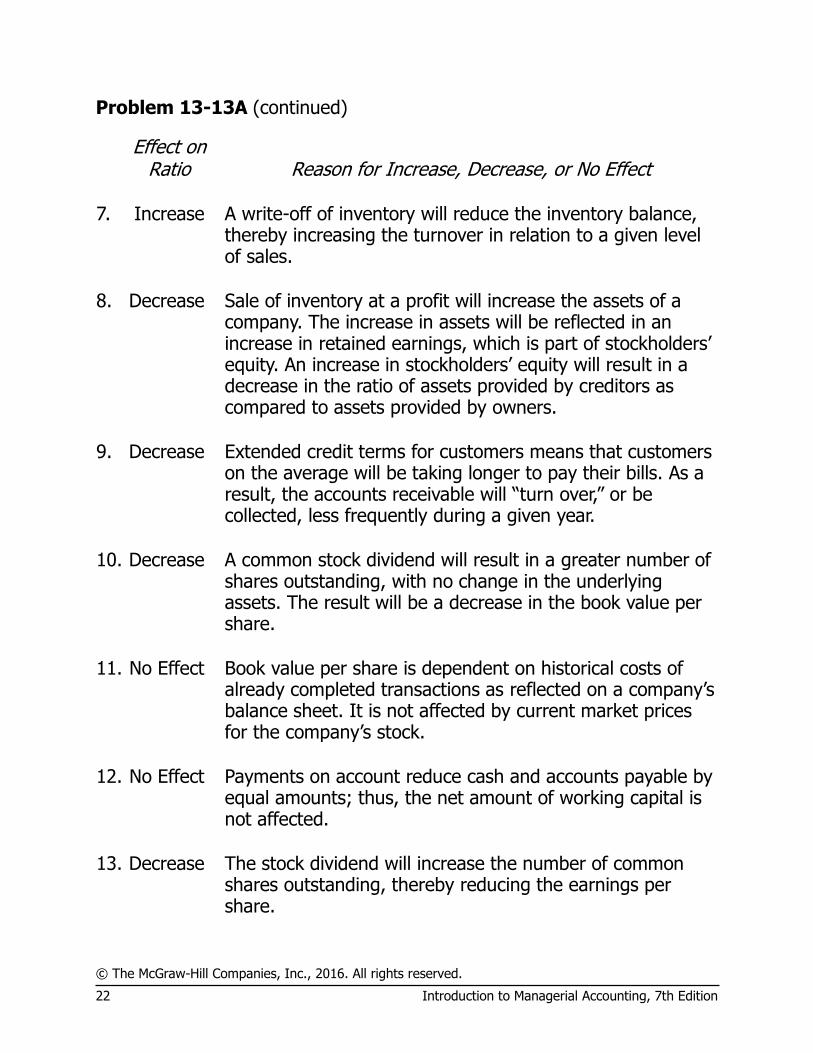
Problem 13-13A (continued)
Effect on Ratio
Reason for Increase, Decrease, or No Effect
7. Increase
A write-off of inventory will reduce the inventory balance, thereby increasing the turnover in relation to a given level of sales.
8. Decrease
Sale of inventory at a profit will increase the assets of a company. The increase in assets will be reflected in an increase in retained earnings, which is part of stockholders’ equity. An increase in stockholders’ equity will result in a decrease in the ratio of assets provided by creditors as compared to assets provided by owners.
9. Decrease
Extended credit terms for customers means that customers on the average will be taking longer to pay their bills. As a result, the accounts receivable will “turn over,” or be collected, less frequently during a given year.
10. Decrease
A common stock dividend will result in a greater number of shares outstanding, with no change in the underlying assets. The result will be a decrease in the book value per share.
11. No Effect
Book value per share is dependent on historical costs of already completed transactions as reflected on a company’s balance sheet. It is not affected by current market prices for the company’s stock.
12. No Effect
Payments on account reduce cash and accounts payable by equal amounts; thus, the net amount of working capital is not affected.
13. Decrease
The stock dividend will increase the number of common shares outstanding, thereby reducing the earnings per share.
© The McGraw-Hill Companies, Inc., 2016. All rights reserved.
Solutions Manual, Chapter 13 23
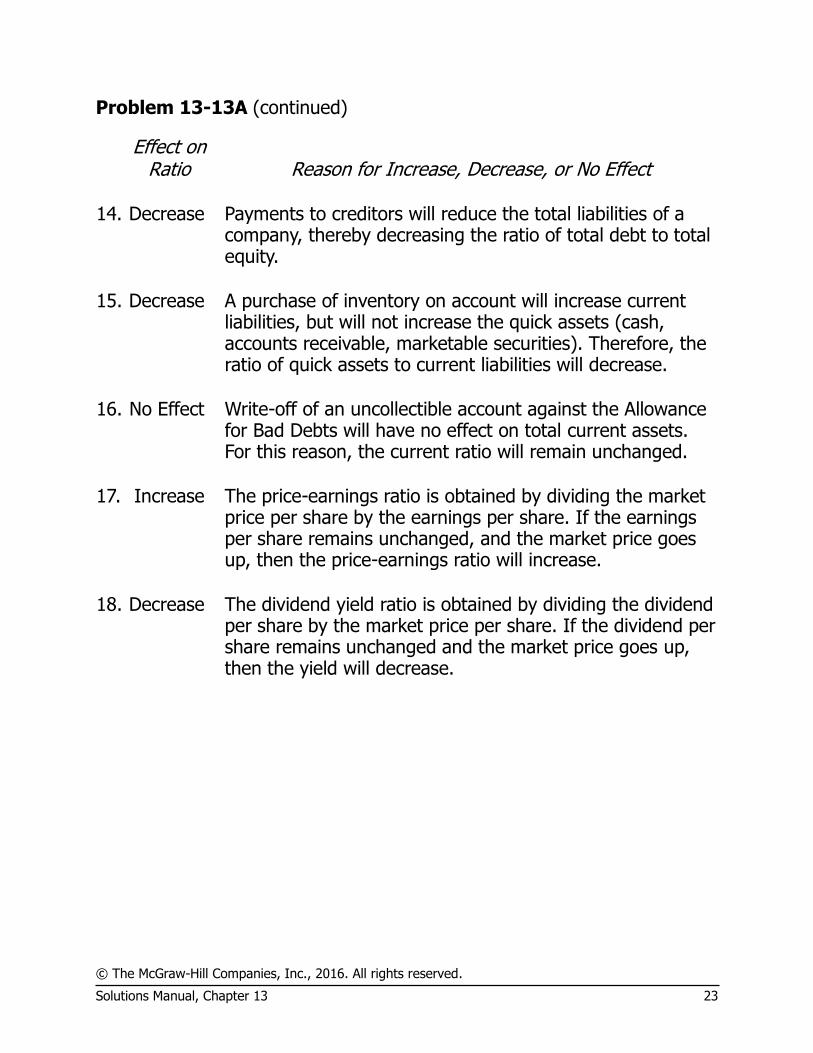
Problem 13-13A (continued)
Effect on Ratio
Reason for Increase, Decrease, or No Effect
14. Decrease
Payments to creditors will reduce the total liabilities of a company, thereby decreasing the ratio of total debt to total equity.
15. Decrease
A purchase of inventory on account will increase current liabilities, but will not increase the quick assets (cash, accounts receivable, marketable securities). Therefore, the ratio of quick assets to current liabilities will decrease.
16. No Effect
Write-off of an uncollectible account against the Allowance for Bad Debts will have no effect on total current assets. For this reason, the current ratio will remain unchanged.
17. Increase
The price-earnings ratio is obtained by dividing the market price per share by the earnings per share. If the earnings per share remains unchanged, and the market price goes up, then the price-earnings ratio will increase.
18. Decrease
The dividend yield ratio is obtained by dividing the dividend per share by the market price per share. If the dividend per share remains unchanged and the market price goes up, then the yield will decrease.
© The McGraw-Hill Companies, Inc., 2016. All rights reserved.
24 Introduction to Managerial Accounting, 7th Edition
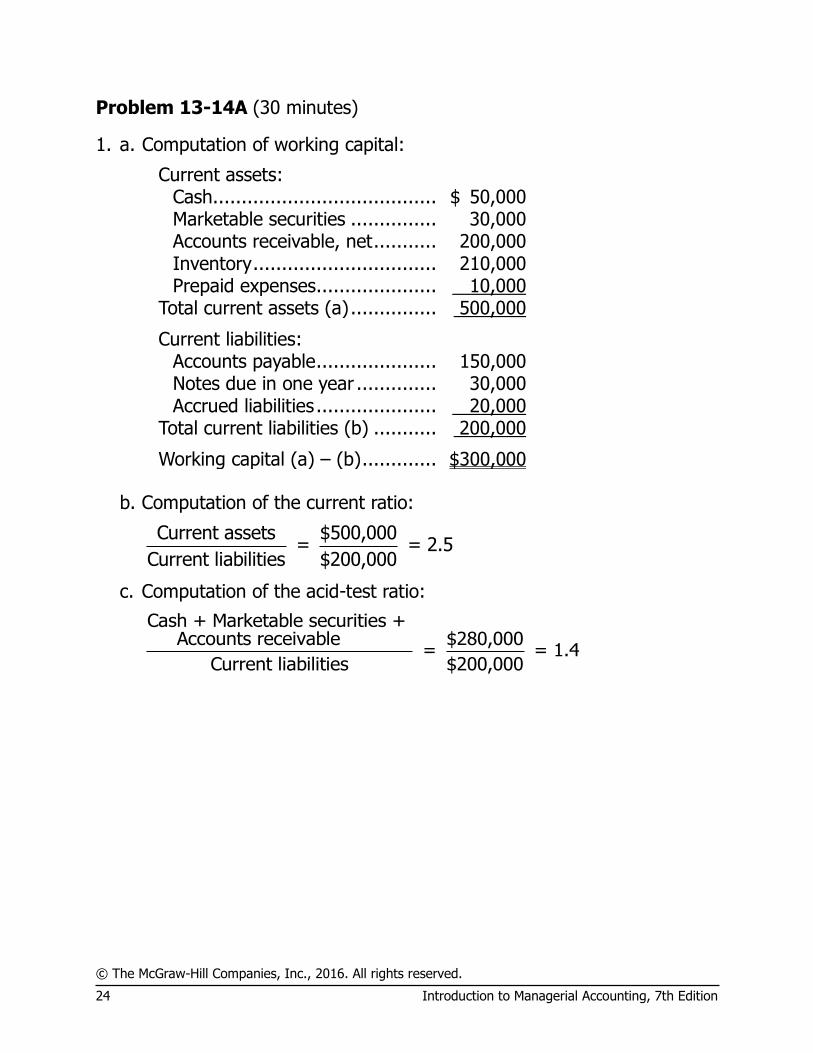
Problem 13-14A (30 minutes)
1. a. Computation of working capital:
Current assets: Cash ....................................... $ 50,000 Marketable securities ............... 30,000 Accounts receivable, net ........... 200,000 Inventory ................................ 210,000 Prepaid expenses ..................... 10,000
Total current assets (a) ............... 500,000
Current liabilities: Accounts payable ..................... 150,000 Notes due in one year .............. 30,000 Accrued liabilities ..................... 20,000
Total current liabilities (b) ........... 200,000
Working capital (a) – (b) ............. $300,000 b. Computation of the current ratio:
Current assets $500,000
= = 2.5Current liabilities $200,000
c. Computation of the acid-test ratio:
Cash + Marketable securities + Accounts receivable $280,000
= = 1.4Current liabilities $200,000
© The McGraw-Hill Companies, Inc., 2016. All rights reserved.
Solutions Manual, Chapter 13 25
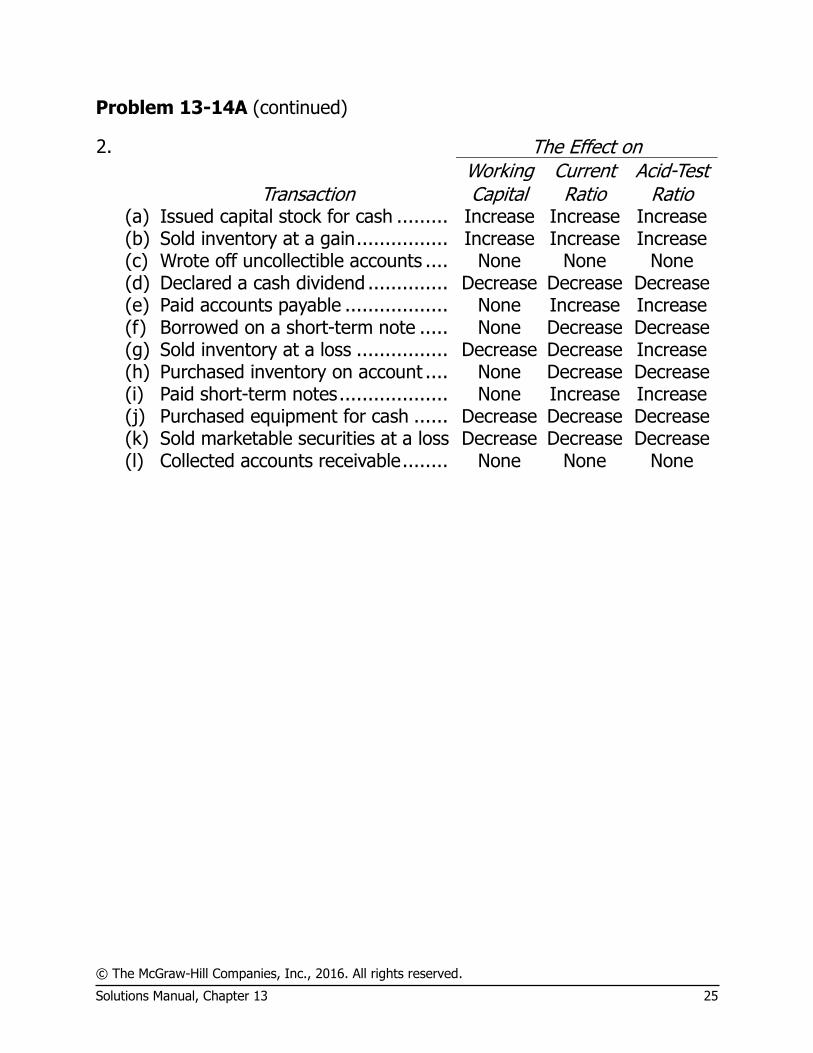
Problem 13-14A (continued)
2. The Effect on Working Current Acid-Test Transaction Capital Ratio Ratio (a) Issued capital stock for cash ......... Increase Increase Increase (b) Sold inventory at a gain ................ Increase Increase Increase (c) Wrote off uncollectible accounts .... None None None (d) Declared a cash dividend .............. Decrease Decrease Decrease (e) Paid accounts payable .................. None Increase Increase (f) Borrowed on a short-term note ..... None Decrease Decrease (g) Sold inventory at a loss ................ Decrease Decrease Increase (h) Purchased inventory on account .... None Decrease Decrease (i) Paid short-term notes ................... None Increase Increase (j) Purchased equipment for cash ...... Decrease Decrease Decrease (k) Sold marketable securities at a loss Decrease Decrease Decrease (l) Collected accounts receivable ........ None None None
© The McGraw-Hill Companies, Inc., 2016. All rights reserved.
26 Introduction to Managerial Accounting, 7th Edition
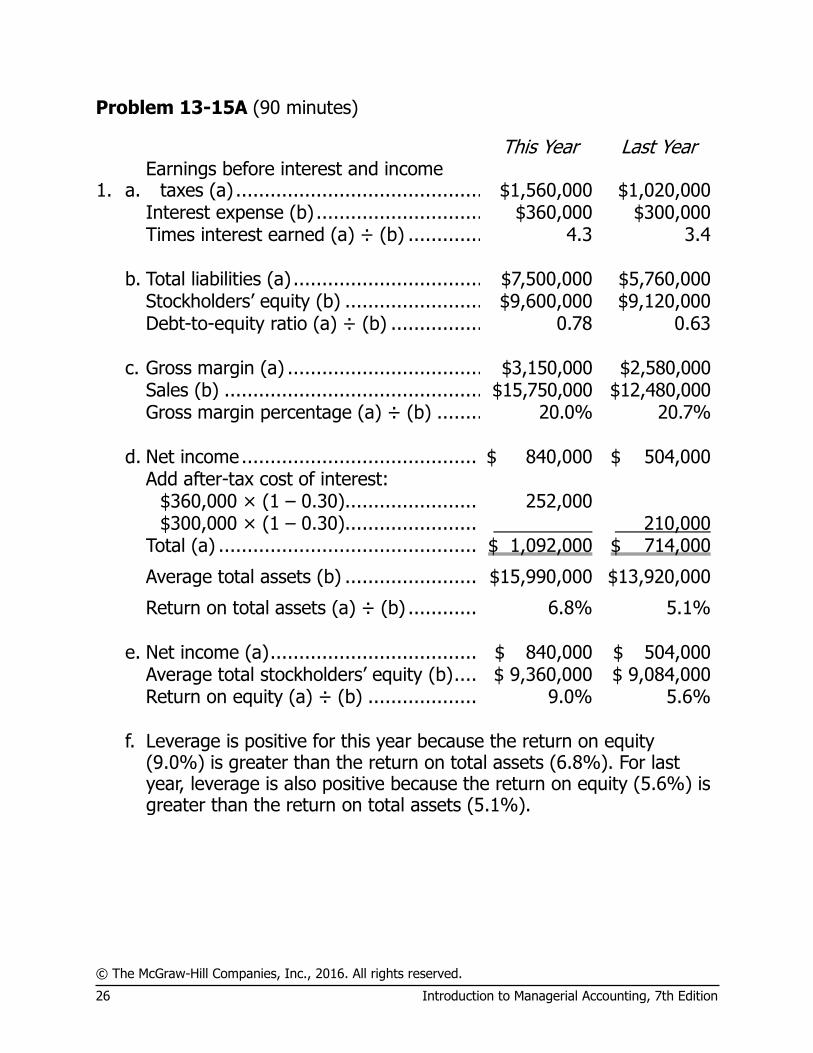
Problem 13-15A (90 minutes)
This Year Last Year
1. a. Earnings before interest and income
taxes (a) ................................................................... $1,560,000 $1,020,000 Interest expense (b) ..................................................... $360,000 $300,000 Times interest earned (a) ÷ (b) ..................................... 4.3 3.4 b. Total liabilities (a) ......................................................... $7,500,000 $5,760,000 Stockholders’ equity (b) ................................................ $9,600,000 $9,120,000 Debt-to-equity ratio (a) ÷ (b) ........................................ 0.78 0.63 c. Gross margin (a) .................................. $3,150,000 $2,580,000 Sales (b) ............................................. $15,750,000 $12,480,000 Gross margin percentage (a) ÷ (b) ........ 20.0% 20.7% d. Net income ......................................... $ 840,000 $ 504,000 Add after-tax cost of interest: $360,000 × (1 – 0.30) ....................... 252,000 $300,000 × (1 – 0.30) ....................... 210,000 Total (a) ............................................. $ 1,092,000 $ 714,000
Average total assets (b) ....................... $15,990,000 $13,920,000
Return on total assets (a) ÷ (b) ............ 6.8% 5.1% e. Net income (a) .................................... $ 840,000 $ 504,000 Average total stockholders’ equity (b) .... $ 9,360,000 $ 9,084,000 Return on equity (a) ÷ (b) ................... 9.0% 5.6%
f. Leverage is positive for this year because the return on equity (9.0%) is greater than the return on total assets (6.8%). For last year, leverage is also positive because the return on equity (5.6%) is greater than the return on total assets (5.1%).
© The McGraw-Hill Companies, Inc., 2016. All rights reserved.
Solutions Manual, Chapter 13 27
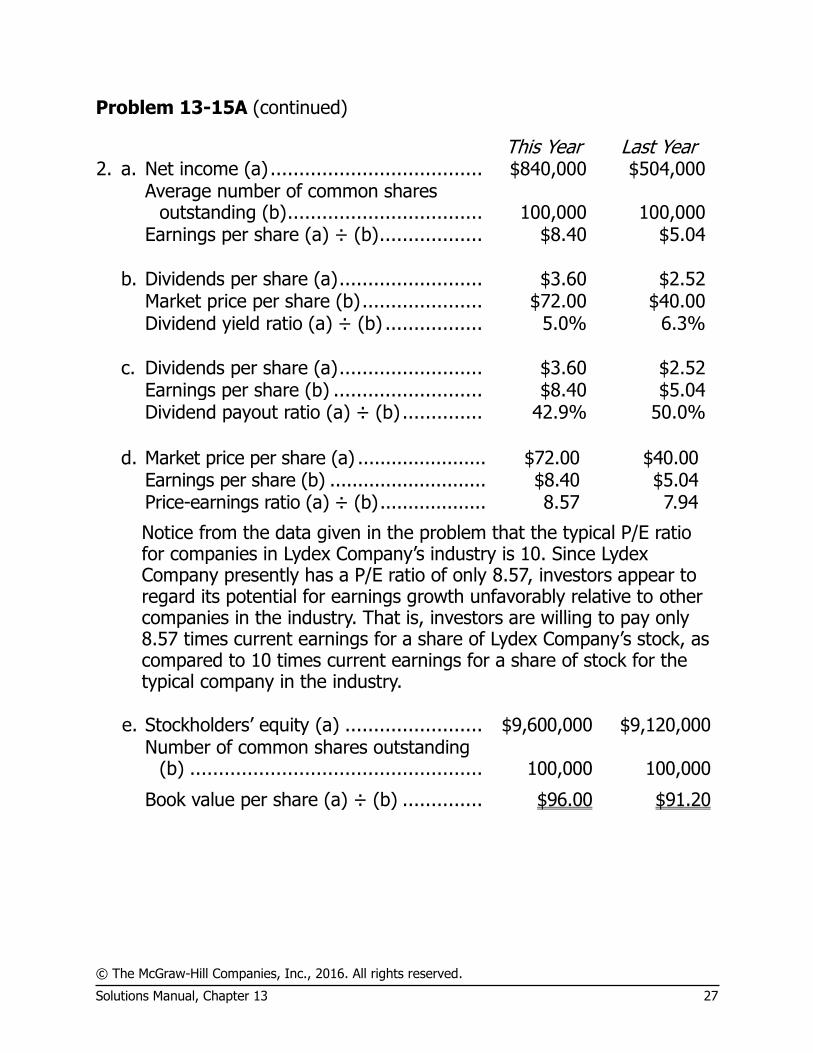
Problem 13-15A (continued)
This Year Last Year 2. a. Net income (a) ..................................... $840,000 $504,000
Average number of common shares
outstanding (b) .................................. 100,000 100,000 Earnings per share (a) ÷ (b) .................. $8.40 $5.04 b. Dividends per share (a) ......................... $3.60 $2.52 Market price per share (b) ..................... $72.00 $40.00 Dividend yield ratio (a) ÷ (b) ................. 5.0% 6.3% c. Dividends per share (a) ......................... $3.60 $2.52 Earnings per share (b) .......................... $8.40 $5.04 Dividend payout ratio (a) ÷ (b) .............. 42.9% 50.0%
d. Market price per share (a) ....................... $72.00 $40.00 Earnings per share (b) ............................ $8.40 $5.04 Price-earnings ratio (a) ÷ (b) ................... 8.57 7.94
Notice from the data given in the problem that the typical P/E ratio for companies in Lydex Company’s industry is 10. Since Lydex Company presently has a P/E ratio of only 8.57, investors appear to regard its potential for earnings growth unfavorably relative to other companies in the industry. That is, investors are willing to pay only 8.57 times current earnings for a share of Lydex Company’s stock, as compared to 10 times current earnings for a share of stock for the typical company in the industry.
e. Stockholders’ equity (a) ........................ $9,600,000 $9,120,000
Number of common shares outstanding
(b) ................................................... 100,000 100,000
Book value per share (a) ÷ (b) .............. $96.00 $91.20
© The McGraw-Hill Companies, Inc., 2016. All rights reserved.
28 Introduction to Managerial Accounting, 7th Edition
Problem 13-15A (continued)
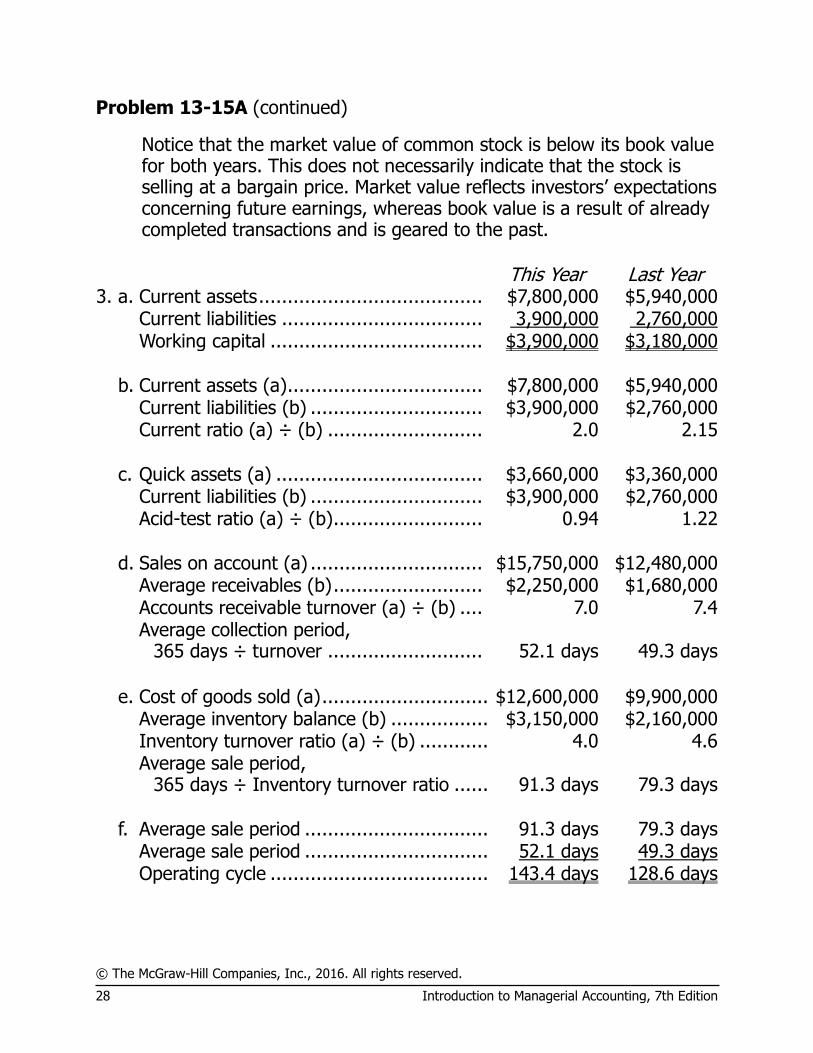
Notice that the market value of common stock is below its book value for both years. This does not necessarily indicate that the stock is selling at a bargain price. Market value reflects investors’ expectations concerning future earnings, whereas book value is a result of already completed transactions and is geared to the past.
This Year Last Year 3. a. Current assets ....................................... $7,800,000 $5,940,000 Current liabilities ................................... 3,900,000 2,760,000 Working capital ..................................... $3,900,000 $3,180,000 b. Current assets (a) .................................. $7,800,000 $5,940,000 Current liabilities (b) .............................. $3,900,000 $2,760,000 Current ratio (a) ÷ (b) ........................... 2.0 2.15 c. Quick assets (a) .................................... $3,660,000 $3,360,000 Current liabilities (b) .............................. $3,900,000 $2,760,000 Acid-test ratio (a) ÷ (b) .......................... 0.94 1.22 d. Sales on account (a) .............................. $15,750,000 $12,480,000 Average receivables (b) .......................... $2,250,000 $1,680,000 Accounts receivable turnover (a) ÷ (b) .... 7.0 7.4
Average collection period,
365 days ÷ turnover ........................... 52.1 days 49.3 days
e. Cost of goods sold (a) ................................................... $12,600,000 $9,900,000 Average inventory balance (b) ....................................... $3,150,000 $2,160,000 Inventory turnover ratio (a) ÷ (b) .................................. 4.0 4.6
Average sale period,
365 days ÷ Inventory turnover ratio ............................ 91.3 days 79.3 days f. Average sale period ...................................................... 91.3 days 79.3 days Average sale period ...................................................... 52.1 days 49.3 days Operating cycle ............................................................ 143.4 days 128.6 days
© The McGraw-Hill Companies, Inc., 2016. All rights reserved.
Solutions Manual, Chapter 13 29
Problem 13-15A (continued)
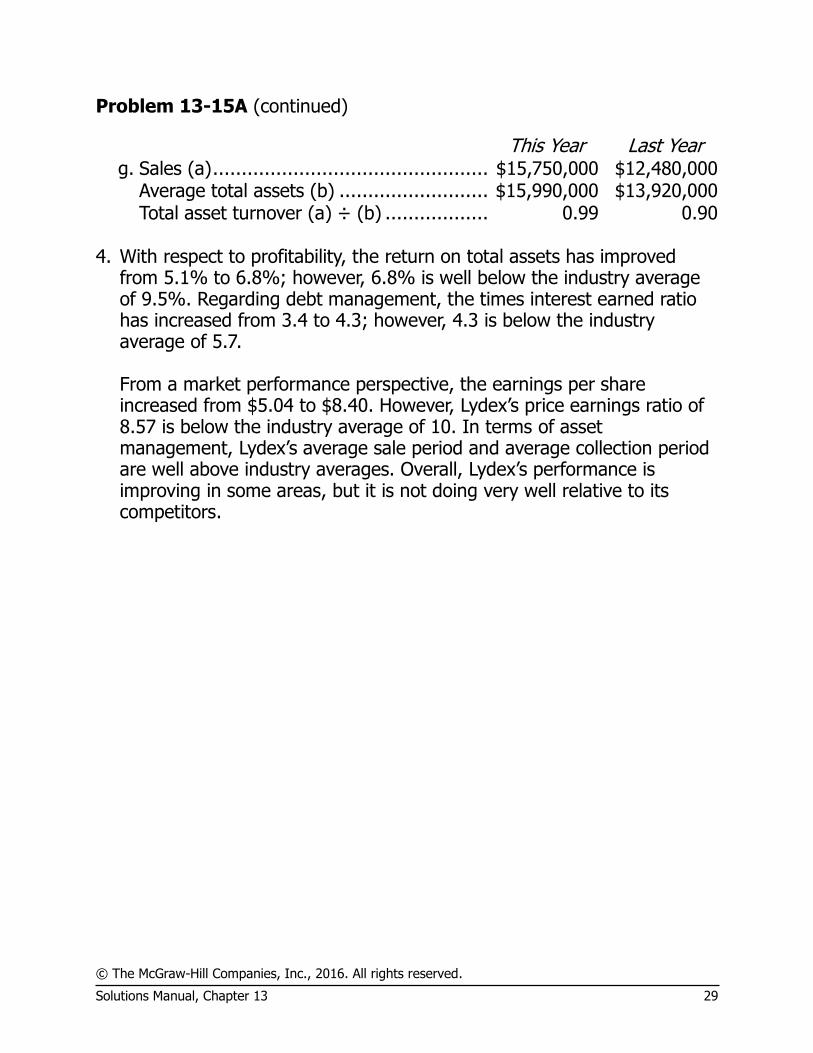
This Year Last Year g. Sales (a) ...................................................................... $15,750,000 $12,480,000 Average total assets (b) ................................................ $15,990,000 $13,920,000 Total asset turnover (a) ÷ (b) ........................................ 0.99 0.90 4. With respect to profitability, the return on total assets has improved
from 5.1% to 6.8%; however, 6.8% is well below the industry average of 9.5%. Regarding debt management, the times interest earned ratio has increased from 3.4 to 4.3; however, 4.3 is below the industry average of 5.7.
From a market performance perspective, the earnings per share
increased from $5.04 to $8.40. However, Lydex’s price earnings ratio of 8.57 is below the industry average of 10. In terms of asset management, Lydex’s average sale period and average collection period are well above industry averages. Overall, Lydex’s performance is improving in some areas, but it is not doing very well relative to its competitors.
© The McGraw-Hill Companies, Inc., 2016. All rights reserved.
30 Introduction to Managerial Accounting, 7th Edition
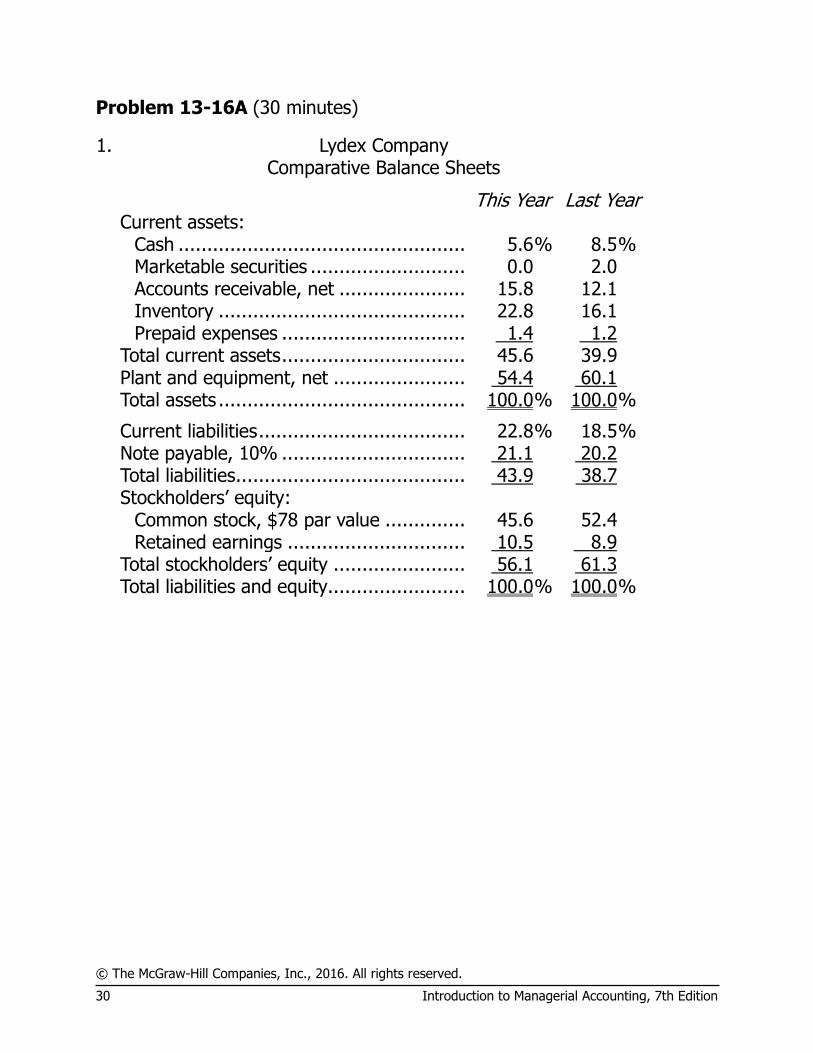
Problem 13-16A (30 minutes)
1. Lydex Company Comparative Balance Sheets
This Year Last Year Current assets:
Cash .................................................. 5.6 % 8.5 % Marketable securities ........................... 0.0 2.0 Accounts receivable, net ...................... 15.8 12.1 Inventory ........................................... 22.8 16.1 Prepaid expenses ................................ 1.4 1.2
Total current assets ................................ 45.6 39.9 Plant and equipment, net ....................... 54.4 60.1 Total assets ........................................... 100.0 % 100.0 %
Current liabilities .................................... 22.8 % 18.5 % Note payable, 10% ................................ 21.1 20.2 Total liabilities ........................................ 43.9 38.7 Stockholders’ equity:
Common stock, $78 par value .............. 45.6 52.4 Retained earnings ............................... 10.5 8.9
Total stockholders’ equity ....................... 56.1 61.3 Total liabilities and equity........................ 100.0 % 100.0 %
© The McGraw-Hill Companies, Inc., 2016. All rights reserved.
Solutions Manual, Chapter 13 31
Problem 13-16A (continued)
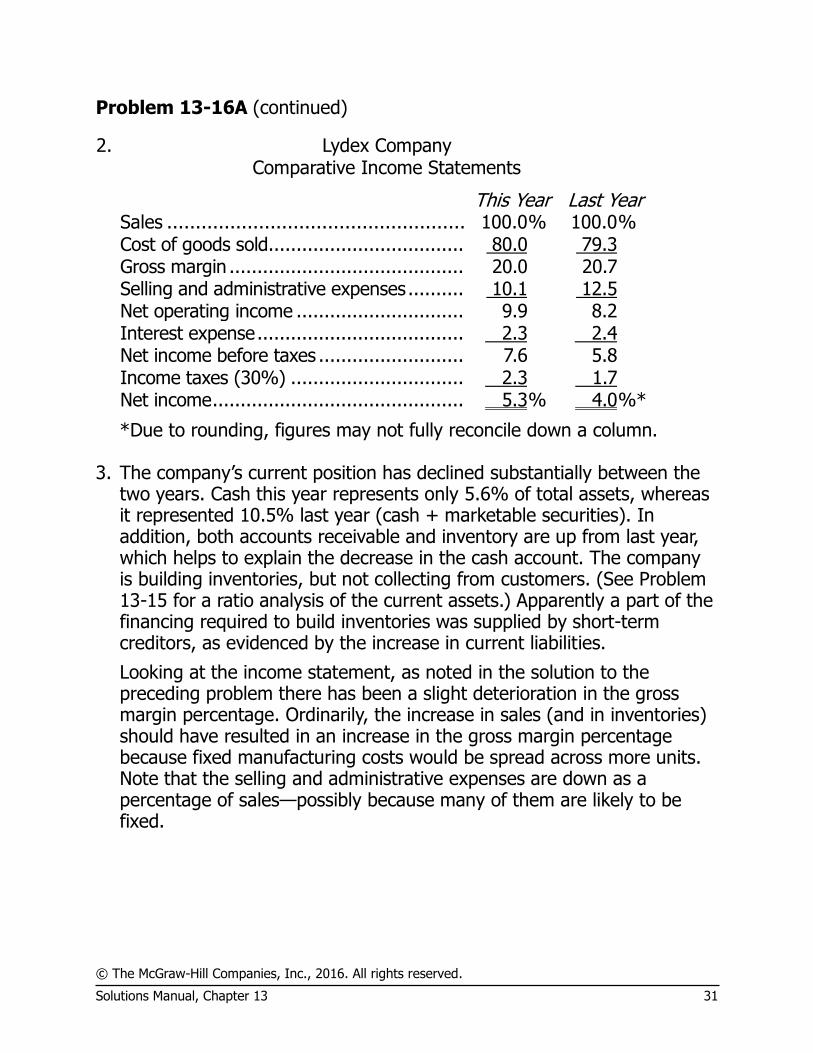
2. Lydex Company Comparative Income Statements
This Year Last Year Sales .................................................... 100.0 % 100.0 % Cost of goods sold ................................... 80.0 79.3 Gross margin .......................................... 20.0 20.7 Selling and administrative expenses .......... 10.1 12.5 Net operating income .............................. 9.9 8.2 Interest expense ..................................... 2.3 2.4 Net income before taxes .......................... 7.6 5.8 Income taxes (30%) ............................... 2.3 1.7 Net income ............................................. 5.3 % 4.0 %*
*Due to rounding, figures may not fully reconcile down a column. 3. The company’s current position has declined substantially between the
two years. Cash this year represents only 5.6% of total assets, whereas it represented 10.5% last year (cash + marketable securities). In addition, both accounts receivable and inventory are up from last year, which helps to explain the decrease in the cash account. The company is building inventories, but not collecting from customers. (See Problem 13-15 for a ratio analysis of the current assets.) Apparently a part of the financing required to build inventories was supplied by short-term creditors, as evidenced by the increase in current liabilities.
Looking at the income statement, as noted in the solution to the preceding problem there has been a slight deterioration in the gross margin percentage. Ordinarily, the increase in sales (and in inventories) should have resulted in an increase in the gross margin percentage because fixed manufacturing costs would be spread across more units. Note that the selling and administrative expenses are down as a percentage of sales—possibly because many of them are likely to be fixed.
© The McGraw-Hill Companies, Inc., 2016. All rights reserved.
32 Introduction to Managerial Accounting, 7th Edition
Problem 13-17A (30 minutes)
a. It is becoming more difficult for the company to pay its bills as they come due. Although the current ratio has improved over the three years, the acid-test ratio is down. Also notice that the accounts receivable and inventory are both turning more slowly, indicating that an increasing portion of the current assets is being made up of these items, from which bills cannot be paid.
b. Customers are paying their bills more slowly in Year 3 than in Year 1. This is evidenced by the decline in accounts receivable turnover.
c. The total of accounts receivable is increasing. This is evidenced both by a slowdown in turnover and in an increase in total sales.
d. The level of inventory undoubtedly is increasing. Notice that the inventory turnover is decreasing. Even if sales (and cost of goods sold) just remained constant, this would be evidence of a larger average inventory on hand. However, sales are not constant, but rather are increasing. With sales increasing (and undoubtedly cost of goods sold also increasing), the average level of inventory must be increasing as well to service the larger volume of sales.
e. The market price is going down. The dividends paid per share over the three-year period are unchanged, but the dividend yield is going up. Therefore, the market price per share of stock must be decreasing.
f. The amount of earnings per share is increasing. Again, the dividends paid per share have remained constant. However, the dividend payout ratio is decreasing. In order for the dividend payout ratio to be decreasing, the earnings per share must be increasing.
g. The price-earnings ratio is going down. If the market price of the stock is going down [see Part (e) above], and the earnings per share are going up [see Part (f) above], then the price-earnings ratio must be decreasing.
h. In Year 1 and in Year 2 there was negative leverage because in both years the return on total assets exceeded the return on common equity. In Year 3 there was positive leverage because in that year the return on common equity exceeded the return on total assets employed.

© The McGraw-Hill Companies, Inc., 2016. All rights reserved.
Solutions Manual, Chapter 13 33
Problem 13-18A (60 minutes)
This Year Last Year 1. a. Current assets ....................................... $1,520,000 $1,090,000 Current liabilities .................................... 800,000 430,000 Working capital ...................................... $ 720,000 $ 660,000 b. Current assets (a) .................................. $1,520,000 $1,090,000 Current liabilities (b) ............................... $800,000 $430,000 Current ratio (a) ÷ (b) ............................ 1.90 2.53 c. Quick assets (a) ..................................... $550,000 $468,000 Current liabilities (b) ............................... $800,000 $430,000 Acid-test ratio (a) ÷ (b) .......................... 0.69 1.09 d. Sales on account (a) .............................. $5,000,000 $4,350,000 Average receivables (b) .......................... $390,000 $275,000 Accounts receivable turnover (a) ÷ (b) ..... 12.8 15.8
Average collection period: 365 days ÷
Accounts receivable turnover ................ 28.5 days 23.1 days e. Cost of goods sold (a) ............................ $3,875,000 $3,450,000 Average inventory (b) ............................. $775,000 $550,000 Inventory turnover ratio(a) ÷ (b) ............. 5.0 6.3
Average sales period:
365 days ÷ Inventory turnover ratio ...... 73.0 days 57.9 days f. Average sale period ................................ 73.0 days 57.9 days Average collection period ........................ 28.5 days 23.1 days Operating cycle ...................................... 101.5 days 81.0 days g. Sales (a) ............................................... $5,000,000 $4,350,000 Average total assets (b) .......................... $2,730,000 $2,440,000 Total asset turnover (a) ÷ (b) .................. 1.83 1.78
© The McGraw-Hill Companies, Inc., 2016. All rights reserved.
34 Introduction to Managerial Accounting, 7th Edition
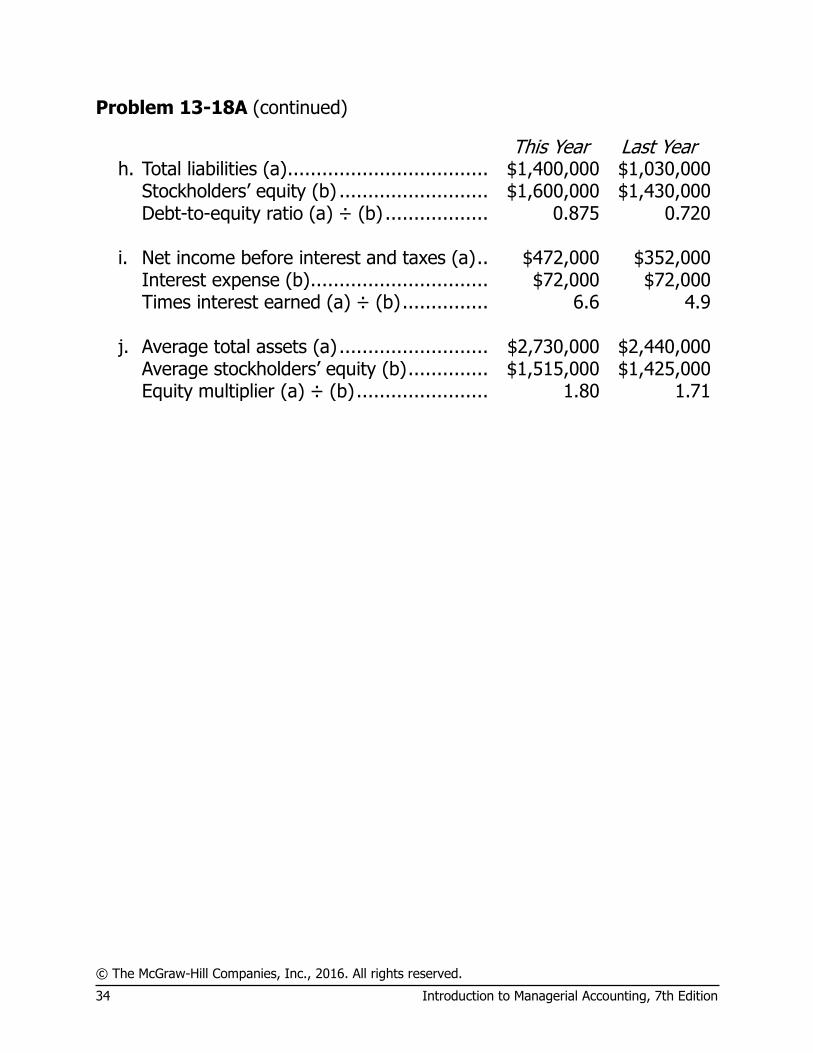
Problem 13-18A (continued)
This Year Last Year h. Total liabilities (a) ................................... $1,400,000 $1,030,000 Stockholders’ equity (b) .......................... $1,600,000 $1,430,000 Debt-to-equity ratio (a) ÷ (b) .................. 0.875 0.720 i. Net income before interest and taxes (a) .. $472,000 $352,000 Interest expense (b) ............................... $72,000 $72,000 Times interest earned (a) ÷ (b) ............... 6.6 4.9 j. Average total assets (a) .......................... $2,730,000 $2,440,000 Average stockholders’ equity (b) .............. $1,515,000 $1,425,000 Equity multiplier (a) ÷ (b) ....................... 1.80 1.71
© The McGraw-Hill Companies, Inc., 2016. All rights reserved.
Solutions Manual, Chapter 13 35
Problem 13-18A (continued)
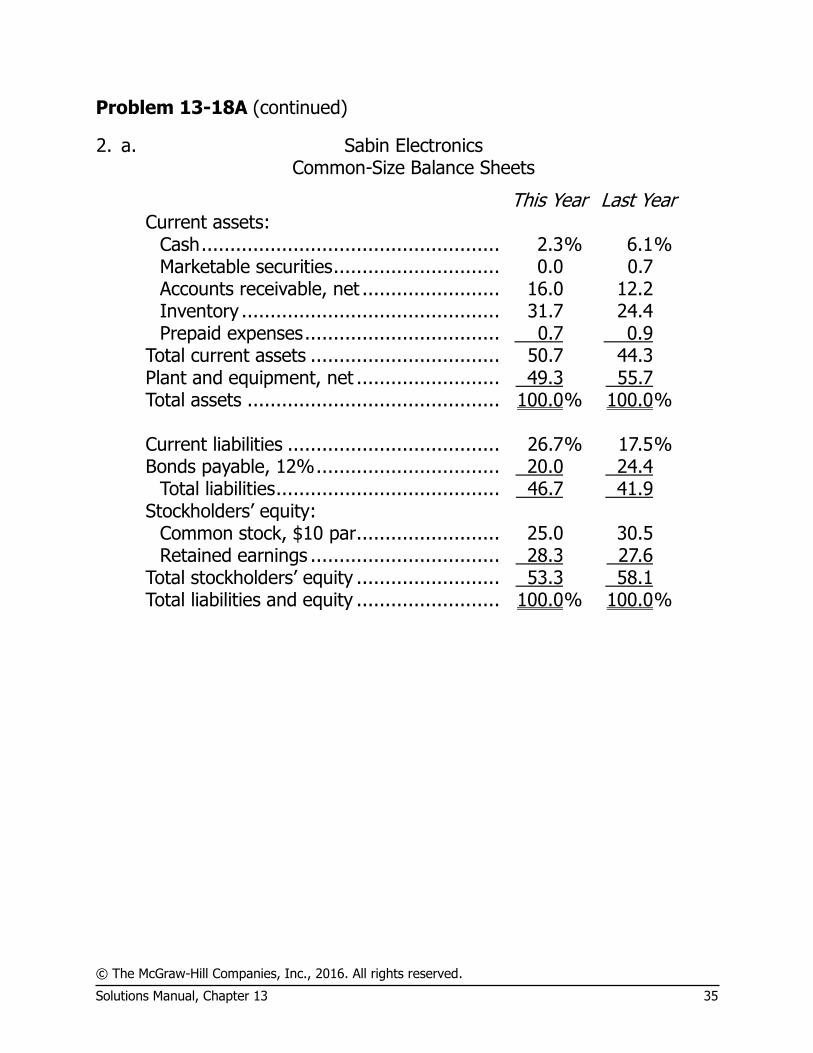
2. a. Sabin Electronics Common-Size Balance Sheets
This Year Last Year Current assets:
Cash .................................................... 2.3 % 6.1 % Marketable securities ............................. 0.0 0.7 Accounts receivable, net ........................ 16.0 12.2 Inventory ............................................. 31.7 24.4 Prepaid expenses .................................. 0.7 0.9
Total current assets ................................. 50.7 44.3 Plant and equipment, net ......................... 49.3 55.7 Total assets ............................................ 100.0 % 100.0 % Current liabilities ..................................... 26.7 % 17.5 % Bonds payable, 12% ................................ 20.0 24.4
Total liabilities ....................................... 46.7 41.9 Stockholders’ equity:
Common stock, $10 par ......................... 25.0 30.5 Retained earnings ................................. 28.3 27.6
Total stockholders’ equity ......................... 53.3 58.1 Total liabilities and equity ......................... 100.0 % 100.0 %
© The McGraw-Hill Companies, Inc., 2016. All rights reserved.
36 Introduction to Managerial Accounting, 7th Edition
Problem 13-18A (continued)
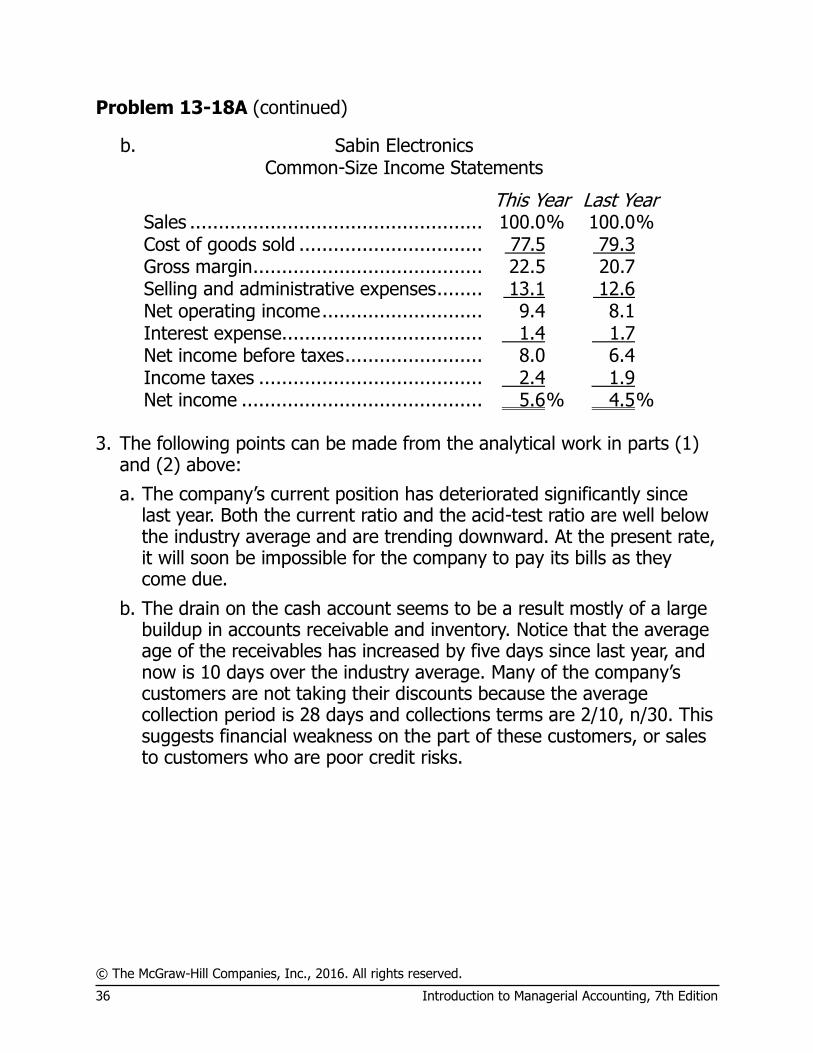
b. Sabin Electronics Common-Size Income Statements
This Year Last Year Sales ................................................... 100.0 % 100.0 % Cost of goods sold ................................ 77.5 79.3 Gross margin ........................................ 22.5 20.7 Selling and administrative expenses ........ 13.1 12.6 Net operating income ............................ 9.4 8.1 Interest expense................................... 1.4 1.7 Net income before taxes ........................ 8.0 6.4 Income taxes ....................................... 2.4 1.9 Net income .......................................... 5.6 % 4.5 %
3. The following points can be made from the analytical work in parts (1)
and (2) above:
a. The company’s current position has deteriorated significantly since last year. Both the current ratio and the acid-test ratio are well below the industry average and are trending downward. At the present rate, it will soon be impossible for the company to pay its bills as they come due.
b. The drain on the cash account seems to be a result mostly of a large buildup in accounts receivable and inventory. Notice that the average age of the receivables has increased by five days since last year, and now is 10 days over the industry average. Many of the company’s customers are not taking their discounts because the average collection period is 28 days and collections terms are 2/10, n/30. This suggests financial weakness on the part of these customers, or sales to customers who are poor credit risks.
© The McGraw-Hill Companies, Inc., 2016. All rights reserved.
Solutions Manual, Chapter 13 37
Problem 13-18A (continued)
c. The inventory turned only five times this year as compared to over six times last year. It takes nearly two weeks longer for the company to turn its inventory than the average for the industry (73 days as compared to 60 days for the industry). This suggests that inventory stocks are higher than they need to be.
d. The debt-to-equity ratio is aligned with the industry average and the times interest earned ratio slightly exceeds the industry benchmark.
e. In the authors’ opinion, the loan should be approved only if the
company gets its accounts receivable and inventory back under control. If the accounts receivable collection period is reduced to about 20 days, and if the inventory is pared down enough to reduce the turnover time to about 60 days, enough funds could be released to substantially improve the company’s cash position. Then a loan might not even be needed.
© The McGraw-Hill Companies, Inc., 2016. All rights reserved.
38 Introduction to Managerial Accounting, 7th Edition
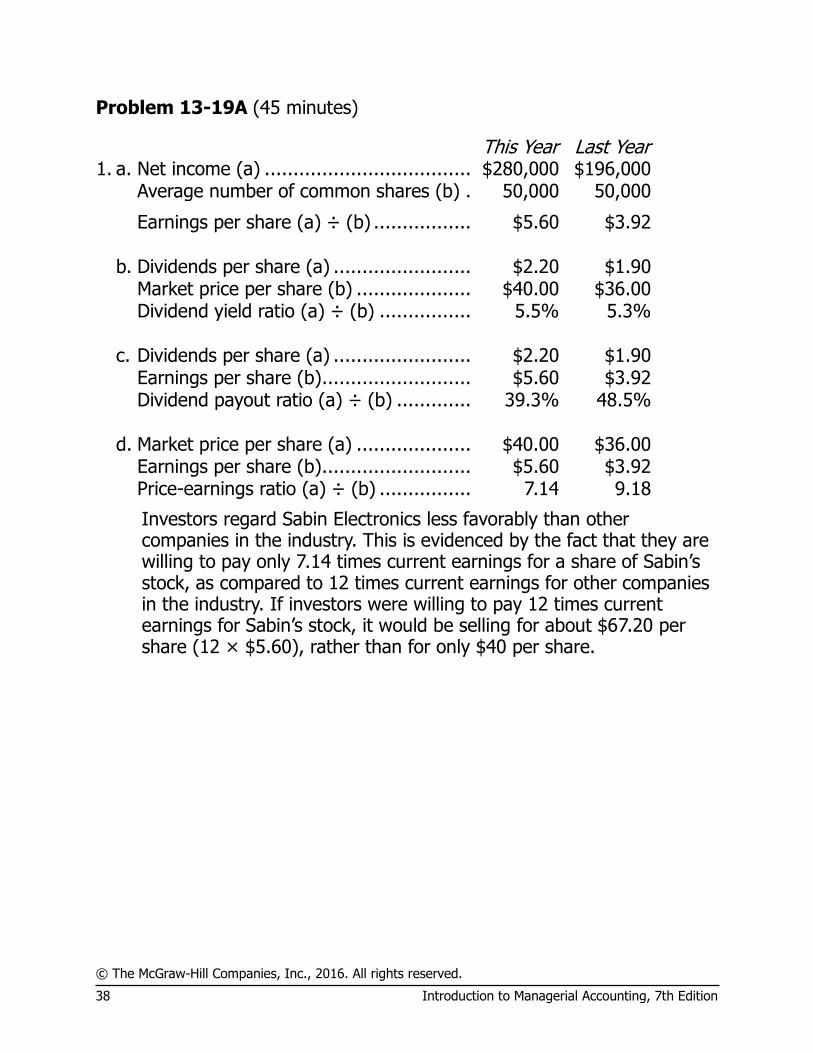
Problem 13-19A (45 minutes)
This Year Last Year 1. a. Net income (a) .................................... $280,000 $196,000 Average number of common shares (b) . 50,000 50,000
Earnings per share (a) ÷ (b) ................. $5.60 $3.92 b. Dividends per share (a) ........................ $2.20 $1.90 Market price per share (b) .................... $40.00 $36.00 Dividend yield ratio (a) ÷ (b) ................ 5.5% 5.3% c. Dividends per share (a) ........................ $2.20 $1.90 Earnings per share (b) .......................... $5.60 $3.92 Dividend payout ratio (a) ÷ (b) ............. 39.3% 48.5% d. Market price per share (a) .................... $40.00 $36.00 Earnings per share (b) .......................... $5.60 $3.92 Price-earnings ratio (a) ÷ (b) ................ 7.14 9.18 Investors regard Sabin Electronics less favorably than other
companies in the industry. This is evidenced by the fact that they are willing to pay only 7.14 times current earnings for a share of Sabin’s stock, as compared to 12 times current earnings for other companies in the industry. If investors were willing to pay 12 times current earnings for Sabin’s stock, it would be selling for about $67.20 per share (12 × $5.60), rather than for only $40 per share.
© The McGraw-Hill Companies, Inc., 2016. All rights reserved.
Solutions Manual, Chapter 13 39
Problem 13-19A (continued)
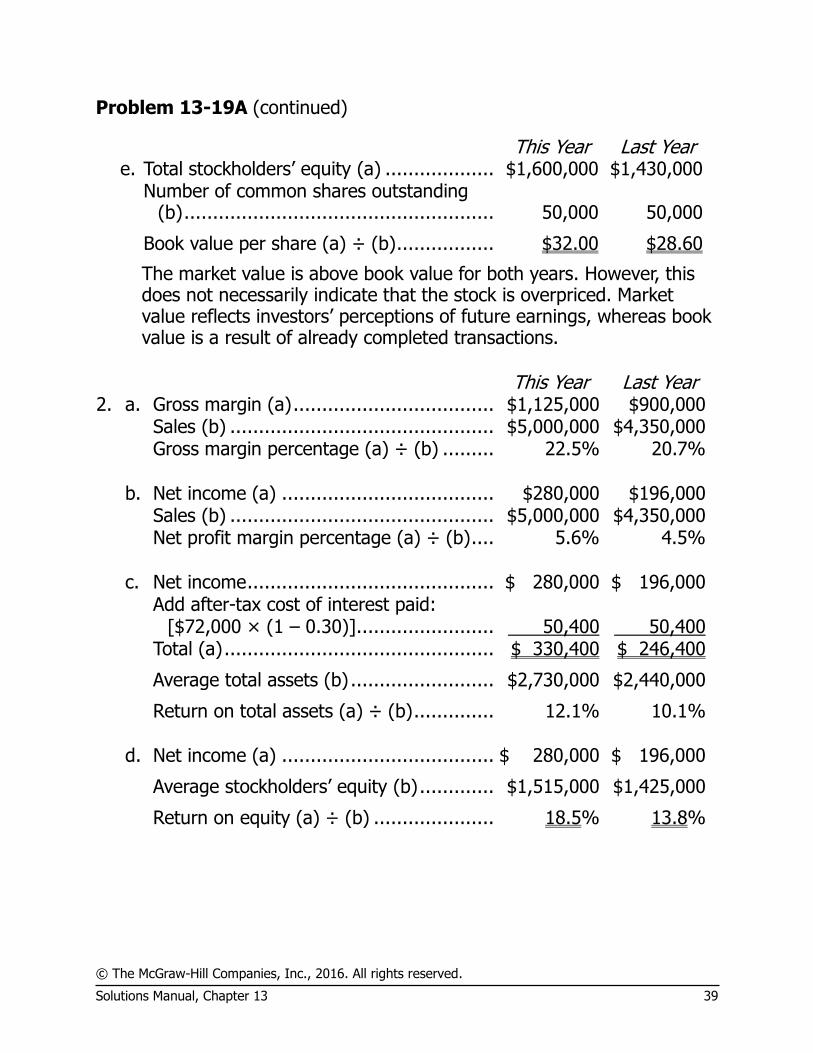
This Year Last Year e. Total stockholders’ equity (a) ................... $1,600,000 $1,430,000
Number of common shares outstanding
(b) ...................................................... 50,000 50,000
Book value per share (a) ÷ (b) ................. $32.00 $28.60
The market value is above book value for both years. However, this does not necessarily indicate that the stock is overpriced. Market value reflects investors’ perceptions of future earnings, whereas book value is a result of already completed transactions.
This Year Last Year 2. a. Gross margin (a) ................................... $1,125,000 $900,000 Sales (b) .............................................. $5,000,000 $4,350,000 Gross margin percentage (a) ÷ (b) ......... 22.5% 20.7% b. Net income (a) ..................................... $280,000 $196,000 Sales (b) .............................................. $5,000,000 $4,350,000 Net profit margin percentage (a) ÷ (b) .... 5.6% 4.5% c. Net income ........................................... $ 280,000 $ 196,000 Add after-tax cost of interest paid: [$72,000 × (1 – 0.30)] ........................ 50,400 50,400 Total (a) ............................................... $ 330,400 $ 246,400
Average total assets (b) ......................... $2,730,000 $2,440,000
Return on total assets (a) ÷ (b) .............. 12.1% 10.1% d. Net income (a) ..................................... $ 280,000 $ 196,000
Average stockholders’ equity (b) ............. $1,515,000 $1,425,000
Return on equity (a) ÷ (b) ..................... 18.5% 13.8%
© The McGraw-Hill Companies, Inc., 2016. All rights reserved.
40 Introduction to Managerial Accounting, 7th Edition
Problem 13-19A (continued)
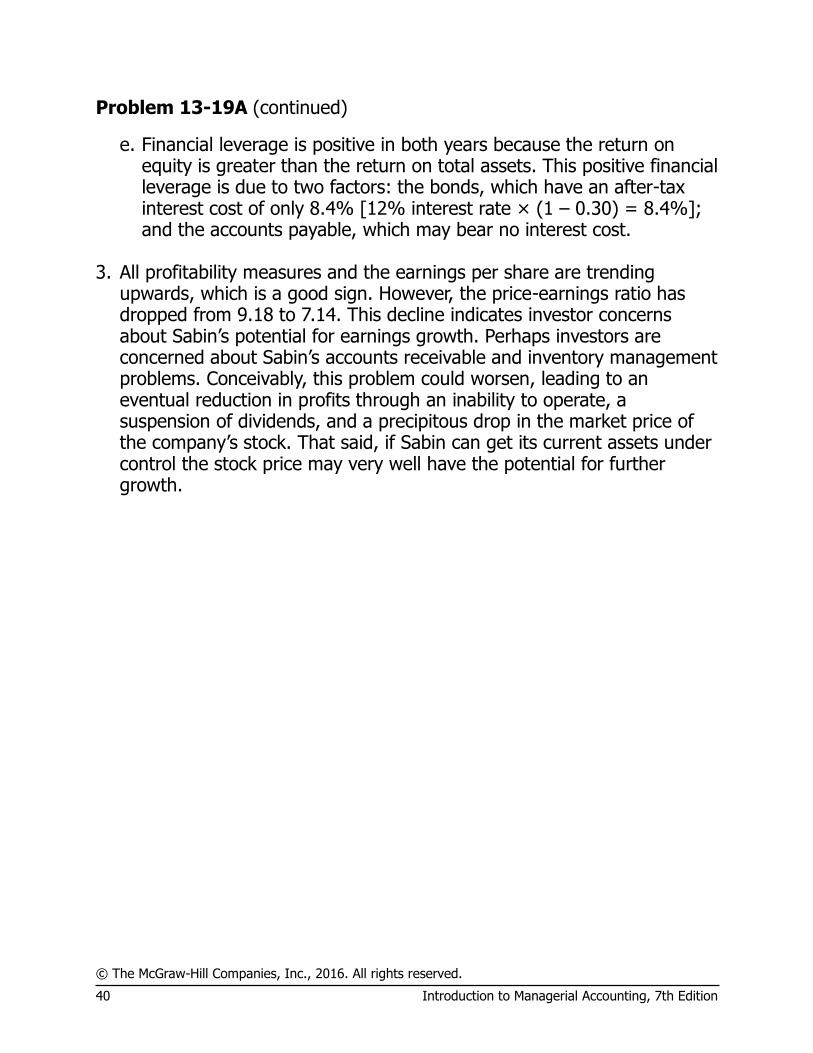
e. Financial leverage is positive in both years because the return on equity is greater than the return on total assets. This positive financial leverage is due to two factors: the bonds, which have an after-tax interest cost of only 8.4% [12% interest rate × (1 – 0.30) = 8.4%]; and the accounts payable, which may bear no interest cost.
3. All profitability measures and the earnings per share are trending
upwards, which is a good sign. However, the price-earnings ratio has dropped from 9.18 to 7.14. This decline indicates investor concerns about Sabin’s potential for earnings growth. Perhaps investors are concerned about Sabin’s accounts receivable and inventory management problems. Conceivably, this problem could worsen, leading to an eventual reduction in profits through an inability to operate, a suspension of dividends, and a precipitous drop in the market price of the company’s stock. That said, if Sabin can get its current assets under control the stock price may very well have the potential for further growth.
© The McGraw-Hill Companies, Inc., 2016. All rights reserved.
Solutions Manual, Chapter 13 41
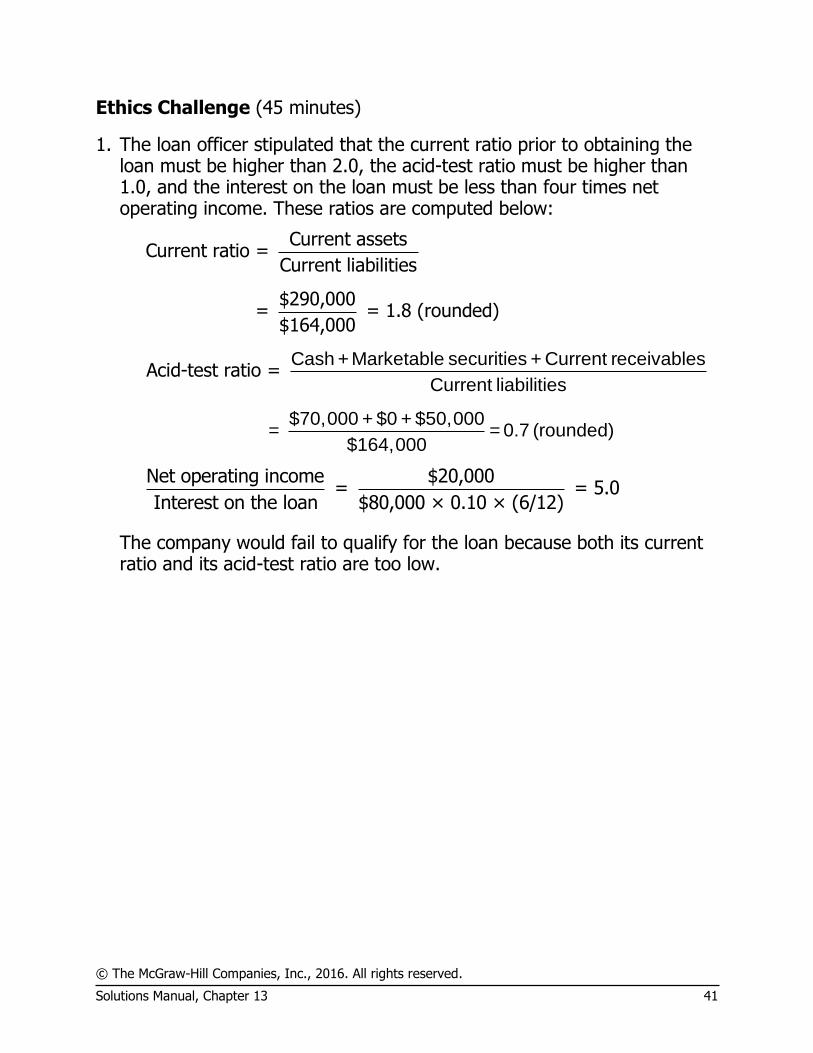
Ethics Challenge (45 minutes)
1. The loan officer stipulated that the current ratio prior to obtaining the loan must be higher than 2.0, the acid-test ratio must be higher than 1.0, and the interest on the loan must be less than four times net operating income. These ratios are computed below:
Current assetsCurrent ratio =
Current liabilities
$290,000= = 1.8 (rounded)
$164,000
Acid-test ratio = Cash + Marketable securities + Current receivables
Current liabilities
$70,000 + $0 + $50,000= = 0.7 (rounded)
$164,000
Net operating income $20,000
= = 5.0Interest on the loan $80,000 × 0.10 × (6/12)
The company would fail to qualify for the loan because both its current ratio and its acid-test ratio are too low.
© The McGraw-Hill Companies, Inc., 2016. All rights reserved.
42 Introduction to Managerial Accounting, 7th Edition
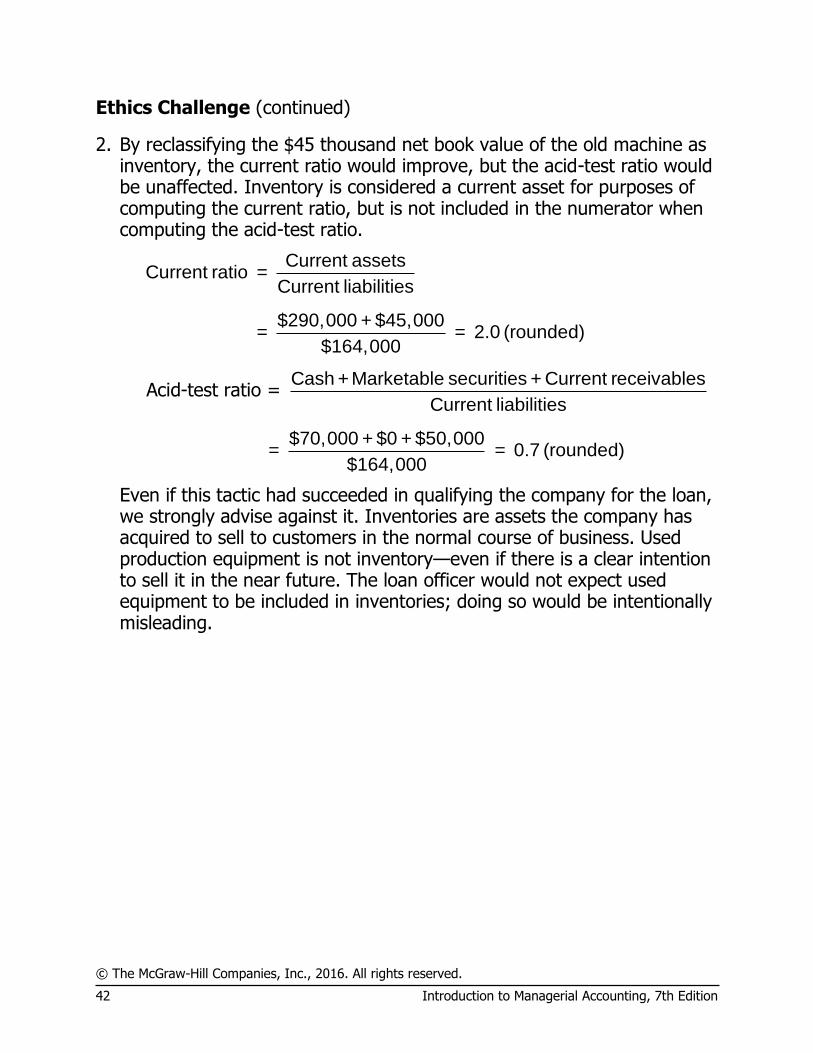
Ethics Challenge (continued)
2. By reclassifying the $45 thousand net book value of the old machine as inventory, the current ratio would improve, but the acid-test ratio would be unaffected. Inventory is considered a current asset for purposes of computing the current ratio, but is not included in the numerator when computing the acid-test ratio.
Current assetsCurrent ratio =
Current liabilities
$290,000 + $45,000= = 2.0 (rounded)
$164,000
Acid-test ratio = Cash + Marketable securities + Current receivables
Current liabilities
$70,000 + $0 + $50,000= = 0.7 (rounded)
$164,000
Even if this tactic had succeeded in qualifying the company for the loan, we strongly advise against it. Inventories are assets the company has acquired to sell to customers in the normal course of business. Used production equipment is not inventory—even if there is a clear intention to sell it in the near future. The loan officer would not expect used equipment to be included in inventories; doing so would be intentionally misleading.
© The McGraw-Hill Companies, Inc., 2016. All rights reserved.
Solutions Manual, Chapter 13 43
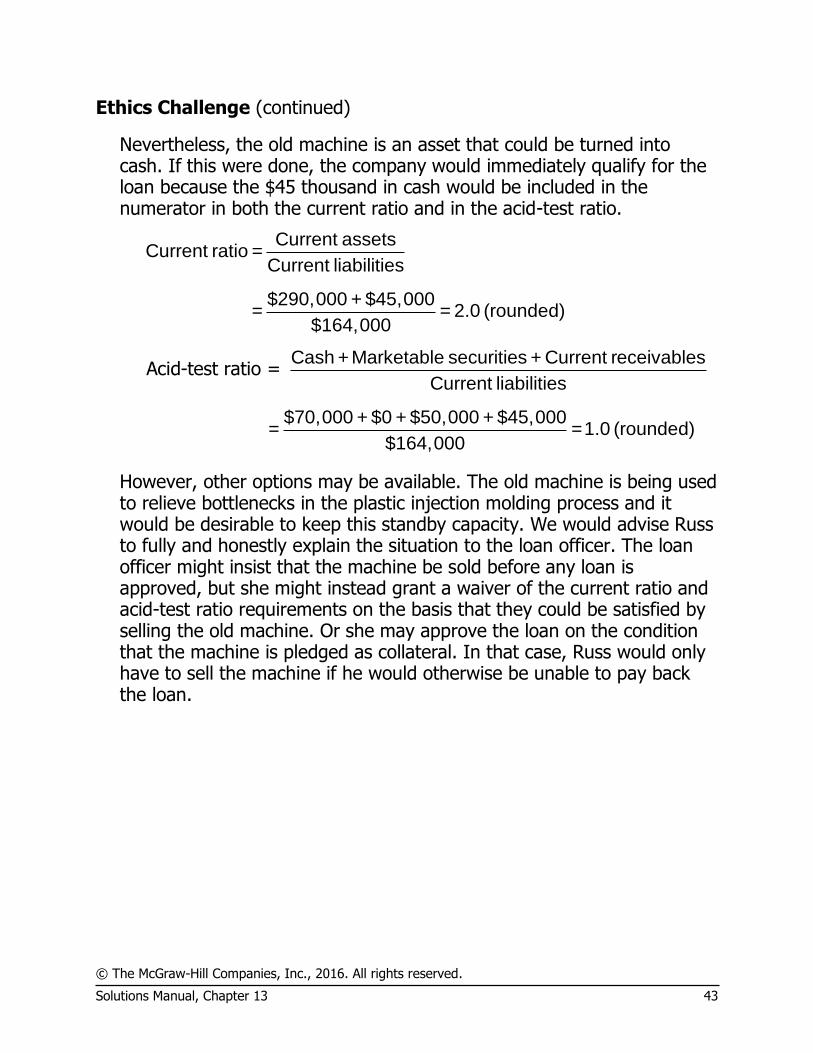
Ethics Challenge (continued)
Nevertheless, the old machine is an asset that could be turned into cash. If this were done, the company would immediately qualify for the loan because the $45 thousand in cash would be included in the numerator in both the current ratio and in the acid-test ratio.
Current assetsCurrent ratio =
Current liabilities
$290,000 + $45,000= = 2.0 (rounded)
$164,000
Acid-test ratio = Cash + Marketable securities + Current receivables
Current liabilities
$70,000 + $0 + $50,000 + $45,000= = 1.0 (rounded)
$164,000
However, other options may be available. The old machine is being used to relieve bottlenecks in the plastic injection molding process and it would be desirable to keep this standby capacity. We would advise Russ to fully and honestly explain the situation to the loan officer. The loan officer might insist that the machine be sold before any loan is approved, but she might instead grant a waiver of the current ratio and acid-test ratio requirements on the basis that they could be satisfied by selling the old machine. Or she may approve the loan on the condition that the machine is pledged as collateral. In that case, Russ would only have to sell the machine if he would otherwise be unable to pay back the loan.
© The McGraw-Hill Companies, Inc., 2016. All rights reserved.
44 Introduction to Managerial Accounting, 7th Edition
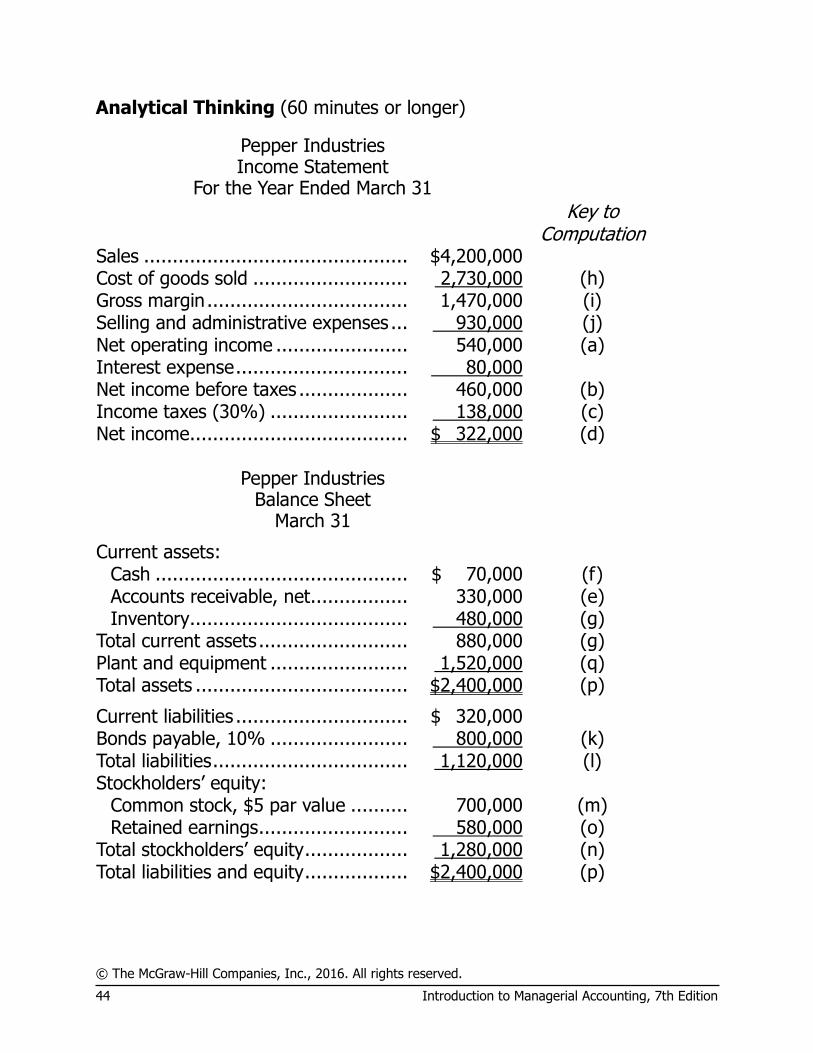
Analytical Thinking (60 minutes or longer)
Pepper Industries Income Statement
For the Year Ended March 31
Key to
Computation Sales .............................................. $4,200,000 Cost of goods sold ........................... 2,730,000 (h) Gross margin ................................... 1,470,000 (i) Selling and administrative expenses ... 930,000 (j) Net operating income ....................... 540,000 (a) Interest expense .............................. 80,000 Net income before taxes ................... 460,000 (b) Income taxes (30%) ........................ 138,000 (c) Net income ...................................... $ 322,000 (d)
Pepper Industries Balance Sheet
March 31
Current assets: Cash ............................................ $ 70,000 (f) Accounts receivable, net ................. 330,000 (e) Inventory ...................................... 480,000 (g)
Total current assets .......................... 880,000 (g) Plant and equipment ........................ 1,520,000 (q) Total assets ..................................... $2,400,000 (p)
Current liabilities .............................. $ 320,000 Bonds payable, 10% ........................ 800,000 (k) Total liabilities .................................. 1,120,000 (l) Stockholders’ equity:
Common stock, $5 par value .......... 700,000 (m) Retained earnings .......................... 580,000 (o)
Total stockholders’ equity .................. 1,280,000 (n) Total liabilities and equity .................. $2,400,000 (p)
© The McGraw-Hill Companies, Inc., 2016. All rights reserved.
Solutions Manual, Chapter 13 45
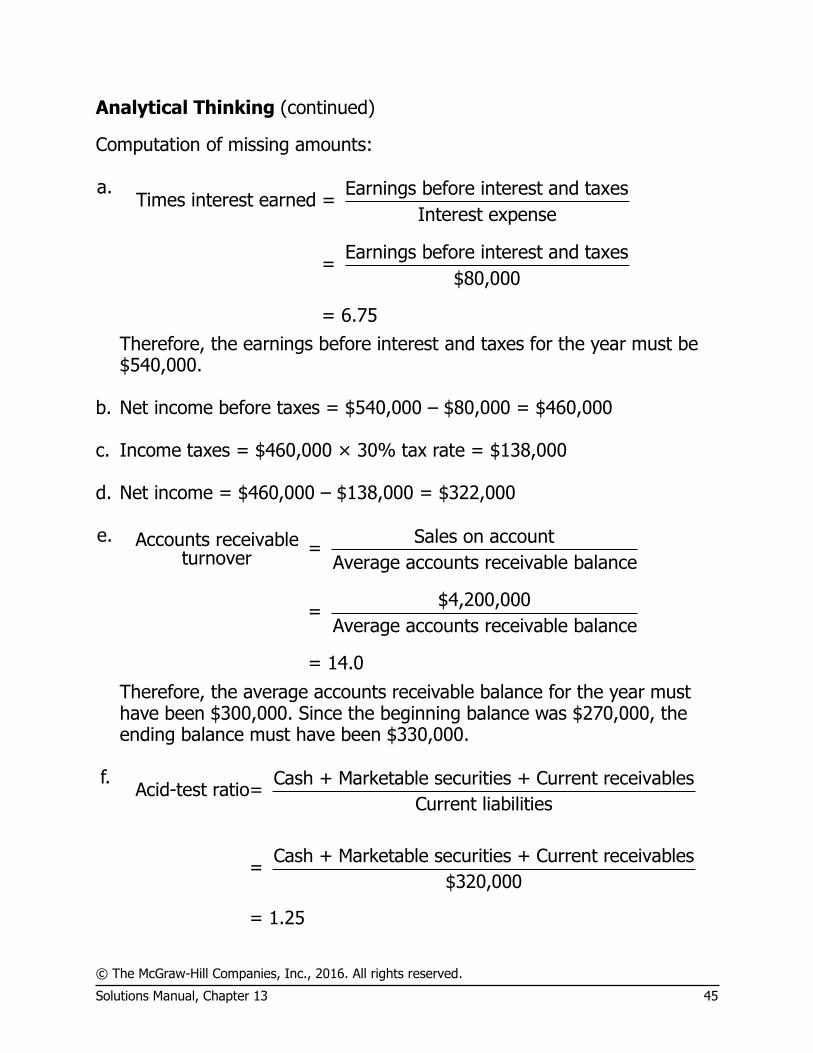
Analytical Thinking (continued)
Computation of missing amounts: a. Earnings before interest and taxes
Times interest earned = Interest expense
Earnings before interest and taxes=
$80,000
= 6.75
Therefore, the earnings before interest and taxes for the year must be $540,000.
b. Net income before taxes = $540,000 – $80,000 = $460,000 c. Income taxes = $460,000 × 30% tax rate = $138,000 d. Net income = $460,000 – $138,000 = $322,000 e. Sales on accountAccounts receivable =
turnover Average accounts receivable balance
$4,200,000=
Average accounts receivable balance
= 14.0
Therefore, the average accounts receivable balance for the year must have been $300,000. Since the beginning balance was $270,000, the ending balance must have been $330,000.
f. Cash + Marketable securities + Current receivables
Acid-test ratio= Current liabilities
Cash + Marketable securities + Current receivables
= $320,000
= 1.25
© The McGraw-Hill Companies, Inc., 2016. All rights reserved.
46 Introduction to Managerial Accounting, 7th Edition
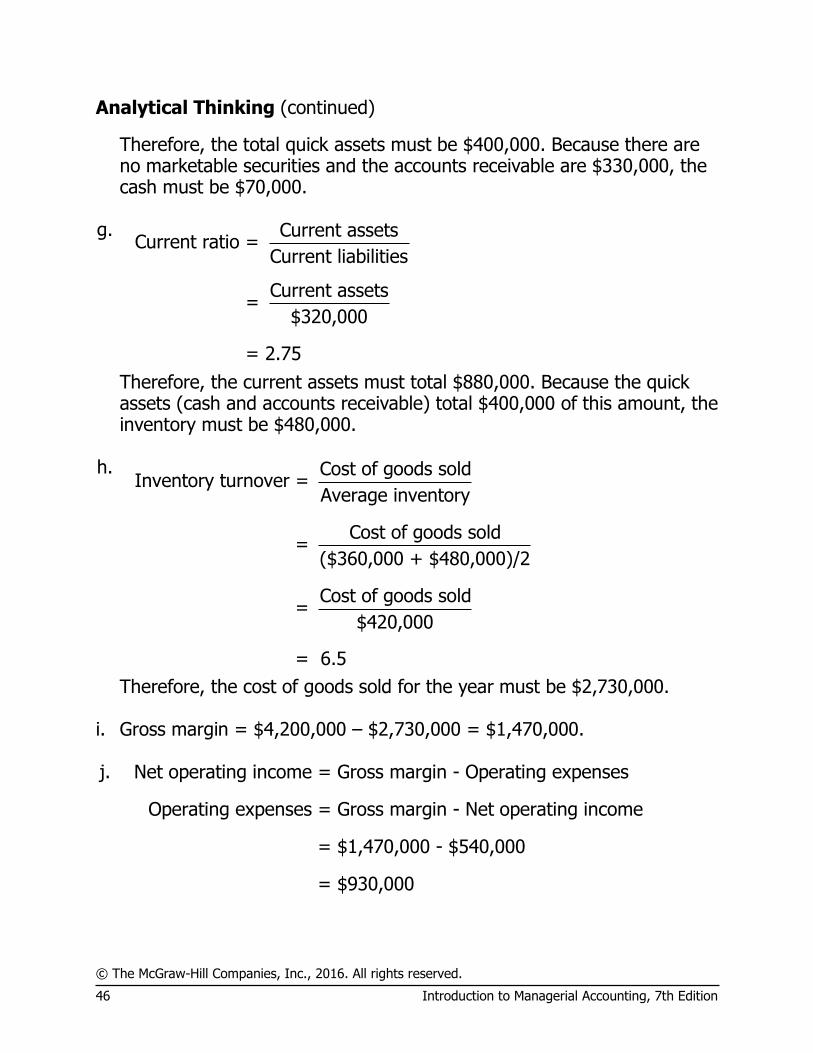
Analytical Thinking (continued)
Therefore, the total quick assets must be $400,000. Because there are no marketable securities and the accounts receivable are $330,000, the cash must be $70,000.
g. Current assets
Current ratio = Current liabilities
Current assets =
$320,000
= 2.75
Therefore, the current assets must total $880,000. Because the quick assets (cash and accounts receivable) total $400,000 of this amount, the inventory must be $480,000.
h. Cost of goods sold
Inventory turnover = Average inventory
Cost of goods sold=
($360,000 + $480,000)/2
Cost of goods sold=
$420,000
= 6.5
Therefore, the cost of goods sold for the year must be $2,730,000. i. Gross margin = $4,200,000 – $2,730,000 = $1,470,000. j. Net operating income = Gross margin - Operating expenses
Operating expenses = Gross margin - Net operating income
= $1,470,000 - $540,000
= $930,000
© The McGraw-Hill Companies, Inc., 2016. All rights reserved.
Solutions Manual, Chapter 13 47
Analytical Thinking (continued)
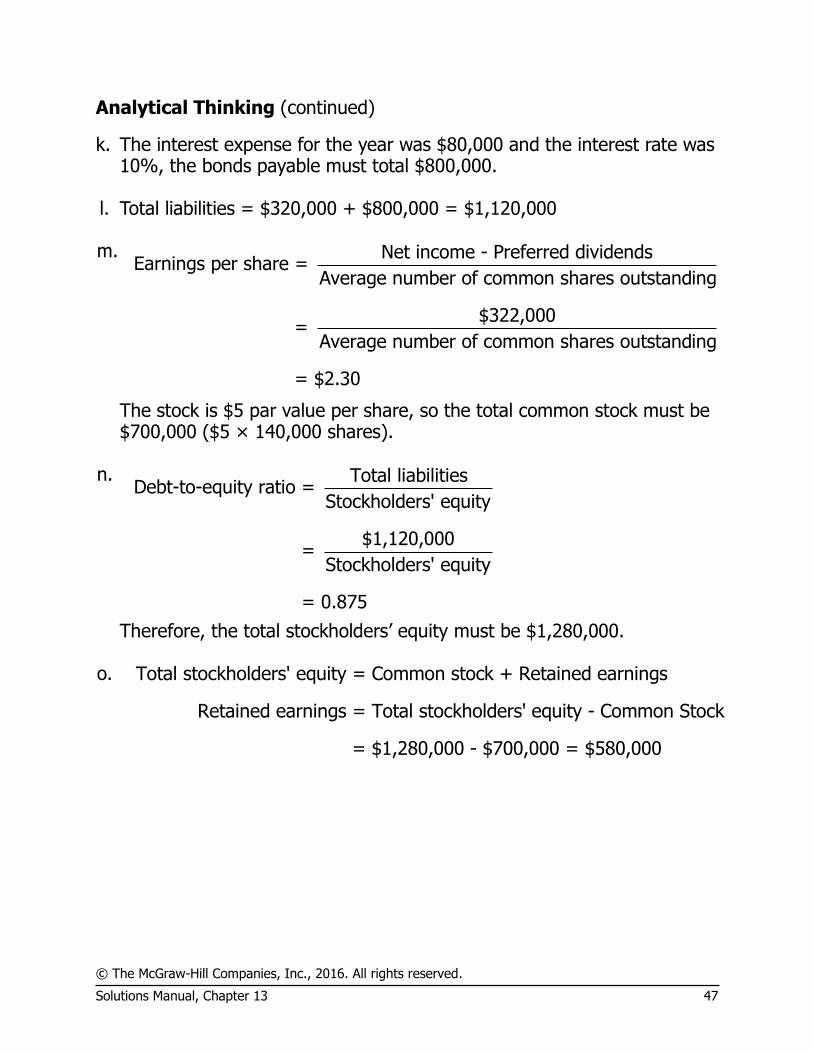
k. The interest expense for the year was $80,000 and the interest rate was 10%, the bonds payable must total $800,000.
l. Total liabilities = $320,000 + $800,000 = $1,120,000 m. Net income - Preferred dividends
Earnings per share = Average number of common shares outstanding
$322,000=
Average number of common shares outstanding
= $2.30
The stock is $5 par value per share, so the total common stock must be $700,000 ($5 × 140,000 shares).
n. Total liabilities
Debt-to-equity ratio = Stockholders' equity
$1,120,000=
Stockholders' equity
= 0.875
Therefore, the total stockholders’ equity must be $1,280,000. o. Total stockholders' equity = Common stock + Retained earnings
Retained earnings = Total stockholders' equity - Common Stock
= $1,280,000 - $700,000 = $580,000
© The McGraw-Hill Companies, Inc., 2016. All rights reserved.
48 Introduction to Managerial Accounting, 7th Edition
Analytical Thinking (continued)
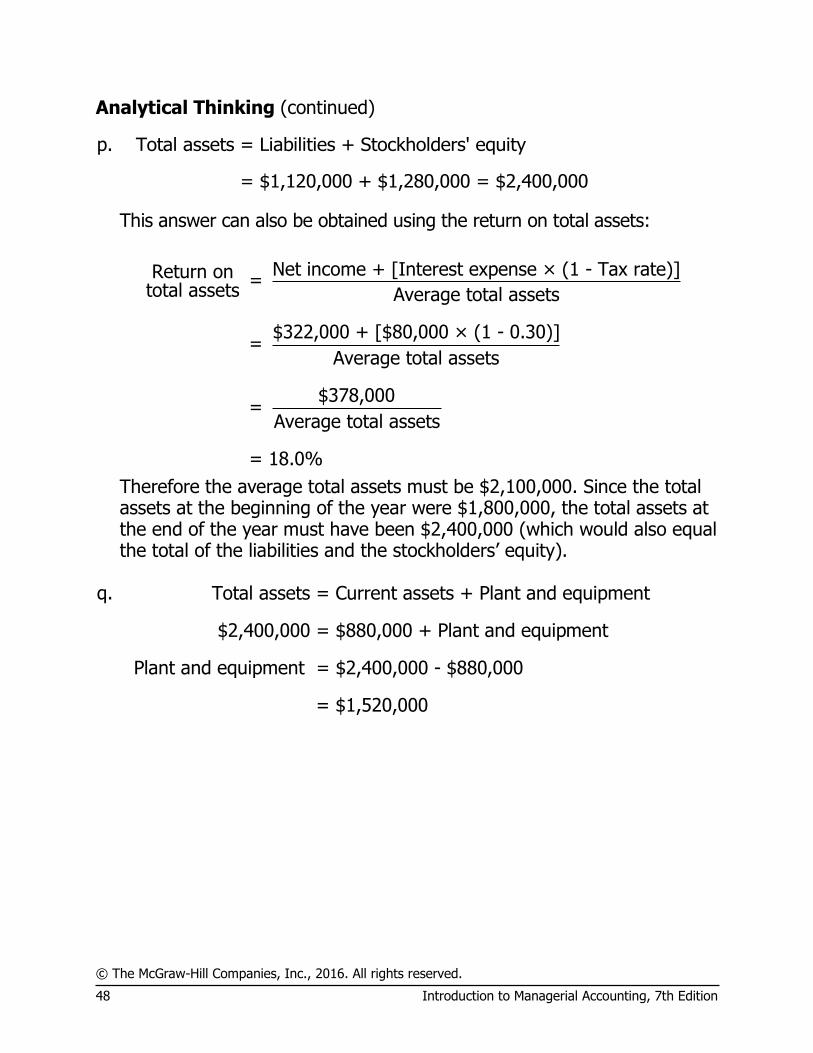
p. Total assets = Liabilities + Stockholders' equity
= $1,120,000 + $1,280,000 = $2,400,000
This answer can also be obtained using the return on total assets:
Net income + [Interest expense × (1 - Tax rate)]Return on =
total assets Average total assets
$322,000 + [$80,000 × (1 - 0.30)]=
Average total assets
$378,000=
Average total assets
= 18.0%
Therefore the average total assets must be $2,100,000. Since the total assets at the beginning of the year were $1,800,000, the total assets at the end of the year must have been $2,400,000 (which would also equal the total of the liabilities and the stockholders’ equity).
q. Total assets = Current assets + Plant and equipment
$2,400,000 = $880,000 + Plant and equipment
Plant and equipment = $2,400,000 - $880,000
= $1,520,000
© The McGraw-Hill Companies, Inc., 2016. All rights reserved.
Solutions Manual, Chapter 13 49
Teamwork in Action
The answer to this question will depend on the company that the students analyze.


![UPR Info · 2017. 9. 29. · UPR Trax [No. 77] UPR Info Newsletter September 2017 In-country Pre-sessions: preparing for the UPR UPR Info in a nutshell Similarly to our work in September,](https://img.pdfslide.net/doc/110x75/60c5a26cc561015c8d0d3503/upr-info-2017-9-29-upr-trax-no-77-upr-info-newsletter-september-2017-in-country.jpg)