Embed Size (px)
DESCRIPTION
The Financial Statements of MSF-Holland of 2008
Citation preview
Financial Statements
2008

2

3
Contents
1 Financial Statements 2008 MSF-Holland Association 5
Statement of expenditure and income for 2008 7
Balance sheet as at 31 December 2008 9
Cash flow statement for 2008 10
2 Explanation statement of expenditure and income in 2008 13
3 Explanation of the Balance Sheet 35
4 Accounting Principles 45
5 Associated parties Médecins Sans Frontières 49
6 Long-term forecast 55
7 Other information 59

4
55
MSF-Holland aSSociation
The 2008 Annual Financial Statements include the financial information of the association MSF-Holland in Amsterdam.
The association MSF-Holland was founded September 7, 1984. The objective of the organisation is: “The organizing of practical medical aid to people in disaster areas and crises worldwide, in accordance with the principles expressed in the Charter. Based on its medical work, the association will also make every effort towards effective advocacy on behalf of the section of the population that it aids.”
MSF-Holland is part of the network organisation of Médecins Sans Frontières, in which nineteen national organisations (MSF-sections) are active . Apart from MSF Holland four other MSF-sections carry out projects independently. Every MSF-section is an independ-ent economic and legal entity. The MSF-sections are united in the Swiss based associa-tion “Association Bureau Médecins sans Frontières International”. In view of the fact that the MSF-sections become increasingly interdependant, this financial report includes a chapter called “associated parties”, that focuses on the mutual agreements resulting in the related financial flows and related management and risks. Effort has been made to make the related financial cash flows within the MSF-network as transparent as possible in this financial statements.
The Charter and more comprehensive information about the organisation is published on the website of MSF-Holland (www.artsenzondergrenzen.nl) and in the annual report of MSF-Holland. In the annual report a summary explanation of the financial statements is included. The annual report is published on the website.
The association MSF-Holland is registered with the Amsterdam Chamber of Commerce under number 41215974. The association MSF-Holland is a member of the Association of Fundraising Institutions (VFI) and is certified by the Central Bureau for Fundraising (CBF). The conditions for CBF certification can be consulted on www.cbf.nl.
GuidelineS
This report has been prepared in accordance with Guideline 650 for the Reporting of Fundraising Institutions, as published by the Dutch Accounting Standards Board (Raad voor de Jaarverslaggeving). The purpose of the Guideline is to provide insight in fundraising and the realised expenditure of funds on the objectives for which the funds were raised.
In various parts of the financial report, reference is made to the guidelines and recom-mendations of the Association of Fundraising Institutions (VFI). These certifications can be consulted on www.vfi.nl.
cHanGeS in accountinG principleS
There have been no changes in accounting principles in 2008.
preSentation
In view of the fact that the association MSF-Holland considers the expenditures on the Association’s goals to be its principle objective, it has been decided to deviate from the prescribed model for the presentation of income and expenditure. This financial report shows the expenditures before the income. The statement of expenditure and income is shown before the balance sheet.
The basis used for the valuation of the expenditure, the assets and the accounting prin-ciples are explained in chapter 4 of the financial report. It is recommended this be read before viewing the statement of expenditure and income and the balance sheet.
1 Financial Statements 2008 MSF-Holland Association

6

7
Sta
tem
ent of exp
enditu
re a
nd in
com
e for 2008
in e
ur
o t
Ho
uS
an
dS
expenditure Explanatory notes 2008 Budget 2008 2007
Spent on Association goalsDirect aid 2.1 94,735 95,000 92,113
Preparation and coordination in the Netherlands
2.2 10,354 11,000 11,258
Information and awareness-raising 2.3 2,077 2,450 2,092
Commissioned to third-parties 2.4 3,860 442 449
Total spent on Association goals 111,026 108,892 105,912
Fundraising expensesCosts own fundraising 2.5 6,265 6,600 7,055
Costs aquisition institutional donor grants 2.6 125 135 146
Total fundraising expenses 6,390 6,735 7,201
Management and administration 2.7 3,527 3,450 3,345
Total expenditures 2.8 120,943 119,077 116,458
incoMe
Income from own fundraising 2.9 38,080 33,700 33,070
Income from third-party activities 2.10
Proceeds from the National Postcode Lottery 18,883 15,000 15,461
Grants from within the MSF-network 2.11 55,811 55,100 58,790
Grants from institutional donors 2.12 16,271 16,000 12,140
Other income 2.13 1,390 900 1,062
Total receipts 130,435 120,700 120,523
Results Operational Activities 9,492 1,623 4,065
Exchange rate results 2.14 -1,683 -700 -353
SURPLUS 7,809 923 3,712

8
Explanatory notes 2008 Budget 2008 2007
Allocation of surplus / deficitContinuity reserves 3.8.a 0 0 -500
Appropriation reserve 3.8.b -656 0 387
Other free reserves 3.8.c 7,582 923 3,825
Appropriated funds 3.8.d 883 0 0
7,809 923 3,712
explanation oF tHe year end reSult
The result from operational activities is explained by a combination of occurrences. Expenditures in the head office decreased with € 1.5 million, thus reducing the total of costs. In the last quarter of the year income from own fundraising activities increased more than expected. In addition more project grants were received that were accounted for in 2008. An additional contribution of the National Postcode Lottery from the extra draw of € 883.369 and additional grants from MSF-sections of € 2.798.000 were received. These incomes have been added to the appropriated funds and the other free reserves and are allocated to 2009 projects expenditures. This has been taken into account in the 2009 budget. The result from operational activities is diminished by exchange rate results that are mainly caused by exchange rate fluctuations of the United States Dollar and the British Pound compared to the euro during the year. The total year end surplus therefore ends at € 7.8 million.

9
aSSetS Explanatory notes 31 December 2008 31 December 2007
Tangible fixed assetsOperating assets 3.1 241 618
StocksStocks for direct aid 3.2 1,929 2,208
Receivables and accrued incomeThird-party appeals 3.3 5,437 2,622
MSF network 3.4 6,744 4,983
Institutional donors 3.5 5,935 3,596
Other receivables and accrued income 3.6 4,561 3,114
22,677 14,315
Cash at bank and in hand 3.7 60,410 53,017
Total assets 85,257 70,158
liaBilitieS
Reserves and funds
Reserves 3.8
Continuity reserve 59,000 59,000
Appropriation reserve 2,170 2,826
Other free reserves 6,394 -1,188
67,564 60,638
FundsAppropriated funds 3.8.d. 1,095 212
Short-term liabilities 3.9 16,598 9,308
Total liabilities 85,257 70,158
Bala
nce s
heet as a
t 31 D
ecem
ber 2008
in e
ur
o t
Ho
uS
an
dS

10
caSH Flow FroM operatinG activitieS 31 December 2008 31 December 2007
Receipts:Contributions, (charitable) donations and gifts 28,698 24,597
Legacies and bequests (inheritances) 7,821 7,997
Grants from private organisations 1,148 300
Total receivables from own fundraising 37,667 32,894
Receipts from the National Postcode Lottery 16,069 15,316
Received from MSF-Germany 16,331 25,401
Received from MSF-United Kingdom 12,815 11,404
Received from MSF-Canada 5,605 9,017
Received from other MSF-sections 18,870 11,275
Total received from MSF-sections 53,621 57,097
(concerning project grants)
Received from institutional donors 15,334 15,963
Interest received 1,168 1,122
Received tax net and VAT 110 125
Received from MSF-sections from monies advanced 1,381 880
Total other receipts 2,659 2,127
Total receipts 125,350 123,397
continued on page 11

11
brought forward from page 10 31 December 2008 31 December 2007
Transport: Total receipts 125,350 123,397
Payments: Payments made in project countries 48,167 51,280
Commissioned to third parties 442 449
Payments to MSF-International (contributions) 1,255 494
Payments to MSF-Germany 1,282 1,433
Payments to MSF-United Kingdom 1,321 1,556
Payments to MSF-Canada 777 556
Payments to other MSF-sections 3,937 3,101
Payments to MSF-Supply and MSF-Logistique 2,993 3,263
Total payments to MSF-sections 11,565 10,403
Payments to suppliers of goods and services 37,842 33,595
Payments concerning (field) personnel 17,697 21,101
Other payments 2,068 58
Total payments at headquarters 57,607 54,754
Total payments 117,781 116,886
Cash flow from operating activities 7,569 6,511
Cash flow from investment activitiesPayments concerning investments in tangible fixed assets -176 -414
Receipts from disinvestments 0 0
-176 -414
Cash flow from financing activitiesNot applicable 0 0
Total cash flow 7,393 6,097continued on page 12
Cash fl
ow
sta
tem
ent fo
r 2008
in e
ur
o t
Ho
uS
an
dS
12
tHe caSH Flow
The cash flow statement has been prepared according to the direct method in order to provide a clearer view of the different flows of funds in the organisation. The cash flow between MSF-Holland and the MSF-sections can be distinguished. The cash flow state-ment also clearly shows which part of the expenditure has been made in the countries where projects are being carried out. The cash flow statement shows the liquidity needs of MSF-Holland but does not show the variations in the cash flow. Normally, a large part of the income is received at the end of the financial year whereas the payments are reason-ably spread over the months. This means that during the year, MSF-Holland must be able to cover a large part of its costs from available funds. In 2008 a great deal of the project grants were received in December while the expenses for emergency aid increased in May (Myanmar, cyclone Nargis) and October. The increase in the liquidity position at year-end can be attributed to the increase in income from own fundraising. The payables and receivables developed evenly.
receiptS
Receipts from the Médecins Sans Frontières sections concern project grants. Receipts from project grants (from MSF-sections and institutional donors) are explained in more detail in note (3.4) and note (3.5) of this financial report. The item “Received from MSF-sections for monies advanced” consists of receivables referring to employees posted abroad not by MSF-Holland but one of the other MSF sections, and to employees at the Amsterdam office that actually carry out work for one of the other MSF-sections. These employees are not counted as part of the MSF-Holland staff.
payMentS
The majority of payments made in the project countries are to local personnel. Transport and storage costs and the local costs of expatriate staff are the next biggest items. Given the current structure of the projects, approximately half of the expenses for the projects are incurred in the countries or the regions where these are being carried out. Viewed over several years, the growth in activities has meant increased expenditure in the project
countries while the volume of payments made at headquarters decreased. The 2008 cash flow overview does not show this trend. In 2008 payments for a number of project coun-tries (Zimbabwe, DR Congo) were routed through headquarters as payments could not be done in a reliable manner in those countries or would imply a too high risk exposure. The payments to MSF-International concern contributions to office and international coordinated activities and projects such as the campaign Access to Essential Medicines and the MSF-International fund for (medical) innovation in aid projects.
The payments to the MSF-network concern remuneration for hired-in employees posted to and working in the project countries. From 2006 onwards, employees posted abroad receive a contract of employment in the country where they were recruited. The payments in 2008 increased from € 7.1 million to € 8.6 million because during the period 2006-2008 according to the planning there were gradually more employees recruited by their own MSF-sections. The “payments concerning (posted) staff ” through the Amsterdam office have decreased with a comparable amount. Pension contributions, social security payments, income tax, and salaries have been included in the payments concerning the (posted) staff.
The payments to the purchasing organisations “MSF-Supply” (Belgium) and “MSF Logistique” (France) are included as payments within the MSF-network. Through the procurement centres/depots of MSF-Belgium and MSF-France, it is mainly vehicles, medicines and specialised supplies that are purchased. Major advantages of scale are obtained through joint procurement and stocks of aid supplies are more efficiently maintained within the international organisation. In 2008, a total of € 3.0 million (2007: € 3.3 million) was ordered from these purchasing organisations.
For a full overview of the related flow of funds and financial relationships within the MSF-network, please refer to the combined financial statements to be published mid 2009. Chapter 5, on “Associated Parties” of the financial report of MSF-Holland shows the core figures for the year 2007.
brought forward from page 11 31 December 2008 31 December 2007
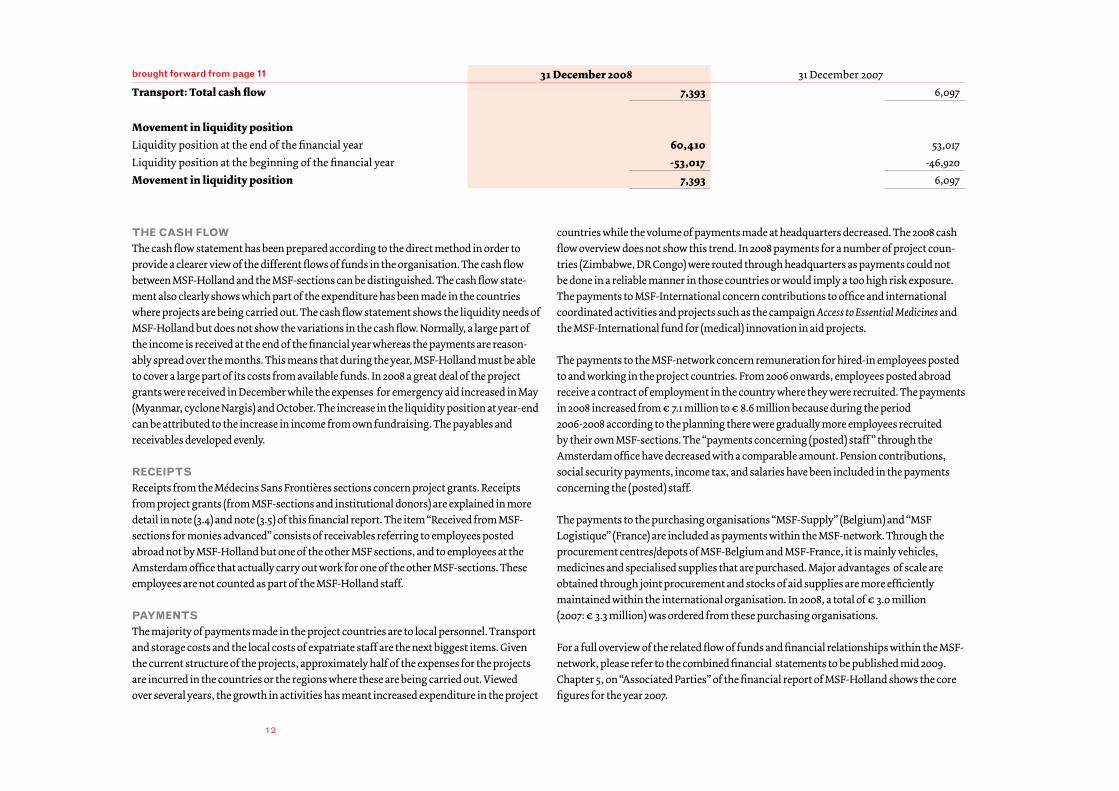
Transport: Total cash flow 7,393 6,097
Movement in liquidity positionLiquidity position at the end of the financial year 60,410 53,017
Liquidity position at the beginning of the financial year -53,017 -46,920
Movement in liquidity position 7,393 6,097

13
2 Explanation of the statement of expenditure and income in 2008
This chapter explains the expenditure and income in the sequence of the statement of expenditure and income. Note 2.8 shows the total of all costs with the relevant explana-tions. Note 2.9 onwards gives an explanation of income.
2.1 Emergency Aidin euro thousands
The costs of emergency aid relate to projects carried out or to be carried out by MSF-Holland. This note gives an explanation concerning the costs of emergency aid per country and the division of these costs per country. In the annex to this financial report an explanation is given successively of the costs, per country, per category, the costs per project activity and the financing per donor.
The direct costs for emergency aid increased by € 2.6 million from € 92.1 million in 2007 to € 94.7 million in 2008. In most emergency aid projects in countries where MSF-Holland is active, expenditure went up. In Myanmar a large scale emergency project was started after the cyclone Nargis; in the DR Congo the armed conflict sparked off and for some time MSF was the only organisation remaining in the area; in Zimbabwe the population has been confronted with food shortage and a cholera epidemic. MSF-Holland decided to continue the work in Bangladesh and in Uganda a new project was opened up in Karamojo. Finally we responded to food crises in Ethiopia. The projects in Kismaayo and Mogadishu in Somalia could not be continued due to increased insecu-rity and after a bomb attack in which three MSF-Holland staff members were killed.

14
coStS eMerGency aid
Medical and logistical
personnel posted
National personnel
Medical m
aterials
Building materials and
sanitation facilities
Operational costs
Transport, storage and vehicles
Training and support for local institutions
Auditing, advising and
support of projects
Other general costs
Project costs 2008
Budgeted Project costs 2008
Project costs 2007
Afghanistan 1 30 25 56 248 53
Bangladesh 515 448 216 32 83 162 2 15 1,473 353 1,787
Burundi 3 3 4 -1 9 25 1,876
Central African Republic 1,214 1,015 643 292 246 1,003 4 22 0 4,439 4,191 3,553
Chad 1,551 1,286 597 352 331 679 8 27 71 4,902 4,136 4,299
Colombia 868 1,281 205 15 155 203 8 7 26 2,768 2,716 2,753
Congo, Republic of 303 588 26 16 41 33 5 5 1 1,018 1,240 3,091
Democratic Republic of the Congo 3,050 3,925 2,283 530 585 1,533 47 93 -277 11,769 9,846 11,673
Ethiopia 1,305 1,192 751 150 282 570 8 38 -17 4,279 3,494 2,868
Haiti 677 1,971 867 142 96 159 4 23 12 3,951 3,869 3,045
India 1,088 851 463 117 171 273 2 15 117 3,097 2,860 2,865
Iraq 246 177 1,188 0 94 261 231 38 -11 2,224 2,437 1,910
Ivory Coast 212 682 52 1 40 38 24 12 48 1,109 1,093 3,871
Mexico 5 1 29 35 0 0
Moldova 274 252 57 12 58 33 3 6 2 697 743 332
Myanmar (Burma) 1,094 2,091 4,536 1,423 224 1,597 55 67 -64 11,023 8,485 7,128
Nepal 654 362 294 31 98 312 4 17 9 1,781 1,541 989
Nigeria 685 859 467 54 138 270 10 33 11 2,527 1,750 2,030
Pakistan 704 596 312 156 125 234 4 15 8 2,154 2,684 1,683
Papua New Guinea 519 174 160 42 94 143 6 11 11 1,160 759 251
Philippines 4 1 1 1 1 8 0 0
Russia (Caucasus) 338 1,906 947 43 257 246 40 11 52 3,840 4,193 4,197
Somalia 846 1,720 1,518 191 252 1,197 1 27 41 5,793 6,700 6,288
Sri Lanka 472 105 99 29 29 37 1 14 1 787 1,167 925
Sudan - North / Darfur 1,314 2,669 470 218 279 436 2 16 60 5,464 5,752 5,442
Sudan - South 1,991 1,764 1,200 433 347 1,275 9 43 63 7,125 7,574 6,522
Subtotal costs emergency aid 19,933 25,945 17,355 4,279 4,052 10,699 478 584 163 83,488 77,856 79,431continued on page 15

15
brought forward from page 14
Medical and logistical
personnel posted
National personnel
Medical m
aterials
Building materials and
sanitation facilities
Operational costs
Transport, storage and vehicles
Training and support for local institutions
Auditing, advising and
support of projects
Other general costs
Project costs 2008
Budgeted Project costs 2008
Project costs 2007
Transport: Subtotal costs emergency aid 19,933 25,945 17,355 4,279 4,052 10,699 478 584 163 83,488 77,856 79,431Turkmenistan 379 273 102 43 64 60 5 4 -10 920 867 735
Uganda 735 645 216 208 110 273 3 22 18 2,230 888 2,251
Uzbekistan 512 550 719 14 88 121 33 21 -12 2,046 1,501 2,090
Zimbabwe 1,067 1,424 1,837 172 202 567 8 20 126 5,423 4,249 3,530
Projects closed in 2007 in Angola, Indonesia, Liberia, Sierra Leone and Zambia
11 1 6 18 12 4,341
Reserved in the budget for unplanned emergency aid projects
9,627
22,637 28,837 20,229 4,716 4,516 11,721 527 657 285 94,125 95,000 92,378
Other costs and movements in provisions for emergency aid costs
613 59 -295 233 610 -265
Total emergency aid 23,250 28,837 20,229 4,716 4,516 11,780 527 362 518 94,735 95,000 92,113

16
The strategic plan established by the Board indicates the objectives for the type of projects. These objectives can be translated in the costs of emergency aid. The graphics below show two objectives that are the most indicative for MSF-Holland’s work. MSF-Holland works in the first place in conflict areas. At least 30% of its emergency aid is carried out in conflict areas. MSF-Holland wants above all to reach the victims of conflicts so that at least 50% of its costs go to emergency aid and benefiting this group.
The proportion of the costs for medical, logistic and administrative coordination is approximately 16% (2007: 18%) of the total emergency aid costs.
Finally, the financing of the emergency aid is shown. The long-term objective that no more than 10% of the expenditure on emergency aid would be financed by institutional donors was abandoned by the Board in 2008. In 2008 the percentage was 17% (2007: 13%). In the next years an increasing share of institutional funding is anticipated.
eMerGency aid For victiMS oF conFlict in 2008 and 2007
eMerGency aid in conFlict areaS in 2008 and 2007
eMerGency aid FundinG 2008
Victims of armed conflict
Victims of social conflict
Victims of endemic and epidemic diseases
Victims of natural disasters
Medical and logistics coordination of the projects
17%
5%
19%
13%
46%
49%
17%
15%
0%19%
2007
2008
37%
42%
11%
Armed conflict
Internal instability
Post-war countries
Stable countries
10%
23%
14%
35%
28%
2007
2008
Institutional funds
Network MSF
Donations & National Postcode Lottery
17%
24%
59%

17
The costs for preparation and coordination decreased according to planning. The de-crease can be explained by the planned transfer of project management responsibilities to the offices in Canada and Germany.In chapter 5, “Associated parties” this is explained in more detail.
Explanatory notes 2008 Budget 2008 2007
Direct costs note 2.8 1,378 1,415 1,362
Costs staff head office note 2.8 5,916 6,650 6,723
Share in overhead costs note 2.8 3,060 2,935 3,173
Total 10,354 11,000 11,258
Explanatory notes 2008 Budget 2008 2007
Direct costs
Periodical Hulppost (25%; see also chapter 4, “Accounting principles”) 361 356 328
Contributions to the international campaign Access to Essential Medicines 259 221 195
Information activities in television broadcasts of the National Postcode Lottery 235 257 276
Other 722 981 668
1,577 1,815 1,467
Attributable costsCosts personnel head office note 2.8 454 585 575
Attributed overhead costs note 2.8 46 50 50
Total 2,077 2,450 2,092
2.2 Preparation and coordinationin euro thousands
2.3 Information and awareness-raisingin euro thousands
The contributions to the campaign Access to Essential Medicines increased slightly in 2008 in accordance with the guidelines of the MSF-network.

18
Explanatory notes 2008 2008 2007
Contributions to Drugs for Neglected Diseases Initiative in Geneva, Switzerland 442 442 449
Contributions to the international MSF fund for innovative projects; MSF-International 218 0 0
Project grant to MSF-France, Earthquake China 200 0 0
Extraordinary activities 2.4.a. 3,000 0 0
Total commissioned to third parties 3,860 442 449
2.4 Commissioned to third-partiesin euro thousands
The amount of the contributions by MSF-Holland to the Drugs for Neglected Diseases Initiative is determined by the division of costs agreed in the MSF-network. The agree-ment concerning the Drugs for Neglected Diseases Initiative was begun in 2003 and ended July 2008. The agreement has not been continued by MSF-Holland. The contribution to the international fund for innovation in projects is determined in the MSF-network at 1% of income raised out own fundraising activities in the preceding year.
2008 2007
Production film on Médecins Sans Frontières 3,000 0
Total extraordinary activities 3,000 0
2.4.a Extraordinary activitiesin euro thousands
MSF Holland received an exceptional contribution of € 3,000,000 of the Dutch National Postcode Lottery specifically earmarked for the production of a film about the work of MSF. The production of the film has been commissioned in 2008. A tri-partite agreement between the National Postcode Lottery, MSF-Holland and the producer will be drafted governing the commissioning of the film production. From the agreement no additional financial obligations for MSF-Holland will arise.

19
Explanatory notes 2008 Budget 2008 2007
Direct costs Direct mail 658 598 586
Periodical Hulppost (75%; see also chapter 4) 1,082 1,070 984
Telemarketing activities 1,696 3,300 3,417
Face-to-face fundraising 1,901 642 901
Corporate fundraising 113 150 0
Internet fundraising 63 50 0
Other and general costs of fundraising 147 115 514
5,660 5,925 6,402
Attributable costsCosts personnel head office note 2.8 550 625 601
Attributed overhead costs note 2.8 55 50 52
Total 6,265 6,600 7,055
2.5 Costs own fundraisingin euro thousands
In the first quarter of 2008, telemarketing activities that were started in 2006 and 2007 were diminished. Face-to-face and canvassing marketing methods were used more in 2008. Because telemarketing was reduced in 2008 the overall costs of own fundraising reduced. In these financial statements the composition of the income (see note 2.9.c) is presented in the same categories as the expenses to allow for a better comparison of costs versus income. In 2008, 10 full-time staff members worked on fundraising activities (2007: 10 full-time staff ).
28%
27%
30%
1%2%
0%2%10%
Direct mail (including Hulppost)
Telemarketing activities
Face-to-face fundraising
Internet fundraising
Corporate fundraising
Legacies and inheritances
General fundraising
Attributed costs
FundraiSinG expenSeS in 2008
20
coStS own FundraiSinG aS % oF incoMe own FundraiSinG
0% 5%
2009
10% 15% 20% 25%
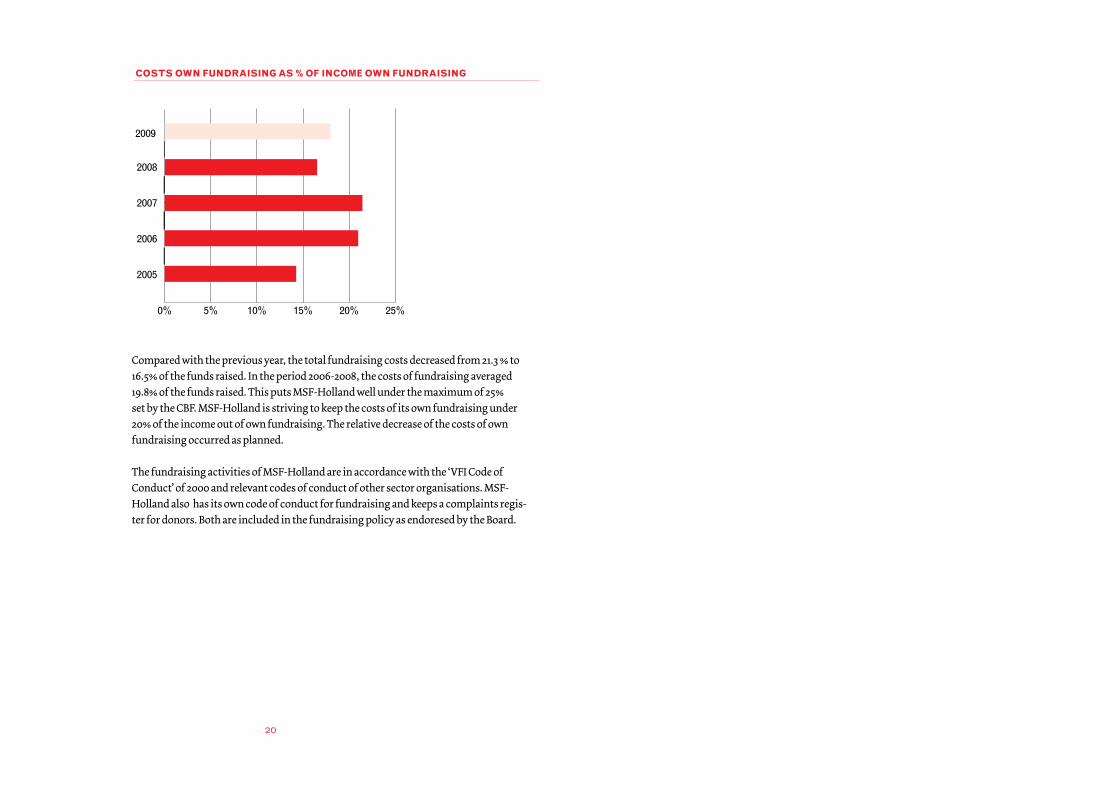
Compared with the previous year, the total fundraising costs decreased from 21.3 % to 16.5% of the funds raised. In the period 2006-2008, the costs of fundraising averaged 19.8% of the funds raised. This puts MSF-Holland well under the maximum of 25% set by the CBF. MSF-Holland is striving to keep the costs of its own fundraising under 20% of the income out of own fundraising. The relative decrease of the costs of own fundraising occurred as planned.
The fundraising activities of MSF-Holland are in accordance with the ‘VFI Code of Conduct’ of 2000 and relevant codes of conduct of other sector organisations. MSF- Holland also has its own code of conduct for fundraising and keeps a complaints regis-ter for donors. Both are included in the fundraising policy as endoresed by the Board.

21
Explanatory notes 2008 Budget 2008 2007
Direct costs note 2.8 6 7 7
Costs head office personnel note 2.8 108 118 128
Attributed overhead costs note 2.8 11 10 11
Total 125 135 146
2.6 Costs from acquiring government grants in euro thousands
The costs from acquiring government grants particularly concern the costs for submitting requests for a grant and for reports justifying the expenditures. The costs from acquiring government grants are included here when incurred at head office. The costs incurred in project countries are included in the coordination costs of direct aid. The income from institutional donor grants increased with € 4.2 million to € 16.3 million in 2008.
2.7 Costs Management and administrationin euro thousands
Explanatory notes 2008 Budget 2008 2007
Direct costs note 2.8 1,072 1,044 981
Contributions to the MSF-International office chapter 5 474 458 265
Costs personnel head office note 2.8 1,800 1,800 1,930
Attributed overhead costs note 2.8 181 148 169
Total 3,527 3,450 3,345
The costs for “Management and administration” in 2008 amounted to 3.0 % of the total expenditures (2007: 2.9 %) and are explained in more detail below.

22
The summary below shows a total of all costs. The costs of head office’ personnel and the “Overhead” costs are divided in proportion to the attributed number full-time equiva-lents (fte) employed at headquarters during the year. The costs of the “Overhead” are shown in full in the summary of total costs. MSF-Holland wants to show the size and the
type of these costs and also indicate their attribution to its main activities.
The attribution of costs to the different activities is explained in more detail in chapter 4; accounting principles. The total of the costs and the breakdown of the costs is as follows:
2.8 Total all costs, specification and division of costs according to type and allocation in euro thousands
Spent on Association goals Fundraising
Management and
AdministrationTo be
attributed
2008 Total
Budget 2008 Total
2007 Total
Emergency A
id
Com
missioned to
third-party
Preparation and coordination
Information and
awareness raising
Ow
n fundraising
Acquiring
government grants
Overhead
Managem
ent and A
dministration
Number of full-time units working during the year
467 0 104 8 10 2 31 13 635 716 714
Direct costs direct aidMedical and logistical staff posted
23,250 23,250 23,544 24,244
National staff 28,837 28,837 30,383 28,024
Medical materials 20,229 20,229 20,874 18,384
Building materials and sanitation facilities
4,716 4,716 2,751 3,252
Operational costs 4,516 4,516 4,646 4,738
Transport, storage and vehicles
11,780 11,780 10,656 11,487
Training and support of local institutions
527 527 1,278 587
Auditing, advising and support projects
362 362 397 403
Other general costs 518 518 488 994
Subtotal direct costs emergency aid 94,735 94,735 95,017 92,113continued on page 23

23
Spent on Association goals Fundraising
Management and
AdministrationTo be
attributed
Total 2008
Budget total 2007
Total 2007brought forward from page 22
Emergency A
id
Third-party activities
Preparation and coordination
Information and
awareness raising
Ow
n fundraising
Acquiring
government grants
Managem
ent and A
dministration
Overhead
Transport: Subtotal direct costs emergency aid 94,735 94,735 95,017 92,113
Commissioned to third-parties 642 - - - - - - 642 442 449
Contributions 218 - 259 - - 474 - 951 680 460
Publicity and communications 3,000 - 800 4,376 - - - 8,176 5,725 6,036
Housing costs - - - - - - 1,006 1,006 1,000 1,017
Office and general costs - 186 461 1,162 - 510 1,141 3,460 3,800 3,615
Cost supplies and stocks - 242 - - - - - 242 245 242
Travel and accommodation costs - 654 27 32 6 106 45 870 910 886
Advice costs - 296 - - - 324 136 756 400 572
Costs board - - - - - 132 - 132 140 89
Depreciation and interest - - 30 90 - - 258 378 285 340
94,735 3,860 1,378 1,577 5,660 6 1,546 2,586 111,348 108,644 105,819
Costs to be divided for head office personnelSalaries and social security 4,934 379 459 90 1,501 639 8,002 8,800 8,147
Pension contributions 536 41 50 10 163 70 870 1,020 999
Other personnel costs 446 34 41 8 136 58 723 630 1,493
Subtotal all costs 94,735 3,860 7,294 2,031 6,210 114 3,346 3,353 120,943 119,094 116,458
Breakdown of overhead costs 3,060 46 55 11 181 -3,353
Total all costs 94,735 3,860 10,354 2,077 6,265 125 3,527 0 120,943 119,094 116,458
24
2.8 a Composition of the expenditures
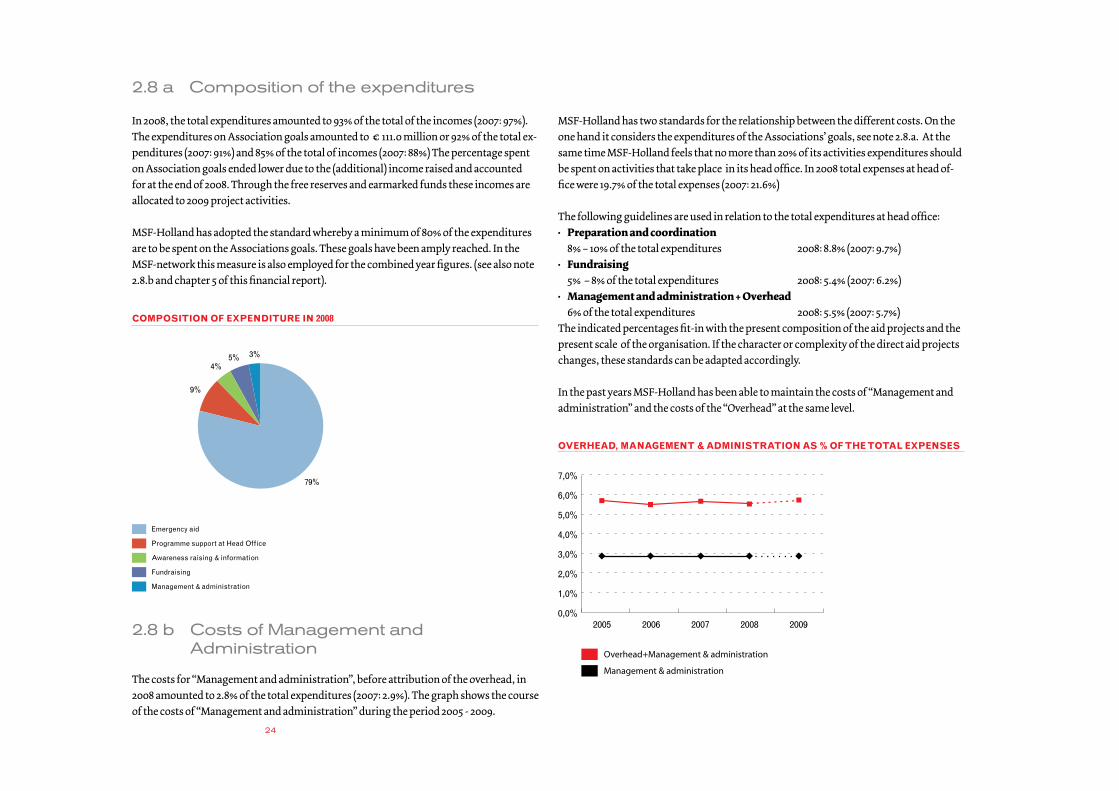
In 2008, the total expenditures amounted to 93% of the total of the incomes (2007: 97%). The expenditures on Association goals amounted to € 111.0 million or 92% of the total ex-penditures (2007: 91%) and 85% of the total of incomes (2007: 88%) The percentage spent on Association goals ended lower due to the (additional) income raised and accounted for at the end of 2008. Through the free reserves and earmarked funds these incomes are allocated to 2009 project activities.
MSF-Holland has adopted the standard whereby a minimum of 80% of the expenditures are to be spent on the Associations goals. These goals have been amply reached. In the MSF-network this measure is also employed for the combined year figures. (see also note 2.8.b and chapter 5 of this financial report).
2.8 b Costs of Management and Administration
The costs for “Management and administration”, before attribution of the overhead, in 2008 amounted to 2.8% of the total expenditures (2007: 2.9%). The graph shows the course of the costs of “Management and administration” during the period 2005 - 2009.
MSF-Holland has two standards for the relationship between the different costs. On the one hand it considers the expenditures of the Associations’ goals, see note 2.8.a. At the same time MSF-Holland feels that no more than 20% of its activities expenditures should be spent on activities that take place in its head office. In 2008 total expenses at head of-fice were 19.7% of the total expenses (2007: 21.6%)
The following guidelines are used in relation to the total expenditures at head office:• Preparation and coordination 8% – 10% of the total expenditures 2008: 8.8% (2007: 9.7%)• Fundraising 5% – 8% of the total expenditures 2008: 5.4% (2007: 6.2%)• Management and administration + Overhead 6% of the total expenditures 2008: 5.5% (2007: 5.7%)The indicated percentages fit-in with the present composition of the aid projects and the present scale of the organisation. If the character or complexity of the direct aid projects changes, these standards can be adapted accordingly.
In the past years MSF-Holland has been able to maintain the costs of “Management and administration” and the costs of the “Overhead” at the same level.
coMpoSition oF expenditure in 2008
overHead, ManaGeMent & adMiniStration aS % oF tHe total expenSeS
79%
9%
4%5% 3%
Emergency aid
Programme support at Head Office
Awareness raising & information
Fundraising
Management & administration
2005 2006 2007 200920080,0%
1,0%
2,0%
3,0%
4,0%
5,0%
6,0%
7,0%
Overhead+Management & administration
Management & administration

25
2.8 c Personnel
In the course of 2008, MSF-Holland posted 821 members of staff to its projects (2007: 800) corresponding to 467 full-time equivalents (2007: 535). In 2008, MSF employed approxi-mately 5,420 national staff ( 2007: 5,602).
At head office there were 168 FTEs employed in 2008 (2007: 179). This number diminished more than planned.The number of FTEs involved in preparation and coordination and administration at head office decreased according to planning (minus 10 FTE), whilst the number of FTE in the other categories remained about the same.
2.8 d Salaries, social security and personnel costs
The salaries, € 8,548,366 (2007: € 10,186,545), social security costs, € 397,510 (2007: € 445,604) and pension contributions, € 893,102 (2007: € 1,068,504 ) are shown in the item “Medical and logistical staff posted” (direct costs emergency aid). Costs of staff that is hired-in from another MSF-section are also included here, € 5,759,612 in 2008 (2007: € 5,329,718). Other general costs include personnel costs regarding housing, international transport, training en preparation for departure and posting. The decrease in MSF-Hol-land’s salary costs and the related expenses is due to the fact that less expatriate personnel full time equivalents were spent in emergency aid projects in 2008.
The item “Salaries and social security” of head office personnel costs exclusively consists of the gross salaries, taxed reimbursement of expenses and associated social security costs, € 1,084,983 (2007: € 1,095,312). Non-taxable reimbursements, canteen costs and the costs of temporary and free-lance staff employed are included in the item “Other person-nel costs”.
In 2008, the average costs for head office personnel remained unchanged. It is expected that the average costs of personnel will increase in 2009 because of inflation correction and the planned adaptation of the function grid.
The decrease in the item “Other personnel costs” was due to a more strict policy on the employment of temporary personnel and the completion of two essential IT-implementa-tions (purchasing and fundraising).
2.8 e Auditors costs
€ 74,197 (2007: € 91,355) is included as the fee for our external auditor KPMG Accountants N.V. for auditing the financial report. In the costs for ‘Auditing, advising and supporting projects’ € 104,759 (2007: € 76,488) is included for auditing project expenses, mainly for the benefit of institutional donors. Of this amount € 42,840 concerns the auditing costs for contracts that have ended in 2008. The amounts shown include VAT.
2.8 f Board and Association costs and expenses paid to board members
The Board and Association costs cover the costs made by Board members when carrying out their task of supervision, the costs of the General Assembly and the costs for the repre-sentation of the Association in the network Médecins Sans Frontières. With the exception of the president, members of the Board receive no remuneration. By decision of the Board of the Association, the president is granted compensation for the time that he devotes to his work. In 2007 the Board has extended the number of days for which the president may claim compensation. This concerns a temporary extension to 4 days a week. The increased workload is due to increasing tasks within the network Médecins Sans Frontières. The total compensations paid in 2008 amounted to € 65,268 (2007: € 48,650):
in euro thousands 2008 Budget 2008
2007
Compensation paid to president: P. de Graaf (from May 25, 2008)
38 43 0
Compensation paid to president: A. van der Veen (until May 24, 2008)
27 30 49
Total 65 73 49
In 2008 the other Board members have not received any remuneration from the Associa-tion MSF-Holland. No loans, advances or guarantees were provided to Board members.
At December 31, 2008, the number of Board members of the Association MSF-Holland comprised: 8 (2007: 10). According to the statutes of the Association, the minimum number of Board members required is 10.
26
2.8 g Remuneration of the directorsin euro thousands
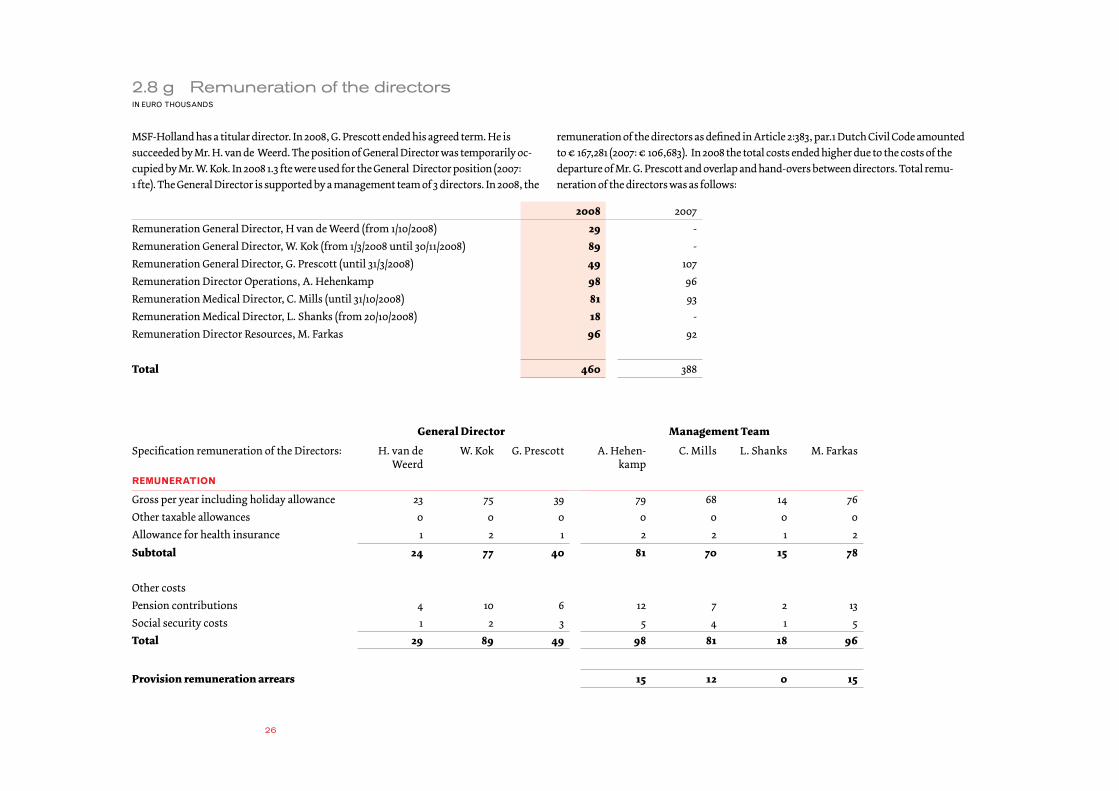
MSF-Holland has a titular director. In 2008, G. Prescott ended his agreed term. He is succeeded by Mr. H. van de Weerd. The position of General Director was temporarily oc-cupied by Mr. W. Kok. In 2008 1.3 fte were used for the General Director position (2007: 1 fte). The General Director is supported by a management team of 3 directors. In 2008, the
remuneration of the directors as defined in Article 2:383, par.1 Dutch Civil Code amounted to € 167,281 (2007: € 106,683). In 2008 the total costs ended higher due to the costs of the departure of Mr. G. Prescott and overlap and hand-overs between directors. Total remu-neration of the directors was as follows:
2008 2007
Remuneration General Director, H van de Weerd (from 1/10/2008) 29 -
Remuneration General Director, W. Kok (from 1/3/2008 until 30/11/2008) 89 -
Remuneration General Director, G. Prescott (until 31/3/2008) 49 107
Remuneration Director Operations, A. Hehenkamp 98 96
Remuneration Medical Director, C. Mills (until 31/10/2008) 81 93
Remuneration Medical Director, L. Shanks (from 20/10/2008) 18 -
Remuneration Director Resources, M. Farkas 96 92
Total 460 388
General Director Management Team
Specification remuneration of the Directors: H. van de Weerd
W. Kok G. Prescott A. Hehen-kamp
C. Mills L. Shanks M. Farkas
reMuneration
Gross per year including holiday allowance 23 75 39 79 68 14 76
Other taxable allowances 0 0 0 0 0 0 0
Allowance for health insurance 1 2 1 2 2 1 2
Subtotal 24 77 40 81 70 15 78
Other costs
Pension contributions 4 10 6 12 7 2 13
Social security costs 1 2 3 5 4 1 5
Total 29 89 49 98 81 18 96
Provision remuneration arrears 15 12 0 15

27
In 2008, MSF-Holland reassessed the classification of the directors positions according to the guideline “Advisory scheme for the remuneration of directors of charity organisa-tions”. This advisory scheme was adopted by the members of the VFI sector organisation in December 2005. Based on this scheme, MSF-Holland has classified the director to job grade I, which provides for a maximum of € 117,294 (2008 table). In accordance with this advisory scheme, the maximum yearly income for the other directors who are part of the management team has been classified as job grade H with a maximum of € 103,431 (2008 table). According to the scheme, pension and employer’s costs are not included in these
payments. The reassessment as done by the Board has been reviewed by an external advisor. The directors Mr. M. Farkas and Ms. L. Shanks have secondary occupations. Mr. M. Farkas is board member of MSF-Sweden (from May 2008), member of the Board of Directors of the foundation Integrand Nederland (from April 2008), advisor to the Foundation Veritas Beheer and board member of Foundation Veritas Eigen huis. Ms. L. Shanks is board member of MSF-Norway (from May 2008). These occupations are not remunerated and in accordance with the policies of MSF-Holland. No loans, advances or guarantees were provided to any of the directors.
2.9 Income from own fundraisingin euro thousands
Explanatory notes 2008 Budget 2008 2007
Donations from mailings, including Hulppost 14,560 13,000 13,259
Inheritances 8,171 7,000 8,177
Donations from telemarketing 8,063 9,300 8,115
Donations from corporate fundraising 2,517 1,500 1,594
Donations from face-to-face fundraising 1,688 1,200 210
Other donations received 1,542 0 1,116
Grants from private organisations and provincial governments 2.9.b. 1,148 1,385 300
Internet donations 377 300 173
Contributions from Association members 14 15 13
Sales of goods 0 0 113
Total 38,080 33,700 33,070
2.9 a Earmarked income from own fundraising (see also note 3.8.d.; the appropriation fund)
Receipts Expenditures Not spentin 2008 in 2008 in 2008
Donations for Myanmar including cyclone Nargis 391 -391 0Donations and gifts for various countries 232 -232 0Grants from private organisations and provincial governments
1,148 -1,148 0
Balance as at 31 December to allocation funds 1,771 -1,771 0
All income received in 2008 earmarked by donors has been spent in 2008. No addition was made to the appropriation fund in 2008.

28
2.9 b Grants from private organisations are as follows:
Allocation 2008 2007
Achmea Foundation Myanmar, Yangon 100 0
Medicor Foundation Congo, Republic of 0 300
Medicor Foundation Uganda 548 0
Province of Zeeland, The Netherlands China earthquake 200 0
Province of Zeeland, The Netherlands Myanmar, cyclone 300 0
1,148 300
2.9 c Composition of income from own fundraising
In 2008, the income from own fundraising rose by € 5.0 million from € 33.1 million in 2007 to € 38.1 million in 2008. The increase was greater than budgeted. From the end of 2006 until mid 2008 MSF-Holland made more investments in own fundraising. This has resulted in a significant increase in income received from own fundraising in 2007 ( € 5.1 million) and 2008 ( € 5 million)
The income from donations grew by € 3.4 million while the income from corporate fund-raising grew by € 1.0 million. The increase in donations from telemarketing slowed down considerably in 2008. MSF-Holland redirected the expenses towards other fundraising channels, such as face-to-face fundraising. In these financial statements the composition of the income is presented in the same categories as the expenses (see note 2.5) to allow for a better comparison of costs versus income.
incoMe FroM own FundraiSinG 2008 incoMe and coStS FroM own FundraiSinG 2005 - 2009
Spontaneous donations
Legacies and inheritances
Corporate fundraising
Direct mail (including Hulppost)
Telemarketing
Face-to-face campaigns
Internet
Private Funds, local councils
Contribution members
38%
21%
4%
1%
0%3%
4%
7% 22%
2005 2006 2007 200920080
5
10
15
20
25
30
35
40
45
Income own fundraising
Cost own fundraising
in million euro

29
2.10 Income from third-partiesin euro thousands
Explanatory notes 2008 Budget 2008 2007
Proceeds National Postcode Lottery, regular draw 15,000 15,000 15,461
Proceeds National Postcode Lottery, extra draw 2.10.a 883 0 0
Proceeds National Postcode Lottery, extra draw 2.10.a 3,000 0 0
18,883 15,000 15,461
As of 1 January 2008 the contract with the National Postcode Lottery has been renewed for a period of 5 years. The maximum annual contribution to MSF-Holland from the regular draw is set at € 15,000,000. In 2008 MSF Holland was awarded an additional amount of € 883,369. This contribution is earmarked for the project in Baraka, DR Congo and
represents the MSF-Holland part of a joint proposal with Oxfam-Novib of € 1,668,745. In addition MSF-Holland was awarded an extraordinary contribution of € 3,000,000 specifi-cally for the production of a film about the work of MSF. The production of the film was contracted to a third party in 2008.
2.10 a Earmarked income from third-party activities (see also note 3.98.d.; the appropriation fund)
in euro thousands
Receipts in 2008
Expenditures in 2008
Not spent in 2008
Project Baraka, DR Congo 883 0 883Production film MSF 3,000 3,000 0
Balance as at 31 December to allocation funds 3,883 3,000 883
30
2008 Budget 2008 2007
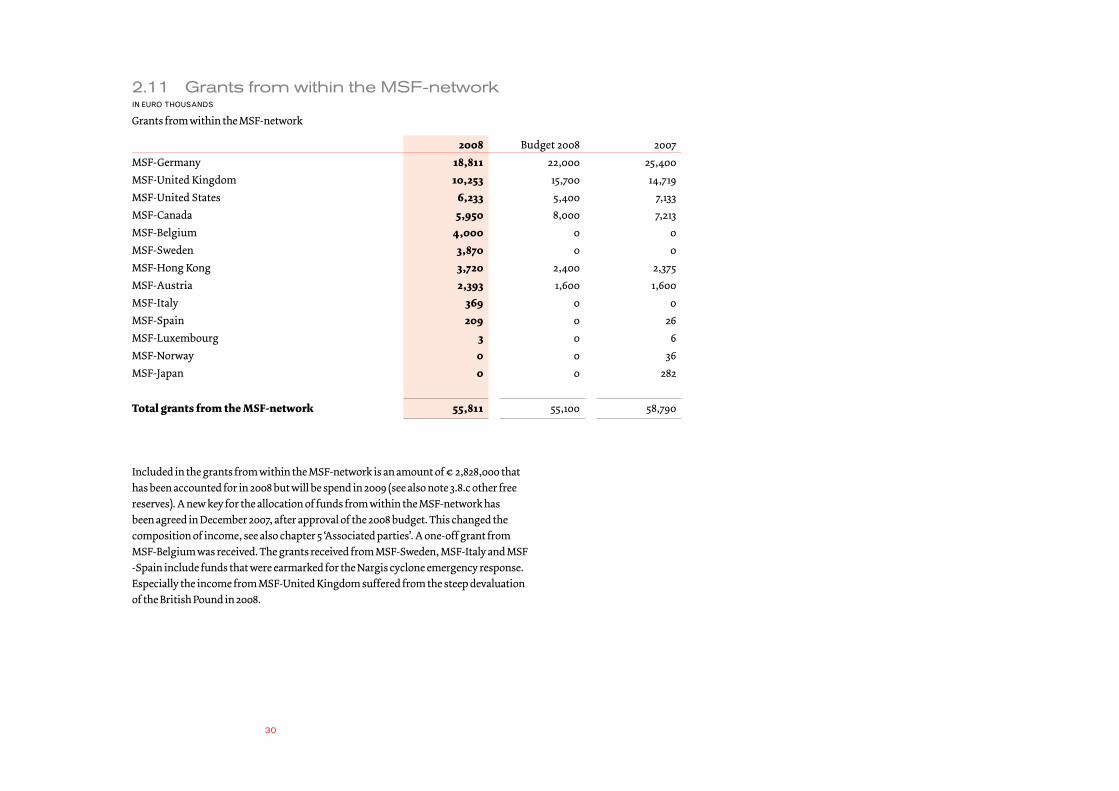
MSF-Germany 18,811 22,000 25,400
MSF-United Kingdom 10,253 15,700 14,719
MSF-United States 6,233 5,400 7,133
MSF-Canada 5,950 8,000 7,213
MSF-Belgium 4,000 0 0
MSF-Sweden 3,870 0 0
MSF-Hong Kong 3,720 2,400 2,375
MSF-Austria 2,393 1,600 1,600
MSF-Italy 369 0 0
MSF-Spain 209 0 26
MSF-Luxembourg 3 0 6
MSF-Norway 0 0 36
MSF-Japan 0 0 282
Total grants from the MSF-network 55,811 55,100 58,790
Grants from within the MSF-network
2.11 Grants from within the MSF-networkin euro thousands
Included in the grants from within the MSF-network is an amount of € 2,828,000 that has been accounted for in 2008 but will be spend in 2009 (see also note 3.8.c other free reserves). A new key for the allocation of funds from within the MSF-network has been agreed in December 2007, after approval of the 2008 budget. This changed the composition of income, see also chapter 5 ‘Associated parties’. A one-off grant from MSF-Belgium was received. The grants received from MSF-Sweden, MSF-Italy and MSF -Spain include funds that were earmarked for the Nargis cyclone emergency response. Especially the income from MSF-United Kingdom suffered from the steep devaluation of the British Pound in 2008.

31
2.12 Grants from institutional donorsin euro thousands
Grants from institutional donors come from: 2008 Budget 2008 2007
European Union (ECHO and EU) 5,254 4,500 1,743
German government (AA) 1,983 1,000 850
Swedish government (Sida) 1,729 1,500 1,747
Canadian government (CIDA) 1,662 1,500 1,424
British government (DFID) 1,310 1,000 979
Norwegian government (NORAD, NRMFA) 1,089 500 1,100
Irish government (Ireland Aid) 837 1,750 1,389
Danish government (DANIDA) 828 0 0
3-Diseases Fund 816 1,400 1,064
United Nations (UNAIDS, UNHCR, UNICEF) 286 450 450
Swiss government (SDC) 262 0 0
Dutch government (BuZa) 215 290 1,394
Other institutional donors 0 2,110 0
Total 16,271 16,000 12,140
The project grants refer to the portion of the grants awarded that concern activities carried out in the financial year.
2.13 Other incomein euro thousands
2008 Budget 2008 2007
Income from interest 1,390 900 1,133
Other income and expenditure 0 0 -71
Total 1,390 900 1,062
Income from interest rose in 2008 due to an improvement in the rate of interest for short-term savings-deposits and money market deposits for foreign currencies.
32
2.14 Exchange results from transactions in currency
in euro thousands
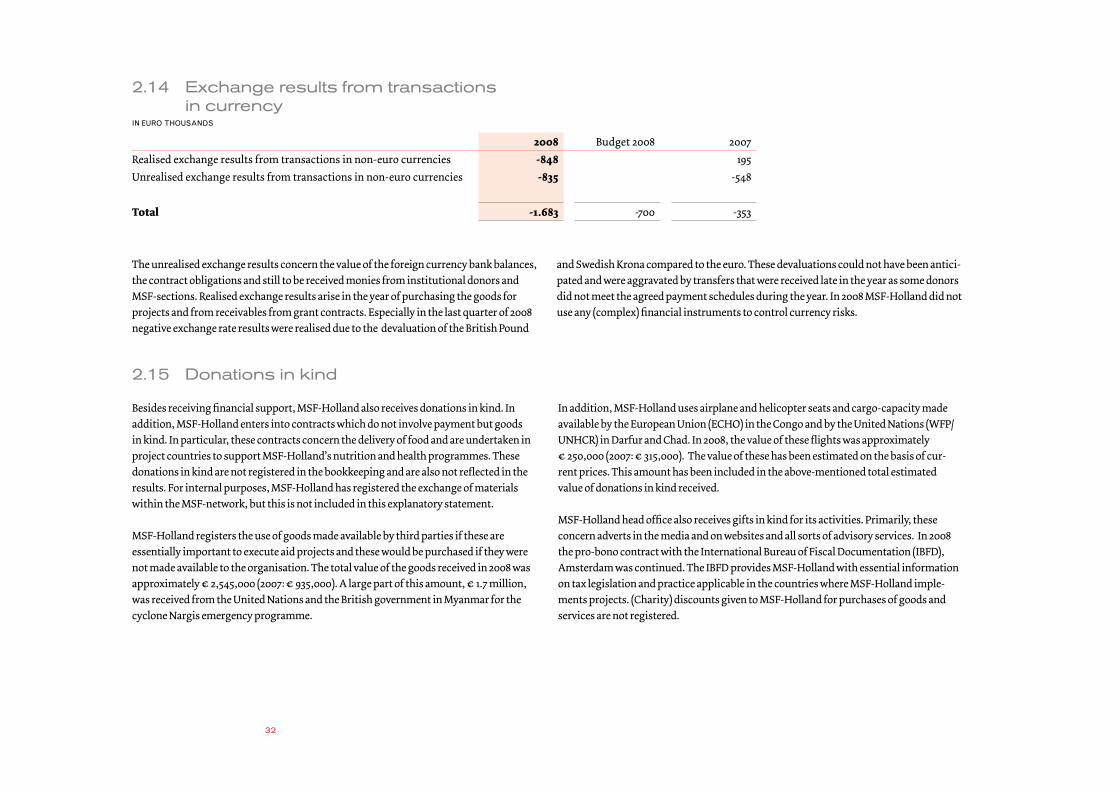
2008 Budget 2008 2007
Realised exchange results from transactions in non-euro currencies -848 195
Unrealised exchange results from transactions in non-euro currencies -835 -548
Total -1.683 -700 -353
The unrealised exchange results concern the value of the foreign currency bank balances, the contract obligations and still to be received monies from institutional donors and MSF-sections. Realised exchange results arise in the year of purchasing the goods for projects and from receivables from grant contracts. Especially in the last quarter of 2008 negative exchange rate results were realised due to the devaluation of the British Pound
and Swedish Krona compared to the euro. These devaluations could not have been antici-pated and were aggravated by transfers that were received late in the year as some donors did not meet the agreed payment schedules during the year. In 2008 MSF-Holland did not use any (complex) financial instruments to control currency risks.
2.15 Donations in kind
Besides receiving financial support, MSF-Holland also receives donations in kind. In addition, MSF-Holland enters into contracts which do not involve payment but goods in kind. In particular, these contracts concern the delivery of food and are undertaken in project countries to support MSF-Holland’s nutrition and health programmes. These donations in kind are not registered in the bookkeeping and are also not reflected in the results. For internal purposes, MSF-Holland has registered the exchange of materials within the MSF-network, but this is not included in this explanatory statement.
MSF-Holland registers the use of goods made available by third parties if these are essentially important to execute aid projects and these would be purchased if they were not made available to the organisation. The total value of the goods received in 2008 was approximately € 2,545,000 (2007: € 935,000). A large part of this amount, € 1.7 million, was received from the United Nations and the British government in Myanmar for the cyclone Nargis emergency programme.
In addition, MSF-Holland uses airplane and helicopter seats and cargo-capacity made available by the European Union (ECHO) in the Congo and by the United Nations (WFP/UNHCR) in Darfur and Chad. In 2008, the value of these flights was approximately € 250,000 (2007: € 315,000). The value of these has been estimated on the basis of cur-rent prices. This amount has been included in the above-mentioned total estimated value of donations in kind received.
MSF-Holland head office also receives gifts in kind for its activities. Primarily, these concern adverts in the media and on websites and all sorts of advisory services. In 2008 the pro-bono contract with the International Bureau of Fiscal Documentation (IBFD), Amsterdam was continued. The IBFD provides MSF-Holland with essential information on tax legislation and practice applicable in the countries where MSF-Holland imple-ments projects. (Charity) discounts given to MSF-Holland for purchases of goods and services are not registered.

33
B-FaSt, Merlin, MdM
Canvas, plastic 50 Roll Medical emergency kit 3m 10 Kit Family tent 130 Unit
Canvas, plastic, 60x4m 13 Box Canvas, plastic4x6m 15 Unit Water purification kit 1 Unit
BritiSH GovernMent (dFid)
Blankets 70,000 Unit Bed nets 80,000 Unit
Plastic canvas 4x6m 27,000 Unit
united nationS (wFp)
Cereals 575.95 Metric Tons Corn flour, CSB 337.05 Metric Tons
Lentils/pulses 76.83 Metric Tons Beans 50.96 Metric Tons
Vegetable oil 78.36 Metric Tons Sugar 19.21 Metric Tons
Salt 12.34 Metric Tons Vegetables 32.20 Metric Tons
united nationS (unHcr)
Blankets 2,350 Unit Bed nets 550 Unit Diesel 600 Litre
Maternity kit 1 Kit Contraceptives 602,200 Unit
united nationS (uniceF)
Plumpy-nut 4,949 Dozen Milk powder F-75, F-100 101 Dozen Various Vaccines 26,760 Doses
Tent 103 Unit Milk powder F-75, F-101 1 Pallet Vaccination materials p.m.
Canvas, plastic, 4x6m 3,001 Unit Blankets 520 Unit Medical material p.m.
Jerry cans 1,000 Unit Soap 10,000 Unit Ringer IV-fluids 1,000 KG
Water pump 2 Unit Soap 234 Dozen Bed nets 9,774 Unit
BP5- biscuits 755 Dozen refrigerator (vaccines) 2 Unit Nutrition Kit 2 Kit
BP5- biscuits 1 Pallet Medical emergency kit 3m 4 Kit Nutrition material p.m.
Essential medicine kit 500 Kit Freight costs p.m.
united nationS (unFpa)
Contraceptives 974,000 Unit Various medical material p.m.
MiniStry oF HealtH, nyala, darFur
Various Vaccines 43,837 Doses
national tB proGraMMe, MyanMar
MDR-TB medicines 706,237 Unit

34
35
3 Explanation of the Balance Sheet
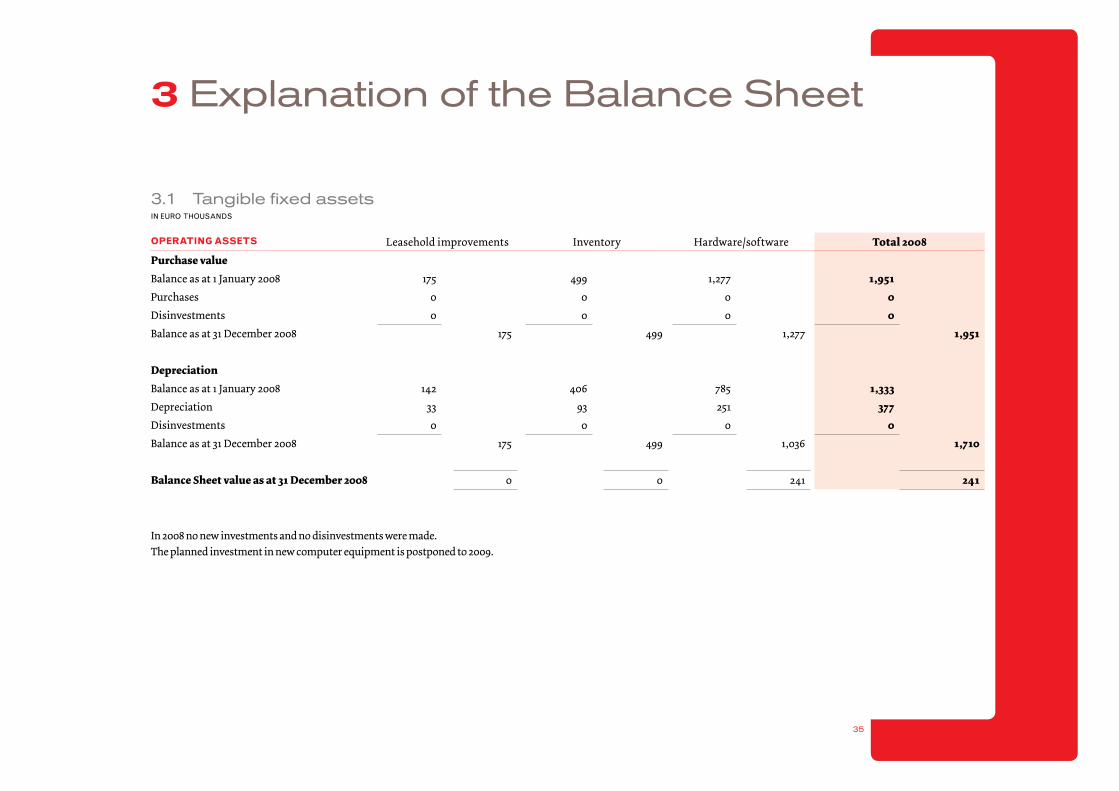
operatinG aSSetS Leasehold improvements Inventory Hardware/software Total 2008
Purchase value
Balance as at 1 January 2008 175 499 1,277 1,951
Purchases 0 0 0 0
Disinvestments 0 0 0 0
Balance as at 31 December 2008 175 499 1,277 1,951
Depreciation
Balance as at 1 January 2008 142 406 785 1,333
Depreciation 33 93 251 377
Disinvestments 0 0 0 0
Balance as at 31 December 2008 175 499 1,036 1,710
Balance Sheet value as at 31 December 2008 0 0 241 241
3.1 Tangible fixed assetsin euro thousands
In 2008 no new investments and no disinvestments were made.The planned investment in new computer equipment is postponed to 2009.

36
Stock For aSSociation GoalS - direct aid 2008 2007
Medical materials 935 1,007
Transport equipment 352 401
Other materials 695 837
Stocks as at 31 December 1,982 2,245
Provision for obsolescence -53 -37
Balance as at 31 December 1,929 2,208
3.2 Stocksin euro thousands
Included in this item are stocks for direct aid that are kept in the Netherlands (see also chapter 4). The value of the project-related stocks taken into stock as at 31 December amounts to € 742,879 (2007: € 699,822). The other stocks have not yet been allocated to aid projects and concern free stocks and so-called emergency stocks. The item “Other
materials” consists mainly of emergency housing materials (tents, tools, etc.), water and sanitation equipment, communication equipment and computers for the projects.The provision for obsolescence concerns medical materials for which the shelf life is about to expire. In 2008 the actual write-off was € 67,789.
2008 2007
Receivables from the National Postcode Lottery, regular draw 1,554 2,622
Receivables from the National Postcode Lottery, extra draw 2008 3,883 0
5,437 2,622
3.3 Receivables from Third-Party Appealsin euro thousands
Receivables from the National Postcode Lottery are short-term.

37
3.4 Receivables from within the Médecins Sans Frontières networkin euro thousands
The receivables from Médecins Sans Frontières sections concern project grant contracts that have ended. The receivables are short-term.
The receivables from Médecins Sans Frontières sections throughout the year developed as follows:
2008 2007
Balance as at 1 January 4,983 3,502
Project grants awarded 55,811 58,791
Exchange rate differences -429 -213
Project grants received -53,621 -57,097
Balance as at 31 December 6,744 4,983
2008 2007
Balance as at 1 January 3,596 8,225
Project grants awarded 19,112 12,070
Exchange rate differences -444 -78
Project grants received -15,882 -16,263
Non-allocated project grants -447 -358
Balance as at 31 December 5,935 3,596
The receivables are as follows:
Receivables from terminated project grant contracts 1,568 1,666
Receivables from current project grant contracts 4,367 1,930
5,935 3,596
3.5 Receivables from institutional donorsin euro thousands
Receivables for institutional grants comprise receivables from both awarded project grants and those that have already ended. Developments of these in the financial year were as follows:

38
Receivables from institutional grants have a term shorter than one year. The “project grants received” include receipts from grants from private organisations. In 2008, this amounted to € 548,031 (2007: € 312,000). In the cash flow statement the division is shown.
2008 2007
Debtors 19 0
Taxes and social security contributions to be received. 24 13
Pre-paid pension scheme contributions 172 455
Debtors from settled inheritances 931 581
Receivable from other MSF-sections 1,254 992
Prepayments and accrued income 2,161 1,073
Balance as at 31 December 4,561 3,114
3.6 Other receivables and accrued incomein euro thousands
All other receivables and accrued income are short-term. The amounts receivable under “Receivable from other MSF-sections” refer to prefinancing of joint projects, advance payments and secondment of personnel working for other MSF-sections.
2008 2007
Balance of cash at bank and in hand at headquarters 55,460 47,132
Balance of cash at bank and in hand at projects 4,950 5,885
Balance as at 31 December 60,410 53,017
3.7 Cash at bank and in handin euro thousands
The headquarters’ balance of cash at bank includes immediately accessible savings accounts to the sum of € 48,908,863 (2007: € 32,563,333). These savings accounts are 1 monthly, 3 monthly and 6 monthly bank deposits at the Fortis Bank (NL), ABN AMRO Bank and van Lanschot Bankers. MSF-Holland holds its main operating cash management accounts at Fortis bank (NL). In 2008 MSF-Holland did not use any complex financial instruments.

39
Continuity reserve
Allocation reserve
Other free reserve
Appropiation fund
Total 2008 Total 2007
Balance as at 1 January 59,000 2,826 -1,188 212 60,850 57,138
Allocation of the result 0 -656 7,582 883 7,809 3,712
Balance as at 31 December 59,000 2,170 6,394 1,095 68,659 60,850
3.8 Reserves and fundsin euro thousands
In accordance with the Board’s resolution, a continuity reserve has been formed. The amount of the reserve has been set at the average amount (over three years) of ex-penditures needed to ensure the unimpeded progress of the projects and the related supporting activities for a six-month period. In 2008, no additions or withdrawals to the continuity reserves have been made. MSF-Holland’s continuity reserve satisfies the various guidelines and complies with the standard set by the Board.
Within the network Médecins Sans Frontières, a reserve for at least three and, at the most twelve months has been agreed. The lower limit of three months must also be available in cash at bank and in hand. According to the conditions of the CBF certi-fication, the continuity reserve should not exceed a maximum of one and half times the yearly costs for the operational activities. MSF-Holland considers the expenses on the project and the related supporting activities and the costs of fundraising as costs of the operational activities. Depreciation costs, contributions and one-off items are not included here. Payable grants to third parties are short term liabilities and are also not included.
3.8 a Continuity reserve

40
The extent of the continuity reserve is calculated as follows: Expenditure 2007
Expenditure 2008
Budget 2009 6-month average
Emergency Aid 92,113 94,735 104,000 48,475Preparation and coordination 11,258 10,354 9,900 5,252Information and awareness raising 2,092 2,077 2,500 1,112Own fundraising 7,055 6,265 6,600 3,320Acquisition grants institutional donors 146 125 150 70Management and administration 3,345 3,527 3,575 1,741
116,009 117,083 126,725 59,970Deduct:Depreciation costs 340 378 350 178One-off expenses (fundraising) 1,200 0 0 200Contributions 460 733 765 326
Target continuity reserves (6 months) as at 31 December 114,009 115,972 125,610 59,266
Actual continuity reserves as at 31 December 59,000
Target lower limit (3 months) continuity reserves as at 31 December 29,633
At the end of 2008, 93% of the reserves were retained in cash at hand and in bank (2007: 92%). MSF-Holland needs a solid liquidity position to be able to guarantee the unhin-dered progress of its aid projects and to come into action quickly if need be.

41
Tangible fixed assets
Stocks Total 2008
Balance as at 1 January 618 2,208 2,826
Allocation of the result -377 -279 -656
Balance as at 31 December 241 1,929 2,170
3.8 b Appropriation reservein euro thousands
The appropriated reserve is used to finance the tangible fixed assets and stocks and calculated as follows:
Planned investments for 2008 were cancelled or postponed into 2009. Next to that the amount of stock decreased slightly. The decrease in the appropriation reserves has been added to the other free reserves. As in 2009 new investments are planned an addition to the appropriation reserves has been budgeted.
3.8 c Other free reserve
In 2008 through the allocation of the result the amount of € 656,006 was withdrawn from the appropriation reserve and added to the other free reserves. In addition the entire part of the year-end result that has not been earmarked to be spend on a specific project, € 7,809,307, has been added to the other free reserves.
With these additions the remaining shortfall in the other free reserves originating from 2006 has been fully compensated. The other free reserves will be used for emergency aid projects in 2009. In the budget for 2009 this has been taken into account (see also chapter 6) .

42
Unused at yearend 2007
Receipts in 2008
Expenditure in 2008
Unused at yearend 2008
Earmarked income from own fundraising: Earmarked for various countries 0 232 -232 0
Earmarked for Myanmar 0 391 -391 0
Subsidies of private foundations 0 1,148 -1,148 0
Other earmarked funds: MSF-International: meningitis vaccines 212 0 0 212
Earmarked income National Postcode Lottery: Baraka, DR Congo 0 883 0 883
Balance as at 31 December 212 2,654 -1,771 1,095
3.8 d Appropriation fundsin euro thousands
The appropriated funds contains the funds that have been earmarked by donors for a specific purpose and which have not yet been spent. Note 2.9.a. gives an indication of the volume of earmarked monies that are received and spent during the year. The balance of the appropriated funds is calculated as follows:
The earmarked funds for the meningitis vaccines concern a stock of semi-finished vac-cines. This stock is used in February 2009 and the funds have been spent. The earmarked funds for Baraka, DR Congo, will be spend in 2009.

43
The item “Payable to other MSF-sections” refers to liabilities to MSF-sections that concern amounts for international projects, personnel costs and training for expatriate staff. Increasingly funds advanced by other MSF-sections in the project countries are used and the payables to MSF-Logistique also increased. The increase in other liabilities is the result of an increase in outstanding cheque payments and the increase in credi-tors in the project countries. The National Postcode Lottery awarded MSF-Holland
an extraordinary contribution of € 3,000,000 specifically for the production of a film on the work of MSF. The production was contracted in 2008. Budgetary commitments are commitments arising from awarded project grants in which the commitment falls in proportion to the progress of the project. The balance concerns the portion of the project grants that have yet to be implemented by MSF-Holland.
2008 2007
Budgetary commitments (see specification below) 3,356 1,651
Accounts payable/creditors 2,663 2,548
Payable to other MSF-sections 2,679 1,533
Taxes payable 349 336
Other liabilities 7,551 3,240
Balance as at 31 December 16,598 9,308
3.9 Short-term liabilitiesin euro thousands
The item “Budgetary commitments” developed in the year as follows:
2008 2007
Balance as at 1 January 1,651 2,372
Listed under long-term liabilities as at 1 January 0 0
Project grants awarded in this financial year 74,923 70,860
Exchange rate differences -141 8
Project grants from institutional donors -16,819 -12,441
Project grants from other MSF-sections -55,811 -58,790
Total project grants -72,630 -71,231
Non-allocated project grants -447 -358
Balance as at 31 December 3,356 1,651
The budgetary commitments at the end of the 2008 financial year refer entirely to the implementation of projects in 2009 and are thus short-term commitments. There were no long-term budgetary commitments at the end of 2008.

44
3.10 Commitments not included in the balance sheet
Commitments not included in the balance sheet refer to the contract for office rental (including service costs). The total amount of these commitments is € 3.7 million for 2009 up to and including 2013. € 0.8 million refers to 2009, € 2.5 million to the years 2009-2012 and € 0.4 million to 2013.
Bank guarantees for the benefit of third parties were granted for the rental contract of the office in Amsterdam (€ 189,326) and for the temporary registration of vehicles in aid projects (€ 20,000).
In a number of countries where MSF-Holland implements projects, taxation and litigation procedures are pending. MSF-Holland maintains a register of these. In these financial statements provisions are made to a total of € 804,336. Based on legal advice obtained and the provisions made we don’t expect that out of the procedures any further significant liabilities may arise.
MSF-Holland has requested the Amsterdam Tax Office to asses the possible implications for VAT being due for posted staff with a contract in a national MSF organisations (in par-ticular MSF-Germany). At present, it is not known whether there is indeed an obligation to declare VAT for this and financial liability may arise.

45
4 Accounting Principles
General
The accounting principles used for the valuation of assets and liabilities are based on historical costs. If not stated differently, assets and liabilities are shown at their nominal value. Revenues and costs are allocated to the period they relate to.
ForeiGn currency
The reporting currency is the euro. Assets and liabilities denominated in foreign curren-cies are valued at the exchange rates prevailing at the balance sheet date. Transactions denominated in foreign currencies are translated at the exchange rates prevailing at the transaction date. Exchange rate differences are accounted for after determination of the result out of the operational activities. The exchange results have been incorporated in the financial statements according to Guideline 122 of Dutch Accounting Standards as the Guideline 650 does not provide for this.
caSH Flow StateMent
The cash flow statement has been prepared according to the direct method. Cash flows denominated in foreign currencies have been translated into euro at the exchange rate prevailing at the transaction date. The cash flow statement has been prepared according to the direct method in order to provide a clearer view of the different flows of funds in the organisation, and the flows of funds within the Médecins Sans Frontières network. This also clearly shows which part of the expenditure has been devoted to countries where projects are being carried out. The cash flow statement shows the liquidity needs of MSF-Holland.
tanGiBle Fixed aSSetS
Tangible fixed assets are stated at cost less depreciation. Depreciation is calculated according to the straight-line method based on expected economic life. The following percentages are used:
• leasehold improvements and inventory 20%• hardware and software 33.33%
Purchase costs of fixed assets used in the project countries are charged to project costs. After completion of the projects these assets are generally transferred to the beneficiaries.
StockS
Stocks are stated at cost price less a provision for obsolescence where necessary. In 2008, as in 2007, a small provision has been made for obsolescence and mentioned in the expla-nation. The costs of the stocks are charged on to the projects at the time they are sent to the project countries. Costs of the stocks are calculated based on average costing while the movement of physical stock is according to the First-In-First-Out principle.
accountS receivaBle
Accounts receivable are stated less a provision for doubtful debtors. In 2008, there was no provision for doubtful debtors included.
caSH at Bank and in Hand
Cash at bank and in hand concern the balances of cash and bank accounts held for the head office and all countries where MSF-Holland holds accounts for project funds. Cash and bank balances denominated in foreign currencies are valued at the exchange rates prevailing at the balance sheet date.

46
eventS aFter tHe reportinG period
Events after the reporting period are disclosed according to Guideline 160 of Dutch Accounting Standards. In this report non-adjusting events have been disclosed. An event after the reporting period is disclosed when it results in significant commitments or downward revaluation of assets. Events after the reporting period are disclosed in chapter 7, Other information.
incoMe FroM own FundraiSinG
• Donations and gifts Direct donations from the public and private companies are accounted for on a cash basis.
• Contributions Contributions from members of the Association are accounted for on a cash basis.
• Inheritances Inheritances are accounted for in the financial year in which the amount can be esti-mated with a fair degree of accuracy. However, any advances paid out before that date will be accounted for in the year in which the actual payment has been received. The size of the inheritance can be established as reliable if a fair assessment of the proceeds can be made based on the stage of settlement of the inheritance. For example, this is in the case of the receipt of final account-justification.
• Foundations, associations and private funds Grants from private organisations are shown under income from own fundraising. These grants are included as income in the statement of expenditure and income in proportion to the progress of the project.
incoMe FroM tHird-party appealS
Income from third party appeals only concerns amounts from the proceeds of the Nation-al Postcode Lottery. Income allocated by the National Postcode Lottery to MSF-Holland has been included as income at the time of the allocation. The proceeds from the National Postcode Lottery are based on a contract and on a contractually valid financial regulation. As of 1 January 2008, the contract with the National Postcode Lottery has been renewed for a period of five years.
incoMe FroM witHin tHe MédecinS SanS FrontièreS network
Project grants allocated to MSF-Holland and the subsequent budgetary obligations arising from grants from within the network Médecins Sans Frontières are shown in the balance sheet from the allocation (contract) date. These grants are accounted for as income in the statement of expenditure and income in proportion to the progress of the project. According to Guideline 650 this income should be shown under “Income from third- party appeals”. In view of the volume and the importance of income from within the network Médecins Sans Frontières, it has been decided to show this as a separate category.
GrantS FroM inStitutional donorS
Project grants awarded to MSF-Holland and the related budgetary obligations are shown in the balance sheet from the awarding date. These grants are accounted for as income in the statement of expenditure and income in proportion to the progress of the project.
donationS in kind
Donations in kind are not financially registered and as such have not been included in the balance sheet. Donations in kind are shown in the explanatory notes in the state of expenditure and income as far as they concern goods that are essentially important to MSF to be able to execute its aid projects and, had they not be be made available to MSF, they would be been purchased. An explanation is given regarding received donations in kind where a reporting obligation is required. An estimated total of the current purchase rate of the received goods is shown in this financial statement.
penSionS
The pension schemes set up for the employees are based on a career-average plan with conditional indexation. All schemes have been placed with a life assurance company and, in view of the nature of the insurance contract, may be classified as so-called defined contribution schemes. This means that MSF’s commitment towards its employees, under the insurance contract concluded with the life assurance company, is limited to payment of the agreed contributions to the life assurance company. These contributions are ac-counted for as expenses in the year they relate to. The explanation of the division of costs (note 2.8) shows the amount included as pension contributions from the relevant pension scheme. The pension insurance contract has been extended for a period of five years start-ing January 1, 2008. The pension contract has been assessed for these financial statements in accordance with the Draft Guideline oRJ271.3 as published in December 2008.

47
eMerGency aid coStS
Costs of emergency aid relate to the costs of the aid projects undertaken by MSF-Holland. This concerns any on-site costs incurred by the projects, including the costs of medical and logistic personnel posted and the costs of relief supplies bought via headquarters and transported to the projects.
Relief supplies that have been purchased through headquarters are charged on to the projects at the time they are sent to the project country. Supplies that have been deliv-ered at the warehouse and are in transit are accounted for as project-related stocks and included in the balance sheet. Outstanding orders are not included in the accounts of MSF-Holland. Outstanding orders are internally reported as budget commitment and included in the three-way matching procedure.
preparation and coordination coStS
Costs of preparation and coordination relate to the costs incurred by headquarters for the direct support of aid projects carried out by MSF-Holland. Relevant costs include costs of departments handling the provision of medical advice, the purchase of project supplies and the recruitment and posting of staff. The costs of the Operations Director and the Medical Director are included in this category. For aid projects in a number of countries, preparation and coordination activities has been (partly) outsourced to the sections with which MSF-Holland works intensively. The costs of the activities outsourced to support the projects directly in other MSF-sections (2008: Canada and Germany) are explained in more detail in chapter 5, associated parties.
inForMation and awareneSS raiSinG coStS
Costs of information and awareness raising relate to the costs of advocacy within the the scope of the association goals. The primary purpose of advocacy is to increase the public’s awareness and to bring about a change of attitude and conduct.
The allocation of costs for information and awareness raising and the categories stated below are based on the following guidelines:• 50% of the costs of the website go to “Information and awareness raising” and 50% to
“Management and administration”; • 25% of the costs of the periodical Hulppost go to “Information and awareness
raising”and 75% to “Costs own fundraising”;• 50% of the costs of publishing the annual report go to “Information and awareness
raising” and 50% to “Management and administration”.
activitieS carried out By tHird partieS
Grants from MSF-Holland and contracts commissioned to third parties arestated as costs from the awarding date.
coStS own FundraiSinG
Fundraising costs relate to all costs of activities with the direct or indirect purpose to induce people and institutions to donate money for one or more goals of the association. 75% of the costs of the periodical Hulppost have been allocated to fundraising costs. The bank costs, which correspond to the fundraising activities, are incorporated by MSF-Holland in the “Management and administration” costs. The automation costs and subsequent costs of depreciation related to the registration and communications with (potential) donors are included here.
activitieS carried out By tHird partieS
Grants from MSF-Holland and contracts commisioned to third parties are stated as cost from the awarding date.
coStS acquiSition inStitutional donor GrantS
The costs of acquiring government grants are shown in “Costs of acquiring institutional donor grants” if these costs where made at head office. This particularly concerns part of the personnel costs incurred in the project administration department.
ManaGeMent and adMiniStration coStS
Management and administration costs relate to the costs made for directing and manag-ing the organisation. 50% of the costs of the website have been allocated to the “Manage-ment and administration” costs. In addition, 50% of the costs of the annual report have been allocated to the “Management and administration” costs. The costs of recruiting personnel to work at the head office and also the costs of performing general financial administration, planning and control, the (majority of ) legal expenses, as well as the costs of the Board and the Association have been included in this category.
overHead coStS
Overhead costs relate to the costs of facility support for housing, automation, general insurances and other office facilities and include depreciation costs, with the excep-tion of the depreciation costs of the donor database which are included in the costs own fundraising.
diviSion oF perSonnel coStS and overHead coStS
Personnel costs at head office have not been accounted for by MSF-Holland as direct costs but in proportion to the number of allotted full-time equivalents of personnel at head office working for certain activities. The overhead costs have been attributed in the same way to different activities. Note 2.8 in this financial statement explains the divisions of these costs. The divisions of overhead costs is based on the Recommendation Application of Guideline 650 for Management & Administration costs (January 2008) as published by the Dutch Association of Fundraising Institutions VFI.

48

49
5 Associated parties:Médecins Sans Frontières
In the Guideline 650 for the Reporting of Fundraising Institutions attention is given to the financial reporting of organisations that structurally work together. Strictly speak-ing, these definitions are not applicable to MSF-Holland. MSF-Holland works, of course, closely in the international network Médecins Sans Frontières. However, the association MSF-Holland is legally and financially strictly independent. More and more the MSF-sec-tions in the international network become interdependent. In addition to the necessary coordination regarding medical and operational policy, mutual policies are also deter-mined regarding organisation development, finances and personnel management.
5.1 Médecins Sans Frontières partnership
MSF-Holland is part of the international network of Médecins Sans Frontières, in which nineteen national organisations (MSF-sections) and a number of associated institutions are active. Besides MSF-Holland, the following four MSF-sections also carry out projects independently; Belgium, France, Spain and Switzerland. Médecins Sans Frontières also has registered MSF-sections in Austria, Australia, Canada, Denmark, Germany, Greece, Hong Kong, Italy, Japan, Luxembourg, Norway, Sweden, the United Kingdom and the USA. These MSF-sections, provide a significant contribution to achieve the objectives which constitute the ideas of Médecins Sans Frontières, the recruitment of expatriate staff and fundraising for projects. Every MSF-section is an independent economic and legal entity.
All of the MSF-sections have agreed to abide by the principles of the International Charter of Médecins Sans Frontières. All MSF-sections are united in the ‘Association Bureau Médecins sans Frontières International’ in Switzerland. All presidents of the MSF-sections are represented in the General Assembly of Members of MSF-International, the International Council. They meet at least twice a year. The International Council can make decisions that, in practice, are binding for the individual organisations. Primarily, the International Council is involved in monitoring of the objectives and the organisation’s identity and the promotion of mutual cooperation and policy coordination. One of the core items of its policy is the improvement of mutual responsibility and supervision. The
principles of this cooperation are determined in a number of basic documents to which all MSF-sections have agreed.The presidents of the associations of the five operational MSF-sections, one of whom is the president of MSF-Holland, form together with the international president and the international secretary the daily management of the association ‘Association Bureau Médecins sans Frontières International’. An independent treasurer has been appointed to support the International Council Board.
Intensive international cooperation and coordination of policy and execution are im-portant because the activities of individual organisations have a great influence and are dependent on each other. There is a real chain of risks in many areas. For example, there are risks of reputation, security risks and financial risks. The Board of MSF-Holland’s management recognises these risks and together with the management team, uses all its efforts to promote and strengthen international collaboration.
5.2 Governance and governance related risks
MSF-Holland works in particular together with the MSF-sections in Canada, Germany and the United Kingdom. These MSF-sections are involved in the supervisory function, policy determination and at the executive level in the Association. As can be seen from the financial statement these three MSF-sections also provide an important financial contribution to aid projects; € 35.0 million in 2008 (2007: € 47.3 million). A large part of the staff posted to MSF-Holland aid projects were recruited by these MSF-sections; 273 staff posted in 2008 (2007: 298 staff posted). The four MSF-sections work together in the ‘Operations Centre Amsterdam’ (OCA). This collaboration only concerns the execution of aid projects and there is no formal private corporate organisation constituted. As a result, the Board of the association MSF-Holland remains legally and financially responsible for the execution of aid projects in this financial statement. The Boards of MSF-sections in Canada, Germany en the United Kingdom jointly established an umbrella organ; the OCA-Council. Besides the four presidents there are four delegated members who repre-sent their Board at the OCA-Council meetings. The OCA-Council oversees the implemen-tation of medical and operational policy according to the jointly agreed Strategic Plan
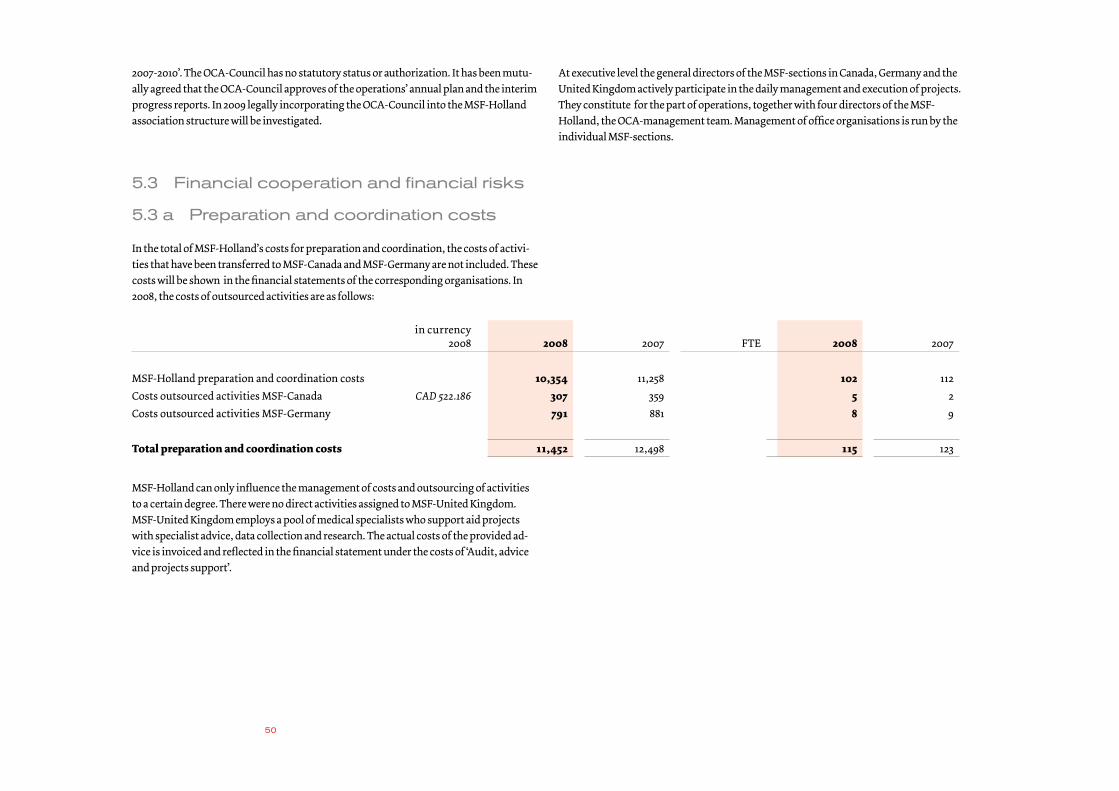
50
2007-2010’. The OCA-Council has no statutory status or authorization. It has been mutu-ally agreed that the OCA-Council approves of the operations’ annual plan and the interim progress reports. In 2009 legally incorporating the OCA-Council into the MSF-Holland association structure will be investigated.
At executive level the general directors of the MSF-sections in Canada, Germany and the United Kingdom actively participate in the daily management and execution of projects. They constitute for the part of operations, together with four directors of the MSF-Holland, the OCA-management team. Management of office organisations is run by the individual MSF-sections.
In the total of MSF-Holland’s costs for preparation and coordination, the costs of activi-ties that have been transferred to MSF-Canada and MSF-Germany are not included. These costs will be shown in the financial statements of the corresponding organisations. In 2008, the costs of outsourced activities are as follows:
5.3 Financial cooperation and financial risks
5.3 a Preparation and coordination costs
in currency 2008 2008 2007 FTE 2008 2007
MSF-Holland preparation and coordination costs 10,354 11,258 102 112
Costs outsourced activities MSF-Canada CAD 522.186 307 359 5 2
Costs outsourced activities MSF-Germany 791 881 8 9
Total preparation and coordination costs 11,452 12,498 115 123
MSF-Holland can only influence the management of costs and outsourcing of activities to a certain degree. There were no direct activities assigned to MSF-United Kingdom. MSF-United Kingdom employs a pool of medical specialists who support aid projects with specialist advice, data collection and research. The actual costs of the provided ad-vice is invoiced and reflected in the financial statement under the costs of ‘Audit, advice and projects support’.

51
Share Currency
MSF- Canada 70% CAD
MSF- Germany 70% EUR
MSF-United Kingdom 70% GBP
MSF- Hong Kong 30% EUR
MSF-Austria 30% EUR
MSF-United States 7.5% USD
MSF-Sweden 20% SEK
5.3 b Payments and receipts
The payments and receipts from within the Médecins Sans Frontières network have been included in this financial statement and are specifically mentioned, where possible. Pay-ments within the MSF-network concern payments for hired-in staff who are posted and employed in project countries. A mutually agreed framework agreement was drawn up for all hired-in staff which includes agreements on mutual liability. The compensations are based on average real cost in which no increments or overhead have been calculated.The other payments concern the purchase of project goods from the procurement organi-sations ‘MSF-Supply’ (Belgium), and ‘MSF Logistique’ (France) and the epidemiological research and data registration of ‘Epicentre’, which is part of MSF-France. The receipts from other MSF-sections mainly concern part of the project grants. Project grants are based on mutual contracts all of which must be shown in a report. In addition, MSF-Hol-land receives compensation for staff hired-in by other sections. In 2008 this was € 748,986 (2007: € 554,287).
5.3 c International financial agreements
Within the network Médecins Sans Frontières agreements have been made regarding the division of fundraising revenue that is available for aid projects after the deduction of costs for offices and the contributions to MSF-International. As of the financial year 2008 MSF-Holland can rely on a share of the net income from the following MSF-sections. This share is expressed as a percentage and concerns for Canada, Sweden, the United Kingdom and the United States commitments in foreign currency for which a currency risks exist.
These agreements enable the risk of disappointment of income from public donor ap-peals to be spread more evenly and thus obtain better guarantees for the continuity of the aid projects implementation.
The agreements regarding contributions to the MSF international office are based on the income from own fundraising from the previous year. In 2008, MSF-Holland’s share was 8.82% of the total MSF-international costs. This share is set for 9.36% in 2009. The budgets and thus the contributions are determined yearly by the International Council. The International Council can decide to start and to finance coordinated projects. National or-ganisations are not automatically obliged to make a financial contribution. MSF-Holland contributes to the MSF International campaign Access to Essential Medicines’. Starting 2008 1% of the income out of own fundraising is contributed to the international fund for innovation in projects that is managed by MSF-International. MSF-Holland’s payments are shown as contribution costs in this financial statement. MSF Holland did not apply for innovation funds in 2008.
Agreements have been made regarding the amount and location of the total reserves in all MSF organisations. Internal, combined budget and cash flow reports are made each month. Within the network-MSF “General Accepted Accounting Principles” guidelines have been agreed and are used, and also include the principles for costs attribution.
As of 2006 agreements have been made regarding the employment of expatriate person-nel. In principal, all expatriate personnel receive a contract in the country they reside in if an MSF-section has an office in that country. The terms of employment and the remu-neration structure have been fully aligned to both the ratio of the local cost of living as well as the social security standards. All posted staff have been insured and are covered by a worldwide insurance policy . Starting 2009 a worldwide medical malpractice liability cover has been arranged to cover the organisation worldwide. In a number of countries where MSF has emergency aid projects insurance coverage is limited. For these further agreements have been made in the MSF-network .
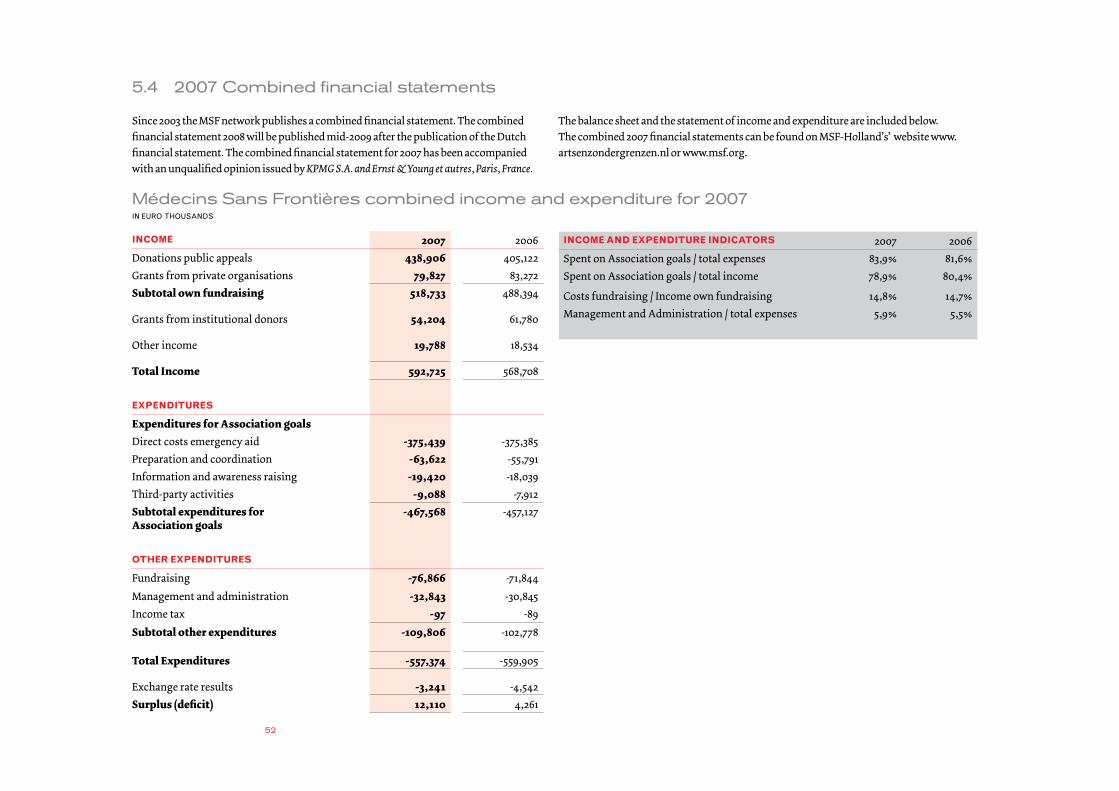
52
Since 2003 the MSF network publishes a combined financial statement. The combined financial statement 2008 will be published mid-2009 after the publication of the Dutch financial statement. The combined financial statement for 2007 has been accompanied with an unqualified opinion issued by KPMG S.A. and Ernst & Young et autres, Paris, France.
The balance sheet and the statement of income and expenditure are included below. The combined 2007 financial statements can be found on MSF-Holland’s’ website www.artsenzondergrenzen.nl or www.msf.org.
5.4 2007 Combined financial statements
incoMe 2007 2006
Donations public appeals 438,906 405,122
Grants from private organisations 79,827 83,272
Subtotal own fundraising 518,733 488,394
Grants from institutional donors 54,204 61,780
Other income 19,788 18,534
Total Income 592,725 568,708
expenditureS
Expenditures for Association goalsDirect costs emergency aid -375,439 -375,385
Preparation and coordination -63,622 -55,791
Information and awareness raising -19,420 -18,039
Third-party activities -9,088 -7,912
Subtotal expenditures for Association goals
-467,568 -457,127
otHer expenditureS
Fundraising -76,866 -71,844
Management and administration -32,843 -30,845
Income tax -97 -89
Subtotal other expenditures -109,806 -102,778
Total Expenditures -557,374 -559,905
Exchange rate results -3,241 -4,542
Surplus (deficit) 12,110 4,261
Médecins Sans Frontières combined income and expenditure for 2007in euro thousands
incoMe and expenditure indicatorS 2007 2006
Spent on Association goals / total expenses 83,9% 81,6%
Spent on Association goals / total income 78,9% 80,4%
Costs fundraising / Income own fundraising 14,8% 14,7%
Management and Administration / total expenses 5,9% 5,5%

53
Médecins Sans Frontières combined balance sheet 2007in euro thousands
total 2007 2006
Intangible fixed assets 2,838 2,037
Tangible fixed assets 28,668 29,218
Financial assets 5,639 4,511
Fixed assets 37,145 35,766
Stocks 20,046 19,485
Grants from institutional donors to be received 16,822 18,969
Contributions to be received 14,991 16,891
Debtors 4,820 6,250
Other amounts to be received 4,357 4,678
Cash at bank and in hand 350,171 347,454
Current assets 411,207 413,727
Total Assets 448,352 449,493
Appropriation reserves 2,478 2,478
Free reserves 402,175 389,361
Other reserves -14,578 -7,102
Subtotal reserves 390,075 384,737
Provision and contingent liabilities 3,387 4,300
Financial debts 2,569 5,256
Accounts payable and accrued liabilities 42,654 44,026
Deferred income 9,662 11,162
Overdrafts 5 12
Subtotal Liabilities 58,277 64,756
Total liability 448,352 449,493
Balance SHeet indicatorS 2007 2006
Reserves as % if total expenditures 70% 69%
in a number of months 8,4 8,2
Current Ratio 7,1 6,4
Solvability 87% 86%

54

55
6 Long-term forecast
The long-term forecast is the financial translation of the Strategic plan 2007-2010 that was approved by the Board in 2006. In this period of the strategic plan continuation of the projects is foreseen which translates into steady growth of the organisation. In the reality the costs of emergency aid vary because the organisation is partly dependent on need for medical emergency help in the event of conflicts or natural disasters.
In 2008, the planned budget for emergency aid was achieved. However in 2008, less ex-penditure on planned projects was realised while more was spent on upcoming emergen-cy aid projects like in Myanmar (after the cyclone Nargis) and Zimbabwe (food shortages and cholera outbreak). The initial budget for emergency aid in 2009 has been maintained as planned. To meet the wish for a balanced budget the surplus realised in 2008 that has been added to the other free reserves has been allocated to 2009 aid projects. In the 2009 budget for the income the likelihood of further deterioration of exchange rates (British Pound and other currencies) has been provided for. Towards the end of the year 2009 a new long-term forecast for 2011-2015 will be drafted

56
6.1 Forecast of income and expenditurein euro thousands
Actual Actual Actual Actual Budget Forecast
incoMeS 2005 2006 2007 2008 2009 2010
Income from own fundraising 25,979 28,034 33,070 38,080 36,800 39,000
Share in joint appeals 7 0 0 0 0 0
Share in third-party appeals:
Proceeds from National Postcode Lottery 14,662 14,996 15,461 18,883 15,000 15,000
Income from MSF-network activities 53,383 57,462 58,790 55,811 49,250 55,000
Grants from institutional donors 27,745 18,823 12,140 16,271 20,000 24,000
(as a % of the emergency aid expenses) 30% 19% 13% 17% 19% 21%
Other income and expenditure 2,099 875 1,062 1,390 1,200 1000
Total available for Association goals 123,875 120,190 120,523 130,435 122,250 134,000
expenditureS
Spent on Association goalsEmergency aid 93,952 99,714 92,113 94,735 104,000 111,800
Preparation and coordination in the Netherlands 9,523 10,430 11,258 10,354 9,900 9,500
Information and awareness raising 2,498 2,161 2,092 2,077 2,500 2,500
Activities carried out by third-parties: 645 542 449 3,860 240 0
Total spent on Association goals 106,618 112,847 105,912 111,026 116,640 123,800
(as a % of the total available for Association goals - policy standard is > 80%)
86% 94% 88% 85% 95% 92%
Fundraising incomeCosts from own fundraising 3,566 5,873 7,055 6,265 6,600 6,500
(as a % of the income own fundraising - target is < 20%) 14% 21% 21% 16% 18% 17%
Costs from institutional grants 120 142 146 125 150 150
Management and administration 3,215 3,372 3,345 3,527 3,575 3,550
Total expenditures 113,519 122,234 116,458 120,943 126,965 134,000
(as a % of the total of income) 92% 102% 97% 93% 104% 100%
Result from operational activities 10,356 -2,044 4,065 9,492 -4,715 0

57
6.2 Development of the costs and indicatorsin euro thousands
Actual Actual Actual Actual Budget Forecast
preparation and coordination 2005 2006 2007 2008 2009 2010
Preparation and coordination costs Amsterdam 9,523 10,430 11,258 10,354 9,900 9,500
Costs outsourced work MSF-Canada + MSF-Germany 0 442 1,240 1,098 1,400 1,350
Total preparation and coordination costs 9,523 10,872 12,498 11,452 11,300 10,850
(as a % of the total spent on Association goals – policy standard is 8-10%) 9% 10% 12% 10% 10% 9%
Information and awareness raising 2,498 2,161 2,093 2,077 2,500 2,500
Management and administration plus costs fundraising expenditures 6,901 9,387 10,546 9,917 10,325 10,200
(as a % of the total expenditures – policy standard 10- 12%) 6% 7% 9% 8% 8% 7%
Total expenditures at Amsterdam office 18,922 22,420 25,137 23,446 24,125 23,550
(as a % of the total expenditures – policy standard is < 20%)
17% 18% 22% 19% 19% 18%
MSF-Holland applies a number of indicators to steer its financial policy and to prepare the budget. These indicators are used to determine whether the organisation is effectively managed and whether the majority of the expenditures are in fact spent on aid projects. In accordance with the standards in the MSF network, MSF strives to devote at least 80% of its expenditure to the Association goals. This means that the expenditures on ‘Manage-ment and Administration’ plus the costs of fundraising may not amount to more than
20% of the expenditure. In reality, these expenditures are with the current scale of the aid activities much lower. MSF-Holland imposes its own stricter policy in which the expendi-tures at headquarters may not amount to more than 20% of the total expenditure. In 2008 the standard was met with 19.0% , while in 2007 the increased investments in own fund-raising caused a slightly higher percentage (21.5%) of Amsterdam head office expenditure.
Part of the management of the projects carried out by MSF-Holland is being outsourced to MSF-Germany and MSF-Canada, see also chapter 5 associated parties. In the short term this resulted in higher costs (2006 and 2007). In 2008, for the first time a decrease in costs of the office in Amsterdam is visible. In the budget for 2009 a further decrease is planned.
In 2006 and 2007 investments have been made in fundraising. In 2008 the investments were decreased. As a result the percentage of costs for fundraising has decreased in com-
parison with the income. On average in 2008 this percentage has increased to 21 percent over a period of three years after which it will decline again. As such MSF-Holland will remain well within the standard of 25 percent set by the CBF.

58
Actual Actual Actual Actual Budget Forecast
2005 2006 2007 2008 2009 2010
Number of posted staff 590 592 535 467 490 575
Number of staff office Amsterdam 167 179 179 168 171 172
Number of national staff in projects 7,800 6,450 5,602 5,420 6,260 6,000
6.3 Development of staffingin fulltime equivalents
In 2005 and 2006 the number of national staff working for MSF-Holland was counted as per 31 December. The administration of national staff has been improved and from the financial year 2007 the number of staff has been changed to show full time equivalents.

59
7 Other information
7.1 Events after the reporting period
On March 4th, 2009 the Government of Sudan ordered MSF-Holland to immediately stop it’s medical relief activities in Darfur. All international staff has been expelled from the country and all of the assets of the organisation have been seized by the Government of Sudan with immediate effect. MSF-Holland has been working in Sudan for over 20 years. In 2003 MSF was one the first organisations to recognise and respond to the crisis in Dar-fur, scaling up its aid projects in 2004 and 2005. Over the period 2004-2008 an amount of € 47,865,724 has been used by MSF-Holland to provide (emergency) medical services for the people of Darfur. The expulsion from Darfur was not foreseen.
The events after the reporting period do not affect the 2008 balance sheet. All stocks and inventories are expensed as soon as they are shipped to projects. Yet the loss of assets that otherwise would have been utilised for the realisation of the objectives of the association is preliminary estimated to be between € 1,500,000 and € 2,000,000. Bank accounts of the association held in Khartoum and Nyala, Sudan, have been frozen. Current account balances were € 283,500. The present status of the bank accounts is un-clear. No provisions have been made in these financial statements for the possible writing off of bank balances.
The events after the reporting period have resulted in significant commitments. In accordance with the expulsion order MSF-Holland will need to complete all financial commitments including those related to labour rights. From the latter a commitment to cancel contracts for national staff arises. The financial commitment is estimated to be between € 800,000 and € 1,500,000. This commitment will be substituted in the planned 2009 budget for Darfur.No provisions have been made in these financial statements for the above commitments.
No other commitments or disclosures are expected relating to above mentioned events.
7.2 Signing and auditors report
The financial statements are prepared by the management. On the condition of obtaining an unqualified opinion of the auditor the financial statements were unanimously adopted by the Board of the Association MSF-Holland in its meeting of March 13, 2009. The annual financial statements will be presented for approval to the General Assembly to be held March 15, 2009.
Amsterdam, 10 April 2009,
The Association Board and the Director

60
AUDITORS’ REPORT
To: the Board of Vereniging Artsen zonder Grenzen We have audited the 2008 financial statements of vereniging Artsen zonder Grenzen, as included on pages 5 to 47 of this annual report and comprising the balance sheet as at 31 December 2008 and the balance of income and expenditure for 2008 with the notes. Management’s responsibility The management of the Vereniging is responsible for the preparation and fair presenta-tion of the financial statements, as well as for the preparation of the annual report, both in accordance with the Fundraising Institutions Accounting Guideline (RJ 65). This responsibility includes: designing, implementing and maintaining internal control relevant to the preparation and fair representation of the financial statements that are free from material misstatement, whether due to fraud or error; selecting and applying appropriate accounting policies; and making accounting estimates that are reasonable in the circumstances. Auditor’s responsibility Our responsibility is to express an opinion on the financial statements based on our audit. We conducted our audit in accordance with Dutch law. This law requires that we comply with ethical requirements and plan and perform our audit to obtain reasonable assurance on whether the financial statements are free from material misstatement. An audit involves performing procedures to obtain audit evidence about the amounts and disclosures in the financial statements. The procedures selected depend on the auditor’s judgement, including the assessment of the risks of material misstatement of the finan-cial statements, whether due to fraud or error. In making those risk assessments, the audi-tor considers internal control relevant to the entity’s preparation and fair representation of the financial statements in order to design audit procedures that are appropriate in
the circumstances, but not for the purpose of expressing an opinion on the effectiveness of the entity’s internal control. An audit also includes evaluating the appropriateness of accounting policies used and the reasonableness of accounting estimates made by man-agement, as well as evaluating the overall presentation of the financial statements.
We believe that the audit evidence we have obtained is sufficient and appropriate to pro-vide a basis for our audit opinion.
Opinion In our opinion, the financial statements give a true and fair view of the financial position of vereniging Artsen zonder Grenzen as at 31 December 2008 and for the result for the year 2008 in accordance with the Fundraising Institutions Accounting Guideline (RJ650). We report that, as far as we could determine, the annual report is consistent with the financial statements. Amstelveen, 10 April 2009 KPMG ACCOUNTANTS N.V. W. Tjoelker RA

61
aBBreviationS
AA Auswärtiges Amt (Germany)
BuZa Dutch Ministry of Foreign Affairs
CIDA Canadian International Development Agency
DANIDA Danish International Development Assistance
DFID Department for International Development (Great Britain)
ECHO European Commission Humanitarian Aid Office
EU European Union
Ireland Aid (DCI) Development Cooperation Ireland - Ireland Aid
NORAD Norwegian Agency for Development Cooperation
NRMFA Royal Norwegian Ministry of Foreign Affairs
PSI Population Services International
SDC Swiss Agency for Development and Cooperation
SHO Cooperative Aid Organisations
Sida Swedish International Development Cooperation Agency
UNAIDS Joint United Nations Programme on HIV/AIDS
UNFPA United Nations Population Fund
UNHCR United Nations High Commissioner for Refugees
UNICEF United Nations Children’s Fund
WFP United Nations World Food Program
MSF-A Médecins Sans Frontières Austria
MSF-B Médecins Sans Frontières Belgium
MSF-C Médecins Sans Frontières Canada
MSF-G Médecins Sans Frontières Germany
MSF-HK Médecins Sans Frontières Hong Kong
MSF-I Médecins Sans Frontières Italy
MSF-IO Médecins Sans Frontières International Office
MSF-J Médecins Sans Frontières Japan
MSF-Lux Médecins Sans Frontières Luxemburg
MSF-S Médecins Sans Frontières Sweden
MSF-SP Médecins Sans Frontières Spain
MSF-N Médecins Sans Frontières Norway
MSF-UK Médecins Sans Frontières United Kingdom
MSF-USA Médecins Sans Frontières United States of America
CBF Central Bureau Fundraising (Centraal Bureau Fondsenwerving)
MSF Médecins Sans Frontières
MSF-sectie National Médecins Sans Frontières organisation
NPL National Postcode Lottery
VFI The Association of Fundraising Institutions


![Example Consolidated Financial Statements 2008[1]](https://img.pdfslide.net/doc/110x75/55cf91a1550346f57b8f1a59/example-consolidated-financial-statements-20081.jpg)